Embed Size (px)
Citation preview

1
Investigation of the Influence of Flow Rate on Bubble Formation
and Collapse in Ball Valves at Various Opening Percentages Using
an AE Technique
Tiahiret Alhashan1, Abdulmajid Addali1 and Joao Amaral Teixeira1
1 School of Energy, Cranfield University, Cranfield, Beds. MK43 0AL.
Email: [email protected] Abstract
Ball valves are popularly used in many different industrial processes and hydraulic
systems because of their light weight and simple structure. However, they are
susceptible to cavitation phenomena and the growth and collapse of the bubbles
formed leads to erosion and pitting of the metal surfaces. This paper presents the
monitoring and detection of bubble formation at an early stage in a ball valve using
acoustic emission (AE). It is shown that AE will detect incipient cavitation and that
there is a clear correlation between AE signal levels and the flow rate through the
ball valve at a constant opening percentage.
Keywords: Acoustic emission, cavitation, monitoring, bubble formation, ball valve
1. Introduction
Ball valves play a significant role in industry, including the control of water, gas and
oil flows in pipelines and nuclear power plants. When the valves fail consequent
problems that occur can include environmental pollution, waste of resources,
decrease in the working life of equipment and increase in maintenance costs [1][2].
AE is a physical phenomenon produced by the abrupt release of energy from
localised sources within a liquid such as cavitation, after which the energy
propagates as a compression wave [3][4][5]. Valve cavitation is a common
occurrence which takes place in many industrial processes, including hydraulic
systems, and when detected may require part or complete system shut-down. If the
cavitation bubble collapses into a micro-jet near to a wall, it can cause surface
erosion, pitting, noise, vibration and decrease in the life of the equipment [6][7]. If the
cavitation continues for any length of time before maintenance action cures the
problem, it could incur large costs due to lower efficiency of the system, instrument
and component damage, and could possibly cause local pollution.
Cavitation is considered to be one of the most common causes of failure in industrial
ball valves as a result of pitting due to undetected bubble formation. Thus, the early

2
detection and diagnosis of cavitation within this essential component are necessary
for any successful condition monitoring programme, to allow these valves to continue
to operate at full capacity without having to stop the system for frequent inspections.
Published works to date show that there have been few attempts to apply AE to the
monitoring and detection of bubble formation and collapse in valves.
Ceccio et al. [8] established that there are significant differences between bubble
cavitation in salt water and fresh water; these were attributed to differences in the
bubble event rate and average maximum bubble size between the salt and fresh
water. It was noted that the AE from bubble cavitation in fresh water was lower than
that for salt water. However, it was noted that small bubbles produced greater AE
compared to large bubbles. Bubbles of similar size created similar AE regardless of
whether they were in salt water or fresh water, and the chemical differences of the
water did not appear to affect the acoustics directly.
According to Gaitan [9] cavitation was detected by Leonhard Euler in 1754 when he
proposed that large pressures could be produced when the local velocity of the liquid
was high enough to break the liquid. This phenomenon was described as cavitation
in 1895 by Froude to explain the occurrence of bubble clouds around the impellers of
pumps. Since then, the term “cavitation events” has been used to describe the
bubble formation that appears when a liquid is subjected to a sharp pressure drop as
occurs, for example, in pumps and hydraulic systems [10].
Rydberg [7] and Vokurka [11] have confirmed that cavitation comes from the
occurrence of bubbles due to the pressure decrease caused by a change in the flow
rate of a liquid. Baker et al. [12] have claimed that cavitation phenomena can be
used to explain the occurrence and development of any bubble. Leighton et al. [13]
concluded that sources of sound emitted from oceans were often caused by
pressure waves generated by gas bubbles present in the liquid.
Cavitation phenomena generated by different sources and different conditions are of
interest in many processes [14]. Cavitation involves bubble formation inside a liquid
when the local pressure drops below the vapour pressure, usually due to changes in
the dynamic conditions, and the subsequent oscillation and collapse of the bubble
[15].
Benz [16] recommended that the RMS (Root Mean Square) be used to identify the
degree of opening of valves, and also to check for the appearance of ageing and
leak monitoring of valves in nuclear power plants. Kaewwaewnoi et al. [17]

3
concluded that the AE technique could be used to monitor and detect valve leakage,
and that the AE activity increased with leakage rate. Masjedian et al. [18] used two
methods, characteristic diagrams and acoustic analysis, in the detection and
monitoring of cavitation phenomena in globe valves. They found good agreement
between the two techniques to an acceptable level of accuracy. Additionally, they
investigated the acoustic waveforms of cavitation in globe valves using the fast
Fourier transform (FFT) [19].
Dickey et al. [20] noted that the AE amplitude signal in a frequency field is
independent of the leakage rate but depends on sensor response and valve
geometry. However, they did not report any relationship between the AE parameters
and the valve leakage rate, which is fundamental for determining the leakage rate
using AE techniques. Alfayez et al. [21][22] found the RMS value of the AE signal to
be a useful technique for early monitoring of cavitation with the strong possibility of
also determining the best efficiency point of a centrifugal pump or hydraulic system.
Jaubert et al. [23] noted that AE was a suitable method for the detection of cavitation
phenomena in pumps, and that this method allowed the cavitation to be detected at
an early stage, which makes it possible to study incipient cavitation phenomena.
Neill et al. [6] employed AE techniques for monitoring cavitation phenomena in
centrifugal pumps and obtained greater accuracy than with the vibration signal.
Addali [24][25] found that the gas void fraction (GVF) could be determined by
measurement of AE because there was a direct relationship between the AE energy
and GVF. It was also found that an increase of the superficial gas and liquid
velocities caused an increase in AE energy levels. Husin et al. [26] used AE to detect
bubble inception and burst. In another investigation, Alhashan et al. [27] used the AE
technique to monitor bubble formation during the boiling process. They established a
clear association between increasing AE signals and bubble formation. Carmi et al.
[28] used AE in the detection of bubble transition during flow boiling and reported
that there was a good possibility of AE detecting the bubbles in the early stages of
flow boiling. Benes and Uhre [29] noted that the RMS and other parameters of the
AE signal correlated well with overheating during heat transfer, and it was
established that the AE signal could be used to predict the boiling phenomenon.
Alhashan et al. [30] found that the densities of different liquids affected the level of
the AE signal so that, for example, AE levels in tap water were higher than those in
salt water. Shuib and Mba [31] found that AE was a good technique for the detection

4
of single bubble formation and burst. It was observed that AE could be used to
measure the velocity of the acoustic wave in the water.
Recently, the application of the AE technique in the non-destructive testing of valves
has developed significantly and can be used in a wide range of applications [8][32].
The AE method can detect and monitor leakage without having to dismantle a valve
[33]. Bubble cavitation and leakage are unacceptable phenomena in expensive
equipment such as valves because they cause deterioration and even failure of
hydraulic systems [34]. To reduce or eliminate the damage caused by cavitation in
rotating machines such as centrifugal pumps, the device must be monitored so that
bubble formation is detected at an early stage [35].
Bubble cavitation and flashing phenomena are considered one of the most common
causes of failure due to bubble formation and collapse in process systems.
Therefore the early diagnosis and monitoring of bubble formation and collapse
during fluid transportation in pipes, valves and centrifugal pumps are necessary.
Successfully implementing a condition monitoring programme that can pick up early
signs of bubble formation can be used as a warning signal for control purpose to
avoid the consequence of bubble collapse (cavitation). To date, most published work
shows that there have been few attempts at applying the AE technique to the
detection and monitoring of bubble formation and collapse processes.
This investigation addresses the applicability of AE techniques to monitor bubble
formation and collapse at an early stage in ball valves experimentally. This will offer
a good opportunity to study bubble behaviour under different flow conditions, such as
flow rate, AE sensor position, and valve opening percentage.
2. AE parameters The AE signal parameters used in this research are:
Root Mean Square (RMS) - a measure of the continuously varying AE signal
“voltage” in the AE system. It is an electrical engineering power term defined as the
rectified, time-averaged signal, measured on a linear scale and recorded in volts.
Today this parameter is widely used for machine monitoring [36]. RMS can be
calculated as:
5
N
XXXRMS N
22
2
2
1 ........ (1)
where, X1, X2 …….XN are sampled values and N is the total number of samples.
Energy is defined as the integral of the squared signal (α) over the test duration,
calculated using Equation (2), where T is the total sampling time [4][5][36]. E is the
energy contained in the AE signal, with units usually in logarithmic form (dB,
decibels) [5][36].
dttE T )(2
0 (2)
A count or hit or event is when the AE signal exceeds a predetermined threshold
level. The count rate is the number of times the AE signal crosses the detection
threshold per unit time [5].
The AE-Amplitude is the maximum (positive or negative) AE signal during an AE hit
[5].
The threshold feature records the value of the threshold at the time of an AE hit
which is important to know.
The rise time is the time from crossing the threshold to the time of the peak
amplitude [4][5].
The frequency spectrum is the Fourier Transform of the time domain signal into the
frequency domain [4][5].
A Hit in AE is the process of detection and measuring an AE signal level on a
channel [4][5]. For further information about how to calculate the AE parameters, see
reference [5].
3. Experimental work
For these experiments, a purpose-built test rig was used to monitor bubble formation
and collapse employing AE techniques, at an early stage of bubble formation in a
ball valve. This work investigated cavitation in tap water at 20 0C. In each test run of
the ball valve, a file containing the waveform data was saved to the computer. This
waveform was transformed by FFT into frequency and power spectra. The main
characteristics of the waveform were count, RMS, amplitude, frequency, rise time
and energy.

6
According to the IEC 60534 standard [37][38], K, the differential pressure ratio
across the ball valve, is calculated by Equation (3):
vPP
PPK
1
21 (3)
K
1 (4)
where 1P and 2P are the pressures at the upstream and downstream locations
respectively. vP is is the vapour pressure of the liquid at the operating temperature.
σ is the cavitation index, calculated using equation (4), and is a measure of the
possibilty of cavity formation [37][38].
The results of laboratory and field tests have demonstrated that it is acceptable to
use σ for assessing the likelihood of cavitation (and related choking, noise and
damage) [37][38]:
2 No cavitation occurs
27.1 Some cavitation might occur
7.15.1 Likely onset of cavitation
5.11 Severe cavitation
1 Flashing is occurring
The rig for the ball valve tests is shown in Figures 1 and 2. The valve was a
commercially available, straight through, lever handle ball valve with a one inch (25.4
mm) bore manufactured by BSS BOSS products. The system contained two
piezoelectric sensors (Physical Acoustic Corporation type “PICO”) to detect and
monitor any early stage cavitation that occured in the ball valve. One sensor was
placed immediately upstream, and the other immediately downstream of the valve,
such that the two sensors were 70 mm apart (see Figure 3). The operating frequency
range of the sensors was 20 kHz – 750 kHz. Both sensors were attached to the
external surface of the ball valve using superglue. The AE sensors were connected
to the data acquisition system via preamplifiers, set at 40 dB gain. The system was
set to continuously sample the AE waveforms at a rate of 5 MHz.
7
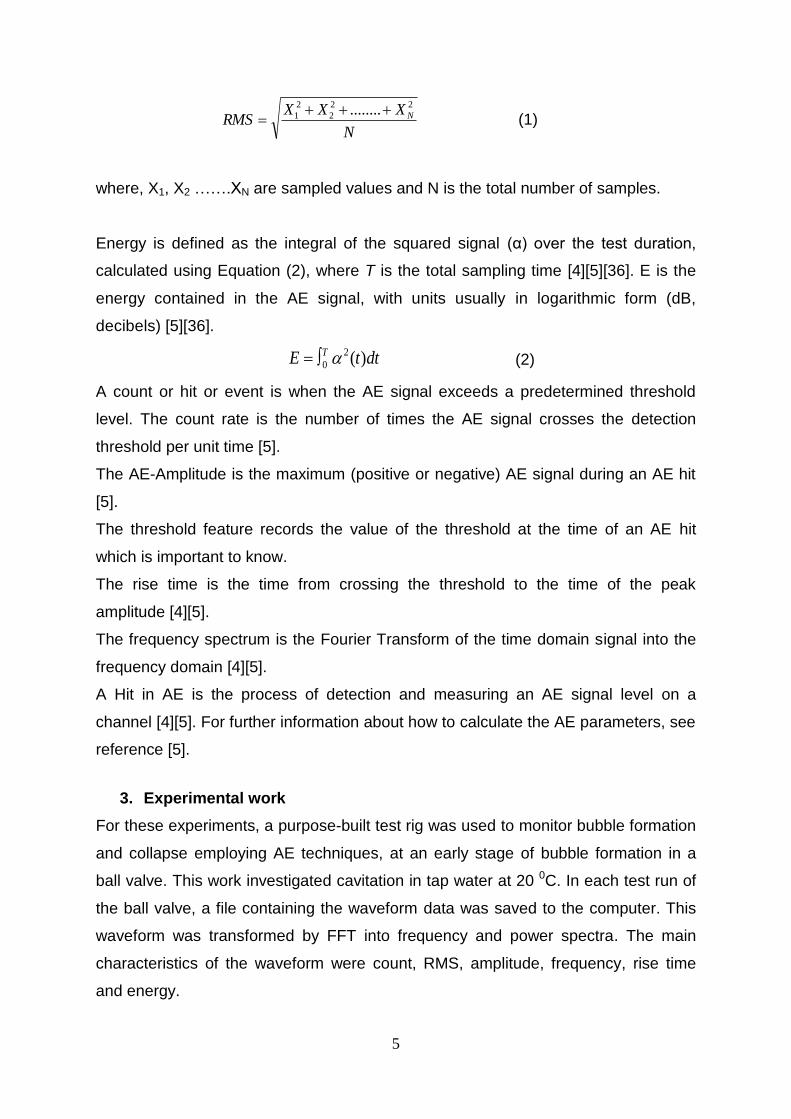
Figure 1: Schematic diagram of the cavitation test setup.
Figure 2: Ball valve test-rig.

8
Figure 3: Close-up of ball valve showing positions of both AE sensors.
The pump drove water through plastic tubing to the test valve (see Figure 1). The
plastic tubing was used to attenuate any vibration being transmitted to the sensors.
Also the pump was situated within a wooden box to avoid pump noise contaminating
the acoustic data. The upstream and downstream pressures of the water flow
through the test valve were measured by the pressure transducers (PMP 1400) and
the measured data were transferred to the computer where they were stored.
Simultaneously, flow rate data were measured using a flowmeter and stored in the
computer. The experimental data from the AE sensors were also stored on the
computer for later analysis.
For this experiment, the chosen threshold for the AE signal was 26 dB because it
was observed that the AE sensors still measured some background noise when the
threshold was set between 20 and 24 dB. At 25 dB, zero noise was recorded, but the
threshold value was set at 1 dB above operational background noise, to ensure
consistent experimental results throughout the test period. These experiments
related to a preamplifier gain of 40 dB.
4. Results and discussion
Ten different flow rates of 0.55, 0.66, 0.77, 0.88, 0.99, 1.05, 1.09, 1.15, 1.2 and 1.25
m3/h were used for each percentage opening of the ball valve. The tests were
undertaken for six degrees of opening: 140, 150, 160, 170, 180 and 200, where 00 was
fully closed and 900 was 100 % open. For this study, one experimental case is
9
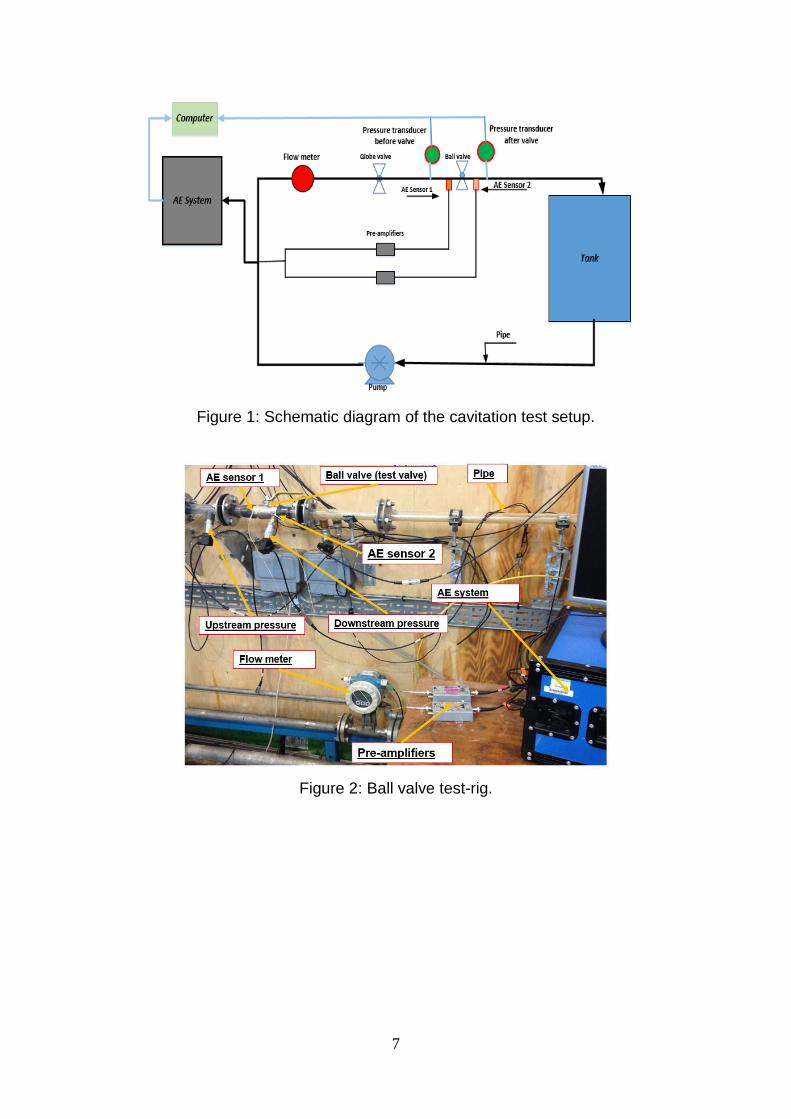
presented, the case where the valve was opened to 150. Three test runs were
undertaken for each of the opening percentages, where the average values of the
AE signals were taken. A plot of the trend of the AE count against K and flow rate
(m3/h), for an opening of 150, is presented in Figure 4, as is the cavitation index.
Figure 4: Plot of count against K and flow rate for ball valve 150 open (16.7 % of fully
open), for channel 2.
In Figure 4 the plot is divided into four different stages based on the trend behaviour
of the AE count, and the AE-RMS values of the bubble activities, as shown in Figure
5. The numbers in boxes at the bottom of Figure 4 show the stage of the flow. During
the first stage (< 0.66 m3/h) bubbles did form but the vibration due to the flow was
negligible which means there was no cavitation. In the second stage (0.66 – 0.79
m3/h), with increasing flow rate and momentum of turbulent flow, bubbles did form
and the vibration and noise increased, and some cavitation might have occurred. In
the third stage (0.79 - 1 m3/h) bubble activity increased, cavitation began and grew
quickly to reach its fully developed stage, and the accompanying vibration and noise
increased rapidly. At the fourth stage (1 - 1.25 m3/h), the downstream pressure
continued to increase as shown in Table 1, but some bubbles did not collapse and
escape downstream with the flow. This persistence of the bubble is called the
flashing phenomenon.

10
Table 1: Values of P1, P2, K and σ associated with Figure 4.
The relationship between the flow rate (in m3/h) and the AE-RMS of the ball valve for
stages 1, 2 and 3 is shown in Figure 5. In stage 1, increasing the flow rate from 0.55
to 0.66 m3/h gave an approximately constant level of AE RMS value because there
was no bubble activity. In stage 2 the value of AE-RMS slowly increased with
increase in the flow rate to about 0.77, due to some bubbles forming. This is the
stage in which some cavitation might occur. With incipient cavitation, the AE RMS
value continued to increase with flow rate until at about K= 0.69 when cavitation had
reached the fully developed point, which was the maximum point of stage 3.
With incipient cavitation, the AE RMS value continued to increase with flow rate until
at about 1.0 m3/h, K = 0.69 and the cavitation index approached 1.43, when
cavitation was likely to have become severe. At a flow rate of 1.1 m3/h, K = 0.7 and
the cavitation index fell below 1.5, and cavitation was likely to be severe. The sharp
rise in the Average count and the increasing gradient of the AE RMS in Figure 5
confirm that cavitation had become fully developed.
Following this, with increase in the pressure difference (P1-P2) across the ball valve,
the cavitation index (σ) gradually decreased until it reached a value at which some
bubbles had a chance to travel downstream without collapsing, as shown in Table 1;
this is the flashing phenomenon.
The value of AE-RMS increased as the bubble activity increased, and reached a
maximum of about 1 mV, due to bubble formation.

11
Figure 5: RMS-flow rate diagram during stages 1, 2 and 3.
Bubble activity and cavitation in the ball valve depend on flow rate, pressure
difference and valve opening percentage. The bubble formation phenomena were
statistically analysed to determine the AE parameter which is the best indicator to
use for bubble occurrence detection. Table 2 shows the range of values for
comparison between the classical AE parameters as obtained directly from the AE
system (AE Rise Time, AE Count, AE Amplitude, AE Abs. Energy and AE
Frequency) from Sensor 2.
Table 2: Comparison between AE parameters of bubble formation for tap water in ball valve at stages 1 and 2 (average of three sets of readings).
12
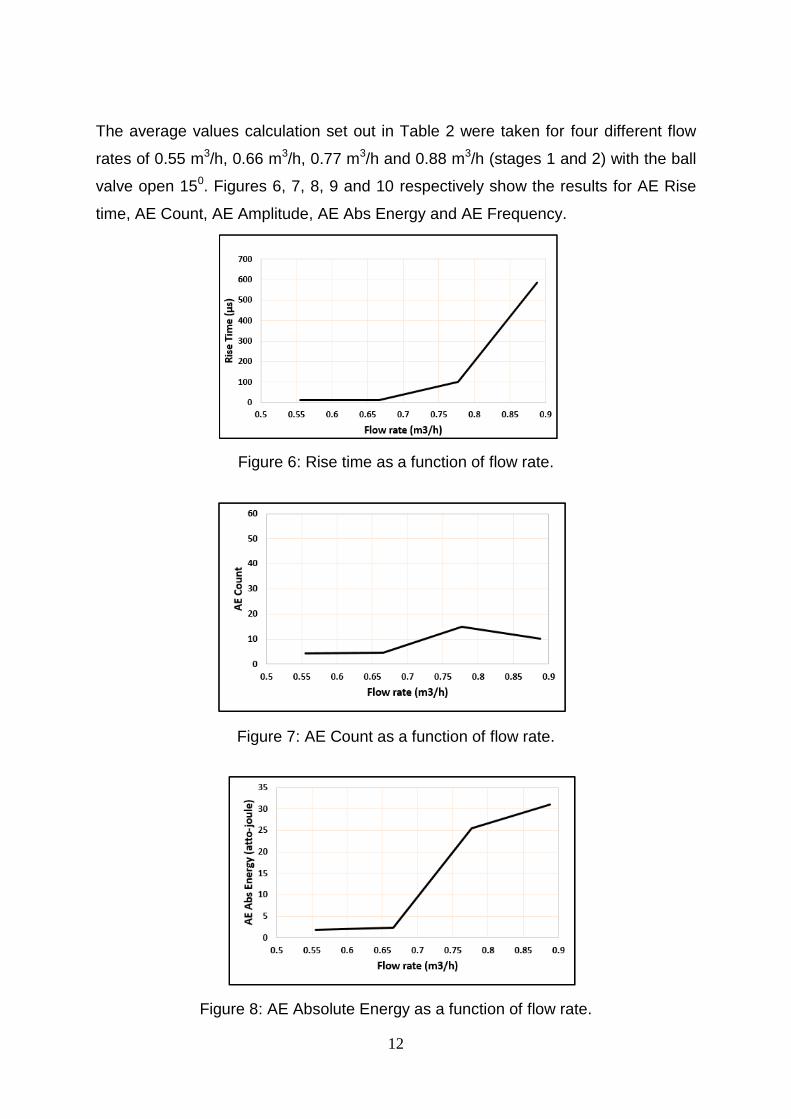
The average values calculation set out in Table 2 were taken for four different flow
rates of 0.55 m3/h, 0.66 m3/h, 0.77 m3/h and 0.88 m3/h (stages 1 and 2) with the ball
valve open 150. Figures 6, 7, 8, 9 and 10 respectively show the results for AE Rise
time, AE Count, AE Amplitude, AE Abs Energy and AE Frequency.
Figure 6: Rise time as a function of flow rate.
Figure 7: AE Count as a function of flow rate.
Figure 8: AE Absolute Energy as a function of flow rate.
13
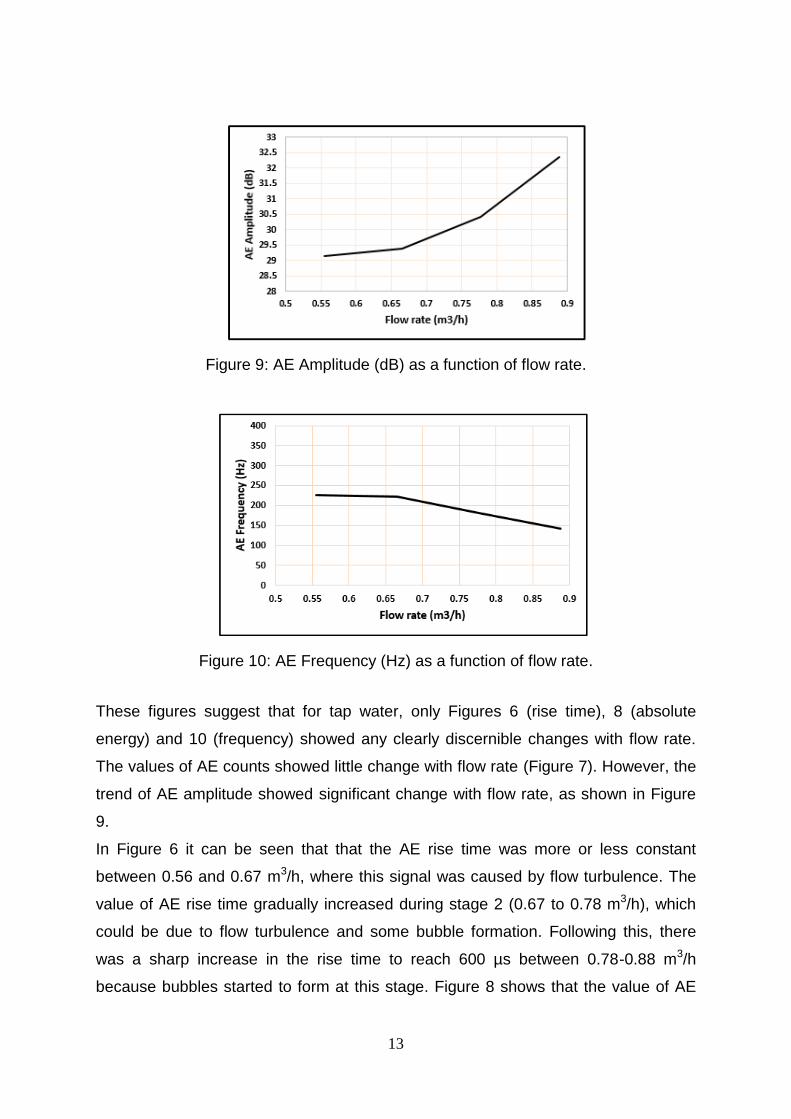
Figure 9: AE Amplitude (dB) as a function of flow rate.
Figure 10: AE Frequency (Hz) as a function of flow rate.
These figures suggest that for tap water, only Figures 6 (rise time), 8 (absolute
energy) and 10 (frequency) showed any clearly discernible changes with flow rate.
The values of AE counts showed little change with flow rate (Figure 7). However, the
trend of AE amplitude showed significant change with flow rate, as shown in Figure
9.
In Figure 6 it can be seen that that the AE rise time was more or less constant
between 0.56 and 0.67 m3/h, where this signal was caused by flow turbulence. The
value of AE rise time gradually increased during stage 2 (0.67 to 0.78 m3/h), which
could be due to flow turbulence and some bubble formation. Following this, there
was a sharp increase in the rise time to reach 600 µs between 0.78-0.88 m3/h
because bubbles started to form at this stage. Figure 8 shows that the value of AE
14
energy was stable between 0.56 and 0.67 m3/h, because there was no bubble
occurrence at this stage. But for flow rates above 0.67 m3/h, a sharp increase in the
value of the AE energy was observed. Figure 10, on the other hand, shows that the
AE frequency decreased with increasing flow rate turbulence and as bubbles started
to form.
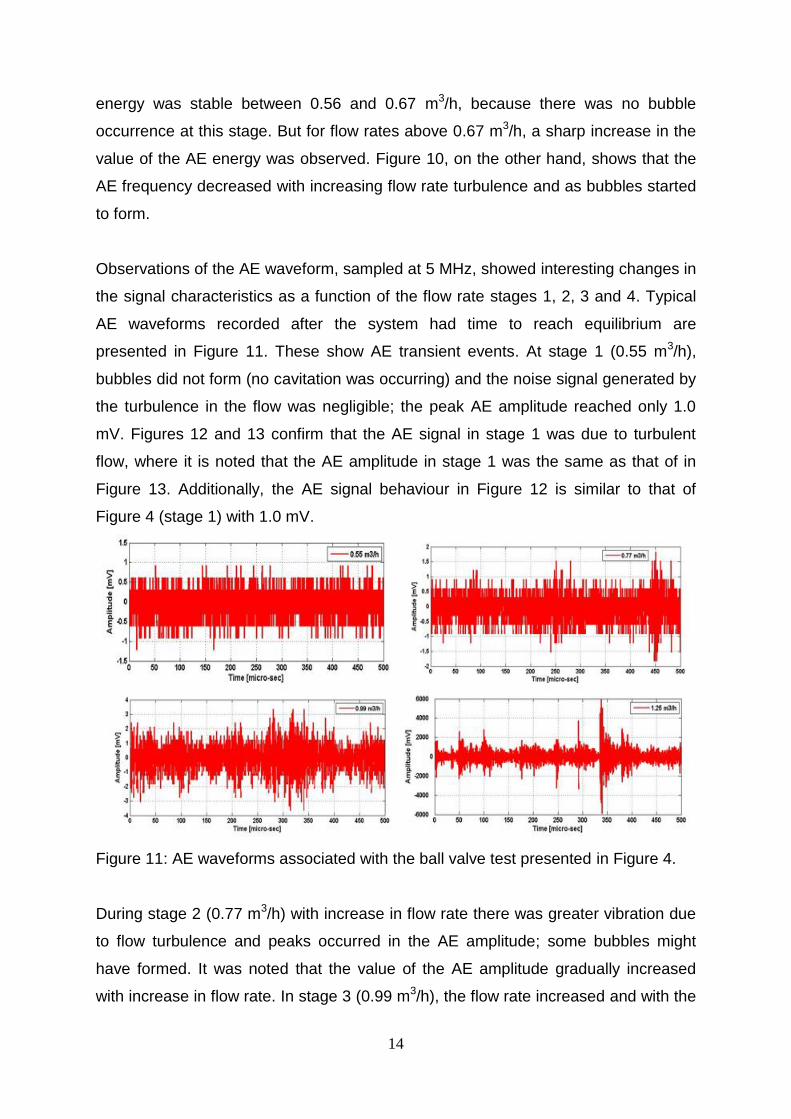
Observations of the AE waveform, sampled at 5 MHz, showed interesting changes in
the signal characteristics as a function of the flow rate stages 1, 2, 3 and 4. Typical
AE waveforms recorded after the system had time to reach equilibrium are
presented in Figure 11. These show AE transient events. At stage 1 (0.55 m3/h),
bubbles did not form (no cavitation was occurring) and the noise signal generated by
the turbulence in the flow was negligible; the peak AE amplitude reached only 1.0
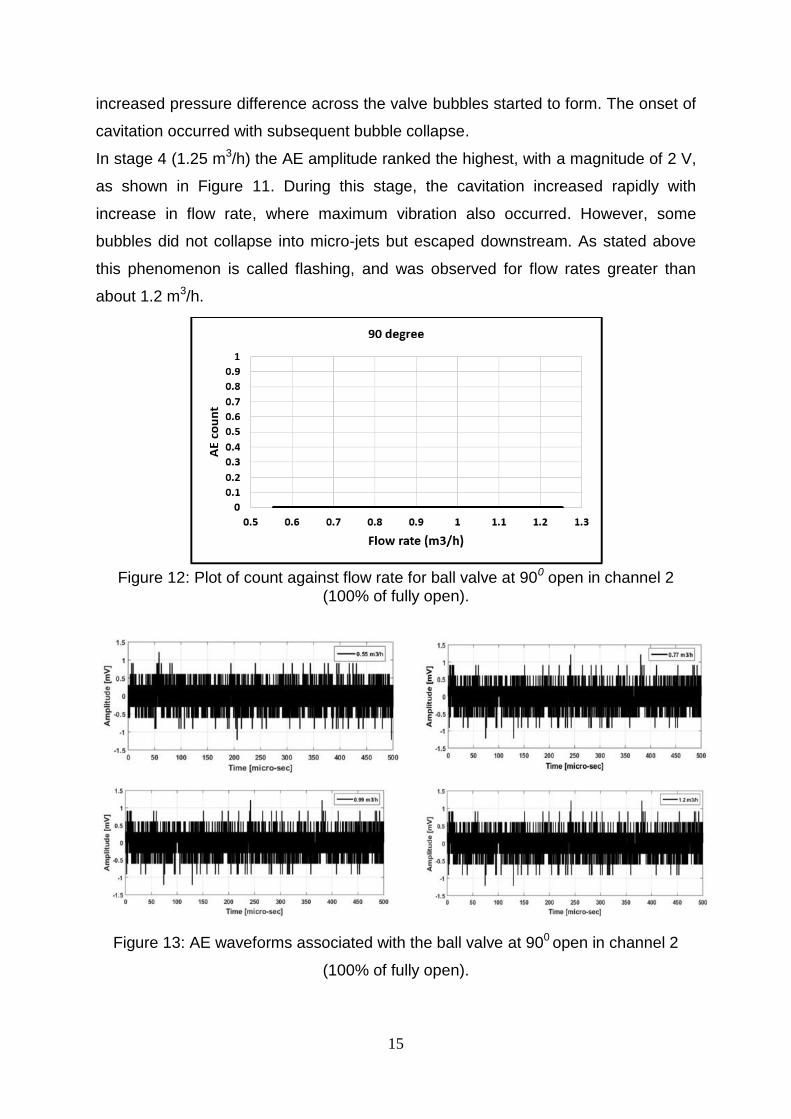
mV. Figures 12 and 13 confirm that the AE signal in stage 1 was due to turbulent
flow, where it is noted that the AE amplitude in stage 1 was the same as that of in
Figure 13. Additionally, the AE signal behaviour in Figure 12 is similar to that of
Figure 4 (stage 1) with 1.0 mV.
Figure 11: AE waveforms associated with the ball valve test presented in Figure 4.
During stage 2 (0.77 m3/h) with increase in flow rate there was greater vibration due
to flow turbulence and peaks occurred in the AE amplitude; some bubbles might
have formed. It was noted that the value of the AE amplitude gradually increased
with increase in flow rate. In stage 3 (0.99 m3/h), the flow rate increased and with the
15
increased pressure difference across the valve bubbles started to form. The onset of
cavitation occurred with subsequent bubble collapse.
In stage 4 (1.25 m3/h) the AE amplitude ranked the highest, with a magnitude of 2 V,
as shown in Figure 11. During this stage, the cavitation increased rapidly with
increase in flow rate, where maximum vibration also occurred. However, some
bubbles did not collapse into micro-jets but escaped downstream. As stated above
this phenomenon is called flashing, and was observed for flow rates greater than
about 1.2 m3/h.
Figure 12: Plot of count against flow rate for ball valve at 900 open in channel 2
(100% of fully open).
Figure 13: AE waveforms associated with the ball valve at 900 open in channel 2
(100% of fully open).
16
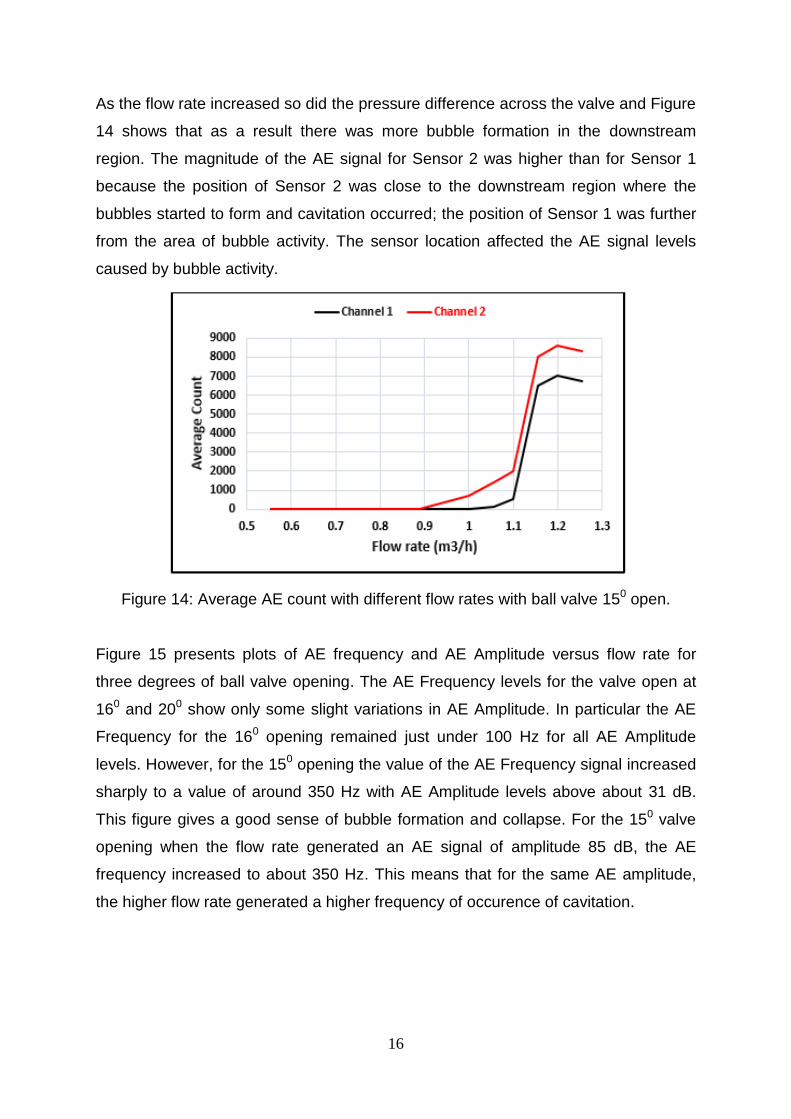
As the flow rate increased so did the pressure difference across the valve and Figure
14 shows that as a result there was more bubble formation in the downstream
region. The magnitude of the AE signal for Sensor 2 was higher than for Sensor 1
because the position of Sensor 2 was close to the downstream region where the
bubbles started to form and cavitation occurred; the position of Sensor 1 was further
from the area of bubble activity. The sensor location affected the AE signal levels
caused by bubble activity.
Figure 14: Average AE count with different flow rates with ball valve 150 open.
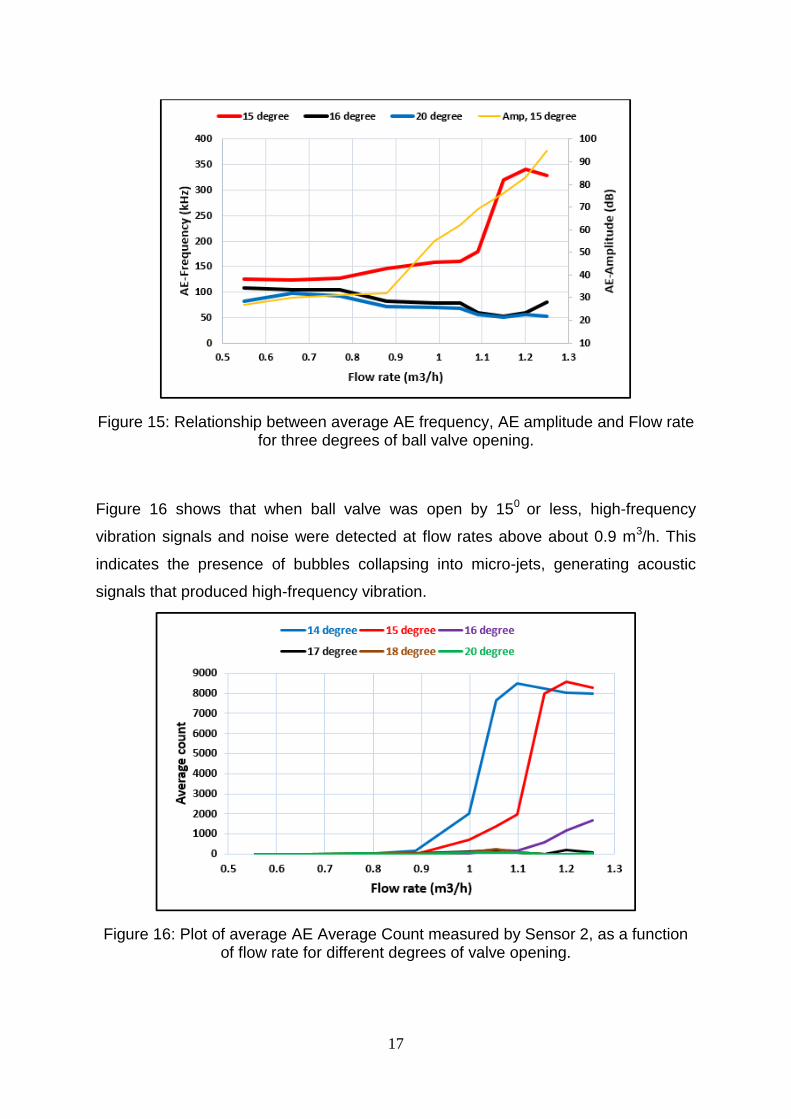
Figure 15 presents plots of AE frequency and AE Amplitude versus flow rate for
three degrees of ball valve opening. The AE Frequency levels for the valve open at
160 and 200 show only some slight variations in AE Amplitude. In particular the AE
Frequency for the 160 opening remained just under 100 Hz for all AE Amplitude
levels. However, for the 150 opening the value of the AE Frequency signal increased
sharply to a value of around 350 Hz with AE Amplitude levels above about 31 dB.
This figure gives a good sense of bubble formation and collapse. For the 150 valve
opening when the flow rate generated an AE signal of amplitude 85 dB, the AE
frequency increased to about 350 Hz. This means that for the same AE amplitude,
the higher flow rate generated a higher frequency of occurence of cavitation.
17
Figure 15: Relationship between average AE frequency, AE amplitude and Flow rate for three degrees of ball valve opening.
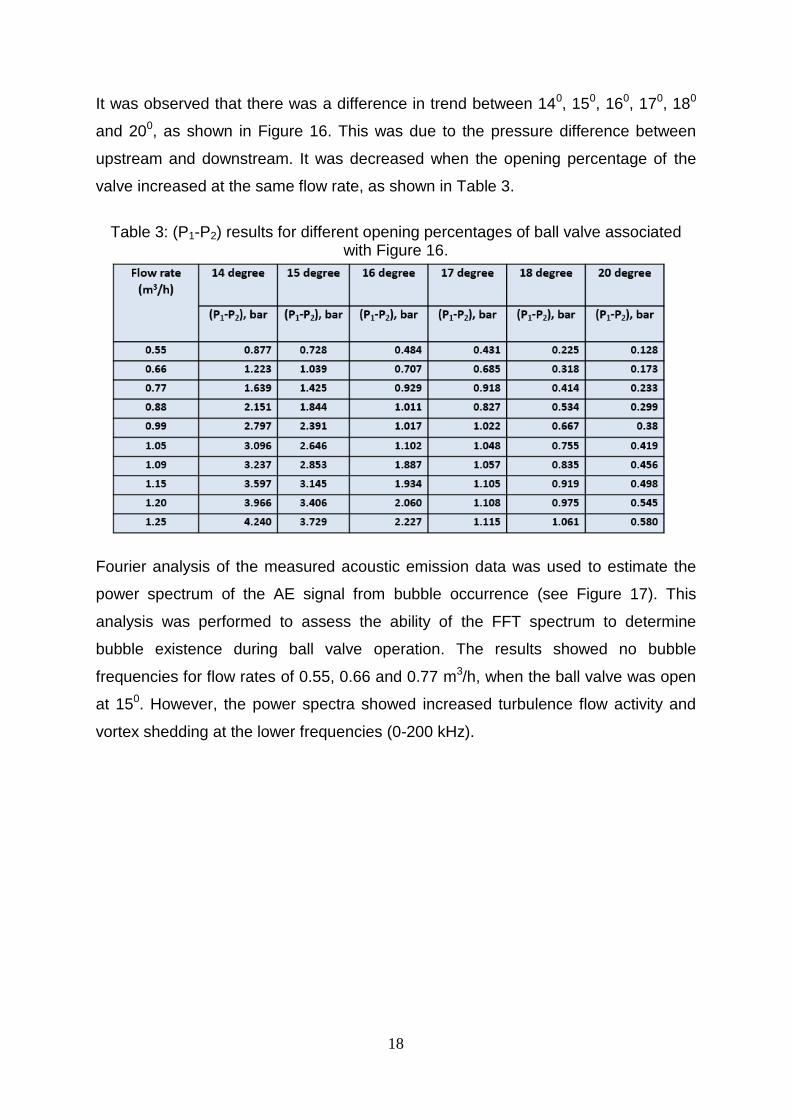
Figure 16 shows that when ball valve was open by 150 or less, high-frequency
vibration signals and noise were detected at flow rates above about 0.9 m3/h. This
indicates the presence of bubbles collapsing into micro-jets, generating acoustic
signals that produced high-frequency vibration.
Figure 16: Plot of average AE Average Count measured by Sensor 2, as a function of flow rate for different degrees of valve opening.
18
It was observed that there was a difference in trend between 140, 150, 160, 170, 180
and 200, as shown in Figure 16. This was due to the pressure difference between
upstream and downstream. It was decreased when the opening percentage of the
valve increased at the same flow rate, as shown in Table 3.
Table 3: (P1-P2) results for different opening percentages of ball valve associated
with Figure 16.
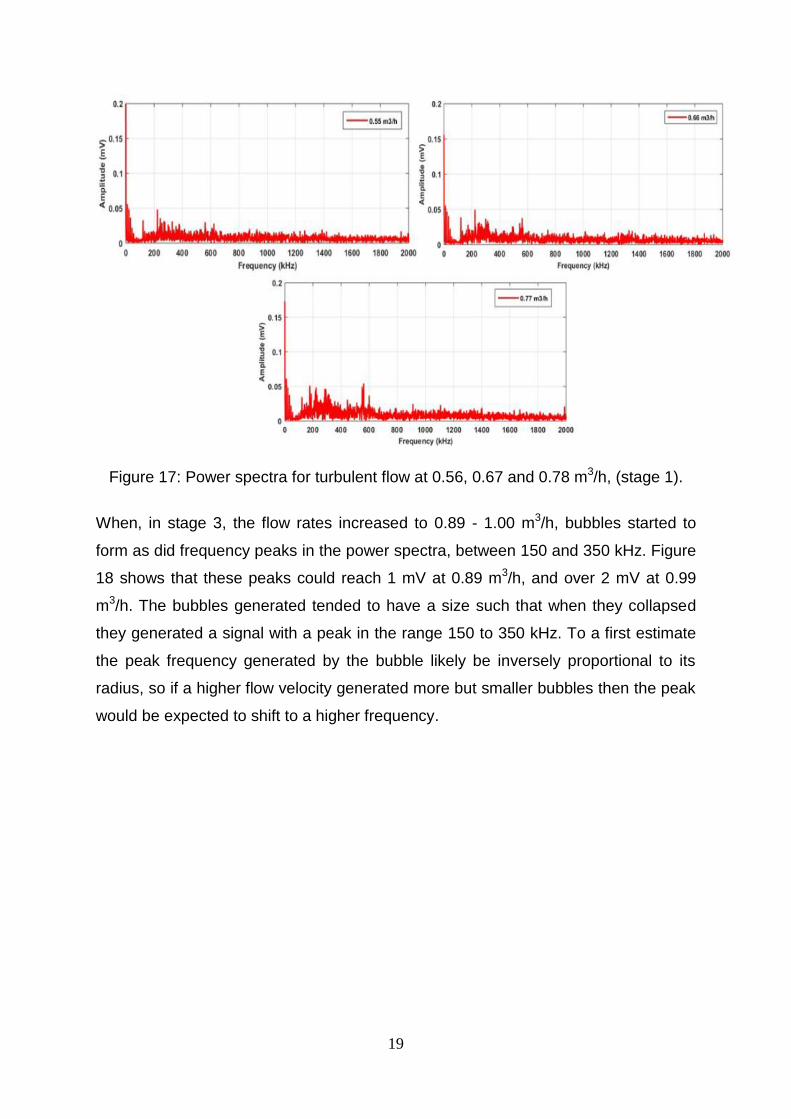
Fourier analysis of the measured acoustic emission data was used to estimate the
power spectrum of the AE signal from bubble occurrence (see Figure 17). This
analysis was performed to assess the ability of the FFT spectrum to determine
bubble existence during ball valve operation. The results showed no bubble
frequencies for flow rates of 0.55, 0.66 and 0.77 m3/h, when the ball valve was open
at 150. However, the power spectra showed increased turbulence flow activity and
vortex shedding at the lower frequencies (0-200 kHz).
19
Figure 17: Power spectra for turbulent flow at 0.56, 0.67 and 0.78 m3/h, (stage 1).
When, in stage 3, the flow rates increased to 0.89 - 1.00 m3/h, bubbles started to
form as did frequency peaks in the power spectra, between 150 and 350 kHz. Figure
18 shows that these peaks could reach 1 mV at 0.89 m3/h, and over 2 mV at 0.99
m3/h. The bubbles generated tended to have a size such that when they collapsed
they generated a signal with a peak in the range 150 to 350 kHz. To a first estimate
the peak frequency generated by the bubble likely be inversely proportional to its
radius, so if a higher flow velocity generated more but smaller bubbles then the peak
would be expected to shift to a higher frequency.

20
Figure 18: Power spectra for turbulent flows of 0.89 and 1.00 m3/h, (stage 3).
Figure 19 shows power spectral plots for flow rates of 1.06, 1.10, 1.16. 1.20 and 1.26
m3/h (stage 4). The frequency spectra for each flow rate show AE events that are
associated with different bubble sizes, and that any increase in AE amplitude
depended on the level of bubble activity.
Figure 19: Power spectral plots for turbulent flows of 1.05, 1.09, 1.15. 1.20 and 1.25
m3/h (stage 4).
21
The value of the amplitude of the primary frequency components in the region of
about 150 - 350 kHz observed at 1.06 m3/h increased with increasing flow rate,
which suggests an increase in bubble activity, though there was also a shift of
energy towards 350 kHz, which is due to cavitation. The amplitude of the AE signal
between about 400 to 700 kHz increased not only absolutely but also relative to the
peak at 350 kHz. Observation of the power spectra shown in Figure 19 strongly
suggests that the bubble occurrence frequency started from around 200 kHz but that
increasing the flow rate increased both the amplitude and peak frequency of the
associated signal. That is, the increase in spectral activity above about 800 kHz was
due to developing bubble activity and cavitation.
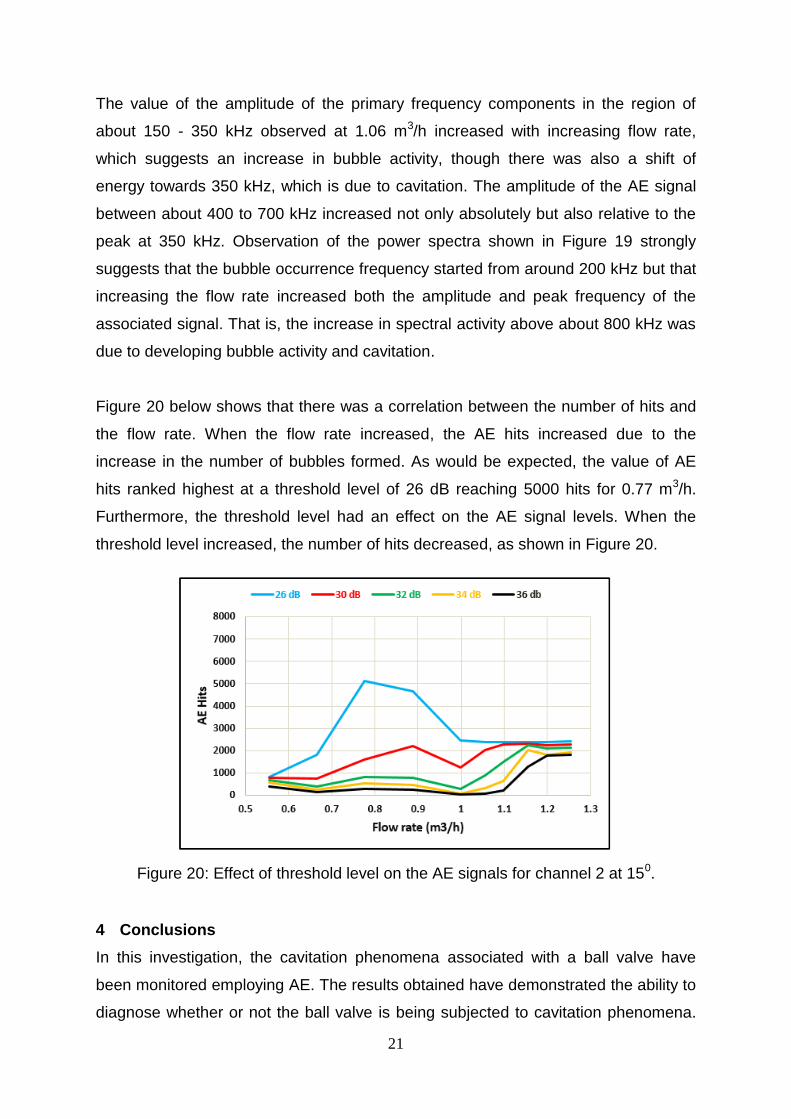
Figure 20 below shows that there was a correlation between the number of hits and
the flow rate. When the flow rate increased, the AE hits increased due to the
increase in the number of bubbles formed. As would be expected, the value of AE
hits ranked highest at a threshold level of 26 dB reaching 5000 hits for 0.77 m3/h.
Furthermore, the threshold level had an effect on the AE signal levels. When the
threshold level increased, the number of hits decreased, as shown in Figure 20.
Figure 20: Effect of threshold level on the AE signals for channel 2 at 150.
4 Conclusions
In this investigation, the cavitation phenomena associated with a ball valve have
been monitored employing AE. The results obtained have demonstrated the ability to
diagnose whether or not the ball valve is being subjected to cavitation phenomena.
22
When the ball valve was opened ≤ 150, the cavitation from incipient to fully
developed could be detected by analysing the high-frequency signal variations.
Furthermore, a correlation between the AE signals and threshold levels was noted;
when the threshold level increased, the value of the AE signal increased.
The present study concludes that undesired cavitation phenomenon can be
attributed to flow geometry, upstream pressure and flow rate and that collapsing
bubbles at higher flow rates generate higher-amplitude AE signals. These results,
however, also demonstrate that incipient cavitation at lower flow rates can be
detected using AE methods. Monitoring using AE should therefore enable a
reduction in erosion and pitting, and the provision of safer working conditions. The
AE technique used can detect and monitor bubble formation in ball valves with a
high degree of sensitivity. Finally, it can be said that the AE signals obtained using
this technique can distinguish between different types of bubble formation and
collapse.
References
1. Meland E. , Henriksen V. , Hennie E. and Rasmussen. Spectral analysis of internally leaking shut-down valves. Measurement. 2011; 44: 1059–1072.
2. Rajtar J. M. and Muthiah R. Pipeline leak detection system for oil and gas flowlines. Journal of Manufacturing Science and Engineering. 1997; 119,: 105–109.
3. Alssayh M. Slug Velocity Measurement and Flow Regime Recognition Using Acoustic Emission Technology. PhD Thesis. Cranfield University; 2013.
4. FDIS ISO. International Standards Organization Documents 22096. Documents. ISO, Generic RT (eds.) Condition monitoring and diagnosis of machines – Acoustic Emission; 2007.
5. Corporation PA. AE win PCI-2 Based AE System User’s Manual. Mistras Group Inc. 2007; REV 3(April): 1–312.
6. Neill, G.D., Reuben, R.L. and Sandford PM. Detection of Incipient Cavitation in Pumps using Acoustic Emission. Journal of Process Mechanical Engineering. 1997; 211(4): 267–277.
7. Rydberg KE. Energy efficient water hydraulic systems. The Fifth International Conference on Fluid Power transmission and Control, HangZhou, Chinahe. 2001; : 44–46.
8. Ceccio S. GS and SYT. The Effects of Salt Water on Bubble Cavitation. Journal of Fluids Engineering. 1997; Vol. 119: 155–163.
9. Gaitan DF. An experimental investigation of acoustic cavitation in gaseous liquids. University of Southwestern Louisiana. USA.; 1990.
10. Excel T. Local pressure loss calculation. ThermExcel - All Rights Reserved.

23
2014. Available at: https://www.thermexcel.com (Accessed: 1 December 2016)
11. Vorkurka K. Amplitudes of free bubble oscillations in liquids. Journal of Sound and Vibration. 1990. pp. 259–275.
12. Baker, K.G., Robertson, V.J. and Duck FA. A review of therapeutic ultrasound: Biophysical effects. Physical Therapy. 2001; 81(7): 1351–1358.
13. Leighton TG. The acoustic bubble: Oceanic bubble acoustics and ultrasonic cleaning. Proceedings of Meetings on Acoustics. 2015; 24: 1–5. Available at: DOI:10.1121/2.0000121
14. Futakawa M., Kogawa H., Hasegawa S., Ikeda Y., Riemer B., Wendel M., et al. Cavitation damage prediction for spallation target vessels by assessment of acoustic vibration. Journal of Nuclear Materials. 2008; 377(1): 182–188. Available at: DOI:10.1016/j.jnucmat.2008.02.058
15. Szkodo M. Cavitation erosion behaviour of laser processed Fe-Cf-Mn and Fe-cr-Co alloys. Journal of Achievement in Materials and Manufacturing Engineering. 2006; (1–2): 239–242.
16. Benz A. E. G. Use of Acoustic emission techniques for detection of discontinuities. Material Evaluation,. 1998; 56(0025–5327 CODEN : MAEVAD): 1215–1222.
17. Kaewwaewnoi W., Prateepasen A., Kaewtrakulpong P. Measurement of Valve Leakage Rate using Acoustic Emission. Proceedings of the 2nd International Conference on Electrical Engineering/Electronics, Computer, Telecommunications and Information Technology. 2005. pp. 3–6.
18. Jazi A. Masjedian, and Rahimzadeh H. Detecting cavitation in globe valves by two methods: Characteristic diagrams and acoustic analysis. Applied Acoustics. Elsevier Ltd; 2009; 70(11–12): 1440–1445. Available at: DOI:10.1016/j.apacoust.2009.04.010
19. Jazi a. M., Rahimzadeh H. Waveform analysis of cavitation in a globe valve. Ultrasonics. Elsevier B.V.; 2009; 49(6–7): 577–582. Available at: DOI:10.1016/j.ultras.2009.02.004
20. Dickey J., Dimmick J. and MPM. Acoustic Measurement of Valve Leakage Rates. Materials Evaluation. 1978; 36: 67–77.
21. Alfayez L., Mba D., Dyson G. Detection of incipient cavitation and the best efficiency point of a centrifugal pump using Acoustic Emission. 2004.
22. Alfayez, L., D. Mba and G dyson. Detection of incipient cavitation and the best efficiency point of 2.2MW centrifugal pump using acoustic emission. in 26th Eu. Berlin; 2004.
23. Jaubert L., Maillard S., Sulis V. Monitoring of Fluidic Systems By Acoustic Emission. European conf. AE Testing. France; 2008. pp. 334–339.
24. Addali a., Al-lababidi S., Yeung H., Mba D., Khan F. Acoustic emission and gas-phase measurements in two-phase flow. Proceedings of the Institution of Mechanical Engineers, Part E: Journal of Process Mechanical Engineering. 2010; 224(4): 281–290. Available at: DOI:10.1243/09544089JPME359
25. Addali A. Monitoring gas void fraction in two-phase flow with Acoustic Emission. PhD Thesis. Cranfield University; 2010.

24
26. Husin S., Addali A., Mba D. Feasibility study on the use of the Acoustic Emission technology for monitoring flow patterns in two phase flow. Flow Measurement and Instrumentation. Elsevier; 2013; 33: 251–256. Available at: DOI:10.1016/j.flowmeasinst.2013.07.011
27. Alhashan T., Elforjani M., Addali A., Teixeira J. Monitoring of Bubble Formation during the Boiling Process Using Acoustic Emission Signals. International Journal of Engineering Research & Science (IJOER). 2016; 2(4): 66–72.
28. Carmi Rami , Bussiba Arie AI and HI. Detection of Transient Zones During Water Boiling by Acoustic Emission. Acoustic Emission. 2011; 29: 89–97.
29. Benes P., Uher M. Identification of liquid boiling by acoustic emission. Fundamental and Applied Metrology. 2009; (1): 1396–1401.
30. Alhashan T., Addali A. The Effect of Salt Water on Bubble Formation during Pool Boiling Using Acoustic Emission Technique. 2016; 13(5): 51–56. Available at: DOI:10.9790/1684-1305085156
31. Husin Shuib and Mba Divad. Acoustic emission of a single bubble activities. Proceedings of the World Congress on Engineering 2010 Vol. II. London UK; 2010. pp. 0–5.
32. Thompson G. and Zolkiewski G. An experimental investigation into the detection of internal leakage of gases through valves by vibration analysis. Proceedings of the Institution of Mechanical Engineers. 1997; 211,.
33. Yan J., Heng-hu Y., Hong Y., Feng Z., Zhen L., Ping W., et al. Nondestructive Detection of Valves Using Acoustic Emission Technique. 2015; 2015. Available at: DOI:10.1155/2015/749371
34. Alhashan T., Addali A., Teixeira J. Exploration of the Possibility of Acoustic Emission Technique in Detection and Diagnosis of Bubble Formation and Collapse in Valves. 2016; 13(4): 1–9. Available at: DOI:10.9790/1684-13040.
35. Brennen C. Hydrodynamics of Pumps. Oxford Uni. Cambridge University Press; 1994. Available at: DOI:10.1017/CBO9780511976728
36. Elforjani MA. Condition Monitoring of Slow Speed Rotating Machinery Using Acoustic Emission Technology. Cranfield Univesity; 2010. Available at: DOI:10.1017/CBO9781107415324.004
37. International Electrochemical Commission (IEC) 60534-8-1. Industrial-process control valves - Part 8-1: Noise considerations - Laboratory measurement of noise generated by aerodynamic flow through control valves. 2005.
38. International Electrochemical Commission (IEC) 60534-8-4. 2nd Ed. Industrial-process control valves - Part 8-4: Noise considerations - Prediction of noise generated by hydrodynamic flow. 2005.