Embed Size (px)
Citation preview
IJBPAS, June, 2015, 4(6): 4289-4310
ISSN: 2277–4998
4289
IJBPAS, June, 2015, 4(6)
HYPOCHOLESTEROLEMIC EFFECT OF SOME PLANT BY-PRODUCTS IN
BAKERY PRODUCTION: BIOCHEMICAL AND HISTOLOGICAL STUDY
MOSTAFA H. OSFOR*, 1
, MOHAMED A. BASALAMAH, AHMED M. ASHSHI1,
AMANY HEGAZY2, MAHA I. ABDELMOATY
2, NASER A. ELSAWY
1&3 AND
MOHAMMED AS ABOUREHAB4
1: Departments of Clinical Nutrition and Laboratory, Medicine Faculty of Applied Medical
Sciences Umm Al-Qura University, 21995 Saudi Arabia
2: Department of Nutrition and Food Science, National Research Center, Dokki, Giza 00202
Egypt
3: Anatomy and Embryology Department, Faculty of Medicine, Zagazig University Zagazig
002055, Egypt
4: Pharmaceutics Departments, Faculty of Pharmacy, Umm Al-Qura University, 21995 Saudi
Arabia
*Corresponding Author: E Mail: [email protected]
ABSTRACT
The current study was conducted to investigate the hypocholesterolemic effect of a mixture of
three plant by-products (orange albedo, potato peel and carrot pomace), as a source of natural
fibers on hypercholesterolemia and hyperglycemia in hypercholesterolemic rats. Furthermore,
production of bread containing high natural fiber contents, formed from these by-products.
The diet was supplemented with 10% and 20% of this mixture. The obtained results revealed
that the hypercholesterolemic rats which fed on the diet supplemented with 20% mixture
showed the highest significant improve in lipid profile, liver function, kidney function, blood
picture and plasma glucose compared to positive and negative control. Also the results
showed a high significant decrease in body weight gain compared to positive control. In
addition, the sensory evaluation of the bread which formed from these by-products showed
that the addition of the mixture to the bread significantly decreased the bread quality
compared with control Balady Bread, but the bread that contained 10% mix showed a high
Mostafa H. Osfor et al Research Article
4290
IJBPAS, June, 2015, 4(6)
values in [taste, aroma, mouth feel, crumb texture, crumb color, (break & shred) and crust
color] compared to the bread containing 20% mix.
Keywords: Hypercholesterolemia, dietary Orange Albedo powder (OrAP), potato peel
powder (PoPP) carrot pomace powder (CaPP), and dietary fibers
INTRODUCTION:
In recent years, many reports have focused on
how to decrease plasma lipid concentrations
and the absorption of fat in the intestinal tract
to reduce diet-related chronic disease. Fibers
show some potent hypolipidemic effect [1].
The relationship between fruit and vegetable
intake and health has been the focal point of
much scientific investigation, in attempts to
identify the specific plant components that
convey health benefits. Fruits and vegetables,
apart from being good sources of vitamins,
minerals, and fiber, are also rich sources of
potentially bioactive compounds known as
phytochemicals [2-3].
Dietary fiber may reduce the risk of coronary
heart disease (CHD) through a variety of
mechanisms, such as improving blood lipid
profiles [4-5], Depending on specific
characteristics, a soluble fiber has been shown
to reduce triglyceridaemia in human
secondary CVD risk trials [6] and in obese
Zucker rats [7].
Furthermore, dietary fibers can adsorb heavy
metals [8-9] and act as a potential “functional
food” that reduces the incidence of CVDs
[10] by reducing the risk of type-2 diabetes,
body weight, serum low-density lipoprotein–
cholesterol levels and adsorbing bile acids
[11].
Abd El-Ghany et al. [12] found that PoPP
showed a significant decrease in cholesterol,
triglycerides, LDL-C and VLDL-C, and
significant increase in HDL-C comparing
with positive control. Singh et al. [13] found
that potato peel influence both glycemic index
and antioxidant status in streptozotocin
(STZ)-induced diabetic male Wistar rats. In
that study, diabetic rats fed on PoPP
supplemented diet showed significant
decrease in blood glucose levels.
A study by Singh and Rajini [14] was
conducted to investigate the protective effect
of PoPP against acute liver injury in rats. The
results demonstrated that pretreatment of rats
with PoPP significantly prevented the
increased activities of AST and ALT in serum
prevented the elevation of hepatic MDA
formation as well as protected the liver from
GSH depletion.
Carrot fiber has become of interest to food
processers due to the large quantities of carrot
waste created in the cut and peel carrot and
carrot juice industries. Carrot pomace is the
wet carrot shavings produced from carrot
processing which is subsequently dried to
Mostafa H. Osfor et al Research Article
4291
IJBPAS, June, 2015, 4(6)
form a powder, the water retention and
swelling capacities of carrot pomace were
relatively high compared to other agricultural
byproducts such as apple, pear, and orange
pomace [15]. Nawirska and Uklanska [16]
found that carrot pomace have the highest
percentage of soluble fiber when compared
with apple, cabbage, strawberry, black
currant, and chokeberry pomace.
Chau and Huang [17] demonstrated that the
WIFF derived from Orang peel had very
pronounced hypocholesterolemic and
hypolipidemic effects as compared to
cellulose. It could significantly decrease the
levels of serum triglyceride, serum total
cholesterol, liver total lipid, and liver
cholesterol, the hypocholesterolemic action of
WIFF is due to its ability to enhance
cholesterol and bile acids excretion. WIFF
could be a potential cholesterol-lowering
ingredient in human diets, and offer industry
an opportunity to develop new formulations
of fiber-rich functional foods.
Pectin, the dietary fiber that is so effective in
helping to reduce cholesterol, is present in
large amounts in the white lining of citrus
fruit (albedo). An easy way to increase pectin
intake is to eat the white pith. Pectin is a
major component of the kind of fiber that is
known to lower cholesterol. Pectin is also
helpful in stabilizing blood sugar. A single
orange provides 3 grams of fiber, and dietary
fiber has been associated with a wide range of
health benefits [18].
MATERIALS AND METHODS
MATERIALS
Fresh potato peels (Solanum tuberosum, L.)
were obtained from Chipsy for Food
Industries Company - Egypt, fresh carrot
pomace (Daucus carota) was obtained from
local juice extraction shops, and orange was
obtained from local market and the albedo
was separated from the orange peels. The
three samples were dried in an air-oven at 45
°C for 48 h. The dried samples were ground
in a multi mill apparatus and passed through a
0.5-mm mesh sieve to obtain a fine powder.
The powders were mixed well at equal
weights.
Biological effects of the mixture powder:
Experimental animals and diets:
Thirty two male albino rats weighing (100-
120 g) were obtained from the laboratory
animal house, National Research Center,
Egypt. The animals were housed individually
in stainless steel cages in a controlled
environment (25±2 ºC, 50-60% relative
humidity and 12-hour light-dark cycle). The
animals were fed ad-libitum with a basal diet
and water for two weeks, and were then
randomly assigned to 4 groups (8 rats each) as
follows:
Group 1 (negative control): received basal
diet consisting of starch 65% casein 10% corn
oil 10% salt mixture 4% vitamins mixture 1%
Mostafa H. Osfor et al Research Article
4292
IJBPAS, June, 2015, 4(6)
and cellulose 10% Association of Official
Agriculture Chemists, 2000.
Group 2 (positive control): received
hypercholesterolemia-induced diet (high fat
diet) which prepared as basal diet preparation,
except that the 10% corn oil portion was
replaced with 10% animal fat and it was
supplemented with 1% cholesterol and 0.25%
bile salts [19].
Group 3: received 80% high fat diet plus
20% mixture powder.
Group 4: received 90% high fat diet plus
10% mixture powder.
Experimental Design:
During the experimental period (6 weeks),
water and diets were available ad- libitum. At
the end of the experiment, all the animals
were scarified by cervical decapitation. Blood
samples were collected in two tubes. The first
one (0.5 mL blood) was used for the
determination of blood hemoglobin, red blood
cells (RBCs), white blood cells (WBCs) and
haematocrit (HCT), the 2nd heparinized tube
was centrifuged at 2500 rpm at 37 ºC for 15
min to separate the plasma which was kept in
the deep freezer for the subsequent
investigation. Also, body weight, food
consumption were recorded day after day.
Biochemical Analysis:
Lipid Profile:
Plasma total lipid (TL), triglycerides (TG),
total cholesterol (TC), low density lipoprotein
cholesterol (LDL-C) and high density
lipoprotein cholesterol (HDL-C) “mg/dl”
were determined according to Knight et al.
[20], Fossati and Prencipe [21], Allain et al.
[22], Levy [23] and Burstein [24],
respectively.
Atherogenic Index (AI) was calculated
according to Lee and Niemann [25].
Liver functions tests:
Aspartate aminotransferase (AST) and alanine
aminotransferase (ALT) activities were
measured colorimetrically at 340 nm in
plasma according to the method described by
Reitman and Frankel [26]. Alkaline
phosphatase (ALP) activity in plasma was
determined colorimetrically at 405 nm
according to the method of Rec [27].
Kidney functions tests:
For kidney functions urea in plasma was
determined colorimetrically at 578 nm
according to the methods described by Patton
and Crouch [28] and the determination of
plasma creatinine content was carried out
colorimetrically at 510 nm according to the
methods described by Faulkner and King
[29].
Determination of glucose:
Plasma glucose level was determined
colorimetrically at 510 nm according to
Trinder [30].
Determination of total protein and
albumin:
Mostafa H. Osfor et al Research Article
4293
IJBPAS, June, 2015, 4(6)
Plasma total protein and plasma albumin were
determined colorimetrically according to the
methods described by Henry [31] and
Doumas and Peters [32] respectively.
Blood Picture:
Blood hemoglobin:
The concentration of blood hemoglobin was
determined colorimetrically at 546 nm
according to the method of International
Committee for Standardization in
Haematology [33].
Red blood cells (RBCs) and White blood
cells (WBCs):
Red blood cells (RBCs) count and White
blood cells (WBCs) count were measured
according to the method of Natt and Herrick
[34].
Hematocrit (HCT):
Hematocrit (HCT) is the percent volume of
whole blood occupied by red blood cells and
is determined by centrifuging blood in special
(hematocrit) capillary tubes. It was
determined according to the method of
Campbell [35].
Histopathological examination:
Liver and kidney of the sacrificed rats were
taken and immersed in 10 % formalin
solution. The specimens were then trimmed,
washed and dehydrated in ascending grades
of alcohol. Dehydrated specimens were
cleared in xylol, embedded in paraffin,
sectioned at 4-6 microns thickness and stained
with Heamtoxylin and Eosin for
histopathological examination according to
the method described by Carleton [36].
Preparation of bread samples:
Bread was prepared with 10 and 20 % of
mixture powder by substituted with wheat
flour comparing with the control balady
bread. The baking formula according to the
flour weight included salt (2%) and
compressed yeast (3%), the used amount of
water was varied.
Dough was made from wheat flour extract 79
%, flour blends were mixed in a mixer and
baked into bread using the conventional
straight dough process. After one hour of
fermentation the dough mass was divided into
loaves, rounded and allowed to rest for 20
minutes before sheeting and molding, then
baked according to the conventional method.
Sensory evaluation of prepared bread:
The untrained panelists, consisting of 17
college students (10 females and 7 males)
most of whom had no experience with
sensory evaluation techniques, were given a
general orientation session to be familiar with
the test procedures, bread samples were
evaluated within 6 hour after baking. Each
batch of test samples had one slice of the
control bread and tested bread samples of all
levels while presented to each panelist in a
dish labeled each sample with a three-digit
random number code. The tested parameters
were taste, aroma, mouth feel, crumb texture,
crumb color, (break & shred), crust color and
Mostafa H. Osfor et al Research Article
4294
IJBPAS, June, 2015, 4(6)
symmetry shape. Categories were established
similar to those of Kulp et al. [37] with a total
scoring scale of 100 divided to each
parameter as follows (taste (20), aroma (20),
mouth feel (10), crumb texture (15), crumb
color (10), (break & shred) (10), crust color
(10) and symmetry shape (5)).
Statistical analysis:
Statistical analysis (standard error „„SE‟‟) was
carried out according to Fisher [38]. LSD
(Least significant difference) test was used to
compare the significant differences between
means of treatment; Waller and Duncan [39].
The statistical package for social science
SPSS (1999) program version was used for all
analysis.
RESULTS
Table 1: The mean value of Body Weight Gain (g / d), Feed Efficiency Ratio and Food Intake (g / d) in the
experimental rats
Parameters
Treatments
Body weight gain FER Food intake
G-1
Negative control 1.3 ±0.11
[bc] 0.07 ±0.00
[c] 18.0 ±0.60
[b]
G-2
Positive control 2.4 ±0.06
[a] 0.12 ±0.00
[a] 20.1 ±0.33
[a]
G-3
20% Mix 1.1 ±0.07
[c] 0.06 ±0.00
[c] 15.9 ±0.55
[c]
G-4
10% Mix 1.4 ±0.08
[b] 0.10 ±0.00
[b] 13.0 ±0.45
[d]
All values represented as mean +S.E.; [a-d]
Means with different letters are significantly different (p<0.05).
Table 2: Plasma total lipid, total cholesterol, triglycerides, LDL-C, HDL-C (mg/dl) and AI in the
experimental rats
Parameters
Treatments
Total lipid T. cholesterol Triglycerides LDL-C HDL-C AI
G-1
(Negative
control)
631 ±38.1 [b]
199 ±6.2 [b]
124 ±7.6 [b]
140 ±3.46 [b]
48.4 ±3.01 [b]
3.11
G-2
(Positive control) 1252 ±36.5
[a] 388.9 ±11.8
[a] 395 ±17.2
[a] 324 ±11.5
[a] 37.8 ±3.52
[c] 9.28
G-3
(20%Mixiture) 496 ±24
[c] 157 ±3.4
[c] 73.1 ±2.2
[c] 86 ±3.26
[c] 59 ±2.22
[a] 1.66
G-4
(10%Mix) 591 ±30.2
[bc] 175.1 ±6.9
[c] 94 ±2.6
[c] 101.6 ±5.84
[c] 46.9 ±4.32
[bc] 2.73
[a-c]All values represented as mean +S.E.; Means with different letters are significantly different (p<0.05).
Table 3: Complete blood picture of the experimental rats
Parameters
Treatments
Hemoglobin
(g/dL)
RBCs Count
(×million /mm³)
Hematocrit Value (%)
WBCs Count (×10³
/µL)
G-1
(Negative Control) 11.2 ±0.55
[b] 5.2 ±0.17
[a] 36.9 ±2.02
[b] 9.6 ±0.84
[a]
Mostafa H. Osfor et al Research Article
4295
IJBPAS, June, 2015, 4(6)
G-2
(Positive Control) 9.3 ±0.55
[c] 3.6 ±0.18
[b] 29.1 ±1.03
[c] 3.3 ±0.24
[c]
G-3
(20% Mix) 13.8 ±0.53
[a] 5.5 ±0.21
[a] 42.7 ±1.62
[a] 7.7 ±0.6
[ab]
G-4
(10% Mix) 13 ±0.54
[a] 5 ±0.17
[a] 39.8 ±1.52
[ab] 6.7 ±1.02
[b]
All values represented as mean +S.E; [a-c]
Means with different letters are significantly different (p<0.05).
Table 4: Plasma ALT, AST and ALP activities (IU/L) in the experimental rats
Parameters
Treatments
AST
ALT
ALP
G-1
(Negative control) 28.4 ±2.32
[b] 25.6 ±2.25
[b] 91 ±4.81
[b]
G-2
(Positive control) 93.1 ±6.42
[a] 86 ±4.04
[a] 183 ±4.25
[a]
G-3
(20% Mix) 23.4 ±2.98
[b] 27.5 ±3.36
[b] 78.1 ±4.58
[c]
G-4
(10% Mix) 26.3 ±2.3
[b] 28.1 ±2.98
[b] 86.6 ±4.11
[bc]
All values represented as mean +S.E.
Means with different letters are significantly different (p<0.05).
Table 5: Plasma urea and creatinine (mg/dL) of the experimental rats
Parameters
Treatments
Urea
Creatinine
G-1
(Negative Control) 26.6 ±3.1
[a] 0.9 ±0.08
[b]
G-2
(Positive Control) 12.9 ±1.73
[b] 1.2 ±0.07
[a]
G-3
(20% Mix) 27.4 ±2.8
[a] 0.8 ±0.07
[b]
G-4
(10% Mix) 26.8 ±2.78
[a] 1 ±0.07
[b]
All values represented as mean +S.E.; Means with different letters are significantly different (p<0.05)
Table 6: Plasma protein, albumin (g/dL) and plasma glucose (mg/dL) of the experimental rats
Parameters
Treatments
Total protein Albumin
Glucose
G-1
(Negative control) 7 ±0.26
[a] 4 ±0.28
[a] 87 ±6.67
[b]
G-2
(Positive control) 4.2 ±0.28
[b] 2.5 ±0.24
[b] 105 ±3.95
[a]
G-3
(20% Mix) 7.4 ±0.19
[a] 4.3 ±0.22
[a] 72.6 ±2.24 c
G-4
(10% Mix) 7.2 ±0.2
[a] 4.1 ±0.19
[a] 80.8 ±3.46
[bc]
Mostafa H. Osfor et al Research Article
4296
IJBPAS, June, 2015, 4(6)
All values represented as mean +S.E.; Means with different letters are significantly different (p<0.05).
Table 7: Relative organs weight (g) of the experimental rats
Organs
Treatments
Liver
Heart
Kidney
Spleen
G-1
(Negative control) 9.1 ±0.27
[d] 1.3 ±0.06
[a] 2.2 ±0.05
[c] 1.1 ±0.05
[a]
G-2
(Positive control) 20.0 ±0.85
[a] 1.4 ±0.05
[a] 2.7 ±0.06
[a] 1.3 ±0.06
[a]
G-3
(20% Mix) 11.1 ±0.63
[c] 1.3 ±0.03
[a] 2.4 ±0.06
[bc] 1.1 ±0.04
[a]
G-4
(10% Mix) 13.4 ±0.74
[b] 1.3 ±0.06
[a] 2.5 ±0.06
[b] 1.2 ±0.07
[a]
All values represented as mean +S.E.; Means with different letters are significantly different (p<0.05)
Table 8: Effect of different levels of the mixture powder on Balady Bread sensory evaluation
Samples Taste
(20)
Aroma
(20)
Mouth
feel
(10)
Crumb
texture
(15)
Crumb
color
(10)
Break
&
Shred
(10)
Crust
color
(10)
Symmetry
shape
(5)
overall
acceptance
(100)
Balady
Bread
(Control)
15.3
±0.75 [a]
15.9
±0.51 [a]
8.5
±0.23 [a]
11.6
±0.40 [a]
8.5
±0.21 [a]
8.6
±0.38 [a]
9.4
±0.15 [a]
4.4 ±0.17 [a]
82.1
20% Mix 8.8
±0.16 [c]
9.6
±0.59 [c]
2.9
±0.22 [c]
5.4
±0.15 [c]
5.4
±0.15 [c]
2.5
±0.12 [c]
5.2
±0.18 [c]
1.5 ±0.17 [b]
41.2
10% Mix 10.4
±0.15 [b]
11.3
±0.22 [b]
5.6
±0.36 [b]
9.8
±0.16 [b]
6.5
±0.15 [b]
5.4
±0.17 [b]
7.1
±0.20 [b]
4.1 ±0.12 [a]
60.1
All values represented as mean +S.E. Means with different letters are significantly different (p<0.05).
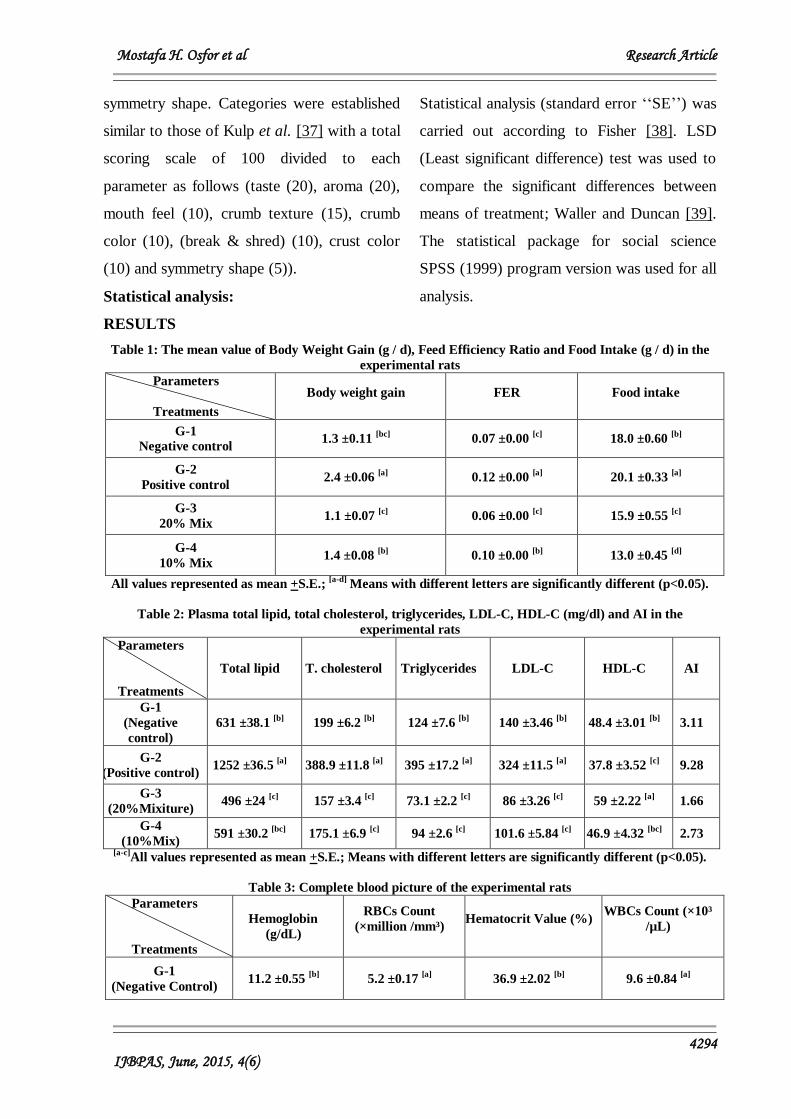
Fig. 1: Normal histological structure of hepatic lobule in rat’s liver fed the basal diet “negative control
group”. (H and E ×400)
Mostafa H. Osfor et al Research Article
4297
IJBPAS, June, 2015, 4(6)
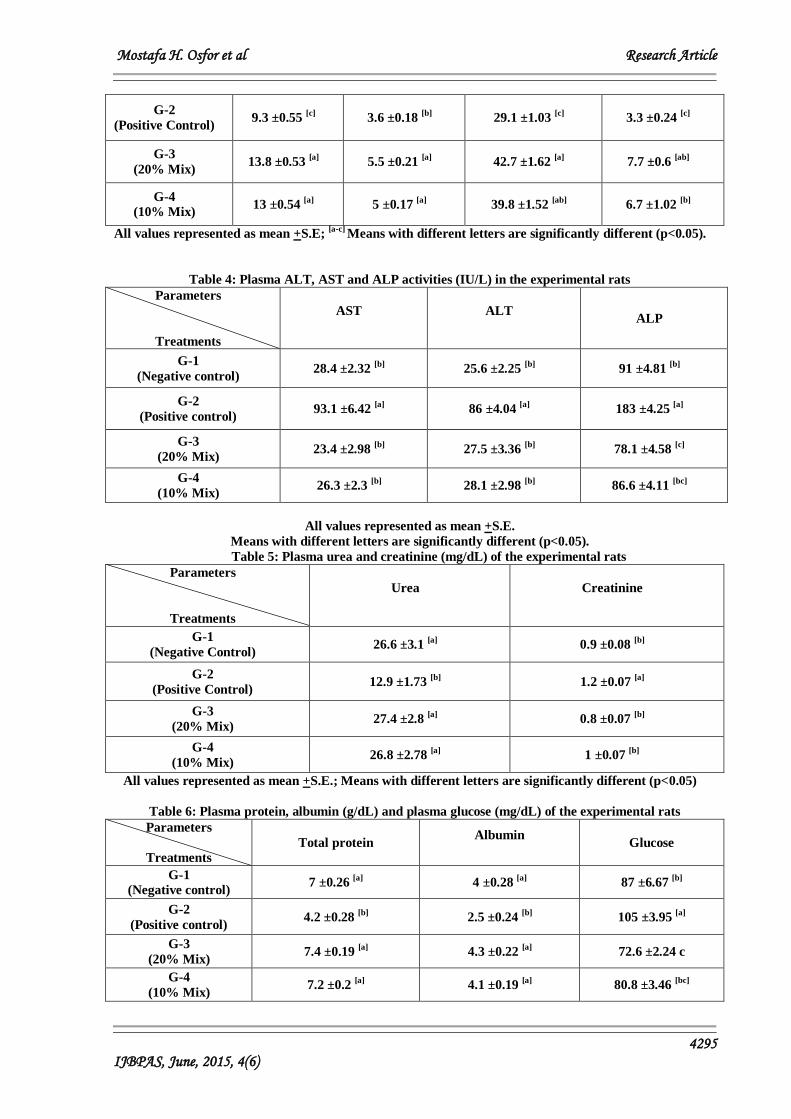
Fig. 2: Liver of rat from group 2 “positive control” showing enlarged hepatocytes, foamy cytoplasm (small
arrow) as well as local hepatic hemorrhage (large arrow). (H and E ×400)
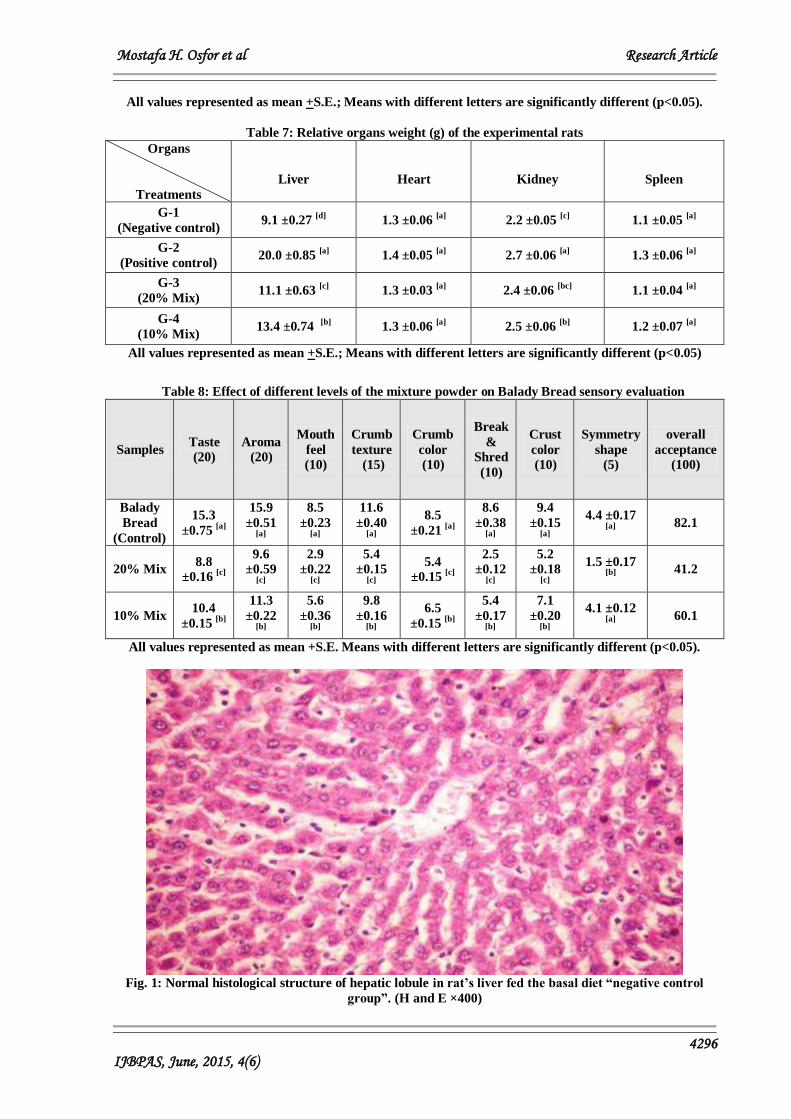
Fig. 3: Liver of rat from group 3 (20% Mix) showing fatty change of some hepatocytes (H and E ×400)
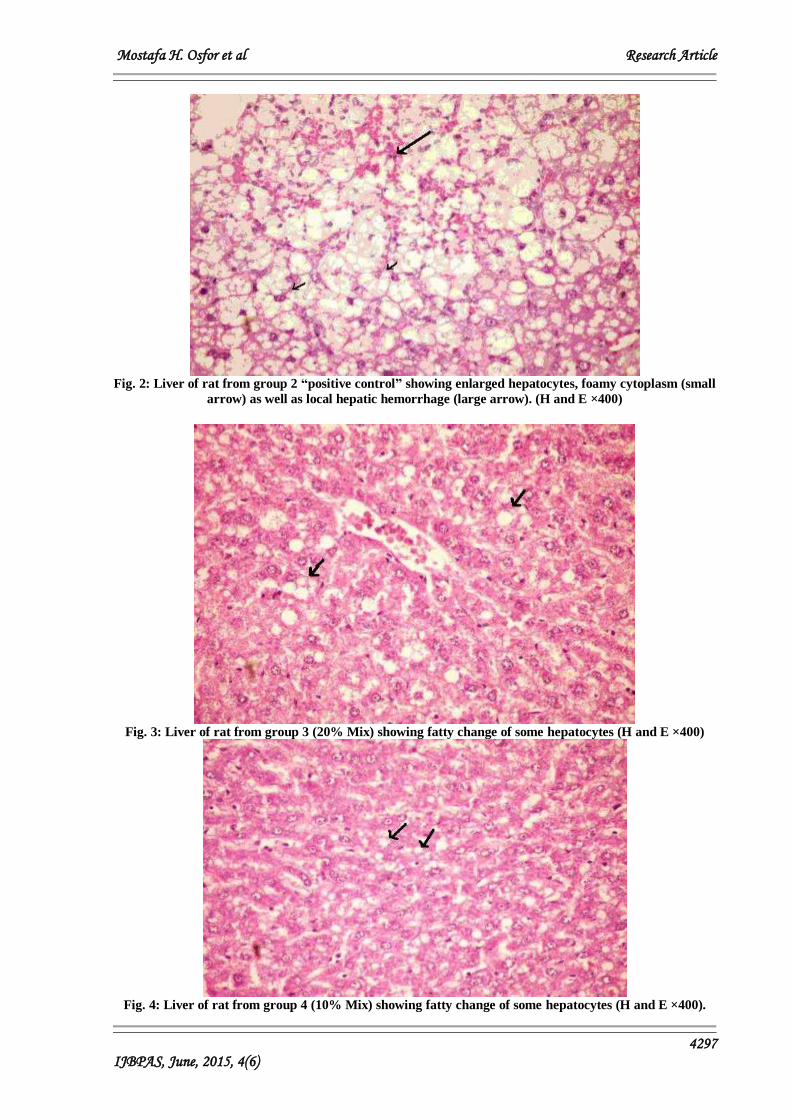
Fig. 4: Liver of rat from group 4 (10% Mix) showing fatty change of some hepatocytes (H and E ×400).
Mostafa H. Osfor et al Research Article
4298
IJBPAS, June, 2015, 4(6)
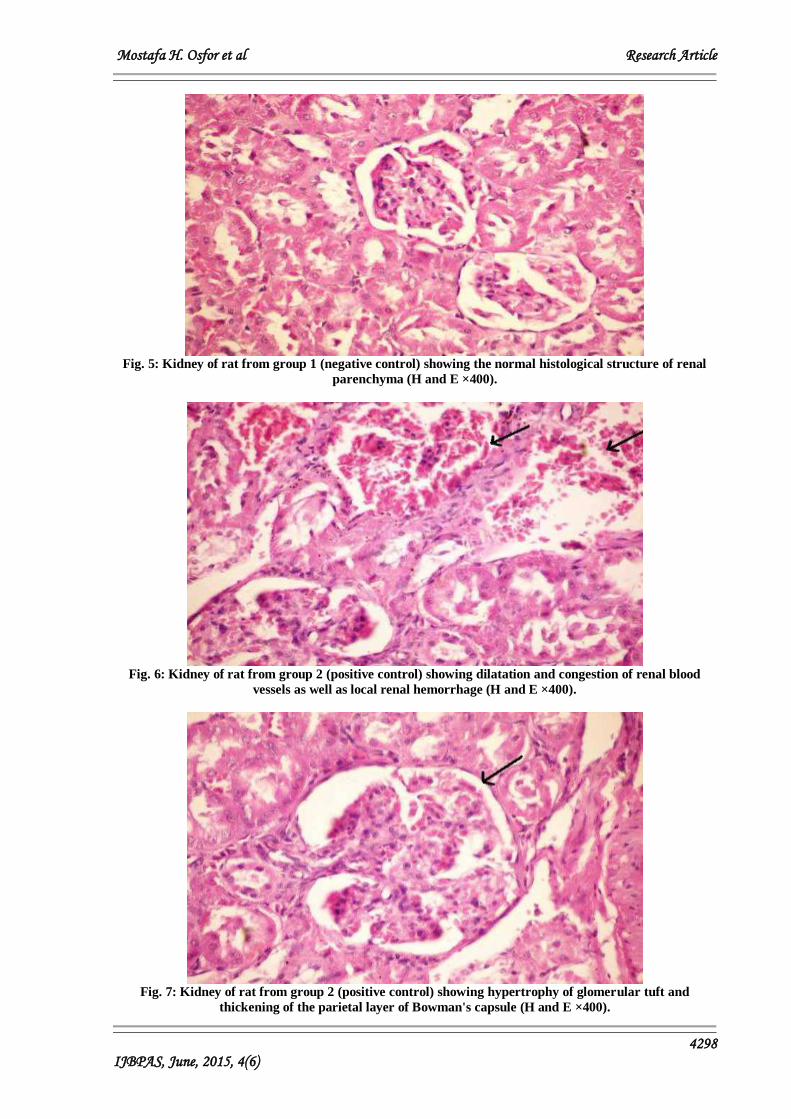
Fig. 5: Kidney of rat from group 1 (negative control) showing the normal histological structure of renal
parenchyma (H and E ×400).
Fig. 6: Kidney of rat from group 2 (positive control) showing dilatation and congestion of renal blood
vessels as well as local renal hemorrhage (H and E ×400).
Fig. 7: Kidney of rat from group 2 (positive control) showing hypertrophy of glomerular tuft and
thickening of the parietal layer of Bowman's capsule (H and E ×400).
Mostafa H. Osfor et al Research Article
4299
IJBPAS, June, 2015, 4(6)
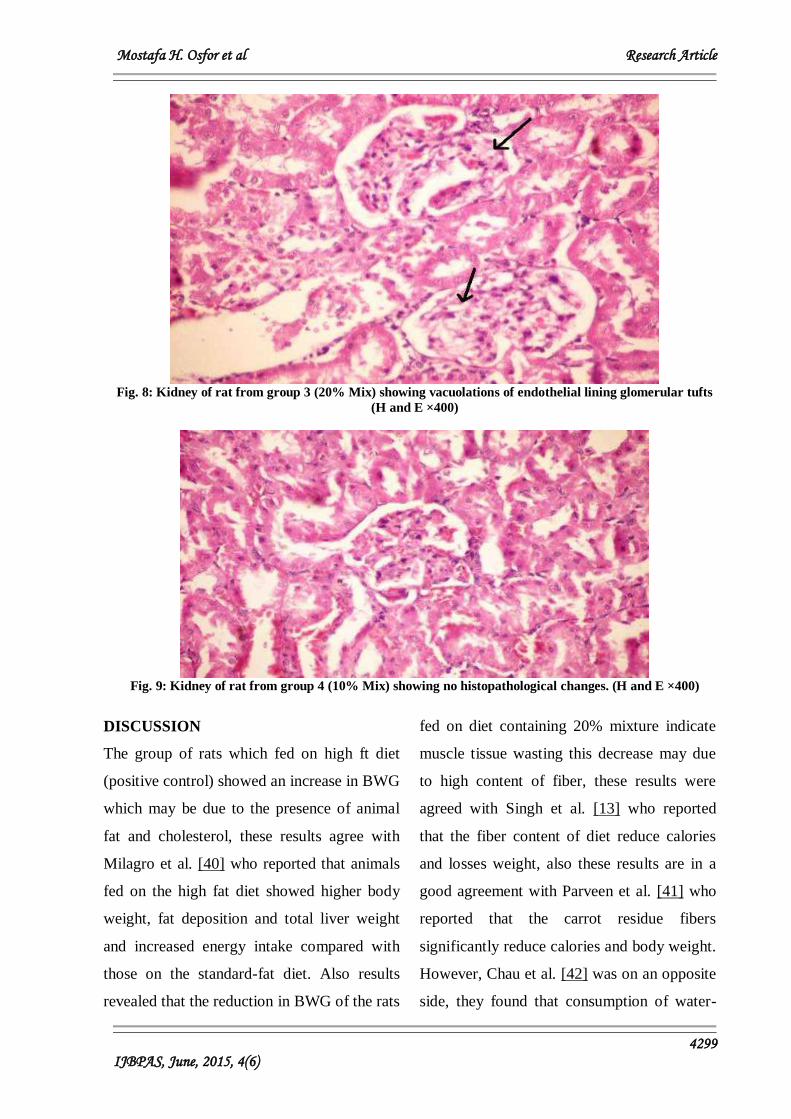
Fig. 8: Kidney of rat from group 3 (20% Mix) showing vacuolations of endothelial lining glomerular tufts
(H and E ×400)
Fig. 9: Kidney of rat from group 4 (10% Mix) showing no histopathological changes. (H and E ×400)
DISCUSSION
The group of rats which fed on high ft diet
(positive control) showed an increase in BWG
which may be due to the presence of animal
fat and cholesterol, these results agree with
Milagro et al. [40] who reported that animals
fed on the high fat diet showed higher body
weight, fat deposition and total liver weight
and increased energy intake compared with
those on the standard-fat diet. Also results
revealed that the reduction in BWG of the rats
fed on diet containing 20% mixture indicate
muscle tissue wasting this decrease may due
to high content of fiber, these results were
agreed with Singh et al. [13] who reported
that the fiber content of diet reduce calories
and losses weight, also these results are in a
good agreement with Parveen et al. [41] who
reported that the carrot residue fibers
significantly reduce calories and body weight.
However, Chau et al. [42] was on an opposite
side, they found that consumption of water-
Mostafa H. Osfor et al Research Article
4300
IJBPAS, June, 2015, 4(6)
insoluble fiber rich fraction didn't affect the
weights of hamsters. Also Nicolle et al., [43]
were on contrary line with our study who
found no significant changes on body weight
gain and food intake in the groups feed on
carrot diet with the control group.
Dietary factors such as continuous ingestion
of high amounts of saturated fats and
cholesterol are believed to be directly related
to hypercholesterolemia and susceptibility to
atherosclerosis. Lipid structure, composition,
configuration, in addition to excessive fat and
cholesterol consumption are also believed to
affect the lipid profile in the plasma (Asashina
et al., [44].
The intake of the designed formula in
different concentrations induced significant
improvement in the hypercholesterolemic
state, as shown by significant increase in
HDL-C concentration and significant
decrease in all other lipid parameters
compared to the positive control group.
Chau and Huang [17] found that the fibers
derived from orange albedo could
significantly decrease the levels of serum
triglyceride, serum total cholesterol, liver total
lipid, and liver cholesterol. And the
hypocholesterolemic action of these fibers is
due to its ability to enhance cholesterol and
bile acids excretion, and so, it could be a
potential cholesterol-lowering ingredient in
human diets. On the other hand, Chau et al.
[45] found that the inclusion of carrot pomace
fiber in diet effectively decreased the
concentrations of serum total cholesterol,
serum triacylglycerides and liver cholesterol,
and increased the concentrations of fecal total
lipid, fecal cholesterol, and fecal bile acids,
and showing pronounced hypolipidemic and
hypocholesterolemic effects. Carrot pomace
fibers having high cation-exchange capacity
could entrap, destabilize and disintegrate the
lipid emulsion, and thus reduce the diffusion
and absorption of lipid as well as cholesterol
[46].
The addition of mixture to the diet with 10,
20% concentrations lead to decrease in total
lipid, total cholesterol, triglycerides and LDL-
C but resulting increase of HDL-C. Our data
was in the same line with Nicolle et al. [43]
who found carrot consumption exerts a
moderate lowering cholesterol effect (12%
decreases). A significant 11% reduction of
cholesterol has been observed in human
subjects by Robertson et al. [47].
A study conducted by Hsu et al. [48], showed
that insoluble fiber-rich fractions (IFRF)
isolated from carrot pomace was found to
have very pronounced hypocholesterolemic
and hypolipidemic effects, these results
suggested that the hypolipidemic and
hypocholesterolemic actions of IFRF were
attributed to its ability to enhance the
excretion of cholesterol, lipid, and bile acids
via feces.
Mostafa H. Osfor et al Research Article
4301
IJBPAS, June, 2015, 4(6)
The improvement in blood picture data was
noticed especially in hemoglobin which
recorded a significant increase in 20%
mixture than control group also hematocrite
was in significant increase in 10%, 20%
mixture compared with positive control, this
increase in blood picture may due to the high
presence of iron. Gopalan et al. [49] found
that carrot is a good source of minerals like
Ca, P, Fe and Mg. On the other hand, the
intake of mixture which contains orange
albedo with different concentrations improved
the blood picture of rats. These results could
be contributed to the improvement in iron
absorption from rat's gut after consumption of
orange albedo due to its high content of
ascorbic acid [50].
AST and ALT levels act as indicators of liver
functions, hence, restoration of normal levels
of these enzymes indicates normal functions
of liver, the previous results indicated that the
rats fed on hypercholesterolemic diet showed
increased liver enzymes (AST, ALT and
Alkaline phosphatase). Morphological
alterations that occur in the liver affect many
metabolic processes in the organism. Peroxide
formation induced by hypercholesterolemia
[51] result in the release of some enzymes by
interacting with cellular structure and
function. Thus, the serum activities of cellular
enzymes such as transaminases, alkaline
phosphatase, and lactate dehydrogenase do
increase. With the increase in cellular
membrane permeability, intracellular fluid
transfers onto intercellular space, resulting in
muscle and liver cell degeneration.
Rats fed on 10 and 20% mixture
supplemented to hypercholesterolemic diet
showed improved liver functions. This effect
is mainly related to the presence of natural
soluble and insoluble dietary fiber, and
through increasing the plasma antioxidant
activity that have been reported to protect the
liver against oxidative stress in rats.
Flavonoids also attenuate lipopolysaccharide-
induced hepatotoxicity, possibly by
preventing the cytotoxic effects of oxidants as
nitrous oxide (NO) and oxygen-free radicals
[52].
The present study also revealed that the ALP
activity was increased when the liver
functions abnormally [53], thus the study of
liver ALP was done in the present study to
find out the effect of the dietary fiber in the
mixture on liver ALP. Results showed that
mixture with 10 and 20% had a lowering
effect on the activity of ALP in serum of
hypercholesterolemic rats compared to the
positive control, but this decrease was not
significant with the negative control group.
This effect is mainly related to the presence of
natural soluble and insoluble dietary fiber
[54].
he result of the present study also declared
that mixture especially at 20% level has a
significant improvement effect on the kidney
Mostafa H. Osfor et al Research Article
4302
IJBPAS, June, 2015, 4(6)
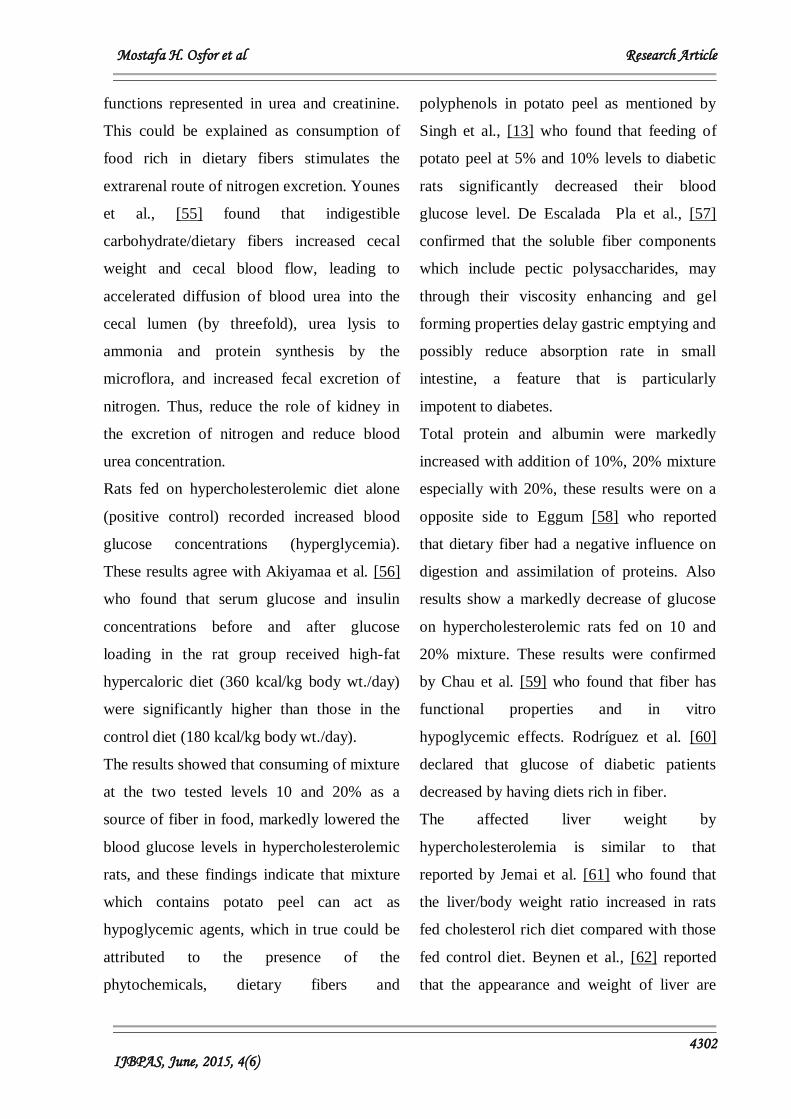
functions represented in urea and creatinine.
This could be explained as consumption of
food rich in dietary fibers stimulates the
extrarenal route of nitrogen excretion. Younes
et al., [55] found that indigestible
carbohydrate/dietary fibers increased cecal
weight and cecal blood flow, leading to
accelerated diffusion of blood urea into the
cecal lumen (by threefold), urea lysis to
ammonia and protein synthesis by the
microflora, and increased fecal excretion of
nitrogen. Thus, reduce the role of kidney in
the excretion of nitrogen and reduce blood
urea concentration.
Rats fed on hypercholesterolemic diet alone
(positive control) recorded increased blood
glucose concentrations (hyperglycemia).
These results agree with Akiyamaa et al. [56]
who found that serum glucose and insulin
concentrations before and after glucose
loading in the rat group received high-fat
hypercaloric diet (360 kcal/kg body wt./day)
were significantly higher than those in the
control diet (180 kcal/kg body wt./day).
The results showed that consuming of mixture
at the two tested levels 10 and 20% as a
source of fiber in food, markedly lowered the
blood glucose levels in hypercholesterolemic
rats, and these findings indicate that mixture
which contains potato peel can act as
hypoglycemic agents, which in true could be
attributed to the presence of the
phytochemicals, dietary fibers and
polyphenols in potato peel as mentioned by
Singh et al., [13] who found that feeding of
potato peel at 5% and 10% levels to diabetic
rats significantly decreased their blood
glucose level. De Escalada Pla et al., [57]
confirmed that the soluble fiber components
which include pectic polysaccharides, may
through their viscosity enhancing and gel
forming properties delay gastric emptying and
possibly reduce absorption rate in small
intestine, a feature that is particularly
impotent to diabetes.
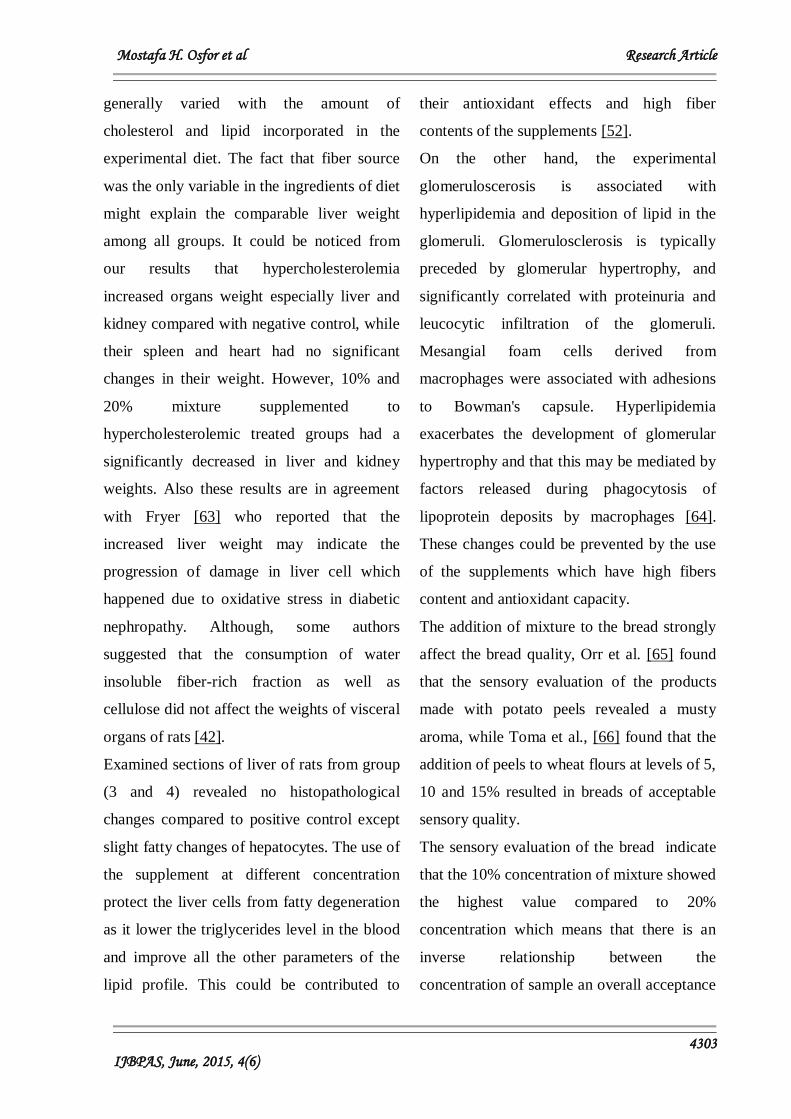
Total protein and albumin were markedly
increased with addition of 10%, 20% mixture
especially with 20%, these results were on a
opposite side to Eggum [58] who reported
that dietary fiber had a negative influence on
digestion and assimilation of proteins. Also
results show a markedly decrease of glucose
on hypercholesterolemic rats fed on 10 and
20% mixture. These results were confirmed
by Chau et al. [59] who found that fiber has
functional properties and in vitro
hypoglycemic effects. Rodríguez et al. [60]
declared that glucose of diabetic patients
decreased by having diets rich in fiber.
The affected liver weight by
hypercholesterolemia is similar to that
reported by Jemai et al. [61] who found that
the liver/body weight ratio increased in rats
fed cholesterol rich diet compared with those
fed control diet. Beynen et al., [62] reported
that the appearance and weight of liver are
Mostafa H. Osfor et al Research Article
4303
IJBPAS, June, 2015, 4(6)
generally varied with the amount of
cholesterol and lipid incorporated in the
experimental diet. The fact that fiber source
was the only variable in the ingredients of diet
might explain the comparable liver weight
among all groups. It could be noticed from
our results that hypercholesterolemia
increased organs weight especially liver and
kidney compared with negative control, while
their spleen and heart had no significant
changes in their weight. However, 10% and
20% mixture supplemented to
hypercholesterolemic treated groups had a
significantly decreased in liver and kidney
weights. Also these results are in agreement
with Fryer [63] who reported that the
increased liver weight may indicate the
progression of damage in liver cell which
happened due to oxidative stress in diabetic
nephropathy. Although, some authors
suggested that the consumption of water
insoluble fiber-rich fraction as well as
cellulose did not affect the weights of visceral
organs of rats [42].
Examined sections of liver of rats from group
(3 and 4) revealed no histopathological
changes compared to positive control except
slight fatty changes of hepatocytes. The use of
the supplement at different concentration
protect the liver cells from fatty degeneration
as it lower the triglycerides level in the blood
and improve all the other parameters of the
lipid profile. This could be contributed to
their antioxidant effects and high fiber
contents of the supplements [52].
On the other hand, the experimental
glomeruloscerosis is associated with
hyperlipidemia and deposition of lipid in the
glomeruli. Glomerulosclerosis is typically
preceded by glomerular hypertrophy, and
significantly correlated with proteinuria and
leucocytic infiltration of the glomeruli.
Mesangial foam cells derived from
macrophages were associated with adhesions
to Bowman's capsule. Hyperlipidemia
exacerbates the development of glomerular
hypertrophy and that this may be mediated by
factors released during phagocytosis of
lipoprotein deposits by macrophages [64].
These changes could be prevented by the use
of the supplements which have high fibers
content and antioxidant capacity.
The addition of mixture to the bread strongly
affect the bread quality, Orr et al. [65] found
that the sensory evaluation of the products
made with potato peels revealed a musty
aroma, while Toma et al., [66] found that the
addition of peels to wheat flours at levels of 5,
10 and 15% resulted in breads of acceptable
sensory quality.
The sensory evaluation of the bread indicate
that the 10% concentration of mixture showed
the highest value compared to 20%
concentration which means that there is an
inverse relationship between the
concentration of sample an overall acceptance
Mostafa H. Osfor et al Research Article
4304
IJBPAS, June, 2015, 4(6)
of Balady Bread. Angioloni and Collar [67]
stated that the dietary fibers with larger
particle size and high viscoelastic profile
resulted in highly sensory acceptable breads
with higher amount of resistant starch, lower
digestible starch bringing lower in vitro
expected glycemic Index, and slightly lower
protein digestibility.
CONCLUSION
The present study clearly refers to the
possibility of using some plant by-product to
develop new formulations of fiber-rich
functional foods such as bakery products as a
hypocholesterolemic agent and could be used
in obese people for body weight loss.
REFERENCES
[1] Zhang, J.; Liu, J.; Li, L. and Xia, E.
(2008): Dietary chitosan improves
hypercholesterolemia in rats fed high
fat diets. Nutr. Res., 28:383-390.
[2] Del Rio D, Costa LG, Lean MEJ,
Crozier A. Polyphenols and health:
what compounds are involved? Nutr
Metab Cardiovasc
Dis. 2009;20(1):1–6.
[3] Gonzalez-Aguilar GA, Ayala-Zavala
JF, De la Rosa LA, Alvarez-Parrilla
E. Phytochemical changes in the
postharvest and minimal processing
of fresh fruits and vegetables. In: De
la Rosa LA, Alvarez-Parrilla E,
Gonzalez-Aguilar GA, editors. Fruit
and vegetable phytochemicals:
Chemistry. Mexico: Nutritional
Value, and Stability; 2010. pp. 309–
11.
[4] Krzysik, M.; Grajeta, H.; Prescha, A.
and Weber, R. (2011): Effect of
cellulose, pectin and chromium (III)
on lipid and carbohydrate
metabolism in rats. Journal of Trace
Elements in Medicine and Biology,
25; 97–102.
[5] Zhang, N.; Huang, C. and Ou, S.
(2011): In vitro binding capacities of
three dietary fibers and their mixture
for four toxic elements, cholesterol,
and bile acid. Journal of Hazardous
Materials, 186:236-239.
[6] Sola, R.; Godàs, G. and Ribalta, J.
(2007): Effects of soluble fiber
(Plantago ovata husk) on plasma
lipid, lipoproteins, and
apolipoproteins in men with
ischemic heart disease. Am. J. Clin.
Nutr., 85:1157-63.
[7] Galisteo, M.; Mor َ n, R.; Rivera, L.;
Romero, R.; Anguera, A. and
Zarzuelo, A. (2010): Plantago ovata
husks-supplemented diet ameliorates
metabolic alterations in obese Zucker
rats through activation of AMP-
activated protein kinase.
Comparative study with other dietary
fibers. Clin. Nutr., 29(2):261-267.
Mostafa H. Osfor et al Research Article
4305
IJBPAS, June, 2015, 4(6)
[8] Callegaro, M.G.K.; Milbradt, B.G.;
Diettrich, T.; Alves, E.; Duarte, F.A.;
Flores, E.M.M.; Dressler, V.L.;
Silva, L.P. and Emanuelli, T. (2010):
Influence of cereal bran supplement
on cadmium effects in growing rats,
Human Exp. Toxicol., 29:467–476.
[9] Hu, G.H.; Huang, S.H.; Chen, H. and
Wang, F. (2010): Binding of four
heavy metals to hemicelluloses from
rice bran. Food Res. Int., 43: 203–
206.
[10] Viuda-Martos, M.; Lopez-Marcos,
M.C.; Fernandez-Lopez, M.J.;
Sendra, E.; Lopez- Vargas, J.H.
and Perez-Alvarez, J.A. (2010):
Role of fiber in cardiovascular
diseases: a review. Compr. Rev.
Food Sci. Food Safety, 9: 240-258.
[11] Kendall, C.W.; Esfahani, A. and
Jenkins, D.J.A. (2009): The link
between dietary fibre and human
health. Food Hydrocolloids, 24: 42–
48.
[12] Abd El-Ghany, M.A.; Ramadan,
M.A. and Hassanain, S.M.M.
(2011): Antioxidant activity of
some agro-industrial peels on liver
and kidney of rats exposed to
oxidative stress. World Journal of
Dairy & Food Sciences, 6(1):105-
114.
[13] Singh, N.; Kamath, V. and Rajini,
P.S. (2005): Protective effect of
potato peel powder in ameliorating
oxidative stress in streptozotocin
diabetic rats. Plant Foods for
Human Nutrition, 60(2):49-54.
[14] Singh, N. and Rajini, P.S. (2008):
Antioxidant-mediated protective
effect of potato peel extract in
erythrocytes against oxidative
damage. Chem. Biol. Interact.,
173(2):97-104.
[15] Chantaro, P.; Devahastin, S. and
Chiewchan, N. (2007): Production
of antioxidant high-dietary-fiber
powder from carrot peels. Food Sci.
Technol., 41:1987–94.
[16] Nawirska, A. and Ukl´anska, C.
(2008): Waste products from fruit
and vegetable processing as
potential sources for food
enrichment in dietary fibre. Acta.
Sci. Pol. Technol. Aliment., 7:35–
42.
[17] Chau, C.F. and Huang, Y.L. (2003):
Comparison of the chemical
composition and physicochemical
properties of different fibers
prepared from the peel of Citrus
sinensis L. Cv. Liucheng. Journal of
Agricultural and Food Chemistry,
51(9): 2615-2618.
Mostafa H. Osfor et al Research Article
4306
IJBPAS, June, 2015, 4(6)
[18] Pratt, S.G. and Matthews, K.
(2004): SuperFoods Rx: Fourteen
Foods That Will Change Your Life.
HarperCollins Publishers Inc., New
York. 336 p.
[19] Fukushima, M., Takayama, Y.,
Habaguchi, T. and Nakano, M.
(1997): Comparative
hypocholesterolemic effects of
capybara (Hydrochoerus
hydrochaeris dabbenei) oil, horse
oil and sardine oil in cholesterolfed
rats. Lipid, 32(4): 391-395.
[20] Knight, J.A., Anderson, S.J. and
Rawle, J.M. (1972): Chemical bases
of the sulfo-phosphovanillin
reaction for estimating serum total
lipid. Clin. Chem., 18(3): 199-202.
[21] Fossati, P. and Prencipe, L. (1982):
The determination of triglyceride
using enzymatic methods. Clin.
Chem., 28: 2077-2080.
[22] Allain, C.C., Poon, L.S., Chan,
C.S., Richmoud, W. and Fu, P.C.
(1974): Enzymatic determination of
total serum cholesterol. Clin.
Chem., 20(4): 470-475.
[23] Levy, A.L. (1981): A fully
enzymatic colourimetric
determination of LDL- cholesterol
in the serum. Clin. Chem., 27(5):
653-662.
[24] Burstein, M. (1970): A fully
enzymatic colorimetric
determination of HDL cholesterol in
the serum. Lipid Res., 11: 583-595.
[25] Lee, R. and Niemann, D. (1996):
Nutritional Assessment 2nd
ed
Mosby Missou USA.
[26] Reitman, S. and Frankel, S. (1957):
A colourimetric method for the
determination of serum glutamic
oxaloacetic and glutamic pyruvic
transaminases. Am. J. Clin. Path.,
28(56): 56-62.
[27] Rec, G. (1972): Optimised standard
colorimetric methods. J. Clin.
Chem. and Clin. Biochem.,10:
182.
[28] Patton, C. J. and Crouch, S. R.
(1977): Spectrophotmetric and
kinetics investigations of the
Berthelot reaction for the
determination of ammonia. Analyti.
Chem., 49: 464–469.
[29] Faulkner, N.R. and King, J.W.
(1976): Fundamental of clinical
chemistry (2nd
ed.) Tietz, Sannders
Philadelphia, 994-998.
[30] Trinder, P. (1969): Determination of
blood glucose using an oxidation
peroxidase system with a non
carsinogenic chromogene. Ann.
Clin. Biochem., 6: 24.
Mostafa H. Osfor et al Research Article
4307
IJBPAS, June, 2015, 4(6)
[31] Henry, R. J. (1976): Clinical
chemistry, Hoeber, New Yourk,
413.
[32] Doumas, B.T., Peters, T. Jr. (1997):
Serum and urine albumin: a
progress report on their
measurement and clinical
significance. Clin. Chem. Acta,
258(1): 3-20.
[33] International Committee for
Standardization in Haematology.
(1967): Recommendations for
haemoglobinometry in human
blood. Brit. J. Haemat., 13(4):71-75.
[34] Natt, M. P. and Herrick, C.A.
(1952): A new blood count diluent
for counting erythrocytes and
leukocytes of the chicken. Poult.
Sci., 31: 735–738.
[35] Campbell, T. W. (1995): Avian
hematology and cytology, 2nd
edition. Iowa State University Press,
Ames, Iowa, 3–19.
[36] Carleton, H.M. (1980): Carleton's
Histological Technique. 5th Edition,
Oxford University Press, USA. 520
p.
[37] Kulp, K.; Chung, H.; Martinez-
Anaya, M.A. and Doerry, W.
(1985): Fermentation of water
ferments and bread quality. Cereal
Chem., 62(1):55-59.
[38] Fisher, R.A. (1970): Statistical
method for research workers
Edinburgh ed. 14, Oliver and
Boyed, p. 140.
[39] Waller, R.A. and Duncan, D.B.
(1969): Aboys rule for symmetric
multiple comparison problem. An.
State Assoc. J., 65: 1485-1503.
[40] Milagro, F.I.; Campion, J. and
Martinez, J.A. (2006): Weight gain
induced by high-fat feeding
involves increased liver oxidative
stress. Obesity (Silver Spring),
14:1118-1123.
[41] Parveen, N.; Akhtar, M.S.; Abbas,
N. and Abid, A.R. (2000): Effects
of carrot residue fiber on body
weight gain and serum lipid
fractions. Int. J. Agri. Biol., 2: 125-
128.
[42] Chau, C.F.; Huang, Y.L. and Lin,
C.Y. (2004a): Investigation of the
cholesterol-lowering action of
insoluble fibre derived from the
peel of Citrus sinensis L. cv.
Liucheng. Food Chemistry, 87,
361–366.
[43] Nicolle, C., Cardinault, N.,
Aprikian, O., Busserolles, J.,
Grolier, P., Rock, E., Demigné, C.,
Mazur, A., Scalbert, A., Amouroux,
P. and Rémésy, C. (2003): Effect of
carrot intake on cholesterol
Mostafa H. Osfor et al Research Article
4308
IJBPAS, June, 2015, 4(6)
metabolism and on antioxidant
status in cholesterol-fed rat. Eur. J.
Nutr., 42(5): 254-61.
[44] Asashina, M.; Sato, M. and
Imaizumi, K. (2005): Genetic
analysis of diet induced
hypercholesterolemia in
exogenously hypercholesterolemic
(Ex HC) rats. J. Lipid. Res., 46:
2289-2294.
[45] Chau, C.F.; Chen, C.H. and Wang,
Y.T. (2004b): Effects of a novel
pomace fiber on lipid and
cholesterol metabolism in the
hamster. Nutrition Research 24:
337–345.
[46] Thibault, J.F. and Ralet, M.C.
(2001): Pectins: their origin,
structure and functions. In:
Advanced Dietary Fiber
Technology (Eds. Mccleary, B.V.
and Prosky, L.), Black well science,
Oxford, pp. 369-379.
[47] Robertson, J., Brydon, W.G.,
Tadesse, K., Wenham, P., Walls,
A., Eastwood, M.A. (1979): The
effect of raw carrot on serum lipid
and colon function. Am. J. Clin.
Nutr., 32: 1889–1892.
[48] Hsu, P.K.; Chien, P.J.; Chen, C.H.
and Chau, C.F. (2006): Carrot
insoluble fiber-rich fraction lowers
lipid and cholesterol absorption in
hamsters. LWT, 39, 337–342.
[49] Gopalan, C.; Sastri, B.V.R. and
Balasubramanian, S.C. (1991):
Nutritive Value of Indian Foods.
National Institute of Nutrition (I. C.
M. R.), New Delhi, India. 156 p.
[50] Shah, M.; Griffin, I.J.; Lifschitz,
C.H. and Abrams, S.A. (2003):
Effect of orange and apple juices on
iron absorption in children. Arch.
Pediatr. Adolesc. Med.,
157(12):1232-15236.
[51] Sudhahar, V.; Kumar, S.A.;
Sudharsan, P.T. and Varalakshmi,
P. (2007): Protective effect of
lupeol and its ester on cardiac
abnormalities in experimental
hypercholesterolemia. Vascul.
Pharmacol., 46, 412-418.
[52] Ali, S.; Prasad, R.; Naime, M.;
Zafar, H. and Mahmood, A. (2011):
Dried peel fraction of Citrus
sinensis partially reverses
pathological changes in rat model of
liver cirrhosis. Mediterr. J. Nutr.
Metab., 4:57-67.
[53] Rashad, M.M. and Moharib, S.A.
(2008): Studies of the effect of
some plant leaf fibers on the key
liver enzymes intermediate
carbohydrate and lipid metabolism
Mostafa H. Osfor et al Research Article
4309
IJBPAS, June, 2015, 4(6)
in rats. Advance in Food Sci., 1: 1-
8.
[54] Rashad, M.M. and Moharib, S.A.
(2003): Effect of type and level of
dietary fiber supplements in rats.
Grasas y Aceites, 54: 277-284.
[55] Younes, H.; Garleb, K.A; Behr,
S.R; Demigne, C. and Remesy, C.
(1998): Dietary fiber stimulates the
extrarenal route of nitrogen
excretion in partially
nephrectomized rats. J. Nutr.
Biochem., 9:613-620.
[56] Akiyamaa, T.; Tachibanaa, I.;
Shiroharaa, H.; Watanabea, N. and
Otsuki, M. (1996): High-fat
hypercaloric diet induces obesity,
glucose intolerance and
hyperlipidemia in normal adult male
Wistar rat. Diabetes Res. Clin.
Pract., 31(1-3):27-35.
[57] De Escalada Pla, M.F.; Ponce,
N.M.; Stortz, C.A.; Gerschenson,
L.N. and Rojas, A.M. (2007):
Composition and functional
properties of enriched fiber products
obtained from pumpkin (Cucurbita
moschata Duchesne ex Poiret).
Lebensmittel-Wissenschaft &
Technologie, 40(7):1176-1185.
[58] Eggum, B. O. (1992): The influence
of dietary fiber on protein digestion
and utilisation. In Dietary Fibre – A
Component of Food. Nutritional
Function in Health and Disease, pp.
153-165 [T. F. Schweizer and C. A.
Edwards, editors], London :
Springer-Verlag.
[59] Chau, C.F.; Chen, C.H. and Lee,
M.H. (2004c): Comparison of the
characteristics, functional
properties, and in vitro
hypoglycemic effects of various
carrot insoluble fiber-rich fractions.
Lebensmittel-Wissenschaft und-
Technologie, 37, 155–160.
[60] Rodríguez, R., Jiménez, A.,
Fernández-Bolaños, J., Guillén, R.,
and Heredia, A. (2006): Dietary
fiber from vegetable products as
source of functional ingredients.
Trends in Food Science and
Technology, 17: 3-15.
[61] Jemai, H.; Bouaziz, M.; Fki, I.; El
Feki, A. and Sayadi, S. (2008):
Hypolipidimic and antioxidant
activities of oleuropein and its
hydrolysis derivative-rich extracts
from Chemlali olive leaves.
Chemicobiological Interactions,
176(2-3):88-98.
[62] Beynen, A.C.; West, C.E.; Van
Zutphen, L.F.M. and Katan, M.B.
(1986): Relation between the
responses of serum cholesterol to
dietary cholesterol and to the type
Mostafa H. Osfor et al Research Article
4310
IJBPAS, June, 2015, 4(6)
of fat in random-bred rabbits.
Nutrition Reports International, 33,
71-78.
[63] Fryer, J.P. (2001): The role of
intestinal transplantation in the
management of intestinal failure.
Curr. Gastroenterol Rep., 3(4):334-
42.
[64] Rayner, H.C.; Ward, L. and Walls,
J. (1991): Cholesterol feeding
following unilateral nephrectomy in
the rat leads to glomerular
hypertrophy. Nephron, 57(4):453-
459.
[65] Angioloni, A. and Collar, C. (2011):
Physicochemical and nutritional
properties of reduced-caloric
density high-fiber breads. Food
Science and Technology, 44, 747-
758.