Embed Size (px)
Citation preview
Second International Symposium on Marine Propulsors smp’11, Hamburg, Germany, June 2011
Investigation of the Flow Field around a Propeller-Rudder Configuration: On-Surface Pressure Measurements and Velocity-
Pressure-Phase-Locked Correlations
Mario Felli, Massimo Falchi, Francisco Pereira
CNR-INSEAN, Rome, Italy
ABSTRACT
The present paper deals with the problem of the propeller-
induced perturbation on the rudder. The study aims at
providing insights on the key mechanisms governing the
complex interaction between the propeller wake structures
and the rudder. In this regard, a wide experimental
activity that concerned PIV and LDV velocity
measurements and wall-pressure-measurements on the
two faces of the rudder was performed in a cavitation
tunnel. The major flow features that distinguish the flow
field around a rudder operating in the race of a propeller
were highlighted, such as the complex dynamics of the
propeller tip vortices and the re-storing mechanism of the
tip vortex downstream of the rudder. Wall-pressure
signals were Fourier decomposed and then reconstructed,
isolating the contributions of the more energetic
harmonics when both the propeller phase and the rudder
deflection change.
Keywords
Propeller, rudder, wall pressure, tip vortex
1 INTRODUCTION
The present trend to increase the ship speed and the
propeller thrust has consequently made the problem of the
mutual-interaction between the propeller and the rudder
(or between the propeller and the strut in a pulling type
podded propulsor) particularly critical because it is
correlated directly to the hydroacoustic, structural and
propulsive performance of the ship. In particular, the
propeller-rudder interaction is a significant noise source
that affects the acoustic signature of surface ship and the
on-board comfort as the consequence of the impact and
the deformation of the propeller vortex filaments, the
unsteady and non-uniform inflow on the rudder and the
propeller induced cavitation, mainly (Felli et al 2008).
In this scenario, the efforts towards the improvement of
the ship performance requires the development of
advanced numerical and experimental tools to be used for
both new design approaches (as in the case of the twisted
rudder (Shen et al 1997)), as well as to get a better insight
into the complex mechanism of interaction with the
propeller vortical structures (Felli et al 2009).
However, such an accurate analysis is a challenging task
when the influence of the propeller is important and
requires advanced numerical and experimental tools to
resolve the complex flow around the rudder with the
adequate accuracy.
On the experimental side, the problem of the propeller-
rudder interaction has been widely addressed by the
literature. However, most of the emphasis has been placed
towards global performance (i.e., propeller and rudder
loads) and cavitation measurements, as in Molland and
Turnock (1992), Kracht (1992), Shen et al (1997), and
Paik et al (2008), for example.
On the other hand, a few works have instead been dealing
with the measure of the flow field distribution around a
rudder, e.g., Felli et al (2004, 2006, 2008, 2010), Anschau
& Mach (2009), and Lucke (2009).
Among these studies, the works by Felli et al (2004, 2006,
2009 and 2009a) have investigated the problem of the
propeller-rudder interaction with a focus on the tip
vortex/rudder interaction. These studies, performed by
phase locked velocimetry measurements (i.e., LDV and
PIV) and time resolved visualizations, explored different
configurations of a propeller-rudder system (i.e., rudder
aligned with the propeller shaft and at an offset, propeller-
rudder in uniform and non-uniform inflow conditions),
and has allowed highlighting some distinguishing
phenomena of the tip vortex/rudder interaction as, for
instance, a mechanism of breakdown of the tip vortex
filaments and their recovering downstream of the rudder.
Following these works, the present paper focuses on the
analysis of the interaction mechanisms between the
propeller wake and the rudder, and, specifically,
documents the effect of the propeller phase, the rudder
deflection and the propeller inflow on the pressure field
along the rudder surface. For this purpose, a special steel-
rudder was manufactured to allow the detailed mapping
of the pressure field along the rudder surface.
Analysis tools of the pressure data were implemented to
go into the mechanisms of noise generation and to
identify and characterize the perturbation sources in a
propeller-rudder configuration.
In §2 and §3, we deal with the description of the
experimental set up, the test matrix and the test
conditions. The analysis of the results is documented in
§4. In §4.1, we describe the flow field evolution around
the rudder. The distribution of the pressure field on the
rudder surface is reported in §4.2. Conclusions and future
works are summarized in §5.
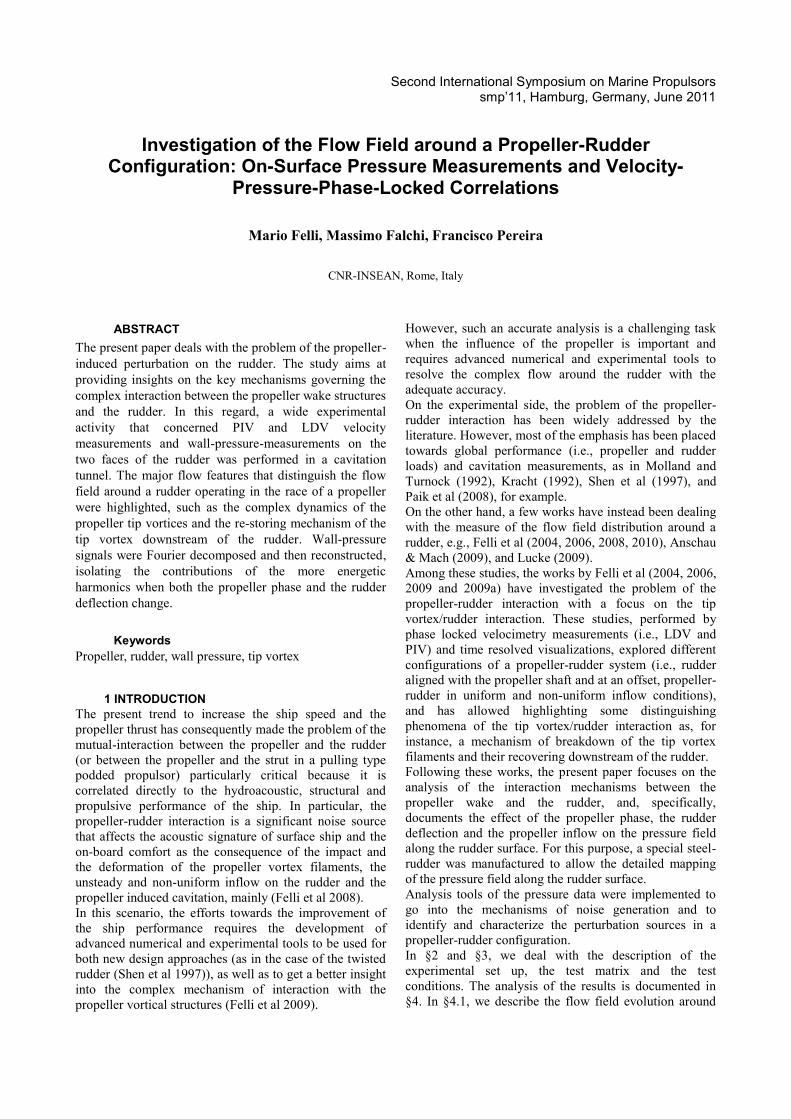
Figure 1: Propeller-rudder installation inside the tunnel.
Figure 2: Propeller-rudder configuration.
2 EXPERIMENTAL SET UP
2.1 Facility and propeller-rudder configuration
Measurements were conducted in the Italian Navy
Cavitation Tunnel (C.E.I.M.M.). This is a close jet tunnel
with a 2.6 m long by 0.6 m span by 0.6 m deep test
section. Perspex windows on the four walls enable the
optical access in the test section. The nozzle contraction
ratio is 5.96:1 and the maximum water speed is 12 m/s.
The highest free stream turbulence intensity in the test
section is 2%. In the test section, the mean velocity
uniformity is within 1% for the axial component and 3%
for the vertical component.
The propeller-rudder arrangement was thought to
simulate the typical configuration of a single-screw ship
model. Therefore, the rudder was fixed with the plane of
symmetry passing through the prolongation of the
propeller axis and with the leading edge at about r=R
from the propeller disk plane. A sketch of the
experimental configuration is given in Figures 1 and 2.
Rudder geometry was simulated using an all-movable-
2D-wing having a rectangular planform and standard
symmetrical sections with NACA 0020 profiles. Major
features of the rudder are documented in Table 1.
The model propeller was the INSEAN E779A. This
propeller, object of a dataset collecting hydrodynamics
and hydroacoustics measurements (Cenedese et al 1985,
Stella et al 2000, Di Felice et al 2004, Pereira et al 2004,
Felli et al 2009), is a four-bladed Wageningen modified
type model with a diameter of D=227.3mm and a uniform
pitch distribution. More detailed information on the
E779A propeller is available in the aforementioned
literature.
Table 1: Geometrical data of the rudder.
Rudder length 600 mm
Rudder chord 180 mm
Rudder profiles NACA 0020
Rudder yaw axis dist. from LE 0
Rudder distance from propeller 113.5 mm
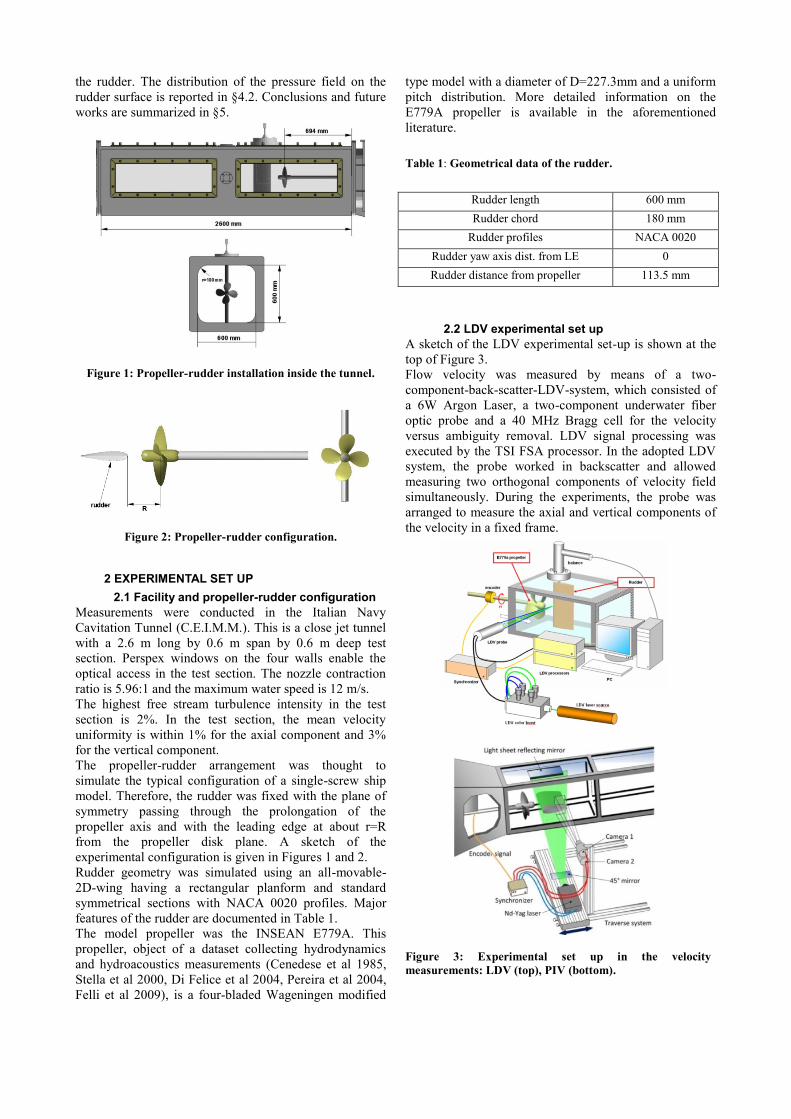
2.2 LDV experimental set up
A sketch of the LDV experimental set-up is shown at the
top of Figure 3.
Flow velocity was measured by means of a two-
component-back-scatter-LDV-system, which consisted of
a 6W Argon Laser, a two-component underwater fiber
optic probe and a 40 MHz Bragg cell for the velocity
versus ambiguity removal. LDV signal processing was
executed by the TSI FSA processor. In the adopted LDV
system, the probe worked in backscatter and allowed
measuring two orthogonal components of velocity field
simultaneously. During the experiments, the probe was
arranged to measure the axial and vertical components of
the velocity in a fixed frame.
Figure 3: Experimental set up in the velocity
measurements: LDV (top), PIV (bottom).
The three-dimensional velocity survey was performed in
two separate steps rotating the experiment of 90°, similar
to the experiment of Felli et al (2009). More specifically,
two configurations with the rudder fixed on the top and
side window of the test section were used to resolve the
U-W and the U-V velocity components respectively.
Phase sampling techniques, i.e., Tracking Triggering
Technique (TTT) (Stella et al 2000), were used to
correlate the randomly acquired velocity bursts to the
corresponding position of the propeller. Phase sampling
of the velocity signal was carried out by a rotary 7200
pulse/revolution encoder and a synchronizer; the latter
provides the digital signal of the propeller position to the
TSI RMR (Rotating Machine Resolver).
The underwater probe was set up on a computer-
controlled-traverse which allowed getting a displacement
accuracy of 0.1mm in all the directions and to achieve a
high automation of the LDV system.
Particular care was required during the initial location of
the measurement volume to reduce positioning errors of
the two optical configurations. This was carried out by
aligning the measurement volume on a special target with
known position as to the propeller disc center.
The tunnel water was seeded with 1-m Titanium dioxide
(TiO2) particles in order to improve the Doppler signal
processor data rate.
2.3 PIV experimental set up
A sketch of the PIV experimental set up is reported at
bottom of Figure 3. Rudder was mounted on the side-
window of the facility, parallel to the optical axis of two
CCD cameras (i.e., PCO Sensicam 1028 x 1280 px2). This
arrangement, with the two cameras mounted one upside
the other, allowed the simultaneous imaging of the upper
and lower side regions of the rudder. In this regard, the
laser beam was aligned parallel to the rudder span and,
then, 90-degree-rotated by a 45 deg mirror. This allowed
lighting the rudder along a chordwise cross-section.
A second mirror reflecting the light sheet was placed on
the top-window of the facility in order to compensate the
lack of light in the regions at the leading and trailing
edges of the rudder, where the curvature is such to locally
block the laser sheet passage. Further details on this
aspect are documented in Felli et al (2009a).
The PIV acquisition was conditioned upon the passage of
the propeller reference blade for a selected angular
position. This was carried out synchronizing the PIV
acquisition to a TTL OPR (i.e., Once Per Revolution)
signal, supplied by a signal processor fed by a 3600
pulse/sec rotary incremental encoder, mounted on the
propeller dynamometer. Once triggered, the PIV
synchronizer supplies a TTL signal to the two cross-
correlation cameras and to a double-cavity Nd-Yag laser
(200 mJ per pulse at 12.5 Hz) according to the timing
diagram (150sec time between pulses).
The statistical analysis was performed on a population of
500 images/phase, acquired at each propeller phase in the
range 0°85° with the step of 5°.
Instantaneous velocity fields were acquired from a
distance of 500 mm from the facility side window, using a
50 mm lens with 2.8 f-number and imaging an area of
about 160 by 130 mm2.
The flow field evolution was reconstructed re-assembling
six different patches (i.e., three per camera), by which the
whole investigation area was scanned. In this regard, the
PIV system was mounted on a traverse system in order to
image the different patches with the adequate precision.
This operation was executed with an accuracy of 0.1 mm
in order to minimize any misalignment during patch
reassembling. In addition, patches were partially
overlapped in order to compensate any minimal camera
misalignment during the final reconstruction of the flow
field evolution.
Facility water was seeded with 30-40 μm silver coated
hollow glass spherical particles with high diffraction
index and density of about 1.1 g/cm3.
Image analysis was performed combining the discrete
offset technique (Di Florio et al 2002) and the iterative
image deformation method (Scarano & Riethmuller 2000,
Scarano 2002). Prior to the analysis, the images were pre-
processed subtracting the mean grey image obtained over
the whole image population for a given patch and phase
angle. The adopted processing set-up was composed by a
3-step discrete offset method with a final window size of
32x28 px2 (i.e., interrogation windows stretched slightly
in the streamwise direction) and a grid spacing between
the vectors of 10 pixels (i.e., 66% overlap). The image
deformation was then performed through 4 iterations with
a local Gaussian weighting filter applied to the predictor
field and a Gaussian sub-pixel interpolation fit.
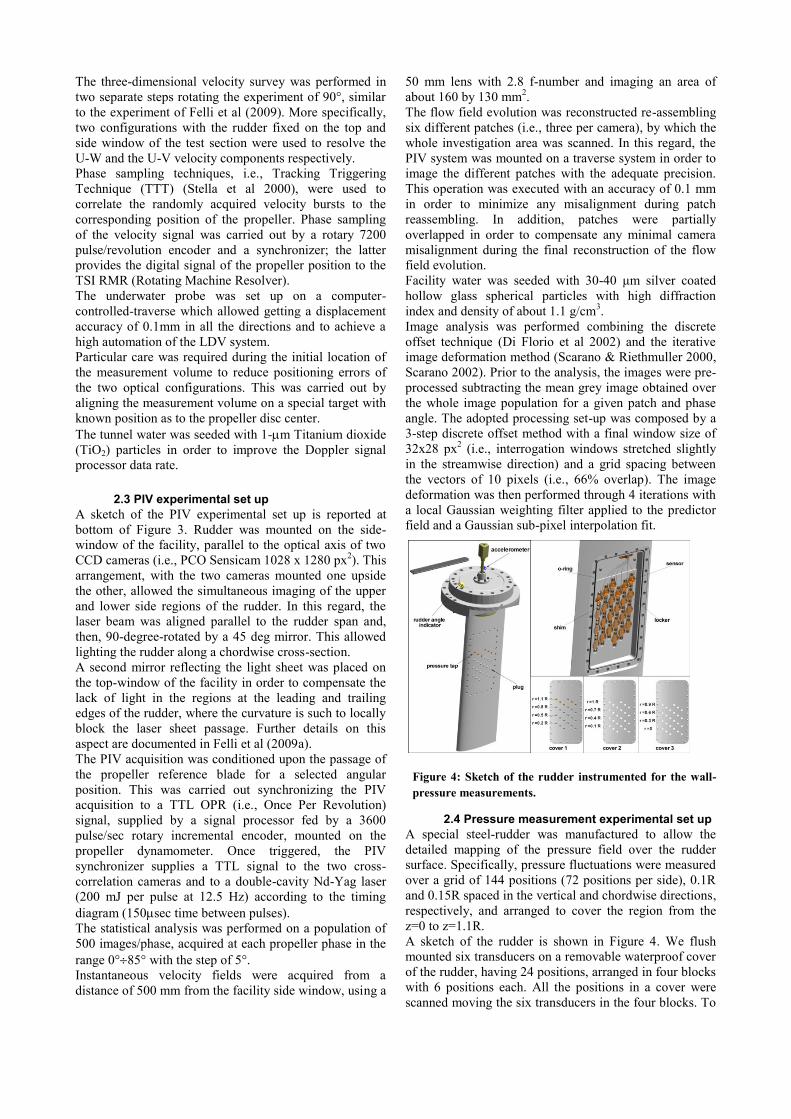
Figure 4: Sketch of the rudder instrumented for the wall-
pressure measurements.
2.4 Pressure measurement experimental set up
A special steel-rudder was manufactured to allow the
detailed mapping of the pressure field over the rudder
surface. Specifically, pressure fluctuations were measured
over a grid of 144 positions (72 positions per side), 0.1R
and 0.15R spaced in the vertical and chordwise directions,
respectively, and arranged to cover the region from the
z=0 to z=1.1R.
A sketch of the rudder is shown in Figure 4. We flush
mounted six transducers on a removable waterproof cover
of the rudder, having 24 positions, arranged in four blocks
with 6 positions each. All the positions in a cover were
scanned moving the six transducers in the four blocks. To
improve the spatial resolution of the pressure mapping,
three different series of covers were mounted on each side
of the rudder. The three series had the same grid, 0.1R
and 0.2R shifted each other in the vertical direction. The
resulting arrangement is documented in Figure 4.
Pressure transducers were ENTRAN EPN D11 relative
sensor models (i.e., 25 psi full range, 15 kHz resonant
frequency, 14 mV/psi sensitivity)
Signals were acquired by a Prosig P8200 acquisition
system, setting the sampling rate at 40 kHz and the
acquisition time at 100 sec. Simultaneously, a once-per-
revolution TTL trigger signal was acquired to synchronize
the pressure signals with the angular position of the
propeller reference blade. Specifically, the
synchronization was carried out during the data
processing on the base of the pressure signal and the
propeller TTL time histories.
Then, pressure signals were phase averaged, using a
slotting technique with 360 angular intervals in which
pressure samples were arranged depending on the phase
delay from the last trigger signal (Felli et al 2006).
3 TEST MATRIX AND CONDITIONS
Tests were carried at the free-stream velocity of U=5 m/s
and the propeller revolution speed of n=25 rps, at which
corresponds the advance ratio J of 0.88. Based on the
rudder chord and the free-stream velocity, the nominal
Reynolds number was around Re=1.36∙106. It is worth
pointing out that velocities induced by the propeller give
an effective Reynolds of 1.63∙106.
At the testing conditions, thrust and torque coefficients on
the propeller are Kt=0.157 and kq=0.0359. These values
correspond to those measured without the rudder, whose
influence can be considered negligible; actually, at least
for the present configuration (propeller-rudder distance
x=R and rudder deflection α=0 deg).
The test matrix concerned the following activities:
- PIV measurements along 3 horizontal-chordwise
and 14 vertical-chordwise sections of the wake.
- LDV measurements along 2 transversal sections
of the wake just in front and behind the rudder,
each having a grid of about 700 points.
- LDV measurements all along the rudder surface,
Grid with 1200 positions, thickened in the tip
vortex region.
- Pressure measurements all along the rudder
surfaces. Grid with 144 positions (72 positions
per side).
For the sake of conciseness, just some representative
positions are reported hereinafter.
4 RESULT ANALYSIS
4.1 Flow field evolution
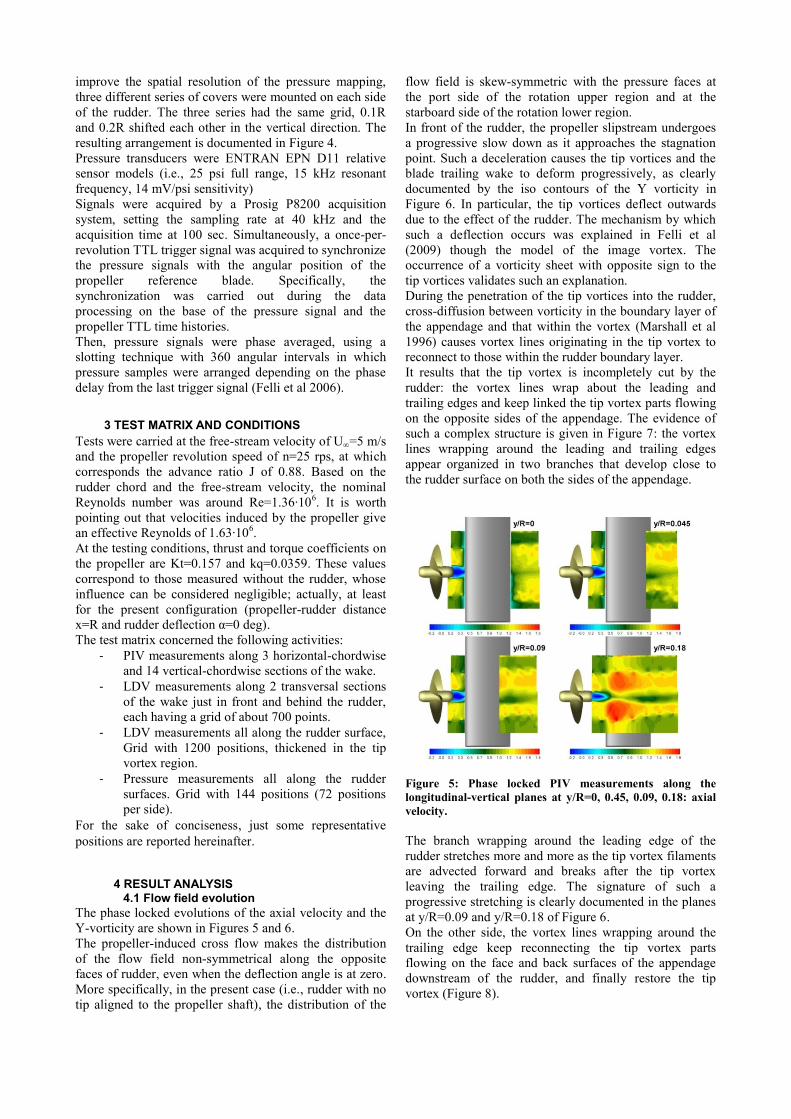
The phase locked evolutions of the axial velocity and the
Y-vorticity are shown in Figures 5 and 6.
The propeller-induced cross flow makes the distribution
of the flow field non-symmetrical along the opposite
faces of rudder, even when the deflection angle is at zero.
More specifically, in the present case (i.e., rudder with no
tip aligned to the propeller shaft), the distribution of the
flow field is skew-symmetric with the pressure faces at
the port side of the rotation upper region and at the
starboard side of the rotation lower region.
In front of the rudder, the propeller slipstream undergoes
a progressive slow down as it approaches the stagnation
point. Such a deceleration causes the tip vortices and the
blade trailing wake to deform progressively, as clearly
documented by the iso contours of the Y vorticity in
Figure 6. In particular, the tip vortices deflect outwards
due to the effect of the rudder. The mechanism by which
such a deflection occurs was explained in Felli et al
(2009) though the model of the image vortex. The
occurrence of a vorticity sheet with opposite sign to the
tip vortices validates such an explanation.
During the penetration of the tip vortices into the rudder,
cross-diffusion between vorticity in the boundary layer of
the appendage and that within the vortex (Marshall et al
1996) causes vortex lines originating in the tip vortex to
reconnect to those within the rudder boundary layer.
It results that the tip vortex is incompletely cut by the
rudder: the vortex lines wrap about the leading and
trailing edges and keep linked the tip vortex parts flowing
on the opposite sides of the appendage. The evidence of
such a complex structure is given in Figure 7: the vortex
lines wrapping around the leading and trailing edges
appear organized in two branches that develop close to
the rudder surface on both the sides of the appendage.
Figure 5: Phase locked PIV measurements along the
longitudinal-vertical planes at y/R=0, 0.45, 0.09, 0.18: axial
velocity.
The branch wrapping around the leading edge of the
rudder stretches more and more as the tip vortex filaments
are advected forward and breaks after the tip vortex
leaving the trailing edge. The signature of such a
progressive stretching is clearly documented in the planes
at y/R=0.09 and y/R=0.18 of Figure 6.
On the other side, the vortex lines wrapping around the
trailing edge keep reconnecting the tip vortex parts
flowing on the face and back surfaces of the appendage
downstream of the rudder, and finally restore the tip
vortex (Figure 8).
The interaction with the rudder causes a spanwise
displacement of the tip vortices that increases more and
more chordwise. The rate of such a spanwise
displacement is particularly marked for the filaments
moving along the suction sides of the rudder. Instead, on
the pressure side, the traces of the tip vortex describe a
nearly horizontal trajectory.
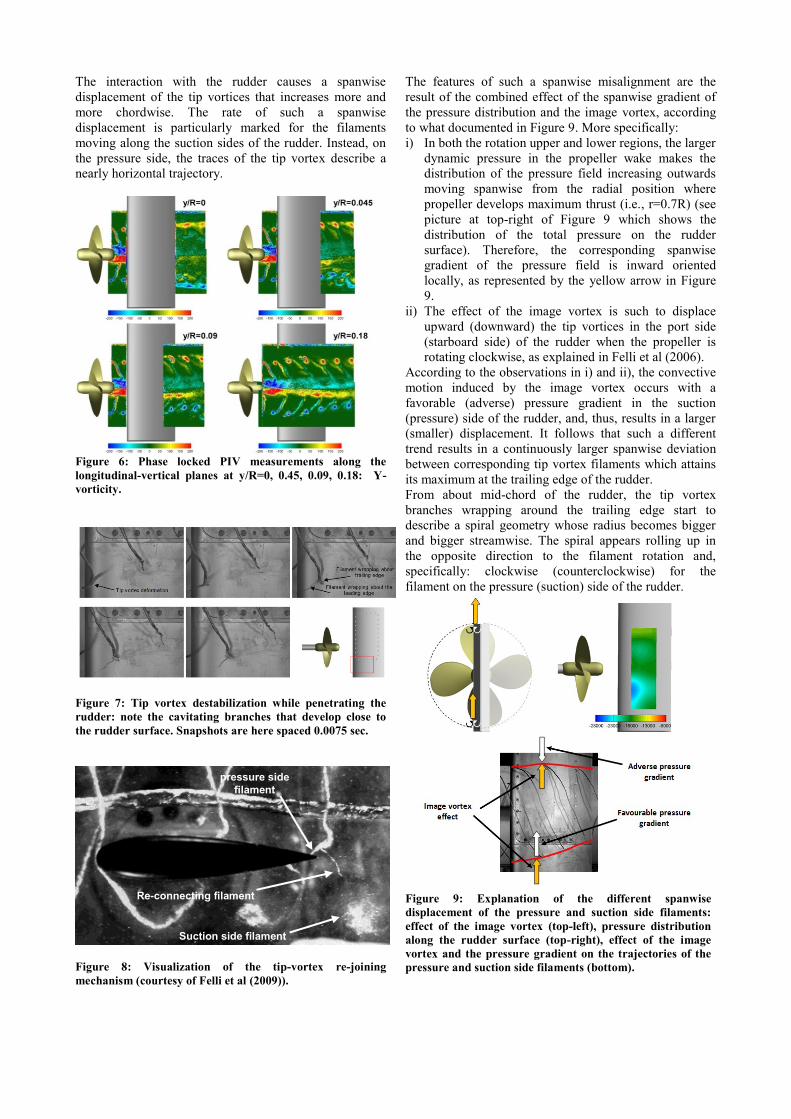
Figure 6: Phase locked PIV measurements along the
longitudinal-vertical planes at y/R=0, 0.45, 0.09, 0.18: Y-
vorticity.
Figure 7: Tip vortex destabilization while penetrating the
rudder: note the cavitating branches that develop close to
the rudder surface. Snapshots are here spaced 0.0075 sec.
Figure 8: Visualization of the tip-vortex re-joining
mechanism (courtesy of Felli et al (2009)).
The features of such a spanwise misalignment are the
result of the combined effect of the spanwise gradient of
the pressure distribution and the image vortex, according
to what documented in Figure 9. More specifically:
i) In both the rotation upper and lower regions, the larger
dynamic pressure in the propeller wake makes the
distribution of the pressure field increasing outwards
moving spanwise from the radial position where
propeller develops maximum thrust (i.e., r=0.7R) (see
picture at top-right of Figure 9 which shows the
distribution of the total pressure on the rudder
surface). Therefore, the corresponding spanwise
gradient of the pressure field is inward oriented
locally, as represented by the yellow arrow in Figure
9.
ii) The effect of the image vortex is such to displace
upward (downward) the tip vortices in the port side
(starboard side) of the rudder when the propeller is
rotating clockwise, as explained in Felli et al (2006).
According to the observations in i) and ii), the convective
motion induced by the image vortex occurs with a
favorable (adverse) pressure gradient in the suction
(pressure) side of the rudder, and, thus, results in a larger
(smaller) displacement. It follows that such a different
trend results in a continuously larger spanwise deviation
between corresponding tip vortex filaments which attains
its maximum at the trailing edge of the rudder.
From about mid-chord of the rudder, the tip vortex
branches wrapping around the trailing edge start to
describe a spiral geometry whose radius becomes bigger
and bigger streamwise. The spiral appears rolling up in
the opposite direction to the filament rotation and,
specifically: clockwise (counterclockwise) for the
filament on the pressure (suction) side of the rudder.
Figure 9: Explanation of the different spanwise
displacement of the pressure and suction side filaments:
effect of the image vortex (top-left), pressure distribution
along the rudder surface (top-right), effect of the image
vortex and the pressure gradient on the trajectories of the
pressure and suction side filaments (bottom).
Suction side filament
Re-connecting filament
pressure side
filament
The signature of the aforesaid roll up is also captured in
the contour plots of the Y-vorticity, as clearly
documented in the planes at y/R=0.09 and y/R=0.18 of
Figure 6. Here, the spiraling geometry of the vortex
filament is resolved as a vorticity core (clockwise rotating
in the pressure side) surrounded by a counter-rotating
vorticity sheet which suddenly appear at about the mid-
chord region of the rudder: the former is induced by the
roll up of the spiral, the latter concerns the vorticity of the
vortex filament.
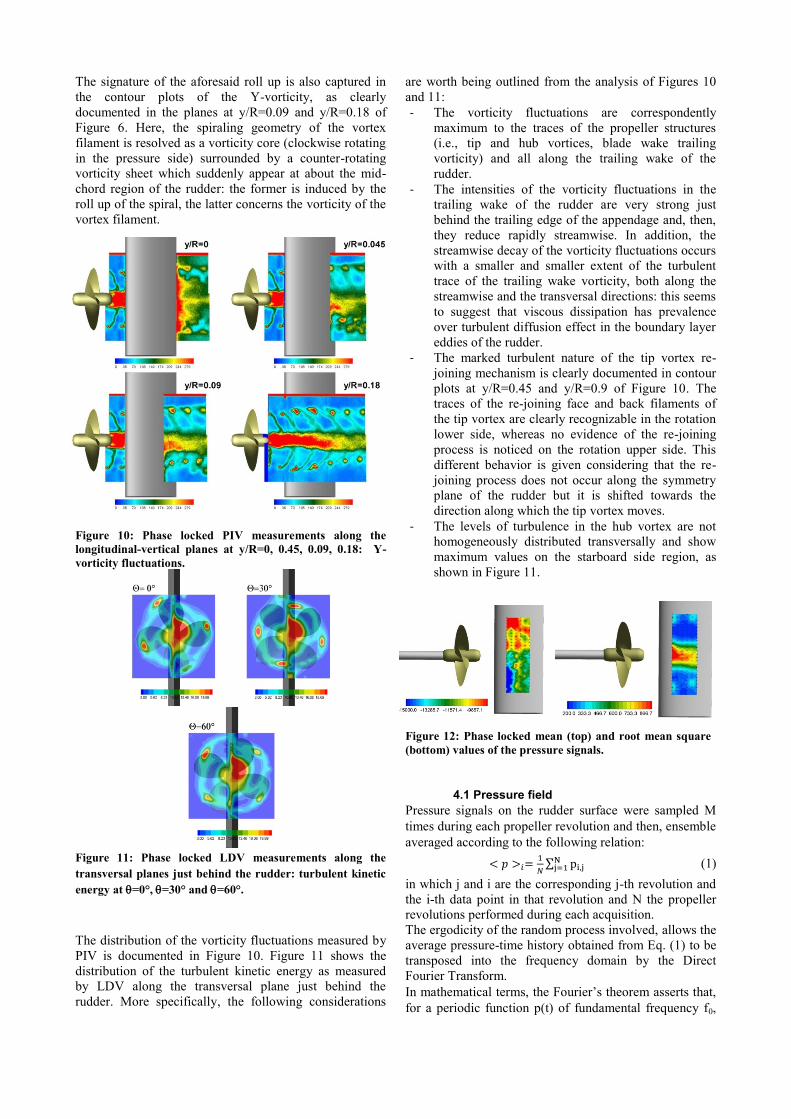
Figure 10: Phase locked PIV measurements along the
longitudinal-vertical planes at y/R=0, 0.45, 0.09, 0.18: Y-
vorticity fluctuations.
Figure 11: Phase locked LDV measurements along the
transversal planes just behind the rudder: turbulent kinetic
energy at =0°, =30° and =60°.
The distribution of the vorticity fluctuations measured by
PIV is documented in Figure 10. Figure 11 shows the
distribution of the turbulent kinetic energy as measured
by LDV along the transversal plane just behind the
rudder. More specifically, the following considerations
are worth being outlined from the analysis of Figures 10
and 11:
- The vorticity fluctuations are correspondently
maximum to the traces of the propeller structures
(i.e., tip and hub vortices, blade wake trailing
vorticity) and all along the trailing wake of the
rudder.
- The intensities of the vorticity fluctuations in the
trailing wake of the rudder are very strong just
behind the trailing edge of the appendage and, then,
they reduce rapidly streamwise. In addition, the
streamwise decay of the vorticity fluctuations occurs
with a smaller and smaller extent of the turbulent
trace of the trailing wake vorticity, both along the
streamwise and the transversal directions: this seems
to suggest that viscous dissipation has prevalence
over turbulent diffusion effect in the boundary layer
eddies of the rudder.
- The marked turbulent nature of the tip vortex re-
joining mechanism is clearly documented in contour
plots at y/R=0.45 and y/R=0.9 of Figure 10. The
traces of the re-joining face and back filaments of
the tip vortex are clearly recognizable in the rotation
lower side, whereas no evidence of the re-joining
process is noticed on the rotation upper side. This
different behavior is given considering that the re-
joining process does not occur along the symmetry
plane of the rudder but it is shifted towards the
direction along which the tip vortex moves.
- The levels of turbulence in the hub vortex are not
homogeneously distributed transversally and show
maximum values on the starboard side region, as
shown in Figure 11.
Figure 12: Phase locked mean (top) and root mean square
(bottom) values of the pressure signals.
4.1 Pressure field
Pressure signals on the rudder surface were sampled M
times during each propeller revolution and then, ensemble
averaged according to the following relation:
∑ (1)
in which j and i are the corresponding j-th revolution and
the i-th data point in that revolution and N the propeller
revolutions performed during each acquisition.
The ergodicity of the random process involved, allows the
average pressure-time history obtained from Eq. (1) to be
transposed into the frequency domain by the Direct
Fourier Transform.
In mathematical terms, the Fourier‟s theorem asserts that,
for a periodic function p(t) of fundamental frequency f0,
one can write p as the sum of basic trigonometric
functions such that:
( ) ∑ ( ) (2)
in which An and n represent the amplitude and phase of
the corresponding harmonic function.
Equation (2) can be rearranged into:
( ) ∑ ( ) ∑
( ) (3)
The determination of An and n in (1) is now reduced to
the calculation of the coefficients Cn and Sn, using the
following formulas:
∫ ( )
∫ ( )
( ) m0 (4)
∫ ( )
( )
The above transform decomposes a periodically unsteady
signal into its basic components, i.e., the fundamental
frequency or first harmonic, and its multiples or higher
order harmonics, and, thus, allows sorting out the phase-
locked coherent flow structures from the otherwise
random unsteadiness in the flow field.
In the present work, the fundamental frequency is
associated to the blade passage, which corresponds to the
rotation speed times the number of blades. More
specifically, the blade passage frequency (BPF) is here
equal to 100 Hz, the propeller rotation speed being 25 rps
and the number of blades 4.
The statistical analysis is calculated over the 2500
propeller revolutions performed during the 100s of
measurement.
The harmonic decomposition is an extremely useful tool
by which one can reconstruct the phase-locked topologies
of each single harmonic in the measurements domain,
and, consequently, isolate the corresponding perturbation
sources (e.g., correlating the phase-locked representation
of each harmonic to corresponding representations of the
velocity signals or visualizations).
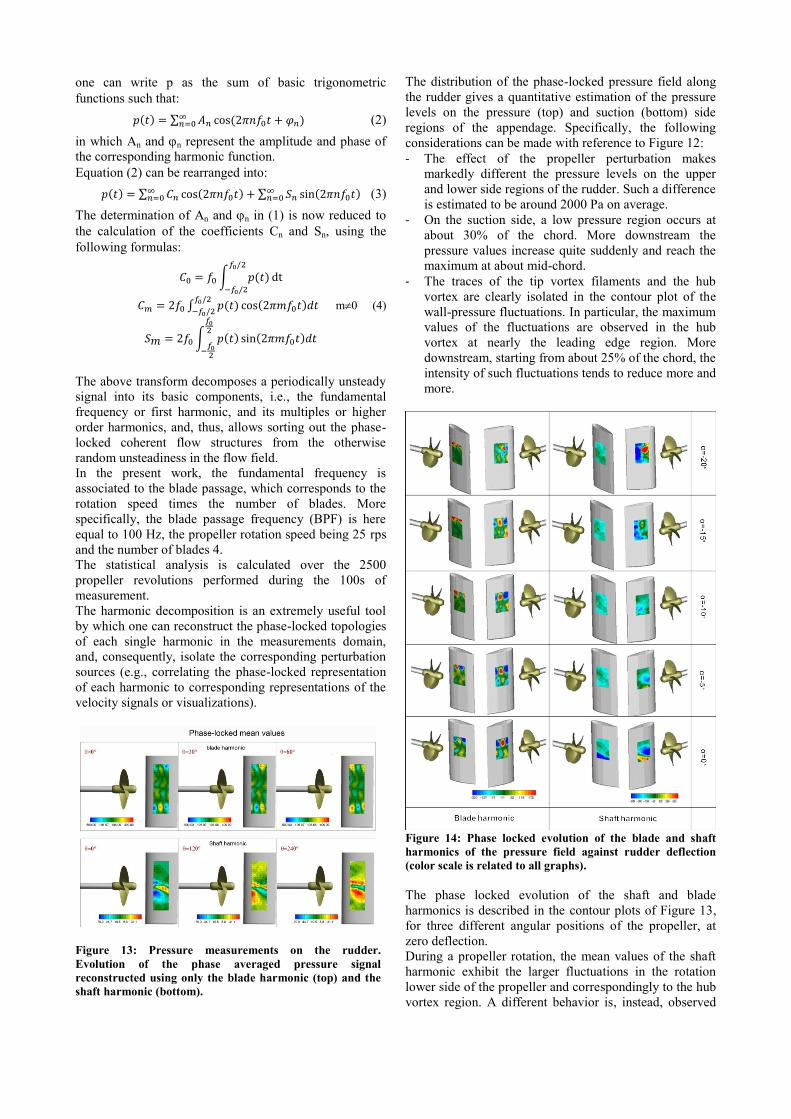
Figure 13: Pressure measurements on the rudder.
Evolution of the phase averaged pressure signal
reconstructed using only the blade harmonic (top) and the
shaft harmonic (bottom).
The distribution of the phase-locked pressure field along
the rudder gives a quantitative estimation of the pressure
levels on the pressure (top) and suction (bottom) side
regions of the appendage. Specifically, the following
considerations can be made with reference to Figure 12:
- The effect of the propeller perturbation makes
markedly different the pressure levels on the upper
and lower side regions of the rudder. Such a difference
is estimated to be around 2000 Pa on average.
- On the suction side, a low pressure region occurs at
about 30% of the chord. More downstream the
pressure values increase quite suddenly and reach the
maximum at about mid-chord.
- The traces of the tip vortex filaments and the hub
vortex are clearly isolated in the contour plot of the
wall-pressure fluctuations. In particular, the maximum
values of the fluctuations are observed in the hub
vortex at nearly the leading edge region. More
downstream, starting from about 25% of the chord, the
intensity of such fluctuations tends to reduce more and
more.
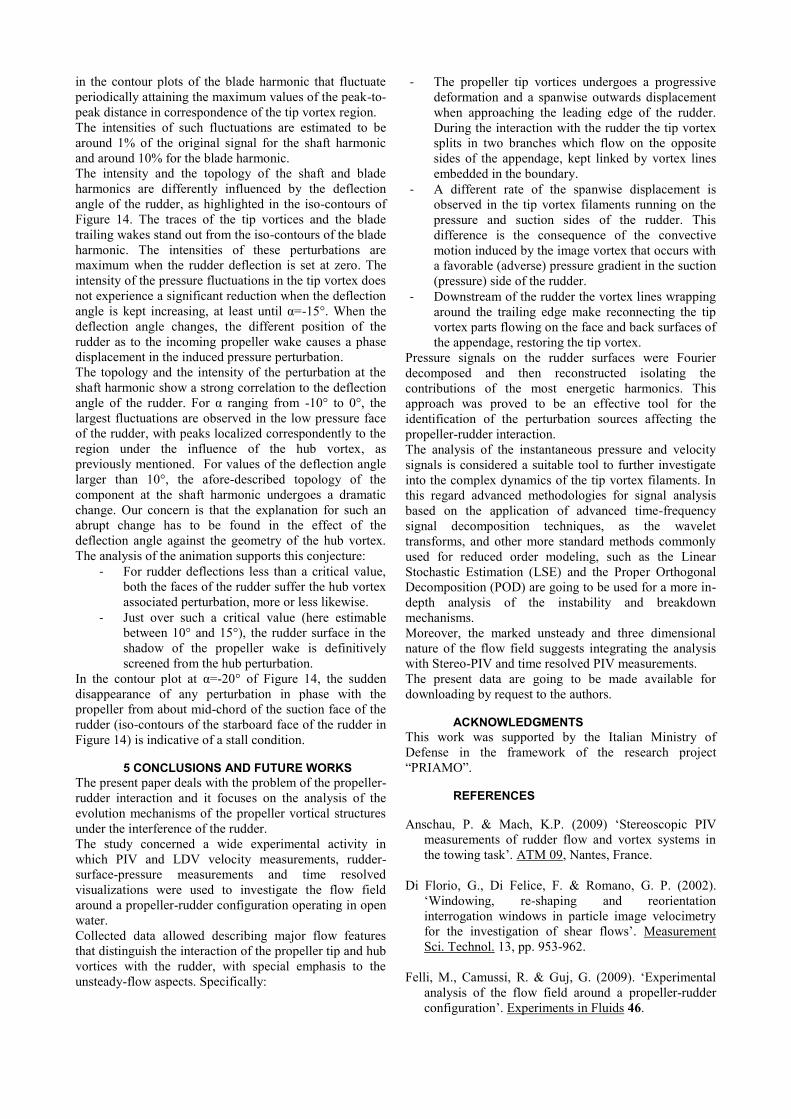
Figure 14: Phase locked evolution of the blade and shaft
harmonics of the pressure field against rudder deflection
(color scale is related to all graphs).
The phase locked evolution of the shaft and blade
harmonics is described in the contour plots of Figure 13,
for three different angular positions of the propeller, at
zero deflection.
During a propeller rotation, the mean values of the shaft
harmonic exhibit the larger fluctuations in the rotation
lower side of the propeller and correspondingly to the hub
vortex region. A different behavior is, instead, observed
in the contour plots of the blade harmonic that fluctuate
periodically attaining the maximum values of the peak-to-
peak distance in correspondence of the tip vortex region.
The intensities of such fluctuations are estimated to be
around 1% of the original signal for the shaft harmonic
and around 10% for the blade harmonic.
The intensity and the topology of the shaft and blade
harmonics are differently influenced by the deflection
angle of the rudder, as highlighted in the iso-contours of
Figure 14. The traces of the tip vortices and the blade
trailing wakes stand out from the iso-contours of the blade
harmonic. The intensities of these perturbations are
maximum when the rudder deflection is set at zero. The
intensity of the pressure fluctuations in the tip vortex does
not experience a significant reduction when the deflection
angle is kept increasing, at least until α=-15°. When the
deflection angle changes, the different position of the
rudder as to the incoming propeller wake causes a phase
displacement in the induced pressure perturbation.
The topology and the intensity of the perturbation at the
shaft harmonic show a strong correlation to the deflection
angle of the rudder. For α ranging from -10° to 0°, the
largest fluctuations are observed in the low pressure face
of the rudder, with peaks localized correspondently to the
region under the influence of the hub vortex, as
previously mentioned. For values of the deflection angle
larger than 10°, the afore-described topology of the
component at the shaft harmonic undergoes a dramatic
change. Our concern is that the explanation for such an
abrupt change has to be found in the effect of the
deflection angle against the geometry of the hub vortex.
The analysis of the animation supports this conjecture:
- For rudder deflections less than a critical value,
both the faces of the rudder suffer the hub vortex
associated perturbation, more or less likewise.
- Just over such a critical value (here estimable
between 10° and 15°), the rudder surface in the
shadow of the propeller wake is definitively
screened from the hub perturbation.
In the contour plot at α=-20° of Figure 14, the sudden
disappearance of any perturbation in phase with the
propeller from about mid-chord of the suction face of the
rudder (iso-contours of the starboard face of the rudder in
Figure 14) is indicative of a stall condition.
5 CONCLUSIONS AND FUTURE WORKS
The present paper deals with the problem of the propeller-
rudder interaction and it focuses on the analysis of the
evolution mechanisms of the propeller vortical structures
under the interference of the rudder.
The study concerned a wide experimental activity in
which PIV and LDV velocity measurements, rudder-
surface-pressure measurements and time resolved
visualizations were used to investigate the flow field
around a propeller-rudder configuration operating in open
water.
Collected data allowed describing major flow features
that distinguish the interaction of the propeller tip and hub
vortices with the rudder, with special emphasis to the
unsteady-flow aspects. Specifically:
- The propeller tip vortices undergoes a progressive
deformation and a spanwise outwards displacement
when approaching the leading edge of the rudder.
During the interaction with the rudder the tip vortex
splits in two branches which flow on the opposite
sides of the appendage, kept linked by vortex lines
embedded in the boundary.
- A different rate of the spanwise displacement is
observed in the tip vortex filaments running on the
pressure and suction sides of the rudder. This
difference is the consequence of the convective
motion induced by the image vortex that occurs with
a favorable (adverse) pressure gradient in the suction
(pressure) side of the rudder.
- Downstream of the rudder the vortex lines wrapping
around the trailing edge make reconnecting the tip
vortex parts flowing on the face and back surfaces of
the appendage, restoring the tip vortex.
Pressure signals on the rudder surfaces were Fourier
decomposed and then reconstructed isolating the
contributions of the most energetic harmonics. This
approach was proved to be an effective tool for the
identification of the perturbation sources affecting the
propeller-rudder interaction.
The analysis of the instantaneous pressure and velocity
signals is considered a suitable tool to further investigate
into the complex dynamics of the tip vortex filaments. In
this regard advanced methodologies for signal analysis
based on the application of advanced time-frequency
signal decomposition techniques, as the wavelet
transforms, and other more standard methods commonly
used for reduced order modeling, such as the Linear
Stochastic Estimation (LSE) and the Proper Orthogonal
Decomposition (POD) are going to be used for a more in-
depth analysis of the instability and breakdown
mechanisms.
Moreover, the marked unsteady and three dimensional
nature of the flow field suggests integrating the analysis
with Stereo-PIV and time resolved PIV measurements.
The present data are going to be made available for
downloading by request to the authors.
ACKNOWLEDGMENTS
This work was supported by the Italian Ministry of
Defense in the framework of the research project
“PRIAMO”.
REFERENCES
Anschau, P. & Mach, K.P. (2009) „Stereoscopic PIV
measurements of rudder flow and vortex systems in
the towing task‟. ATM 09, Nantes, France.
Di Florio, G., Di Felice, F. & Romano, G. P. (2002).
„Windowing, re-shaping and reorientation
interrogation windows in particle image velocimetry
for the investigation of shear flows‟. Measurement
Sci. Technol. 13, pp. 953-962.
Felli, M., Camussi, R. & Guj, G. (2009). „Experimental
analysis of the flow field around a propeller-rudder
configuration‟. Experiments in Fluids 46.
Felli, M. & Di Felice, F. (2004). „Analysis of the
propeller-hull interaction by LDV phase sampling
techniques‟. Journal of Visualization 7(1).
Felli, M. & Di Felice, F. (2005). „Propeller wake analysis
in non-uniform inflow by LDV phase sampling
techniques‟. Journal of Marine Science and
Technology 10(4), pp. 159-172.
Felli, M., Di Felice, F., Guj, G. & Camussi, R. (2006).
„Analysis of the propeller wake evolution by pressure
and velocity phase measurements‟. Experiments in
Fluids 1, pp. 1-11.
Felli, M., Falchi, M. & Di Felice, F. (2009a). „PIV
analysis of the mechanism of evolution and interaction
of the propeller tip vortices with a rudder‟. 8th
International Symposium on Particle Image
Velocimetry, Melbourne, Australia.
Felli, M., Greco, L., Colombo, C., Salvatore, F., Di
Felice, F. & Soave M. (2006). „Experimental and
theoretical investigation of propeller-rudder
interaction phenomena‟. 26th Symposium on Naval
Hydrodynamics, Rome, Italy.
Huang, H. T., Fielder, H. F. & Wang, J. J. (1993).
„Limitation and improvement of PIV; part II: Particle
Image Distortion, a novel technique‟. Exp. Fluids 15,
pp. 263-273.
Kracht, A. M. (1992). „Ship propeller rudder interaction‟.
2nd
International Symposium on Propeller and
Cavitation, Hangchou, China.
Lücke T. & Streckwall H. (2009). „Cavitation Research
on a Very Large Semi Spade Rudder‟. First
International Symposium on Marine Propulsors,
SMP‟09, Trondheim, Norway.
Marshall, J. S. & Grant, J. R. (1996). „Penetration of a
Blade into a Vortex Core: Vorticity response and
Unsteady Blade Forces‟. Journal of Fluid Mechanics
306, pp. 83-109.
Molland, A. F. & Turnock, S. R. (1992). „Wind tunnel
investigation of the influence of propeller loading on
ship rudder performance‟. The Royal Institution of
naval Architects, London, UK.
Paik, B. G., Kim, K. Y., Ahn, J. W., Kim, Y. S., Kim, S.
P. & Park, J. J. (2008). „Experimental study on the gap
entrance profile affecting rudder gap cavitation‟.
Ocean Engineering 35, pp. 139-149.
Scarano, F. (2002). „Iterative image deformation methods
in PIV‟. Measurement. Sci. Technol. 13, pp. 1-19.
Shen, Y. T., Jiang, C. W. & Remmers, K. D. (1997).
„Effect of ship hull and propeller on rudder
cavitation‟. Journal of Ship Research, pp. 41-44.
Shen, Y. T., Remmers, K. D. & Jiang, C. W. (1997).
„Effect of ship hull and propeller on rudder
cavitation‟. Journal of Ship Research, pp. 41-43.