Embed Size (px)
Citation preview
7
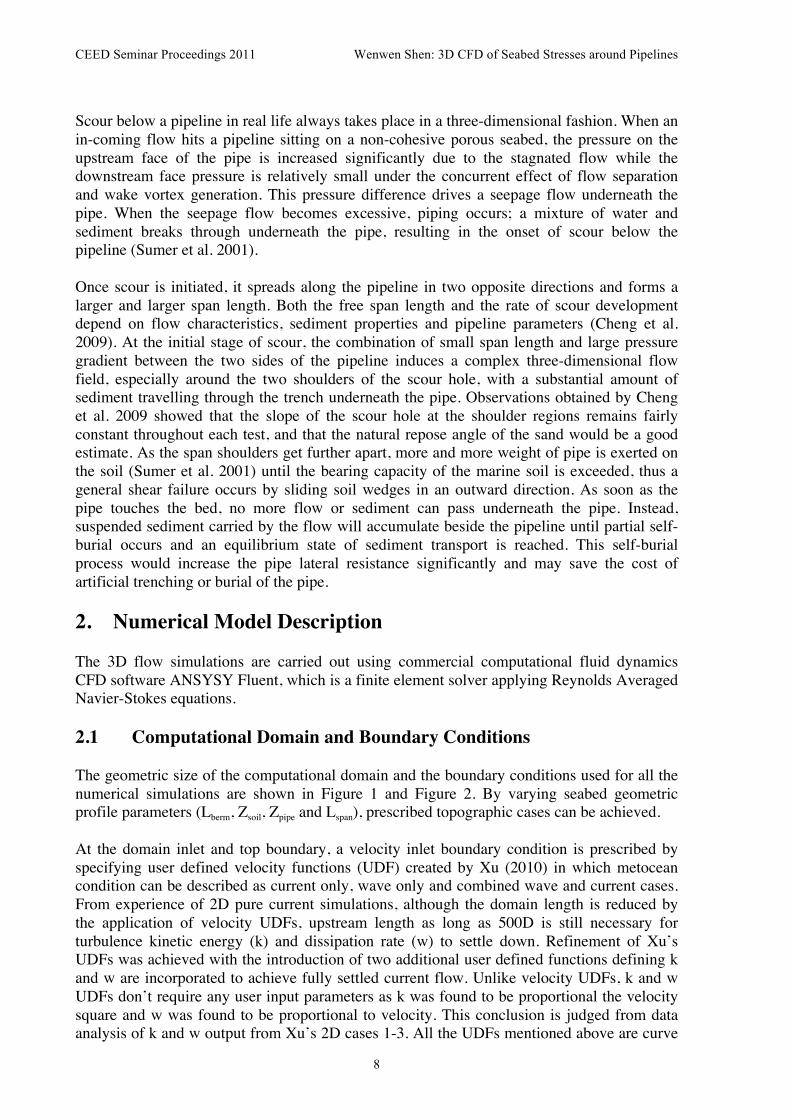
3D Investigation of Seabed Stress Around Subsea Pipelines
Wenwen Shen
Dr Jeremy Leggoe School of Mechanical and Chemical Engineering
Terry Griffiths CEED Client: J P Kenny
Abstract
Field observations on offshore pipelines indicate that local scour around pipes laid on an erodible seabed is almost inevitable. As a major forcing mechanism for sediment transport, seabed shear stresses may dominate the deformation of the seabed. Little research work has considered sediment transport induced seabed deformation in the vicinity of a pipeline and thence the consequences for the design of subsea pipelines. This project is an extended project of the 2010 CEED project“2D CFD Modeling of Seabed Shear Stresses around Subsea Pipelines”. It provides a three dimensional view of seabed shear stress investigation, using DES kw SST turbulence model with user defined velocity turbulence functions, which distinguishes itself from the prevailing researches conducted so far on the topic of flow around circular cylinder. This project investigates the variation of seabed shear stresses induced by three-dimensional flows due to scour propagation under inclined current and wave incident angles. The aim is to modify existing two-dimensional models with data generated under various scour initiated seabed topographies in inclined waves and currents using CFD software FLUENT.
1. Introduction Offshore pipeline stability design is of vital importance in the offshore industry. A cost efficient design is important for the economic performance of projects whilst minimizing the environmental footprint in the marine ecosystem and maintaining high levels of safety. However, the existing design code method turns out to be too conservative to provide cost effective solutions and results in undesirably large requirements for seabed intervention, such as the placement of quarried rock or trenching (Zeitoun et al. 2009). The potential instability of the seabed caused by natural flow induced sediment transport significantly affects the pipeline’s resistance to lateral movement. Working on the results of Xu (2010), the client achieved two-dimensional sediment transport models by using seabed shear stress to predict suspended sediment concentration determined by Shield’s criteria threshold of suspension (Soulsby 1997). In these models seabed geometry is assumed to be infinitely long along the pipe and fluid flow is perpendicular to the pipeline. These models can give a good estimation of shear stress in the centre of a long scour hole. However, in reality, to estimate the shear stresses at the edges of a scour hole where very high stresses are possible, pronounced sediment transport influenced by the effect of scour propagation along the axis of the pipe could be underestimated. With three-dimensional investigations into various seabed topographies under typical scour stages and different wave and current incident angles, we can modify those two-dimensional models with quantified results supported by this project. Thus the dimension along the pipe where variations of seabed shear stresses can be expected will be taken into account as well.
CEED Seminar Proceedings 2011 Wenwen Shen: 3D CFD of Seabed Stresses around Pipelines
8
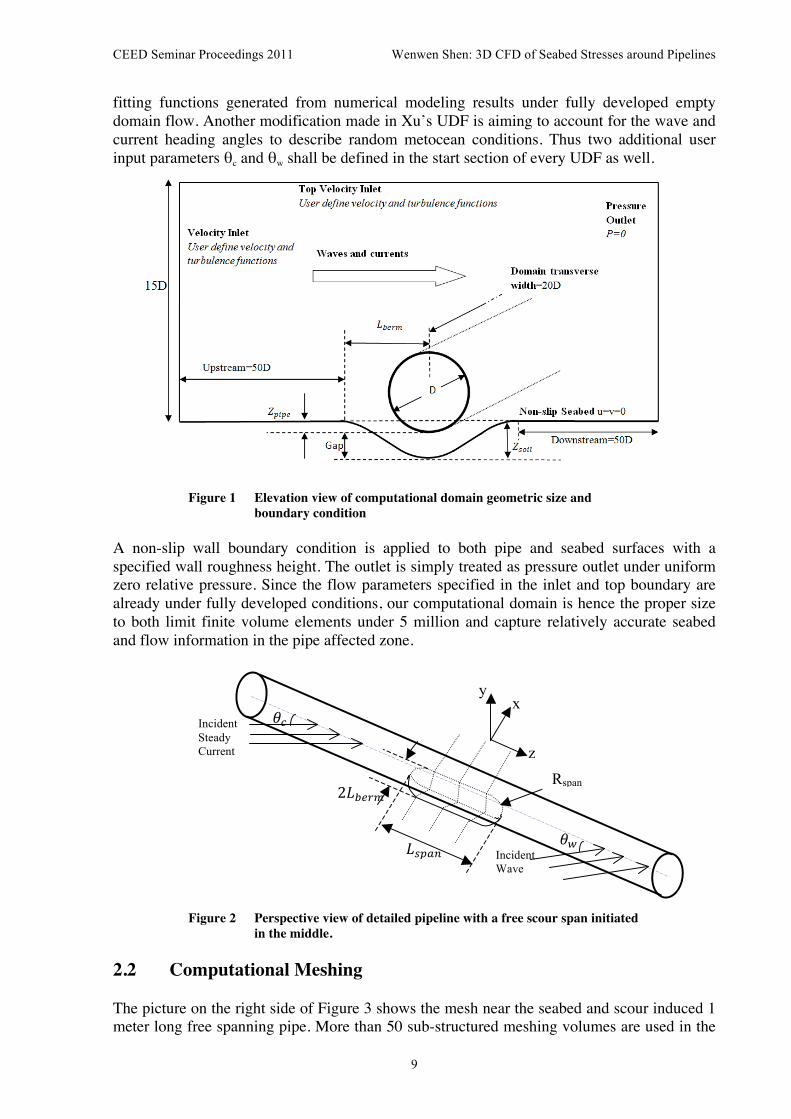
Scour below a pipeline in real life always takes place in a three-dimensional fashion. When an in-coming flow hits a pipeline sitting on a non-cohesive porous seabed, the pressure on the upstream face of the pipe is increased significantly due to the stagnated flow while the downstream face pressure is relatively small under the concurrent effect of flow separation and wake vortex generation. This pressure difference drives a seepage flow underneath the pipe. When the seepage flow becomes excessive, piping occurs; a mixture of water and sediment breaks through underneath the pipe, resulting in the onset of scour below the pipeline (Sumer et al. 2001). Once scour is initiated, it spreads along the pipeline in two opposite directions and forms a larger and larger span length. Both the free span length and the rate of scour development depend on flow characteristics, sediment properties and pipeline parameters (Cheng et al. 2009). At the initial stage of scour, the combination of small span length and large pressure gradient between the two sides of the pipeline induces a complex three-dimensional flow field, especially around the two shoulders of the scour hole, with a substantial amount of sediment travelling through the trench underneath the pipe. Observations obtained by Cheng et al. 2009 showed that the slope of the scour hole at the shoulder regions remains fairly constant throughout each test, and that the natural repose angle of the sand would be a good estimate. As the span shoulders get further apart, more and more weight of pipe is exerted on the soil (Sumer et al. 2001) until the bearing capacity of the marine soil is exceeded, thus a general shear failure occurs by sliding soil wedges in an outward direction. As soon as the pipe touches the bed, no more flow or sediment can pass underneath the pipe. Instead, suspended sediment carried by the flow will accumulate beside the pipeline until partial self-burial occurs and an equilibrium state of sediment transport is reached. This self-burial process would increase the pipe lateral resistance significantly and may save the cost of artificial trenching or burial of the pipe. 2. Numerical Model Description The 3D flow simulations are carried out using commercial computational fluid dynamics CFD software ANSYSY Fluent, which is a finite element solver applying Reynolds Averaged Navier-Stokes equations. 2.1 Computational Domain and Boundary Conditions The geometric size of the computational domain and the boundary conditions used for all the numerical simulations are shown in Figure 1 and Figure 2. By varying seabed geometric profile parameters (Lberm, Zsoil, Zpipe and Lspan), prescribed topographic cases can be achieved. At the domain inlet and top boundary, a velocity inlet boundary condition is prescribed by specifying user defined velocity functions (UDF) created by Xu (2010) in which metocean condition can be described as current only, wave only and combined wave and current cases. From experience of 2D pure current simulations, although the domain length is reduced by the application of velocity UDFs, upstream length as long as 500D is still necessary for turbulence kinetic energy (k) and dissipation rate (w) to settle down. Refinement of Xu’s UDFs was achieved with the introduction of two additional user defined functions defining k and w are incorporated to achieve fully settled current flow. Unlike velocity UDFs, k and w UDFs don’t require any user input parameters as k was found to be proportional the velocity square and w was found to be proportional to velocity. This conclusion is judged from data analysis of k and w output from Xu’s 2D cases 1-3. All the UDFs mentioned above are curve
CEED Seminar Proceedings 2011 Wenwen Shen: 3D CFD of Seabed Stresses around Pipelines
9
fitting functions generated from numerical modeling results under fully developed empty domain flow. Another modification made in Xu’s UDF is aiming to account for the wave and current heading angles to describe random metocean conditions. Thus two additional user input parameters θc and θw shall be defined in the start section of every UDF as well.
Figure 1 Elevation view of computational domain geometric size and boundary condition
A non-slip wall boundary condition is applied to both pipe and seabed surfaces with a specified wall roughness height. The outlet is simply treated as pressure outlet under uniform zero relative pressure. Since the flow parameters specified in the inlet and top boundary are already under fully developed conditions, our computational domain is hence the proper size to both limit finite volume elements under 5 million and capture relatively accurate seabed and flow information in the pipe affected zone.
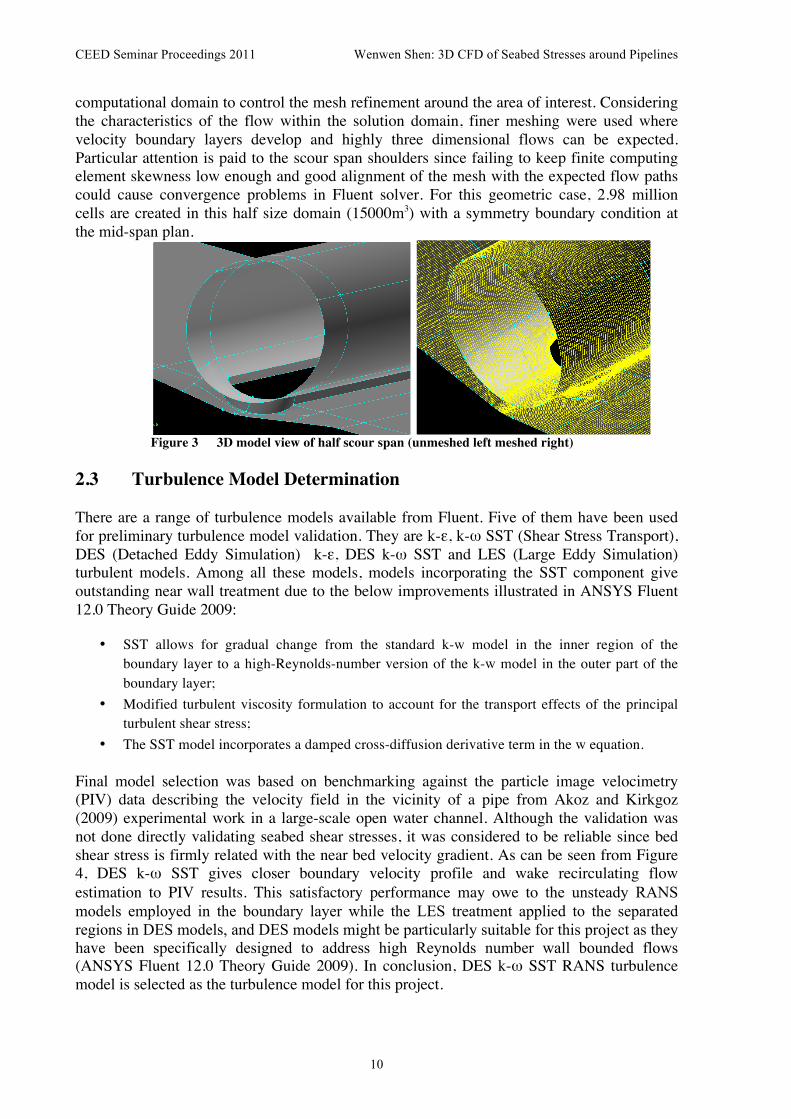
Figure 2 Perspective view of detailed pipeline with a free scour span initiated
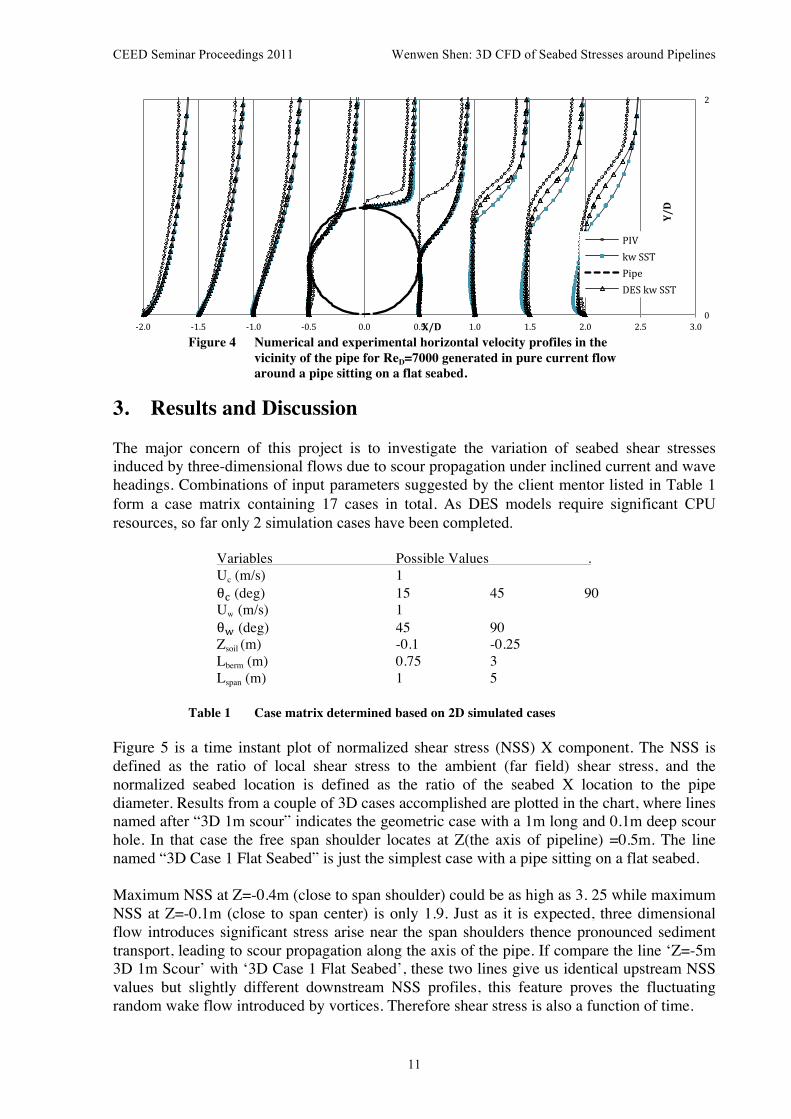
in the middle. 2.2 Computational Meshing The picture on the right side of Figure 3 shows the mesh near the seabed and scour induced 1 meter long free spanning pipe. More than 50 sub-structured meshing volumes are used in the
z
y x
IncidentWave
!!
!! Incident Steady Current
!!"#$
2!!"#$ Rspan
CEED Seminar Proceedings 2011 Wenwen Shen: 3D CFD of Seabed Stresses around Pipelines
10
computational domain to control the mesh refinement around the area of interest. Considering the characteristics of the flow within the solution domain, finer meshing were used where velocity boundary layers develop and highly three dimensional flows can be expected. Particular attention is paid to the scour span shoulders since failing to keep finite computing element skewness low enough and good alignment of the mesh with the expected flow paths could cause convergence problems in Fluent solver. For this geometric case, 2.98 million cells are created in this half size domain (15000m3) with a symmetry boundary condition at the mid-span plan.
Figure 3 3D model view of half scour span (unmeshed left meshed right)
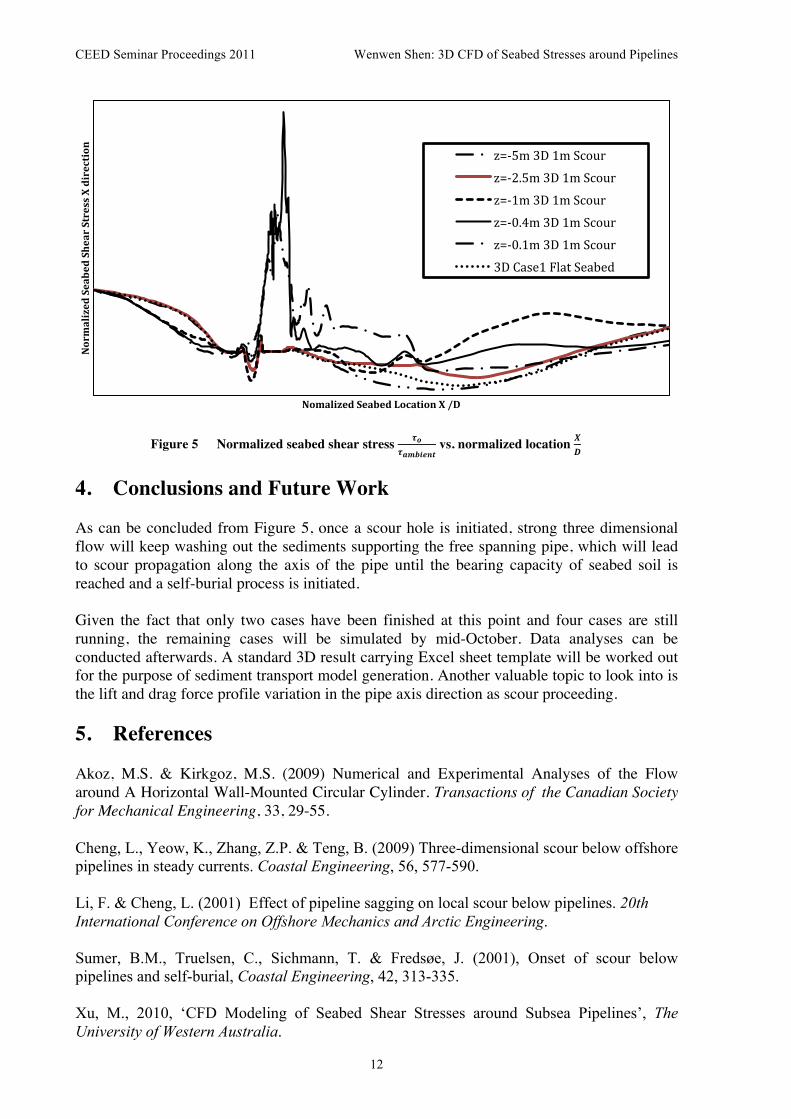
2.3 Turbulence Model Determination There are a range of turbulence models available from Fluent. Five of them have been used for preliminary turbulence model validation. They are k-ε, k-ω SST (Shear Stress Transport), DES (Detached Eddy Simulation) k-ε, DES k-ω SST and LES (Large Eddy Simulation) turbulent models. Among all these models, models incorporating the SST component give outstanding near wall treatment due to the below improvements illustrated in ANSYS Fluent 12.0 Theory Guide 2009:
• SST allows for gradual change from the standard k-w model in the inner region of the boundary layer to a high-Reynolds-number version of the k-w model in the outer part of the boundary layer;
• Modified turbulent viscosity formulation to account for the transport effects of the principal turbulent shear stress;
• The SST model incorporates a damped cross-diffusion derivative term in the w equation. Final model selection was based on benchmarking against the particle image velocimetry (PIV) data describing the velocity field in the vicinity of a pipe from Akoz and Kirkgoz (2009) experimental work in a large-scale open water channel. Although the validation was not done directly validating seabed shear stresses, it was considered to be reliable since bed shear stress is firmly related with the near bed velocity gradient. As can be seen from Figure 4, DES k-ω SST gives closer boundary velocity profile and wake recirculating flow estimation to PIV results. This satisfactory performance may owe to the unsteady RANS models employed in the boundary layer while the LES treatment applied to the separated regions in DES models, and DES models might be particularly suitable for this project as they have been specifically designed to address high Reynolds number wall bounded flows (ANSYS Fluent 12.0 Theory Guide 2009). In conclusion, DES k-ω SST RANS turbulence model is selected as the turbulence model for this project.
CEED Seminar Proceedings 2011 Wenwen Shen: 3D CFD of Seabed Stresses around Pipelines
11
Figure 4 Numerical and experimental horizontal velocity profiles in the
vicinity of the pipe for ReD=7000 generated in pure current flow around a pipe sitting on a flat seabed.
3. Results and Discussion The major concern of this project is to investigate the variation of seabed shear stresses induced by three-dimensional flows due to scour propagation under inclined current and wave headings. Combinations of input parameters suggested by the client mentor listed in Table 1 form a case matrix containing 17 cases in total. As DES models require significant CPU resources, so far only 2 simulation cases have been completed.
Variables Possible Values . Uc (m/s) 1 θ! (deg) 15 45 90 Uw (m/s) 1
θ! (deg) 45 90 Zsoil (m) -0.1 -0.25 Lberm (m) 0.75 3 Lspan (m) 1 5
Table 1 Case matrix determined based on 2D simulated cases Figure 5 is a time instant plot of normalized shear stress (NSS) X component. The NSS is defined as the ratio of local shear stress to the ambient (far field) shear stress, and the normalized seabed location is defined as the ratio of the seabed X location to the pipe diameter. Results from a couple of 3D cases accomplished are plotted in the chart, where lines named after “3D 1m scour” indicates the geometric case with a 1m long and 0.1m deep scour hole. In that case the free span shoulder locates at Z(the axis of pipeline) =0.5m. The line named “3D Case 1 Flat Seabed” is just the simplest case with a pipe sitting on a flat seabed. Maximum NSS at Z=-0.4m (close to span shoulder) could be as high as 3. 25 while maximum NSS at Z=-0.1m (close to span center) is only 1.9. Just as it is expected, three dimensional flow introduces significant stress arise near the span shoulders thence pronounced sediment transport, leading to scour propagation along the axis of the pipe. If compare the line ‘Z=-5m 3D 1m Scour’ with ‘3D Case 1 Flat Seabed’, these two lines give us identical upstream NSS values but slightly different downstream NSS profiles, this feature proves the fluctuating random wake flow introduced by vortices. Therefore shear stress is also a function of time.
0
2
-‐2.0 -‐1.5 -‐1.0 -‐0.5 0.0 0.5 1.0 1.5 2.0 2.5 3.0
Y/D
X/D
PIV kw SST Pipe DES kw SST
CEED Seminar Proceedings 2011 Wenwen Shen: 3D CFD of Seabed Stresses around Pipelines
12
Figure 5 Normalized seabed shear stress !!
!!"#$%&' vs. normalized location !
!
4. Conclusions and Future Work As can be concluded from Figure 5, once a scour hole is initiated, strong three dimensional flow will keep washing out the sediments supporting the free spanning pipe, which will lead to scour propagation along the axis of the pipe until the bearing capacity of seabed soil is reached and a self-burial process is initiated. Given the fact that only two cases have been finished at this point and four cases are still running, the remaining cases will be simulated by mid-October. Data analyses can be conducted afterwards. A standard 3D result carrying Excel sheet template will be worked out for the purpose of sediment transport model generation. Another valuable topic to look into is the lift and drag force profile variation in the pipe axis direction as scour proceeding. 5. References Akoz, M.S. & Kirkgoz, M.S. (2009) Numerical and Experimental Analyses of the Flow around A Horizontal Wall-Mounted Circular Cylinder. Transactions of the Canadian Society for Mechanical Engineering, 33, 29-55. Cheng, L., Yeow, K., Zhang, Z.P. & Teng, B. (2009) Three-dimensional scour below offshore pipelines in steady currents. Coastal Engineering, 56, 577-590. Li, F. & Cheng, L. (2001) Effect of pipeline sagging on local scour below pipelines. 20th International Conference on Offshore Mechanics and Arctic Engineering. Sumer, B.M., Truelsen, C., Sichmann, T. & Fredsøe, J. (2001), Onset of scour below pipelines and self-burial, Coastal Engineering, 42, 313-335. Xu, M., 2010, ‘CFD Modeling of Seabed Shear Stresses around Subsea Pipelines’, The University of Western Australia.
Normalized Seabed Shear Stress X direction
Nomalized Seabed Location X /D
z=-‐5m 3D 1m Scour z=-‐2.5m 3D 1m Scour z=-‐1m 3D 1m Scour z=-‐0.4m 3D 1m Scour z=-‐0.1m 3D 1m Scour 3D Case1 Flat Seabed