Embed Size (px)
Citation preview

Institute of Experimental Pharmacology and Toxicology
Center for Experimental Medicine
University Medical Center Hamburg-Eppendorf
Investigation of the autophagy-lysosomal pathway in
human inherited cardiomyopathies
Dissertation
Submitted to the Department of Chemistry
Faculty of Mathematics, Informatics, and Natural Sciences
University of Hamburg
for the degree of
Doctor of Natural Sciences
(Dr. rer. nat.)
by
Antonia Theresa Luisa Zech
Hamburg, 2019

2

3
1st Referee: Prof. Dr. Lucie Carrier
2nd Referee: Prof. Dr. Elke Oetjen
Date of disputation: 05.05.2020
This thesis was carried out from October 2015 until December 2019 (including maternity and
parental leave from October 2018 until and including August 2019) at the Institute of
Experimental Pharmacology and Toxicology (Director: Prof. Dr. Thomas Eschenhagen) under
the supervision of Prof. Dr. Lucie Carrier.

4
Table of contents - I
5
Table of contents
1. Introduction .................................................................................................................... 9
1.1. Autophagy-lysosomal pathway ................................................................................ 9
The ALP with its single steps ............................................................................ 9
Regulation of the ALP in human heart .............................................................12
The role of the ALP in cardiac disease ............................................................15
1.2. Human inherited cardiomyopathies ........................................................................16
1.3. Cardiac myosin-binding protein C ...........................................................................18
cMyBP-C as part of the sarcomere ..................................................................19
Regulation of cardiac function by cMyBP-C .....................................................20
cMyBP-C in HCM ............................................................................................21
1.4. Human induced pluripotent stem cells ....................................................................22
1.5. Human induced-pluripotent stem cell-derived cardiomyocytes ...............................23
1.6. CRISPR/Cas9-based genome editing ....................................................................25
2. Aim of study ..................................................................................................................29
3. Material & Methods .......................................................................................................30
3.1. Cell Culture ............................................................................................................30
Cell culture media ...........................................................................................30
HiPSC culture..................................................................................................32
3.2. CRISPR/Cas9-mediated knockout of MYBPC3 ......................................................33
Validation of targeted genomic locus in ERC018 hiPSC ..................................33
CRISPR/Cas9 gene editing approach and cloning ..........................................35
Nucleofection optimization for ERC018 ...........................................................37
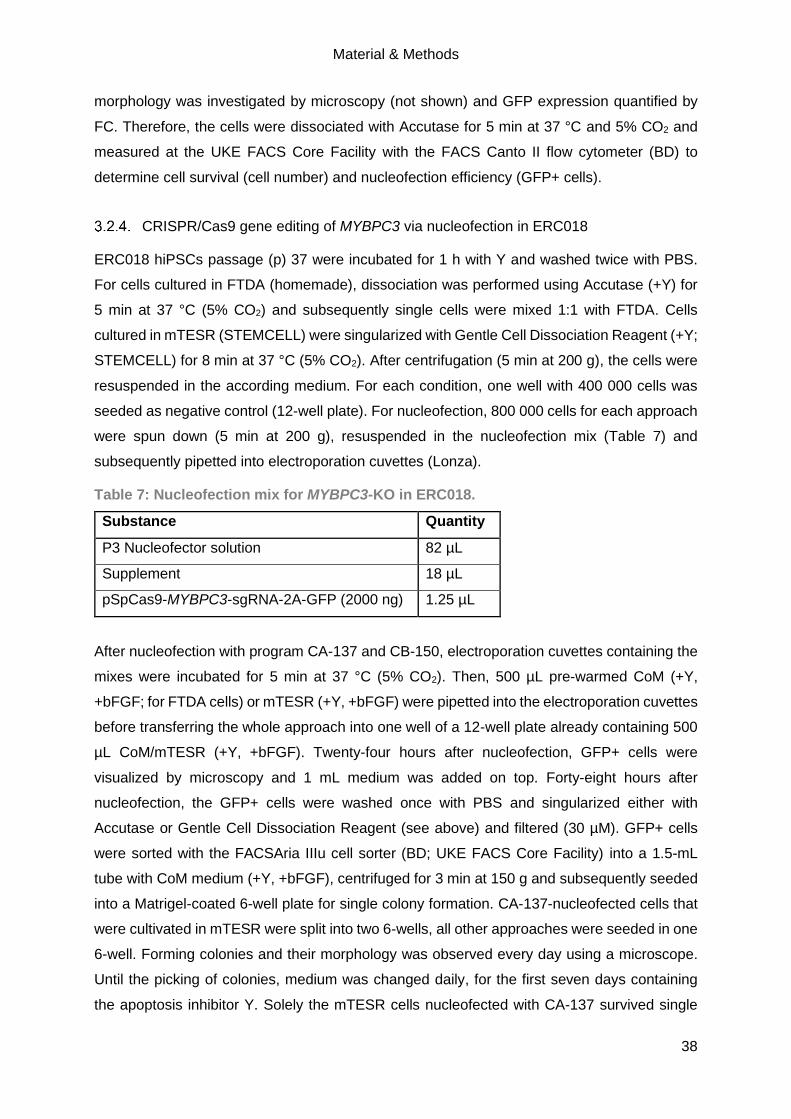
CRISPR/Cas9 gene editing of MYBPC3 via nucleofection in ERC018 ............38
Subcloning and off-target analysis of CRISPR clones .....................................39
Karyotype analysis of CRISPR clones .............................................................40
Genotyping of CRISPR clones ........................................................................41
3.3. Generation, cultivation and treatment of hiPSC-CMs ..............................................41
Cardiac differentiation of hiPSC ......................................................................41
Thawing, cultivation and treatment of hiPSC-CMs ...........................................42
Table of contents - III
6
3.4. Human tissue samples ...........................................................................................43
3.5. Molecular analysis ..................................................................................................43
Isolation of proteins for WB .............................................................................43
Evaluation of protein level by WB ....................................................................43
Isolation of proteins for mass spectrometry analysis........................................44
Sample preparation for mass spectrometry analysis .......................................44
Mass spectrometry measurements ..................................................................45
Analysis of mass spectrometry data ................................................................45
Isolation of RNA from human cardiac tissue and hiPSC-CMs ..........................46
Validation of MYBPC3-KO on mRNA level ......................................................46
Evaluation of mRNA levels by NanoString Technology ...................................47
Evaluation of mRNA level by RT-qPCR .......................................................48
Immunofluorescence and cell size analysis of hiPSC-CMs ..........................48
3.6. Statistical analysis ..................................................................................................49
4. Results ..........................................................................................................................50
4.1. Evaluation of a putative common ALP alteration in human inherited
cardiomyopathies ..............................................................................................................50
Common autophagy alteration in cardiac tissue samples of HCM and DCM
patients ........................................................................................................................50
Evaluation of the autophagic flux in hiPSC-derived cardiomyocytes ................52
Evaluation of the autophagy-lysosomal pathway in hiPSC-derived
cardiomyocytes from patients with inherited cardiomyopathies ......................................53
4.2. Generation and validation of MYBPC3-deficient hiPSC-derived cardiomyocytes as a
human in vitro model of HCM ............................................................................................70
Selection of MYBPC3 target sequence............................................................70
Nucleofection optimization for ERC018 ...........................................................71
Nucleofection and single clone expansion .......................................................72
Off-target analysis ...........................................................................................77
Karyotype analysis ..........................................................................................79
Cardiac differentiation .....................................................................................81

Table of contents - III
7
Validation of genotype on hiPSC and hiPSC-derived cardiomyocyte level ......83
Molecular validation of the functional MYBPC3 knockout ................................84
Morphological analysis of MYBPC3-KO in 2D-cultured hiPSC-CMs ................92
5. Discussion .....................................................................................................................97
5.1. Alteration of the ALP in human hypertrophic and dilated cardiomyopathies ............97
Markers of the ALP are dysregulated in human tissue and hiPSC-CMs of HCM
and DCM patients ..........................................................................................................98
Autophagic flux is dysregulated in HCM and DCM hiPSC-CMs ..................... 100
5.2. Generation and validation of MYBPC3-deficient hiPSC-derived cardiomyocytes as a
human in vitro model of HCM .......................................................................................... 105
cMyBP-C-deficient hiPSC-CM lines reveal features of human HCM in vitro .. 106
Diseased modelling of MYBPC3-deficient hiPSC-CM lines revealed
haploinsufficiency and increased cell area with culture time ........................................ 109
5.3. Conclusion and further perspectives .................................................................... 113
6. Summary ..................................................................................................................... 114
7. Zusammenfassung ...................................................................................................... 116
8. Literature ..................................................................................................................... 118
9. Supplement ................................................................................................................. 130
9.1. Supplementary figures and tables ........................................................................ 130
9.2. List of abbreviations ............................................................................................. 139
9.3. Devices, materials & substances .......................................................................... 146
Devices ......................................................................................................... 146
Software ........................................................................................................ 147
Materials ....................................................................................................... 147
Cell culture medium and serum ..................................................................... 148
Reagents ....................................................................................................... 149
Kits and enzymes .......................................................................................... 151
Composition of reagents, buffers & solutions ................................................ 152
Antibodies ..................................................................................................... 156
Primer lists & NanoString Expression CodeSet ............................................. 157
Table of contents - III
8
9.4. Security information .............................................................................................. 158
EU-GHS Hazard (H) statements.................................................................... 161
EU-GHS Precaution (P) statements .............................................................. 162
9.5. Publications & congress participations ................................................................. 164
Publications ................................................................................................... 164
Participations at congresses .......................................................................... 165
10. Acknowledgement ................................................................................................... 166
11. Declaration of academic honesty – Eidesstattliche Erklärung .................................. 167

Introduction
9
1. Introduction
1.1. Autophagy-lysosomal pathway
Autophagy (greek auto: self; phagein: eating) is one of the two major protein degradation
pathways within a cell that degrades long-lived proteins and organelles within lysosomes
(Deter and De Duve 1967). Terminally misfolded and short-lived proteins are degraded via the
ubiquitin-proteasome system (UPS). Under basal conditions, autophagy is constantly active
but can be upregulated as a response to various stimuli of stress, for instance starvation or
pathogen infection, to protect against toxic protein aggregates. Furthermore, autophagy is
highly conserved within eukaryotes and is keeping cellular homeostasis whilst acting as an
energy supplier. Hence, autophagy is of particular importance for post-mitotic cell types.
However, defective autophagy can be fatal for every cell type since a low activity may lead to
proteotoxicity whilst a high activity may lead to cell death (Maejima et al. 2017). The most
prominent form of autophagy is macroautophagy (hereafter called autophagy-lysosomal
pathway, short ALP) that involves the formation of an autophagosome enclosing cellular debris
and fusing with a lysosome for degradation of its content. ALP is one of three major forms of
autophagy, next to chaperone-mediated autophagy (CMA) and microautophagy. CMA requires
the translocation of proteins via the chaperone complex into the lysosome whereas
microautophagy stimulates the degradation of cellular components/debris by direct
engulfment. In the human heart, solely the ALP and CMA but not microautophagy have been
described so far. Moreover, both have been shown to either be a selective or non-selective
process that degrades big bulks of cellular waste. To date, a few selective forms of autophagy
that degrade whole organelles have been described in the human heart (e.g. mitophagy,
glycophagy and lysophagy; Figure 1). Further, it has been assumed that ferritinophagy might
play a role in the human heart (Bravo-San Pedro et al. 2017; Delbridge et al. 2017; Zech et al.
2019).
The ALP with its single steps
To date, about 30 autophagy-related genes (ATG) are known in mammalian cells, that are
involved in the single steps of the quite complex ALP process (Figure 1). In brief, the ALP
process comprises phagophore nucleation and elongation, maturation into an autophagosome
and subsequent autophagosome-lysosome fusion for cargo degradation.
Introduction
10
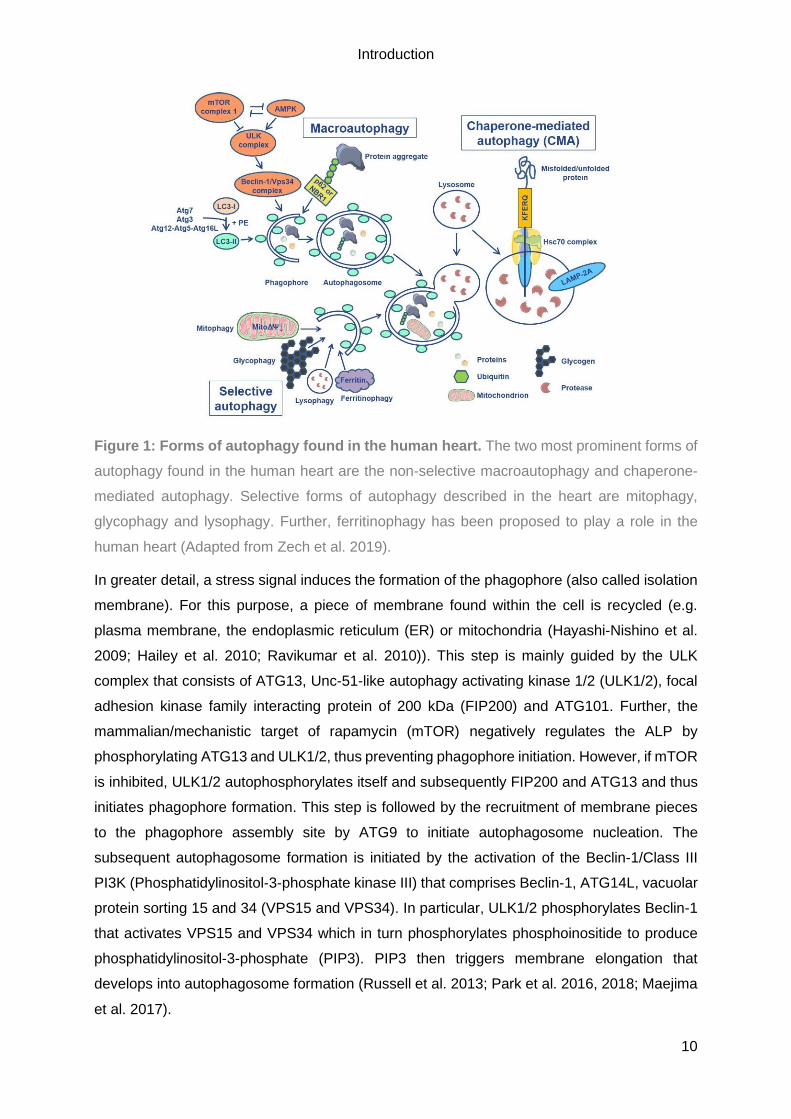
Figure 1: Forms of autophagy found in the human heart. The two most prominent forms of
autophagy found in the human heart are the non-selective macroautophagy and chaperone-
mediated autophagy. Selective forms of autophagy described in the heart are mitophagy,
glycophagy and lysophagy. Further, ferritinophagy has been proposed to play a role in the
human heart (Adapted from Zech et al. 2019).
In greater detail, a stress signal induces the formation of the phagophore (also called isolation
membrane). For this purpose, a piece of membrane found within the cell is recycled (e.g.
plasma membrane, the endoplasmic reticulum (ER) or mitochondria (Hayashi-Nishino et al.
2009; Hailey et al. 2010; Ravikumar et al. 2010)). This step is mainly guided by the ULK
complex that consists of ATG13, Unc-51-like autophagy activating kinase 1/2 (ULK1/2), focal
adhesion kinase family interacting protein of 200 kDa (FIP200) and ATG101. Further, the
mammalian/mechanistic target of rapamycin (mTOR) negatively regulates the ALP by
phosphorylating ATG13 and ULK1/2, thus preventing phagophore initiation. However, if mTOR
is inhibited, ULK1/2 autophosphorylates itself and subsequently FIP200 and ATG13 and thus
initiates phagophore formation. This step is followed by the recruitment of membrane pieces
to the phagophore assembly site by ATG9 to initiate autophagosome nucleation. The
subsequent autophagosome formation is initiated by the activation of the Beclin-1/Class III
PI3K (Phosphatidylinositol-3-phosphate kinase III) that comprises Beclin-1, ATG14L, vacuolar
protein sorting 15 and 34 (VPS15 and VPS34). In particular, ULK1/2 phosphorylates Beclin-1
that activates VPS15 and VPS34 which in turn phosphorylates phosphoinositide to produce
phosphatidylinositol-3-phosphate (PIP3). PIP3 then triggers membrane elongation that
develops into autophagosome formation (Russell et al. 2013; Park et al. 2016, 2018; Maejima
et al. 2017).
Introduction
11
The actual autophagosome formation, composed of elongation and maturation, is guided by
two ubiquitin-like conjugation systems, ATG7-ATG3 or ATG7-ATG10 and ATG12-ATG5-
ATG16L. More precisely, ATG7, an E1-like activating enzyme, and ATG10, an E2-like
conjugating enzyme, first activate and then conjugate ATG12 to ATG5 via a lysine residue. In
conjunction with ATG16L, the E3-like ligase complex is formed (ATG12-ATG5-ATG16L) that
associates to the phagophore membrane as a dimer. Concurrently, the cysteine protease
ATG4 cleaves microtubule-associated protein 1 light chain 3 (LC3), γ-aminobutyric acid
receptor-associated protein (GABARAP) and Golgi-associated ATPase enhancer of 16 kDa
(GATE-16) to reveal the C-terminal glycine. ATG7 then activates the cleaved LC3 (LC3-I),
which in turn is first conjugated with a phosphatidylethanolamine (PE) group, then transferred
to ATG3, before being incorporated into the autophagosomal membrane as LC3-II.
Autophagosomes are double-membraned vesicles, and LC3-II is incorporated into the outer
and inner autophagosomal membrane. Solely the exterior LC3-II can be recycled by ATG4 that
cleaves off PE. LC3-II located inside of the autophagosome is degraded along with the cargo.
Due to its presence within the whole ALP process, LC3-II is the main marker of the ALP.
Further, LC3-II can be used to evaluate the autophagic activity/flux of the ALP. For this
purpose, autophagy modulators such as Bafilomycin A1 (Bafilo) can be applied to block proper
autophagosome-lysosome fusion and thus autophagolysosomal degradation. By determining
the levels of LC3-II with and without modulator treatment, the activity of the ALP can be
determined. Moreover, LC3-II has also been described to play an important role in cargo
recognition (via p62 and neighbour of BRAC1 (NBR1)), autophagosome biogenesis
(elongation and membrane closure) and autophagosome-lysosome fusion. However, further
research is needed to elucidate the precise mode of action (Feng et al. 2014; Ghosh and
Pattison 2018; Zech et al. 2019).
For cargo degradation, the fusion of the autophagosome with a lysosome must take place.
Therefore, autophagosomes and lysosomes are transported along microtubules to the
perinuclear region. Autophagosomes that form all-over the cytoplasm are transported by
dynein, whereas the transport of lysosomes is pH-dependent (Korolchuk et al. 2011). The
fusion itself can either be a complete fusion, resulting in an autolysosome, or a kiss-and-run
fusion. In this case, solely from the autophagosome content is unidirectionally transferred to
the lysosomes in multiple ‘kissing’ events (Jahreiss et al. 2008). Key players of the fusion are
Rab GTPases (e.g. Rab7), membrane-tethering complexes and soluble N-ethylmaleimide-
sensitive-factor attachment receptors (SNAREs; for commentary, see Nakamura and
Yoshimori 2017). The lysosome-associated membrane protein-2 (LAMP-2) that is part of the
lysosomal membrane where it is involved in the lysosomal biogenesis, maturation and function
(Eskelinen 2006) seems to play a special role in the autophagosome-lysosome fusion. In
patients suffering from Danon disease, a LAMP-2 deficiency as well as an accumulation of

Introduction
12
autophagic vacuoles have been shown (Nishino et al. 2000; Hashem et al. 2015). Further, in
non-cardiomyocytes, LAMP-2 appears to facilitate the proper incorporation of syntaxin-17
(STX17; Qs-SNARE) into the autophagosomal membrane and thus enables an interaction with
vesicle-associated membrane protein 8 (VAMP8; R-SNARE) that is located on lysosomes. For
cardiomyocytes, a direct interaction of the isoform LAMP-2B with ATG14 and VAMP8 through
its cytosolic C-terminal coiled-coil domain has been shown to promote the fusion (Chi et al.
2019).
Within the autolysosome, all former cytoplasmic material is degraded by lysosomal hydrolases
(e.g. proteases, phosphatases, lipases). It is assumed that the autolysosome is then recycled
and becomes again a single-membraned lysosome, whereby the ‘former’ cellular waste has
been converted from macromolecules to its building blocks that can be used by the cell (e.g.
adenosine triphosphate (ATP), amino acids, fatty acids). To ensure proper degradation, an
acidic pH of ~4.5 must be maintained by ion channels and the vacuolar H+-ATPase (V-
ATPase). In case of incomplete degradation of the auto-lysosomal content, residual bodies
form (Eskelinen and Saftig 2009; Lawrence and Zoncu 2019).
Regulation of the ALP in human heart
The ALP is constantly active at a low basal level in human heart but multiple stimuli (e.g.
starvation) can induce its activation. To keep cellular homeostasis, a precise and accurate
regulation of the ALP is needed. The serine/threonine kinases mTOR and AMP-activated
protein kinase (AMPK) are the two most studied regulators of ALP in the heart (Figure 2).
mTOR is the master negative regulator of ALP and crucial for proliferation and protein
synthesis. Thus, it is activated under nutrient-rich conditions or by growth factors and inhibited
during starvation. To regulate the ALP in the heart, mTOR forms the mTORC1 complex
together with the regulatory-associated protein of mTOR (RAPTOR), mammalian lethal with
SEC13 protein 8 (mLST8), proline-rich AKT substrate of 40k Da (PRAS40) and DEP domain-
containing mTOR-interacting protein (DEPTOR). Under nutrient-rich conditions, growth factors
or insulin activate the phosphatidylinositol-3-kinase (PI3K) pathway that in turn activates
protein kinase B (PKB)/AKT. PKB/AKT in turn phosphorylates and thus inactivates tuberous
sclerosis protein 1 or 2 (TSC1/2), that normally inhibits mTOR. Thus, mTOR is active and the
ALP is inactivated. Autophagy modulators can inhibit mTOR, such as the ALP activator
rapamycin (Rapa). Rapa inhibits the mTOR kinase activity by forming a complex with FK506-
binding protein of 12 kDa (FKBP12) which in turn binds and stabilizes the RAPTOR-mTOR
complex. However, mTOR can also be inhibited by AMPK under low levels of nutrients.
Therefore, AMPK either phosphorylates RAPTOR directly or indirectly activates TSC1/2.
Further, AMPK also inhibits c-jun N-terminal kinase (JNK) and thus prevents the interaction of
Introduction
13
Beclin-1 and B-cell lymphoma 2 (Bcl-2) and activates the ALP. AMPK in turn can be inhibited
by energy suppliers.
mTORC1 can also be inhibited by glycogen synthase kinase 3 beta (GSK3β) that activates
TSC1/2 during energy stress, by the hexokinase-II (HK-II) under glucose deprivation or by
oxidation at Cys1483 during oxidative stress. In addition, microRNAs (miRNAs) have been
shown to regulate the ALP (e.g. miRNA-212 or miR-99a; Delbridge et al. 2017; Ghosh and
Pattison 2018; Sciarretta et al. 2018).
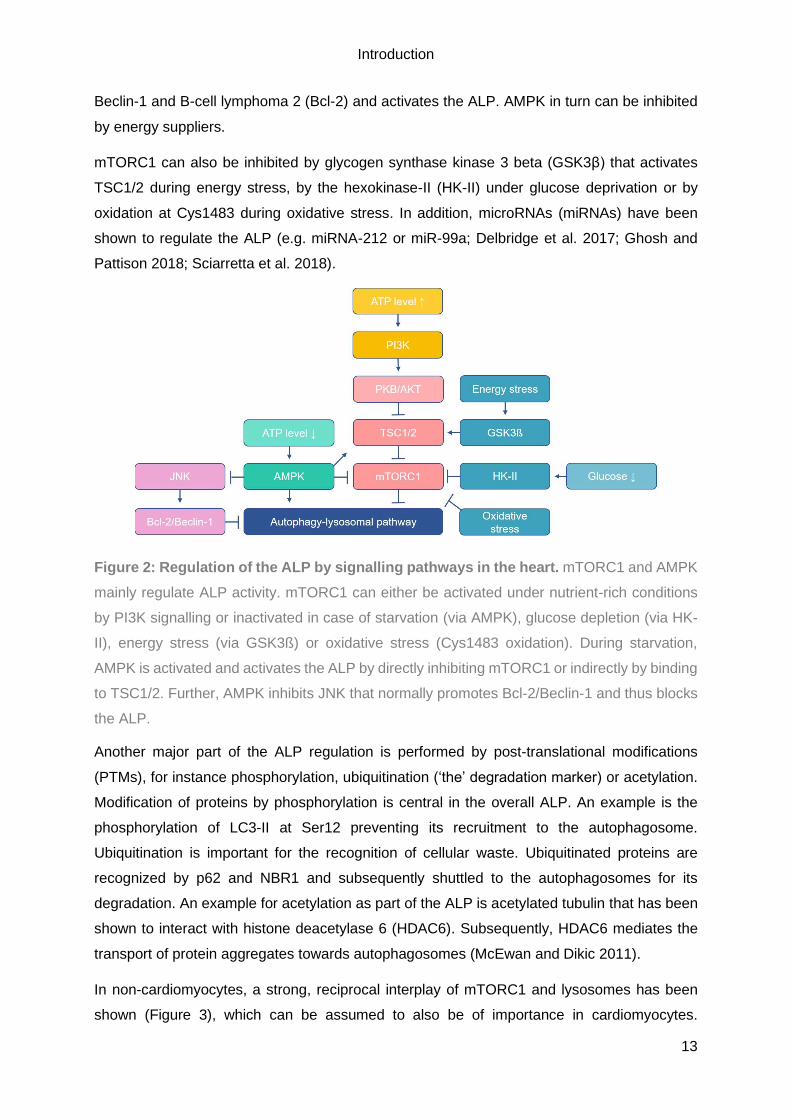
Figure 2: Regulation of the ALP by signalling pathways in the heart. mTORC1 and AMPK
mainly regulate ALP activity. mTORC1 can either be activated under nutrient-rich conditions
by PI3K signalling or inactivated in case of starvation (via AMPK), glucose depletion (via HK-
II), energy stress (via GSK3ß) or oxidative stress (Cys1483 oxidation). During starvation,
AMPK is activated and activates the ALP by directly inhibiting mTORC1 or indirectly by binding
to TSC1/2. Further, AMPK inhibits JNK that normally promotes Bcl-2/Beclin-1 and thus blocks
the ALP.
Another major part of the ALP regulation is performed by post-translational modifications
(PTMs), for instance phosphorylation, ubiquitination (‘the’ degradation marker) or acetylation.
Modification of proteins by phosphorylation is central in the overall ALP. An example is the
phosphorylation of LC3-II at Ser12 preventing its recruitment to the autophagosome.
Ubiquitination is important for the recognition of cellular waste. Ubiquitinated proteins are
recognized by p62 and NBR1 and subsequently shuttled to the autophagosomes for its
degradation. An example for acetylation as part of the ALP is acetylated tubulin that has been
shown to interact with histone deacetylase 6 (HDAC6). Subsequently, HDAC6 mediates the
transport of protein aggregates towards autophagosomes (McEwan and Dikic 2011).
In non-cardiomyocytes, a strong, reciprocal interplay of mTORC1 and lysosomes has been
shown (Figure 3), which can be assumed to also be of importance in cardiomyocytes.

Introduction
14
mTORC1 actively regulates the transcription of ATG and lysosomal genes by phosphorylating
and thus inhibiting the transcription factor EB (TFEB). Further, active mTORC1 is located on
peripheral lysosomes. Here it binds and inhibits the ATP-sensitive Na+-channel that is part of
the lysosomal membrane. However, once mTORC1 is inactivated, it disembarks from the
lysosomes, inducing the opening of the ATP-sensitive Na+-channel. This process is modulated
by lysosomes that can sense the level of amino acids within its lumen through the interaction
of the V-ATPase with Ragulator. Ragulator anchors Rag guanosine triphosphatases
(GTPases) to the lysosomal membrane that in turn translocate active mTORC1 towards the
lysosomal membrane. If starvation persists for a longer period, mTORC1 can be re-activated
to enable autophagic-lysosomal reformation (Puertollano 2014; Lawrence and Zoncu 2019).
Figure 3: A strong, reciprocal interconnection between mTORC1 and lysosomes as part
of the ALP regulation. Active mTORC1 inhibits ALP activation under nutrient-rich conditions
(see left part). Therefore, mTORC1 inhibits ULK1/2, TFEB and the Na+-channel. Concurrently,
lysosomes are transported towards cell periphery. In contrast, during starvation, mTORC1 is
inactivated and thus TFEB translocates into the nucleus (1), autophagic and lysosomal genes
are transcribed (2), the ALP is activated (3) and the Na+-channel opens (5; see right part).
Prolonged starvation periods induce mTORC1 re-activation to induce autophagic-lysosomal
reformation (6; Puertollano 2014). RHEB = Ras homolog enriched in brain; TFE3 =
Transcription factor binding to IGHM enhancer 3; ZKSCAN3 = Zinc finger with KRAB and
SCAN domains 3. Figure was taken from Puertollano 2014.
Introduction
15
The role of the ALP in cardiac disease
The heart represents an organ with high energy demand but low regenerative potential. Thus,
the heart is highly depending on autophagy as part of the protein quality control machinery,
especially during disease. Here, it prevents the accumulation of toxic protein aggregates
(Tannous et al. 2008; Sandri and Robbins 2014). Nonetheless, only a few human inherited
cardiomyopathies have been shown to be associated with defective autophagy so far. The
reported cases always show a mutation in a protein that plays a crucial role within the
ALP/autophagy. The first example is Danon disease, an X-linked disorder that is clinically
characterized by a mild retardation, skeletal myopathy and cardiac hypertrophy. On a
molecular basis, characteristics are LAMP-2 deficiency and accumulation of autophagosomes
due to an impaired autophagosome-lysosome fusion (Nishino et al. 2000; Hashem et al. 2015).
Another example is the rare, multi-systemic disorder Vici syndrome, which is also associated
with defective autophagy and cardiomyopathy. In this case, recessive mutations have been
identified in the ectopic P-granules autophagy protein 5 (EPG5), which in turn plays a crucial
role in autophagosome maturation and autophagosome-lysosome fusion (Cullup et al. 2013;
Balasubramaniam et al. 2017). The last example is a patient with left ventricular non-
compaction (LVNC) and recessive dilated cardiomyopathy (DCM), who carries a mutation in
pleckstrin homology domain containing, family M member 2 (PLEKHM2), a protein that is
important for endosome localization. Not surprisingly, an impaired autophagic flux was
detected in the primary fibroblasts of the patient (Muhammad et al. 2015). The role of the ALP
in the pathogenesis of hypertrophic cardiomyopathy (HCM) is still not fully understood,
although it represents the most common inherited cardiomyopathy. In septal myectomies of
HCM patients carrying either a cardiac myosin-binding protein C (MYBPC3) or beta-myosin
heavy chain (MYH7) mutation, an increased number of autophagosomes and higher protein
levels of LC3-II and Beclin-1 were detected (Song et al. 2014). Our group showed higher
protein levels of LC3-II but unchanged protein levels of Beclin-1 and p62 in septal myectomies
of HCM patients carrying MYBPC3 in comparison to non-failing samples (Singh et al. 2017).
Furthermore, we showed impaired autophagic flux in an HCM mouse model carrying a
homozygous Mybpc3 mutation that was ameliorated by autophagy activation (Singh et al.
2017). These findings indicate a crucial role of the ALP in the pathogenesis of HCM, but to
conclude whether the ALP is activated or impaired in the human heart, the evaluation of the
autophagic flux in hiPSC-CMs is needed. This should be performed in combination with gene
and protein expression analysis for the correct interpretation of the role of the ALP in the human
heart (Dorsch et al. 2019; Zech et al. 2019).

Introduction
16
1.2. Human inherited cardiomyopathies
Human inherited cardiomyopathies represent quite a heterogenous group of diseases of the
myocardium that are associated with mechanical and/or electrical dysfunction of the heart.
Further characteristics are either a ventricular hypertrophy or dilatation. Symptoms vary from
none to fatigue or chest pain to heart failure (Maron et al. 2006). The two most common forms
of human inherited cardiomyopathies are HCM and DCM. HCM is mainly characterized by a
thickened left ventricle and septum due to increased cardiomyocyte size (Figure 4, middle;
Maron et al. 2006).
Figure 4: Representation of a hypertrophic and a dilated heart in comparison to a normal
heart. Shown is a normal heart (left), an HCM heart (middle) and a DCM heart (right) with the
different regions of the heart indicated. The thickening of the left ventricle and septum found in
a HCM heart is depicted in the middle. An enlarged left ventricle, a hallmark of a DCM heart,
is represented on the right. Adapted figure taken from the Mayo clinic website.
Further characteristics of HCM are myocardial disarray, increased interstitial fibrosis and
diastolic dysfunction. Although HCM is rather common with an estimated prevalence of 1:200
to 1:500 in the general population, independent of sex, ethnicity or geographic origin, a
substantial portion of mutation carriers do not show any symptoms (Maron et al. 2014;
Semsarian et al. 2015). However, women suffering from HCM have an overall worse survival
(Geske et al. 2017). HCM can be clinically present at any age and is the most common cause
of sudden cardiac death in young athletes. Moreover, HCM accounts for 36% of cases of
sudden cardiac death of cardiac etiology (Goff and Calkins 2019). Effective treatments, such
as implantable cardioverter-defibrillators (ICDs), surgical septal myectomies or heart
transplantation, are available and have lowered the HCM-related mortality rate to <1%/year
(Maron et al. 2014). HCM is an autosomal-dominant inherited disease and is caused by
mutations in mainly 11 genes encoding sarcomeric proteins, whereby MYBPC3 and MYH7
account over 50% of all mutations (Marian and Braunwald 2017). Most mutations are
Introduction
17
heterozygous and thus, disease onset appears to depend on the amount of mutant protein.
HCM is considered as a sarcomeropathy since more than 1400 mutations in genes encoding
sarcomeric proteins were identified (van der Velden and Stienen 2019). Although, solely ~50%
of HCM cases are associated with a likely pathogenic or pathogenic mutation and thus
inherited (Goff and Calkins 2019). Nonetheless, the vast number of identified mutations and
the diverse clinical manifestation indicate that HCM is a very unpredictable, heterogenous and
complex disease (van der Velden and Stienen 2019).
DCM is mainly characterized by systolic dysfunction and an enlarged heart with thinned walls,
due to hyperplasia of the left ventricle (Figure 4, right part). Patients suffering from DCM
commonly progress to heart failure, either due to pump failure (~70%) or sudden cardiac death
(~30%; Schultheiss et al. 2019). Hence, it is not surprising that DCM is the most common
cause of heart transplantation (Maron et al. 2006). The estimated prevalence of DCM in the
general population is still under investigation. Estimations vary from 1:250 to 1:2700, whereby,
similar to HCM, a vast discrepancy is found between the frequencies of variants that are
supposed to be disease-causing or mutations associated with DCM and incidence/clinical data
of DCM. Furthermore, some studies indicated that the prevalence of DCM seems to vary
according to sex or ethnicity (McNally and Mestroni 2017; Halliday et al. 2018) but large, multi-
ethnic studies with patients varying in age and sex are needed to conclude on this.
Interestingly, black people have an almost 3-fold higher risk for developing DCM and an 1.5 to
2-fold higher risk for dying of DCM (Bozkurt et al. 2016). Furthermore, women suffering from
DCM seem to have an overall better survival (Halliday et al. 2018) in contrast to women
suffering from HCM (see above; Geske et al. 2017). Nonetheless, DCM can occur at all ages
but is mostly present in individuals aged 20 to 50 years (Schultheiss et al. 2019). The current
therapeutic options for DCM comprise angiotensin-converting enzymes (ACE) inhibitors, ß-
blockers, cardiac resynchronization therapy (CRT) alone in form of a pacemaker or in
combination with an ICD, and heart transplantation (Bozkurt et al. 2016; Schultheiss et al.
2019). DCM can either be acquired, inherited or idiopathic, whereby acquired forms result from
different causes, such as (viral) infections, toxins or allergens, pregnancy, systemic endocrine
or autoimmune disease (Maron et al. 2006; Bozkurt et al. 2016; McNally and Mestroni 2017;
Schultheiss et al. 2019). In case of idiopathic DCM, the underlying cause has not been
identified yet. About 20 to 35% of DCM cases are reported as inherited, whereby mutations
were identified in several sarcomeric genes as well as in genes encoding Z-disk proteins,
calcium- or potassium channels, the nuclear envelope, heat-shock chaperones and
mitochondrial proteins (Bozkurt et al. 2016; McNally and Mestroni 2017; Schultheiss et al.
2019). To date, mutations in >50 different genes have been associated with DCM. Most of
these mutations are inherited in an autosomal-dominant pattern with variable expression and
penetrance (Braunwald 2017). However, also autosomal-recessive and X-linked inheritance

Introduction
18
has been described. The most common mutations are truncating mutations of titin (TTN) that
account for ~25% of inherited DCM (Herman et al. 2012). Other mutations have been identified
in lamin A/C (LMNA), MYH7 and phospholamban (PLN; McNally and Mestroni 2017).
Altogether, DCM is less well studied than HCM but seems to be even more complex. Not only
is the clinical manifestation very heterogenous but also a genetically heterogeneity is
established in DCM. Furthermore, most DCM-associated mutations are very rare and the
disease progression of DCM varies a lot (Braunwald 2017; Schultheiss et al. 2019).
1.3. Cardiac myosin-binding protein C
The cardiac myosin-binding protein C (cMyBP-C) is encoded by the MYBPC3 gene, which is
the most commonly mutated genes in HCM (see above; Braunwald 2017). MYBPC3 is
composed of 35 exons that build up to a 21 kbp gene (see Figure 5). Further, MYBPC3
encodes a 150 kDa protein, which in turn consists of eight immunoglobulin-like and three
fibronectin-like domains (Carrier et al. 1997).
Figure 5: Schematic depiction of the MYBPC3 gene, its mRNA and protein structure. A
total of 35 exons (yellow boxes) are stretched along the 21 kbp genomic sequence. The gene
is transcribed into a 3824 bp mRNA-transcript, which in turn is translated into a 1274-amino-
acid protein consisting of eight immunoglobulin-like (C0, C1, C2, C3, C4, C5, C8 and C10; in
pink) and three fibronectin-type III (C6, C7 and C9; in blue) domains. A proline-alanine rich
domain (PA) is located between C0 and C1. A linker region is found between C4 and C5. A
cardiac specific region is the M-motif (purple), next to the C0 domain and a 28-amino-acid
insertion in the C5 domain. Incorporation of cMyBP-C within the A-band is mediated by the
C6-10 domains. Below the interactome of cMyBP-C is visualized. The C0-M region interacts
with F-actin, C1-M-C2 with the myosin-S2 domain. The C-terminus of cMyBP-C mediates the
interaction with four-and-a-half-LIM domain proteins (C6-10), titin (C8-10) and Myosin-LMM
(light meromyosin; C10). Based on Carrier et al. 2015 and UniProt website (Q14896).
Introduction
19
In mammals, MYBPC3 is exclusively expressed in the heart, whereas two other two isoforms,
MYBPC1 and MYBPC2, are expressed in the skeletal muscle (Fougerousse et al. 1998). Three
unique features distinguish cMyBP-C from the slow (MYBPC1) and fast skeletal (MYBPC2)
isoforms: the N-terminal C0 domain, the MyBP-C motif (M-motif) with four additional
phosphorylation sites and 28 additional amino acids (AAs) within the C5 domain (Gautel et al.
1995; Carrier et al. 1997, 2015).
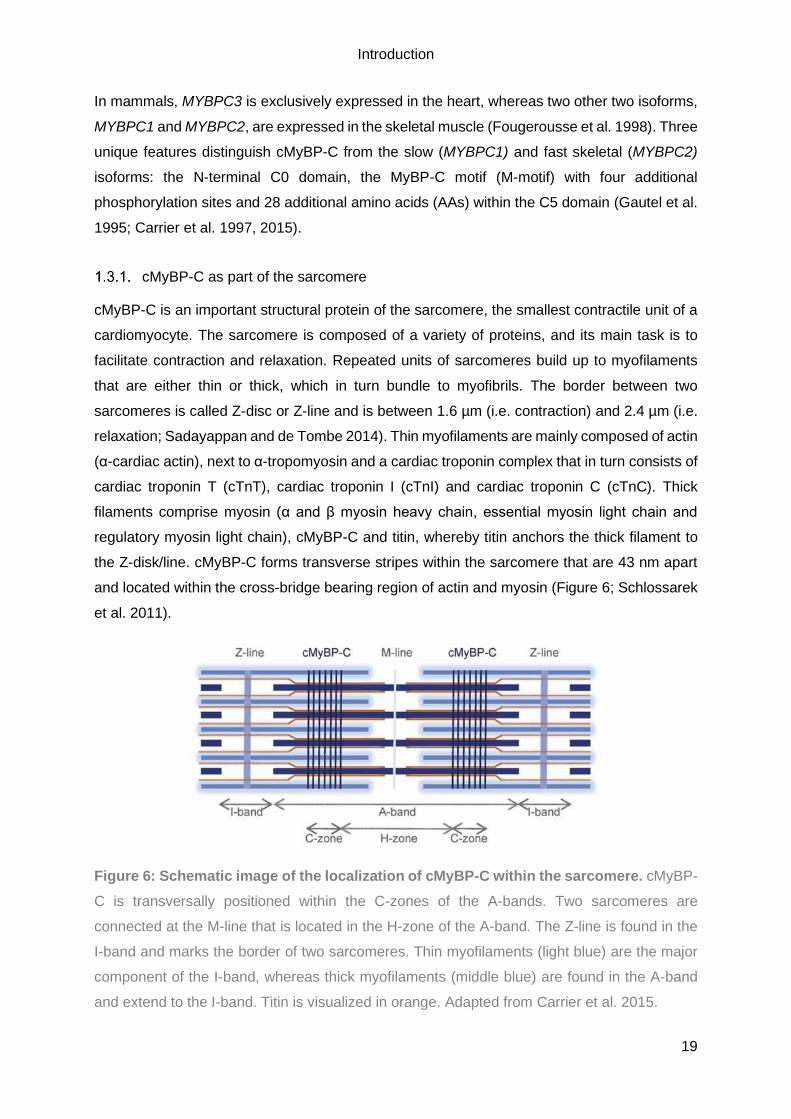
cMyBP-C as part of the sarcomere
cMyBP-C is an important structural protein of the sarcomere, the smallest contractile unit of a
cardiomyocyte. The sarcomere is composed of a variety of proteins, and its main task is to
facilitate contraction and relaxation. Repeated units of sarcomeres build up to myofilaments
that are either thin or thick, which in turn bundle to myofibrils. The border between two
sarcomeres is called Z-disc or Z-line and is between 1.6 µm (i.e. contraction) and 2.4 µm (i.e.
relaxation; Sadayappan and de Tombe 2014). Thin myofilaments are mainly composed of actin
(α-cardiac actin), next to α-tropomyosin and a cardiac troponin complex that in turn consists of
cardiac troponin T (cTnT), cardiac troponin I (cTnI) and cardiac troponin C (cTnC). Thick
filaments comprise myosin (α and β myosin heavy chain, essential myosin light chain and
regulatory myosin light chain), cMyBP-C and titin, whereby titin anchors the thick filament to
the Z-disk/line. cMyBP-C forms transverse stripes within the sarcomere that are 43 nm apart
and located within the cross-bridge bearing region of actin and myosin (Figure 6; Schlossarek
et al. 2011).
Figure 6: Schematic image of the localization of cMyBP-C within the sarcomere. cMyBP-
C is transversally positioned within the C-zones of the A-bands. Two sarcomeres are
connected at the M-line that is located in the H-zone of the A-band. The Z-line is found in the
I-band and marks the border of two sarcomeres. Thin myofilaments (light blue) are the major
component of the I-band, whereas thick myofilaments (middle blue) are found in the A-band
and extend to the I-band. Titin is visualized in orange. Adapted from Carrier et al. 2015.
Introduction
20
However, the exact organization of cMyBP-C within the sarcomere and its interaction with
myosin is still under discussion. At present, there are two structural models: the trimeric collar
model (Flashman et al. 2004, 2008) and the strut model (Squire et al. 2003; Schlossarek et al.
2011). The trimeric collar model proposes that three cMyBP-C molecules form a collar-like
structure by interacting at the C5-C10 domains and then wrap around a myosin filament
(Flashman et al. 2008). In contrast, the strut model suggests the interaction of the C-terminus
of cMyBP-C that is bound to a thick filament, with the N-terminus of cMyBP-C that is bound to
a thin filament (Squire et al. 2003). cMyBP-C is thought to interact with myosin via its rod region
(Lange et al. 2013). Further, cMyBP-C interacts with several sarcomeric proteins as visualized
in Figure 5, for instance actin or titin. Due to its location and interaction within the sarcomere,
cMyBP-C plays a crucial role in sarcomere organization (Schlossarek et al. 2011).
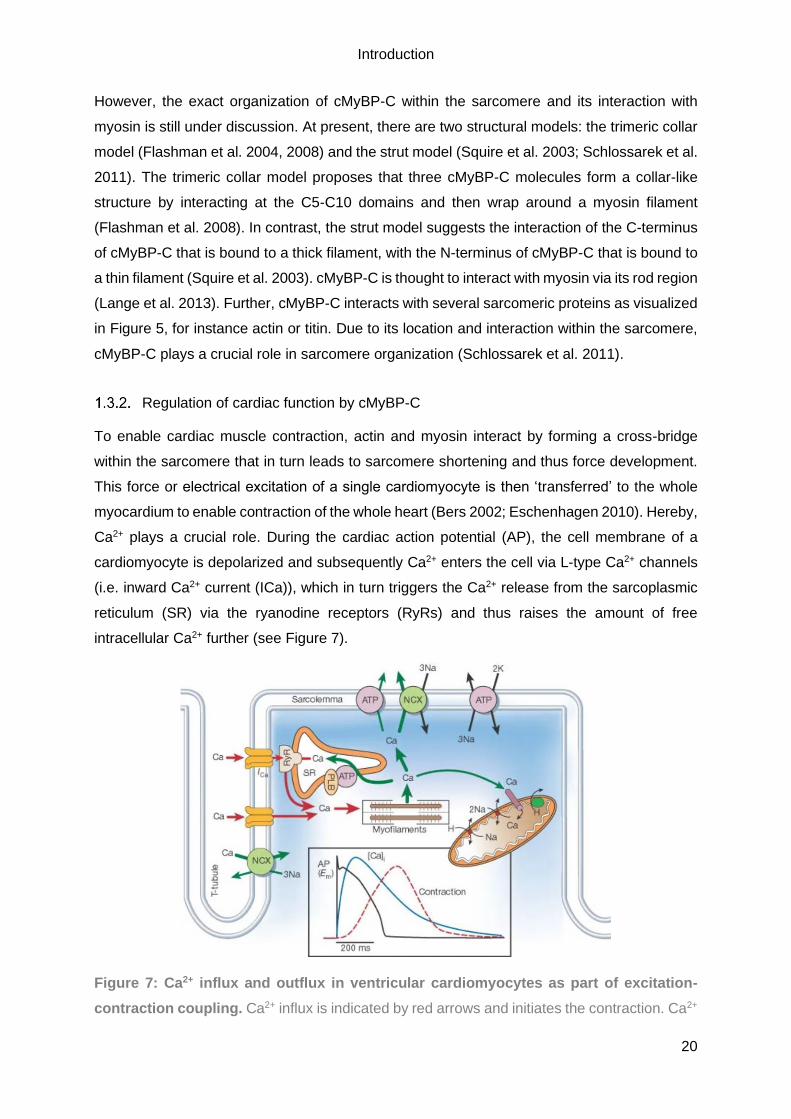
Regulation of cardiac function by cMyBP-C
To enable cardiac muscle contraction, actin and myosin interact by forming a cross-bridge
within the sarcomere that in turn leads to sarcomere shortening and thus force development.
This force or electrical excitation of a single cardiomyocyte is then ‘transferred’ to the whole
myocardium to enable contraction of the whole heart (Bers 2002; Eschenhagen 2010). Hereby,
Ca2+ plays a crucial role. During the cardiac action potential (AP), the cell membrane of a
cardiomyocyte is depolarized and subsequently Ca2+ enters the cell via L-type Ca2+ channels
(i.e. inward Ca2+ current (ICa)), which in turn triggers the Ca2+ release from the sarcoplasmic
reticulum (SR) via the ryanodine receptors (RyRs) and thus raises the amount of free
intracellular Ca2+ further (see Figure 7).
Figure 7: Ca2+ influx and outflux in ventricular cardiomyocytes as part of excitation-
contraction coupling. Ca2+ influx is indicated by red arrows and initiates the contraction. Ca2+

Introduction
21
outflux into the cytosol or influx into the mitochondria is indicated by green arrows resulting in
relaxation due to decreasing Ca2+ -levels. A time course of a typical action-potential (black line)
is shown at the bottom, whereby the Ca2+ transient (blue line) and the contraction (dotted red
line) itself were measured in a rabbit ventricular myocyte. ATP = ATPase; Em = Membrane
potential of sarcolemma; PLB = Phospholamban (Bers 2002).
The free intracellular Ca2+ then binds to cTnC, which in turn binds to cTnI. This allows cTnT
and tropomyosin to move to the cleft of actin and myosin is thus able to form a cross-bridge
with actin, a process that is ATP-driven. In the two heads of each myosin, ATPases are
localized that hydrolyse ATP and thus facilitate the interaction with actin. For relaxation of the
cardiomyocyte, the intracellular Ca2+ concentration has to decrease. Therefore, Ca2+ is actively
transported into the SR via the SR Ca2+ ATPase (SERCA) and out of the cell via the sodium-
calcium exchanger (NCX). In addition, intracellular Ca2+ can be transported out of the cytosol
via the mitochondrial Ca2+-uniport or the sarcolemma Ca2+-ATPase. Due to the lower
intracellular Ca2+ levels, cTnT and tropomyosin move back to the cTnI and thus actin and
myosin cannot form cross-bridges any longer. The cross-bridge formation can be modulated
by proteins of the thin and the thick myofilaments, such as cMyBP-C. Due to its localization
within the cross-bridge bearing region, cMyBP-C determines the force and speed of the
contraction via phosphorylation (Schlossarek et al. 2011) and is required for complete
relaxation of the sarcomere (Bers 2002; Pohlmann et al. 2007; Eschenhagen 2010). Thus,
cMyBP-C is crucial for normal cardiac function and its alteration can have detrimental effects
on the heart, as observed in the pathogenesis of HCM.
cMyBP-C in HCM
To date, about 350 individual MYBPC3 mutations have been identified in HCM (Carrier et al.
2015), accounting for ~35% of all HCM mutations. In several populations, MYBPC3 founder
mutations have been identified, such as the c.772G>A mutation found in Tuscany, Italy
(Olivotto et al. 2008; Vignier et al. 2009). In general, MYBPC3 mutations are associated with
a delayed onset, a lower penetrance, a lower degree of hypertrophy, and an overall better
survival. However, a few MYBPC3 mutations have been associated with progressive heart
failure, stroke and sudden cardiac death (Schlossarek et al. 2011). The majority of the
MYBPC3 mutations introduce a frameshift that leads to a premature termination codon (PTC)
and subsequently, a truncated form of cMyBP-C. Hereby, the C-terminus of cMyBP-C is
affected and thus the major myosin and/or titin-binding sites are missing (Behrens-Gawlik et
al. 2014). Normally, you would expect that the truncated protein is incorporated into the
sarcomere where it alters the function and thus acts as a ‘poison peptide’. However, this does
not seem to be the case for HCM patients carrying a MYBPC3 mutation. To date, truncated
forms of cMyBP-C were not detected by immunoblotting in myocardial samples, implying the
Introduction
22
degradation of the truncated protein (Marston et al. 2009; van Dijk et al. 2009). Since most of
the MYBPC3 mutations in HCM are heterozygous, the absence of truncated cMyBP-C should
result in an ‘disease-causing’ haploinsufficiency (Marston et al. 2009; van Dijk et al. 2009).
Despite this knowledge, it is still not fully understood how mutations in the MYBPC3 gene
cause HCM on a molecular level.
1.4. Human induced pluripotent stem cells
To better understand the pathogenesis and pathophysiology of inherited cardiac diseases,
human in vitro disease models are needed. Human myocardial tissue samples are an
important and precious tool within cardiac research field that provide fundamental knowledge,
but they are very limited in availability, in quantity and in applicability. To date, animal models
are widely used in cardiac research, such as mice and rats (for instance Singh et al. 2017;
Krause et al. 2018) that contributed enormously to our understanding of the pathogenesis and
pathophysiology of human inherited cardiac disease. However, there is a considerable
discrepancy between the murine and human cardiac system and thus in vivo findings are not
directly transferable. Already in 1998, a human embryonic stem cell (hESC) cell line was
generated from human blastocysts, laying the groundwork of human in vitro stem cell research
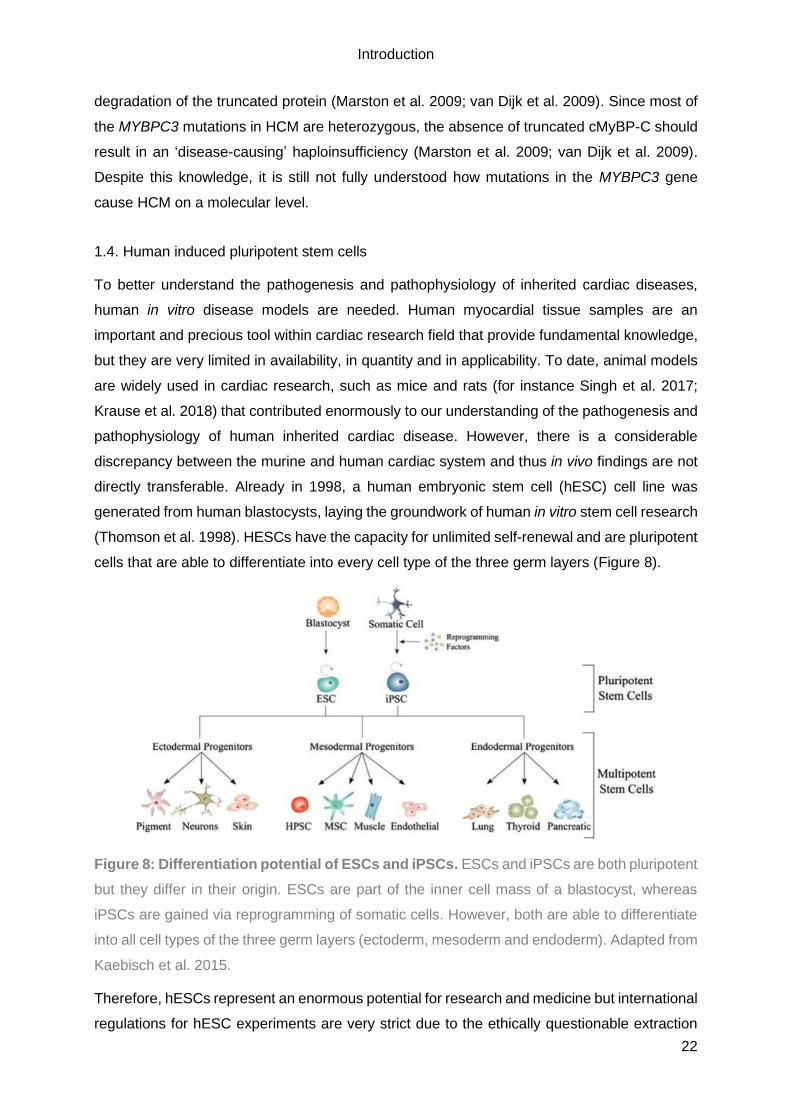
(Thomson et al. 1998). HESCs have the capacity for unlimited self-renewal and are pluripotent
cells that are able to differentiate into every cell type of the three germ layers (Figure 8).
Figure 8: Differentiation potential of ESCs and iPSCs. ESCs and iPSCs are both pluripotent
but they differ in their origin. ESCs are part of the inner cell mass of a blastocyst, whereas
iPSCs are gained via reprogramming of somatic cells. However, both are able to differentiate
into all cell types of the three germ layers (ectoderm, mesoderm and endoderm). Adapted from
Kaebisch et al. 2015.
Therefore, hESCs represent an enormous potential for research and medicine but international
regulations for hESC experiments are very strict due to the ethically questionable extraction

Introduction
23
method of hESCs out of the inner cell mass of human embryos that are ‘left-overs’ from fertility
treatments. The ‘real’ breakthrough of stem cell research occurred in 2006 with the generation
of mouse induced-pluripotent stem cells (iPSC) from embryonic and adult mouse fibroblasts.
The fibroblasts were reprogrammed solely by adding four transcription factors Klf4, c-myc,
Oct4 and Sox2 (Takahashi and Yamanaka 2006). The obtained mouse iPSCs possessed the
same self-renewal and pluripotency capacity as hESCs and thus were able to differentiate into
all cell types of the three germ layers (see Figure 8). Only one year later, a protocol for the
generation of human induced-pluripotent stem cells (hiPSCs) from human dermal fibroblasts
was published (Takahashi et al. 2007). In the last decade, hiPSC research rapidly grew and
the overall procedure was substantially improved. Today, the generation of hiPSCs of all kind
of human cell types is established, for instance from peripheral blood cells (Kim et al. 2016;
Okumura et al. 2019). Moreover, the reprogramming was further evolved, by stepping away
from retroviral transduction with the disadvantage of integration and constitutive expression of
the reprogramming factors, towards a non-integrative reprogramming with Sendai-virus
(Schlaeger et al. 2015). HiPSCs enable in vitro research on post-mitotic cell types such as
cardiomyocytes or neurons, since efficient differentiation protocols have been established
(Karumbayaram et al. 2009; Breckwoldt et al. 2017). In spite of representing this powerful
human in vitro tool, researchers encounter problems, such as clone-to-clone variations or
batch-to-batch differences (Musunuru et al. 2018). Further, it has been shown that one hiPSC
clone that possesses a growth advantage, is able to overgrow the whole culture within a few
weeks (Brenière-Letuffe et al. 2018). This is particularly problematic in the context of karyotypic
abnormalities that hiPSCs are prone to acquire with increasing passage number (Taapken et
al. 2011), or somatic mutations that hiPSCs are known to acquire during and after
reprogramming in culture (Gore et al. 2011). Although hiPSC generation and cultivation are
still vulnerable and require thorough optimization, hiPSCs are a powerful and versatile human
in vitro tool.
1.5. Human induced-pluripotent stem cell-derived cardiomyocytes
Due to the unlimited self-renewal, pluripotency and the absence of ethical concerns, hiPSCs
are the eligible tool to access cell types with a low regenerative potential, such as
cardiomyocytes. Since the discovery of hiPSCs in 2007, a lot of effort was made to develop
cardiac differentiation protocols. Hereby, the underlying molecular mechanisms of the
participating signalling pathways during mammalian embryological heart development are
mimicked. Therefore, hiPSCs are either cultured as a monolayer or within a suspension by
forming cell aggregates, so-called embryoid bodies (EB; Breckwoldt et al. 2017; Palpant et al.
2017). Either way, stage-specific application of growth factors in defined media is used to first
induce mesodermal lineage and subsequently the cardiac specification to generate hiPSC-

Introduction
24
derived cardiomyocytes (hiPSC-CMs; Mummery et al. 2012). The application possibilities are
versatile since hiPSC-CMs can be generated indefinitely, functionally characterized in vitro and
possess the genome of the donor. Furthermore, hiPSCs can be generated from every human
being, healthy or diseased, and subsequently differentiated into cardiomyocytes. Thus, it is
feasible to study human inherited cardiac diseases in vitro, termed disease modelling. This
can be combined with the targeted genetic modification of a gene locus of interest to either
introduce or remove a mutation on hiPSC level (Hinson et al. 2015; Mosqueira et al. 2018).
Although effective disease modelling with (gene-edited) hiPSC-CMs has been shown, the data
differs strongly. For instance, the parameter cell size differs greatly, as in the actually size as
also the extend of the increase between studies and HCM or DCM hiPSC-CMs. Thus, there is
a great need for quantitative comparisons and robust, high content assay (Eschenhagen and
Carrier 2018). Nonetheless, disease modelling with (gene-edited) hiPSC-CMs seems to be the
tool of choice to ultimately develop novel therapeutic approaches (Figure 9; Eschenhagen et
al. 2015; Musunuru et al. 2018; Prondzynski et al. 2019).
Figure 9: Applications of hiPSCs in biomedical research. By taking a skin biopsy of a
patient, fibroblasts can be isolated and subsequently reprogrammed into patient-specific
hiPSCs with four transcription factors (Takahashi et al. 2007). Either these patient-specific
hiPSCs are directly differentiated into the cell type of interest, in our case cardiomyocytes, or
are gene-edited, e.g. by CRISPR/Cas9, to either repair a disease-causing mutation in diseased
hiPSCs or to introduce a disease-causing mutation in hiPSCs of a healthy individual. The whole

Introduction
25
procedure aims to study the disease in a human in vitro model to develop therapeutic
approaches on the long run.
1.6. CRISPR/Cas9-based genome editing
Genome editing is an important and versatile tool in basic, biomedical and biotechnological
research that enables the precise and targeted alteration of the gene locus of interest. In the
last 15 years, a number of genome editing technologies have emerged, such as zinc finger
nucleases (ZFNs; Urnov et al. 2005; Miller et al. 2007) and transcription activator-like effector
nucleases (TALENs; Hockemeyer et al. 2011). Either way, an endonuclease catalytic domain
is tethered to a DNA-binding protein to introduce a targeted DNA double-strand break (DSB)
at the investigated genomic loci. Subsequently, the cell’s DNA repair-machinery is used for
site-specific alteration (Ran et al. 2013). ZFNs are a combination of the cleavage domain of
Fok1 and a designed zinc-finger protein. It was shown that ZFNs can be used to precisely edit
site-specific sequences or to integrate whole genes (Urnov et al. 2005; Miller et al. 2007;
Moehle et al. 2007). The DNA binding domain of TALENs consists of multiple units of ~34 AAs
(TALE repeats) that are nearly identical (only two AAs difference) and are arranged in tandems.
For each gene editing approach, the DNA binding domain is specific and tethered to a
nuclease, enabling site-specific alteration with TALENs (Hockemeyer et al. 2011). However,
the ‘real’ breakthrough in genome editing was the discovery of the clustered regularly
interspaced short palindromic repeats (CRISPR)/CRISPR-associated (Cas) system as part of
the adaptive immune system in bacteria and archaea. In short, the host specifically
incorporates short sequences (20 bp ‘protospacer’) from the invader (virus or plasmid) into the
CRISPR gene locus. Upon transcription and processing, small crRNAs (CRISPR RNAs) are
formed that guide a multifunctional Cas-protein complex, containing the Cas9 nuclease, to the
anew incoming foreign genetic elements, which subsequently performs cleavage. The Cas9
nuclease expression cassette as well as the trans-activating crRNA (tracrRNA) are part of the
CRISPR gene locus. A DSB is solely introduced by the Cas9 nuclease if a protospacer-
adjacent motif (PAM) is present at the 3’-end of the 20 bp protospacer. Hereby, the self-
targeting of the CRISPR locus by the Cas-protein complex is prevented. To further clarify, the
CRISPR/Cas system in Streptococcus thermophilus, which is relatively simple and well-
studied, is displayed in Figure 10 (Bhaya et al. 2011).
Introduction
26
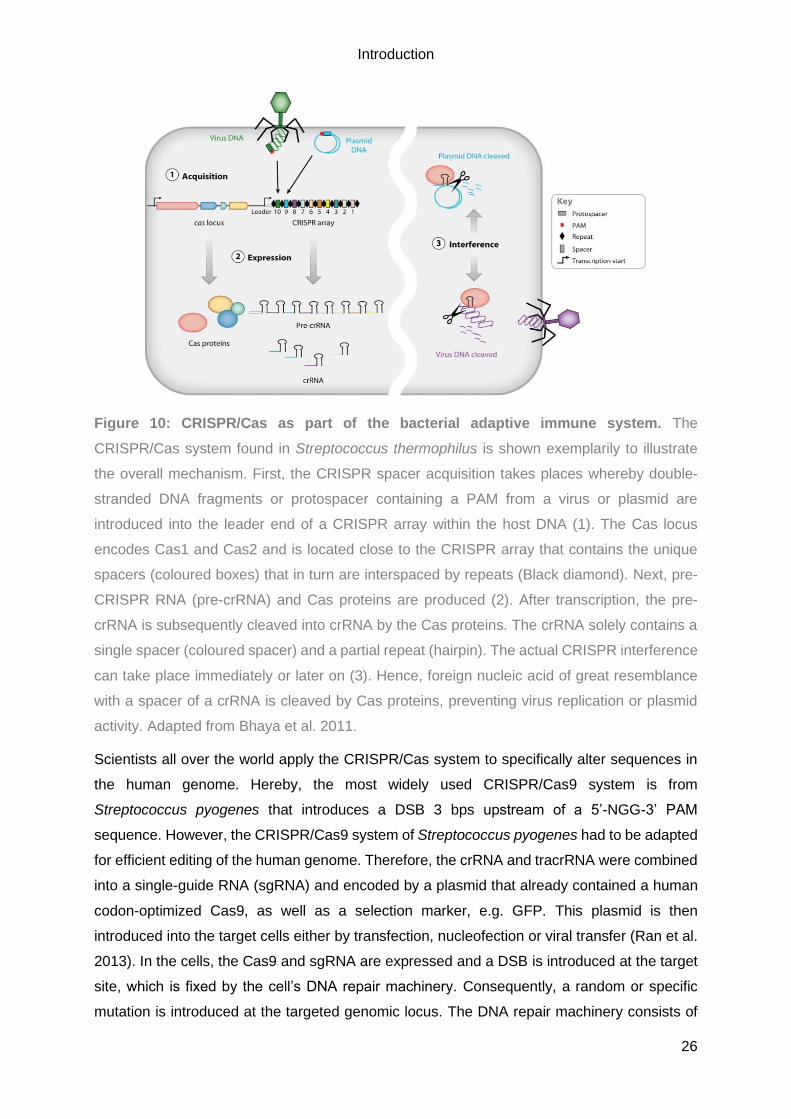
Figure 10: CRISPR/Cas as part of the bacterial adaptive immune system. The
CRISPR/Cas system found in Streptococcus thermophilus is shown exemplarily to illustrate
the overall mechanism. First, the CRISPR spacer acquisition takes places whereby double-
stranded DNA fragments or protospacer containing a PAM from a virus or plasmid are
introduced into the leader end of a CRISPR array within the host DNA (1). The Cas locus
encodes Cas1 and Cas2 and is located close to the CRISPR array that contains the unique
spacers (coloured boxes) that in turn are interspaced by repeats (Black diamond). Next, pre-
CRISPR RNA (pre-crRNA) and Cas proteins are produced (2). After transcription, the pre-
crRNA is subsequently cleaved into crRNA by the Cas proteins. The crRNA solely contains a
single spacer (coloured spacer) and a partial repeat (hairpin). The actual CRISPR interference
can take place immediately or later on (3). Hence, foreign nucleic acid of great resemblance
with a spacer of a crRNA is cleaved by Cas proteins, preventing virus replication or plasmid
activity. Adapted from Bhaya et al. 2011.
Scientists all over the world apply the CRISPR/Cas system to specifically alter sequences in
the human genome. Hereby, the most widely used CRISPR/Cas9 system is from
Streptococcus pyogenes that introduces a DSB 3 bps upstream of a 5’-NGG-3’ PAM
sequence. However, the CRISPR/Cas9 system of Streptococcus pyogenes had to be adapted
for efficient editing of the human genome. Therefore, the crRNA and tracrRNA were combined
into a single-guide RNA (sgRNA) and encoded by a plasmid that already contained a human
codon-optimized Cas9, as well as a selection marker, e.g. GFP. This plasmid is then
introduced into the target cells either by transfection, nucleofection or viral transfer (Ran et al.
2013). In the cells, the Cas9 and sgRNA are expressed and a DSB is introduced at the target
site, which is fixed by the cell’s DNA repair machinery. Consequently, a random or specific
mutation is introduced at the targeted genomic locus. The DNA repair machinery consists of
Introduction
27
two major pathways: the non-homologous end joining (NHEJ) and homology-directed repair
(HDR; Figure 11). Hereby, the NHEJ leads to a random alteration of the target site due to its
mode of action. In NHEJ the two ends of the DSB are just re-joined which often results in the
random addition or removal of a few bases, so-called insertion-deletion (indel) mutations. This
approach is used by scientists that want to introduce a frameshift and subsequent PTC,
resulting in a KO of the gene of interest. However, if a precise and defined genome editing is
intended, HDR is needed. Hereby, a ‘repair’/’mutation’ template is introduced into the cells,
either in form of double-stranded DNA (dsDNA) or as single-stranded oligonucleotides
(ssODNs) with homology arms flanking the targeted sequence. When designing a
CRIPSR/Cas9 genome editing approach, it has to be kept in mind that the HDR is only active
in dividing cells. Furthermore, the efficiency of HDR varies a lot with the cell type, cell state,
the genomic locus and the repair template (Ran et al. 2013).
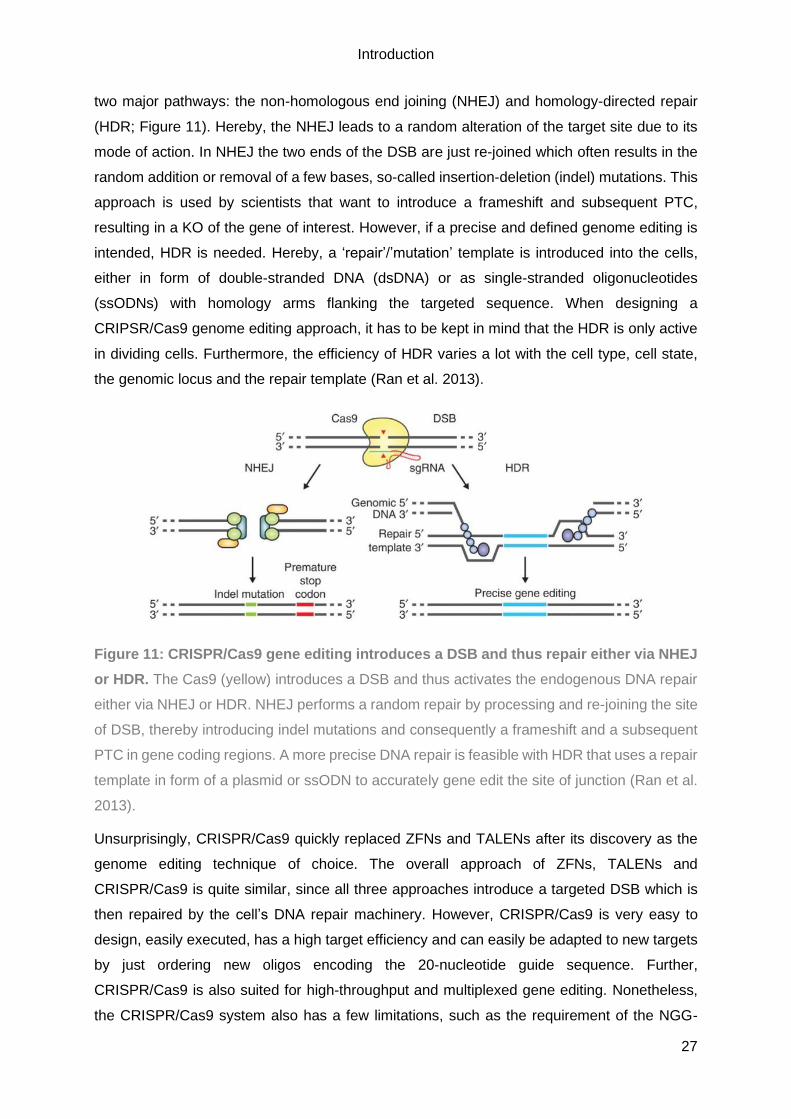
Figure 11: CRISPR/Cas9 gene editing introduces a DSB and thus repair either via NHEJ
or HDR. The Cas9 (yellow) introduces a DSB and thus activates the endogenous DNA repair
either via NHEJ or HDR. NHEJ performs a random repair by processing and re-joining the site
of DSB, thereby introducing indel mutations and consequently a frameshift and a subsequent
PTC in gene coding regions. A more precise DNA repair is feasible with HDR that uses a repair
template in form of a plasmid or ssODN to accurately gene edit the site of junction (Ran et al.
2013).
Unsurprisingly, CRISPR/Cas9 quickly replaced ZFNs and TALENs after its discovery as the
genome editing technique of choice. The overall approach of ZFNs, TALENs and
CRISPR/Cas9 is quite similar, since all three approaches introduce a targeted DSB which is
then repaired by the cell’s DNA repair machinery. However, CRISPR/Cas9 is very easy to
design, easily executed, has a high target efficiency and can easily be adapted to new targets
by just ordering new oligos encoding the 20-nucleotide guide sequence. Further,
CRISPR/Cas9 is also suited for high-throughput and multiplexed gene editing. Nonetheless,
the CRISPR/Cas9 system also has a few limitations, such as the requirement of the NGG-

Introduction
28
PAM at the targeted locus or dreaded off-target events. However, the NGG-PAM sequence is
found on average every 8 – 12 bp in the human genome and thus it is quite likely to find a
suitable sgRNA. An off-target event represents an introduction of a DSB and thus an indel
mutation at an unwanted site within the genome that possesses a high sequence-similarity to
the designed sgRNA. To minimize the probability of off-target events and also to simplify the
overall design, several online prediction tools for CRISPR/Cas9 are available (e.g.
http://crispr.mit.edu/). These websites give a list of all suitable sgRNAs for the region of interest
that are scored according to similarity to other genomic loci within the human genome and the
number of putative off-target sites. Furthermore, a list of the putative off-target sites sorted by
likelihood is provided. Even though the CRISPR/Cas9 system has only been used for a couple
of years in labs all over the world, many papers have been published and also the system itself
has been refined (e.g. high fidelity Cas9; Kleinstiver et al. 2016).
In the cardiac research field, several studies have been published showing the functional
characterisation and in vitro analysis of gene-edited hiPSC-CMs (Hinson et al. 2015;
Mosqueira et al. 2018). In one case, even the translation to affected patients was possible and
has led to the adjustment of their treatment (Prondzynski et al. 2019). Hence, (gene-edited)
hiPSC-CMs are a suitable tool to not only study human inherited cardiomyopathies in vitro but
also to ultimately develop novel therapeutic approaches (Eschenhagen and Carrier 2018).

Aim of study
29
2. Aim of study
The ALP is one of the two major proteolytic systems within cells that is crucial for cellular
homeostasis and of special importance for cardiomyocytes as they represent a post-mitotic
cell type. HCM and DCM are the two most common inherited cardiomyopathies and MYBPC3
is the most frequently mutated gene in HCM. However, it is still unknown how (defective)
autophagy and/or mutations in MYBPC3 contribute to the pathogenesis of HCM and DCM.
Thus, this thesis aimed to decipher the putative interplay of the ALP and cMyBP-C on disease
progression of human inherited cardiomyopathies to finally unravel novel therapeutic options.
Therefore, the first aim of this thesis was to evaluate the putative alteration of the ALP in
cardiac tissue samples of HCM and DCM patients on protein and gene expression level and
further evaluate the biological activity of autophagy (=autophagic flux) on protein level in
hiPSC-CMs derived from an HCM and a DCM patient.
The second aim of this study was to generate a human cellular model of HCM that is deficient
in cMyBP-C. Therefore, hiPSCs from a healthy individual were gene-edited via CRISPR/Cas9
and subsequently, the genetic modification validated, the hiPSCs differentiated into beating
CMs and characterized in 2D culture to validate their suitability as an in vitro model of HCM.

Material & Methods
30
3. Material & Methods
The here used materials, chemicals, reagents and devices are described in detail in the
appendix (Chapter 9).
3.1. Cell Culture
Cell culture media
All used cell culture media are listed in Table 1.
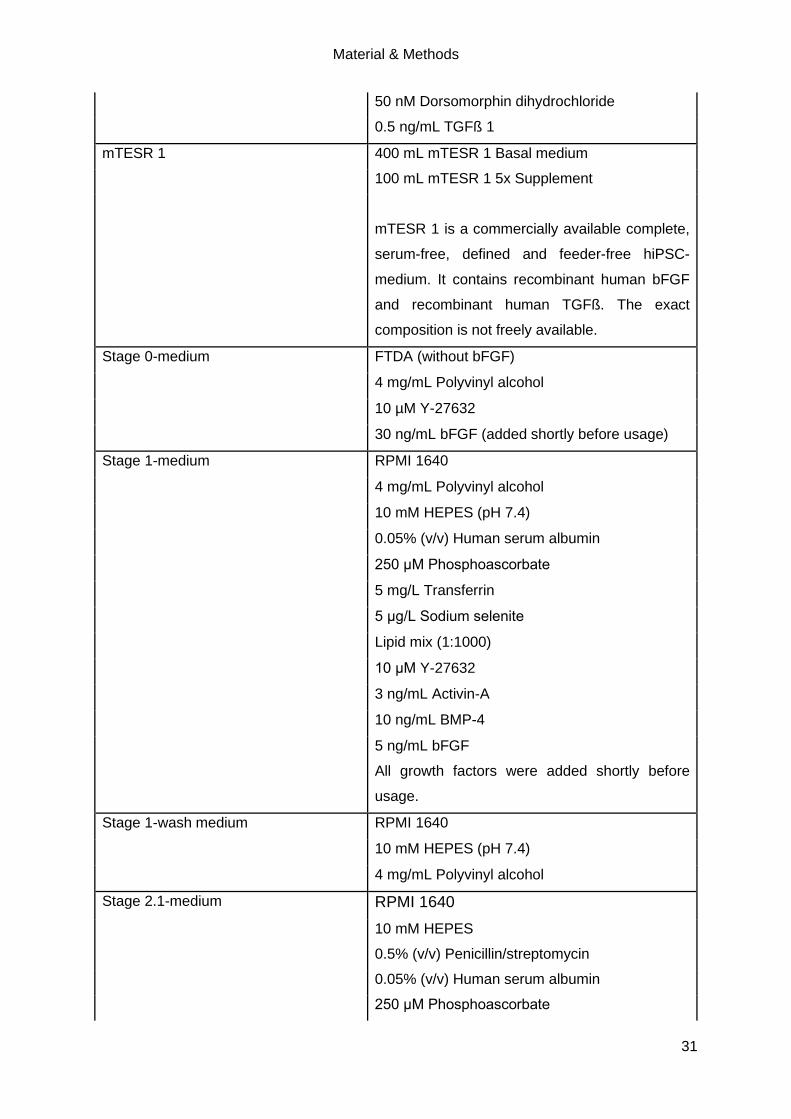
Table 1: Listing and composition of cell culture media.
Media Composition
2D culture medium DMEM
1% (v/v) Penicillin/streptomycin
10% (v/v) Horse serum
10 µg/mL Human recombinant insulin
33 µg/mL Aprotinin
CoM DMEM/F-12 without glutamine
1% (v/v) Non-essential amino acids
1% (v/v) L-glutamine
0.5% (v/v) Penicillin/streptomycin
3.5 µL/500 mL ß-Mercaptoethanol
20% (v/v) Knockout serum replacement
10 ng/mL bFGF
After incubation on mitotically inactivated mouse
embryonic fibroblasts (strain CF-1) for 24 h, the
medium was collected and sterile filtered (0.1
µm).
30 ng/mL bFGF (added shortly before usage)
FTDA DMEM/F-12 without glutamine
2 mM L-glutamine
Lipid mix (1:1000)
5 mg/L Transferrin
5 µg/L Sodium selenite
0.1% (v/v) Human serum albumin
5 µg/mL Human recombinant insulin
2.5 ng/mL Activin-A
30 ng/mL bFGF (added shortly before usage)
Material & Methods
31
50 nM Dorsomorphin dihydrochloride
0.5 ng/mL TGFß 1
mTESR 1 400 mL mTESR 1 Basal medium
100 mL mTESR 1 5x Supplement
mTESR 1 is a commercially available complete,
serum-free, defined and feeder-free hiPSC-
medium. It contains recombinant human bFGF
and recombinant human TGFß. The exact
composition is not freely available.
Stage 0-medium FTDA (without bFGF)
4 mg/mL Polyvinyl alcohol
10 µM Y-27632
30 ng/mL bFGF (added shortly before usage)
Stage 1-medium RPMI 1640
4 mg/mL Polyvinyl alcohol
10 mM HEPES (pH 7.4)
0.05% (v/v) Human serum albumin
250 μM Phosphoascorbate
5 mg/L Transferrin
5 μg/L Sodium selenite
Lipid mix (1:1000)
10 μM Y-27632
3 ng/mL Activin-A
10 ng/mL BMP-4
5 ng/mL bFGF
All growth factors were added shortly before
usage.
Stage 1-wash medium RPMI 1640
10 mM HEPES (pH 7.4)
4 mg/mL Polyvinyl alcohol
Stage 2.1-medium RPMI 1640
10 mM HEPES
0.5% (v/v) Penicillin/streptomycin
0.05% (v/v) Human serum albumin
250 μM Phosphoascorbate
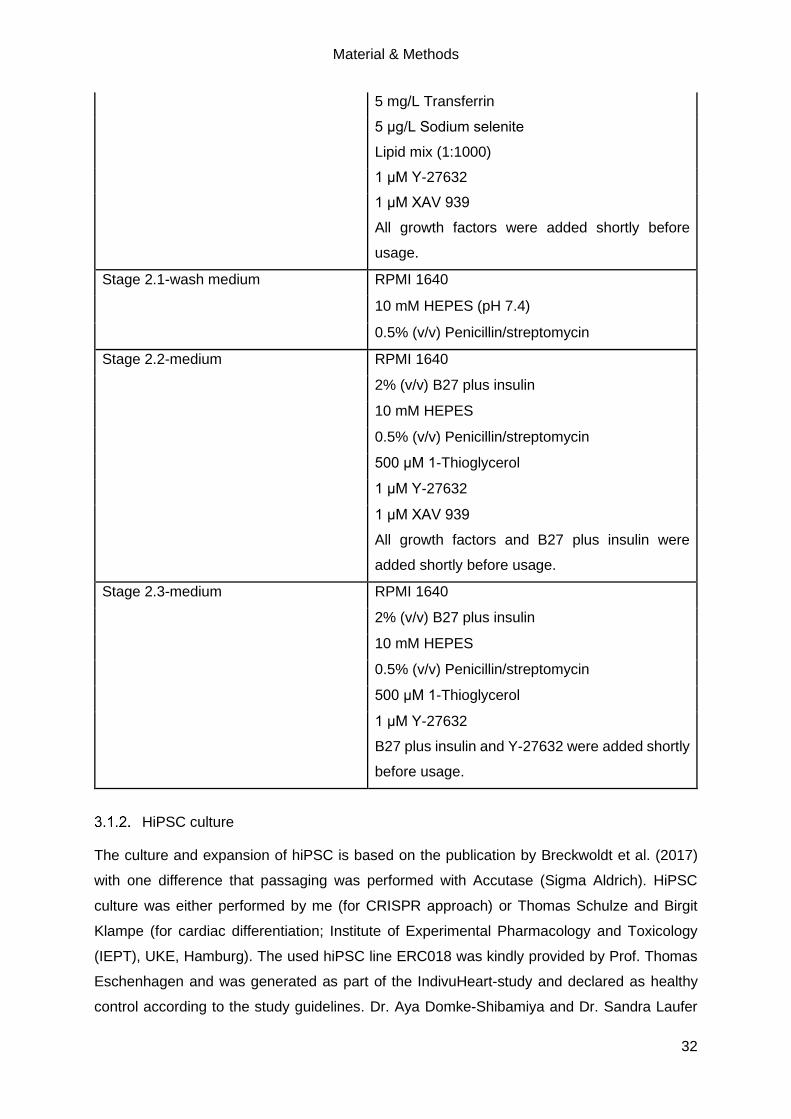
Material & Methods
32
5 mg/L Transferrin
5 μg/L Sodium selenite
Lipid mix (1:1000)
1 μM Y-27632
1 μM XAV 939
All growth factors were added shortly before
usage.
Stage 2.1-wash medium RPMI 1640
10 mM HEPES (pH 7.4)
0.5% (v/v) Penicillin/streptomycin
Stage 2.2-medium RPMI 1640
2% (v/v) B27 plus insulin
10 mM HEPES
0.5% (v/v) Penicillin/streptomycin
500 μM 1-Thioglycerol
1 μM Y-27632
1 μM XAV 939
All growth factors and B27 plus insulin were
added shortly before usage.
Stage 2.3-medium RPMI 1640
2% (v/v) B27 plus insulin
10 mM HEPES
0.5% (v/v) Penicillin/streptomycin
500 μM 1-Thioglycerol
1 μM Y-27632
B27 plus insulin and Y-27632 were added shortly
before usage.
HiPSC culture
The culture and expansion of hiPSC is based on the publication by Breckwoldt et al. (2017)
with one difference that passaging was performed with Accutase (Sigma Aldrich). HiPSC
culture was either performed by me (for CRISPR approach) or Thomas Schulze and Birgit
Klampe (for cardiac differentiation; Institute of Experimental Pharmacology and Toxicology
(IEPT), UKE, Hamburg). The used hiPSC line ERC018 was kindly provided by Prof. Thomas
Eschenhagen and was generated as part of the IndivuHeart-study and declared as healthy
control according to the study guidelines. Dr. Aya Domke-Shibamiya and Dr. Sandra Laufer
Material & Methods
33
(UKE Stem Cell Core Facility) isolated fibroblasts from skin biopsies and subsequently
reprogrammed the fibroblasts using a Sendai virus-based Kit (CytoTune™-iPS 1.0 Sendai
Reprogramming Kit; Life Technologies). Cultivation and expansion of hiPSC was performed in
FTDA medium in hypoxia (5% O2) on Geltrex-coated (1:200; Thermo Fisher Scientific) cell
culture plates and flasks. Before cardiac differentiation, the pluripotency of the hiPSC was
evaluated by flow cytometry (FC) using the stage-specific Embryonic Antigen 3 (SSEA3)
marker. Testing for a mycoplasma contamination was regularly performed by June Uebeler
(IEPT, UKE, Hamburg, Germany).
The HCM hiPSC lines (HCMrepair, HCM, HCMmut) were kindly provided by Prof. Lucie Carrier
and Dr. Maksymilian Prondzynski. The DCM hiPSC lines (DCMrepair, DCM) were kindly
provided by Prof. Arne Hansen and Dr. Anika E. Knaust.
This thesis conforms to the ethical guidelines outlined by the Declaration of Helsinki and the
Medical Association of Hamburg. Furthermore, the donors gave informed consent and all
methods used to generate and analyse the hiPSCs were approved by the local ethics
committee of Hamburg (approval numbers PV3501 and PV4798).
3.2. CRISPR/Cas9-mediated knockout of MYBPC3
This CRISPR/Cas9 gene editing approach was performed in parallel to the experiments of Dr.
Anika E. Knaust (Knaust 2017), Dr. Maksymilian Prondzynski (Prondzynski 2017) and Dr.
Alexandra Madsen (Löser 2018). Further, Dr. Sandra Laufer and Dr. Christiane Neuber from
the UKE Stem Cell Core Facility supported all experiments by offering their help and expertise.
Validation of targeted genomic locus in ERC018 hiPSC
The here selected CRISPR/Cas9 gene editing approach is based on a publication from Ran
et al. (2013) and the chosen cell line ERC018 was kindly provided by Prof. Thomas
Eschenhagen. To validate the targeted genomic sequence, DNA of ERC018 hiPSC was first
isolated with the DNeasy Blood & Tissue Kit (QIAGEN; according to manufacturer’s
instructions) and subsequently exon 6 was amplified by Touchdown PCR (see Table 2 and
Table 3). The size of the PCR product was verified on a 1% agarose gel (not shown).

Material & Methods
34
Table 2: Touchdown PCR approach for exon 6 of MYBPC3 using PrimeSTAR
polymerase. The used primers target exon 6 of MYBPC3 (see Table S5).
Substance Quantity
5xPrimeSTAR buffer 10 µL
2.5 mM dNTPs 4 µL
Fwd primer (10 µM) 0.5 µL
Rev primer (10 µM) 0.5 µL
DMSO 1 µL
PrimeSTAR 0.5 µL
Genomic DNA (50 – 100 ng) 1 µL
ddH2O Fill up to 50 µL
Table 3: Program of Touchdown PCR of PrimeSTAR polymerase. Expected size of PCR
product is 515 bp. * = - 0.5 °C per cycle. ** = Elongation time is dependent on the size of PCR
product (1 kb/min). ∞ = Hold.
Temperature Time Cycles
98 °C 10 sec
11 x 65 °C* 30 sec
72 °C 52 sec**
98 °C 10 sec
24 x 60 °C 30 sec
72 °C 52 sec**
72 °C 7 min
4 °C ∞
After purification with the QIAquick PCR Purification Kit (QIAGEN) according to the
manufacturer’s instructions, the purified PCR product was ligated with the CloneJET PCR
Cloning Kit (Thermo Fisher Scientific). Shortly, all the components were pipetted together
(Table 4), briefly vortexed, spun down and incubated for 5 min at room temperature (RT).
Material & Methods
35
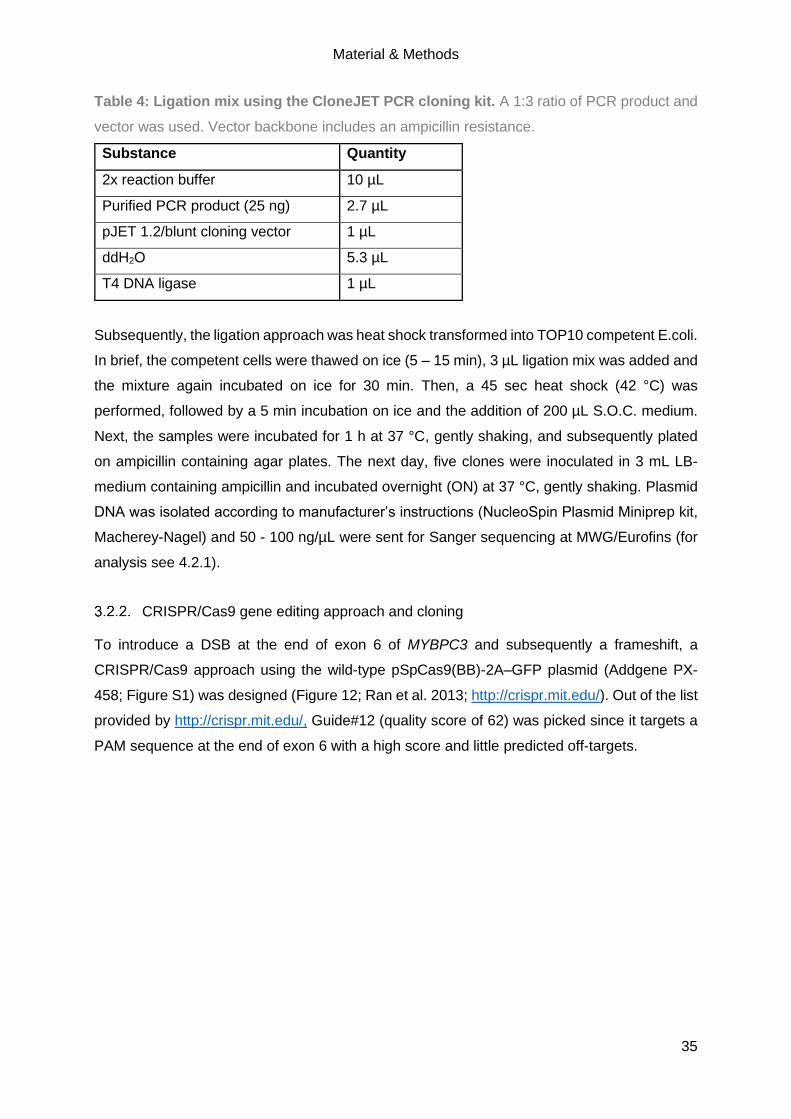
Table 4: Ligation mix using the CloneJET PCR cloning kit. A 1:3 ratio of PCR product and
vector was used. Vector backbone includes an ampicillin resistance.
Substance Quantity
2x reaction buffer 10 µL
Purified PCR product (25 ng) 2.7 µL
pJET 1.2/blunt cloning vector 1 µL
ddH2O 5.3 µL
T4 DNA ligase 1 µL
Subsequently, the ligation approach was heat shock transformed into TOP10 competent E.coli.
In brief, the competent cells were thawed on ice (5 – 15 min), 3 µL ligation mix was added and
the mixture again incubated on ice for 30 min. Then, a 45 sec heat shock (42 °C) was
performed, followed by a 5 min incubation on ice and the addition of 200 µL S.O.C. medium.
Next, the samples were incubated for 1 h at 37 °C, gently shaking, and subsequently plated
on ampicillin containing agar plates. The next day, five clones were inoculated in 3 mL LB-
medium containing ampicillin and incubated overnight (ON) at 37 °C, gently shaking. Plasmid
DNA was isolated according to manufacturer’s instructions (NucleoSpin Plasmid Miniprep kit,
Macherey-Nagel) and 50 - 100 ng/µL were sent for Sanger sequencing at MWG/Eurofins (for
analysis see 4.2.1).
CRISPR/Cas9 gene editing approach and cloning
To introduce a DSB at the end of exon 6 of MYBPC3 and subsequently a frameshift, a
CRISPR/Cas9 approach using the wild-type pSpCas9(BB)-2A–GFP plasmid (Addgene PX-
458; Figure S1) was designed (Figure 12; Ran et al. 2013; http://crispr.mit.edu/). Out of the list
provided by http://crispr.mit.edu/, Guide#12 (quality score of 62) was picked since it targets a
PAM sequence at the end of exon 6 with a high score and little predicted off-targets.
Material & Methods
36
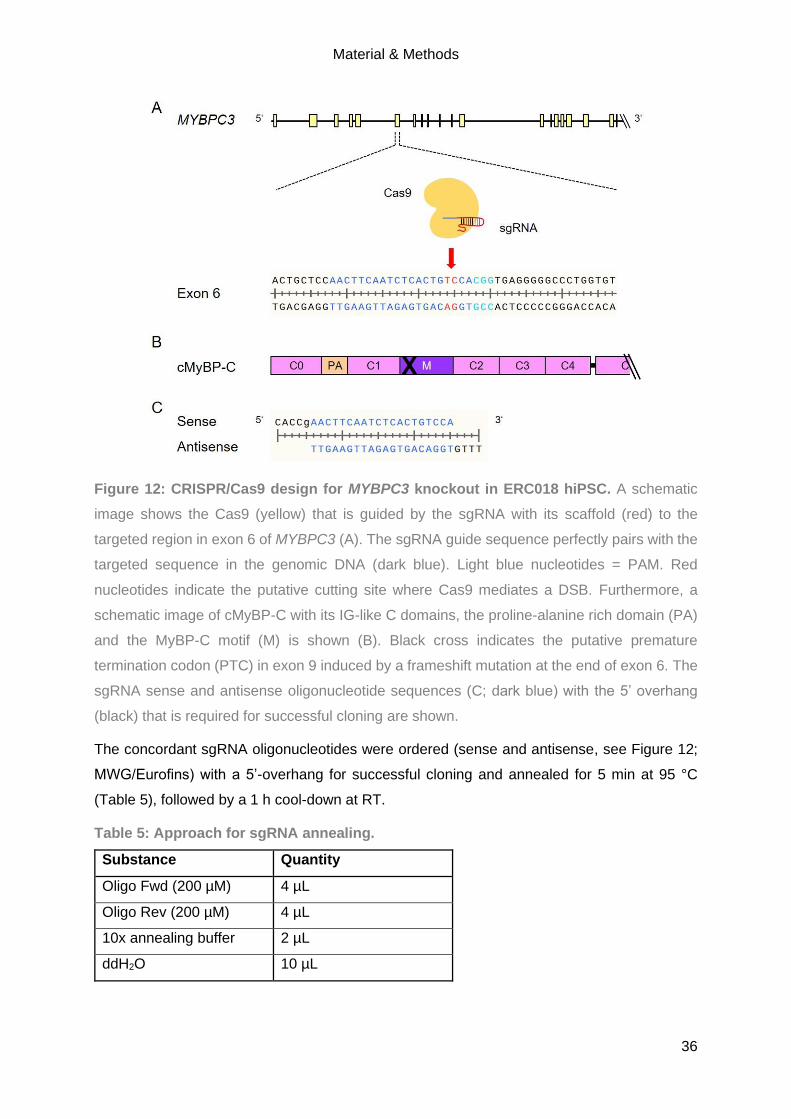
Figure 12: CRISPR/Cas9 design for MYBPC3 knockout in ERC018 hiPSC. A schematic
image shows the Cas9 (yellow) that is guided by the sgRNA with its scaffold (red) to the
targeted region in exon 6 of MYBPC3 (A). The sgRNA guide sequence perfectly pairs with the
targeted sequence in the genomic DNA (dark blue). Light blue nucleotides = PAM. Red
nucleotides indicate the putative cutting site where Cas9 mediates a DSB. Furthermore, a
schematic image of cMyBP-C with its IG-like C domains, the proline-alanine rich domain (PA)
and the MyBP-C motif (M) is shown (B). Black cross indicates the putative premature
termination codon (PTC) in exon 9 induced by a frameshift mutation at the end of exon 6. The
sgRNA sense and antisense oligonucleotide sequences (C; dark blue) with the 5’ overhang
(black) that is required for successful cloning are shown.
The concordant sgRNA oligonucleotides were ordered (sense and antisense, see Figure 12;
MWG/Eurofins) with a 5’-overhang for successful cloning and annealed for 5 min at 95 °C
(Table 5), followed by a 1 h cool-down at RT.
Table 5: Approach for sgRNA annealing.
Substance Quantity
Oligo Fwd (200 µM) 4 µL
Oligo Rev (200 µM) 4 µL
10x annealing buffer 2 µL
ddH2O 10 µL
Material & Methods
37
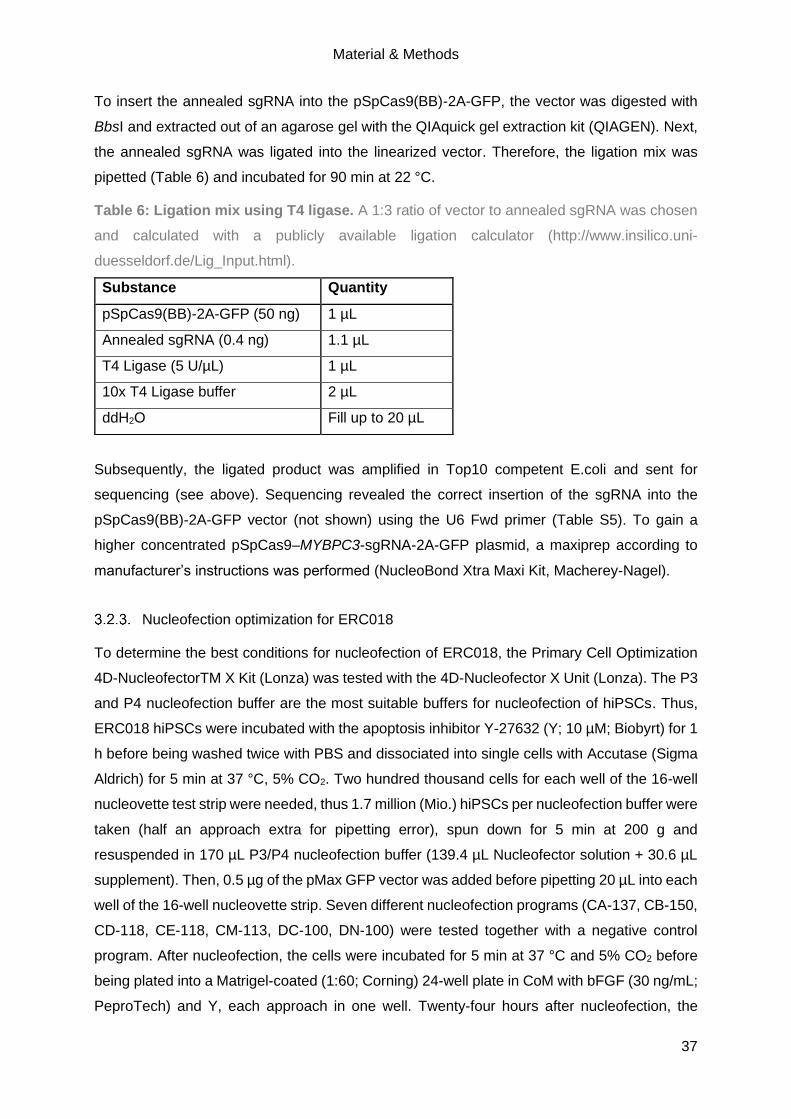
To insert the annealed sgRNA into the pSpCas9(BB)-2A-GFP, the vector was digested with
BbsI and extracted out of an agarose gel with the QIAquick gel extraction kit (QIAGEN). Next,
the annealed sgRNA was ligated into the linearized vector. Therefore, the ligation mix was
pipetted (Table 6) and incubated for 90 min at 22 °C.
Table 6: Ligation mix using T4 ligase. A 1:3 ratio of vector to annealed sgRNA was chosen
and calculated with a publicly available ligation calculator (http://www.insilico.uni-
duesseldorf.de/Lig_Input.html).
Subsequently, the ligated product was amplified in Top10 competent E.coli and sent for
sequencing (see above). Sequencing revealed the correct insertion of the sgRNA into the
pSpCas9(BB)-2A-GFP vector (not shown) using the U6 Fwd primer (Table S5). To gain a
higher concentrated pSpCas9–MYBPC3-sgRNA-2A-GFP plasmid, a maxiprep according to
manufacturer’s instructions was performed (NucleoBond Xtra Maxi Kit, Macherey-Nagel).
Nucleofection optimization for ERC018
To determine the best conditions for nucleofection of ERC018, the Primary Cell Optimization
4D-NucleofectorTM X Kit (Lonza) was tested with the 4D-Nucleofector X Unit (Lonza). The P3
and P4 nucleofection buffer are the most suitable buffers for nucleofection of hiPSCs. Thus,
ERC018 hiPSCs were incubated with the apoptosis inhibitor Y-27632 (Y; 10 µM; Biobyrt) for 1
h before being washed twice with PBS and dissociated into single cells with Accutase (Sigma
Aldrich) for 5 min at 37 °C, 5% CO2. Two hundred thousand cells for each well of the 16-well
nucleovette test strip were needed, thus 1.7 million (Mio.) hiPSCs per nucleofection buffer were
taken (half an approach extra for pipetting error), spun down for 5 min at 200 g and
resuspended in 170 µL P3/P4 nucleofection buffer (139.4 µL Nucleofector solution + 30.6 µL
supplement). Then, 0.5 µg of the pMax GFP vector was added before pipetting 20 µL into each
well of the 16-well nucleovette strip. Seven different nucleofection programs (CA-137, CB-150,
CD-118, CE-118, CM-113, DC-100, DN-100) were tested together with a negative control
program. After nucleofection, the cells were incubated for 5 min at 37 °C and 5% CO2 before
being plated into a Matrigel-coated (1:60; Corning) 24-well plate in CoM with bFGF (30 ng/mL;
PeproTech) and Y, each approach in one well. Twenty-four hours after nucleofection, the
Substance Quantity
pSpCas9(BB)-2A-GFP (50 ng) 1 µL
Annealed sgRNA (0.4 ng) 1.1 µL
T4 Ligase (5 U/µL) 1 µL
10x T4 Ligase buffer 2 µL
ddH2O Fill up to 20 µL
Material & Methods
38
morphology was investigated by microscopy (not shown) and GFP expression quantified by
FC. Therefore, the cells were dissociated with Accutase for 5 min at 37 °C and 5% CO2 and
measured at the UKE FACS Core Facility with the FACS Canto II flow cytometer (BD) to
determine cell survival (cell number) and nucleofection efficiency (GFP+ cells).
CRISPR/Cas9 gene editing of MYBPC3 via nucleofection in ERC018
ERC018 hiPSCs passage (p) 37 were incubated for 1 h with Y and washed twice with PBS.
For cells cultured in FTDA (homemade), dissociation was performed using Accutase (+Y) for
5 min at 37 °C (5% CO2) and subsequently single cells were mixed 1:1 with FTDA. Cells
cultured in mTESR (STEMCELL) were singularized with Gentle Cell Dissociation Reagent (+Y;
STEMCELL) for 8 min at 37 °C (5% CO2). After centrifugation (5 min at 200 g), the cells were
resuspended in the according medium. For each condition, one well with 400 000 cells was
seeded as negative control (12-well plate). For nucleofection, 800 000 cells for each approach
were spun down (5 min at 200 g), resuspended in the nucleofection mix (Table 7) and
subsequently pipetted into electroporation cuvettes (Lonza).
Table 7: Nucleofection mix for MYBPC3-KO in ERC018.
Substance Quantity
P3 Nucleofector solution 82 µL
Supplement 18 µL
pSpCas9-MYBPC3-sgRNA-2A-GFP (2000 ng) 1.25 µL
After nucleofection with program CA-137 and CB-150, electroporation cuvettes containing the
mixes were incubated for 5 min at 37 °C (5% CO2). Then, 500 µL pre-warmed CoM (+Y,
+bFGF; for FTDA cells) or mTESR (+Y, +bFGF) were pipetted into the electroporation cuvettes
before transferring the whole approach into one well of a 12-well plate already containing 500
µL CoM/mTESR (+Y, +bFGF). Twenty-four hours after nucleofection, GFP+ cells were
visualized by microscopy and 1 mL medium was added on top. Forty-eight hours after
nucleofection, the GFP+ cells were washed once with PBS and singularized either with
Accutase or Gentle Cell Dissociation Reagent (see above) and filtered (30 µM). GFP+ cells
were sorted with the FACSAria IIIu cell sorter (BD; UKE FACS Core Facility) into a 1.5-mL
tube with CoM medium (+Y, +bFGF), centrifuged for 3 min at 150 g and subsequently seeded
into a Matrigel-coated 6-well plate for single colony formation. CA-137-nucleofected cells that
were cultivated in mTESR were split into two 6-wells, all other approaches were seeded in one
6-well. Forming colonies and their morphology was observed every day using a microscope.
Until the picking of colonies, medium was changed daily, for the first seven days containing
the apoptosis inhibitor Y. Solely the mTESR cells nucleofected with CA-137 survived single
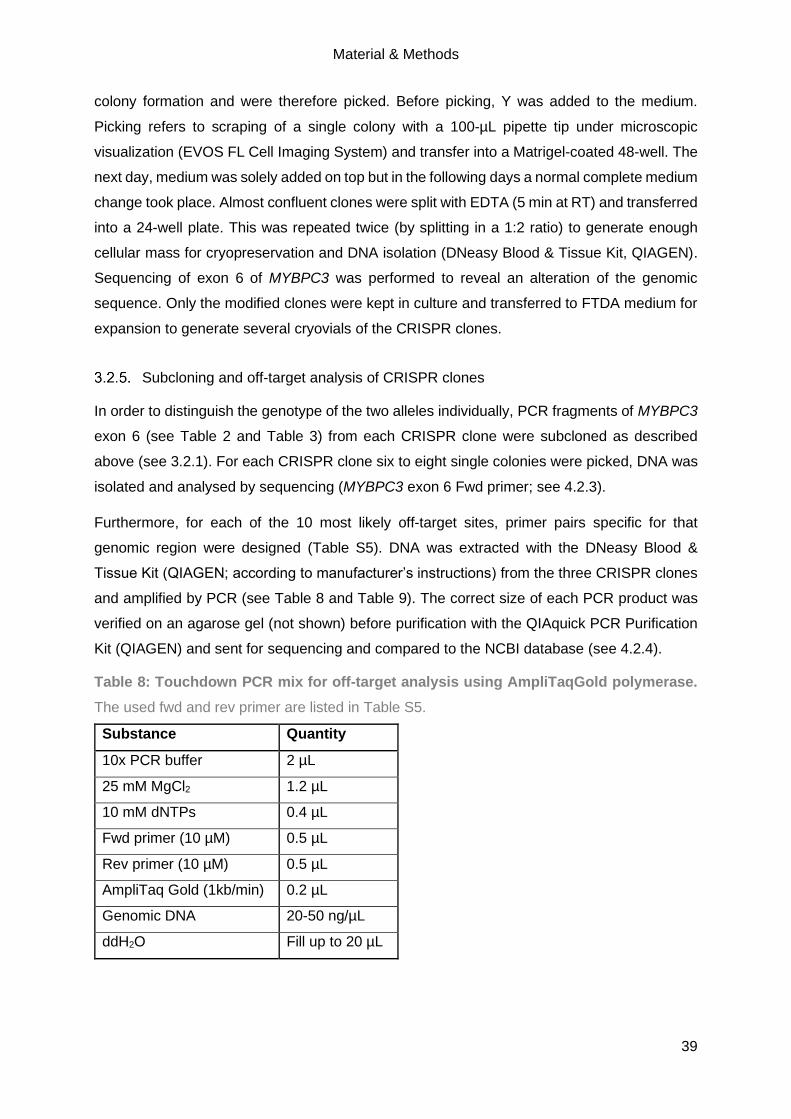
Material & Methods
39
colony formation and were therefore picked. Before picking, Y was added to the medium.
Picking refers to scraping of a single colony with a 100-µL pipette tip under microscopic
visualization (EVOS FL Cell Imaging System) and transfer into a Matrigel-coated 48-well. The
next day, medium was solely added on top but in the following days a normal complete medium
change took place. Almost confluent clones were split with EDTA (5 min at RT) and transferred
into a 24-well plate. This was repeated twice (by splitting in a 1:2 ratio) to generate enough
cellular mass for cryopreservation and DNA isolation (DNeasy Blood & Tissue Kit, QIAGEN).
Sequencing of exon 6 of MYBPC3 was performed to reveal an alteration of the genomic
sequence. Only the modified clones were kept in culture and transferred to FTDA medium for
expansion to generate several cryovials of the CRISPR clones.
Subcloning and off-target analysis of CRISPR clones
In order to distinguish the genotype of the two alleles individually, PCR fragments of MYBPC3
exon 6 (see Table 2 and Table 3) from each CRISPR clone were subcloned as described
above (see 3.2.1). For each CRISPR clone six to eight single colonies were picked, DNA was
isolated and analysed by sequencing (MYBPC3 exon 6 Fwd primer; see 4.2.3).
Furthermore, for each of the 10 most likely off-target sites, primer pairs specific for that
genomic region were designed (Table S5). DNA was extracted with the DNeasy Blood &
Tissue Kit (QIAGEN; according to manufacturer’s instructions) from the three CRISPR clones
and amplified by PCR (see Table 8 and Table 9). The correct size of each PCR product was
verified on an agarose gel (not shown) before purification with the QIAquick PCR Purification
Kit (QIAGEN) and sent for sequencing and compared to the NCBI database (see 4.2.4).
Table 8: Touchdown PCR mix for off-target analysis using AmpliTaqGold polymerase.
The used fwd and rev primer are listed in Table S5.
Substance Quantity
10x PCR buffer 2 µL
25 mM MgCl2 1.2 µL
10 mM dNTPs 0.4 µL
Fwd primer (10 µM) 0.5 µL
Rev primer (10 µM) 0.5 µL
AmpliTaq Gold (1kb/min) 0.2 µL
Genomic DNA 20-50 ng/µL
ddH2O Fill up to 20 µL

Material & Methods
40
Table 9: Touchdown PCR program for AmpliTaq Gold polymerase. Expected size of PCR
products varies from 473 bp to 771 bp (Table S5). * = - 0.5 °C per cycle. ** = Elongation time
is dependent on the size of PCR product (1 kb/min). ∞ = Hold.
Temperature Time Cycles
94 °C 5 min
94 °C 30 sec
11 x 65 °C* 30 sec
68 °C 52 sec**
94 °C 30 sec
24 x 60 °C 30 sec
68 °C 52 sec**
68 °C 7 min
4 °C ∞
Karyotype analysis of CRISPR clones
To validate whether successfully CRISPR clones show a correct karyotype hiPSCs were
analysed by G-banding and NanoString Technology. For G-banding, hiPSCs of each clone
(p47-49) were thawed and cultured for two passages in FTDA. For examination, cells were
plated on two Geltrex-coated 6-wells, and when the confluency reached ~80%, the cells were
handed over to the Department for Human Genetics at the UKE for cytogenetic analysis. The
karyotype was also evaluated in a younger passage of all CRISPR clones with the NanoString
Technology. Therefore, the nCounter Human Karyotype Panel was used (NanoString
Technologies) according to manufacturer’s instructions. 300 ng genomic DNA was fragmented
by Alu1 restriction digestion for 1 h at 37 °C. The fragmentation was verified on a 1% agarose
gel, before the samples were denatured at 95 °C for 5 min to obtain single-stranded DNA and
subsequently put on ice until hybridization reaction was ready (at least 2 min). The
hybridization mix was pipetted (Table 10) and incubated for 16 h at 65 °C before being loaded
onto the nCounter Cartridge and run on the nCounter SPRINT Profiler.
Table 10: Hybridization mix for karyotyping with NanoString Technology.
Substance Quantity
Reporter CodeSet 3 µL
Hybridization buffer 5 µL
Denatured DNA 10 µL
Capture ProbeSet 2 µL

Material & Methods
41
The NanoString karyotype experiment was performed by Elisabeth Krämer and analysed by
Dr. Giulia Mearini (IEPT, UKE, Hamburg, Germany).
Genotyping of CRISPR clones
Similar to standardized genotyping of mice strains, generated CRISPR clones were subjected
to genotyping on a regular basis to validate the identity and prevent mix-ups. Thus, DNA was
isolated of either hiPSCs (before differentiation) or CMs (after differentiation or thawing) with
the DNeasy Blood & Tissue Kit (QIAGEN) and amplified by PCR (see Table 2 and Table 3).
The resulting PCR product was purified (QIAquick PCR Purification Kit; QIAGEN), sent for
sequencing and subsequently compared to the wild-type genomic sequence and the original
CRISPR clone genomic sequences (see 4.2.7).
3.3. Generation, cultivation and treatment of hiPSC-CMs
Cardiac differentiation of hiPSC
ERC018 hiPSCs and the CRISPR hiPSC lines were differentiated into CMs with the
established in-house differentiation protocol published by Breckwoldt et al. in 2017. This is a
growth factor, EB-based differentiation protocol with three-stages that has been frequently
described (Lemme et al. 2018; Schulze et al. 2019) and mainly produces ventricular hiPSC-
CMs. The used media are described in detail in 3.1.1. Differentiation of all hiPSC lines were
performed by me or in collaboration with Maksymilian Prondzynski, Anika E. Knaust or Marta
Lemme.
Stage-0 consisted of dissociating hiPSCs that were grown in a monolayer in Geltrex-coated
T80 cell culture flasks under hypoxia by first adding the apoptosis inhibitor Y (1 h before the
dissociation) and then EDTA. Then, 30 Mio. cells per 100 mL Stage-0 medium were incubated
in 500 mL spinner flasks on magnetic stirrer plates ON under hypoxia to induce EB formation.
Stage-1 was performed on the next day and consisted of first washing and then estimating the
EB volume. About 180-250 µL EBs were cultured in suspension in Pluronic F-127 (Sigma-
Aldrich)-coated T175 flasks under hypoxia in Stage-1 medium and thereby mesodermal
differentiation was induced. The following growth factors were used for the mesodermal
induction: BMP4 (10 ng/mL), Activin A (3 ng/mL) and bFGF (5 ng/mL). For the next two days,
half medium changes were performed. Then, EBs were again washed and their volume
estimated before transferring 180-250 µL EBs into Stage-2 medium to induce cardiac
differentiation. Again, half medium changes were performed for the next two days before
performing a complete medium change by transferring the EBs into Stage-2.1 medium. This
medium contains insulin and XAV 939, a WNT-signalling inhibitor. For the next three days, half

Material & Methods
42
medium changes were performed and subsequently, the cells were transferred into Stage-2.2
medium (without XAV 939) and cultured for five more days. On average, nicely shaped EBs
started spontaneous beating between day 8 and 12 of cardiac differentiation. After 17 days of
cardiac differentiation, the EBs were enzymatically dissociated for up to 3.5 h at 37 °C with
Collagenase II (200 U/mL, Worthington) into single cells. HiPSC-CMs were either directly
plated in 2D (24-well plate) or frozen in cryovials in freezing solution. Therefore, the
cryopreservation system Asymptote EF600M (Grant Instruments) device was used for a
controlled, gentle freezing down to -80 °C. Subsequently, the frozen cells were transferred to
-150 °C for long-term storage. The percentage of hiPSC-CMs positive for cTnT was
determined by FC.
Thawing, cultivation and treatment of hiPSC-CMs
HiPSC-CMs were thawed with a gentle protocol to enable high recovery rates of CMs.
Therefore, the cryovial was taken from the -150 °C storage and cells were immediately thawed
in a water bath (37 °C) before being gently transferred into a 50-mL falcon tube using a 2 mL
serological pipette. The empty cryovial was rinsed with 1 mL of pre-warmed 2D culture
medium. Subsequently, this 1 mL was added dropwise (one drop every 4-5 sec) to the cell
suspension in the 50-mL falcon whereby the falcon was gently swirled. Then, 1 mL of pre-
warmed 2D culture medium was added dropwise with one drop every 2-3 sec while the falcon
was gently swirled. Next, 7 mL of pre-warmed 2D culture medium was added with one drop
every sec while the falcon was gently swirled. The whole cell-medium-mixture was then
inverted 2-3x, and the number of cells determined (Neubauer chamber).
For 2D culture of hiPSC-CMs of ERC018 and the CRISPR clones, 12-well and 96-well plates
were coated with Geltrex (1:100) and for one 12-well 440 000 cells and for one 96-well 2500-
5000 cells seeded. The hiPSC-CMs were cultured for up to 30 days (37 °C, 5% CO2, normoxia)
with being fed three times a week. HiPSC-CMs were monitored carefully by microscopic
evaluation and every week, images and videos were taken. At day 7 and day 30, hiPSC-CMs
cultured in 96-well plates were treated for 3 h at 37 °C with either DMSO (0.05%), Rapa (2.5
µM; Sigma-Aldrich) or Bafilo (50 nM; Sigma-Aldrich). After two washing steps with PBS, the
cells were fixed with Roti-Histofix (Roth) for 20 min at 4 °C. After three more washing steps,
the 96-plate was sealed and stored at 4 °C until immunofluorescence analysis (see 3.5.11).
To detect putative truncated forms of cMyBP-C, hiPSC-CMs were treated at day 29 for 24 h at
37 °C with either 0.01% or 0.1% DMSO or 1 µM or 10 µM MG-132 (proteasome inhibitor; Merck
Biosciences). To evaluate the autophagic flux, hiPSC-CMs were treated at day 30 for 3 h at
37 °C with 0.05% DMSO, 2.5 µM Rapa or 50 nM Bafilo. In both cases, the cells were washed
once with PBS and subsequently harvested with Accutase solution (5 min at 37 °C). The cell
pellets were first washed with PBS and then snap-frozen in liquid nitrogen. All cell pellets were

Material & Methods
43
stored at -80 °C. HiPSC-CMs samples were prepared for molecular analysis (Western Blot
(WB), RNA, mass spectrometry). Treatment of all hiPSC lines was performed by me or with
the help of Maksymilian Prondzynski, Mirja Schulze or Marta Lemme, since drug application
was not possible during pregnancy.
3.4. Human tissue samples
Human tissue samples were provided by Prof. Thomas Eschenhagen in case of DCM and non-
failing (NF) samples, as being donor hearts not suitable for transplantation. Prof. Lucie Carrier
provided septal myectomies of HCM patients. The human heart samples were chopped into
small pieces and snap-frozen in liquid nitrogen. Subsequently, the human heart samples were
either stored as a piece or powder at -80 °C until further use. Protein and RNA were isolated
by Elisabeth Krämer and Jutta Starbatty or in collaboration with me. This thesis conforms to
the ethical guidelines outlined by the Declaration of Helsinki and the Medical Association of
Hamburg. The donors gave informed consent.
3.5. Molecular analysis
Isolation of proteins for WB
To isolate proteins from human cardiac tissue, 30 mg tissue powder were combined with 6.25
volumes of H2O with protease inhibitors (Roche Complete mini EDTA free Protease Inhibitor;
1 tablet in 10 mL) and homogenized using the TissueLyser (QIAGEN), two times 30 sec at 20
Hz. Then, the mixture was centrifuged for 30 min at 16 000 g at 4 °C. Subsequently, the
supernatant (cytosolic fraction) was collected and stored at -20 °C until utilization. After two
washing steps with H2O with protease inhibitors with centrifugation steps for 5 min at 16 000 g
at 4 °C, the pellet was homogenized in 6.25 volumes of Kranias buffer (with 0.1% DTT) using
the TissueLyser two times for 30 sec at 20 Hz to yield the membrane-enriched fraction. To
evaluate protein levels in hiPSC-CMs, the cells were dissolved in 100 µL Kranias buffer (0.1%
DTT) by vigorous pipetting and short vortexing. The concentration of proteins was evaluated
by Qubit measurement (Qubit Protein Assay Kit; Thermo Fisher Scientific).
Evaluation of protein level by WB
For hiPSC-CMs 7.5 µg protein and for human cardiac tissue samples 10 µg protein was mixed
with 6x Laemmli buffer and ddH2O (21 µL in total). The mixture was incubated either for 10
min at 55 °C for autophagic flux analysis or 5 min at 95 °C for all other proteins. Subsequently,
the mixture was loaded onto an agarose gel (10% for ubiquitin analysis; 12% for autophagic
flux and other proteins). SDS-PAGE was performed for 10 min at 80 V, then for ~ 70 min at
150 V. Subsequently, transfer of proteins onto a nitrocellulose or PVDF membrane (0.45 µm)

Material & Methods
44
took place. After the successful transfer, the membranes were washed with TBS-T and stained
with Ponceau solution (Sigma-Aldrich) to visualize all proteins attached to the membrane. After
an image was taken at the ChemiDoc Touch Imaging System (Bio-Rad), membranes were
blocked either in 5% skim milk or 5% BSA for 1 h at RT to prevent unspecific binding events.
To visualize proteins of interest, primary antibody incubation was performed at 4 °C ON in
TBS-T and secondary antibody incubation for 1 h at RT in 5% skim milk/TBS-T under gentle
rotation. Either the Clarity Western ECL Substrate (Bio-Rad) or the SuperSignal West Dura
ECL (Thermo Fisher) were used for visualization at the ChemiDoc Touch Imaging System.
Analysis and quantification of protein bands was performed with the ImageLab software (Bio-
Rad). The quantified protein bands were either normalized to cTnT or to the ponceau staining.
Silke Düsener-Reischmann and Dr. Saskia Schlossarek (IEPT, UKE, Hamburg) helped with
the conduction of WBs in this thesis.
Isolation of proteins for mass spectrometry analysis
Mass spectrometry preparation, measurement and analysis was performed by Dr. Elke
Hammer and Maren Depke at the Interfaculty Institute of Genetics and Functional Genomics
(University Medicine Greifswald).
Protein was extracted from 2D-cultured hiPSC-CMs by five cycles of freezing (liquid nitrogen)
and thawing (30 °C, 1 400 rpm) in 8 M urea/ 2 M thiourea. Cell debris and insoluble material
was separated by centrifugation (20 000 × g, 1 h at 4 °C). After determination of protein content
with the Coomassie Plus (Bradford) Assay Kit according to manufacturer’s instructions
(Thermo Fisher Scientific), equal protein amounts from 2-4 wells of each batch were pooled
and subjected to proteolytic digestion.
Sample preparation for mass spectrometry analysis
Four µg of total protein from each sample were reduced for 15 min at 37 °C with 2.5 mM
UltraPure DTT (Invitrogen) and alkylated for 30 min at 37 °C with 10 mM Iodacetamide (Sigma
Aldrich). Protein were lysed for 3 h at 37 °C using LysC (1:100; Promega) and subsequently
digested with Trypsin Gold ON at 37 °C (Promega). The tryptic digestion was stopped by
adding acetic acid (final concentration 1%) followed by desalting using ZipTip-µC18 tips (Merck
Millipore). Eluted peptides were concentrated by evaporation under vacuum and subsequently
resolved in 0.1% acetic acid, 2% acetonitrile (ACN) containing Hyper Reaction
Monitoring/indexed Retention Time (HRM/iRT) peptides (Biognosys AG) according to
manufacturer’s instructions.

Material & Methods
45
Mass spectrometry measurements
Before mass spectromic (MS) data acquisition, tryptic peptides were separated on an µPACTM
micro-Chip (Pharmafluidics) using an Ultimate 3000 nano-LC system (Thermo Fisher
Scientific). Peptides were eluted at a constant temperature of 50 °C and a flow rate of 600
nL/min. MS data was recorded on a QExactive HFx mass spectrometer (Thermo Electron). To
design a spectral library, MS/MS peptides were separated by 2 h-linear gradients with
increasing acetonitrile concentration from 5 to 25 % in 0.1 % acetic acid and data were
recorded in data dependent mode (DDA). The MS scans were carried out in a m/z range of
350 to 1650 m/z. Data was acquired with a resolution of 60 000 and an automatic gain control
(AGC) target of 3 x 10⁶ at maximal injection times of 45 ms. The top 12 most abundant isotope
patterns with charge ≥2 from the survey scan were then selected for fragmentation by high
energy collisional dissociation (HCD) with a maximal injection time of 22 ms, an isolation
window of 1.3 m/z, and a normalized collision energy of 27.5 eV. Dynamic exclusion was set
to 45 s. The MS/MS scans had a resolution of 15 000 and an AGC target of 1 x 10⁵. The
acquisition of MS data for relative quantitation was performed in data independent mode (DIA)
after peptide pre-fractionation using a 100 min-linear gradient from 5% to 25% acetonitrile in
0.1% acetic acid. Briefly, the data was acquired in the m/z range from 350 to 1200 m/z, the
resolution for MS was 120 000 and for MS/MS 30 000. The AGC target was 3 x 10⁶ for MS
and MS/MS. The number of DIA isolation windows was 70 of 11 m/z with 1 m/z overlap.
Analysis of mass spectrometry data
Proteins were identified using SpectronautTM Pulsar 13.4 software (Biognosys AG) against a
spectral library generated from DDA measurements of all 34 different samples of the study.
The spectral library construction by Spectronaut was based on a database search using a
human protein database (Uniprot vs 03_2019, 20404 entries) extended by sequences of
bovine fibrinogen subunits A, B, and C. Because of the use of horse serum as medium
supplement, sequences of 10 proteins reproducibly identified by proteotypic peptides were
added to the database. The target-decoy search was performed with a parent mass error of
±20 ppm, fragment mass error of 0.01 Da, and allowing full-tryptic peptides (trypsin/P cleavage
rule) with a minimal peptide length of six amino acids and up to two internal cleavage sites.
The search included carbamidomethylation at cysteine as fixed modification and oxidation at
methionine and acetylation at protein N-termini as variable modifications. The generation of
the ion library in SpectronautTM v13.4.190802.43655 resulted in a constructed library
consisting of 335 310 fragments, 30 756 peptides and 3 376 protein groups. The Spectronaut
DIA-MS analysis was carried out as described previously (Palma Medina et al. 2019) with
project specific modifications. Briefly, the following parameter settings were applied: dynamic
MS1 and MS2 mass tolerance, dynamic XIC RT extraction window, automatic calibration,
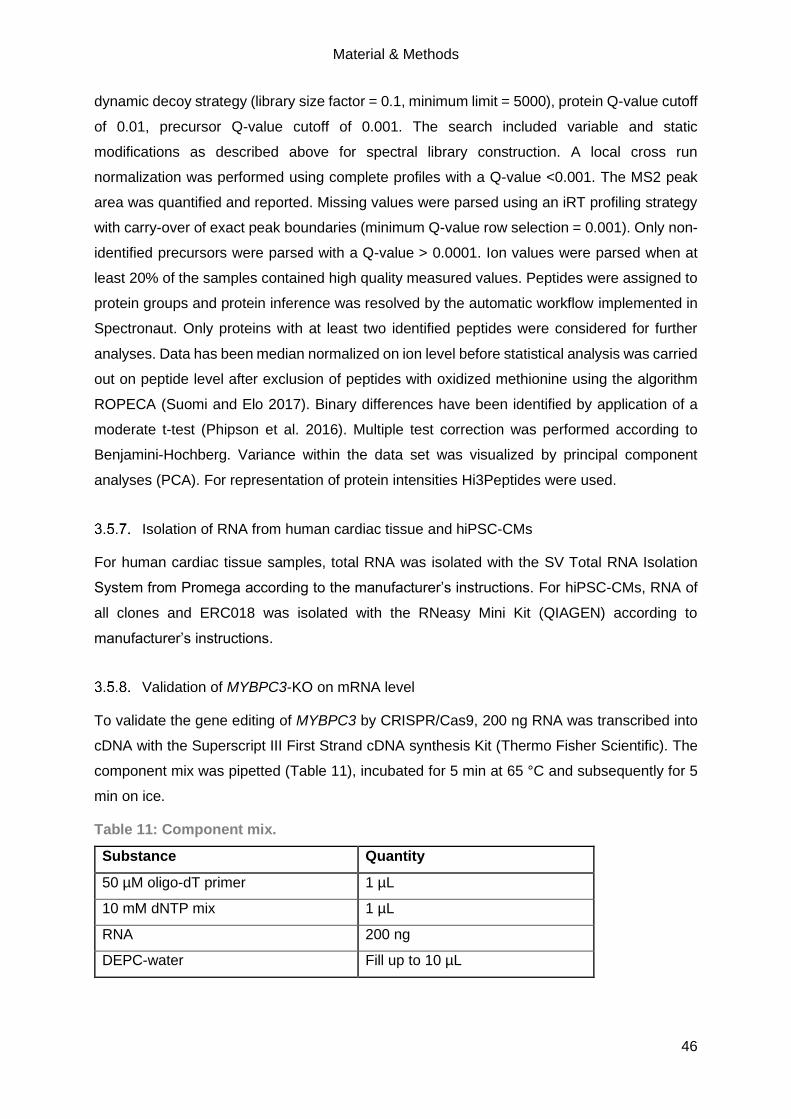
Material & Methods
46
dynamic decoy strategy (library size factor = 0.1, minimum limit = 5000), protein Q-value cutoff
of 0.01, precursor Q-value cutoff of 0.001. The search included variable and static
modifications as described above for spectral library construction. A local cross run
normalization was performed using complete profiles with a Q-value <0.001. The MS2 peak
area was quantified and reported. Missing values were parsed using an iRT profiling strategy
with carry-over of exact peak boundaries (minimum Q-value row selection = 0.001). Only non-
identified precursors were parsed with a Q-value > 0.0001. Ion values were parsed when at
least 20% of the samples contained high quality measured values. Peptides were assigned to
protein groups and protein inference was resolved by the automatic workflow implemented in
Spectronaut. Only proteins with at least two identified peptides were considered for further
analyses. Data has been median normalized on ion level before statistical analysis was carried
out on peptide level after exclusion of peptides with oxidized methionine using the algorithm
ROPECA (Suomi and Elo 2017). Binary differences have been identified by application of a
moderate t-test (Phipson et al. 2016). Multiple test correction was performed according to
Benjamini-Hochberg. Variance within the data set was visualized by principal component
analyses (PCA). For representation of protein intensities Hi3Peptides were used.
Isolation of RNA from human cardiac tissue and hiPSC-CMs
For human cardiac tissue samples, total RNA was isolated with the SV Total RNA Isolation
System from Promega according to the manufacturer’s instructions. For hiPSC-CMs, RNA of
all clones and ERC018 was isolated with the RNeasy Mini Kit (QIAGEN) according to
manufacturer’s instructions.
Validation of MYBPC3-KO on mRNA level
To validate the gene editing of MYBPC3 by CRISPR/Cas9, 200 ng RNA was transcribed into
cDNA with the Superscript III First Strand cDNA synthesis Kit (Thermo Fisher Scientific). The
component mix was pipetted (Table 11), incubated for 5 min at 65 °C and subsequently for 5
min on ice.
Table 11: Component mix.
Substance Quantity
50 µM oligo-dT primer 1 µL
10 mM dNTP mix 1 µL
RNA 200 ng
DEPC-water Fill up to 10 µL
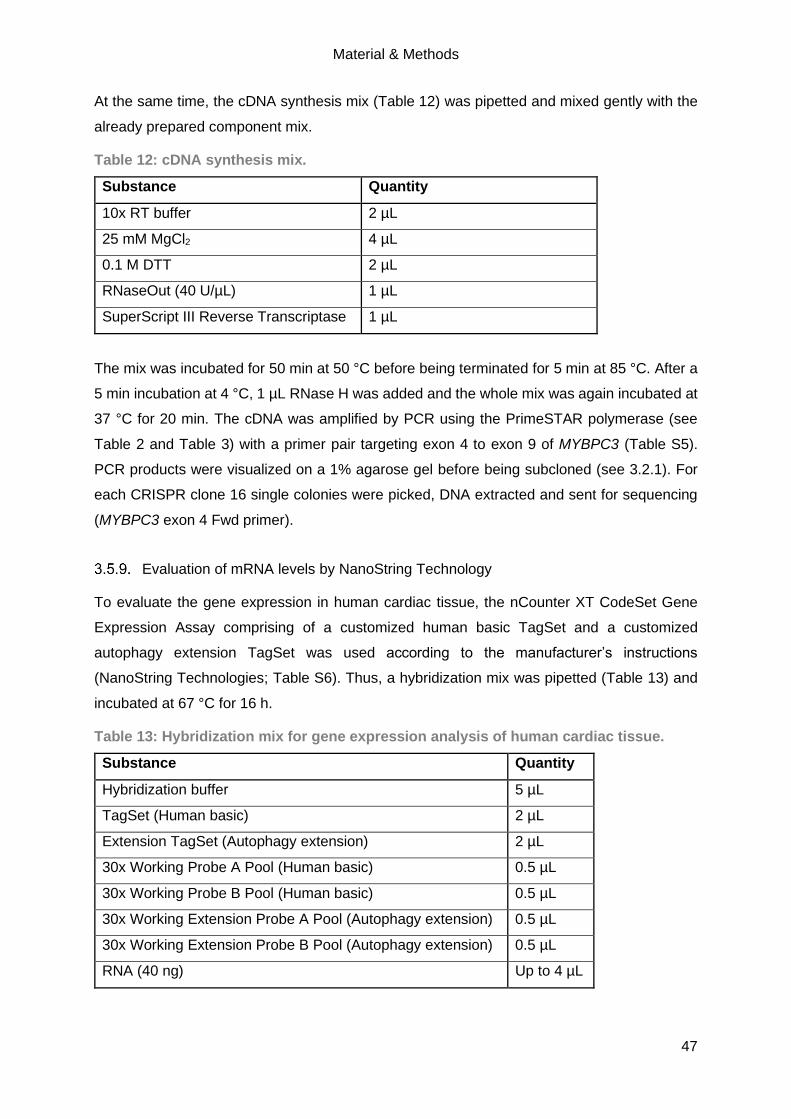
Material & Methods
47
At the same time, the cDNA synthesis mix (Table 12) was pipetted and mixed gently with the
already prepared component mix.
Table 12: cDNA synthesis mix.
Substance Quantity
10x RT buffer 2 µL
25 mM MgCl2 4 µL
0.1 M DTT 2 µL
RNaseOut (40 U/µL) 1 µL
SuperScript III Reverse Transcriptase 1 µL
The mix was incubated for 50 min at 50 °C before being terminated for 5 min at 85 °C. After a
5 min incubation at 4 °C, 1 µL RNase H was added and the whole mix was again incubated at
37 °C for 20 min. The cDNA was amplified by PCR using the PrimeSTAR polymerase (see
Table 2 and Table 3) with a primer pair targeting exon 4 to exon 9 of MYBPC3 (Table S5).
PCR products were visualized on a 1% agarose gel before being subcloned (see 3.2.1). For
each CRISPR clone 16 single colonies were picked, DNA extracted and sent for sequencing
(MYBPC3 exon 4 Fwd primer).
Evaluation of mRNA levels by NanoString Technology
To evaluate the gene expression in human cardiac tissue, the nCounter XT CodeSet Gene
Expression Assay comprising of a customized human basic TagSet and a customized
autophagy extension TagSet was used according to the manufacturer’s instructions
(NanoString Technologies; Table S6). Thus, a hybridization mix was pipetted (Table 13) and
incubated at 67 °C for 16 h.
Table 13: Hybridization mix for gene expression analysis of human cardiac tissue.
Substance Quantity
Hybridization buffer 5 µL
TagSet (Human basic) 2 µL
Extension TagSet (Autophagy extension) 2 µL
30x Working Probe A Pool (Human basic) 0.5 µL
30x Working Probe B Pool (Human basic) 0.5 µL
30x Working Extension Probe A Pool (Autophagy extension) 0.5 µL
30x Working Extension Probe B Pool (Autophagy extension) 0.5 µL
RNA (40 ng) Up to 4 µL

Material & Methods
48
Subsequently, the samples were mixed 1:1 with RNase-free H2O by flicking, shortly spun down
and pipetted into the cartridge. The analysis of the runs was performed with the nSolver
Analysis Software 4.0 (NanoString Technologies). The runs themselves and the analysis of
the runs were performed by me with the help of Dr. Maksymilian Prondzynski and Elisabeth
Krämer.
Evaluation of mRNA level by RT-qPCR
Further, the expression of MYBPC3 in the hiPSC-CMs of the three CRISPR clones and
ERC018 was validated by RT-qPCR. Therefore, SYBR-Green (Thermo Fisher Scientific) was
used according to manufacturer’s instructions (Table 14) and the samples were amplified
during 45 cycles with the ABI PRISM 7900HT Sequence Detection System (Applied
Biosystems). All target sequences were analysed in triplicates and the transcript levels were
normalized to GAPDH (glyceraldehyde 3-phosphate dehydrogenase; exon 5 to exon 6). The
target sequences for MYBPC3 were exon 1 to exon 2 and MYBPC3 exon 26 (Table S5). To
validate the trisomy, exon 4 of LMNA was validated (Table S5). The relative differences
between ERC018 and the CRISPR clones were calculated with the 2-ΔΔCt method for relative
quantifications. Dr. Saskia Schlossarek (IEPT, UKE, Hamburg) assisted with RT-qPCR
analysis.
Table 14: RT-qPCR master mix.
Substance Quantity
Maxima SYBR Green/ROX qPCR Master Mix (2x) 5 µL
Fwd primer (10 µM) 0.9 µL
Rev primer (10 µM) 0.9 µL
cDNA (1:5 dilution; add to individual PCR tubes) 1 µL
DEPC-water 2.2 µL
Immunofluorescence and cell size analysis of hiPSC-CMs
To perform immunofluorescence staining, hiPSC-CMs cultured in 96-well plates were
incubated with primary antibody (Table S3) that was diluted in permeabilization buffer (50
µL/96-well; Table S2). The incubation was performed ON at 4 °C under gentle agitation and
protected from light. On the next day, the hiPSC-CMs were washed twice with PBS and
incubated with the secondary antibody (Table S4), also diluted in permeabilization buffer (50
µL/96-well), for 1 h at RT in the dark under gentle agitation. During the last 20 min of this 1 h
incubation, Hoechst 33342 (1:2500 in PBS, 50 µL/well; Thermo Fisher Scientific) was added
to stain the nuclei. After two washing steps with PBS, fresh PBS was added and the wells were
analysed by confocal microscopy (LSM 800, Zeiss) either for protein expression or cell size.

Material & Methods
49
For the analysis of the cell size of hiPSC-CMs, images of three wells per cell line were taken
of every single cell showing a nice striation and overall shape. The quantification was
performed using Fiji software (ImageJ). The approach was based on the publication of
Prondzynski et al. (2017).
3.6. Statistical analysis
GraphPad Prism software 8.3.0 was used to perform statistics. Data was presented as
mean±SEM either as bar graphs, stacked bar graphs or scatterplots. Either the unpaired
Student’s t-test or one-way ANOVA (plus Tukey or Bonferroni’s post-test) was used to
determine whether the difference between groups was statistically significant, whereby a p-
value lower than 0.05 was considered to be statistically significant. The number of replicates,
batches and wells was expressed as n=replicate number/batch number/well number.
Results
50
4. Results
4.1. Evaluation of a putative common ALP alteration in human inherited cardiomyopathies
Previously, our group showed impaired protein quality control (UPS and ALP; Schlossarek et
al. 2012; Singh et al. 2017) in a HCM mouse model carrying a Mybpc3 knock-in mutation that
resembles a human founder mutation found in Tuscany, Italy (c.772G>A; Olivotto et al. 2008;
Vignier et al. 2009). Upon activation of autophagy (caloric restriction or Rapa treatment), a
(partial) amelioration of the cardiomyopathic phenotype was observed (Singh et al. 2017).
However, the role of the ALP and its biological activity within human inherited
cardiomyopathies needed to be further elucidated.
Common autophagy alteration in cardiac tissue samples of HCM and DCM patients
Thus, the putative alteration of the ALP was investigated in septal myectomies of HCM patients
carrying MYBPC3 mutations, explanted hearts of DCM patients and NF individuals as controls.
The main markers of autophagy were evaluated by immunoblotting (Figure 13A). LC3-II is
found in the inner and outer membrane of the autophagosome and is degraded within the
autolysosomes. LC3-II protein levels were >2.5-fold higher in HCM and DCM patients than in
NF samples (Figure 13B), implying either an increased formation or accumulation of
autophagosomes. p62 is a shuttle protein that guides poly-ubiquitinated aggregates to the
ALP. In DCM, p62 protein levels were 2.5-fold higher than in NF samples, indicating either an
increase or accumulation of poly-ubiquitinated proteins (Figure 13C). In contrast, p62 levels
did not differ between HCM and NF samples. To validate the activity of the main negative
regulator of autophagy, mTORC1, the protein levels of one downstream target of mTORC1,
phosphorylated S6 (pS6) were determined (Figure 13D). Markedly lower levels of pS6 were
detected in HCM and DCM than in NF samples. Furthermore, the protein levels of LAMP-2,
one of the main markers of lysosomes, were determined. LAMP-2 protein levels were
dramatically lower in HCM samples, whereas they were 3-fold higher in DCM than in NF
samples (Figure 13E).

Results
51
Figure 13: Protein levels of autophagy markers in ventricular tissues of HCM and DCM
patients. A representative WB of the main marker of the ALP determined in HCM carrying a
mutation in MYBPC3 and DCM patients in relation to NF samples (A) and its quantifications
are shown (B - E). Calsequestrin (CSQ), S6 and ponceau were used as loading controls and
for normalization. Data are expressed as mean±SEM (*p<0.05, **p<0.01, ***p<0.001 vs NF,
unpaired Student’s t-test). N-numbers are indicated (see bars).
Then, gene expression analysis of NF, HCM and DCM patient samples was performed with
the NanoString technology (Figure 14). Hereby, the group of HCM patients carrying a MYBPC3
mutation and HCM patients with non-MYBPC3 mutations were merged since statistical
analysis did not show any significant differences between those two groups.
Higher levels of natriuretic peptide A (NPPA) and periostin (POSTN) and lower levels of cardiac
alpha-myosin heavy chain (MYH6) and signal transducer and activator of transcription 3
(STAT3) were detected. This data confirmed the diseased state of the HCM and DCM patients.
Furthermore, alterations in the expression of genes contributing to Ca2+ handling (e.g. lower
levels of ATPase sarcoplasmic/endoplasmic reticulum Ca2+ transporting 2 (ATP2A2) or protein
phosphatase 1 regulatory inhibitor subunit 1A (PPP1R1A)) or fibrosis (e.g. higher levels of
collagen type I alpha 1 chain (COL1A1)) were detected in HCM and DCM patients when
compared to NF individuals. The gene expression analysis of the main marker of autophagy
in HCM and DCM patient samples, revealed a diverse, inconclusive pattern. For instance,
lower levels of microtubule associated protein 1 light chain 3 beta (MAP1LC3B) encoding LC3B
and higher levels of mechanistic target of rapamycin kinase (MTOR) were detected in both
HCM and DCM, whereas the levels of lysosomal-associated membrane protein 2 (LAMP2)
and sequestome 1 (SQSTM1) mRNA did not differ between HCM, DCM and NF samples.

Results
52
Figure 14: Determination of mRNA levels in ventricular tissue of HCM and DCM patients.
Gene expression analysis was performed to analyse the main marker of the ALP, as well as
the pathomechanism, fibrosis and Ca2+ handling in HCM and DCM tissue samples and
compared to NF individuals. n = number of individuals. mRNA levels were determined in single
samples that were pooled for data analysis. Data were normalized to six housekeeping genes
(ABCF1, ACTB, CLTC, GAPDH, PGK1, TUBB) and related to NF. A cut-off of <0.8 or >1.2-
fold change to NF was set for the heatmap construction. Exemptions were made for several
genes (e.g. LAMP1 and LAMP2) as they represent important markers, in this case for the ALP.
Data are expressed as mean±SEM (*p<0.05, **p<0.01 vs NF, unpaired Student’s t-test).
Evaluation of the autophagic flux in hiPSC-derived cardiomyocytes
It is not sufficient to determine basal levels of the main marker of the ALP to validate whether
the ALP is actually activated or impaired in human inherited cardiomyopathies. Therefore, the
autophagic flux/biological activity has to be evaluated. Unfortunately, it was not feasible to
assess the autophagic flux in human myocardial samples since an ALP modulator treatment
is needed. However, hiPSC-CMs represent a suitable in vitro tool since an ALP treatment can
be performed. Evaluation of the autophagic flux is estimated with the difference in LC3-II
protein between treated and untreated samples, as LC3-II is part of the autophagosome
membrane and is degraded within autolysosomes.
First, the feasibility of the autophagic flux evaluation in hiPSC-CMs had to be tested. Therefore,
hiPSCs from a healthy individual were first differentiated into beating CMs (Breckwoldt et al.
2017), cultured in 2D and on day 30 a 3 h treatment was performed. HiPSC-CMs were treated
either with 50 nM Bafilomycin A1 (Bafilo), a vascular type H(+)-ATPase that acts as an
autophagosome-lysosome fusion inhibitor, alone or in combination with 2.5 µM Rapa, an

Results
53
inhibitor of the main negative regulator of autophagy, mTORC1, and thus activates the ALP.
Subsequently, the hiPSC-CMs were harvested, snap-frozen and analysed by immunoblotting
(Figure 15). Treatment with Bafilo, alone or in combination with Rapa, induced a marked
accumulation in LC3-II protein, due to the block of autophagosome-lysosome fusion. Similarly,
higher level of p62 protein, but to a lower extent than LC3-II, were present in the Bafilo-treated
hiPSC-CMs. As expected, Rapa treatment, alone or in combination with Bafilo, induced a
marked reduction of pS6 levels, a downstream target of mTORC1. ALP modulator treatment
revealed that the evaluation of the autophagic flux is feasible in hiPSC-CMs and thus in human
inherited cardiomyopathies.
Figure 15: Establishment of autophagic flux evaluation in hiPSC-CMs. HiPSC-CMs of a
healthy individual were cultured for 30 days in vitro before treatment with 2.5 µM Rapa, alone
or in combination with 50 nM Bafilo. Immunoblotting results of LC3-II, p62 and pS6 are shown.
CSQ, S6 and ponceau were used as loading controls.
Evaluation of the autophagy-lysosomal pathway in hiPSC-derived cardiomyocytes
from patients with inherited cardiomyopathies
Next, hiPSC-CMs derived from an HCM patient (c.740C>T, p.T247M missense mutation in α-
actinin 2 (ACTN2); heterozygous (HCMhet) and homozygous (HCMhom)) and a DCM patient
(c.40_42delAGA, pArg14del mutation in PLN; heterozygous (DCM)), their corresponding
isogenic CRISPR controls (HCMrepair and DCMrepair) and a healthy control (healthy ctrl)
were systematically evaluated for a putative common alteration of autophagy in inherited
cardiomyopathies. Therefore, all hiPSC-CM lines were cultured for 30 days while being
constantly monitored by light microscopy (representative Figure 16 and Figure S2).
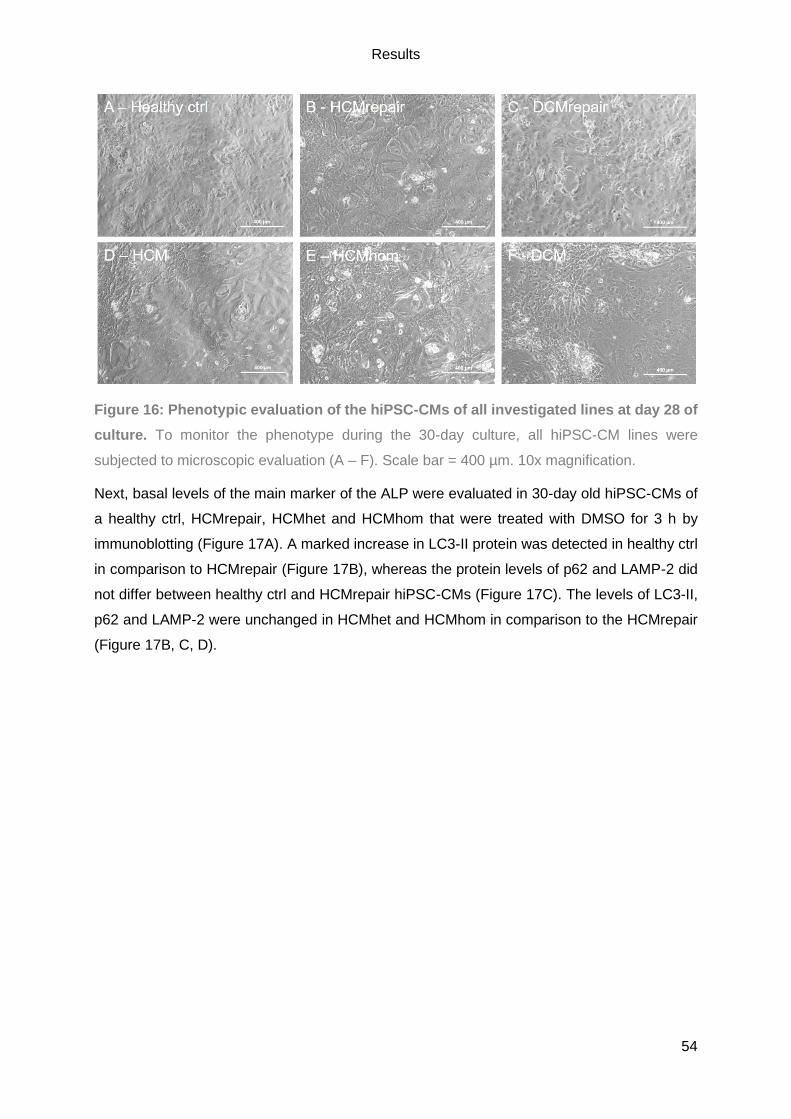
Results
54
Figure 16: Phenotypic evaluation of the hiPSC-CMs of all investigated lines at day 28 of
culture. To monitor the phenotype during the 30-day culture, all hiPSC-CM lines were
subjected to microscopic evaluation (A – F). Scale bar = 400 µm. 10x magnification.
Next, basal levels of the main marker of the ALP were evaluated in 30-day old hiPSC-CMs of
a healthy ctrl, HCMrepair, HCMhet and HCMhom that were treated with DMSO for 3 h by
immunoblotting (Figure 17A). A marked increase in LC3-II protein was detected in healthy ctrl
in comparison to HCMrepair (Figure 17B), whereas the protein levels of p62 and LAMP-2 did
not differ between healthy ctrl and HCMrepair hiPSC-CMs (Figure 17C). The levels of LC3-II,
p62 and LAMP-2 were unchanged in HCMhet and HCMhom in comparison to the HCMrepair
(Figure 17B, C, D).
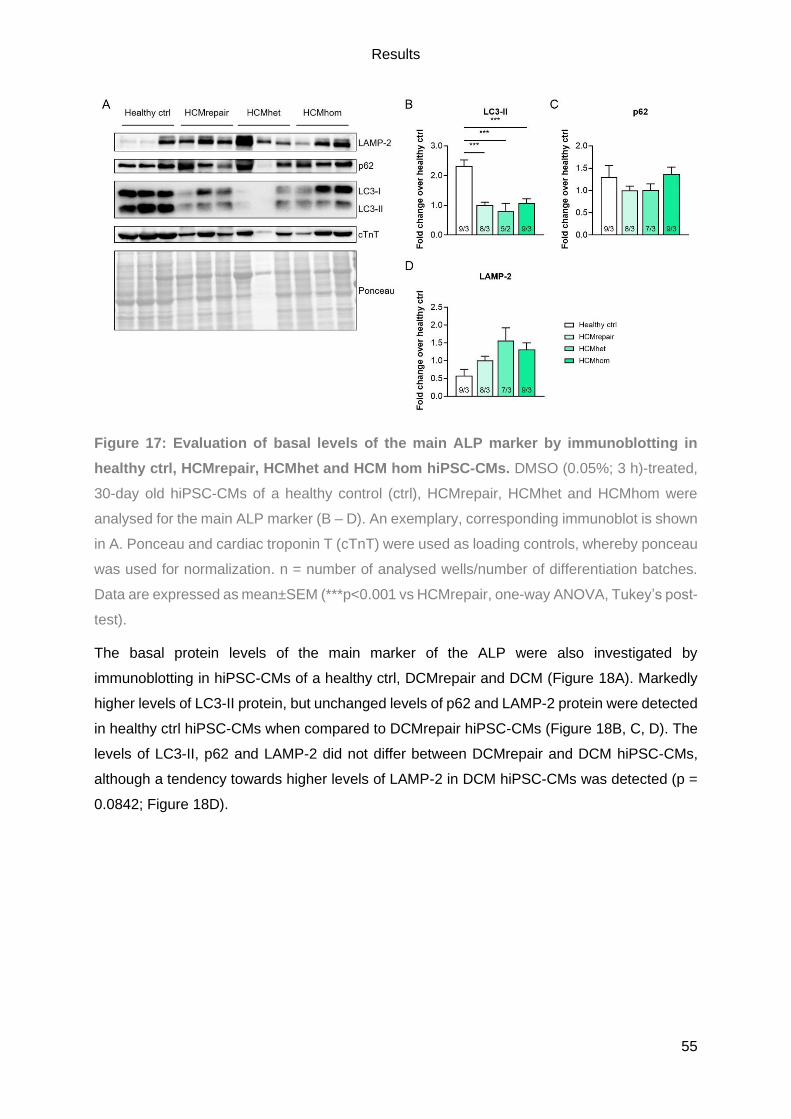
Results
55
Figure 17: Evaluation of basal levels of the main ALP marker by immunoblotting in
healthy ctrl, HCMrepair, HCMhet and HCM hom hiPSC-CMs. DMSO (0.05%; 3 h)-treated,
30-day old hiPSC-CMs of a healthy control (ctrl), HCMrepair, HCMhet and HCMhom were
analysed for the main ALP marker (B – D). An exemplary, corresponding immunoblot is shown
in A. Ponceau and cardiac troponin T (cTnT) were used as loading controls, whereby ponceau
was used for normalization. n = number of analysed wells/number of differentiation batches.
Data are expressed as mean±SEM (***p<0.001 vs HCMrepair, one-way ANOVA, Tukey’s post-
test).
The basal protein levels of the main marker of the ALP were also investigated by
immunoblotting in hiPSC-CMs of a healthy ctrl, DCMrepair and DCM (Figure 18A). Markedly
higher levels of LC3-II protein, but unchanged levels of p62 and LAMP-2 protein were detected
in healthy ctrl hiPSC-CMs when compared to DCMrepair hiPSC-CMs (Figure 18B, C, D). The
levels of LC3-II, p62 and LAMP-2 did not differ between DCMrepair and DCM hiPSC-CMs,
although a tendency towards higher levels of LAMP-2 in DCM hiPSC-CMs was detected (p =
0.0842; Figure 18D).

Results
56
Figure 18: Investigation of the basal levels of the main ALP marker by immunoblotting
in healthy ctrl, DCMrepair and DCM hiPSC-CMs. Thirty-day-old hiPSC-CMs were treated
for 3 h with 0.1% DMSO (0.05%; 3 h). Subsequently, the main marker of the ALP was analysed
by immunoblotting (B – D) whereby an exemplary, corresponding immunoblot is shown in A.
Ponceau and cTnT were used as loading controls, whereby ponceau was used for
normalization. n = number of analysed wells/number of differentiation batches. Data are
expressed as mean±SEM (**p<0.01, ***p<0.001 vs DCMrepair, one-way ANOVA, Tukey’s
post-test).
On day 30 of culture, the hiPSC-CMs were treated either with DMSO (0.05%) or Bafilo (50 nM)
and subsequently the protein levels of LC3-II and p62 were investigated (Figure 19A - F). Bafilo
treatment induced a marked, significant increase in LC3-II protein levels in all investigated
hiPSC-CM lines (Figure 19G). The increase in LC3-II protein was similar in HCMrepair and
DCMrepair hiPSC-CMs, whereas healthy ctrl hiPSC-CMs showed an increase of LC3-II to a
higher extent. Of interest, the levels of LC3-II protein increased to a higher extent in HCMhet
and HCMhom than in HCMrepair, indicating an increased autophagic flux in the mutated HCM
hiPSC-CMs. In contrast, LC3-II protein levels were increased to a lower extent in DCM than
DCMrepair, implying a reduced autophagic flux in the diseased DCM hiPSC-CMs. In case of
p62, higher protein levels were solely determined in healthy ctrl and HCMhet hiPSC-CMs after
Bafilo treatment (Figure 19H), suggesting that the autophagic flux was overall not well detected
on p62 level. However, p62 might have formed aggregates after Bafilo treatment, which could
not have been detected with the here applied protein lysis buffer.

Results
57
Figure 19: Analysis of the autophagic flux by immunoblotting in hiPSC-CMs. Thirty-day-
old hiPSC-CMs of a healthy ctrl, HCMrepair, HCMhet, HCMhom, DCMrepair and DCM were
treated either with 0.05% DMSO or 50 nM Bafilo for 3 h. The corresponding quantifications of
LC3-II and p62 are shown (G + H), as well as exemplary immunoblots for all investigated cell
lines (A - F). Ponceau and cTnT were used as a loading controls. However, solely ponceau
was used for normalization. n = number of analysed wells/number of differentiation batches.
Data are expressed as mean±SEM (*p<0.05, **p<0.01, ***p<0.001 vs corresponding DMSO
control, unpaired Student’s t-test).

Results
58
Concurrently, samples of all six hiPSC-CM lines were treated on day 30 of culture either with
DMSO (0.05%) or Bafilo (50 nM) and sent as frozen pellets to our collaborators at the
University Medicine Greifswald (Dr. Elke Hammer and Maren Depke, Interfaculty Institute of
Genetics and Functional Genomics) for mass spectrometry analysis. They processed and
analysed the samples with the LC-MS/MS. Unfortunately, due to technical issues one batch of
HCMhet was lost. Furthermore, to validate the Bafilo treatment, the protein levels of p62 were
evaluated by LC-MS/MS of DMSO and Bafilo treated hiPSC-CMs (Figure 20). The protein
levels of LC3-II were not used to validate the Bafilo treatment since an additional enrichment
step for post-translational modifications would have been needed to detect the lipidated form
of LC3 with the LC-MS/MS. For all investigated hiPSC-CM lines, an increase in p62 protein
level was detected after Bafilo treatment, suggesting that the autophagic flux worked, but it
was significant only in the healthy ctrl, HCMhet, HCMhom and DCMrepair hiPSC-CMs. Of
note, the autophagic flux increase for each individual hiPSC-CM line is quite similar to the
increase detected in LC3-II after Bafilo treatment by immunoblotting (see Figure 19).
Figure 20: Autophagic flux evaluation with p62 protein level in all investigated hiPSC-
CMs determined by mass spectrometry analysis. Thirty-day-old hiPSC-CMs were either
treated with DMSO (0.05%) or Bafilo (50 nM) for 3 h and subsequently analysed by LC-MS/MS.
Normalized Hi3 protein intensities are shown. n = number of wells/number of differentiation
batches. Data are expressed as mean±SEM (p*<0.05, p***<0.001 vs corresponding control;
unpaired Student’s t-test).
The principal component analysis (PCA) of the data set is shown with its five dimensions
(Figure 21). The most prominent finding was a vast difference between DCM and DCMrepair
hiPSC-CMs in comparison to the remaining hiPSC-CM lines as displayed in the1st Dimension.
The 2nd dimension of the PCA pointed out the big difference between the DCM, HCM (each
with its isogenic controls) and healthy control hiPSC-CMs. Unfortunately, the 3rd dimension of
the PCA showed that the effect of the Bafilo treatment was lower than the batch-to-batch

Results
59
variability. This was quite unexpected, since the Bafilo treatment effect detected by
immunoblotting was quite obvious (see Figure 19), as well as the effect on p62 detected by
mass spectrometry (see Figure 20).
Figure 21: PCA analysis of treated hiPSC-CMs. The 1st dimension highlighted the vast
difference between DCM and DCM repair to the other investigated cell lines. The 2nd dimension
showed the big difference between DCM, HCM (each with its isogenic control) and healthy
control. The 3rd dimension demonstrated that the effect of the Bafilo treatment is lower than
the batch-to-batch variability. The 4th and 5th dimensions did not show a clear picture and were
difficult to interpret. n = number of analysed wells/number of differentiation batches.
For better illustration, a 3D PCA plot was created that visualizes the more prominent effect of
the marked difference between different cell lines and batches (Figure 22A; 1st and 2nd
dimension of the ‘regular’ PCA) in contrast to the effect of the Bafilo treatment (Figure 22E; 3rd
dimension of the ‘regular’ PCA). Moreover, the dramatic difference between batches (Figure
22B), between the different hiPSC-CM lines (Figure 22C) and the genetic background (Figure
22D) was also visualized in a 3D PCA plot.

Results
60
Figure 22: 3D PCA plots of the investigated hiPSC-CM lines. 3D PCA plot of all treated
hiPSC-CMs revealed a vast difference between cell lines and batches (A). The dramatic
difference between the batches (B), the marked difference between the different hiPSC-CMs
lines (C) and the genetic background (D) is shown. The difference between cell lines and
batches was stronger than the effect of the actual Bafilo treatment (E). n = number of analysed
wells within one batch/number of batches (if not otherwise indicated in the legend).
However, the marked difference between the different genetic backgrounds was also detected
by immunoblotting. A representative immunoblot is shown in Figure S3, whereas the
quantification is shown in Figure 23. Here, the protein levels of LC3-II and p62 were analysed
in hiPSC-CMs of healthy ctrl, HCMrepair and DCMrepair. This analysis revealed a significant
difference between healthy ctrl and HCMrepair and DCMrepair for LC3-II and a significant
difference for p62 between HCMrepair and DCMrepair. Of note, the significantly lower levels
of LC3-II in HCMrepair and DCMrepair hiPSC-CMs were already detected in the evaluation of
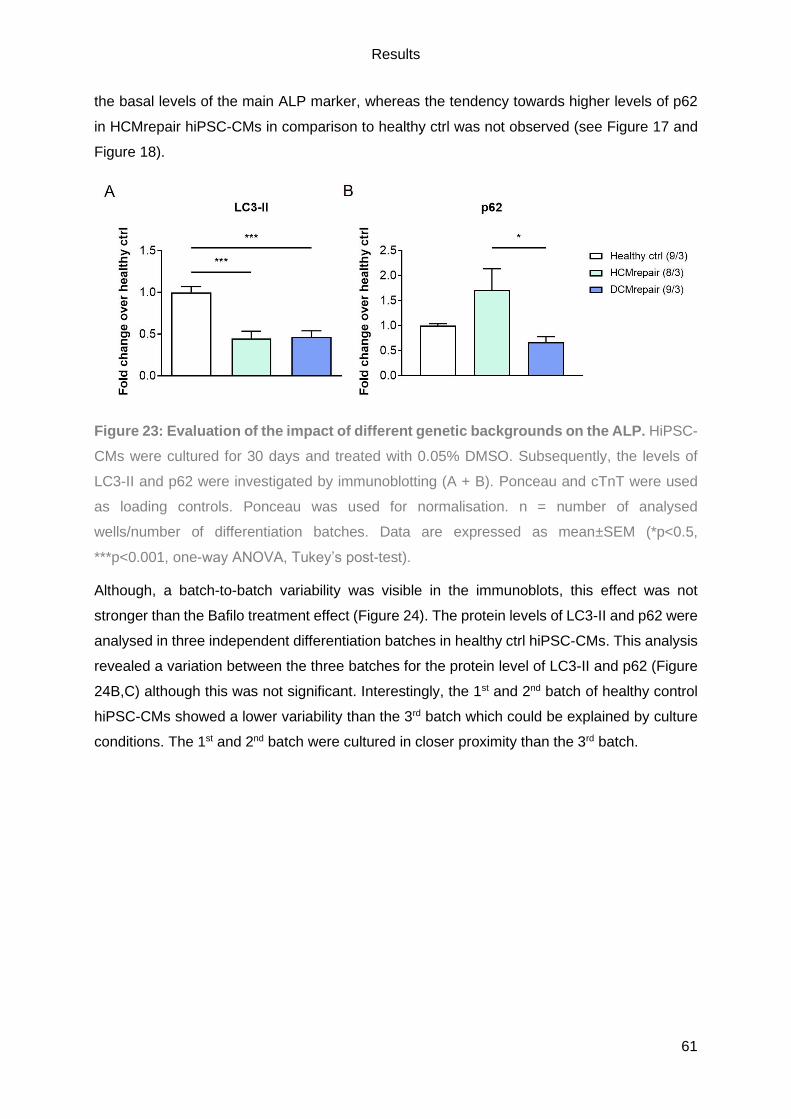
Results
61
the basal levels of the main ALP marker, whereas the tendency towards higher levels of p62
in HCMrepair hiPSC-CMs in comparison to healthy ctrl was not observed (see Figure 17 and
Figure 18).
Figure 23: Evaluation of the impact of different genetic backgrounds on the ALP. HiPSC-
CMs were cultured for 30 days and treated with 0.05% DMSO. Subsequently, the levels of
LC3-II and p62 were investigated by immunoblotting (A + B). Ponceau and cTnT were used
as loading controls. Ponceau was used for normalisation. n = number of analysed
wells/number of differentiation batches. Data are expressed as mean±SEM (*p<0.5,
***p<0.001, one-way ANOVA, Tukey’s post-test).
Although, a batch-to-batch variability was visible in the immunoblots, this effect was not
stronger than the Bafilo treatment effect (Figure 24). The protein levels of LC3-II and p62 were
analysed in three independent differentiation batches in healthy ctrl hiPSC-CMs. This analysis
revealed a variation between the three batches for the protein level of LC3-II and p62 (Figure
24B,C) although this was not significant. Interestingly, the 1st and 2nd batch of healthy control
hiPSC-CMs showed a lower variability than the 3rd batch which could be explained by culture
conditions. The 1st and 2nd batch were cultured in closer proximity than the 3rd batch.

Results
62
Figure 24: Batch-to-batch variability in healthy ctrl hiPSC-CMs. Three independent
differentiation batches of healthy ctrl hiPSC-CMs were treated with 0.05% DMSO and
subsequently analysed for the basal levels of LC3-II (B) and p62 protein (C) by immunoblotting
(A). HiPSC-CMs were cultured for 30 days. Ponceau and cTnT were used as loading controls,
Ponceau was used for normalisation. n = 3 wells/batch. Data are expressed as mean±SEM
(one-way ANOVA, Tukey’s post-test).
Further, a batch-to-batch variability was also displayed in DCMrepair hiPSC-CMs (Figure 25).
Here, a significant difference between the three batches for the levels of p62 were detected
(Figure 25C). For LC3-II, there is only a tendency towards lower LC3-II levels in the 3rd batch
(Figure 25B). Noteworthy, the 2nd and 3rd batches were cultured in closer proximity than the 1st
batch.

Results
63
Figure 25: Batch-to-batch variability in DCMrepair hiPSC-CMs. Protein levels of LC3-II (A)
and p62 protein (B) were analysed by immunoblotting (A) in hiPSC-CMs that were cultured for
30 days and treated with 0.05% DMSO. Ponceau and cTnT were used as loading controls,
whereas ponceau was used normalization. n = 3 wells/batch. Data are expressed as
mean±SEM (***p<0.001, one-way ANOVA, Tukey’s post-test).
The batch-to-batch variability was much more prominent, when cTnT instead of ponceau was
used as a cardiac loading control (Figure 26), demonstrated by a significant difference in LC3-
II (Figure 26B) and p62 (Figure 26C) protein levels between the three independent batches of
DCMrepair hiPSC-CMs.
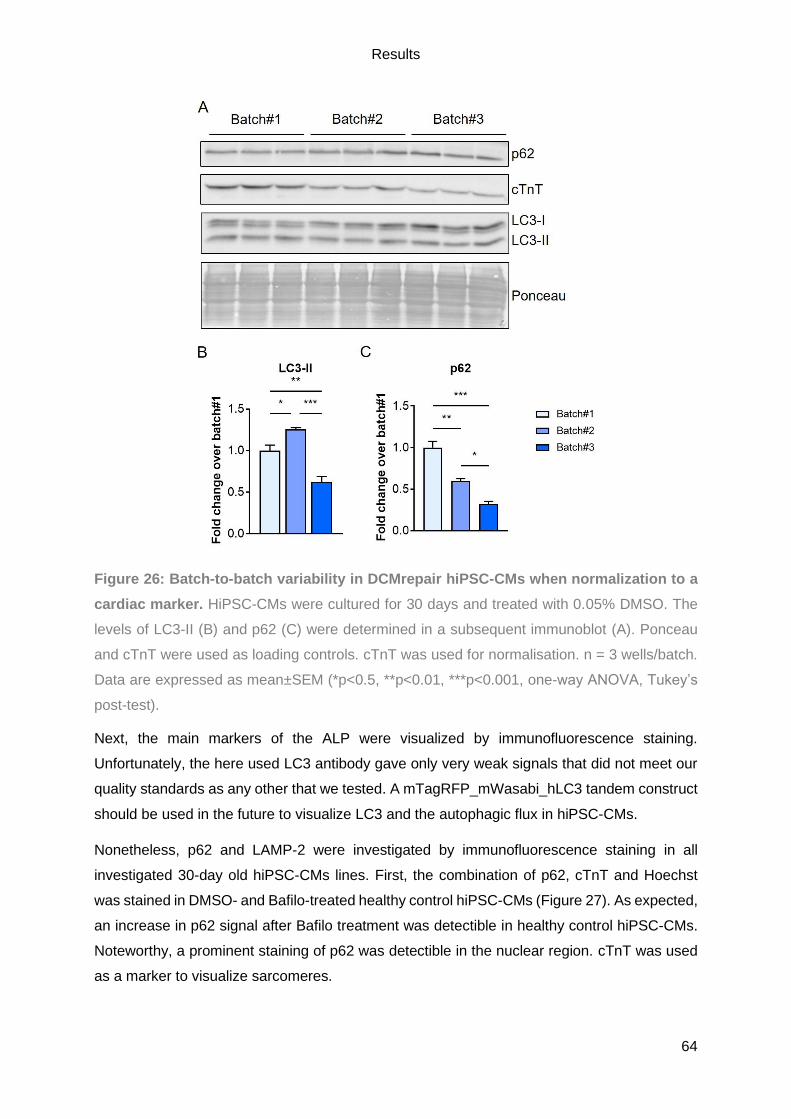
Results
64
Figure 26: Batch-to-batch variability in DCMrepair hiPSC-CMs when normalization to a
cardiac marker. HiPSC-CMs were cultured for 30 days and treated with 0.05% DMSO. The
levels of LC3-II (B) and p62 (C) were determined in a subsequent immunoblot (A). Ponceau
and cTnT were used as loading controls. cTnT was used for normalisation. n = 3 wells/batch.
Data are expressed as mean±SEM (*p<0.5, **p<0.01, ***p<0.001, one-way ANOVA, Tukey’s
post-test).
Next, the main markers of the ALP were visualized by immunofluorescence staining.
Unfortunately, the here used LC3 antibody gave only very weak signals that did not meet our
quality standards as any other that we tested. A mTagRFP_mWasabi_hLC3 tandem construct
should be used in the future to visualize LC3 and the autophagic flux in hiPSC-CMs.
Nonetheless, p62 and LAMP-2 were investigated by immunofluorescence staining in all
investigated 30-day old hiPSC-CMs lines. First, the combination of p62, cTnT and Hoechst
was stained in DMSO- and Bafilo-treated healthy control hiPSC-CMs (Figure 27). As expected,
an increase in p62 signal after Bafilo treatment was detectible in healthy control hiPSC-CMs.
Noteworthy, a prominent staining of p62 was detectible in the nuclear region. cTnT was used
as a marker to visualize sarcomeres.

Results
65
Figure 27: p62 evaluation in 30-day-old hiPSC-CMs healthy ctrl by immunofluorescence
staining. Thirty-day-old hiPSC-CMs were treated either with 0.05% DMSO or 50 nM Bafilo for
3 h and stained for p62 (orange), cTnT (green) and Hoechst (blue). The merged images, a
zoom of the merged images and the single channels of p62 and cTnT are shown. White box
highlights the magnified area (zoom). Scale bar = 50 µm. 40x magnification.
Next, p62 in combination with cTnT and Hoechst was stained in treated hiPSC-CMs of
HCMrepair, HCMhet and HCMhom (Figure 28). Overall, the Bafilo treatment did increase the
p62 signal intensity in all three HCM hiPSC-CM lines. Of note, the p62 signal intensity seemed
stronger in HCMhom hiPSC-CMs than in HCMrepair and HCMhet at baseline and after Bafilo
treatment.
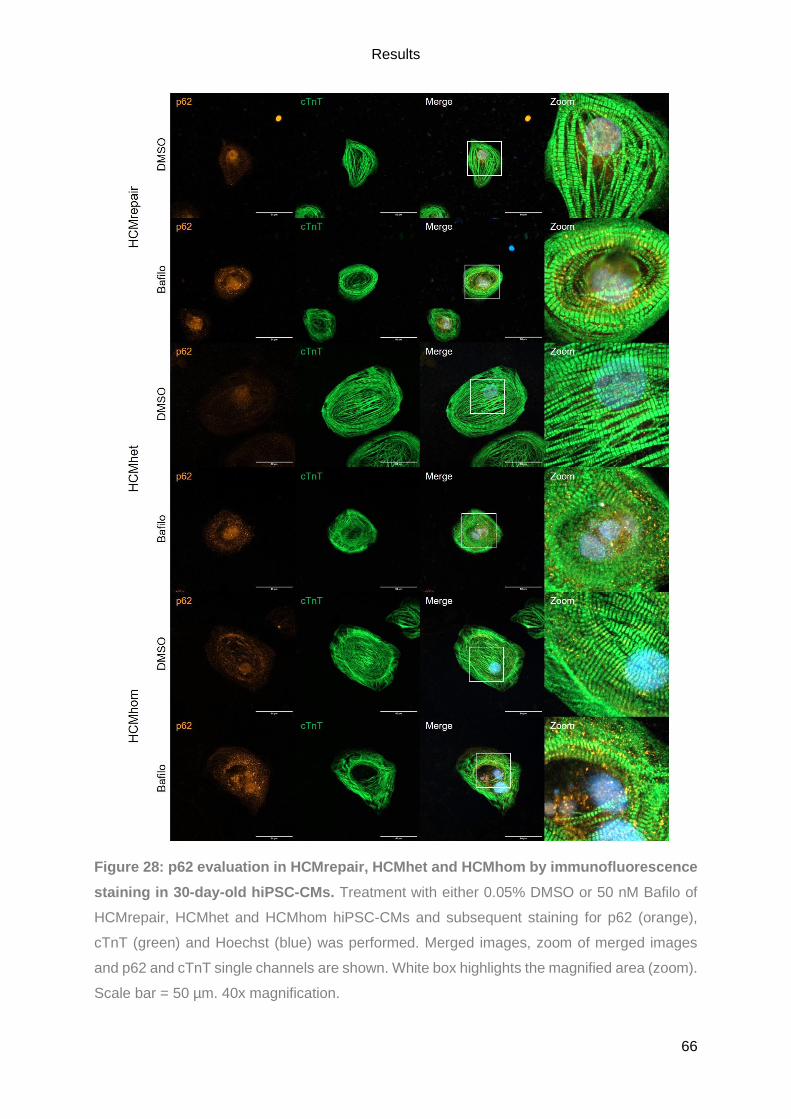
Results
66
Figure 28: p62 evaluation in HCMrepair, HCMhet and HCMhom by immunofluorescence
staining in 30-day-old hiPSC-CMs. Treatment with either 0.05% DMSO or 50 nM Bafilo of
HCMrepair, HCMhet and HCMhom hiPSC-CMs and subsequent staining for p62 (orange),
cTnT (green) and Hoechst (blue) was performed. Merged images, zoom of merged images
and p62 and cTnT single channels are shown. White box highlights the magnified area (zoom).
Scale bar = 50 µm. 40x magnification.

Results
67
Quite striking was the detection of striated structures with p62 after bafilo treatment that was
the most visible in all HCM hiPSC-CM lines but most prominent in HCMhom hiPSC-CMs
(Figure 29), which also showed a marked decrease in the levels of many components of the
sarcomere in the mass spectrometry analysis (data not shown). The detection of striated
structures with p62 suggests a higher ALP activity along sarcomeres, although a counter-
staining for a sarcomeric protein is missing.
Figure 29: p62 immunofluorescence staining in HCMhom hiPSC-CMs. Thirty-day old
hiPSC-CMs of HCMhom were either treated with DMSO (0.05%) or Bafilo (50 nM) and stained
for p62 (orange). The single image as well as a zoom of it is shown. Noteworthy is the nice
striation of the sarcomere visualized with p62 staining. White box highlights the magnified area
(zoom). Scale bar = 50 µm. 40x magnification.
Furthermore, DCMrepair and DCM hiPSC-CMs treated with either DMSO or Bafilo were
stained for p62, cTnT and Hoechst (Figure 30). Again, the Bafilo treatment induced an increase
in p62 signal in both hiPSC-CM lines. Overall, p62 seemed to be quite strong but it is
noteworthy that overall morphology was not as ‘beautiful’ as in the other investigated hiPSC-
CM lines since fibroblasts were visualized in these images.

Results
68
Figure 30: p62 evaluation in DCMrepair and DCM by immunofluorescence staining in
30-day-old hiPSC-CMs. Treatment with either 0.05% DMSO or 50 nM Bafilo of DCMrepair
and DCM hiPSC-CMs and subsequent staining for p62 (orange), cTnT (green) and Hoechst
(blue) was performed. Merged images, a zoom of the merged images and p62 and cTnT single
channels are shown. White box highlights the magnified area (zoom). Scale bar = 50 µm. 40x
magnification.
To visualize LAMP-2 protein in all investigated hiPSC-CM lines, immunofluorescence staining
in combination with titin and Hoechst was performed in untreated 30-day old hiPSC-CMs
(Figure 31). The perinuclear localization of LAMP-2 was clearly visible in all hiPSC-CM lines,
as well as an even distribution all over the cell. By eye, there was no dramatic difference
between the here evaluated hiPSC-CM lines. Titin was used to visualize the striated
sarcomere.
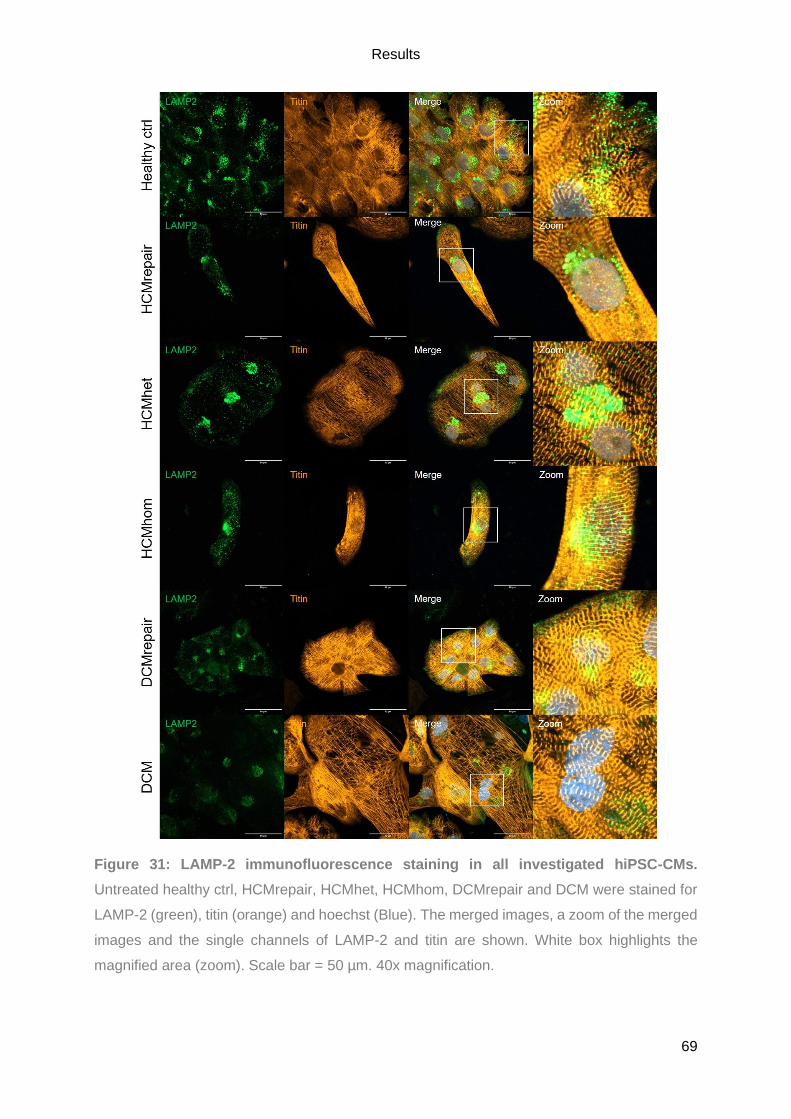
Results
69
Figure 31: LAMP-2 immunofluorescence staining in all investigated hiPSC-CMs.
Untreated healthy ctrl, HCMrepair, HCMhet, HCMhom, DCMrepair and DCM were stained for
LAMP-2 (green), titin (orange) and hoechst (Blue). The merged images, a zoom of the merged
images and the single channels of LAMP-2 and titin are shown. White box highlights the
magnified area (zoom). Scale bar = 50 µm. 40x magnification.

Results
70
4.2. Generation and validation of MYBPC3-deficient hiPSC-derived cardiomyocytes as a
human in vitro model of HCM
In order to investigate the role of cMyBP-C in hiPSC-CMs and HCM, a stable MYBPC3-
knockout (KO) hiPSC-line had to be generated. Therefore, the cutting-edge genome editing
technology CRISPR/Cas9 was used to mimic a founder mutation from Tuscany, Italy
(c.772G>A; Olivotto et al. 2008), aiming to introduce a frameshift mutation that results in the
absence of cMyBP-C. In HCM patients carrying this founder mutation, a nonsense mRNA was
detected, leading to a PTC in exon 9 due to skipping of exon 6 and thus this would result in a
truncated protein (Helms et al. 2014). Further, in an HCM mouse model carrying a Mybpc3-
targeted knock-in mutation that resembles this founder mutation, three different forms of
mRNA were detected. A missense mRNA, which results in a E264K 150 kDa cMyBP-C, a
nonsense mRNA, where skipping of exon 6 leads to a PTC in exon 9 and a putative truncated
protein, and a deletion/insertion mRNA. Here, the skipping of exon 6 is accompanied by the
partial retention of intron that restores the reading frame, resulting in a 147 kDa cMyBP-C
(Vignier et al. 2009).
Selection of MYBPC3 target sequence
The overall CRISPR/Cas9-mediated KO approach for MYBPC3 was based on a publication
from Ran and colleagues (Ran et al. 2013) and was designed with an online tool from MIT
(http://crispr.mit.edu/). To validate whether the targeted genomic loci within the here used
healthy control hiPSC line ERC018 does not carry any SNPs or mutations, it was amplified by
PCR and sent for sequencing (for primers see Table S5; for protocol see 3.2.1). Neither a SNP,
nor a mutation was detected (Figure 32) and thus, the MIT tool-based designed sgRNA was
suitable to target MYBPC3 in ERC018. Subsequently the designed sgRNA was subcloned into
the plasmid encoding the Cas9 nuclease and GFP (see 3.2.2).
Figure 32: Validation of the genomic loci targeted by the designed sgRNA in ERC018.
The database sequence of the targeted genomic loci extracted from the human genome
assembly GRCh38/hg38 and the sequencing results of the targeted genomic loci in ERC018
hiPSCs are shown. Sequencing alignment has been created with SnapGene. Red nucleotides

Results
71
indicate the putative cutting site. Yellow feature = exon 6. Dark blue feature = sgRNA. Light
blue feature = PAM.
Nucleofection optimization for ERC018
Nucleofection is the best-known transfection method for hiPSCs and was therefore chosen to
genetically modify ERC018. Since, hiPSCs lines differ a lot regarding their nucleofection
efficiency and susceptibility an optimization run was performed. Therefore, 200,000 cells were
nucleofected with the pmaxGFP vector (0.5 µg) and subsequently analysed by flow cytometry
to determine the best combination of nucleofection buffer (P3 or P4) and program (Table 15;
for further details see 3.2.3).
Table 15: Overview of the nucleofection optimization of ERC018. Results for each tested
condition are shown as number of cells 24 h after nucleofection (5 min measurement at low
flow rate), GFP+ cell number and percentage determined by flow cytometry.
Buffer Program Cell number GFP+ cells Nucleofection efficiency
P3
CA-137 844 100 11.8%
CB-150 978 73 7.5%
CD-118 1391 83 6.0%
CE-118 1209 70 5.8%
CM-113 885 55 6.2%
DC-100 814 39 4.8%
DN-100 1097 57 5.2%
P4
CA-137 422 96 22.7%
CB-150 918 112 12.2%
CD-118 1288 72 5.6%
CE-118 1147 96 8.4%
CM-113 1158 66 5.7%
DC-100 960 42 4.4%
DN-100 1169 47 4.0%
However, due to low survival and many apoptotic cells, the optimization run was repeated in
collaboration with Dr. Alexandra Madsen (see Table 16; Löser 2018). The repetition of the
optimization revealed that the combination of buffer P3 and program CA-137 or CB-150 was
the best combination in terms of high cell survival and nucleofection efficiency and thus
subsequently both combinations were used in parallel for experiments.

Results
72
Table 16: Repetition of nucleofection optimization of ERC018. Again, the table shows for
each tested condition the number of cells 24 h after nucleofection (5 min measurement at low
flow rate), GFP+ cell number and percentage determined by flow cytometry. Program CA-137
and CB-150 combined with buffer P3 appeared to be the best choices (indicated by red box).
Buffer Program Cell number GFP+ cells Nucleofection efficiency
P3
CA-137 2450 1186 48.4%
CB-150 4285 1885 44.0%
CD-118 3923 1278 32.6%
CE-118 3421 1171 34.2%
CM-113 3637 1326 36.5%
DC-100 2426 900 37.1%
DN-100 1086 439 40.4%
P4
CA-137 1533 647 42.2%
CB-150 2419 899 37.2%
CD-118 3329 1138 34.2%
CE-118 3197 1076 33.7%
CM-113 4536 1607 35.4%
DC-100 2309 622 26.9%
DN-100 1426 518 36.3%
Nucleofection and single clone expansion
ERC018 hiPSC (p37) cultivated in mTESR or FTDA were nucleofected with 2000 ng pSpCas9-
MYBPC3-GFP and program CA-137 or CB-150 and visualized 24 h after nucleofection. Figure
33 depicts ERC018 hiPSCs that were cultured in mTESR and either not nucleofected or
nucleofected with program CA-137 or CB-150. Many cells nucleofected with program CA-137
showed a strong GFP signal within their nucleus (Figure 33). In contrast, cells nucleofected
with program CB-150 resulted in a weaker GFP signal within their nucleus (Figure 33). For
both conditions, dead cells were floating in the supernatant but overall CA-137-nucleofected
cells showed better morphology. Cells nucleofected in FTDA and subsequently plated in CoM
showed a very weak GFP signal and abnormal morphology regardless of the program (not
shown), similar to mTESR CB-150-nucleofected cells. As expected, the non-nucleofected
control cells only show an autofluorescent GFP signal (Figure 33).
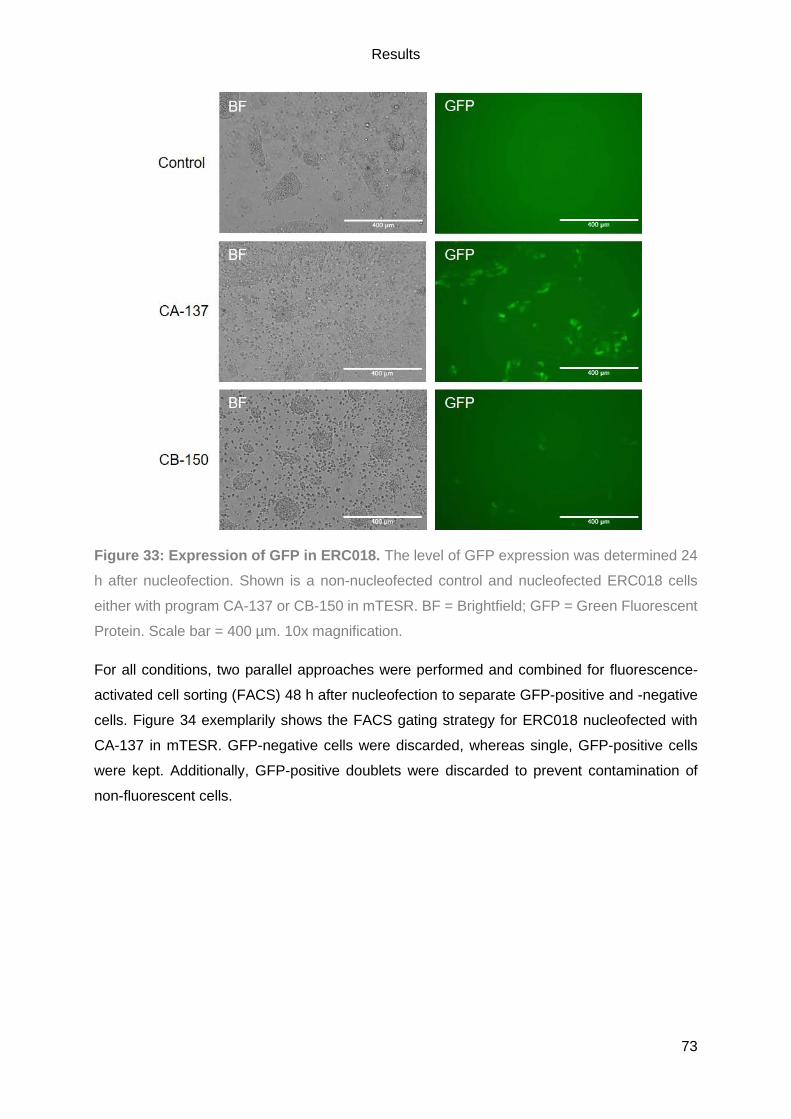
Results
73
Figure 33: Expression of GFP in ERC018. The level of GFP expression was determined 24
h after nucleofection. Shown is a non-nucleofected control and nucleofected ERC018 cells
either with program CA-137 or CB-150 in mTESR. BF = Brightfield; GFP = Green Fluorescent
Protein. Scale bar = 400 µm. 10x magnification.
For all conditions, two parallel approaches were performed and combined for fluorescence-
activated cell sorting (FACS) 48 h after nucleofection to separate GFP-positive and -negative
cells. Figure 34 exemplarily shows the FACS gating strategy for ERC018 nucleofected with
CA-137 in mTESR. GFP-negative cells were discarded, whereas single, GFP-positive cells
were kept. Additionally, GFP-positive doublets were discarded to prevent contamination of
non-fluorescent cells.

Results
74
Figure 34: FACS gating strategy for MYBPC3-KO in ERC018. Performed by the FACS
Sorting Core Unit at the UKE. To exclude dead cells and small debris, cells were distinguished
by their size with the forward scatter (FSC) and granularity with the sideward scatter (SSC)
(P1; A). Aggregates or doublets were excluded by P2 (B) and P3 (C). P4 represents single,
GFP-positive cells (D). E: Population statistics. Red square highlights nucleofection efficiency.
A = Area. H = Height. W = Width
Table 17 lists the number of GFP-positive cells and the nucleofection efficiency for all tested
approaches. The best result was obtained for ERC018 nucleofected with CA-137 in mTESR
with a nucleofection efficiency of 5.8% and 4403 GFP-positive cells. Sorted cells were plated
in a 6-well plate for single colony formation.
Table 17: Overview of the CRISPR run.
Approach GFP + cells Nucleofection efficiency
CA-137 + mTESR 4403 5.8%
CB-150 + mTESR 908 0.6%
CA-137 + CoM 244 6.5%
CB-150 + CoM 153 0.6%
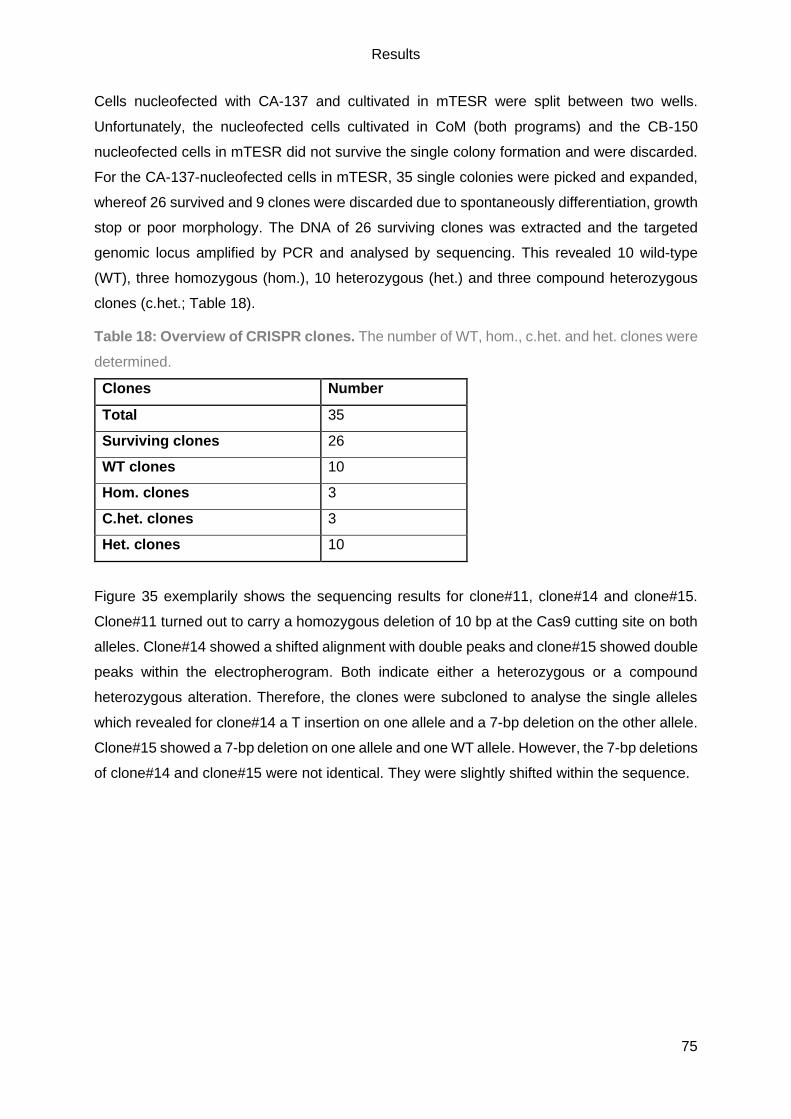
Results
75
Cells nucleofected with CA-137 and cultivated in mTESR were split between two wells.
Unfortunately, the nucleofected cells cultivated in CoM (both programs) and the CB-150
nucleofected cells in mTESR did not survive the single colony formation and were discarded.
For the CA-137-nucleofected cells in mTESR, 35 single colonies were picked and expanded,
whereof 26 survived and 9 clones were discarded due to spontaneously differentiation, growth
stop or poor morphology. The DNA of 26 surviving clones was extracted and the targeted
genomic locus amplified by PCR and analysed by sequencing. This revealed 10 wild-type
(WT), three homozygous (hom.), 10 heterozygous (het.) and three compound heterozygous
clones (c.het.; Table 18).
Table 18: Overview of CRISPR clones. The number of WT, hom., c.het. and het. clones were
determined.
Clones Number
Total 35
Surviving clones 26
WT clones 10
Hom. clones 3
C.het. clones 3
Het. clones 10
Figure 35 exemplarily shows the sequencing results for clone#11, clone#14 and clone#15.
Clone#11 turned out to carry a homozygous deletion of 10 bp at the Cas9 cutting site on both
alleles. Clone#14 showed a shifted alignment with double peaks and clone#15 showed double
peaks within the electropherogram. Both indicate either a heterozygous or a compound
heterozygous alteration. Therefore, the clones were subcloned to analyse the single alleles
which revealed for clone#14 a T insertion on one allele and a 7-bp deletion on the other allele.
Clone#15 showed a 7-bp deletion on one allele and one WT allele. However, the 7-bp deletions
of clone#14 and clone#15 were not identical. They were slightly shifted within the sequence.
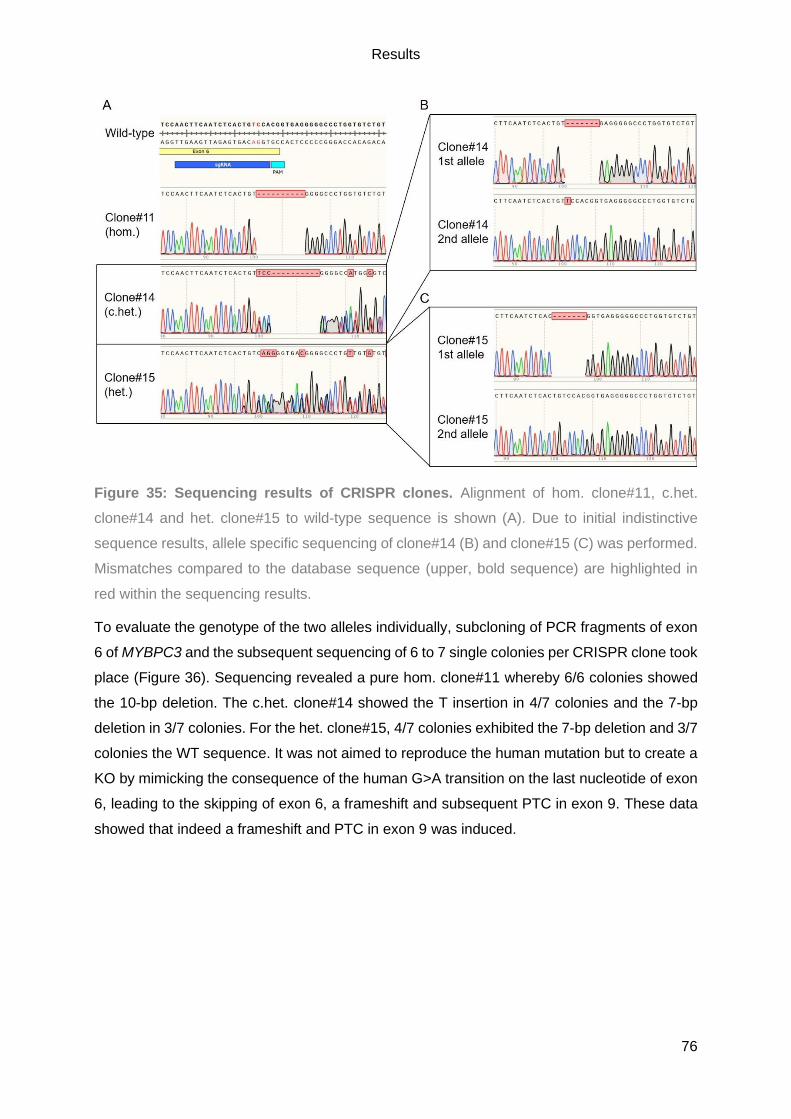
Results
76
Figure 35: Sequencing results of CRISPR clones. Alignment of hom. clone#11, c.het.
clone#14 and het. clone#15 to wild-type sequence is shown (A). Due to initial indistinctive
sequence results, allele specific sequencing of clone#14 (B) and clone#15 (C) was performed.
Mismatches compared to the database sequence (upper, bold sequence) are highlighted in
red within the sequencing results.
To evaluate the genotype of the two alleles individually, subcloning of PCR fragments of exon
6 of MYBPC3 and the subsequent sequencing of 6 to 7 single colonies per CRISPR clone took
place (Figure 36). Sequencing revealed a pure hom. clone#11 whereby 6/6 colonies showed
the 10-bp deletion. The c.het. clone#14 showed the T insertion in 4/7 colonies and the 7-bp
deletion in 3/7 colonies. For the het. clone#15, 4/7 colonies exhibited the 7-bp deletion and 3/7
colonies the WT sequence. It was not aimed to reproduce the human mutation but to create a
KO by mimicking the consequence of the human G>A transition on the last nucleotide of exon
6, leading to the skipping of exon 6, a frameshift and subsequent PTC in exon 9. These data
showed that indeed a frameshift and PTC in exon 9 was induced.
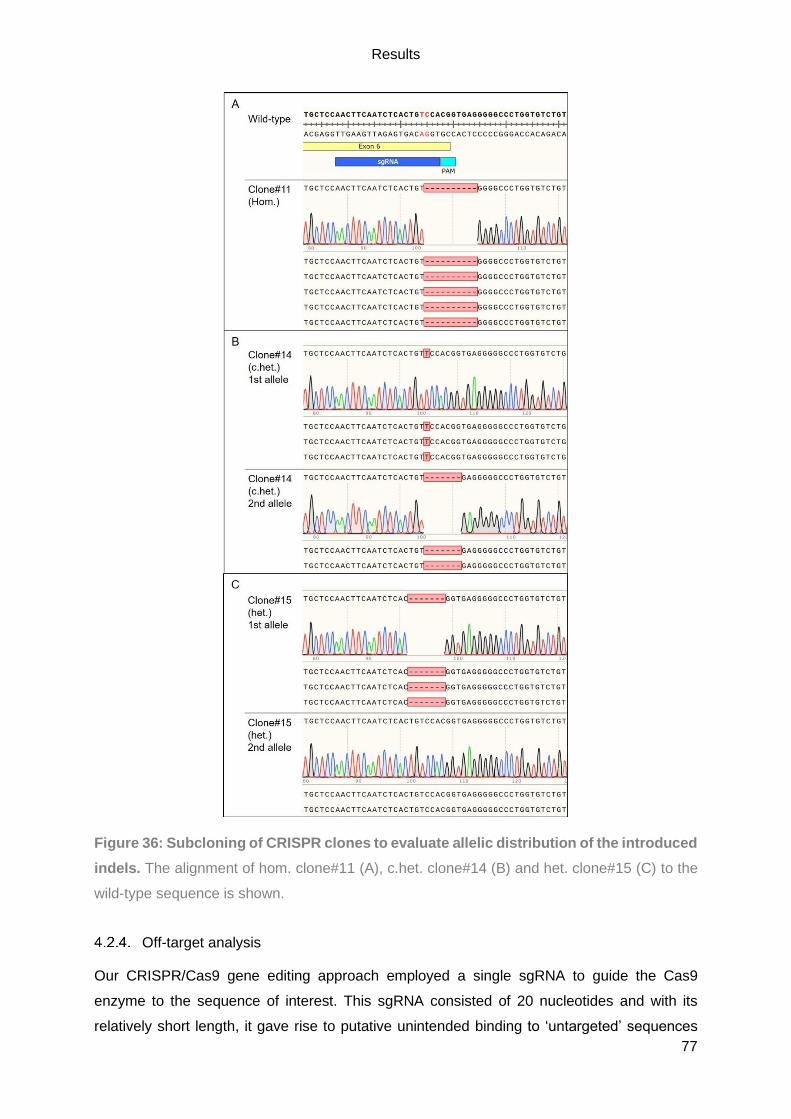
Results
77
Figure 36: Subcloning of CRISPR clones to evaluate allelic distribution of the introduced
indels. The alignment of hom. clone#11 (A), c.het. clone#14 (B) and het. clone#15 (C) to the
wild-type sequence is shown.
Off-target analysis
Our CRISPR/Cas9 gene editing approach employed a single sgRNA to guide the Cas9
enzyme to the sequence of interest. This sgRNA consisted of 20 nucleotides and with its
relatively short length, it gave rise to putative unintended binding to ‘untargeted’ sequences
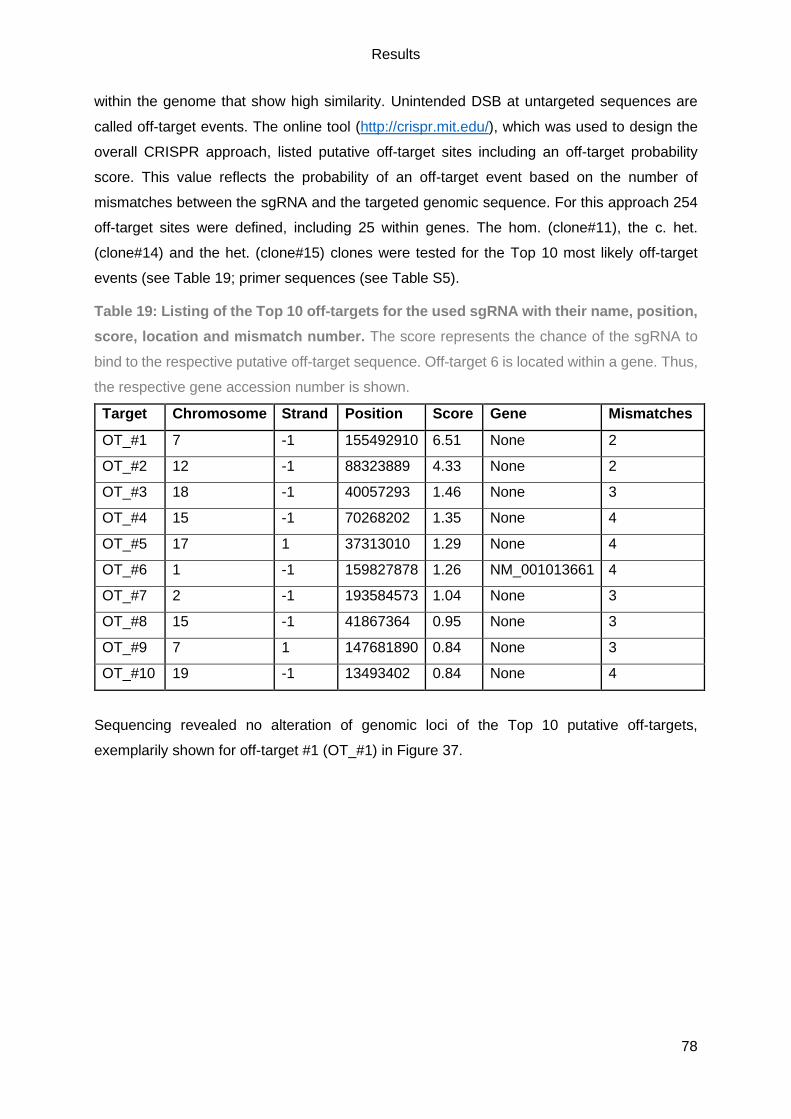
Results
78
within the genome that show high similarity. Unintended DSB at untargeted sequences are
called off-target events. The online tool (http://crispr.mit.edu/), which was used to design the
overall CRISPR approach, listed putative off-target sites including an off-target probability
score. This value reflects the probability of an off-target event based on the number of
mismatches between the sgRNA and the targeted genomic sequence. For this approach 254
off-target sites were defined, including 25 within genes. The hom. (clone#11), the c. het.
(clone#14) and the het. (clone#15) clones were tested for the Top 10 most likely off-target
events (see Table 19; primer sequences (see Table S5).
Table 19: Listing of the Top 10 off-targets for the used sgRNA with their name, position,
score, location and mismatch number. The score represents the chance of the sgRNA to
bind to the respective putative off-target sequence. Off-target 6 is located within a gene. Thus,
the respective gene accession number is shown.
Target Chromosome Strand Position Score Gene Mismatches
OT_#1 7 -1 155492910 6.51 None 2
OT_#2 12 -1 88323889 4.33 None 2
OT_#3 18 -1 40057293 1.46 None 3
OT_#4 15 -1 70268202 1.35 None 4
OT_#5 17 1 37313010 1.29 None 4
OT_#6 1 -1 159827878 1.26 NM_001013661 4
OT_#7 2 -1 193584573 1.04 None 3
OT_#8 15 -1 41867364 0.95 None 3
OT_#9 7 1 147681890 0.84 None 3
OT_#10 19 -1 13493402 0.84 None 4
Sequencing revealed no alteration of genomic loci of the Top 10 putative off-targets,
exemplarily shown for off-target #1 (OT_#1) in Figure 37.

Results
79
Figure 37: Sequencing results of off-target #1. The alignment of off-target sequence #1 to
the sequencing results of all three investigated clones is shown.
Karyotype analysis
It is known that hiPSCs are prone to acquire karyotypic abnormalities that accumulate with
prolonged culture time (Taapken et al. 2011). To validate whether culture conditions or gene
editing by CRISPR/Cas9 altered the karyotype, the hom. (clone#11; p49), the c.het. (clone#14;
p47) and the het. (clone#15; p47) clones were analysed by G-banding. Unfortunately, this
revealed a karyotypic abnormality (47, XX+1), showing a trisomy in chromosome 1 (Figure 38).
Since all CRISPR clones showed a trisomy in chromosome 1, rather the culture conditions
before gene editing and not the gene editing by CRISPR/Cas itself seem to be causative.
Figure 38: Karyotype analysis of CRISPR clones by G-banding. This analysis was
performed by the Department of Human Genetics at the UKE.
To ensure that the high passage number of the tested clones did not cause the karyotypic
abnormality, the youngest passage of each clone and wild-type ERC018 (p26) were evaluated
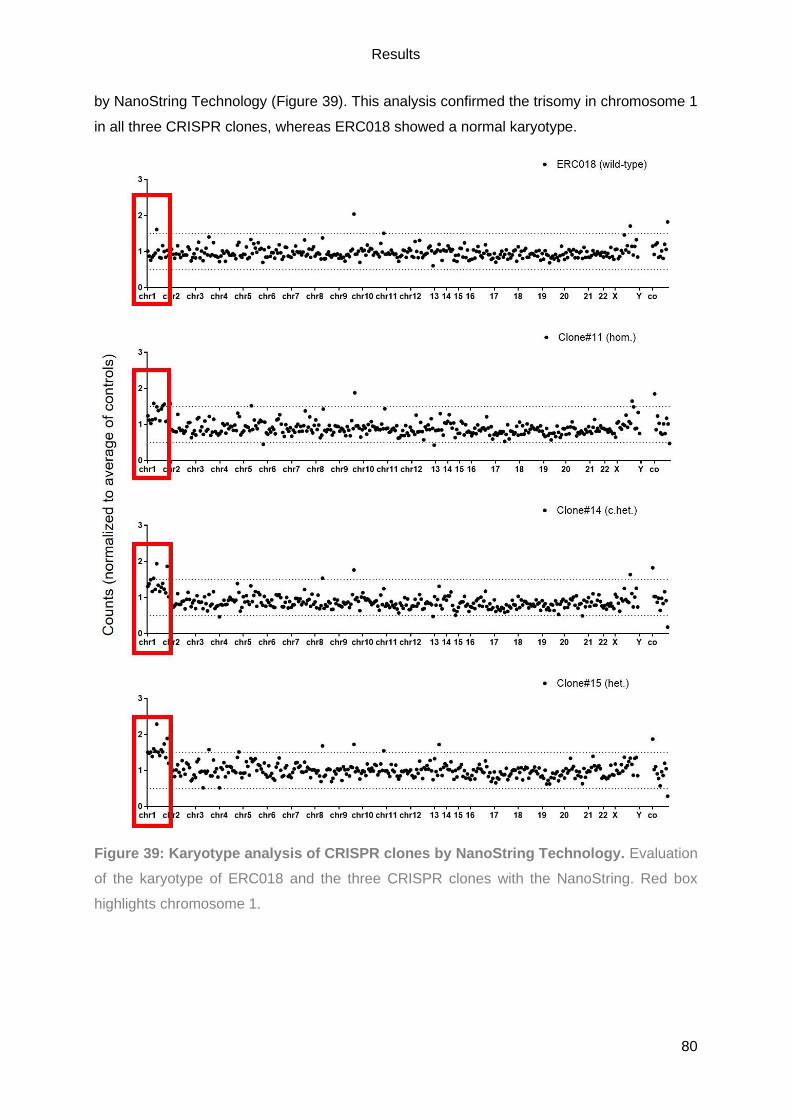
Results
80
by NanoString Technology (Figure 39). This analysis confirmed the trisomy in chromosome 1
in all three CRISPR clones, whereas ERC018 showed a normal karyotype.
Figure 39: Karyotype analysis of CRISPR clones by NanoString Technology. Evaluation
of the karyotype of ERC018 and the three CRISPR clones with the NanoString. Red box
highlights chromosome 1.
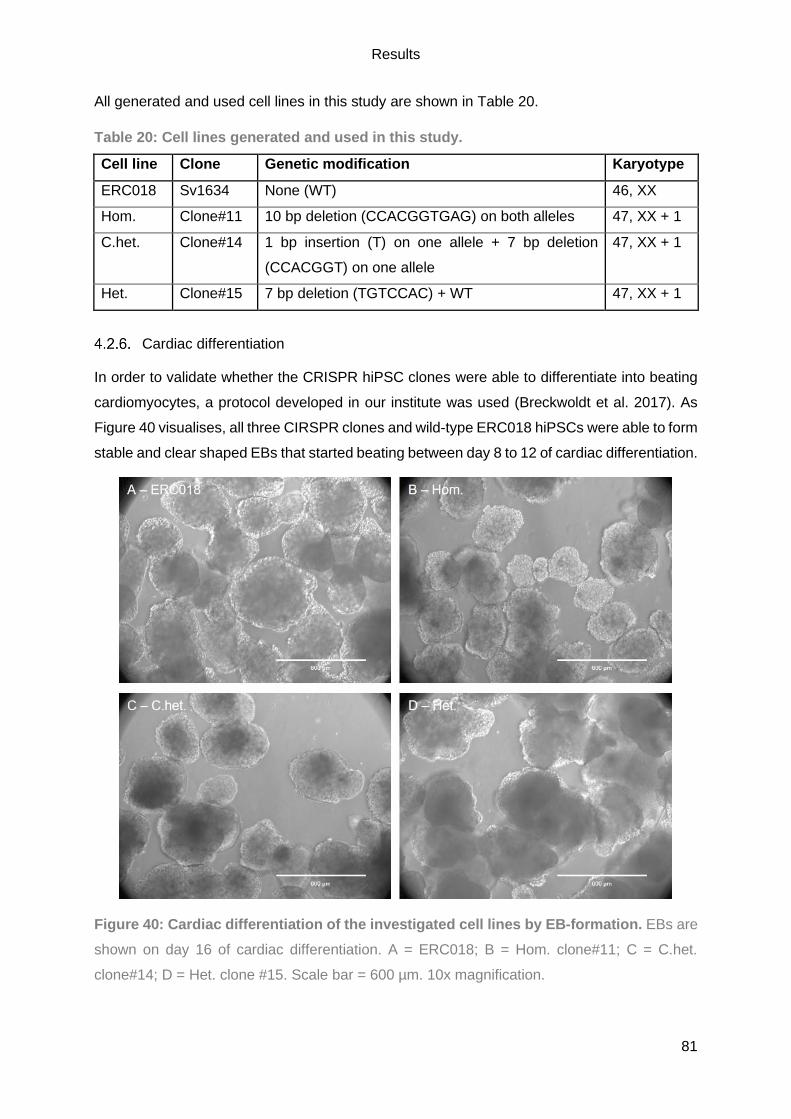
Results
81
All generated and used cell lines in this study are shown in Table 20.
Table 20: Cell lines generated and used in this study.
Cell line Clone Genetic modification Karyotype
ERC018 Sv1634 None (WT) 46, XX
Hom. Clone#11 10 bp deletion (CCACGGTGAG) on both alleles 47, XX + 1
C.het. Clone#14 1 bp insertion (T) on one allele + 7 bp deletion
(CCACGGT) on one allele
47, XX + 1
Het. Clone#15 7 bp deletion (TGTCCAC) + WT 47, XX + 1
Cardiac differentiation
In order to validate whether the CRISPR hiPSC clones were able to differentiate into beating
cardiomyocytes, a protocol developed in our institute was used (Breckwoldt et al. 2017). As
Figure 40 visualises, all three CIRSPR clones and wild-type ERC018 hiPSCs were able to form
stable and clear shaped EBs that started beating between day 8 to 12 of cardiac differentiation.
Figure 40: Cardiac differentiation of the investigated cell lines by EB-formation. EBs are
shown on day 16 of cardiac differentiation. A = ERC018; B = Hom. clone#11; C = C.het.
clone#14; D = Het. clone #15. Scale bar = 600 µm. 10x magnification.

Results
82
On day 17 of cardiac differentiation, the EBs were dissociated and the proportion of
cardiomyocytes was determined by FC, whereby cTnT served as a cardiac marker. Figure 41
exemplarily shows the FC gating strategy with ERC018 hiPSC-CMs. Hereby, 96.2% of the
ERC018 were cTnT+. The FC settings were set with the FITC-isotype control that showed a
minor cTnT+ cell population (0.31%).
Figure 41: Flow cytometry analysis of hiPSC-CMs after cardiac differentiation. ERC018
hiPSC-CMs were either stained with FITC-Isotype control (A) or FITC-cTnT (B). Cellular debris
was excluded from the analysis (P1). Aggregates and doublets were excluded (P2) and the
percentage of single cTnT+ hiPSC-CMs (P3) illustrated in a histogram. Analysed with FlowJo
(BD Biosciences). A = Area.
To evaluate cardiac differentiation efficiency, the number of output cells (CMs) was divided by
the number of input cells (hiPSCs; Figure 42B). Compared to ERC018, all CRISPR clones did
not show a significant difference regarding the cardiomyocytes yield after differentiation (Figure
42A), as values ranged from 73.2% to 98% (mean 80.53±2.85% to 93.58±2.29%). The same
held true for the differentiation efficiency as this ranged from 0.5 to 0.9 (mean 0.57±0.14 to
1.09±0.36) in all hiPSC lines except for one outlier differentiation for c.het. clone#14 with 1.78.
Thus, neither the alteration of MYBPC3 by CRISPR/Cas9 gene editing nor the trisomy seemed
to affect cardiac differentiation.
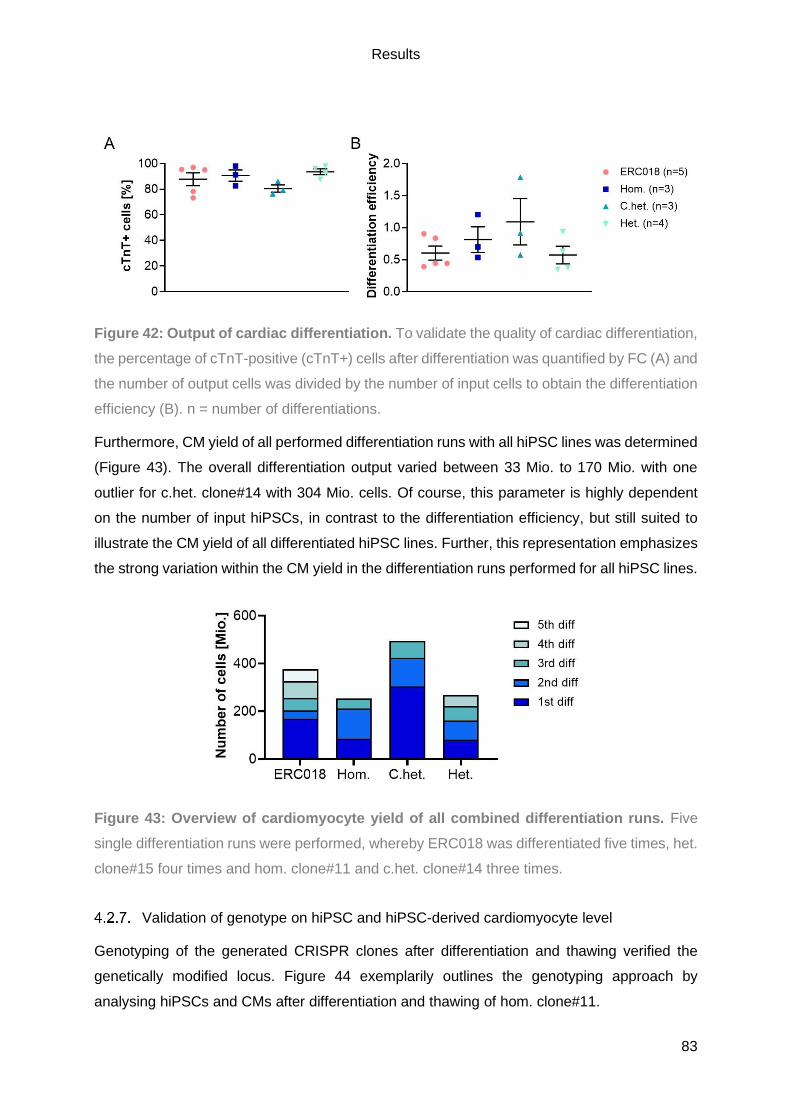
Results
83
Figure 42: Output of cardiac differentiation. To validate the quality of cardiac differentiation,
the percentage of cTnT-positive (cTnT+) cells after differentiation was quantified by FC (A) and
the number of output cells was divided by the number of input cells to obtain the differentiation
efficiency (B). n = number of differentiations.
Furthermore, CM yield of all performed differentiation runs with all hiPSC lines was determined
(Figure 43). The overall differentiation output varied between 33 Mio. to 170 Mio. with one
outlier for c.het. clone#14 with 304 Mio. cells. Of course, this parameter is highly dependent
on the number of input hiPSCs, in contrast to the differentiation efficiency, but still suited to
illustrate the CM yield of all differentiated hiPSC lines. Further, this representation emphasizes
the strong variation within the CM yield in the differentiation runs performed for all hiPSC lines.
Figure 43: Overview of cardiomyocyte yield of all combined differentiation runs. Five
single differentiation runs were performed, whereby ERC018 was differentiated five times, het.
clone#15 four times and hom. clone#11 and c.het. clone#14 three times.
Validation of genotype on hiPSC and hiPSC-derived cardiomyocyte level
Genotyping of the generated CRISPR clones after differentiation and thawing verified the
genetically modified locus. Figure 44 exemplarily outlines the genotyping approach by
analysing hiPSCs and CMs after differentiation and thawing of hom. clone#11.

Results
84
Figure 44: Validation of the genotype of Clone#11 (Hom.). Sanger sequencing of hom.
clone#11 on hiPSC and CM level after differentiation (diff.) and after thawing is shown.
Molecular validation of the functional MYBPC3 knockout
Since the successful alteration of MYBPC3 by CRISPR/Cas9 putatively introduced a frameshift
and subsequently a PTC, it is expected that the nonsense-mediated mRNA decay pathway
(NMD) would label the mRNA containing the PTC for degradation to prevent translation of
truncated protein. This was expected since HCM patients, as well as a Mybpc3-target knock-
in HCM mouse model revealed a nonsense mRNA, which results in skipping of exon 6 and a
PTC in exon 9 (Vignier et al. 2009; Helms et al. 2014). Therefore, the gene editing of MYBPC3
on genomic DNA (gDNA) level was validated on mRNA level by RT-PCR and RT-qPCR, and
for protein levels by WB on respective extracts from hiPSC-CMs.
To validate the mRNA of MYBPC3 by RT-PCR, RNA of all hiPSC-CM lines was isolated,
transcribed into cDNA and exon 4 – 9 was amplified by PCR and analysed on a 1% agarose
gel (Figure 45). The expected band of 473 bp was solely detected for ERC018 and het.
clone##15, whereas the c.het. clone#14 showed a slightly smaller band with a smear above.
A considerable smaller band of roughly 350 bp was detected for the hom. clone#11,
accompanied with a smear in the lane.
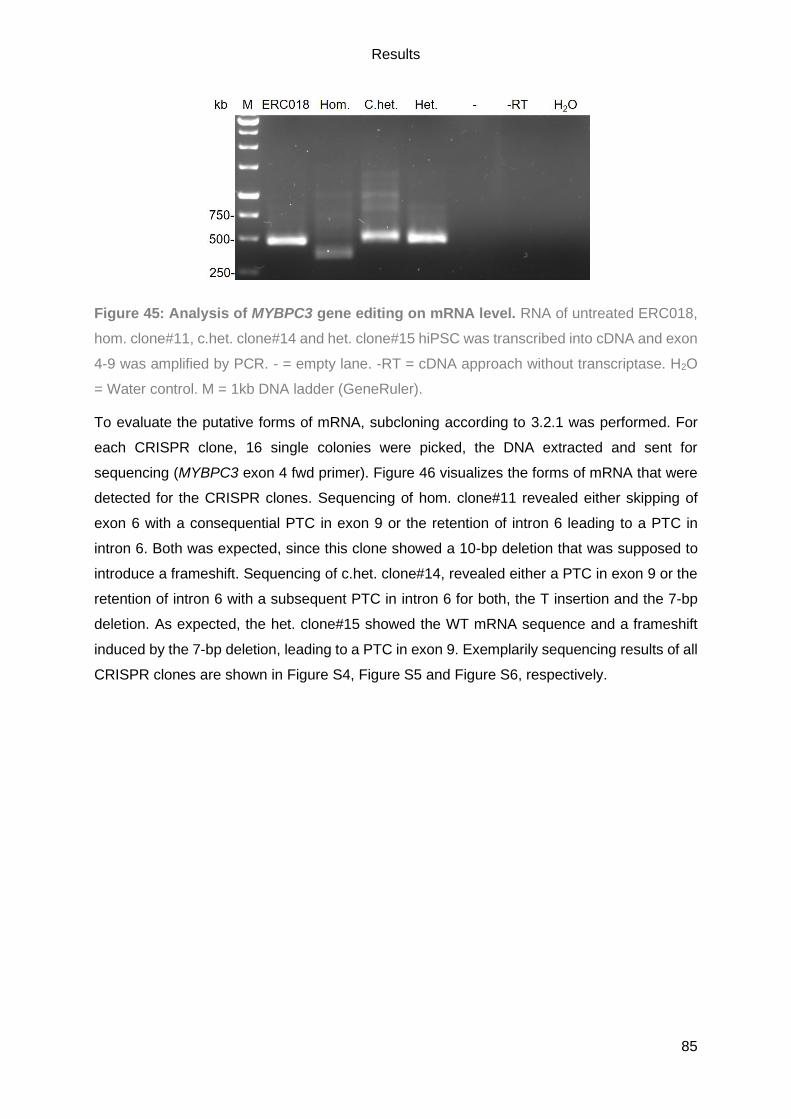
Results
85
Figure 45: Analysis of MYBPC3 gene editing on mRNA level. RNA of untreated ERC018,
hom. clone#11, c.het. clone#14 and het. clone#15 hiPSC was transcribed into cDNA and exon
4-9 was amplified by PCR. - = empty lane. -RT = cDNA approach without transcriptase. H2O
= Water control. M = 1kb DNA ladder (GeneRuler).
To evaluate the putative forms of mRNA, subcloning according to 3.2.1 was performed. For
each CRISPR clone, 16 single colonies were picked, the DNA extracted and sent for
sequencing (MYBPC3 exon 4 fwd primer). Figure 46 visualizes the forms of mRNA that were
detected for the CRISPR clones. Sequencing of hom. clone#11 revealed either skipping of
exon 6 with a consequential PTC in exon 9 or the retention of intron 6 leading to a PTC in
intron 6. Both was expected, since this clone showed a 10-bp deletion that was supposed to
introduce a frameshift. Sequencing of c.het. clone#14, revealed either a PTC in exon 9 or the
retention of intron 6 with a subsequent PTC in intron 6 for both, the T insertion and the 7-bp
deletion. As expected, the het. clone#15 showed the WT mRNA sequence and a frameshift
induced by the 7-bp deletion, leading to a PTC in exon 9. Exemplarily sequencing results of all
CRISPR clones are shown in Figure S4, Figure S5 and Figure S6, respectively.

Results
86
Figure 46: Overview of the mRNA formed for each CRISPR clone. The wild-type mRNA of
MYBPC3 is shown (A). The detected forms of mRNA for the hom. clone#11 (B), the c.het.
clone#14 (C) and the het. clone#15 (D) are shown. Yellow = Exons. Blue = Intron. X = PTC.
Black block = deletion. Red line = 1x T insertion.
However, additional forms of mRNA were detected due to alternative splicing, resulting either
in complete or partial retention of intron 8 or the formation of a new splice site (Figure 47). The
partial and complete retention of intron 8 was detected for the hom. clone#11, in both cases
resulting in a frameshift and a PTC in exon 9. For c.het. clone#14, the partial retention of intron
8 was solely detected for the allele with the T insertion. Unfortunately, this led to the restoration
of the reading frame and a 3864 bp mRNA and a protein of roughly the WT size of 1287 AAs.
The 7-bp deletion in c.het. clone#14 caused the formation of a new donor splice site (GTGAG),
the subsequent deletion of 2 bp and ‘regular’ splicing of intron 6. Nevertheless, a frameshift
was induced with a PTC in exon 9. For het. clone#15, complete retention of intron 8 was only
detected for the WT allele, inducing a frameshift and a PTC in exon 9. It is possible that the
WT allele shows a partial retention of intron 8 but this was not detected in the present study.
This would lead to a 936-bp mRNA, which results in a truncated protein of a length of 311 AAs.
Exemplarily sequencing results of all CRISPR clones with their additional isoforms of mRNA
due to alternative splicing are shown in the supplement (Figure S7), as well as the sequencing
of c.het. clone#14 showing the new splice site (Figure S8).

Results
87
Figure 47: Additional forms of mRNA of all CRISPR clones due to alternative splicing.
The additional forms of mRNA of hom. clone#11 (A), c.het. clone#14 (B) and het. clone#15 (C)
is shown. Yellow = Exons. Blue = Intron. X = PTC. Black box = Deletion. Red line = 1x T
insertion.
Furthermore, for hom. clone#11 the creation of a cryptic splice site would be possible, which
would enable proper splicing of intron 6 that would still lead to PTC in exon 9 (Figure S9). A
summary of the CRISPR clones with their alteration on gDNA, their forms of mRNA including
alternative splicing and putative forms of protein are listed in Table 21. In all cases, except for
the T insertion of the c.het. clone#14, the genetic modification of MYBPC3 has led to a PTC
resulting in shorter mRNA and a putative truncated protein.
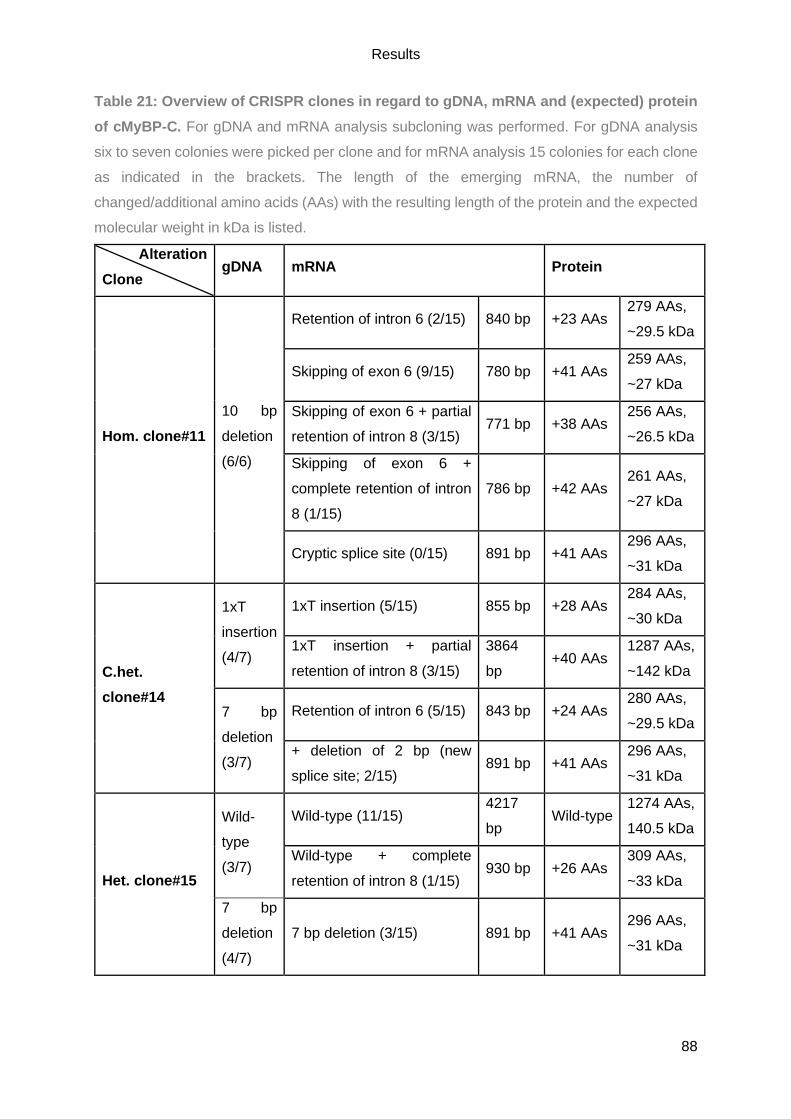
Results
88
Table 21: Overview of CRISPR clones in regard to gDNA, mRNA and (expected) protein
of cMyBP-C. For gDNA and mRNA analysis subcloning was performed. For gDNA analysis
six to seven colonies were picked per clone and for mRNA analysis 15 colonies for each clone
as indicated in the brackets. The length of the emerging mRNA, the number of
changed/additional amino acids (AAs) with the resulting length of the protein and the expected
molecular weight in kDa is listed.
Alteration
Clone gDNA mRNA Protein
Hom. clone#11
10 bp
deletion
(6/6)
Retention of intron 6 (2/15) 840 bp +23 AAs 279 AAs,
~29.5 kDa
Skipping of exon 6 (9/15) 780 bp +41 AAs 259 AAs,
~27 kDa
Skipping of exon 6 + partial
retention of intron 8 (3/15) 771 bp +38 AAs
256 AAs,
~26.5 kDa
Skipping of exon 6 +
complete retention of intron
8 (1/15)
786 bp +42 AAs 261 AAs,
~27 kDa
Cryptic splice site (0/15) 891 bp +41 AAs 296 AAs,
~31 kDa
C.het.
clone#14
1xT
insertion
(4/7)
1xT insertion (5/15) 855 bp +28 AAs 284 AAs,
~30 kDa
1xT insertion + partial
retention of intron 8 (3/15)
3864
bp +40 AAs
1287 AAs,
~142 kDa
7 bp
deletion
(3/7)
Retention of intron 6 (5/15) 843 bp +24 AAs 280 AAs,
~29.5 kDa
+ deletion of 2 bp (new
splice site; 2/15) 891 bp +41 AAs
296 AAs,
~31 kDa
Het. clone#15
Wild-
type
(3/7)
Wild-type (11/15) 4217
bp Wild-type
1274 AAs,
140.5 kDa
Wild-type + complete
retention of intron 8 (1/15) 930 bp +26 AAs
309 AAs,
~33 kDa
7 bp
deletion
(4/7)
7 bp deletion (3/15) 891 bp +41 AAs 296 AAs,
~31 kDa
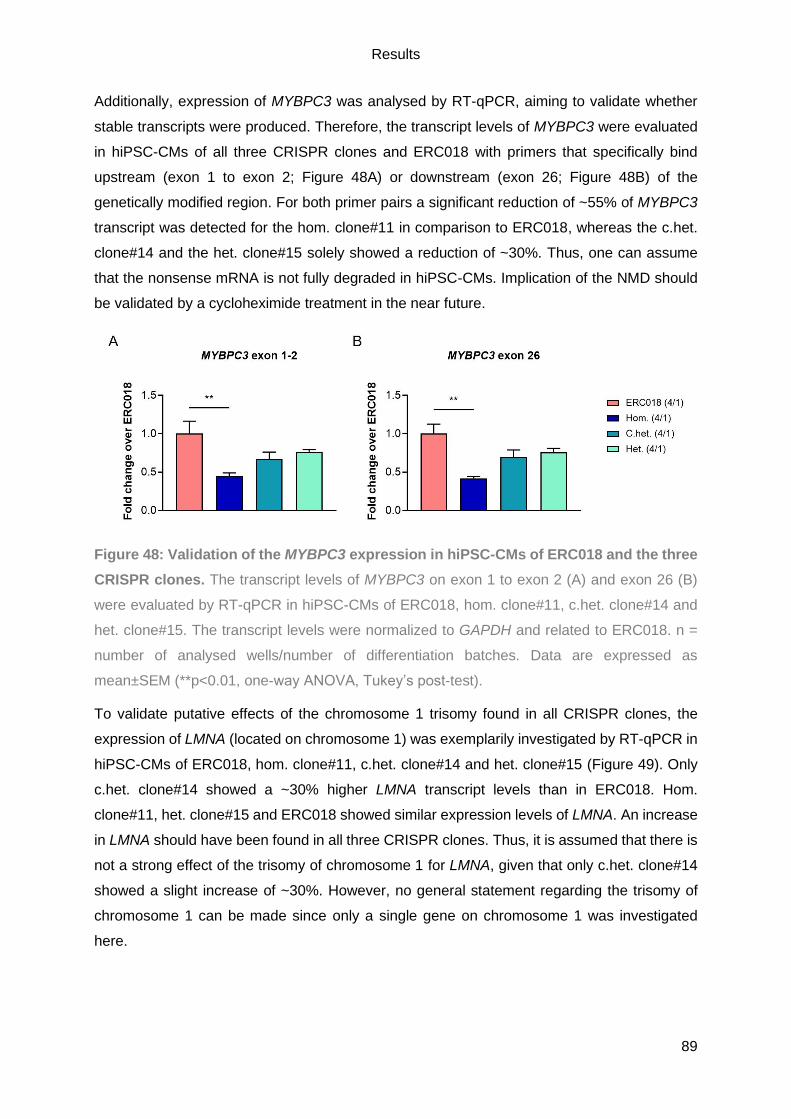
Results
89
Additionally, expression of MYBPC3 was analysed by RT-qPCR, aiming to validate whether
stable transcripts were produced. Therefore, the transcript levels of MYBPC3 were evaluated
in hiPSC-CMs of all three CRISPR clones and ERC018 with primers that specifically bind
upstream (exon 1 to exon 2; Figure 48A) or downstream (exon 26; Figure 48B) of the
genetically modified region. For both primer pairs a significant reduction of ~55% of MYBPC3
transcript was detected for the hom. clone#11 in comparison to ERC018, whereas the c.het.
clone#14 and the het. clone#15 solely showed a reduction of ~30%. Thus, one can assume
that the nonsense mRNA is not fully degraded in hiPSC-CMs. Implication of the NMD should
be validated by a cycloheximide treatment in the near future.
Figure 48: Validation of the MYBPC3 expression in hiPSC-CMs of ERC018 and the three
CRISPR clones. The transcript levels of MYBPC3 on exon 1 to exon 2 (A) and exon 26 (B)
were evaluated by RT-qPCR in hiPSC-CMs of ERC018, hom. clone#11, c.het. clone#14 and
het. clone#15. The transcript levels were normalized to GAPDH and related to ERC018. n =
number of analysed wells/number of differentiation batches. Data are expressed as
mean±SEM (**p<0.01, one-way ANOVA, Tukey’s post-test).
To validate putative effects of the chromosome 1 trisomy found in all CRISPR clones, the
expression of LMNA (located on chromosome 1) was exemplarily investigated by RT-qPCR in
hiPSC-CMs of ERC018, hom. clone#11, c.het. clone#14 and het. clone#15 (Figure 49). Only
c.het. clone#14 showed a ~30% higher LMNA transcript levels than in ERC018. Hom.
clone#11, het. clone#15 and ERC018 showed similar expression levels of LMNA. An increase
in LMNA should have been found in all three CRISPR clones. Thus, it is assumed that there is
not a strong effect of the trisomy of chromosome 1 for LMNA, given that only c.het. clone#14
showed a slight increase of ~30%. However, no general statement regarding the trisomy of
chromosome 1 can be made since only a single gene on chromosome 1 was investigated
here.
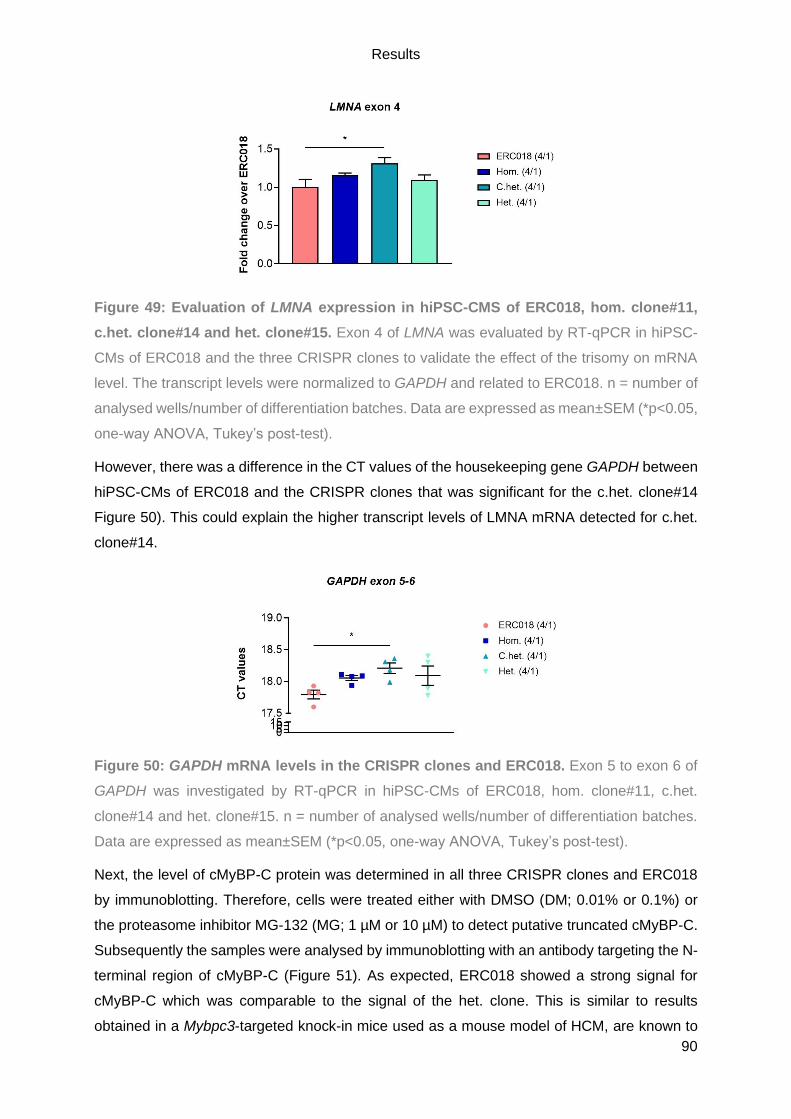
Results
90
Figure 49: Evaluation of LMNA expression in hiPSC-CMS of ERC018, hom. clone#11,
c.het. clone#14 and het. clone#15. Exon 4 of LMNA was evaluated by RT-qPCR in hiPSC-
CMs of ERC018 and the three CRISPR clones to validate the effect of the trisomy on mRNA
level. The transcript levels were normalized to GAPDH and related to ERC018. n = number of
analysed wells/number of differentiation batches. Data are expressed as mean±SEM (*p<0.05,
one-way ANOVA, Tukey’s post-test).
However, there was a difference in the CT values of the housekeeping gene GAPDH between
hiPSC-CMs of ERC018 and the CRISPR clones that was significant for the c.het. clone#14
Figure 50). This could explain the higher transcript levels of LMNA mRNA detected for c.het.
clone#14.
Figure 50: GAPDH mRNA levels in the CRISPR clones and ERC018. Exon 5 to exon 6 of
GAPDH was investigated by RT-qPCR in hiPSC-CMs of ERC018, hom. clone#11, c.het.
clone#14 and het. clone#15. n = number of analysed wells/number of differentiation batches.
Data are expressed as mean±SEM (*p<0.05, one-way ANOVA, Tukey’s post-test).
Next, the level of cMyBP-C protein was determined in all three CRISPR clones and ERC018
by immunoblotting. Therefore, cells were treated either with DMSO (DM; 0.01% or 0.1%) or
the proteasome inhibitor MG-132 (MG; 1 µM or 10 µM) to detect putative truncated cMyBP-C.
Subsequently the samples were analysed by immunoblotting with an antibody targeting the N-
terminal region of cMyBP-C (Figure 51). As expected, ERC018 showed a strong signal for
cMyBP-C which was comparable to the signal of the het. clone. This is similar to results
obtained in a Mybpc3-targeted knock-in mice used as a mouse model of HCM, are known to
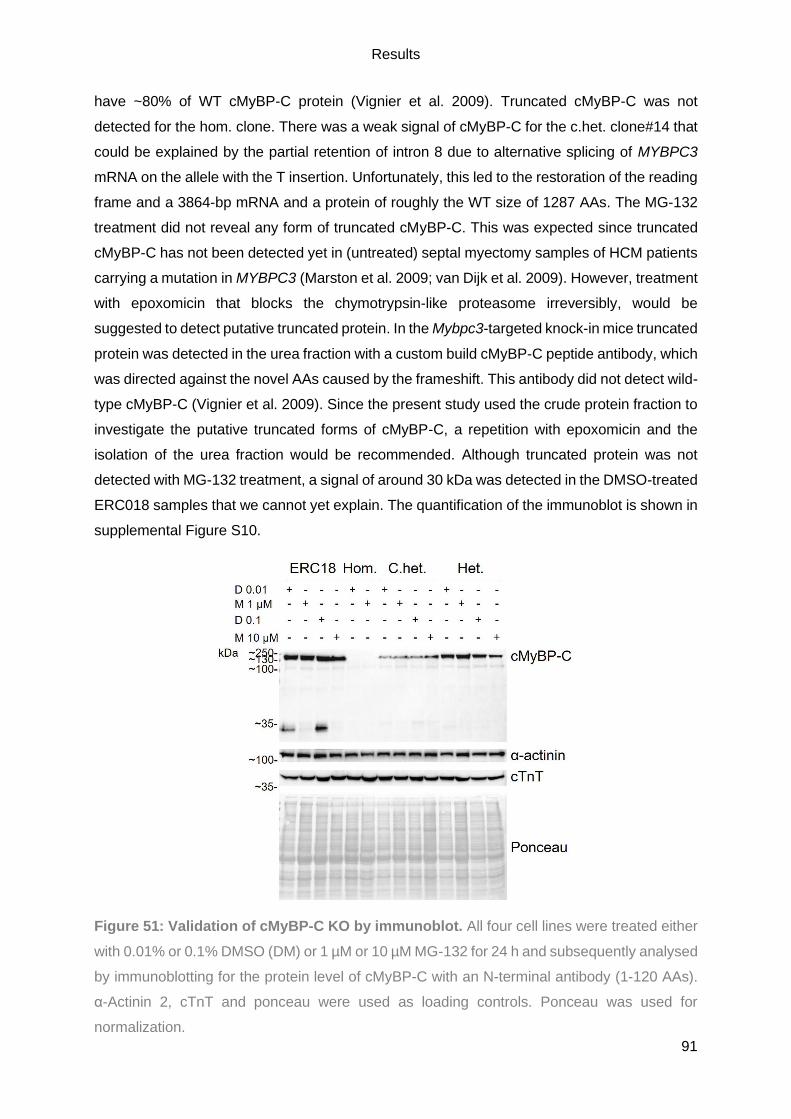
Results
91
have ~80% of WT cMyBP-C protein (Vignier et al. 2009). Truncated cMyBP-C was not
detected for the hom. clone. There was a weak signal of cMyBP-C for the c.het. clone#14 that
could be explained by the partial retention of intron 8 due to alternative splicing of MYBPC3
mRNA on the allele with the T insertion. Unfortunately, this led to the restoration of the reading
frame and a 3864-bp mRNA and a protein of roughly the WT size of 1287 AAs. The MG-132
treatment did not reveal any form of truncated cMyBP-C. This was expected since truncated
cMyBP-C has not been detected yet in (untreated) septal myectomy samples of HCM patients
carrying a mutation in MYBPC3 (Marston et al. 2009; van Dijk et al. 2009). However, treatment
with epoxomicin that blocks the chymotrypsin-like proteasome irreversibly, would be
suggested to detect putative truncated protein. In the Mybpc3-targeted knock-in mice truncated
protein was detected in the urea fraction with a custom build cMyBP-C peptide antibody, which
was directed against the novel AAs caused by the frameshift. This antibody did not detect wild-
type cMyBP-C (Vignier et al. 2009). Since the present study used the crude protein fraction to
investigate the putative truncated forms of cMyBP-C, a repetition with epoxomicin and the
isolation of the urea fraction would be recommended. Although truncated protein was not
detected with MG-132 treatment, a signal of around 30 kDa was detected in the DMSO-treated
ERC018 samples that we cannot yet explain. The quantification of the immunoblot is shown in
supplemental Figure S10.
Figure 51: Validation of cMyBP-C KO by immunoblot. All four cell lines were treated either
with 0.01% or 0.1% DMSO (DM) or 1 µM or 10 µM MG-132 for 24 h and subsequently analysed
by immunoblotting for the protein level of cMyBP-C with an N-terminal antibody (1-120 AAs).
α-Actinin 2, cTnT and ponceau were used as loading controls. Ponceau was used for
normalization.
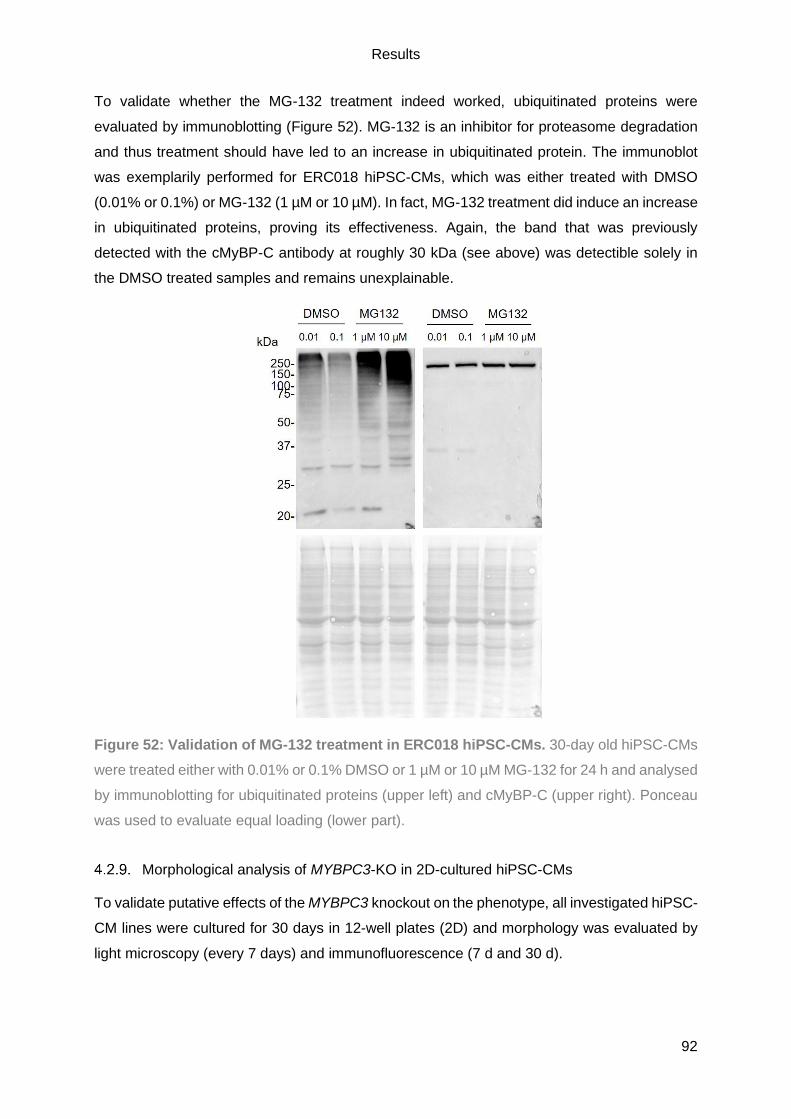
Results
92
To validate whether the MG-132 treatment indeed worked, ubiquitinated proteins were
evaluated by immunoblotting (Figure 52). MG-132 is an inhibitor for proteasome degradation
and thus treatment should have led to an increase in ubiquitinated protein. The immunoblot
was exemplarily performed for ERC018 hiPSC-CMs, which was either treated with DMSO
(0.01% or 0.1%) or MG-132 (1 µM or 10 µM). In fact, MG-132 treatment did induce an increase
in ubiquitinated proteins, proving its effectiveness. Again, the band that was previously
detected with the cMyBP-C antibody at roughly 30 kDa (see above) was detectible solely in
the DMSO treated samples and remains unexplainable.
Figure 52: Validation of MG-132 treatment in ERC018 hiPSC-CMs. 30-day old hiPSC-CMs
were treated either with 0.01% or 0.1% DMSO or 1 µM or 10 µM MG-132 for 24 h and analysed
by immunoblotting for ubiquitinated proteins (upper left) and cMyBP-C (upper right). Ponceau
was used to evaluate equal loading (lower part).
Morphological analysis of MYBPC3-KO in 2D-cultured hiPSC-CMs
To validate putative effects of the MYBPC3 knockout on the phenotype, all investigated hiPSC-
CM lines were cultured for 30 days in 12-well plates (2D) and morphology was evaluated by
light microscopy (every 7 days) and immunofluorescence (7 d and 30 d).
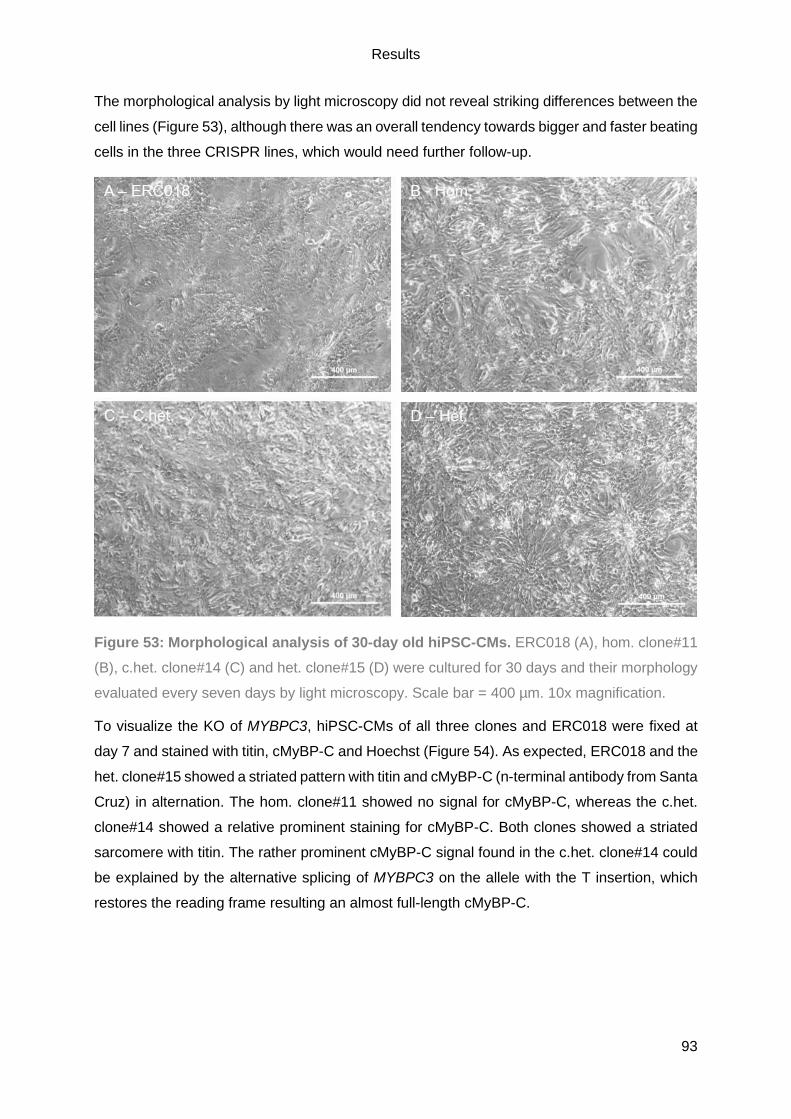
Results
93
The morphological analysis by light microscopy did not reveal striking differences between the
cell lines (Figure 53), although there was an overall tendency towards bigger and faster beating
cells in the three CRISPR lines, which would need further follow-up.
Figure 53: Morphological analysis of 30-day old hiPSC-CMs. ERC018 (A), hom. clone#11
(B), c.het. clone#14 (C) and het. clone#15 (D) were cultured for 30 days and their morphology
evaluated every seven days by light microscopy. Scale bar = 400 µm. 10x magnification.
To visualize the KO of MYBPC3, hiPSC-CMs of all three clones and ERC018 were fixed at
day 7 and stained with titin, cMyBP-C and Hoechst (Figure 54). As expected, ERC018 and the
het. clone#15 showed a striated pattern with titin and cMyBP-C (n-terminal antibody from Santa
Cruz) in alternation. The hom. clone#11 showed no signal for cMyBP-C, whereas the c.het.
clone#14 showed a relative prominent staining for cMyBP-C. Both clones showed a striated
sarcomere with titin. The rather prominent cMyBP-C signal found in the c.het. clone#14 could
be explained by the alternative splicing of MYBPC3 on the allele with the T insertion, which
restores the reading frame resulting an almost full-length cMyBP-C.

Results
94
Figure 54: Validation of KO in hiPSC-CMs by immunofluorescence. All three CRISPR cell
lines and ERC018 were stained for cMyBP-C (green), titin (orange) and Hoechst (blue). The
single channels of cMyBP-C and titin, a merged image and a zoom of the merged image are
shown. An N-terminal cMyBP-C antibody (1-120AAs) was used. White box highlights the
magnified area (zoom). Scale bar = 50 µm. 40x magnification.
Immunofluorescence staining of cMyBP-C (C0-C1 antibody) in combination with α-actinin 2
was also performed in 7-day-old (Figure 55) and 30-day old hiPSC-CMs (Figure S11). Striation
for all hiPSC-CM lines was visible with α-actinin 2. A signal for cMyBP-C was detected for the
c.het. clone#14 and the het. clone#15 that was weaker than the one for ERC018.
Unfortunately, a faint signal for cMyBP-C that was detected for the hom. clone#11. This was
not expected (see above), might be due to antibody un-specificity. This was observed in both,
7-day-old and 30-day-old hiPSC-CMs.

Results
95
Figure 55: Evaluation of cMyBP-C with C0-C1 antibody in combination with α-actinin 2
in 7-day old hiPSC-CMs. ERC018 and the three CRISPR clones were stained for cMyBP-C
(green), α-actinin 2 (orange) and Hoechst (blue). The merged image, a zoom of the merged
image, as well as the single channel images for cMyBP-C and α-actinin 2 are shown. White
box highlights the magnified area (zoom). Scale bar = 50 µm. 40x magnification.
The sequence of MYBPC3 was altered by CRISPR/Cas9 gene editing to obtain an HCM in
vitro model. To assess a putative hypertrophy of this HCM in vitro model, morphology was
evaluated in 7-day and 30-day old hiPSC-CMs by α-actinin 2 staining. Images were taken in
low magnification and subsequently the cell area was analysed with ImageJ (Figure 56). At 7
d in vitro, all CRISPR clones showed a significantly smaller cell area than ERC018 (~1800 µm2
vs. ~3600 µm2). After 30 days in vitro ERC018 showed a smaller cell area of 2804±381 µm2.
In contrast, cell area of all CRISPR clones increased with days in culture, showing significantly
higher cell area for both c.het. and het clones than ERC018, whereas the hom. clone did not
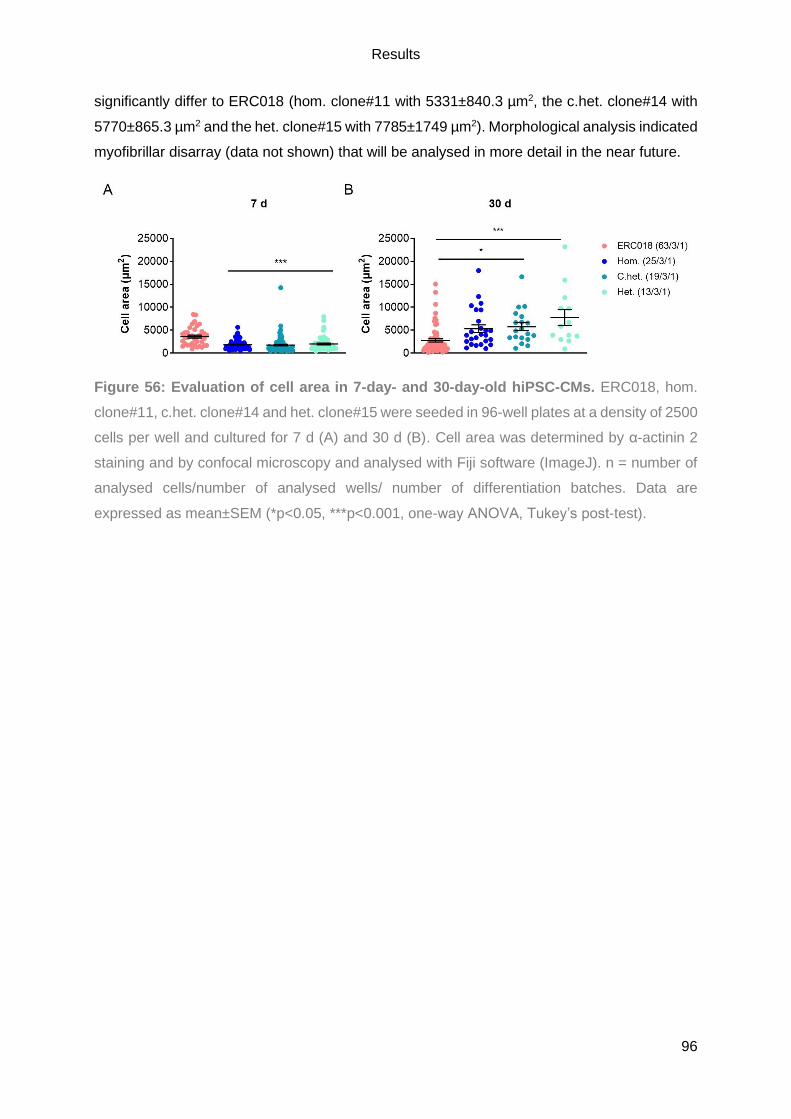
Results
96
significantly differ to ERC018 (hom. clone#11 with 5331±840.3 µm2, the c.het. clone#14 with
5770±865.3 µm2 and the het. clone#15 with 7785±1749 µm2). Morphological analysis indicated
myofibrillar disarray (data not shown) that will be analysed in more detail in the near future.
Figure 56: Evaluation of cell area in 7-day- and 30-day-old hiPSC-CMs. ERC018, hom.
clone#11, c.het. clone#14 and het. clone#15 were seeded in 96-well plates at a density of 2500
cells per well and cultured for 7 d (A) and 30 d (B). Cell area was determined by α-actinin 2
staining and by confocal microscopy and analysed with Fiji software (ImageJ). n = number of
analysed cells/number of analysed wells/ number of differentiation batches. Data are
expressed as mean±SEM (*p<0.05, ***p<0.001, one-way ANOVA, Tukey’s post-test).

Discussion
97
5. Discussion
The overall objective of the present study was to decipher the putative interplay of the
(defective) ALP and cMyBP-C on the pathogenesis of human inherited cardiomyopathies. To
date, it has only been shown that the ALP keeps cellular homeostasis by degrading long-lived
proteins and organelles, as well as (toxic) aggregates, which is of particular importance in post-
mitotic CMs. Further, it is known that HCM and DCM are the two most common human
inherited cardiomyopathies and MYBPC3, encoding cMyBP-C, is the most frequently mutated
gene in HCM. However, it is still unknown how the ALP and mutations in MYBPC3 affect HCM
and DCM and if there is an (presumed) interplay. Thus, there is a great need for research that
ultimately unravels novel therapeutic options for human inherited cardiomyopathies. The major
findings of this study were: i) autophagy is altered in human HCM and DCM tissue samples, ii)
autophagic flux is higher in HCM but lower in DCM hiPSC-CMs; iii) MYBPC3-deficient hiPSC-
CM lined showed reduced levels of mutant mRNA and protein, as well as an increased cell
area over culture time.
5.1. Alteration of the ALP in human hypertrophic and dilated cardiomyopathies
The first aim of the presented study was to evaluate a putative ALP alteration in human
inherited cardiomyopathies, as defects can be fatal. A low activity may lead to proteotoxicity
whilst a high activity may lead to cell death (Maejima et al. 2017). Furthermore, the heart is
especially depending on a well function protein quality control, as it represents an organ with
low regenerative potential. Here, the ALP prevents the accumulation of toxic protein
aggregates (Tannous et al. 2008; Sandri and Robbins 2014). Thus, it is quite surprising that
only a few human inherited cardiomyopathies have been linked to a defect in the ALP, such
as Danon disease (Nishino et al. 2000; Hashem et al. 2015), Vici syndrome (Cullup et al. 2013;
Balasubramaniam et al. 2017), LVNC and a recessive form of DCM (Muhammad et al. 2015).
However, it has been stressed by others to investigate the impact of autophagy in disease
pathogenesis for HCM and DCM on altering protein and gene expression levels (Dorsch et al.
2019; Mosqueira et al. 2019b). Therefore, the ALP was investigated in human myocardial
tissue samples of NF individuals, HCM and DCM patients, as well as HCM and DCM hiPSC-
CMs. Further, the autophagic flux was evaluated on protein level in hiPSC-CMs from a healthy
ctrl, an HCM (heterozygous and CRISPR homozygous) and DCM patient (heterozygous), and
their corresponding CRISPR isogenic controls.
Discussion
98
Markers of the ALP are dysregulated in human tissue and hiPSC-CMs of HCM and
DCM patients
To evaluate the role of autophagy in human inherited cardiomyopathies, the main markers of
the ALP were investigated by immunoblotting and gene expression analysis in cardiac tissue
samples of HCM and DCM patients and compared to NF individuals. Higher levels of LC3-II
protein were detected, which implies either increased formation or accumulation of
autophagosomes, accompanied by a potential ALP activation due to mTORC1 down regulation
(pS6↓) for HCM and DCM (see Figure 13). In HCM patients, markedly lower levels of LAMP-2
were detected, caused either by an increased autophagic activity due to enhanced
autolysosome turnover or a lysosomal defect and thus impaired autophagosomes-lysosome
fusion. In DCM patients, markedly higher levels of LAMP-2 and p62 were detected. Higher
levels of p62 suggest either an increased amount or accumulation of ubiquitinated proteins,
whereas higher levels of LAMP-2 might indicate an increased autophagic activity due to higher
amounts of cargo material or impaired autophagosome-lysosome fusion but proper formed
lysosomes. Similar results were obtained by Song et al. (2014) by detecting higher protein
levels of LC3-II and Beclin-1 next to an increased number of autophagosomes in septal
myectomies of HCM patients carrying either a mutation in MYBPC3 or MYH7. Recent findings
of our group showed higher protein levels of LC3-II but unchanged levels of p62 in septal
myectomies of HCM patients carrying a mutation in MYBPC3 (Singh et al. 2017). Of particular
interest is the marked difference of LAMP-2 in HCM and DCM patients, especially in the
context of Danon disease that is associated with LAMP-2 deficiency and hypertrophic
cardiomyopathy. The absence of LAMP-2 results in the accumulation of autophagosomes due
to defective autophagosome-lysosome fusion (Nishino et al. 2000; Hashem et al. 2015). Two
groups showed that LAMP-2B-deficient hiPSC-CMs and Danon-derived hiPSC-CMs have
defects in autophagosome-lysosome fusion, as well as mitochondrial and contractile
abnormalities. The authors were able to rescue those phenotype by the re-introduction of
LAMP-2B (Hashem et al. 2017; Chi et al. 2019). Although the regulation of mitophagy differs
from the ALP, cargo is taken up into the autophagosome and subsequently degraded within
the autolysosome (Zech et al. 2019). Further, this might imply that the reintroduction of the WT
MYBPC3 could be able to rescue the phenotype. A recent study that investigated a putative
ALP alteration in DCM patients detected an accumulation of aggregates that were associated
with higher levels of p62 in immunohistochemistry staining, and lower levels of LAMP-2 by
immunofluorescence staining (Caragnano et al. 2019). This is in contrast to the present study,
which detected markedly higher levels of LAMP-2 next to higher levels of p62.
Subsequently, gene expression analysis of cardiac tissue samples of HCM and DCM patients
was performed and compared to NF individuals. This revealed a complex and inconclusive
pattern for the ALP but confirmed the progressed diseased state (e.g. higher NPPA and lower
Discussion
99
MYH6 levels). This was supported by altered expression of genes, encoding proteins
contributing to fibrosis and Ca2+ handling. Recently, our group showed similar gene expression
patterns for the ALP in HCM patients carrying MYBPC3 mutations, such as lower MAP1LC3B
and higher MTOR, but also differences, such as higher levels of SQSTM1 whereas this study
showed that levels of SQSTM1 did not differ. One reason for this could be that the previous
study solely investigated HCM patients carrying a MYBPC3 mutation, whereas the present
study also considered non-MYBPC3 HCM patients for gene expression analysis, since no
significant difference was detected in the gene expression pattern between the two groups.
However, with regard to hypertrophy, Ca2+ handling and fibrosis, similar results were obtained,
such as markedly lower levels of MYH6, lower levels of ATP2A2 and higher levels of COL1A1
that are hallmarks of HCM (Singh et al. 2017). A recent publication showed lower level of TFEB
mRNA but higher levels of mTOR protein in cardiac tissues samples of DCM patients. The
authors conclude that a suppression of the ALP is present in DCM (Caragnano et al. 2019).
All of these studies detected basal states of the ALP in HCM and DCM but it remains elusive
whether the ALP is impaired or activated. Thus, the evaluation of the autophagic flux is vital to
draw any conclusion about a putative ALP alteration.
Thirty-day-old hiPSC-CMs from a healthy control, an HCM patient (homozygous and
heterozygous), a DCM patient (heterozygous) and their corresponding isogenic CRISPR
controls were evaluated for a putative common alteration of the ALP (see Figure 17 and Figure
18). HiPSC-CMs of HCMrepair, HCMhet, HCMhom, DCMrepair and DCM showed significantly
lower levels of LC3-II in comparison to healthy ctrl hiPSC-CMs. Lower levels of LC3-II indicate
either an increased LC3 turnover or lower basal activity of the ALP. Only one publication
evaluated the basal levels of LC3-II in hiPSC-CMs. Here, significantly higher levels of LC3-II
were detected in comparison to non-isogenic control hiPSC-CMs as well as a markedly higher
number of early autophagosomes. However, this study evaluated healthy and Danon disease
hiPSC-CMs (Hashem et al. 2015). The present study showed markedly higher protein levels
of LC3-II, but unchanged protein levels of p62 and LAMP-2 in healthy ctrl than in HCMrepair
and DCMrepair hiPSC-CMs. The absence of difference in the levels of p62 and LAMP-2 might
indicate that the isogenic CRISPR controls HCMrepair and DCMrepair are getting closer to a
‘healthy’ phenotype due to the genetic correction. However, a marked difference was detected
for LC3-II, as healthy ctrl hiPSC-CM showed markedly higher levels than HCMrepair and
DCMrepair hiPSC-CMs, which indicates either a lower basal activity of the ALP or an impaired
autophagic flux. Unexpectedly, the levels of LC3-II, p62 and LAMP-2 did not differ between
HCMrepair, HCMhet and HCMhom hiPSC-CMs, as well as between DCMrepair and DCM
hiPSC-CMs. This was surprising and is in contrast to the findings obtained in human
myocardial tissue samples, such was higher LC3-II in HCM and DCM, but lower LAMP-2 in
HCM and higher LAMP-2 in DCM (see Figure 13). The absence of the difference in between
Discussion
100
the HCM and DCM hiPSC-CM lines indicates a low basal activity of the ALP (LC3-II-), a
constant degradation of ubiquitinated cargo (p62-) and proper autophagosome-lysosome
fusion (LAMP-2-). However, DCM hiPSC-CMs showed a tendency towards higher level of
LAMP-2 in comparison to DCMrepair hiPSC-CMs and thus a trend towards DCM tissue
samples, where significantly higher levels of LAMP-2 were detected (see Figure 13). However,
the HCM patients carry MYBPC3 mutations, whereas the HCM hiPSC-CMs carry a mutation
in ACTN2. On gene expression level, no significant difference between HCM patients carrying
a MYBPC3 mutation and non-MYBPC3 HCM patients was observed, this analysis includes the
here investigated ACTN2 mutation (see Figure 14). To verify this finding, hiPSC-CMs carrying
a MYBPC3 mutation should be investigated as well as human myocardial tissue samples of
non-MYBPC3 HCM patients in parallel to all here used samples.
All of these studies detected basal states of the ALP in HCM and DCM, it remains elusive
whether the ALP is impaired or activated. Thus, the evaluation of the autophagic flux is vital to
draw any conclusion about a putative ALP alteration.
Autophagic flux is dysregulated in HCM and DCM hiPSC-CMs
To unravel whether the ALP is activated or impaired in HCM and DCM hiPSC-CMs, the
autophagic flux was evaluated in 30-day-old hiPSC-CMs of all investigated lines by detecting
protein levels of LC3-II and p62 in the absence and presence of Bafilo by immunoblot, mass
spectrometry and immunofluorescence analysis. The immunoblot of all hiPSC-CM lines
revealed that the Bafilo treatment induced a marked increase in LC3-II protein, whereas p62
was only higher in healthy ctrl and HCMhet hiPSC-CMs (see Figure 19). The increase in LC3-
II after Bafilo treatment verified that the evaluation of the autophagic flux worked in all of the
investigated hiPSC-CMs lines, also in the diseased hiPSC-CMs, which is in line with a recent
study (Chi et al. 2019). Of interest, the increase in LC3-II after Bafilo treatment was higher in
HCM hiPSC-CMs and lower in DCM hiPSC-CMs than in the corresponding isogenic controls.
Only one other study modulated the autophagic flux by Bafilo treatment in healthy and
diseased hiPSC-CMs. The authors showed a similar extent of increase in LC3-II protein levels
after Bafilo treatment in both healthy isogenic and non-isogenic controls, Danon and LAMP-
2B KO hiPSC-CMs (Chi et al. 2019). Another study evaluated the autophagic flux in healthy
and diseased Danon hiPSC-CMs after transduction with mRFP-GFP-LC3B and subsequent
immunofluorescent analysis. This is a robust method to evaluate the autophagic flux, since the
GFP signal is quenched in lysosomes due to the low pH. Thus, early autophagosomes exhibit
a signal for RFP and GFP, whereas autolysosomes only show a signal for RFP. The authors
detected more early autophagosomes, whereas mature autophagosomes were nearly absent
in Danon hiPSC-CMs, indicating impaired autophagic flux as maturation of autophagosomes
and subsequent fusion with a lysosome does not seem to take place. Consequently, the

Discussion
101
authors did not apply Bafilo but Rapa to modulate the autophagic flux, which led to an increase
in LC3-II and more early autophagosomes (Hashem et al. 2015). Another study investigated
the autophagic flux in WT and Danon disease hiPSC-CMs obtained from two monozygotic
twins carrying a heterozygous LAMP-2 mutation. Of note, not all of the generated hiPSC lines
showed a mutation in LAMP-2, thus the authors selected for each twin one with (Danon) and
without (WT) LAMP-2 mutation, and evaluated the autophagic flux by transducing with mRFP-
GFP-LC3B or by applying pepstatin A, a protease inhibitor found within the lysosome. In Danon
hiPSC-CMs, the authors observed more early autophagosomes and a significant increase in
LC3-II after pepstatin A treatment (Yoshida et al. 2018). The marked increase in LC3-II after
Bafilo treatment is in contrast to findings obtained in Mybpc3-targeted knock-in mice that
showed a blunted autophagic flux. However, this was only detected in 60-week-old mice, but
not in 10-week-old mice (Singh et al. 2017). Thus, the effect on the autophagic flux could be
‘masked’ in hiPSC-CMs due to their well-known immaturity (Yang et al. 2014). A recent study
showed that hiPSC-CMs of enhanced maturity can be obtained by Torin 1 treatment, which is
a mTOR inhibitor and thus activates autophagy. Here, it also induced the shift to a quiescent
cell state and thus led to the dose-dependent increase in expression of sarcomeric proteins
and ion channels and an increase in the relative maximum force of contraction, short a ‘more’
mature hiPSC-CM phenotype (Garbern et al. 2019). Of course, a higher degree of maturation
would be desirable, as human cardiac tissue samples are obtained from patients, who
underwent septal myectomy or heart transplantation surgery. Thus, related human cardiac
tissue samples represent the late stage of the disease and hiPSC-CMs are rather immature
and therefore cannot resemble the disease in vitro fully. However, the immaturity also has an
advantage, since it enables scientists to study the early pathogenesis of diseases, such as
HCM and DCM. This is reasonable since it is still unknown how mutations in (sarcomeric)
genes lead to the disease phenotype in HCM and DCM (Eschenhagen and Carrier 2018).
To further improve our understanding of the pathogenesis of HCM and DCM, as well as the
role of the autophagic flux, mass spectrometry analysis was performed on all investigated
hiPSC-CM lines after DMSO or Bafilo treatment. Unfortunately, this revealed that the effect of
the Bafilo treatment was lower than the batch-to-batch variability. This was unexpected since
the effect of the Bafilo treatment was detected by immunoblotting (see Figure 20 and Figure
22E) and further, the increase in p62 after Bafilo treatment detected by mass spectrometry
resembled the increase in p62 detected by immunoblotting (see Figure 19). It could be argued
that the Bafilo concentration was too low, since the only other study that evaluated the
autophagic flux in hiPSC-CMs by Bafilo application, used 8-fold more Bafilo than in the present
study (400 nM for 4 h vs. 50 nM for 3 h; Chi et al. 2019). Here, the validation of the LC3-II
protein levels after Bafilo treatment by mass spectrometry would have been very helpful,
unfortunately, an additional enrichment step for post-transcriptional modifications would have

Discussion
102
been needed to detect the lipidated form of LC3 with the LC-MS/MS. Hence, the Bafilo
treatment effect might have been more prominent, if post-translational modifications, such as
LC3-II, were evaluated. Thus, it is recommended to repeat the experiment with an extra
enrichment step for post-transcriptional modifications, especially since post-transcriptional
modifications are vital for the ALP regulation (McEwan and Dikic 2011; Delbridge et al. 2017).
The repetition could be performed either with all samples or with a smaller subset, due to high
sample numbers (three independent differentiations, three individual experiments of six hiPSC-
CMs lines, with two conditions and at least three replicates per condition). Also, a higher n-
number per condition and batch would be desirable, as immunoblot analysis, mass
spectrometry and immunofluorescence analysis were performed in parallel, and samples for a
follow-up RNA-seq were taken. Nonetheless, a repetition would be highly recommended, as
mass spectrometry analysis facilitates to not only investigate the autophagic flux by
investigating single proteins but to grasp the overall involved proteins and thus signalling
pathways. Thus, mass spectrometry could help to reveal the underlying mechanism of HCM
and DCM pathogenesis and to understand the role of the ALP.
Concurrently, the main markers of the ALP were analysed by immunofluorescence staining in
all hiPSC-CM lines. Unfortunately, the most important marker of the ALP, LC3, was not
included in this analysis, since a suitable antibody did not meet our quality standards. This is
(very) unfortunate, since a marked increase in LC3-II after Bafilo treatment was detected in all
hiPSC-CM lines by immunoblotting (see Figure 19). Nonetheless, immunofluorescence
analysis revealed an increase in p62 signal intensity after Bafilo treatment in all investigated
hiPSC-CM lines (see Figure 27, Figure 28 and Figure 30). This was unexpected since
immunoblot results only showed an increase in p62 in healthy ctrl and HCMhet hiPSC-CMs. A
reason for this could be the analysis of the crude protein lysate by immunoblot, which is in line
with the two other publications that investigated the ALP in hiPSC-CMs (Hashem et al. 2015;
Chi et al. 2019). However, the protein lysis with Urea buffer could be recommend, since
immunofluorescence analysis showed even the formation of p62 aggregates by Bafilo
treatment. Although, the increase in healthy ctrl and HCMhet hiPSC-CMs after Bafilo treatment
in the immunoblot argues against this, it is noteworthy that HCMhom hiPSC-CMs already
showed a stronger signal of p62 at baseline. Furthermore, in the HCM hiPSC-CM lines, p62
seemed to make a striated pattern, which might be sarcomeres or T-tubules or the SR.
Nonetheless, this indicates a higher ALP activity along those striated structures. It could be
speculated that mutated ACTN2 is translated directly in close proximity of the sarcomere but
subsequently ubiquitinated and shuttled via p62 to the ALP for the degradation. This
hypothesis would fit to a recent publication that described sarcomeres as very dynamic
structures that are constantly maintained, which is assured by localized translation and
degradation (Lewis et al. 2018). Furthermore, the authors suggest two half-lives for sarcomeric

Discussion
103
proteins, a longer one for incorporated sarcomeric proteins and a very short one for not
incorporated excess proteins. Thus, the marked accumulation of p62 putatively close to the
sarcomere might indicate that there is such an excess of mutant ACTN2 that next to the UPS,
also the ALP degrades sarcomeric proteins to prevent the accumulation of toxic proteins. Also,
LAMP-2 was visualized by immunofluorescence staining, but similar levels were detected in
all hiPSC-CM lines (see Figure 31). This was not expected, since the analysis of LAMP-2 in
HCM and DCM myocardial tissue samples showed either markedly higher (HCM) or lower
level (DCM) of LAMP-2. However, this finding is in line with the analysis of the basal levels of
LAMP-2 in all investigated hiPSC-CM lines (see Figure 17 and Figure 18). LAMP-2 was
prominently localized around the nucleus, as well as an even distribution throughout the
cytoplasm. This localization was expected since lysosomes are found all over the cell ultimately
being transported to the perinuclear region for fusion with an autophagosome (Korolchuk et al.
2011), as shown by others (Hashem et al. 2015).
Next to the low effect of the Bafilo treatment, mass spectrometry clearly showed the vast
difference between DCMrepair and DCM hiPSC-CMs in comparison to the other hiPSC-CM
lines (1st dimension, Figure 21; Figure 22A+C). A difference of the DCM hiPSC-CM lines has
been suspected since the behaviour of the cells in vitro differed to the remaining lines and also
emphasizes that hiPSC-CMs resemble the patient in vitro. This fits to the second most
prominent finding was the marked difference between the different genetic backgrounds
(Healthy ctrl vs. HCMrepair/HCMhet/HCMhom vs. DCMrepair/DCM; 2nd dimension, Figure 21
and Figure 22A+D). This was expected, since it has been shown, that the genetic background
has an influence on the severity of the disease (Smith et al. 2018). Although the disease
hallmarks were resembled in HCM hiPSC-CMs, the authors detected a considerable variability
between hiPSC-CMs that were obtained from the father with an established HCM phenotype
and his two sons that were either not carries of the here investigated mutation (E99K1) or did
not shown any symptoms yet. Therefore, genetically matching isogenic controls were used in
the present study, to exclude effects due to the genetic background, such as the epigenetic
status and differentiation capacity (Musunuru et al. 2018). As mentioned before, it was not
expected that the effect of Bafilo treatment was lower than the batch-to-batch variability as
shown in the 3rd dimension of the PCA. Beforehand, a certain degree of a batch-to-batch
variability was expected, but not to this extent. A recent publication reported batch-to-batch
variability in two commercially available hiPSC-CM lines (iCells and Cor.4U). While evaluating
hiPSC-CMs as a human in vitro model, they detected a batch-to-batch variability in a number
of parameters, such as the baseline beating rate (Huo et al. 2017). The marked difference
between the different genetic backgrounds was also detected by immunoblotting, shown by a
significant difference in LC3-II and p62 between hiPSC-CMs of healthy ctrl, HCMrepair and
DCMrepair (see Figure 23). Furthermore, immunoblots revealed batch-to-batch variabilities to

Discussion
104
a lower extent (see Figure 24 and Figure 25), whereby the Bafilo treatment effect was
significant. Interestingly, lower variability was visible between batches that were cultured in
closer time frames. Thus, an effect of the culture conditions on the hiPSC-CMs cannot be
excluded and was previously described (Dambrot et al. 2014). This study showed that serum-
supplemented medium masked the hypertrophy phenotype. Thus, it could be argued that the
effect of the cardiac phenotype on the ALP was masked by culture conditions, such as serum-
supplementation. Surprisingly, the batch-to-batch variability was more prominent, when the
immunoblots were normalized to a cardiac marker (cTnT; see Figure 26). cTnT was used as
loading control to solely detect the effect in CMs. However, hiPSC-CMs of high purity were
used (on average at least 85% and not lower than 71%) and thus ponceau can be used as
loading control. The strong effect of cTnT on the batch-to-batch variability was not expected.
However, cTnT is also an important component of the sarcomere and thus hiPSC-CMs that
harbour mutations in genes encoding sarcomeric proteins might also disturb the
homeostasis/expression of other sarcomeric proteins. Interestingly, mass spectrometry
analysis revealed a significant downregulation of cTnT in HCMhom in comparison to
HCMrepair and HCMhet hiPSC-CMs (Figure 57). Similarly, many other proteins of the
sarcomere are much less present in HCMhom than in HCMrepair (data not shown). These
findings suggest that HCMhom hiPSC-CMs exhibit a marked instability of sarcomeric
components, which could lead to sarcomere failing.
Figure 57: cTnT protein level in all HCM hiPSC-CMs determined by mass spectrometry
analysis. Thirty-day-old hiPSC-CMs were treated with DMSO (0.05%) for 3 h and
subsequently analysed by LC-MS/MS. n = number of wells/number of differentiation batches.
Data are expressed as mean±SEM (*p<0.05; one-way ANOVA, Tukey’s post-test).
Moreover, it is not surprising that hiPSC-CMs do express batch-to-batch variations, as well as
the difference in the genetic background, as many steps are involved in the generation of
hiPSCs, the subsequent differentiation into CMs, the cultivation and treatment of the hiPSC-
CMs and analysis. This study aimed to ‘prevent’ batch-to-batch variabilities while still detecting
a valuable effect. Therefore, three independent differentiation runs of every cell line, culture of
Discussion
105
the 2D hiPSC-CMs under same conditions in close proximity, subsequent analysis
(immunoblot, mass spectrometry, immunofluorescence analysis) with one batch of hiPSC-CMs
at the same time, including treatment and culture, were performed. Unfortunately, due to
regular culture problems, batch differences, external and technical factors, not always the
same sample set could be used. For instance, several wells of HCMhet hiPSC-CMs were lost
during culture due to a too strong beating behaviour, but only in two out of three batches. The
reasons for this remain elusive, however many factors are involved in the overall procedure
and only the variation of the cultivator could have a huge impact. Nonetheless, the same
differentiation runs were analysed for every hiPSC-CM line by immunoblotting, mass
spectrometry and immunofluorescence analysis.
This study investigated a putative ALP alteration in HCM and DCM and even though, a lot of
data was gathered, it remains unclear whether the ALP is activated or impaired. However, it
could be that external factors that lead to batch-to-batch variabilities as well as immaturity
could ‘mask’ the effect of the disease on the autophagic flux. Nonetheless, this study showed
that the autophagic flux can be evaluated in hiPSC-CMs derived from an HCM and a DCM
patient. Also differences between the hiPSC-CM lines were detected, such as a higher
increase in LC3-II in HCM but a lower increase in DCM hiPSC-CMs when compared to the
corresponding isogenic control. The increase in the autophagic flux in HCM hiPSC-CMs might
be a compensatory mechanism to reduce the p62 aggregates. In all investigated hiPSC-CMs,
an increase in p62 after Bafilo treatment was detected by mass spectrometry and
immunofluorescence. Furthermore, the small number of publications that evaluated the
autophagic flux in hiPSC-CMs, indicate a great need for further studies. Especially since
pathomechanisms that lead from the mutation to the phenotype are still not fully elucidated for
both HCM and DCM (Eschenhagen and Carrier 2018).
5.2. Generation and validation of MYBPC3-deficient hiPSC-derived cardiomyocytes as a
human in vitro model of HCM
The second aim of the presented study was to evaluate the role of cMyBP-C in the
pathogenesis of HCM in a human context. Therefore, a cMyBP-C deficient human cellular
model of HCM was generated by CRISPR/Cas9 gene editing of hiPSCs from a healthy
individual. Hereby, it was aimed to introduce a frameshift mutation that resembles a founder
mutation from Tuscany, Italy (c.772G>A; Olivotto et al. 2008; Vignier et al. 2009).
Subsequently, the genetically modified hiPSCs were differentiated into beating CMs and
characterized in vitro to evaluate the eligibility as a human cellular HCM model.
Discussion
106
cMyBP-C-deficient hiPSC-CM lines reveal features of human HCM in vitro
To evaluate the role of cMyBP-C in the diseased human heart, a functional MYBPC3-KO
hiPSC line was generated by CRISPR/Cas9 gene editing. Hereby, the applied CRISPR/Cas9
approach had a high efficiency since ~74% of the picked clones survived and 50% were
genetically modified. Further, three homozygous clones were obtained, resulting in a ~11.5%
KO efficiency. The remaining genetically modified clones were either heterozygous (~38.5%)
or compound heterozygous (~11.5%). The applied CRISPR/Cas9 approach was based on one
of the first publications that thoroughly explained how to perform CRISPR/Cas9 gene editing
in mammalian cells (Ran et al. 2013). The authors emphasized the overall easiness of the
design, execution and adaption of the CRISPR/Cas9 system by reaching high CRISPR/Cas9
gene editing efficiencies and performing multiplex editing (65-68% efficiency). However, the
authors genetically modified HEK 293FT and HUES9 cells and not hiPSCs. HEK 293FT is one
of the most widely used in vitro cell line worldwide since it is fast growing, easily maintained
and shows high transfection rates. However, the applicability of HEK 293FT cells in research
is under discussion since its origin, phenotype, karyotype and tumorigenicity is ambiguous
(Stepanenko and Dmitrenko 2015). Therefore, HUES9 cells were CRISPR, which is a hESC
cell line and thus closer to the here used in vitro model hiPSCs. However, also for the stable
HUES9 cell line, CRISPR/Cas9 gene editing via HDR resulted in low efficiencies (2.2%).
Furthermore, the authors pointed out that hiPSCs can vary widely in their transfection
efficiency, maintenance and tolerance towards single-colony formation (Ran et al. 2013). This
was also shown by other groups and many improvements have been undertaken to improve
CRISPR/Cas9 gene editing, such as the refinement of the Cas9 nuclease activity to reduce off
target events (Kleinstiver et al. 2016), the optimization of ‘repair’/’mutation’ templates for HDR
(Okamoto et al. 2019) or the overall modification of CRISPR/Cas9 gene editing in hiPSCs
(Paquet et al. 2016; Giacalone et al. 2018).
In the present study, the high gene editing efficiency of 50% in hiPSC clones that survived
picking (~37% of all picked clones) was reached by applying CRISPR/Cas9 gene editing via
NHEJ. This untargeted KO approach was selected since it was aimed to introduce a frameshift
in MYBPC3 that results in a PTC in exon 9, similar to what was observed in the patients
carrying the founder mutation (c.772G>A; Olivotto et al. 2008) or in the corresponding HCM
mouse model carrying a Mybpc3-targeted knock-in that resembles the very same founder
mutation (Vignier et al. 2009). CRISPR/Cas9 gene editing via NHEJ is known to be more
efficient than targeted genetically modification via HDR, which is quite limited in its applicability
and thus, under constant optimization to yield higher efficiencies (Paquet et al. 2016; Okamoto
et al. 2019). Further, by using a CRISPR/Cas9 gene editing approach via NHEJ, only a single
plasmid encoding the Cas9 nuclease and the sgRNA needs to be delivered into hiPSCs,
without an additional ‘repair’/’mutation’ template that requires successful double transfection
Discussion
107
of a single hiPSC. Nonetheless, the here used CRISPR/Cas9 gene editing approach had to
be continuously improved to successfully generate a MYBPC3-deficient hiPSC line. The first
bottleneck was the successful delivery of the plasmid encoding the Cas9 nuclease and the
applied sgRNA. In the present study, nucleofection was used but also transfection and regular
electroporation has been described. However, nucleofection is the most widely used and
supposedly most gentle delivery approach with the highest overall gene targeting efficiencies
(Byrne et al. 2014). For nucleofection, a variety of programs and two different buffers were
tested (see 3.2.3) and the best combination applied (CA-137 and P3 buffer; see Figure 33).
The second bottleneck was the survival of FACS sorting for GFP+ clones and the subsequent
single colony formation. Here, mTESR medium turned out to be the game changer. Although
ERC018 hiPSCs cultivated in CoM and mTESR medium before nucleofection showed a similar
percentage of GFP+ cells (6.5% vs 5.8%) at the FACS, solely the mTESR cultivated cells
survived single colony formation.
Nonetheless, MYBPC3 was successfully modified and thus, one homozygous (hom.
clone#11), one compound heterozygous (c.het. clone#14) and one heterozygous clone (het.
clone#15) were validated for their purity and putative off-target events. The ten most likely off-
target loci did not show any traces of Cas9 nuclease activity. Low off-target activity of Cas9
has been published by others (Smith et al. 2014; Veres et al. 2014) and suggests that an
optimized Cas9 nuclease (e.g. high fidelity Cas9; Kleinstiver et al. 2016) might only be required
for genes that have a high similarity to their isoforms. Nevertheless, one publication that
reported an off-target event in the related isoform did not detect a phenotype that was induce
by the off-target event (see Mosqueira et al. 2018). A recent study provided a new versatile
and precise tool to perform gene editing, Prime editing, with even lower off-target activity.
Prime editing directly writes the new genetic information into a specified DNA site without the
introduction of DSBs or donorDNA. Therefore, a catalytically impaired Cas9 nuclease is fused
to an engineered reverse transcriptase, which is in turn programmed by a prime editing guide
RNA that specifies the target site and encodes the desired edit (Anzalone et al. 2019).
Nonetheless, whole-genome sequencing is advisable to fully exclude off-target events in
CRISPR clones.
The subsequent evaluation of the karyotype by two independent methods revealed a trisomy
of chromosome 1 in all three CRISPR clones. This karyotypic abnormality seemed to be
acquired during regular culture before CRISPR/Cas9 gene editing was performed and not
caused by the actual CRISPR/Cas9 procedure. The likelihood to acquire the very same
karyotypic abnormality coincidentally is rather low (Närvä et al. 2010). Besides, another PhD
student detected a trisomy in chromosome 1 in all of her CRISPR clones that originated from
the very same ERC018 hiPSCs. Her CRISPR/Cas9 approach was also plasmid-based but

Discussion
108
here a targeted KO of DNA methyltransferase 3A (DNMT3A) was performed (Löser 2018).
Further, it has been published that karyotypic abnormalities do constantly occur in hiPSC
culture, independent of reprogramming or culture conditions, at low and high passage
numbers. However, the probability to acquire such a karyotypic abnormality seems to increase
with higher passage number (Taapken et al. 2011). Thus, the relatively high passage number
of p37 of the used ERC018 hiPSCs at nucleofection, seemed to be rather problematic. In
general, if the acquired karyotypic abnormality represents a growth advantage, the single
hiPSC carrying such an abnormality will overgrow the whole culture within a few weeks as
seen by Brenière-Letuffe et al. (2018). The authors performed RGB marking of three different
hiPSC lines with LeGo vectors that allow to track sub-clonal distribution over time by FC or
immunofluorescence analysis and observed a reduction in sub-clonal diversity with culture
time. Therefore, high quality culture should be ensured by stringent and robust standards, such
as a master hiPSC bank of low passage number and a correct karyotype, short culture times
of a few passages and regular testing for genomic integrity, even though this is time and cost
consuming (Brenière-Letuffe et al. 2018). Further, for genetically modified hiPSCs, it is highly
advisable to perform regularly genotyping, as it is mandatory in mice and also performed in the
present study. In hiPSCs, the most frequently acquired abnormalities are a trisomy in
chromosome 8 or chromosome 12 (Taapken et al. 2011) but a trisomy of chromosome 1 has
not been published yet. However, chromosomal aberrations have been frequently detected in
hESCs (q arm; Taapken et al. 2011). In humans, a trisomy of chromosome 1 has been reported
to either result in a miscarriage or in prenatal death of the embryo within the first weeks of
pregnancy (Hanna et al. 1997; Dunn et al. 2001; Banzai et al. 2004). Thus, the trisomy in
chromosome 1 supposedly (adversely) affects hiPSCs. As a small attempt to validate the
putative effect of the trisomy in chromosome 1, by determining the expression of LMNA
(located on chromosome 1) by RT-qPCR in hiPSC-CMs of ERC018 and the three CRISPR
clones (see Figure 49). Only c.het. clone#14 showed a significant increase of ~30% in LMNA
when compared to ERC018, whereby an increase in LMNA mRNA was expected in all three
CRISPR clones since all of them carry a trisomy in chromosome 1. Nevertheless, LMNA is
only one out of ~2000 genes that are located on chromosome 1. Furthermore, significantly
higher CT levels of GAPDH, the applied housekeeping gene, were detected in c.het. clone#14,
which could explain the increase in LMNA mRNA level. Thus, RNAseq would be advised to
evaluate the effect of the trisomy on gene expression level. Scientists all over the world
handling hiPSCs are struggling with abnormal karyotypes but there is no systematic evaluation
of chromosomal aberrations or trisomy in hiPSCs or hiPSC-CMs to date. Thus, the question
remains if and how karyotypic abnormalities affect the cell’s integrity or phenotype and
moreover how its occurrence can be ultimately prevented. The here applied CRISPR/Cas9
approach was repeated by a master student under my supervision and a functional MYBPC3-

Discussion
109
KO was generated with a normal karyotype. However, this finding is not part of the present
study.
Even though, all of the investigated CRISPR clones showed a trisomy in chromosome 1, all
three were successfully differentiated into beating CMs, whereby there was no significant
difference in the hiPSC-CMs yield or in the differentiation efficiency when compared to ERC018
hiPSC-CMs. Thus, cardiac differentiation appeared not to be affected by the genetic
modification of MYBPC3 or the trisomy in chromosome 1. At least for the genetically modified
hiPSCs, a decreased or impaired cardiac differentiation was not expected since many studies
showed the successful cardiac differentiation of gene-edited hiPSCs. Hereby, the mutation
was either introduced into a healthy genome (Mosqueira et al. 2018) or corrected in a diseased
patient hiPSC line by CRISPR/Cas9 (Hinson et al. 2015; Smith et al. 2018; Prondzynski et al.
2019). To date, the effect of a karyotypic abnormality on the cardiac differentiation has not
been systematically evaluated and thus remains elusive.
Diseased modelling of MYBPC3-deficient hiPSC-CM lines revealed haploinsufficiency
and increased cell area with culture time
To validate whether the genetic modification of MYBPC3 indeed induced a frameshift and thus
a PTC and the putative degradation via NMD of its mRNA was evaluated. The NMD degrades
nonsense mRNA transcripts to prevent the translation of truncated and thus (putatively) toxic
protein. In HCM patients carrying the founder mutation (c.772G>A), a nonsense mRNA was
detected, whereby skipping of exon 6 resulted in a PTC in exon 9 putatively and subsequently
in a truncated protein (Helms et al. 2014). In Mybpc3-target knock-in mice that resemble the
founder mutation, three different mutant mRNAs were detected. A missense mRNA, which
results in a E264K protein, a nonsense mRNA, that is associated with the skipping of exon 6,
a PTC in exon 9 and a truncated protein, and a deletion/insertion mRNA that results in a
roughly wild-type sized cMyBP-C (Vignier et al. 2009). The here applied CRISPR design was
an untargeted approach that aimed to introduce a frameshift and a subsequent PTC, to
resemble a human founder mutation (c.772G>A). However, the formation of similar mRNA
forms were expected.
For all CRISPR clones, mRNA forms with an induced frameshift and a PTC was detected (see
Figure 46). Unexpectedly, additional forms of mRNA were detected in all three CRISPR clones
due to alternative splicing, that either resulted in the partial or complete retention of intron 8
and in one case to the formation of a new splice site (see Figure 47). However, this only seems
to be problematic for the c.het. clone#14. Here, the partial retention of intron 8 on the allele
with the T insertion led to the restoration of the reading frame and thus a 3864-bp mRNA is
transcribed and consequently, a nearly wild-type sized protein of 1287 amino acids is

Discussion
110
produced. To verify the here detected alternative forms of mRNA and to assure that no
additional alternative mRNA forms were formed, it would be recommended to increase the
PCR product size (e.g. exon 4 – 11) for excluding the retention of a proximate intron or to
perform RNA-seq. Nonetheless, the present study obtained MYBPC3-deficient hiPSC-CM
lines that resemble the human founder mutation as a frameshift and a subsequent PTC was
detected.
The validation of the different forms of MYBPC3 mRNA (see Figure 48), revealed a significant
reduction of ~55% of MYBPC3 transcript only in the hom. clone#11. This reduction is in line
with a recent publication of our group that showed a 50% reduction of MYBPC3 mRNA in HCM
hiPSC-CMs than to non-isogenic control hiPSC-CMs. However, these hiPSC-CM were
carrying a heterozygous mutation (c.1358-1359insC; Prondzynski et al. 2017), and not a
homozygous mutation as in the present study. Though, a recent study showed that the genetic
background has an influence on the severity of the cardiac disease phenotype in vitro (Smith
et al. 2018). This implies that the disease phenotype in vitro differs in its severity between
hiPSC-CMs in which mutations have been introduced into a healthy background versus the
repair of the mutation in diseased background. Nonetheless, for all three CRISPR clones it can
be assumed that not all forms of (‘regular’ and alternative) mRNA are degraded via NMD. A
repetition of the mRNA evaluation after NMD inhibitor treatment with cycloheximide is
recommended. Nevertheless, we were really surprised by the multiple forms of alternatively
formed mRNA transcripts since this was not published at the time of design and execution of
the experiments.
Since truncated proteins have not been detected yet (Marston et al. 2009; van Dijk et al. 2009)
and a potential degradation by the UPS is possible (Sarikas et al. 2005), all three CRISPR
clones and ERC018 were treated with the proteasome inhibitor MG-132 and subsequently
analysed by immunoblotting with an N-terminal cMyBP-C antibody (see Figure 51). A WT sized
band of cMyBP-C was detected in ERC018, c.het. clone#14 and het. clone#15 but not in the
hom. clone#11. However, the weak cMyBP-C signal for the c.het. clone#14 could be explained
by the alternative splicing detected on the T insertion allele that restored the reading frame.
The het. clone#15 showed a signal for cMyBP-C that is comparable to the one of ERC018.
This was expected since Mybpc3-targeted knock-in mice, which resemble the same founder
mutation, are known to have ~80% of WT cMyBP-C protein (Vignier et al. 2009). A truncated
form of cMyBP-C with an expected size of roughly ~30 kDa was not detected in all three
CRISPR clones or ERC018 hiPSC-CMs that were treated with MG-132, although the treatment
proved to be effective (see Figure 52). ERC018 hiPSC-CMs were also expected to show
truncated cMyBP-C due the here detected alternative splicing in the wild-type sequence of het.
clone#15 (see Figure 47). However, truncated forms of cMyBP-C have not been detected in
Discussion
111
HCM patients yet, implying haploinsufficiency as a disease mechanism (Marston et al. 2009;
van Dijk et al. 2009). Furthermore, truncated cMyBP-C was also not detected in HCM hiPSC-
CMs carrying a heterozygous MYBPC3 mutation, but reduced full-length cMyBP-C levels
(Prondzynski et al. 2017). Nonetheless, the results of the mRNA evaluation indicated that the
putative degradation of the mRNA via NMD is only partial. This is of particular of interest, since
a recent study showed that a chronic activation of the NMD due to a MYBPC3 mutation lead
to cardiac hypertrophy. Although the investigated MYBPC3 mutations (p. 943x; p.R1073) differ
from the here investigated mutation, these mutations also introduce a frameshift with a
subsequent PTC (Seeger et al. 2019): Thus it is highly recommend to make another attempt
to detect truncated cMyBP-C. Therefore, hiPSC-CM lines should be treated with a permanent
proteasome inhibitor, such as epoxomicin. Maybe this could also help to further clarify the band
of ~30 kDa that was detected in ERC018 hiPSC-CMs in the DMSO and not in MG-132 treated
samples. In the literature, solely a 40 kDa band of cMyBP-C has been described that seems
to play a crucial role in the stressed heart of humans and mice (Govindan et al. 2012; Razzaque
et al. 2013).
Our findings emphasize that the verification of genetical modification on gDNA level must not
be transferable to mRNA and protein level. In the course of this year, a study was published
addressing the rescue of the target activity in CRISPR KOs due to alternative splicing and
translation initiation (Smits et al. 2019). The authors investigated 193 genetically modified
deletions to be able to make an assessment, hereof a third showed either alternative splicing
or translation initiation. Even though this study worked with HAP1 cells that are derived from a
patient with chronic myeloid leukaemia, the overall findings should be transferrable.
Next, the three CRISPR clones and ERC018 hiPSC-CMs were morphologically analysed. Light
microscopy did not reveal big differences between the cell lines (see Figure 53), just a
tendency towards bigger and faster beating cells was observed over a period of 30 days. The
putatively altered beating behaviour was not further investigated due to time limitations.
However, immunofluorescence staining confirmed striated sarcomeres for all investigated cell
lines thus proper formation of sarcomeres. Surprisingly, one cMyBP-C antibody showed a
weak signal of cMyBP-C in hom. clone#11 at seven and 30 days (Figure 55 and Figure S11).
This was unexpected since a regular-sized or truncated form of cMyBP-C has not been
detected by immunoblotting and also not by immunofluorescence with an N-terminal cMyBP-
C antibody (see Figure 54). Nonetheless, the presence of a truncated protein or lack of
specificity of the antibody cannot be excluded. As expected, the het. clone#15 showed a
relatively strong signal for cMyBP-C matching the findings of the immunoblot (see Figure 51).
The cMyBP-C signal for the c.het. clone#14 was relatively prominent and can be explained by
alternative splicing (see Figure 47).
Discussion
112
Evaluation of the cell area was performed, since hypertrophy is a hallmark of HCM (see Figure
56). The three CRISPR hiPSC-CMs exhibited larger cell size than ERC018 at 30 days of
culture. This finding is in line with a recent publication of our group that determined a
significantly higher cell area of HCM hiPSC-CMs than in non-isogenic and isogenic control
hiPSC-CMs (Prondzynski et al. 2019). A nice overview was provided by Eschenhagen and
Carrier (2019) that reviewed the hallmarks of HCM and DCM in hiPSC-CMs provided by
several studies. In regard to cell size, the authors pointed out that although an increase in cell
size was detected in the different HCM hiPSC-CM studies (156±85%, n = 15), there is a vast
discrepancy in the actual size of the CMs, as well as in the extent of the increase.
Unfortunately, the above-mentioned experiments were only performed once due to time
limitations. Further experiments are planned for the future, such as the evaluation of
myofibrillar disarray that was indicated by immunofluorescence analysis. Nevertheless, the
here performed experiments indicate that the generated cMyBP-C-deficient hiPSC-CMs could
be a putative in vitro HCM model. However, further experiments are needed and the effect of
the trisomy in chromosome 1, which is present in all CRISPR clones, on disease phenotypes
needs to be further evaluated.
In the literature, several hiPSC-based disease models of HCM have been described that seem
to resemble disease hallmarks, for instance larger cell size, myocardial disarray or higher
expression of NPPA, NPPB and MYH7, even the translation to the clinics was shown in one
study (Brodehl et al. 2019; Prondzynski et al. 2019). Thus hiPSC-CMs seem to be the
appropriate tool to study human inherited cardiomyopathies in vitro. Nevertheless, results of
disease modelling studies vary significantly and thus there is a great need for systematic and
thorough analysis, preferable in high throughput format, that enables quantitative comparisons
(Eschenhagen and Carrier 2018). A recent study exactly addresses this by providing a high-
throughput phenotyping toolkit to characterized HCM hiPSC-CMs that can be used to minimize
technical artefacts and thus allows to solely evaluate the molecular and functional parameters
of HCM in vitro (Mosqueira et al. 2019a). Moreover, we rather seem to be at the beginning to
understand hiPSC-CMs and their associated molecular mechanisms. For instance, it has been
shown that age of the patient and genetic background has an influence on the severity of the
cardiac disease phenotype in vitro (Smith et al. 2018). This is supported by a recent study that
performed disease modelling experiments with an HCM hiPSC-CMs line, but also detected a
significant difference between a non-isogenic and a isogenic control hiPSC-CM line
(Prondzynski et al. 2019). Thus, disease modelling should be performed in hiPSC-CMs with
the genetically matching isogenic controls (Musunuru et al. 2018). Further, hiPSC-CMs are
known to be rather immature and to exhibit phenotypic heterogeneity and also culture
conditions seem to influence the disease phenotype in vitro (Eschenhagen and Carrier 2018).
Furthermore, patients suffering from inherited cardiomyopathies are generally rather old at the

Discussion
113
occurrence of first symptoms. Since hiPSC-CMs are known to be rather immature (Yang et al.
2014), it might be too much to expect of hiPSC-CMs to resemble all disease hallmarks, at least
at the present. Nonetheless, disease modelling with hiPSC-CMs seems to be a rather
promising in vitro tool that shall bring us closer to the ultimate goal to develop novel therapies.
5.3. Conclusion and further perspectives
The present study aimed to investigate the putative participation and interplay of an (defective)
ALP and MYBPC3 mutations on the pathogenesis of human inherited cardiomyopathies (HCM
and DCM). A (putative) alteration of the ALP in HCM and DCM is indicated by higher protein
levels of LC3-II in both, and lower LAMP-2 in HCM, but higher LAMP-2 in DCM tissue samples.
Further, the autophagic flux seems to be dysregulated in diseased hiPSC-CMs, as indicated
by a higher increase in LC3-II protein in mutated HCM hiPSC-CMs than in HCMrepair and a
smaller increase in LC3-II in DCM than in DCMrepair hiPSC-CMs after Bafilo treatment. Of
interest seems to be p62 that showed only higher protein levels in DCM tissue samples and
unchanged levels in DCMrepair and DCM hiPSC-CMs, but only showed an increase in its level
after Bafilo treatment in healthy ctrl and HCMhet hiPSC-CMs. However, the evaluation of the
autophagic flux by mass spectrometry and immunofluorescence revealed an increase of p62
in all investigated hiPSC-CMs after Bafilo treatment. Furthermore, MYBPC3-deficient hiPSC-
CM lines were generated that resemble hallmarks of HCM, such as haploinsufficiency and
hypertrophy. However, the ALP was not investigated in this in vitro model. As of today, it
remains unclear how the ALP and cMyBP-C (adversely) affect HCM and DCM and if there is
an (presumed) interplay.
Therefore, future experiments are planned, such as a repetition of the evaluation of the
autophagic flux by mass spectrometry by analysing post-transcriptional modifications is
planned to be able to analyse LC3-II. Further, the utilization of a mTagRFP_mWasabi_hLC3
tandem construct to visualize and evaluate the autophagic flux in hiPSC-CMs. Moreover, the
HCMhom hiPSC-CMs should be further characterized as a putative in vitro model of
proteotoxicity, as these cells show an increase autophagic flux that might compensate the
marked aggregation of p62 detected by immunofluorescence that was not detected by
immunoblotting. Further, mass spectrometry analysis revealed markedly lower levels of
several sarcomeric proteins, for instance cTnT. Thus, the HCMhom hiPSC-CM line could help
to further clarify the role of the ALP in disease progression of human inherited
cardiomyopathies.

Summary
114
6. Summary
The autophagy-lysosomal pathway (ALP) maintains cellular homeostasis by degrading long-
lived proteins and organelles. Hypertrophic (HCM) and dilated cardiomyopathy (DCM) are the
two most common human inherited cardiomyopathies and MYBPC3, encoding the cardiac
myosin-binding protein C (cMyBP-C), is the most frequently mutated gene in HCM. However,
it remains elusive how an (altered) ALP and MYBPC3 mutations effectively contribute to the
pathogenesis of HCM and DCM. Therefore, myocardial tissue samples of HCM and DCM
patients, as well as 2D cultured human induced-pluripotent stem cell-derived cardiomyocytes
(hiPSC-CMs) of an HCM patient and a DCM patient were evaluated for a putatively altered
ALP. Besides, homozygous, compound heterozygous and heterozygous MYBPC3-deficient
human cellular models of HCM were generated and characterized as hiPSC and hiPSC-CMs.
The ALP evaluation in cardiac tissues samples showed lower levels of LAMP-2 in HCM, but
higher levels of LAMP-2 in DCM that were also present in DCM hiPSC-CMs by tendency.
Further, a higher autophagic activity was detected in HCM hiPSC-CMs, whereas DCM hiPSC-
CMs showed a lower autophagic activity than the corresponding isogenic controls. Protein
expression changes observed in mass spectrometry of samples treated with an ALP inhibitor
however seemed to correlate more with batch-to-batch variability and/or genetic background
than with the treatment. Although, a batch-to-batch variability was also detected by
immunoblotting, the differences were not as prominent as the ALP-inhibition-induced increase
in LC3-II. Despite this, an increase of p62 after ALP inhibition was detected in all hiPSC-CMs
by mass spectrometry and immunofluorescence. In all HCM hiPSC-CMs a striated pattern of
p62 aggregates was detected by immunofluorescence staining, suggesting a higher ALP
activity along sarcomeres, t-tubules or the sarcoplasmic reticulum.
Concurrently, the MYBPC3-deficient hiPSC clones, generated by CRISPR, were differentiated
into hiPSC-CMs of high purity, although a trisomy of chromosome 1 was detected in all of
them. mRNA analysis revealed alternative splicing, resulting in multiple forms of mRNA,
whereby the reading frame of the compound heterozygous clone was restored on one allele
and nearly full-length cMyBP-C was detected. For the homozygous clone, full-length cMyBP-
C was not detected. Further, truncated cMyBP-C was not detected in all CRISPR clones,
although MYBPC3 mRNA was still present in lower amounts. Cell area analysis at day 30 of
culture indicated hypertrophy in all CRISPR clones. Thus, the generated HCM model might be
a suitable in vitro tool, but further experiments are needed.
Finally, it remains unclear how the altered ALP and MYBPC3 mutations affect HCM and DCM.
However, the ALP is vital for the heart during disease, as it prevents the accumulation of toxic
proteins and a defect of the ALP in human inherited cardiomyopathy has been shown. Also,
the role of MYBPC3 within HCM has been deeply investigated. But it remains unclear how a

Summary
115
mutation in MYBPC3 and the involvement of the ALP ultimately lead to HCM or DCM
pathomechanism. Thus, there is a great need for research that ultimately aims to unravel novel
therapeutic options for human inherited cardiomyopathies.

Zusammenfassung
116
7. Zusammenfassung
Der Autophagie-lysosomale Signalweg (ALP) ist von entscheidender Bedeutung für die
zelluläre Homöostase, da er langlebige Proteine und Organellen abbaut. Hypertrophe (HCM)
und dilatative Kardiomyopathie (DCM) sind die zwei am häufigsten vorkommenden humanen
vererbbaren Kardiomyopathien und MYBPC3, welches das kardiale Myosin-bindende Protein-
C (cMyBP-C) kodiert, ist das am häufigsten mutierte Gen in HCM. Jedoch ist es bis heute
ungeklärt, wie ein (veränderter) ALP und Mutationen in MYBPC3 effektiv an der Pathogenese
von HCM und DCM beteiligt sind. Deswegen wurden myokardiale Gewebsproben von HCM
und DCM Patienten, sowie Kardiomyozyten, die aus humanen induzierten pluripotenten
Stammzellen von einem HCM Patienten und einem DCM Patienten (hiPSC-CMs) differenziert
wurden, auf eine mögliche Veränderung des ALPs untersucht. Zudem wurden homozygote,
gemischt heterozygote und heterozygote MYBPC3-defiziente, humane zelluläre HCM Modelle
generiert und auf Stammzell- und Kardiomyozytenebene näher charakterisiert.
Die Untersuchung des ALPs in humanem kardialem Gewebe zeigte einen niedrigeren
Proteinspiegel von LAMP-2 in HCM aber einen höheren Proteinspiegel in DCM, welcher auch
tendenziell in DCM hiPSC-CMs präsent war. Zudem wurde eine gesteigerte autophagische
Aktivität in HCM, aber eine verringerte autophagische Aktivität in DCM hiPSC-CMs im
Vergleich zu den zugehörigen isogenen Kontrollen gezeigt. Die massenspektrometrische
Analyse von ALP-Inhibitor-behandelten Proben zeigte, dass die Batch-zu-Batch Variabilität
und/oder der genetische Hintergrund stärker mit der Veränderung der Proteinexpression in
den behandelten Proben zu korrelieren scheint als mit der Behandlung. Obwohl eine Batch-
zu-Batch Variabilität auch im Immunoblot bestand, war diese nicht stärker als der Anstieg in
LC3-II nach ALP-Inhibierung. Jedoch zeigten die massenspektrometrische Untersuchung und
die Immunfluoreszenzfärbung einen Anstieg der p62 Proteinmenge nach ALP-Inhibierung,
unabhängig von der beobachteten Variabilität. Zudem zeigten die
Immunfluoreszenzfärbungen aller HCM hiPSC-CMs eine deutliche Akkumulierung von p62 in
einem quergestreiften Muster, welches eine höhere ALP-Aktivität an den Sarkomeren, den T-
Tubuli oder dem Sarkoplasmatischen Retikulum andeutet.
Zeitgleich wurden mittels CRISPR generierte MYBPC3-defiziente hiPSC Klone mit hoher
Effizienz zu hiPSC-CMs differenziert, obwohl eine Trisomie von Chromosom 1 in allen
geCRISPRten Klonen vorlag. Diese zeigten zahlreiche mRNA Variationen von MYBPC3, die
unter anderem durch alternatives Spleißen entstanden waren. Dies war nur problematisch für
den gemischt heterozygoten Klon, da hier das Leseraster wiederhergestellt wurde und ein
cMyBP-C in fast voller Länge detektiert wurde. Für den homozygoten Klon wurde cMyBP-C
nicht in voller Länge detektiert. Zudem wurde in keinem der geCRISPRerten Klone trunkiertes
cMyBP-C gefunden, obwohl entsprechende MYBPC3 mRNA in reduzierter Menge vorhanden
Zusammenfassung
117
war. Messungen der Zellfläche nach 30 Tagen Kultivierung deuteten auf eine Hypertrophie
hin, ein Kennzeichen von HCM. Aus den Daten lässt sich schließen, dass das hier generierte
humane HCM Modell geeignet scheint, HCM in vitro zu untersuchen, wobei jedoch weitere
Experimente nötig sind.
Abschließend lässt sich sagen, dass unklar bleibt, wie der veränderte ALP und MYBPC3
Mutationen HCM und DCM beeinträchtigen. Nichtdestotrotz ist der ALP essentiell für das Herz
während einer Erkrankung, da er die Akkumulierung von toxischen Proteinen verhindert und
eine Beeinträchtigung des ALPs in humanen vererbbaren Kardiomyopathien gezeigt wurde.
Auch die Rolle von MYBPC3 in HCM wurde schon ausführlich untersucht. Jedoch, bleibt
unklar, wie eine Mutation in MYBPC3 und die Beteiligung des ALPs schließlich zu den
Pathomechanismen von HCM und DCM führen. Folglich gibt es einen großen
Forschungsbedarf, um neue therapeutische Optionen für humane vererbbare
Kardiomyopathien zu entwickeln.
Literature
118
8. Literature
Anzalone A V., Randolph PB, Davis JR, et al (2019) Search-and-replace genome editing
without double-strand breaks or donor DNA. Nature 576:149–157. doi: 10.1038/s41586-
019-1711-4
Balasubramaniam S, Riley LG, Vasudevan A, et al (2017) EPG5-Related Vici Syndrome: A
Primary Defect of Autophagic Regulation with an Emerging Phenotype Overlapping with
Mitochondrial Disorders. JIMD Rep 42:19–29. doi: 10.1007/8904_2017_71
Banzai M, Sato S, Matsuda H, Kanasugi H (2004) Trisomy 1 in a case of a missed abortion.
J Hum Genet 49:396–397. doi: 10.1007/s10038-004-0164-1
Behrens-Gawlik V, Mearini G, Gedicke-Hornung C, et al (2014) MYBPC3 in hypertrophic
cardiomyopathy: from mutation identification to RNA-based correction. Pflugers Arch
Eur J Physiol 466:215–223. doi: 10.1007/s00424-013-1409-7
Bers DM (2002) Cardiac excitation–contraction coupling. Nature 415:198–205. doi:
10.1038/415198a
Bhaya D, Davison M, Barrangou R (2011) CRISPR-Cas Systems in Bacteria and Archaea :
Versatile Small RNAs for Adaptive Defense and Regulation. Annu Rev Genet 45:273–
297. doi: 10.1146/annurev-genet-110410-132430
Bozkurt B, Colvin M, Cook J, et al (2016) Current Diagnostic and Treatment Strategies for
Specific Dilated Cardiomyopathies: A Scientific Statement from the American Heart
Association. Circ 134:e579–e646. doi:10.1161/CIR.0000000000000455
Braunwald E (2017) Cardiomyopathies. Circ Res 121:711–721. doi:
10.1161/CIRCRESAHA.117.311812
Bravo-San Pedro JM, Kroemer G, Galluzzi L (2017) Autophagy and Mitophagy in
Cardiovascular Disease. Circ Res 120:1812–1824. doi:
10.1161/CIRCRESAHA.117.311082
Breckwoldt K, Letuffe-Brenière D, Mannhardt I, et al (2017) Differentiation of cardiomyocytes
and generation of human engineered heart tissue. Nat Protoc 12:1177–1197. doi:
10.1038/nprot.2017.033
Brenière-Letuffe D, Domke-Shibamiya A, Hansen A, et al (2018) Clonal dynamics studied in
cultured induced pluripotent stem cells reveal major growth imbalances within a few
weeks. Stem Cell Res Ther 9:. doi: 10.1186/s13287-018-0893-2
Brodehl A, Ebbinghaus H, Deutsch MA, et al (2019) Human Induced Pluripotent Stem-Cell-

Literature
119
Derived Cardiomyocytes as Models for Genetic Cardiomyopathies. Int J Mol Sci 20:.
doi: 10.3390/ijms20184381
Byrne SM, Mali P, Church GM (2014) GENOME EDITING IN HUMAN STEM CELLS.
Methods Enzymol 546:119–138. doi: 10.1016/B978-0-12-801185-0.00006-4
Caragnano A, Aleksova A, Bulfoni M, et al (2019) Autophagy and Inflammasome Activation
in Dilated Cardiomyopathy. J Clin Med 8:1519. doi: 10.3390/jcm8101519
Carrier L, Bonne G, Bährend E, et al (1997) Organization and sequence of human cardiac
myosin binding protein C gene (MYBPC3) and identification of mutations predicted to
produce truncated proteins in familial hypertrophic cardiomyopathy. Circ Res 80:427–
434. doi: 10.1161/01.res.0000435859.24609.b3
Carrier L, Mearini G, Stathopoulou K, Cuello F (2015) Cardiac myosin-binding protein C
(MYBPC3) in cardiac pathophysiology. Gene 573:188–197. doi:
10.1016/j.gene.2015.09.008
Chi C, Leonard A, Knight WE, et al (2019) LAMP-2B regulates human cardiomyocyte
function by mediating autophagosome–lysosome fusion. Proc Natl Acad Sci U S A
116:556–565. doi: 10.1073/pnas.1808618116
Cullup T, Kho AL, Dionisi-vici C, et al (2013) Recessive mutations in EPG5 cause Vici
syndrome , a multisystem disorder with defective autophagy. Nat Genet 45:83–87. doi:
10.1038/ng.2497.
Dambrot C, Braam SR, Tertoolen LGJ, et al (2014) Serum supplemented culture medium
masks hypertrophic phenotypes in human pluripotent stem cell derived cardiomyocytes.
J Cell Mol Med 18:1509–1518. doi: 10.1111/jcmm.12356
Delbridge LMD, Mellor KM, Taylor DJ, Gottlieb RA (2017) Myocardial stress and autophagy:
Mechanisms and potential therapies. Nat Rev Cardiol 14:412–425. doi:
10.1038/nrcardio.2017.35
Deter RL, De Duve C (1967) INFLUENCE OF GLUCAGON, AN INDUCER OF CELLULAR
AUTOPHAGY, ON SOME PHYSICAL PROPERTIES OF RAT LIVER LYSOSOMES. J
Cell Biol 33:437–449. doi: 10.1083/jcb.33.2.437
Dorsch LM, Schuldt M, Knežević D, et al (2019) Untying the knot: protein quality control in
inherited cardiomyopathies. Pflugers Arch Eur J Physiol 471:795–806. doi:
10.1007/s00424-018-2194-0
Dunn TM, Grunfeld L, Kardon NB (2001) Trisomy 1 in a Clinically Recognized IVF
Pregnancy. Am J Med Genet 99:152–153. doi: 10.1002/1096-

Literature
120
8628(2000)9999:999<00::aid-ajmg1130>3.0.co;2-p
Eschenhagen T (2010) Is ryanodine receptor phosphorylation key to the fight or flight
response and heart failure ? J Clin Invest 120:4197–4203. doi: 10.1172/JCI45251
Eschenhagen T, Carrier L (2018) Cardiomyopathy phenotypes in human-induced pluripotent
stem cell-derived cardiomyocytes—a systematic review. Pflügers Arch - Eur J Physiol
471:755–768. doi: 10.1007/s00424-018-2214-0
Eschenhagen T, Mummery C, Knollmann BC (2015) Modelling sarcomeric cardiomyopathies
in the dish : from human heart samples to iPSC cardiomyocytes. Cardiovasc Res
105:424–438. doi: 10.1093/cvr/cvv017
Eskelinen EL (2006) Roles of LAMP-1 and LAMP-2 in lysosome biogenesis and autophagy.
Mol Aspects Med 27:495–502. doi: 10.1016/j.mam.2006.08.005
Eskelinen EL, Saftig P (2009) Autophagy: A lysosomal degradation pathway with a central
role in health and disease. Biochim Biophys Acta - Mol Cell Res 1793:664–673. doi:
10.1016/j.bbamcr.2008.07.014
Feng Y, He D, Yao Z, Klionsky DJ (2014) The machinery of macroautophagy. Cell Res
24:24–41. doi: 10.1038/cr.2013.168
Flashman E, Korkie L, Watkins H, et al (2008) Support for a trimeric collar of myosin binding
protein C in cardiac and fast skeletal muscle , but not in slow skeletal muscle. FEBS Lett
582:434–438. doi: 10.1016/j.febslet.2008.01.004
Flashman E, Redwood C, Moolman-Smook J, Watkins H (2004) Cardiac Myosin Binding
Protein C - Its Role in Physiology and Disease. Circ Res 94:1279–1289. doi:
10.1161/01.RES.0000127175.21818.C2
Fougerousse F, Delezoide A, Fiszman MY, et al (1998) Cardiac Myosin Binding Protein C
Gene Is Specifically Expressed in Heart During Murine and Human Development. Circ
Res 82:130–133. doi: 10.1161/01.RES.82.1.130
Garbern JC, Helman A, Sereda R, et al (2019) Inhibition of mTOR Signaling Enhances
Maturation of Cardiomyocytes Derived from Human Induced Pluripotent Stem Cells via
p53-Induced Quiescence. Circulation CIRCULATIONAHA.119.044205. doi:
10.1161/CIRCULATIONAHA.119.044205
Gautel M, Zuffardi O, Freiburg A, Labeit S (1995) Phosphorylation switches specific for the
cardiac isoform of myosin binding protein-C: a modulator of cardiac contraction? EMBO
J 14:1952–1960. doi: 10.1002/j.1460-2075.1995.tb07187.x
Literature
121
Geske JB, Ong KC, Siontis KC, et al (2017) Women with hypertrophic cardiomyopathy have
worse survival. Eur Heart J 38:3434–3440. doi: 10.1093/eurheartj/ehx527
Ghosh R, Pattison JS (2018) Macroautophagy and Chaperone-Mediated Autophagy in Heart
Failure: The Known and the Unknown. Oxid Med Cell Longev 2018:22 Pages. doi:
10.1155/2018/8602041
Giacalone JC, Sharma TP, Burnight ER, et al (2018) CRISPR-Cas9-Based Genome Editing
of Human Induced Pluripotent Stem Cells. Curr Protoc Stem Cell Biol 44:5B.7.1-
5B.7.22. doi: 10.1002/cpsc.46.
Goff ZD, Calkins H (2019) Sudden death related cardiomyopathies - Hypertrophic
cardiomyopathy. Prog Cardiovasc Dis 62:212–216. doi: 10.1016/j.pcad.2019.04.001
Gore A, Li Z, Fung H-L, et al (2011) Somatic coding mutations in human induced pluripotent
stem cells. Nature 471:63–67. doi: 10.1038/nature09805
Govindan S, Mcelligott A, Muthusamy S, et al (2012) Cardiac myosin binding protein-C is a
potential diagnostic biomarker for myocardial infarction. J Mol Cell Cardiol 52:154–164.
doi: 10.1016/j.yjmcc.2011.09.011.
Hailey DW, Kim PK, Satpute-Krishnan P, et al (2010) Mitochondria supply membranes for
autophagosome biogenesis during starvation. Cell 141:656–667. doi:
10.1016/j.cell.2010.04.009.
Halliday BP, Gulati A, Ali A, et al (2018) Sex- and age-based differences in the natural
history and outcome of dilated cardiomyopathy. Eur J Heart Fail 20:1392–1400. doi:
10.1002/ejhf.1216
Hanna JS, Shires P, Matile G (1997) Trisomy 1 in a Clinically Recognized Pregnancy. Am J
Med Genet 68:98–98. doi: org/10.1002/(SICI)1096-8628(19970110)68:1<98::AID-
AJMG20>3.0.CO;2-I
Hashem SI, Murphy AN, Divakaruni AS, et al (2017) Impaired mitophagy facilitates
mitochondrial damage in Danon disease. J Mol Cell Cardiol 108:86–94. doi:
10.1016/j.yjmcc.2017.05.007
Hashem SI, Perry CN, Bauer M, et al (2015) Brief Report: Oxidative Stress Mediates
Cardiomyocyte Apoptosis in a Human Model of Danon Disease and Heart Failure. Stem
Cells 33:2343–2350. doi: 10.1002/stem.2015
Hayashi-Nishino M, Fujita N, Noda T, et al (2009) A subdomain of the endoplasmic reticulum
forms a cradle for autophagosome formation. Nat Cell Biol 11:1433–1437. doi:
10.1038/ncb1991
Literature
122
Helms AS, Davis FM, Coleman D, et al (2014) Sarcomere Mutation-Specific Expression
Patterns in Human Hypertrophic Cardiomyopathy. Circ Cardiovasc Genet 7:434–443.
doi: 10.1161/CIRCGENETICS.113.000448
Herman DS, Lam L, Taylor MRG, et al (2012) Truncations of Titin Causing Dilated
Cardiomyopathy. N Engl J Med 366:619–628. doi: 10.1056/NEJMoa1110186
Hershberger RE, Hedges DJ, Morales A (2013) Dilated cardiomyopathy: the complexity of a
diverse genetic architecture. Nat Rev Cardiol 10:531–547. doi:
10.1038/nrcardio.2013.105
Hinson JT, Chopra A, Nafissi N, et al (2015) Titin Mutations in iPS cells Define Sarcomere
Insufficiency as a Cause of Dilated Cardiomyopathy. Science (80- ) 349:982–986. doi:
10.1126/science.aaa5458
Hockemeyer D, Wang H, Kiani S, et al (2011) Genetic engineering of human pluripotent cells
using TALE nucleases. Nat Biotechnol 29:731–734. doi: 10.1038/nbt.1927
Huo J, Kamalakar A, Yang X, et al (2017) Evaluation of Batch Variations in Induced
Pluripotent Stem Cell-Derived Human Cardiomyocytes from 2 Major Suppliers. Toxicol
Sci 156:25–38. doi: 10.1093/toxsci/kfw235
Jahreiss L, Menzies FM, Rubinsztein DC (2008) The Itinerary of Autophagosomes: From
Peripheral Formation to Kiss-and-Run fusion with Lysosomes. Traffic 9:574–587. doi:
10.1111/j.1600-0854.2008.00701.x
Kaebisch C, Schipper D, Babczyk P, Tobiasch E (2015) The role of purinergic receptors in
stem cell differentiation. Comput Struct Biotechnol J 13:75–84. doi:
10.1016/j.csbj.2014.11.003
Karumbayaram S, Novitch B, Patterson M, et al (2009) Directed differentiation of human
induced pluripotent stem cells generates active motor neurons. Stem Cells 27:806–811.
doi: 10.1002/stem.31
Kim Y, Rim YA, Yi H, et al (2016) The Generation of Human Induced Pluripotent Stem Cells
from Blood Cells: An Efficient Protocol Using Serial Plating of Reprogrammed Cells by
Centrifugation. Stem Cells Int 2016:9. doi: 10.1155/2016/1329459
Kleinstiver BP, Pattanayak V, Prew MS, et al (2016) High-fidelity CRISPR-Cas9 nucleases
with no detectable genome-wide off-target effects. Nature 529:490–495. doi:
10.1038/nature16526
Knaust AE (2017) Disease modelling of a phospholamban p . Arg14del mutation in hiPSC-
derived cardiomyocytes

Literature
123
Korolchuk VI, Saiki S, Lichtenberg M, et al (2011) Lysosomal positioning coordinates cellular
nutrient responses. Nat Cell Biol 13:453–462. doi: 10.1038/ncb2204
Krause J, Löser A, Lemoine MD, et al (2018) Rat atrial engineered heart tissue: a new in
vitro model to study atrial biology. Basic Res Cardiol 113:1–14. doi: 10.1007/s00395-
018-0701-2
Lange WJ De, Grimes AC, Hegge LF, et al (2013) E258K HCM-causing mutation in cardiac
MyBP-C reduces contractile force and accelerates twitch kinetics by disrupting the
cMyBP-C and myosin S2 interaction. J Gen Physiol 142:241–255. doi:
10.1085/jgp.201311018
Lawrence RE, Zoncu R (2019) The lysosome as a cellular centre for signalling, metabolism
and quality control. Nat Cell Biol 21:133–142. doi: 10.1038/s41556-018-0244-7
Lemme M, Ulmer BM, Lemoine MD, et al (2018) Atrial-like Engineered Heart Tissue: An In
Vitro Model of the Human Atrium. Stem Cell Reports 11:1378–1390. doi:
10.1016/j.stemcr.2018.10.008
Lewis YE, Moskovitz A, Mutlak M, et al (2018) Localization of transcripts, translation, and
degradation for spatiotemporal sarcomere maintenance. J Mol Cell Cardiol 116:16–28.
doi: 10.1016/j.yjmcc.2018.01.012
Löser A (2018) Epigenetic mechanisms of transcriptional regulation in cardiac hypertrophy
using engineered heart tissue
Maejima Y, Isobe M, Sadoshima J (2017) Regulation of Autophagy by Beclin 1 in the Heart.
J Mol Cell Cardiol 95:19–25. doi: 10.1016/j.yjmcc.2015.10.032
Marian A, Braunwald E (2017) Hypertrophic cardiomyopathy: Genetics, Pathogenesis,
Clinical Manifestations, Diagnosis, and Therapy. Circ Res 121:749–770. doi:
10.1161/CIRCRESAHA.117.311059.
Maron BJ, Ommen SR, Semsarian C, et al (2014) Hypertrophic Cardiomyopathy: Present
and Future, With Translation Into Contemporary Cardiovascular Medicine. J Am Coll
Cardiol 64:83–99. doi: 10.1016/j.jacc.2014.05.003
Maron BJ, Towbin JA, Thiene G, et al (2006) Contemporary Definitions and Classification of
the Cardiomyopathies: An American Heart Association Scientific Statement From the
Council on Clinical Cardiology, Heart Failure and Transplantation Committee; Quality of
Care and Outcomes Research and Functio. Circulation 113:1807–1816. doi:
10.1161/CIRCULATIONAHA.106.174287
Marston S, Copeland ON, Jacques A, et al (2009) Evidence From Human Myectomy
Literature
124
Samples That MYBPC3 Mutations Cause Hypertrophic Cardiomyopathy Through
Haploinsufficiency*. Circ Res 105:219–222. doi: 10.1161/CIRCRESAHA.109.202440
McEwan DG, Dikic I (2011) The Three Musketeers of Autophagy : phosphorylation ,
ubiquitylation and acetylation. Trends Cell Biol 21:195–201. doi:
10.1016/j.tcb.2010.12.006.
McNally EM, Mestroni L (2017) Dilated Cardiomyopathy: Genetic Determinants and
Mechanisms. Circ Res 121:731–748. doi: 10.1161/CIRCRESAHA.116.309396
Miller JC, Holmes MC, Wang J, et al (2007) An improved zinc-finger nuclease architecture
for highly specific genome editing. Nat Biotechnol 25:778–785. doi: 10.1038/nbt1319
Moehle EA, Rock JM, Lee Y-L, et al (2007) Targeted gene addition into a specified location
in the human genome using designed zinc finger nucleases. Proc Natl Acad Sci U S A
104:3055–3060. doi: 10.1073/pnas.0611478104
Mosqueira D, Lis-Slimak K, Denning C (2019a) High-Throughput Phenotyping Toolkit for
Characterizing Cellular Models of Hypertrophic Cardiomyopathy In Vitro. Methods
Protoc 2:. doi: 10.3390/mps2040083
Mosqueira D, Mannhardt I, Bhagwan JR, et al (2018) CRISPR/Cas9 editing in human
pluripotent stem cell-cardiomyocytes highlights arrhythmias, hypocontractility, and
energy depletion as potential therapeutic targets for hypertrophic cardiomyopathy. Eur
Heart J 39:3879–3892. doi: 10.1093/eurheartj/ehy249
Mosqueira D, Smith JGW, Bhagwan JR, Denning C (2019b) Modeling Hypertrophic
Cardiomyopathy: Mechanistic Insights and Pharmacological Intervention. Trends Mol
Med 25:775–790. doi: 10.1016/j.molmed.2019.06.005
Muhammad E, Levitas A, Singh SR, et al (2015) PLEKHM2 mutation leads to abnormal
localization of lysosomes, impaired autophagy flux and associates with recessive dilated
cardiomyopathy and left ventricular noncompaction. Hum Mol Genet 24:7227–7240. doi:
10.1093/hmg/ddv423
Mummery CL, Zhang J, Ng ES, et al (2012) Differentiation of Human ES and iPS Cells to
Cardiomyocytes: A Methods Overview. Circ Res 111:344–358. doi:
10.1161/CIRCRESAHA.110.227512
Musunuru K, Sheikh F, Gupta RM, et al (2018) Induced Pluripotent Stem Cells for
Cardiovascular Disease Modeling and Precision Medicine: A Scientific Statement From
the American Heart Association. Circ Genomic Precis Med 11:e000043. doi:
10.1161/HCG.0000000000000043

Literature
125
Nakamura S, Yoshimori T (2017) New insights into autophagosome–lysosome fusion. J Cell
Sci 130:1209–1216. doi: 10.1242/jcs.196352
Närvä E, Autio R, Rahkonen N, et al (2010) High-resolution DNA analysis of human
embryonic stem cell lines reveals culture-induced copy number changes and loss of
heterozygosity. Nat Biotechnol 28:371–377. doi: 10.1038/nbt.1615
Nishino I, Fu J, Tanji K, et al (2000) Primary LAMP-2 deficiency causes X-linked vacuolar
cardiomyopathy and myopathy (Danon disease). Nature 406:906–910. doi:
10.1038/35022604
Okamoto S, Amaishi Y, Maki I, et al (2019) Highly efficient genome editing for single-base
substitutions using optimized ssODNs with Cas9-RNPs. Sci Rep 9:. doi:
10.1038/s41598-019-41121-4
Okumura T, Horie Y, Lai CY, et al (2019) Robust and highly efficient hiPSC generation from
patient non-mobilized peripheral blood-derived CD34+ cells using the auto-erasable
Sendai virus vector. Stem Cell Res Ther 10:. doi: 10.1186/s13287-019-1273-2
Olivotto I, Girolami F, Ackerman MJ, et al (2008) Myofilament Protein Gene Mutation
Screening and Outcome of Patients With Hypertrophic Cardiomyopathy. Mayo Clin Proc
83:630–638. doi: 10.4065/83.6.630
Palma Medina LM, Becker A-K, Michalik S, et al (2019) Metabolic Cross-talk between
Human Bronchial Epithelial Cells and Internalized Staphylococcus aureus as a Driver
for Infection. Mol Cell Proteomics 18:892–908. doi: 10.1074/mcp.RA118.001138
Palpant NJ, Pabon L, Friedman CE, et al (2017) Generating high-purity cardiac and
endothelial derivatives from patterned mesoderm using human pluripotent stem cells.
Nat Protoc 12:15–31. doi: 10.1038/nprot.2016.153
Paquet D, Kwart D, Chen A, et al (2016) Efficient introduction of specific homozygous and
heterozygous mutations using CRISPR/Cas9. Nature 533:125–129. doi:
10.1038/nature17664
Park JM, Jung CH, Seo M, et al (2016) The ULK1 complex mediates MTORC1 signaling to
the autophagy initiation machinery via binding and phosphorylating ATG14. Autophagy
12:547–564. doi: 10.1080/15548627.2016.1140293
Park JM, Seo M, Jung CH, et al (2018) ULK1 phosphorylates Ser30 of BECN1 in association
with ATG14 to stimulate autophagy induction. Autophagy 14:584–597. doi:
10.1080/15548627.2017.1422851
Phipson B, Lee S, Majewski IJ, et al (2016) ROBUST HYPERPARAMETER ESTIMATION
Literature
126
PROTECTS AGAINST HYPERVARIABLE GENES AND IMPROVES POWER TO
DETECT DIFFERENTIAL EXPRESSION. Ann Appl Stat 10:946–963. doi: 10.1214/16-
AOAS920.
Pohlmann L, Kröger I, Vignier N, et al (2007) Cardiac Myosin-Binding Protein C Is Required
for Complete Relaxation in Intact Myocytes. Circ Res 101:928–938. doi:
10.1161/CIRCRESAHA.107.158774
Prondzynski M (2017) Modeling of hypertrophic cardiomyopathy and assessment of gene
therapy in human iPSC-derived cardiomyocytes
Prondzynski M, Krämer E, Laufer SD, et al (2017) Evaluation of MYBPC3 trans -Splicing and
Gene Replacement as Therapeutic Options in Human iPSC-Derived Cardiomyocytes.
Mol Ther - Nucleic Acids 7:475–486. doi: 10.1016/j.omtn.2017.05.008
Prondzynski M, Lemoine MD, Zech ATL, et al (2019) Disease modeling of a mutation in a -
actinin 2 guides clinical therapy in hypertrophic cardiomyopathy. EMBO Mol Med
e11115:1–18. doi: 10.15252/emmm.201911115
Puertollano R (2014) mTOR and lysosome regulation. F1000Prime Rep 6:. doi: 10.12703/p6-
52
Ran FA, Hsu PD, Wright J, et al (2013) Genome engineering using the CRISPR-Cas9
system. Nat Protoc 8:2281–2308. doi: 10.1038/nprot.2013.143
Ravikumar B, Moreau K, Jahreiss L, et al (2010) Plasma membrane contributes to the
formation of pre- autophagosomal structures. Nat Cell Biol 12:747–757. doi:
10.1038/ncb2078.
Razzaque A, Gupta M, Osinska H, et al (2013) An Endogenously Produced Fragment of
Cardiac Myosin Binding Protein C is Pathogenic and Can Lead to Heart Failure Abdur.
Circ Res 113:553–61. doi: 10.1161/CIRCRESAHA.113.301225.
Russell RC, Tian Y, Yuan H, et al (2013) ULK1 induces autophagy by phosphorylating
Beclin-1 and activating Vps34 lipid kinase. Nat Cell Biol 15:741–750. doi:
10.1038/ncb2757.
Sadayappan S, de Tombe PP (2014) Cardiac myosin binding protein-C as a central target of
cardiac sarcomere signaling: a special mini-review series. Pflugers Arch Eur J Physiol
466:195–200. doi: 10.1007/s00424-013-1396-8
Sandri M, Robbins J (2014) Proteotoxicity: An Underappreciated Pathology in Cardiac
Disease. J Mol Cell Cardiol 0:3–10. doi: 10.1016/j.yjmcc.2013.12.015
Literature
127
Sarikas A, Carrier L, Schenke C, et al (2005) Impairment of the ubiquitin-proteasome system
by truncated cardiac myosin binding protein C mutants. Cardiovasc Res 66:33–44. doi:
10.1016/j.cardiores.2005.01.004
Schlaeger TM, Daheron L, Brickler TR, et al (2015) A comparison of non-integrating
reprogramming methods. Nat Biotechnol 33:58–63. doi: 10.1038/nbt.3070
Schlossarek S, Englmann DR, Sultan KR, et al (2012) Defective proteolytic systems in
Mybpc3-targeted mice with cardiac hypertrophy. Basic Res Cardiol 107:235. doi:
10.1007/s00395-011-0235-3
Schlossarek S, Mearini G, Carrier L (2011) Cardiac myosin-binding protein C in hypertrophic
cardiomyopathy: Mechanisms and therapeutic opportunities. J Mol Cell Cardiol 50:613–
620. doi: 10.1016/j.yjmcc.2011.01.014
Schultheiss H, Fairweather D, Caforio ALP, et al (2019) Dilated cardiomyopathy. Nat Rev Dis
Prim 5:32. doi: 10.1038/s41572-019-0084-1
Schulze ML, Lemoine MD, Fischer AW, et al (2019) Dissecting hiPSC-CM pacemaker
function in a cardiac organoid model. Biomaterials 206:133–145. doi:
10.1016/j.biomaterials.2019.03.023
Sciarretta S, Forte M, Frati G, Sadoshima J (2018) New Insights Into The Role of mTOR
Signaling in the Cardiovascular System. Circ Res 122:489–505. doi:
10.1161/CIRCRESAHA.117.311147
Seeger T, Shrestha R, Lam CK, et al (2019) A Premature Termination Codon Mutation in
MYBPC3 Causes Hypertrophic Cardiomyopathy via Chronic Activation of Nonsense-
Mediated Decay. Circulation 139:799–811. doi:
10.1161/CIRCULATIONAHA.118.034624
Semsarian C, Ingles J, Maron MS, Maron BJ (2015) New Perspectives on the Prevalence of
Hypertrophic Cardiomyopathy. J Am Coll Cardiol 65:1249–1254. doi:
10.1016/j.jacc.2015.01.019
Singh SR, Zech ATL, Geertz B, et al (2017) Activation of Autophagy Ameliorates
Cardiomyopathy in Mybpc3-Targeted Knockin Mice. Circ Hear Fail 10:e004140. doi:
10.1161/CIRCHEARTFAILURE.117.004140
Smith C, Gore A, Yan W, et al (2014) Whole-Genome Sequencing Analysis Reveals High
Specificity of CRISPR/Cas9 and TALEN-Based Genome Editing in Human iPSCs. Cell
Stem Cell 15:12–13. doi: 10.1016/j.stem.2014.06.011
Smith JGW, Owen T, Bhagwan JR, et al (2018) Isogenic Pairs of hiPSC-CMs with
Literature
128
Hypertrophic Cardiomyopathy/LVNC-Associated ACTC1 E99K Mutation Unveil
Differential Functional Deficits. Stem Cell Reports 11:1226–1243. doi:
10.1016/j.stemcr.2018.10.006
Smits AH, Ziebell F, Joberty G, et al (2019) Biological plasticity rescues target activity in
CRISPR knock outs. Nat Methods 16:1087–1093. doi: 10.1038/s41592-019-0614-5
Song L, Su M, Wang S, et al (2014) MiR-451 is decreased in hypertrophic cardiomyopathy
and regulates autophagy by targeting TSC1. J Cell Mol Med 18:2266–2274. doi:
10.1111/jcmm.12380
Squire JM, Luther PK, Knupp C (2003) Structural Evidence for the Interaction of C-protein (
MyBP-C ) with Actin and Sequence Identification of a Possible Actin-binding Domain. J
Mol Biol 331:713–724. doi: 10.1016/S0022-2836(03)00781-2
Stepanenko AA, Dmitrenko V V. (2015) HEK293 in cell biology and cancer research:
Phenotype, karyotype, tumorigenicity, and stress-induced genome-phenotype evolution.
Gene 569:182–190. doi: 10.1016/j.gene.2015.05.065
Suomi T, Elo LL (2017) Enhanced differential expression statistics for data-independent
acquisition proteomics. Sci Rep 7:1–8. doi: 10.1038/s41598-017-05949-y
Taapken SM, Nisler BS, Newton MA, et al (2011) Karotypic abnormalities in human induced
pluripotent stem cells and embryonic stem cells. Nat Biotechnol 29:313–314. doi:
10.1038/nbt.1835
Takahashi K, Tanabe K, Ohnuki M, et al (2007) Induction of Pluripotent Stem Cells from
Adult Human Fibroblasts by Defined Factors. Cell 131:861–872. doi:
10.1016/j.cell.2007.11.019
Takahashi K, Yamanaka S (2006) Induction of Pluripotent Stem Cells from Mouse Embryonic
and Adult Fibroblast Cultures by Defined Factors. Cell 126:663–676. doi:
10.1016/j.cell.2006.07.024
Tannous P, Zhu H, Johnstone JL, et al (2008) Autophagy is an adaptive response in desmin-
related cardiomyopathy. Proc Natl Acad Sci U S A 105:9745–9750. doi:
10.1073/pnas.0706802105
Thomson JA, Itskovitz-Eldor J, Shapiro SS, et al (1998) Embryonic Stem Cell Lines Derived
from Human Blastocysts. Science (80- ) 282:1145–1147. doi:
10.1126/science.282.5391.1145
Urnov FD, Miller JC, Lee Y-L, et al (2005) Highly efficient endogenous human gene
correction using designed zinc-finger nucleases. Nature 435:646–651. doi:

Literature
129
10.1038/nature03556
van der Velden J, Stienen GJM (2019) CARDIAC DISORDERS AND PATHOPHYSIOLOGY
OF SARCOMERIC PROTEINS. Physiol Rev 99:381–426. doi:
10.1152/physrev.00040.2017
van Dijk SJ, Dooijes D, dos Remedios C, et al (2009) Cardiac Myosin-Binding Protein C
Mutations and Hypertrophic Cardiomyopathy - Haploinsufficiency, Deranged
Phosphorylation, and Cardiomyocyte Dysfunction. Circulation 119:1473–1483. doi:
10.1161/CIRCULATIONAHA.108.838672
Veres A, Gosis BS, Ding Q, et al (2014) Low Incidence of Off-Target Mutations in Individual
CRISPR-Cas9 and TALEN Targeted Human Stem Cell Clones Detected by Whole-
Genome Sequencing. Cell Stem Cell 15:27–30. doi: 10.1016/j.stem.2014.04.020
Vignier N, Schlossarek S, Fraysse B, et al (2009) Nonsense-Mediated mRNA Decay and
Ubiquitin–Proteasome System Regulate Cardiac Myosin-Binding Protein C Mutant
Levels in Cardiomyopathic Mice. Circ Res 105:239–248. doi:
10.1161/CIRCRESAHA.109.201251
Yang X, Pabon L, Murry CE (2014) Engineering Adolescence: Maturation of Human
Pluripotent Stem Cell-derived Cardiomyocytes. Circ Res 114:511–523. doi:
10.1161/CIRCRESAHA.114.300558
Yoshida S, Nakanishi C, Okada H, et al (2018) Characteristics of induced pluripotent stem
cells from clinically divergent female monozygotic twins with Danon disease. J Mol Cell
Cardiol 114:234–242. doi: 10.1016/j.yjmcc.2017.11.019
Zech ATL, Singh SR, Schlossarek S, Carrier L (2019) Autophagy in cardiomyopathies.
Biochim Biophys Acta - Mol Cell Res. doi: 10.1016/J.BBAMCR.2019.01.013
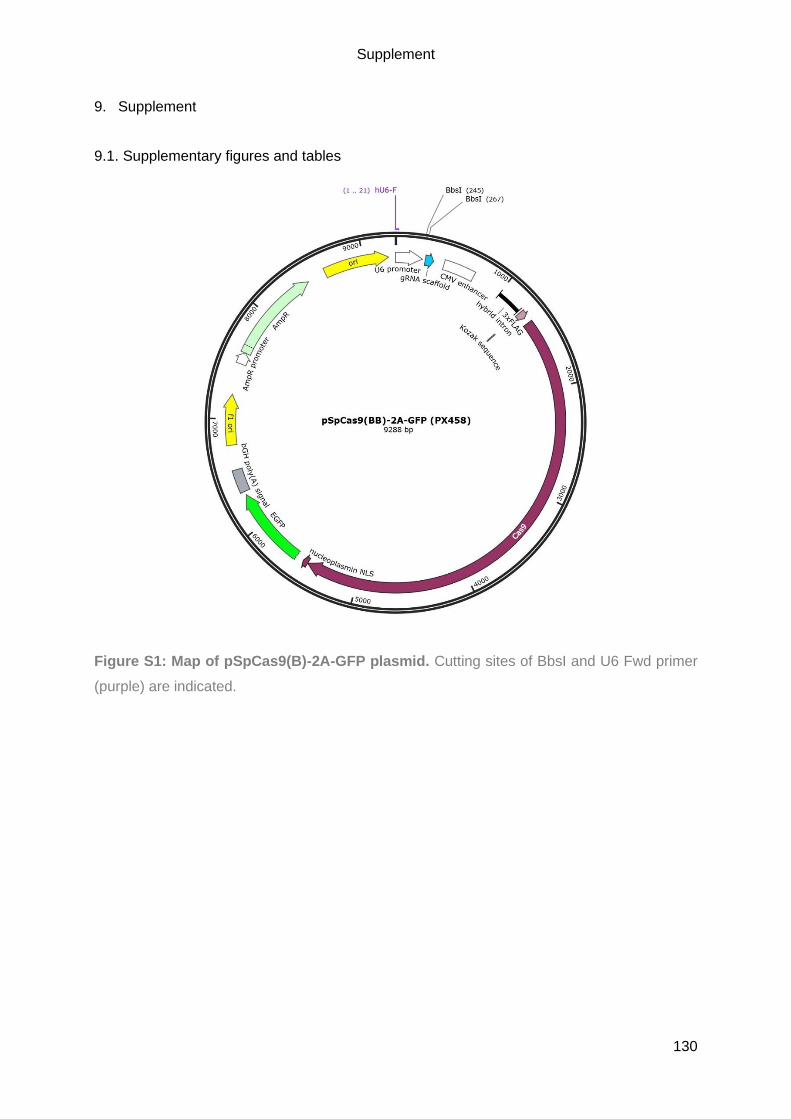
Supplement
130
9. Supplement
9.1. Supplementary figures and tables
Figure S1: Map of pSpCas9(B)-2A-GFP plasmid. Cutting sites of BbsI and U6 Fwd primer
(purple) are indicated.
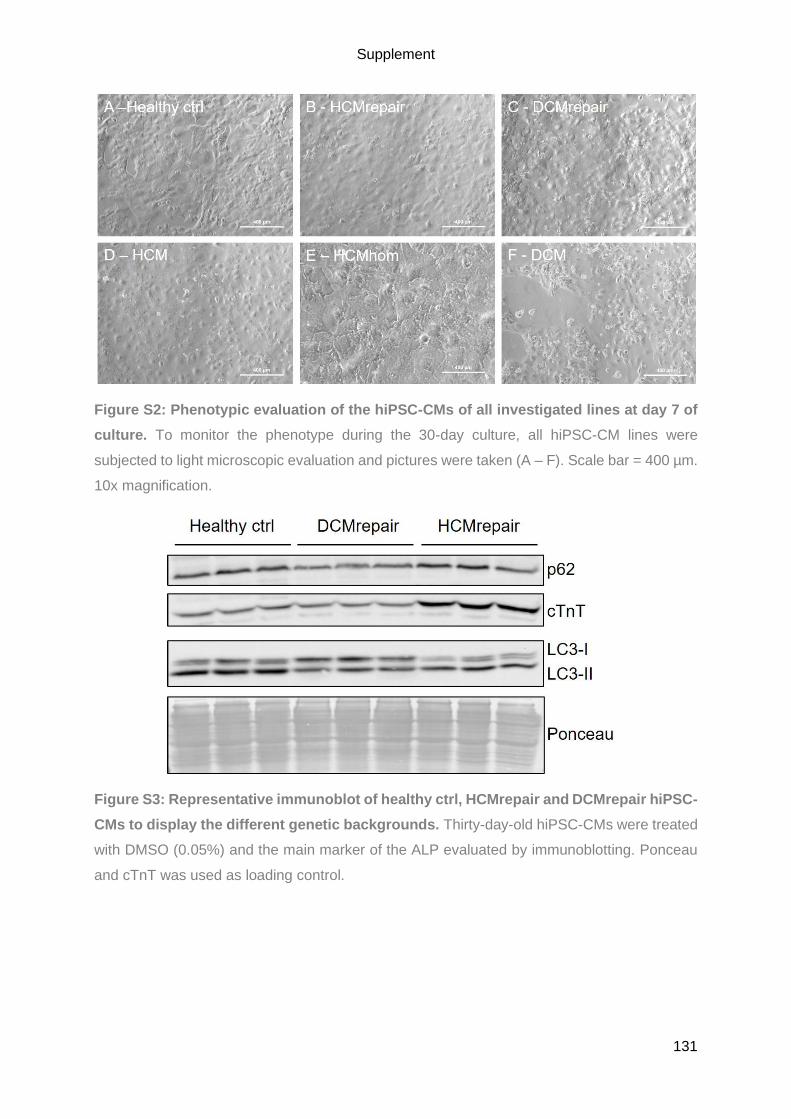
Supplement
131
Figure S2: Phenotypic evaluation of the hiPSC-CMs of all investigated lines at day 7 of
culture. To monitor the phenotype during the 30-day culture, all hiPSC-CM lines were
subjected to light microscopic evaluation and pictures were taken (A – F). Scale bar = 400 µm.
10x magnification.
Figure S3: Representative immunoblot of healthy ctrl, HCMrepair and DCMrepair hiPSC-
CMs to display the different genetic backgrounds. Thirty-day-old hiPSC-CMs were treated
with DMSO (0.05%) and the main marker of the ALP evaluated by immunoblotting. Ponceau
and cTnT was used as loading control.
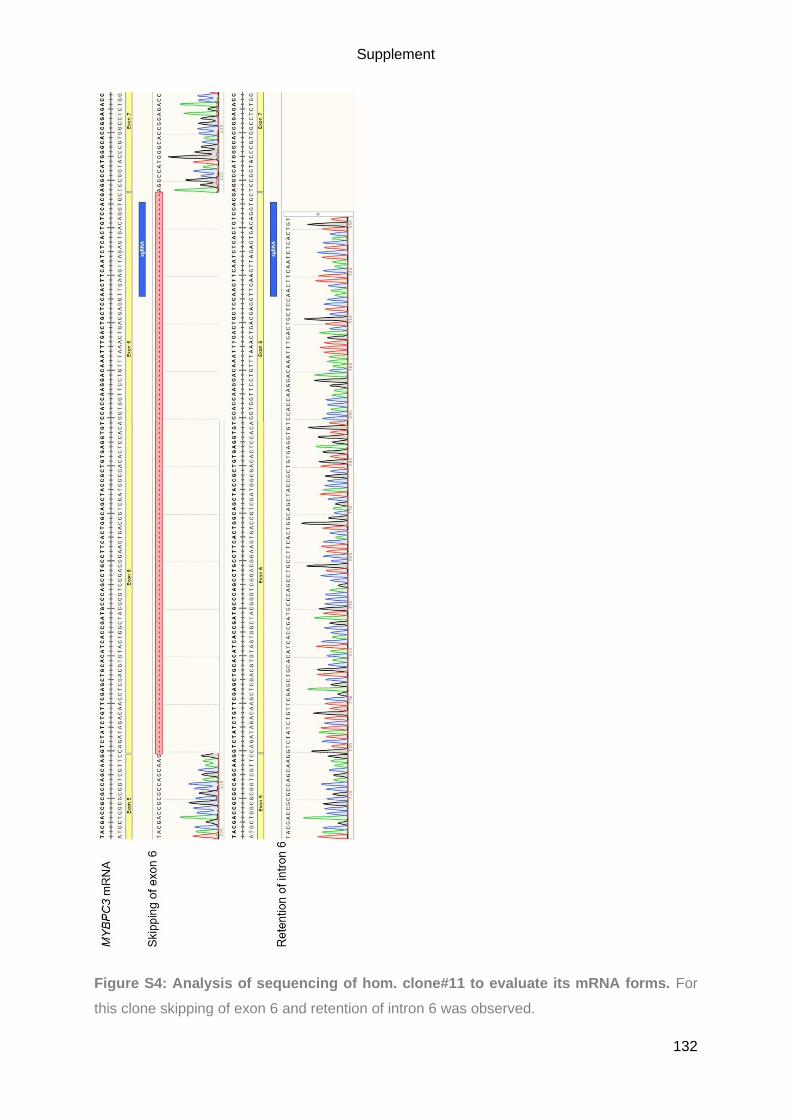
Supplement
132
Figure S4: Analysis of sequencing of hom. clone#11 to evaluate its mRNA forms. For
this clone skipping of exon 6 and retention of intron 6 was observed.

Supplement
133
Figure S5: Analysis of sequencing of c.het. clone#14 to evaluate its mRNA forms.
Sequencing revealed a T insertion and a 7-bp deletion along with the retention of intron 6.

Supplement
134
Figure S6: Analysis of sequencing of het. clone#15 to evaluate its mRNA forms. The
wild-type sequence and a 7 bp deletion was detected for this clone.

Supplement
135
Figure S7: Overview of the alternative splicing of intron 8 for all CRISPR clones. The
hom. clone#11 showed a partial and a complete retention of intron 8 (A), whereas the c.het.
clone#14 only showed the partial retention (B) and the het. clone#15 the complete retention of
intron 8 on its wild-type allele (C).
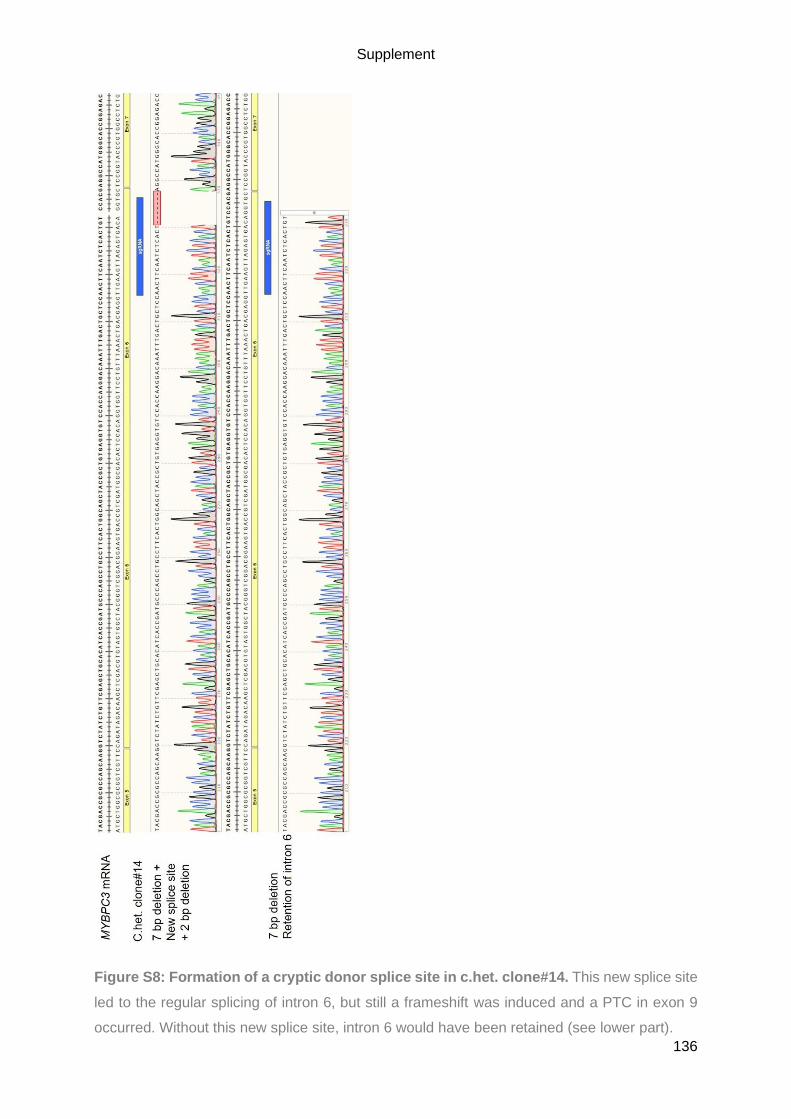
Supplement
136
Figure S8: Formation of a cryptic donor splice site in c.het. clone#14. This new splice site
led to the regular splicing of intron 6, but still a frameshift was induced and a PTC in exon 9
occurred. Without this new splice site, intron 6 would have been retained (see lower part).
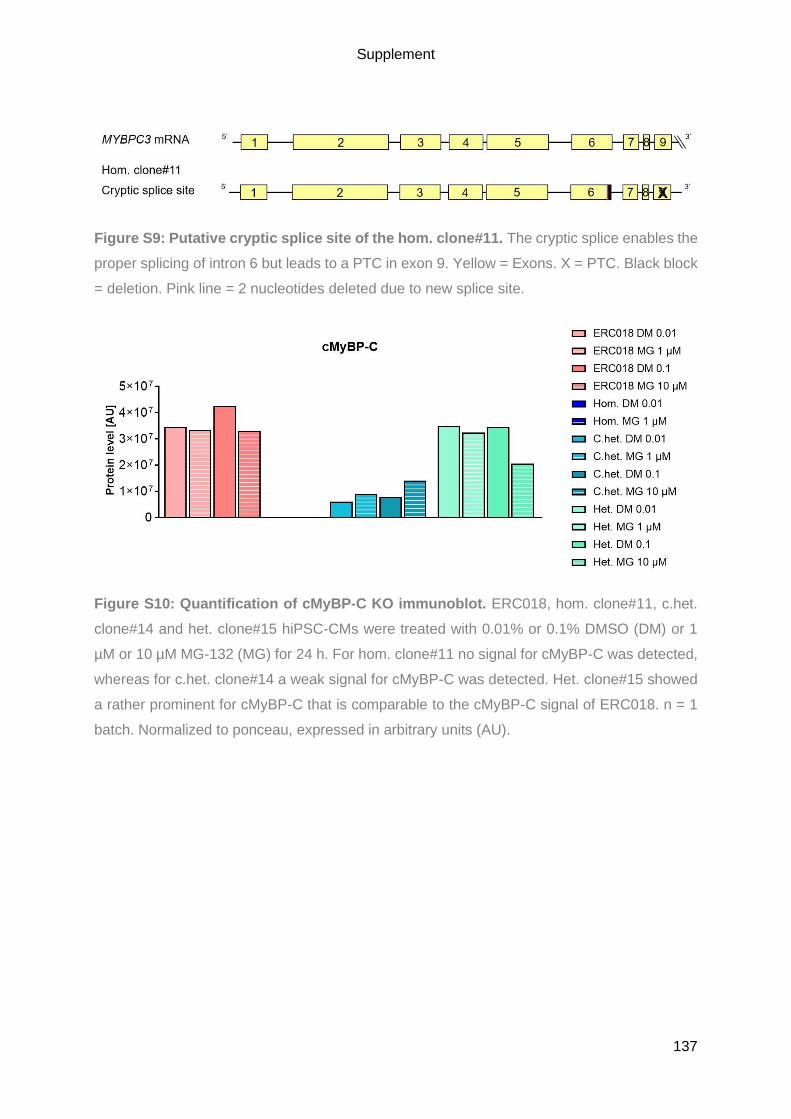
Supplement
137
Figure S9: Putative cryptic splice site of the hom. clone#11. The cryptic splice enables the
proper splicing of intron 6 but leads to a PTC in exon 9. Yellow = Exons. X = PTC. Black block
= deletion. Pink line = 2 nucleotides deleted due to new splice site.
Figure S10: Quantification of cMyBP-C KO immunoblot. ERC018, hom. clone#11, c.het.
clone#14 and het. clone#15 hiPSC-CMs were treated with 0.01% or 0.1% DMSO (DM) or 1
µM or 10 µM MG-132 (MG) for 24 h. For hom. clone#11 no signal for cMyBP-C was detected,
whereas for c.het. clone#14 a weak signal for cMyBP-C was detected. Het. clone#15 showed
a rather prominent for cMyBP-C that is comparable to the cMyBP-C signal of ERC018. n = 1
batch. Normalized to ponceau, expressed in arbitrary units (AU).
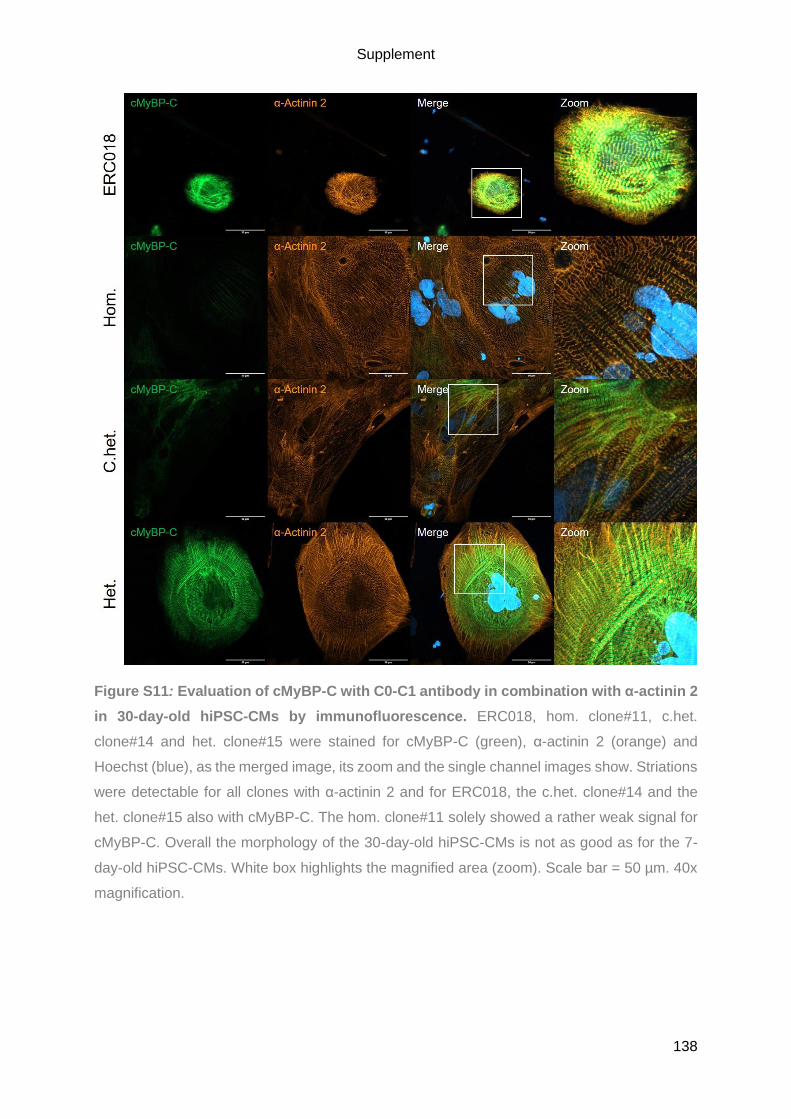
Supplement
138
Figure S11: Evaluation of cMyBP-C with C0-C1 antibody in combination with α-actinin 2
in 30-day-old hiPSC-CMs by immunofluorescence. ERC018, hom. clone#11, c.het.
clone#14 and het. clone#15 were stained for cMyBP-C (green), α-actinin 2 (orange) and
Hoechst (blue), as the merged image, its zoom and the single channel images show. Striations
were detectable for all clones with α-actinin 2 and for ERC018, the c.het. clone#14 and the
het. clone#15 also with cMyBP-C. The hom. clone#11 solely showed a rather weak signal for
cMyBP-C. Overall the morphology of the 30-day-old hiPSC-CMs is not as good as for the 7-
day-old hiPSC-CMs. White box highlights the magnified area (zoom). Scale bar = 50 µm. 40x
magnification.

Supplement
139
9.2. List of abbreviations
A
A Area
AA Amino acid
ABCF1 ATP binding cassette subfamily F member 1
ACE Angiotensin-converting enzymes
ACTA2 Actin alpha 2, smooth muscle
ACTB Actin beta
ACTC1 Cardiac muscle actin alpha 1
ACTN2/ACTN2 Alpha-Actinin 2
AGC Automatic gain control
ALP Autophagy-lysosomal pathway
AMPK AMP-activated protein kinase
AP Action potential
APS Ammonium persulfate
ATG Autophagy-related genes
ATP Adenosine triphosphate/ATPase
ATP2A2 ATPase sarcoplasmic/endoplasmic reticulum Ca2+ transporting 2
AU Arbitrary units
B
Bafilo Bafilomycin A1
BF Brightfield
Bp Base pair
BCL2 BCL2 apoptosis regulator
Bcl-2 B-cell lymphoma 2
bFGF Basic fibroblast growth factor
BMP4 Bone morphogenetic protein 4
BSA Bovine serum albumin
BTS N-Benzyl-p-Toluenesulfonamide
C
Cas CRISPR-associated
CASQ2 Calsequestrin 2
cDNA Complementary DNA
C.het. Compound heterozygous
CLTC Clathrin heavy chain
CM Cardiomyocyte
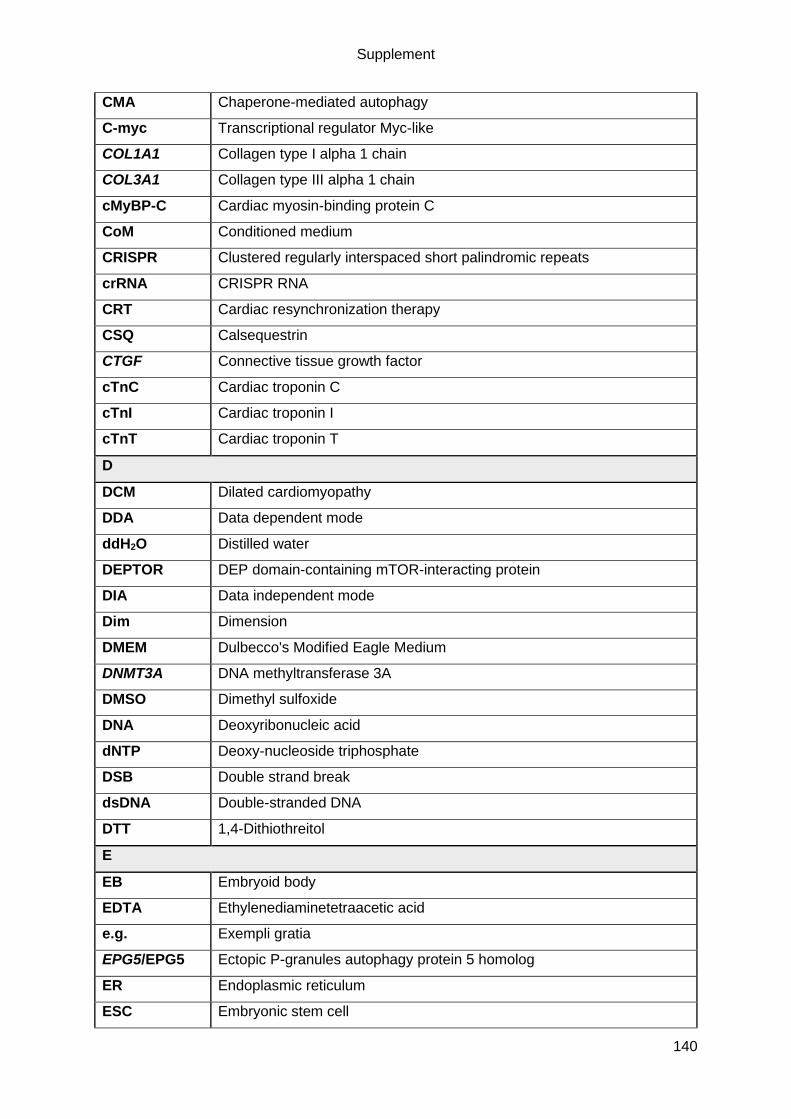
Supplement
140
CMA Chaperone-mediated autophagy
C-myc Transcriptional regulator Myc-like
COL1A1 Collagen type I alpha 1 chain
COL3A1 Collagen type III alpha 1 chain
cMyBP-C Cardiac myosin-binding protein C
CoM Conditioned medium
CRISPR Clustered regularly interspaced short palindromic repeats
crRNA CRISPR RNA
CRT Cardiac resynchronization therapy
CSQ Calsequestrin
CTGF Connective tissue growth factor
cTnC Cardiac troponin C
cTnI Cardiac troponin I
cTnT Cardiac troponin T
D
DCM Dilated cardiomyopathy
DDA Data dependent mode
ddH2O Distilled water
DEPTOR DEP domain-containing mTOR-interacting protein
DIA Data independent mode
Dim Dimension
DMEM Dulbecco's Modified Eagle Medium
DNMT3A DNA methyltransferase 3A
DMSO Dimethyl sulfoxide
DNA Deoxyribonucleic acid
dNTP Deoxy-nucleoside triphosphate
DSB Double strand break
dsDNA Double-stranded DNA
DTT 1,4-Dithiothreitol
E
EB Embryoid body
EDTA Ethylenediaminetetraacetic acid
e.g. Exempli gratia
EPG5/EPG5 Ectopic P-granules autophagy protein 5 homolog
ER Endoplasmic reticulum
ESC Embryonic stem cell

Supplement
141
et al. Et alii
F
FACS Fluorescence-activated cell sorting
FC Flow cytometry
FCS Fetal calf serum
FHL2 Four and a half LIM domains 2
FIP200 Focal adhesion kinase family interacting protein of 200 kDa
FITC Fluorescein isothiocyanate
FKBP12 FK506-binding protein of 12 kDa
FN1 Fibronectin 1
FOXO1 Forkhead box O1
FSC Forward scatter
FTDA bFGF, TGFβ1, dorsomorphin and activin A-based hiPSC culture medium
FWD Forward
FYCO1 FYVE and coiled-coil domain autophagy adaptor 1
G
GABARAP γ-Aminobutyric acid receptor-associated protein
GAPDH Glyceraldehyde 3-phosphate dehydrogenase
GATE-16 Golgi-associated ATPase enhancer of 16k Da
gDNA Genomic DNA
GFP Green fluorescent protein
GSK3β Glycogen synthase kinase 3 beta
GTPase Guanosine triphosphatase
H
H Height
HBSS Hanks' Balanced Salt Solution
HCD High energy collisional dissociation
HCM Hypertrophic cardiomyopathy
HDAC6 Histone deacetylase 6
HDR Homology-directed repair
Healthy ctrl Healthy contrl
HEPES 4-(2-hydroxyethyl)-1-piperazineethanesulfonic acid
hESC Human embryonic stem cell
Het. Heterozygous
hiPSC Human induced-pluripotent stem cell
hiPSC-CMs Human induced-pluripotent stem cell derived cardiomyocytes

Supplement
142
HK-II Hexokinase-II
Hom. Homozygous
HRM/iRT Hyper Reaction Monitoring/indexed Retention Time
I
ICa Inward Ca2+ current
ICD Implantable cardioverter-defibrillators
I.e. Id est
IEPT Institute of Experimental Pharmacology and Toxicology
IF Immunofluorescence/Immunofluoreszenz
indel Insertion-deletion
iPSC Induced-pluripotent stem cell
J
JNK c-Jun N-terminal kinase
K
kb Kilobase
Klf4 Kruppel like factor 4
KO Knockout
L
LAMP1 Lysosome-associated membrane protein 1
LAMP2 Lysosome-associated membrane protein 2
Lamp-2 Lysosomal-associated membrane protein 2
LAMP-2 Lysosome-associated membrane protein-2
LAMP-2B LAMP-2 isoform B
LC3 Microtubule-associated protein 1 light chain 3
LMM Light meromyosin
LVNC Left ventricular non-compaction
M
M-motif MyBP-C motif
MAP1LC3A Microtubule associated protein 1 light chain 3 alpha
MAP1LC3B Microtubule associated protein 1 light chain 3 beta
Mio. Million
miRNA microRNA
mLST8 Mammalian lethal with SEC13 protein 8
mRNA Messenger RNA
MS Mass spectrometric
mTOR Mammalian/mechanistic target of rapamycin

Supplement
143
MTOR Mammalian/mechanistic target of rapamycin kinase
MYBPC1 Myosin binding protein C1
MYBPC2 Myosin binding protein C2
MYBPC3 Myosin binding protein C3
MYH6 Cardiac alpha-myosin heavy chain
MYH7 Beta-myosin heavy chain
N
NaCl Sodium chloride
NBR1/NBR1 NBR1 autophagy cargo receptor/Neighbour of BRAC1
NCX Sodium-calcium exchanger
NFKB1 Nuclear Factor Kappa B Subunit 1
NHEJ Non-homologous end joining
NMD Nonsense-mediated mRNA decay
NPPA Natriuretic peptide A
NPPB Natriuretic peptide B
O
Oct4 Octamer binding transcription factor 4
ON Overnight
OT_#1 Off-target 1
P
p Passage
PA Proline-Alanine rich domain
PAGE Polyacrylamide gel electrophoresis
PAM Protospacer adjacent motif
PBS Phosphate-buffered saline
PCA Principal component analysis
PCR Polymerase chain reaction
PE Phosphatidylethanolamine
PGK1 Phosphoglycerate kinase 1
PI3K Phosphatidylinositol 3-kinase
PI3K, class III Phosphatidylinositol-3-phosphate kinase III
PKB Protein kinase B
PLB/PLN/PLN Phospholamban
PLEKHM2 Pleckstrin homology domain containing, family M member 2
POSTN Periostin
PPP1R1A Protein Phosphatase 1 Regulatory Inhibitor Subunit 1A

Supplement
144
PRAS40 Proline-rich AKT substrate of 40 kDa
PTC Premature termination codon
PVA Polyvinyl alcohol
PVDF Polyvinylidene fluoride
Q
RT-qPCR Real-time quantitative PCR
R
Rapa Rapamycin
RAPTOR Regulatory-associated protein of mTOR
REV Reverse
RHEB Ras homolog enriched in brain
RNA Ribonucleic acid
RPMI Roswell Park Memorial Institute
RT Room temperature
RT-PCR Reverse Transcriptase-PCR
RyR Ryanodine receptor
RYR2 Ryanodine receptor 2
S
S100A4 S100 calcium binding protein A4
SDS Sodium dodecyl sulphate
SEM Standard error of the mean
SERCA Sarcoplasmic reticulum Ca2+ ATPase
sgRNA Single-guide RNA
SNARE Soluble N-ethylmaleimide-sensitive-factor attachment receptor
SNP Single Nucleotide Polymorphism
Sox2 Sex determining region Y -box 2
SR Sarcoplasmic reticulum
SSC Sideward scatter
SSEA3 Stage-specific Embryonic Antigen 3
ssODN Single-stranded oligonucleotides
STAT1 Signal transducer and activator of transcription 1
STAT3 Signal transducer and activator of transcription 3
STX17 Syntaxin 17
SQSTM1 Sequestome 1
T
TAE Tris acetate EDTA
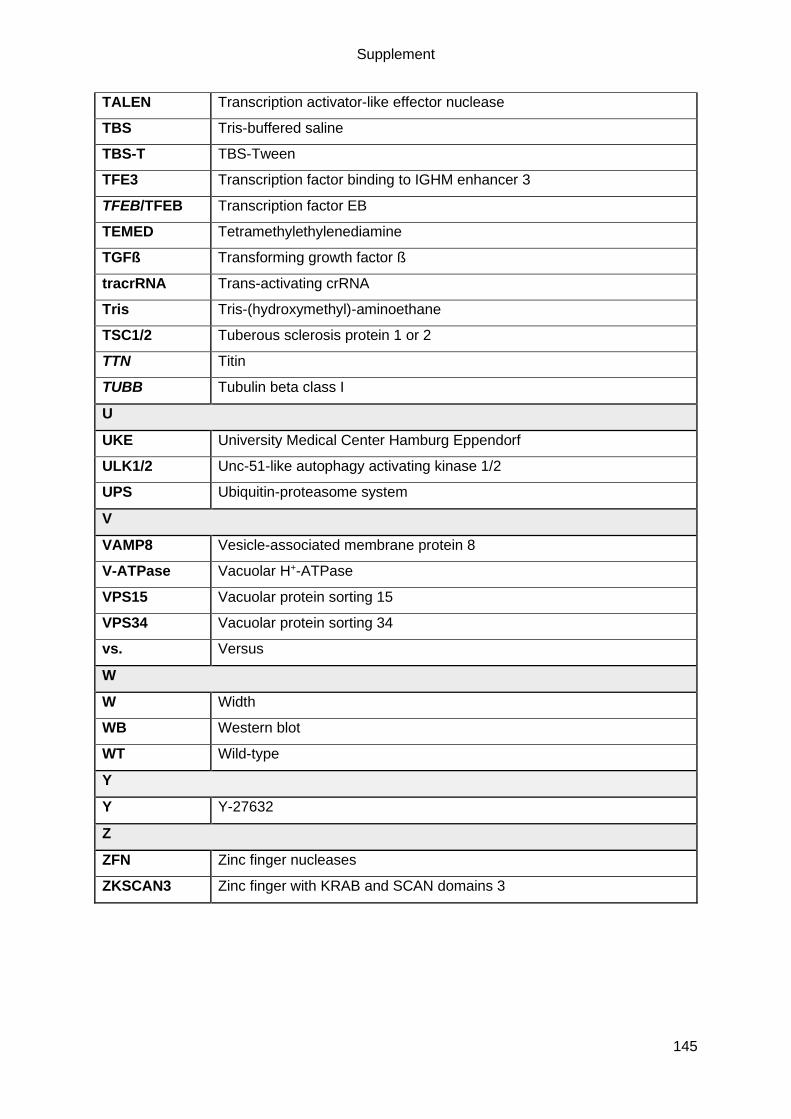
Supplement
145
TALEN Transcription activator-like effector nuclease
TBS Tris-buffered saline
TBS-T TBS-Tween
TFE3 Transcription factor binding to IGHM enhancer 3
TFEB/TFEB Transcription factor EB
TEMED Tetramethylethylenediamine
TGFß Transforming growth factor ß
tracrRNA Trans-activating crRNA
Tris Tris-(hydroxymethyl)-aminoethane
TSC1/2 Tuberous sclerosis protein 1 or 2
TTN Titin
TUBB Tubulin beta class I
U
UKE University Medical Center Hamburg Eppendorf
ULK1/2 Unc-51-like autophagy activating kinase 1/2
UPS Ubiquitin-proteasome system
V
VAMP8 Vesicle-associated membrane protein 8
V-ATPase Vacuolar H+-ATPase
VPS15 Vacuolar protein sorting 15
VPS34 Vacuolar protein sorting 34
vs. Versus
W
W Width
WB Western blot
WT Wild-type
Y
Y Y-27632
Z
ZFN Zinc finger nucleases
ZKSCAN3 Zinc finger with KRAB and SCAN domains 3

Supplement
146
9.3. Devices, materials & substances
Devices
4D-Nucleofector Core Unit and X Unit (Lonza)
ABI PRISM 7900HT Sequence Detection System (Applied Biosystems)
Analytic Scale Genius (Sartorius AG)
Cell culture incubator CB 220 (Binder)
Cell culture incubators S2020 1.8, HERAcell 240 & 150i (Thermo Fisher Scientific)
Cell culture incubators MCO-19M & MCO-20AIC (Sanyo)
Centrifuges 5415 R & 5810 R (Eppendorf)
Centrifuge Avanti JXN 26 (Beckmann Coulter)
Centrifuge J-6B (Beckmann Coulter)
Centrifuges Rotanta/RP & Universal 30 RF (Hettich)
ChemiDoc Touch Imaging System (Bio-Rad)
Confocal microscope (LSM800, Zeiss)
Cryopreservation system Asymptote EF600M (Grant Instruments)
Electrophoretic Transfer Cell Mini Trans-Blot cell (Bio-Rad)
FACSAriaTM IIIu (BD Biosciences)
FACS Canto II flow cytometer (BD Biosciences)
Gel electrophoresis cell Mini-PROTEAN 3 Cell (Bio-Rad)
Gel electrophoresis tank Sub-cell® GT (Bio-Rad)
Ice machine (Scotsman)
Magnetic stirring and heating plate IKA Combimag RET (Janke & Kunkel & Co KG)
Magnetic stirring plate Variomag / Cimarec Biosystem Direct (Thermo Fisher Scientific)
Magnetic stirring plate Variomag / Cimarec Biosystem 4 Direct (Thermo Fisher Scientific)
Microscope Axioskop 2 with AxioCam Color (Zeiss)
Microscope Axiovert 25 with ProgRes Speed XT core 5 camera (Jenoptik)
Microscope EVOS FL Cell Imaging System (Thermo Fisher Scientific)
Microwave (Sharp)
NanoDrop ND-1000 Spectrophotometer (Thermo Fisher Scientific)
nCounter SPRINT Profiler (NanoString Technologies)
Pipettes 10 / 100 / 1000 μL (Eppendorf)
Portable balance Scout Pro (Ohaus)
Power supply PowerPac Basic (Bio-Rad)
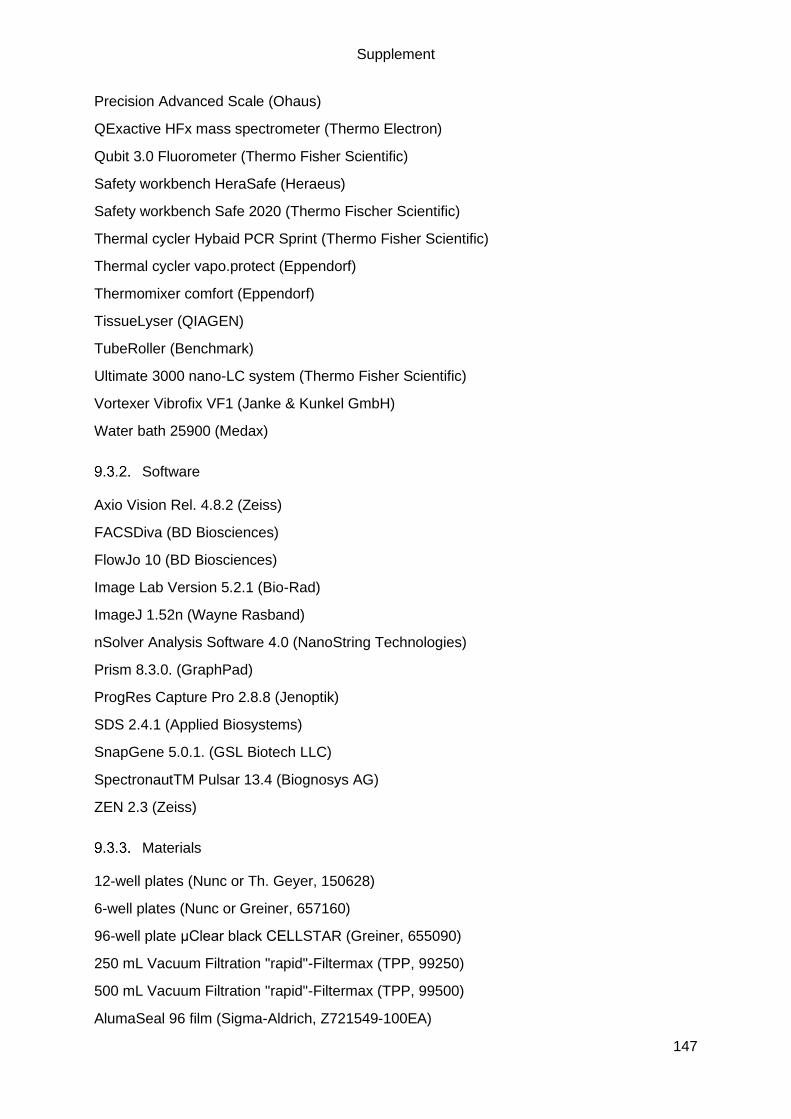
Supplement
147
Precision Advanced Scale (Ohaus)
QExactive HFx mass spectrometer (Thermo Electron)
Qubit 3.0 Fluorometer (Thermo Fisher Scientific)
Safety workbench HeraSafe (Heraeus)
Safety workbench Safe 2020 (Thermo Fischer Scientific)
Thermal cycler Hybaid PCR Sprint (Thermo Fisher Scientific)
Thermal cycler vapo.protect (Eppendorf)
Thermomixer comfort (Eppendorf)
TissueLyser (QIAGEN)
TubeRoller (Benchmark)
Ultimate 3000 nano-LC system (Thermo Fisher Scientific)
Vortexer Vibrofix VF1 (Janke & Kunkel GmbH)
Water bath 25900 (Medax)
Software
Axio Vision Rel. 4.8.2 (Zeiss)
FACSDiva (BD Biosciences)
FlowJo 10 (BD Biosciences)
Image Lab Version 5.2.1 (Bio-Rad)
ImageJ 1.52n (Wayne Rasband)
nSolver Analysis Software 4.0 (NanoString Technologies)
Prism 8.3.0. (GraphPad)
ProgRes Capture Pro 2.8.8 (Jenoptik)
SDS 2.4.1 (Applied Biosystems)
SnapGene 5.0.1. (GSL Biotech LLC)
SpectronautTM Pulsar 13.4 (Biognosys AG)
ZEN 2.3 (Zeiss)
Materials
12-well plates (Nunc or Th. Geyer, 150628)
6-well plates (Nunc or Greiner, 657160)
96-well plate μClear black CELLSTAR (Greiner, 655090)
250 mL Vacuum Filtration "rapid"-Filtermax (TPP, 99250)
500 mL Vacuum Filtration "rapid"-Filtermax (TPP, 99500)
AlumaSeal 96 film (Sigma-Aldrich, Z721549-100EA)
Supplement
148
Aspiration pipette 2 mL (Sarstedt, 86.1252.011)
Blotting paper Whatman 3MM (Schleicher & Schuell)
Cell culture flask T80 (Nunc, 178905)
Cell culture flask T75 (Sarstedt, 83.3911.002)
Cell culture flask T175 (Sarstedt, 2.502)
Cell culture plate 6 / 12 / 24-well (Nunc)
Cell scraper (Sarstedt, 83.1830)
Cell strainer 30 μm (Sysmex, 04-004-2326)
Cryovial CryoPure 1.6 mL (Sarstedt, 72.380)
Flow cytometry tubes (Sarstedt, 55.1579)
Mini-PROTEAN® Comb, 10-well, 1.0 mm, 44 μl (Bio-Rad, 1653359)
Mini-PROTEAN® Comb, 15-well, 1.0 mm, 44 μl (Bio-Rad, 1653360)
Mini-PROTEAN Short Plates (Bio-Rad, 1653308)
Mini-PROTEAN® Spacer Plates with 1.0 mm Integrated Spacers (Bio-Rad, 1653311)
Multiply®µStrip Pro mix colour (Sarstedt, 72.991.992)
Neubauer counting chamber (Karl-Hecht KG)
Nitrocellulose membrane (GE Healthcare, 10600003)
PCR tubes (Sarstedt)
Pipette tips (Sarstedt)
Pipette tips with Biosphere filter (10 µL / 100 µL / 1000 µL Sarstedt)
PVDF membrane (GE Healthcare, 10485289)
µPACTM micro-Chip (Pharmafluidics)
Qubit assay tubes (Thermo Fisher Scientific, Q32856)
Reaction tube graduated 15 mL (Sarstedt, 62.554.502)
Reaction tubes conical 15 / 50 mL (Sarstedt)
Reaction tubes Safe Lock 0.2 – 2 mL (Eppendorf)
Serological pipettes 1 / 2 / 5 / 10 / 25 / 50 mL (Sarstedt)
Spinner flasks 500 / 1000 mL (Integra Biosciences, 182101 / 182051)
Syringe filtration unit Filtropur S 0.2 μm (Sarstedt, 83.1826.001)
TissueLyser Steel Beads (QIAGEN, 69989)
Cell culture medium and serum
DMEM (Biochrom, F0415)
DMEM/F-12 without glutamine (Thermo Fisher Scientific, 21331-046)
Fetal calf serum (FCS; Biochrom, S0615)
Supplement
149
Horse serum (Life Technologies, 26050088)
mTESR 1 (STEMCELL, 85870)
RPMI 1640 (Gibco, 21875)
Reagents
1,4-Dithiothreitol (DTT; Sigma-Aldrich, D9779)
1-Thioglycerol (Sigma-Aldrich, M6145)
2-Mercaptoethanol (Sigma-Aldrich, M6250)
2-Propanol (Merck Millipore, 107022)
6x DNA loading dye (Thermo Fisher Scientific, R0611)
Accutase Cell Dissociation Reagent (Sigma-Aldrich, A6964)
Acetic acid (Roth, HN65.1)
Acetonitrile (Pierce, Thermo Fisher, 51101)
Acrylamide/Bis 40% (29:1; Bio-Rad, 161-0146)
Activin A (R&D Systems, 338-AC)
Agarose (Invitrogen, 15510-027)
Ampicillin trihydrate (SERVA, 13397.01)
Ammoniumpersulfate (APS; Bio-Rad, 161-0700)
Aprotinin (Sigma-Aldrich, A1153)
Aqua ad injectabilia (Baxter S.A., 001428)
B27 Plus Insulin (Gibco, 17504-044)
BactoTM Agar (BD, 214010)
BactoTM Tryptone (BD, 211705)
BactoTM Yeast Extract (BD, 212750)
Bafilomycin A1 (Sigma-Aldrich, B1793)
bFGF (basic fibroblast growth factor; PeptroTech, 100-18B)
BMP4 (R&D Systems, 314-BP)
Bromphenol blue (Merck, 108122)
BSA (Sigma-Aldrich, A3059)
BTS (N-Benzyl-p-Toluenesulfonamide, TCI, B3082-25G)
Clarity Western ECL Substrate (Bio-Rad, 170-5061)
Collagenase II (Worthington, LS004176)
cOmplete, Mini, EDTA-free Protease Inhibitor (Roche, 04693159001)
DMSO (Dimethylsulfoxide; Sigma-Aldrich, D8418)
Dulbecco's Phosphate-Buffered Saline (PBS; Gibco 14040-133)
Supplement
150
Dorsomorphin dihydrochloride (Tocris, 3093)
EDTA (Roth, 8043.2)
Ethanol, absolute (Chemsolute, 2246.1000)
Geltrex (Thermo Fisher Scientific, A1413302)
GeneRuler 1kb DNA ladder (Thermo Fisher Scientific, SM0313)
Gentle Cell Dissociation Reagent (STEMCELL, 07174)
Glycine (Roth, 3790.2)
Glycerol (Merck 1.04092)
HBSS (Thermo Fisher Scientific, 14175-053)
HEPES (Sigma-Aldrich, 9105.4)
Hoechst 33342 (Sigma-Aldrich, B2261-25MG)
Human recombinant insulin (Sigma-Aldrich, I9278)
Human serum albumin (Biological Industries, 05-720-1B)
Hydrochloric acid, 37% solution (Merck, 1.00317)
InSolution MG-132 (Carbobenzoxy-L-leucyl-L-leucyl-L-leucinal, Z-LLL-CHO; Merck Biosciences, 474791)
Iodoacetamide, BioUltra (Sigma Aldrich; I6125-100)
L-glutamine (Gibco, 25030-081)
Lipidmix (Sigma-Aldrich, L5146)
LysC (Promega, VA1170)
Matrigel Growth Factor Reduced Basement Membrane Matric (Corning, 354230)
Methanol (J.Baker, 8045)
Midori Green (Biozym, 617004)
N,N,N',N'-Tetramethylethylenediamine (TEMED, Bio-Rad, 161-0801)
Nitrogen, liquid (Cryotherm)
Non-essential amino acids (Gibco, 11140)
PageRuler Plus Prestained Protein Ladder (Thermo Fisher Scientific, 26619)
Penicillin/streptomycin (Gibco, 15140)
Phosphoascorbate (2-Phospho- L -ascorbic acid trisodium salt; Sigma-Aldrich, 49752)
Pluronic F127 (Sigma-Aldrich, P2443)
Polyvinyl alcohol (PVA; Sigma-Aldrich, P8136)
Ponceau S solution (Sigma-Aldrich, P7170)
Precision Plus Protein Dual Color (Bio-Rad, 161-0394)
Pursept (Schülke, 230125)
QIAshredder (QIAGEN, 79656)
Supplement
151
Rapamycin (Sigma-Aldrich, R8781)
Restore PLUS Western Blot Stripping Buffer (Thermo Fisher Scientific, 46430)
Roti-Histofix 4% (Roth, P087.3)
Saponin (Merck, 558255)
Skim milk powder (Roth, T145.2)
S.O.C. medium (Thermo Fisher Scientific, 15544034)
Sodium azide (Sigma-Aldrich, 71290)
Sodium chloride (NaCl; JT Baker, 7647-14-5)
Sodium dodecyl sulphate (SDS pellets; Roth, CN30.3)
Sodium selenite (Sigma-Aldrich, S5261)
TGFß1 (Peprotech, 100-21C)
Thiourea (Sigma-Aldrich, T7875-500)
TOP10 chemically competent E. coli (Thermo Fisher Scientific, C404010)
Transferrin (Sigma-Aldrich, S5261)
Tris-hydrochloride (Roth, 9090.2)
Triton X-100 (Roth, 3051.3)
Trizma base (Sigma-Aldrich, T1503)
Trypan blue (Biochrom, L 6323)
Trypsin-EDTA 0.5% (Gibco, 15400054)
Trypsin Gold (Promega, V5111)
Tween 20 (Sigma-Aldrich, P1379)
UltraPure DTT (Sigma, 17-1318-02)
Urea (Merck, 1.08487.5000)
XAV 939 (Tocris, 3748)
Y-27632 (Biorbyt, orb154626)
ZipTip-µC18 tips (Merck Millipore, ZTC18S096)
Kits and enzymes
Table S1: Kits and enzymes.
Name Company Product code
AmpliTaq Gold (250 U) DNA polymerase Thermo Fisher Scientific 4311806
CloneJET PCR Cloning Kit Thermo Fisher Scientific K1232
Coomassie Plus (Bradford) Assay Kit Bio-Rad 500-0006
CytoTune™-iPS 1.0 Sendai Reprogramming Kit Life Technologies A16517
DNase Sigma-Aldrich D8764

Supplement
152
DNeasy Blood & Tissue Kit QIAGEN 69504
FastDigest BpiI/BbsI Thermo Fisher Scientific FD1014
HRM/iRT peptides Biognosys AG Ki-3002-1
Maxima SYBR Green/ROX qPCR Master Mix (2x) Thermo Fisher Scientific K0222
NucleoBond Xtra Maxi Kit Macherey-Nagel 740414.50
NucleoSpin Plasmid Miniprep Kit Macherey-Nagel 740588.250
P3 Primary Cell 4D-Nucleofector X Kit L Lonza V4XP-3024
Primary Cell Optimization 4D-Nucleofector X Kit Lonza V4XP-9096
PrimeSTAR HS DNA polymerase Takara R010A
QIAquick Gel Extraction Kit QIAGEN 28706
QIAquick PCR Purification Kit QIAGEN 28104
Qubit Protein Assay Kit Thermo Fisher Scientific Q33212
Qubit RNA BR Assay Kit Thermo Fisher Scientific Q10210
Qubit RNA HS Assay Kit Thermo Fisher Scientific Q32855
Ribonuclease H from E.coli (2U/ µL) Thermo Fisher Scientific 18021014
RNeasy Mini Kit QIAGEN 74106
Superscript III First Strand cDNA synthesis Kit Thermo Fisher Scientific 18080-051
SV Total RNA Isolation System Promega Z3105
T4 Ligase Thermo Fisher Scientific EL0014
Composition of reagents, buffers & solutions
Table S2: List of the composition of the used reagents, buffers and solutions.
Reagent/ buffer/ solutions Composition
10x annealing buffer 100 mM Tris-HCL, pH8
500 mM NaCl
10 mM EDTA
in ddH2O
Agar plates 15 g/L Bacto Agar,
autoclaved and casted into TC dish 100
Activin A (157 µg/mL) 1 mg Activin A
in 6.369 mL 4 mM HCl (sterile)
Aprotinin 33 mg/mL Aprotinin
in aqua ad injectabilia
250 µL aliquots, stored at -20 °C for up to one year
bFGF (100 µg/mL) 1 mg bFGF
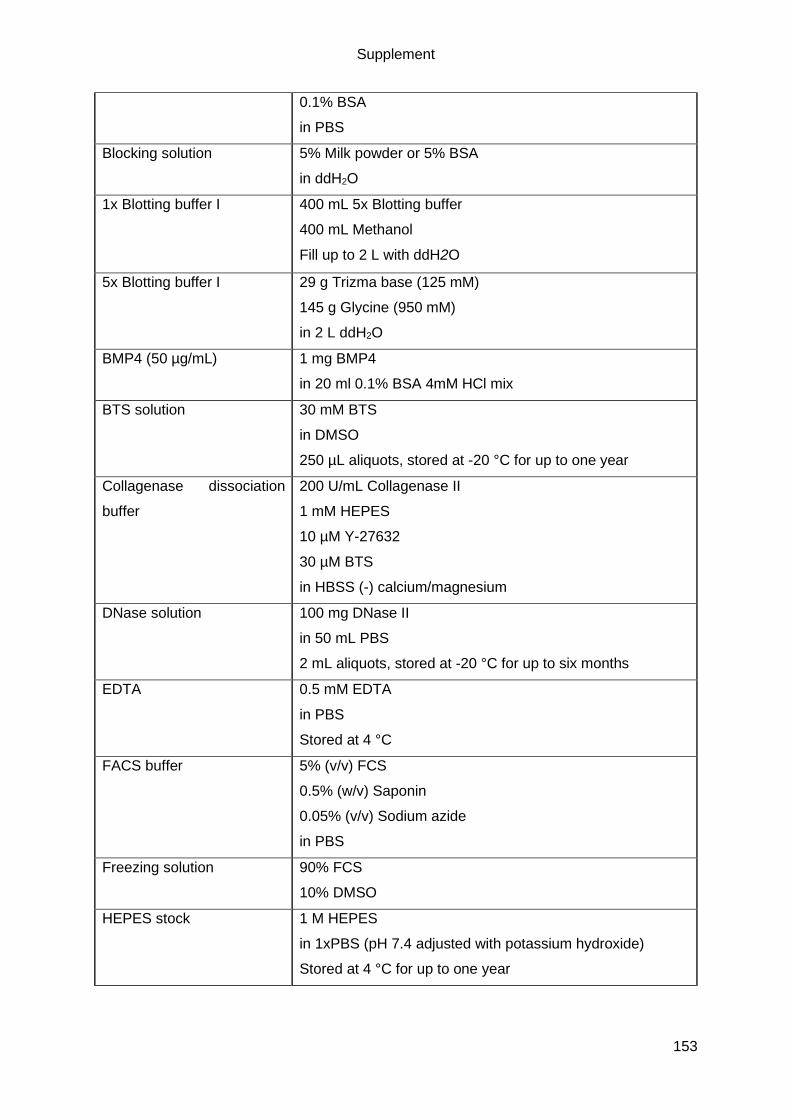
Supplement
153
0.1% BSA
in PBS
Blocking solution 5% Milk powder or 5% BSA
in ddH2O
1x Blotting buffer I 400 mL 5x Blotting buffer
400 mL Methanol
Fill up to 2 L with ddH2O
5x Blotting buffer I 29 g Trizma base (125 mM)
145 g Glycine (950 mM)
in 2 L ddH2O
BMP4 (50 µg/mL) 1 mg BMP4
in 20 ml 0.1% BSA 4mM HCl mix
BTS solution 30 mM BTS
in DMSO
250 µL aliquots, stored at -20 °C for up to one year
Collagenase dissociation
buffer
200 U/mL Collagenase II
1 mM HEPES
10 µM Y-27632
30 µM BTS
in HBSS (-) calcium/magnesium
DNase solution 100 mg DNase II
in 50 mL PBS
2 mL aliquots, stored at -20 °C for up to six months
EDTA 0.5 mM EDTA
in PBS
Stored at 4 °C
FACS buffer 5% (v/v) FCS
0.5% (w/v) Saponin
0.05% (v/v) Sodium azide
in PBS
Freezing solution 90% FCS
10% DMSO
HEPES stock 1 M HEPES
in 1xPBS (pH 7.4 adjusted with potassium hydroxide)
Stored at 4 °C for up to one year

Supplement
154
Kranias buffer 2 mL Tris (1.5 M, pH 8.8)
1 mL EDTA (0.5 M)
6 mL NaF (500mM)
15 mL SDS (20%)
10 mL Glycerol
in 100 mL ddH2O
Laemmli buffer (6x) 1.2 g SDS
6 mg Bromophenol blue
6 g Glycerol
1.2 mL of 0.5 M Tris (pH 6.8)
0.93 g DTT
in ddH2O
LB- medium 10 g Bacto Tryptone
5 g Basto Yeast Extract
10 g NaCl
1 L ddH20, pH7.4
Permeabilization buffer (IF) 3% (w/v) Skim milk powder
0.1% (v/v) Triton X-100
in PBS
Phosphoascorbate (250
mM)
1 g Phosphoascorbate
12.4 mL PBS
Pluronic F-127 solution 1% (w/v) Pluronic F-127
in PBS
Stored at 4 °C for up to one year.
50x Polyvinyl alcohol 20 g polyvinyl alcohol
in 100 mL ddH2O
Stored at 4 °C for up to one year
10x SDS-PAGE
electrophoresis buffer
30.2 g Trizma base (250 mM)
10 g SDS (1%) or 50 mL of 20% SDS sol.
144 g Glycine (1.92 M)
in 1 L ddH2O
Separation gel SDS-PAGE
(12%)
3 mL Acrylamide/Bis 40%
2.5 mL Tris pH 8.8 (1.5 M)
100 µL SDS (10% solution)
100 µL APS (10% solution)
4 µL TEMED
4.3 mL ddH2O
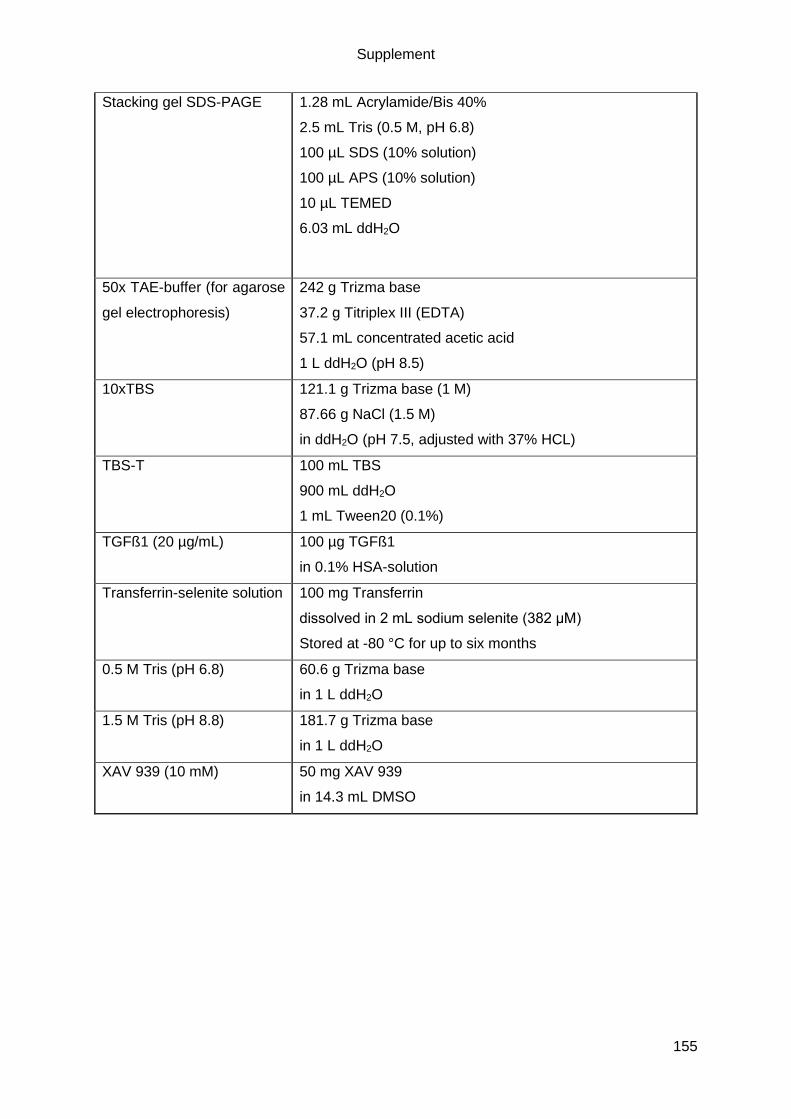
Supplement
155
Stacking gel SDS-PAGE 1.28 mL Acrylamide/Bis 40%
2.5 mL Tris (0.5 M, pH 6.8)
100 µL SDS (10% solution)
100 µL APS (10% solution)
10 µL TEMED
6.03 mL ddH2O
50x TAE-buffer (for agarose
gel electrophoresis)
242 g Trizma base
37.2 g Titriplex III (EDTA)
57.1 mL concentrated acetic acid
1 L ddH2O (pH 8.5)
10xTBS 121.1 g Trizma base (1 M)
87.66 g NaCl (1.5 M)
in ddH2O (pH 7.5, adjusted with 37% HCL)
TBS-T 100 mL TBS
900 mL ddH2O
1 mL Tween20 (0.1%)
TGFß1 (20 µg/mL) 100 µg TGFß1
in 0.1% HSA-solution
Transferrin-selenite solution 100 mg Transferrin
dissolved in 2 mL sodium selenite (382 μM)
Stored at -80 °C for up to six months
0.5 M Tris (pH 6.8) 60.6 g Trizma base
in 1 L ddH2O
1.5 M Tris (pH 8.8) 181.7 g Trizma base
in 1 L ddH2O
XAV 939 (10 mM) 50 mg XAV 939
in 14.3 mL DMSO

Supplement
156
Antibodies
Table S3: Primary antibodies used for flow cytometry (FC), western blot (WB) and
immunofluorescence (IF) microscopy.
Antibody Species Application and dilution Company (product code)
α-Actinin 2,
clone EA 53
Mouse WB: 1:20,000; IF: 1:800 Sigma (A7811)
α-Actinin 2 Rabbit WB: 1:10,000; IF: 1:800 Sigma (SAB2108642)
α-CSQ Rabbit WB: 1:5000 Dianova (ABR-01164)
α-cMyBP-C
C0-01
Rabbit WB: 1:10,000 Gautel
α-cMyBP-C F-
1
Mouse WB: 1:2000; IF: 1:200 Santa Cruz (sc-137181)
α-Titin Z1 Rabbit IF: 1:200 Labeit
α-cTnT
(clone13-11)
Mouse WB: 1:5000; IF: 1:100 Abcam (ab10218)
α-cTnT (clone
1C11)
Mouse WB: 1:5000; IF: 1:100 Abcam (ab8295)
α-cTnT FITC Recombinant
human IgG1
FC: 1:10 Miltenyi Biotec (130-106-
687
α-LAMP-2
H4B4
Mouse IF: 1:50 DHSB (H4B4-s)
α-LAMP-2 Rat WB: 1:2000(tissue) /
1:5000 (hiPSC-CMs
Abcam (ab13524)
α-LC3 Rabbit WB: 1:1000 in 5% BSA Novus Biological (NB100-
2331)
α-LC3 Rabbit WB: 1:1000 in 5%BSA Cell Signaling (2775)
α-p62 Mouse WB: 1:2000 BD (610832)
α-p62 Rabbit IF: 1:200 Sigma P0067
PE-Rat IgM, κ
Isotype control
Mouse FC: 1:50 BD (553943)
α-pS6 Rabbit WB: 1:2000 Cell Signaling (2215)
REA Control
(I)-FITC
Isotype
control IgG1
FC: 1:10 Miltenyi Biotec, 130-104-
611
α-S6 Rabbit WB: 1:5000 Cell Signaling (2217)
α-SSEA3 PE Rat FC: 1:5 BD (560237)
α-Ubiquitin Mouse WB: 1:50 000 Biomol (BML-PW 8810)
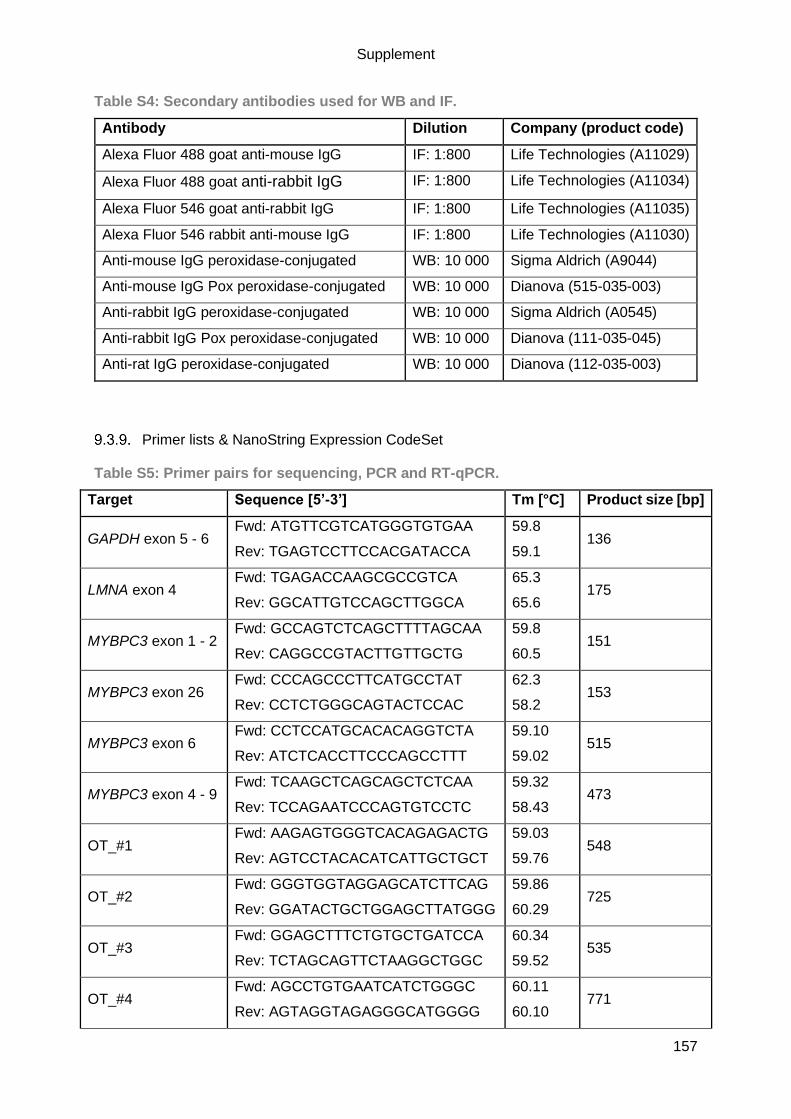
Supplement
157
Table S4: Secondary antibodies used for WB and IF.
Antibody Dilution Company (product code)
Alexa Fluor 488 goat anti-mouse IgG IF: 1:800 Life Technologies (A11029)
Alexa Fluor 488 goat anti-rabbit IgG IF: 1:800 Life Technologies (A11034)
Alexa Fluor 546 goat anti-rabbit IgG IF: 1:800 Life Technologies (A11035)
Alexa Fluor 546 rabbit anti-mouse IgG IF: 1:800 Life Technologies (A11030)
Anti-mouse IgG peroxidase-conjugated WB: 10 000 Sigma Aldrich (A9044)
Anti-mouse IgG Pox peroxidase-conjugated WB: 10 000 Dianova (515-035-003)
Anti-rabbit IgG peroxidase-conjugated WB: 10 000 Sigma Aldrich (A0545)
Anti-rabbit IgG Pox peroxidase-conjugated WB: 10 000 Dianova (111-035-045)
Anti-rat IgG peroxidase-conjugated WB: 10 000 Dianova (112-035-003)
Primer lists & NanoString Expression CodeSet
Table S5: Primer pairs for sequencing, PCR and RT-qPCR.
Target Sequence [5’-3’] Tm [°C] Product size [bp]
GAPDH exon 5 - 6 Fwd: ATGTTCGTCATGGGTGTGAA
Rev: TGAGTCCTTCCACGATACCA
59.8
59.1 136
LMNA exon 4 Fwd: TGAGACCAAGCGCCGTCA
Rev: GGCATTGTCCAGCTTGGCA
65.3
65.6 175
MYBPC3 exon 1 - 2 Fwd: GCCAGTCTCAGCTTTTAGCAA
Rev: CAGGCCGTACTTGTTGCTG
59.8
60.5 151
MYBPC3 exon 26 Fwd: CCCAGCCCTTCATGCCTAT
Rev: CCTCTGGGCAGTACTCCAC
62.3
58.2 153
MYBPC3 exon 6 Fwd: CCTCCATGCACACAGGTCTA
Rev: ATCTCACCTTCCCAGCCTTT
59.10
59.02 515
MYBPC3 exon 4 - 9 Fwd: TCAAGCTCAGCAGCTCTCAA
Rev: TCCAGAATCCCAGTGTCCTC
59.32
58.43 473
OT_#1 Fwd: AAGAGTGGGTCACAGAGACTG
Rev: AGTCCTACACATCATTGCTGCT
59.03
59.76 548
OT_#2 Fwd: GGGTGGTAGGAGCATCTTCAG
Rev: GGATACTGCTGGAGCTTATGGG
59.86
60.29 725
OT_#3 Fwd: GGAGCTTTCTGTGCTGATCCA
Rev: TCTAGCAGTTCTAAGGCTGGC
60.34
59.52 535
OT_#4 Fwd: AGCCTGTGAATCATCTGGGC
Rev: AGTAGGTAGAGGGCATGGGG
60.11
60.10 771
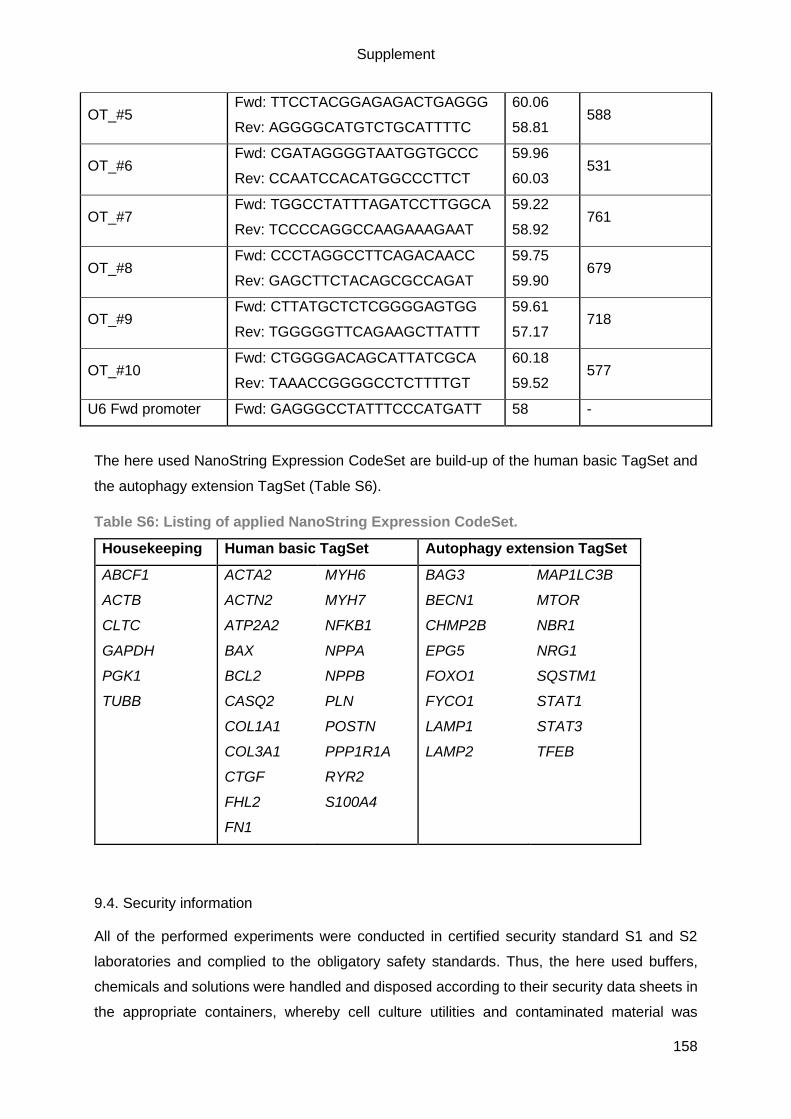
Supplement
158
OT_#5 Fwd: TTCCTACGGAGAGACTGAGGG
Rev: AGGGGCATGTCTGCATTTTC
60.06
58.81 588
OT_#6 Fwd: CGATAGGGGTAATGGTGCCC
Rev: CCAATCCACATGGCCCTTCT
59.96
60.03 531
OT_#7 Fwd: TGGCCTATTTAGATCCTTGGCA
Rev: TCCCCAGGCCAAGAAAGAAT
59.22
58.92 761
OT_#8 Fwd: CCCTAGGCCTTCAGACAACC
Rev: GAGCTTCTACAGCGCCAGAT
59.75
59.90 679
OT_#9 Fwd: CTTATGCTCTCGGGGAGTGG
Rev: TGGGGGTTCAGAAGCTTATTT
59.61
57.17 718
OT_#10 Fwd: CTGGGGACAGCATTATCGCA
Rev: TAAACCGGGGCCTCTTTTGT
60.18
59.52 577
U6 Fwd promoter Fwd: GAGGGCCTATTTCCCATGATT 58 -
The here used NanoString Expression CodeSet are build-up of the human basic TagSet and
the autophagy extension TagSet (Table S6).
Table S6: Listing of applied NanoString Expression CodeSet.
Housekeeping Human basic TagSet Autophagy extension TagSet
ABCF1
ACTB
CLTC
GAPDH
PGK1
TUBB
ACTA2
ACTN2
ATP2A2
BAX
BCL2
CASQ2
COL1A1
COL3A1
CTGF
FHL2
FN1
MYH6
MYH7
NFKB1
NPPA
NPPB
PLN
POSTN
PPP1R1A
RYR2
S100A4
BAG3
BECN1
CHMP2B
EPG5
FOXO1
FYCO1
LAMP1
LAMP2
MAP1LC3B
MTOR
NBR1
NRG1
SQSTM1
STAT1
STAT3
TFEB
9.4. Security information
All of the performed experiments were conducted in certified security standard S1 and S2
laboratories and complied to the obligatory safety standards. Thus, the here used buffers,
chemicals and solutions were handled and disposed according to their security data sheets in
the appropriate containers, whereby cell culture utilities and contaminated material was

Supplement
159
autoclaved before disposal. In case of a putative contamination of a surface with genetically
modified organism, cleaning with 70% ethanol was performed.
Table S7: H- and P- statements for all used chemicals.
Chemical Company H-statement P-statement
1,4-Dithiothreitol (DTT) Applichem H: 302, 315, 319,
412
P: 264, 270, 273, 280,
337+313, 501
1-Thioglycerol Sigma-Aldrich H: 302, 311, 315,
319, 335
P: 261, 264, 280,
301+312+330,
302+352+312, 333+313
2-Mercaptoethanol Sigma-Aldrich H: 301+331, 310,
315, 317, 318,
373, 410
P: 270, 280, 302+352,
330, 304+340,
305+351+338, 310
2-Propanol Merck Millipore H: 225, 319, 336 P: 210, 261,
305+351+338
Acetic acid Roth H: 226, 290, 314 P: 210, 280,
301+330+331,
305+351+338, 308+310
Acetonitrile Pierce,
Thermo Fisher
H: 225, 311,
302+332, 319
P: 210, 280
Acyrlamide/bis solution
40% (29:1)
Bio-Rad H: 302, 312, 315,
317, 319, 340,
350, 361, 372
P: 260, 280, 281,
305+351+338, 405, 501
Ammonium persulfate
(APS)
Bio-Rad H: 272, 302, 315,
317, 319, 334,
335
P: 210, 221, 285,
305+351+338, 405, 501
Ampicillin trihydrate SERVA H: 317, 334 P: 280, 285, 302+352,
304+340, 333+313,
342+311
BTS TCI H: 301 P: 264, 270, 301+310,
321, 330, 405, 501
Collagenase II Worthington H: 334 P: 261, 284, 304+340,
342+311
cOmplete, Mini, EDTA-
free Protease Inhibitor
Roche H: 315, 319 P: 264, 280, 302+352,
332+313, 337+313,
362+364

Supplement
160
Ethylenediamine
tetraacetic acid (EDTA)
Roth H: 319 P: 305+351+338
Ethanol, absolute Chemsolute H: 225, 319 P: 210, 240,
305+351+338, 403+233
Hoechst 33342 Sigma-Aldrich H: 302, 315, 335,
341
P: 280, 301+312+333
Hydrochloric acid, 37%
solution
Merck H: 290, 314, 335 P: 280, 301+330+331,
305+351+338, 308+310
Iodoacetamide, BioUltra Sigma-Aldrich H: 301, 317, 334 P: 261, 280, 301+310,
342+311
Lipidmix Sigma-Aldrich H: 225, 319 P: 210, 280,
305+351+338,
337+313, 403+235
Methanol J T Baker H: 225, 301, 331,
311, 370
P: 210, 233, 280,
302+352
Midori Green Biozym - P: 261, 280
N,N,N´,N´-
Tetramethylethylenedia
mine (TEMED)
Bio-Rad H: 225, 302, 314,
332
P: 210, 233, 280,
301+330+331,
305+351+338, 308, 310
Nitrogen, liquid Cryotherm H: 281 P: 282, 336+315, 403
Penicillin/streptomycin Gibco H: 315, 317, 334,
335
P: 280, 261, 264, 284,
271, 302+352,
304+340, 333+313
Ponceau S Sigma H: 315, 319, 335 P: 261, 305+351+338
Pursept Schülke H: 226, 319 P: 210, 280,
305+351+338,
337+313, 403+235
Restore PLUS Western
Blot Stripping Buffer
Thermo Fisher
Scientific
H: 290 P: 234, 390
Roti-Histofix 4% Roth H: 302, 317, 341,
350
P: 261, 280,
302+352,308+313
Saponin Sigma H: 319, 335 P: 261, 305+351+338
Sodium azide Merck H: 300, 400, 410 P: 273, 309, 310
Sodium dodecyl sulphate
(SDS)
Roth H: 228, 302+332,
315, 318, 335,
412
P: 210, 261, 280,
302+352,
305+351+338, 312
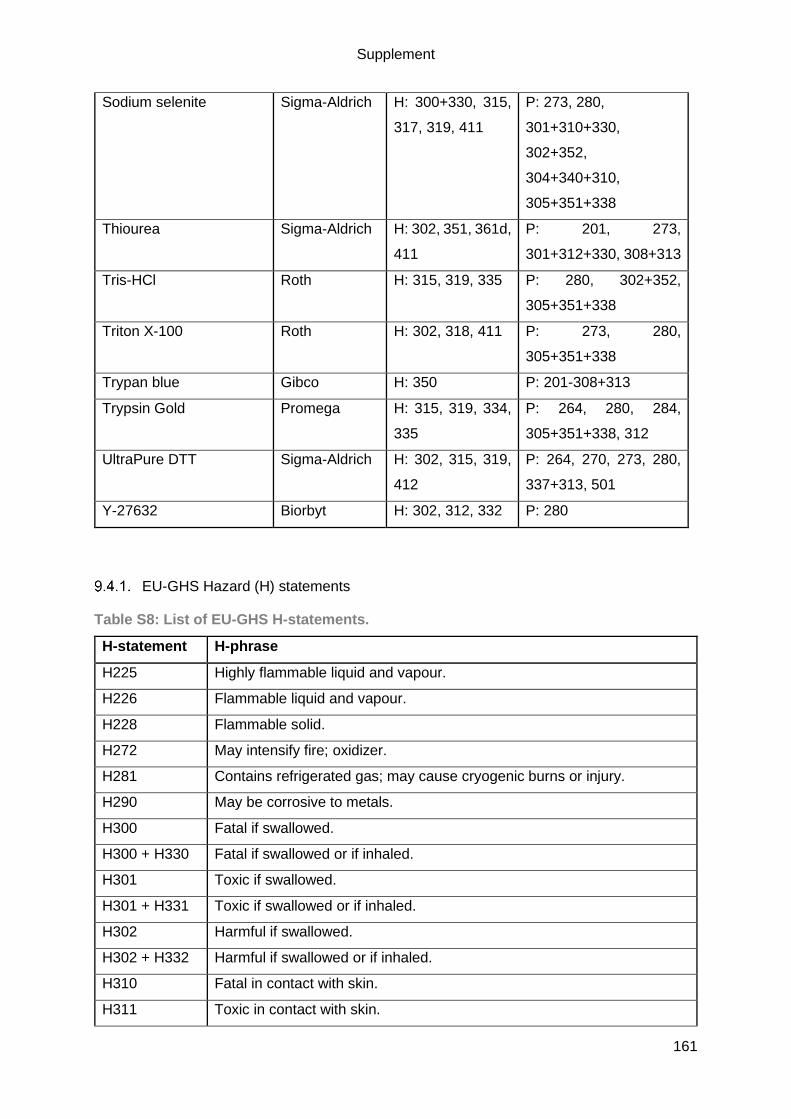
Supplement
161
Sodium selenite Sigma-Aldrich H: 300+330, 315,
317, 319, 411
P: 273, 280,
301+310+330,
302+352,
304+340+310,
305+351+338
Thiourea Sigma-Aldrich H: 302, 351, 361d,
411
P: 201, 273,
301+312+330, 308+313
Tris-HCl Roth H: 315, 319, 335 P: 280, 302+352,
305+351+338
Triton X-100 Roth H: 302, 318, 411 P: 273, 280,
305+351+338
Trypan blue Gibco H: 350 P: 201-308+313
Trypsin Gold Promega H: 315, 319, 334,
335
P: 264, 280, 284,
305+351+338, 312
UltraPure DTT Sigma-Aldrich H: 302, 315, 319,
412
P: 264, 270, 273, 280,
337+313, 501
Y-27632 Biorbyt H: 302, 312, 332 P: 280
EU-GHS Hazard (H) statements
Table S8: List of EU-GHS H-statements.
H-statement H-phrase
H225 Highly flammable liquid and vapour.
H226 Flammable liquid and vapour.
H228 Flammable solid.
H272 May intensify fire; oxidizer.
H281 Contains refrigerated gas; may cause cryogenic burns or injury.
H290 May be corrosive to metals.
H300 Fatal if swallowed.
H300 + H330 Fatal if swallowed or if inhaled.
H301 Toxic if swallowed.
H301 + H331 Toxic if swallowed or if inhaled.
H302 Harmful if swallowed.
H302 + H332 Harmful if swallowed or if inhaled.
H310 Fatal in contact with skin.
H311 Toxic in contact with skin.
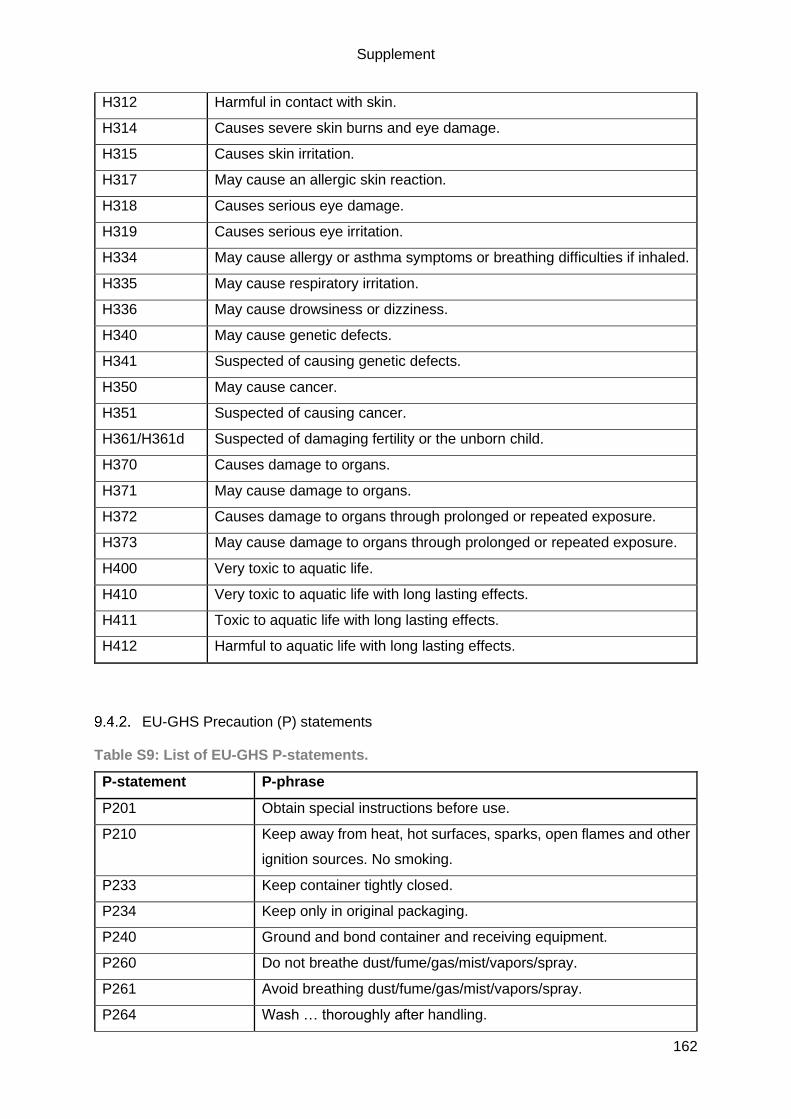
Supplement
162
H312 Harmful in contact with skin.
H314 Causes severe skin burns and eye damage.
H315 Causes skin irritation.
H317 May cause an allergic skin reaction.
H318 Causes serious eye damage.
H319 Causes serious eye irritation.
H334 May cause allergy or asthma symptoms or breathing difficulties if inhaled.
H335 May cause respiratory irritation.
H336 May cause drowsiness or dizziness.
H340 May cause genetic defects.
H341 Suspected of causing genetic defects.
H350 May cause cancer.
H351 Suspected of causing cancer.
H361/H361d Suspected of damaging fertility or the unborn child.
H370 Causes damage to organs.
H371 May cause damage to organs.
H372 Causes damage to organs through prolonged or repeated exposure.
H373 May cause damage to organs through prolonged or repeated exposure.
H400 Very toxic to aquatic life.
H410 Very toxic to aquatic life with long lasting effects.
H411 Toxic to aquatic life with long lasting effects.
H412 Harmful to aquatic life with long lasting effects.
EU-GHS Precaution (P) statements
Table S9: List of EU-GHS P-statements.
P-statement P-phrase
P201 Obtain special instructions before use.
P210 Keep away from heat, hot surfaces, sparks, open flames and other
ignition sources. No smoking.
P233 Keep container tightly closed.
P234 Keep only in original packaging.
P240 Ground and bond container and receiving equipment.
P260 Do not breathe dust/fume/gas/mist/vapors/spray.
P261 Avoid breathing dust/fume/gas/mist/vapors/spray.
P264 Wash … thoroughly after handling.
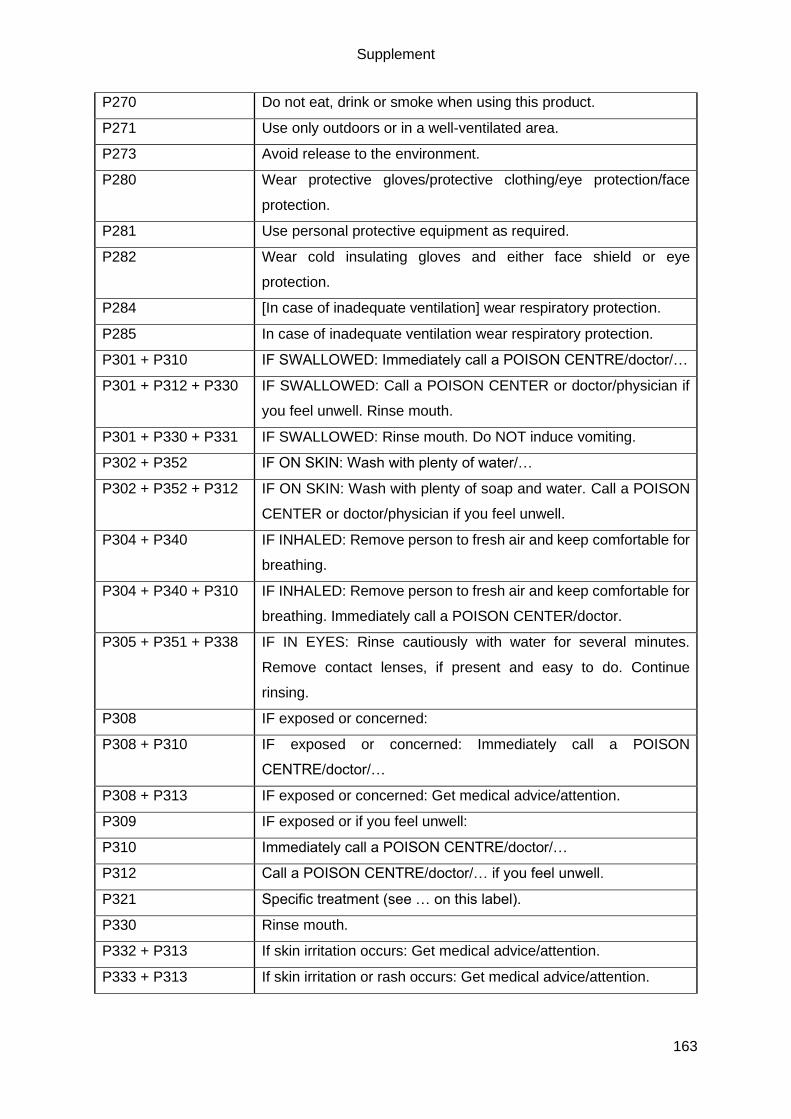
Supplement
163
P270 Do not eat, drink or smoke when using this product.
P271 Use only outdoors or in a well-ventilated area.
P273 Avoid release to the environment.
P280 Wear protective gloves/protective clothing/eye protection/face
protection.
P281 Use personal protective equipment as required.
P282 Wear cold insulating gloves and either face shield or eye
protection.
P284 [In case of inadequate ventilation] wear respiratory protection.
P285 In case of inadequate ventilation wear respiratory protection.
P301 + P310 IF SWALLOWED: Immediately call a POISON CENTRE/doctor/…
P301 + P312 + P330 IF SWALLOWED: Call a POISON CENTER or doctor/physician if
you feel unwell. Rinse mouth.
P301 + P330 + P331 IF SWALLOWED: Rinse mouth. Do NOT induce vomiting.
P302 + P352 IF ON SKIN: Wash with plenty of water/…
P302 + P352 + P312 IF ON SKIN: Wash with plenty of soap and water. Call a POISON
CENTER or doctor/physician if you feel unwell.
P304 + P340 IF INHALED: Remove person to fresh air and keep comfortable for
breathing.
P304 + P340 + P310 IF INHALED: Remove person to fresh air and keep comfortable for
breathing. Immediately call a POISON CENTER/doctor.
P305 + P351 + P338 IF IN EYES: Rinse cautiously with water for several minutes.
Remove contact lenses, if present and easy to do. Continue
rinsing.
P308 IF exposed or concerned:
P308 + P310 IF exposed or concerned: Immediately call a POISON
CENTRE/doctor/…
P308 + P313 IF exposed or concerned: Get medical advice/attention.
P309 IF exposed or if you feel unwell:
P310 Immediately call a POISON CENTRE/doctor/…
P312 Call a POISON CENTRE/doctor/… if you feel unwell.
P321 Specific treatment (see … on this label).
P330 Rinse mouth.
P332 + P313 If skin irritation occurs: Get medical advice/attention.
P333 + P313 If skin irritation or rash occurs: Get medical advice/attention.

Supplement
164
P336 + P315 Thaw frosted parts with lukewarm water. Do not rub affected area.
Get immediate medical advice/attention.
P337 + P313 If eye irritation persists: Get medical advice/attention.
P342 + P311 If experiencing respiratory symptoms: Call a POISON
CENTRE/doctor/…
P362 + P364 Take off contaminated clothing and wash it before reuse.
P390 Absorb spillage to prevent material damage.
P403 Store in a well-ventilated place.
P403 + P233 Store in a well-ventilated place. Keep container tightly closed.
P405 Store locked up.
P501 Dispose of contents/container to …
9.5. Publications & congress participations
Publications
Prondzynski, M, Lemoine, MD, Zech, ATL, Horvath, A, Di Mauro, V, Koivumäki, JT, Kresin, N,
Busch, J, Krause, T, Krämer, E, Schlossarek, S, Spohn, M, Friedrich, F, Münch, J, Laufer, S,
Redwood, C, Volk, AE, Hansen, A, Mearini, G, Catalucci, D, Meyer, C, Christ, T, Patten, M,
Eschenhagen, T & Carrier, L. (2019) Disease modeling of a mutation in α-actinin 2 guides
clinical therapy in hypertrophic cardiomyopathy. EMBO Mol Med. e11115: 1-18.
Zech ATL*, Singh SR*, Schlossarek S, Carrier L. (2019) Autophagy in cardiomyopathies.
Biochim Biophys Acta – Mol Cell Res 1-14.
Lemme M, Ulmer BM, Lemoine MD, Zech ATL, Flenner F, Ravens U, Reichenspurner H, Rol-
Garcia M, Smith G, Hansen A, Christ T & Eschenhagen T. (2018) Atrial-like Engineered Heart
Tissue: An In Vitro Model of the Human Atrium. Stem Cell Rep 11:1378-1390.
Singh SR, Zech ATL, Geertz B, Reischmann-Düsener S, Osinska H, Prondzynski M, Krämer
E, Meng Q, Redwood C, Van der Velden J, Robbins J, Schlossarek S, Carrier L. (2017)
Activation of Autophagy Amerliorates Cardiomyopathy in Mybpc3-Targeted Knockin Mice. Circ
Hear Fail 10.
Harder L, .Eschenburg G, Zech A, Kriebitzsch, Otto B, Streichert T, Behlich AS, Dierck K,
Klingler B, Hansen A, Stanulla M, Zimmermann M, Kremmer E, Stocking C, Horstmann MA.
(2013) Aberrant ZNF423 impedes B cell differentiation and is linked to adverse outcome of
ETV6-RUNX1 negative B precursor acute lymphoblastic leukemia. J Exp Med 210:2289-2304.

Supplement
165
Participations at congresses
“Cardiac Regulatory Mechanisms”– Gordon Research Conference, 3rd – 8th of June 2018, New
London, NH USA; poster presentation “Common autophagy alteration but specific lysosomal
dysfunction in human hypertrophic and dilated cardiomyopathies”.
“Cardiac Regulatory Mechanisms”– Gordon Research Seminar, 2nd – 3rd of June 2018, New
London, NH USA; selected oral abstract and poster presentation “Common autophagy
alteration but specific lysosomal dysfunction in human hypertrophic and dilated
cardiomyopathies”.
34th Annual Meeting of the European Section of the ISHR, 24th – 27th of July 2017, Hamburg,
Germany; selected oral abstract and poster presentation “Evaluation of the autophagy-
lysosomal pathway in cardiac tissue and hiPSC-derived cardiomyocytes from patients with
inherited cardiomyopathies”, awarded with a poster prize.
NCCR retreat, 3rd – 4th of February 2017, Tremsbüttel, Germany; poster presentation
“Alteration of the autophagy-lysosomal pathway in hypertrophic and dilated cardiomyopathy”.
Heart Failure Winter Research Meeting, 25th – 28th of January 2017, Les Diablerets,
Switzerland; poster presentation “Alteration of the autophagy-lysosomal pathway in
hypertrophic and dilated cardiomyopathy”.

Acknowledgement
166
10. Acknowledgement
First of all, I would like to thank Prof. Dr. Lucie Carrier, who not only gave me the opportunity
to perform my PhD in her lab but also always encouraged me to perform experiments and to
participate in conferences to exchange ideas with other scientists. Furthermore, she always
challenged my findings and scientific ideas, although this meant to argue a lot with me.
Nonetheless, she trusted my skills and gut and let me do my thing in the lab.
I would also like to thank Prof. Dr. Thomas Eschenhagen for giving me the opportunity to do
my PhD at his Institute and for his great, challenging scientific feedback during meetings.
Further, I would also like to thank Prof. Dr. Elke Oetjen very much for reviewing this thesis.
Another big thank you is addressed to the AG Carrier, including Dr. Sonia Singh, Dr. Frederik
Flenner, Dr. Giulia Mearini, Lisa Krämer and Niels Pietsch, but also former students, such as
Anna Rinas, Neele Warnecke, Alexander Tourounoglou and many more.
A special thank you goes to Dr. Saskia Schlossarek, who had to put up with a lot to help me
finalize this thesis, while being supportive and reassuring. I do owe her a lot of chocolate.
However, also Josefine Busch largely contributed to this thesis by supporting me 100% in the
lab during pregnancy and as a friend. Furthermore, Silke Reischmann-Düsener helped me to
finish all the experiments.
One of the biggest thank you goes to my triple Ms – Maks, Marta and Mirja -, who helped me
to finish my PhD by supporting me 100% in the lab, especially during pregnancy. Each of them
supported me in their own way, scientifically and personally, and even though we are not
working any longer in one place, they are an important part of my life that I do not want to miss.
Further, I want to thank the people that supported me during CRISPR, such as Sandra Laufer,
Christiane Neuber, Anika E Knaust. Alexandra Madsen and Maks Prondzynski. Moreover, a
big thank goes to the member of our hiPSC-CM working group that helped me to successfully
differentiate, especially Thomas Schulze, Birgit Klampe, Aya Shibamiya and Marina Reinsch.
I also want to say thank you to Lotta Behrens and Malte Loos who supported me in the last
weeks with food and company, and Alexandra Madsen for proofreading this thesis.
I also want to thank my friends that supported me in the last four years. A special thank you
goes to Bianca Dawson that greatly supported me mentally in the last weeks and year.
Finally, the biggest thank you is addressed to my family that always supported me in every
manner you can think of. Especially in the last year, my parents and my siblings, helped me to
finalize this thesis that otherwise wouldn’t have been possible. Particularly, my fiancé Philip
Goldhahn and my son Emil Goldhahn, helped and motivated me every day to do the best I
can.

Declaration of academic honesty
167
11. Declaration of academic honesty – Eidesstattliche Erklärung
I hereby declare that my thesis was written independently by myself and further I did not use
any other sources or aids other than those indicated. The submitted written form of the thesis
complies with the one on the electronic storage medium. This thesis was not handed in any
other form for another examination procedure.
Hamburg, 13.12.2019
„Hiermit versichere ich Eides statt, die vorliegende Dissertation selbst verfasst und keine
anderen als die angegebenen Hilfsmittel benutzt zu haben. Die eingereichte schriftliche
Fassung entspricht der auf dem elektronischen Speichermedium. Ich versichere, dass diese
Dissertation nicht in einem früheren Promotionsverfahren eingereicht wurde.“
Hamburg, den 13.12.2019