Embed Size (px)
Citation preview
Investigation of Non-equilibrium Radiation
for Earth Entry
A. M. Brandis∗†
AMA at NASA Ames, Mountain View, CA, 94035, USA,
C. O. Johnston∗
NASA Langley Research Center, Hampton, VA, 23669, USA
B. A. Cruden‡
AMA at NASA Ames, Mountain View, CA, 94035, USA
For Earth re-entry at velocities between 8 and 11.5 km/s, the accuracy of NASA’scomputational fluid dynamic and radiative simulations of non-equilibrium shock layer ra-diation is assessed through comparisons with measurements. These measurements wereobtained in the NASA Ames Research Center’s Electric Arc Shock Tube (EAST) facility.The experiments were aimed at measuring the spatially and spectrally resolved radianceat relevant entry conditions for both an approximate Earth atmosphere (79% N2 : 21% O2
by mole) as well as a more accurate composition featuring the trace species Ar and CO2
(78.08% N2 : 20.95% O2 : 0.04% CO2 : 0.93% Ar by mole). The experiments were config-ured to target a wide range of conditions, of which shots from 8 to 11.5 km/s at 0.2 Torr(26.7 Pa) are examined in this paper. The non-equilibrium component was chosen to bethe focus of this study as it can account for a significant percentage of the emitted radiationfor Earth re-entry, and more importantly, non-equilibrium has traditionally been assigneda large uncertainty for vehicle design. The main goals of this study are to present theshock tube data in the form of a non-equilibrium metric, evaluate the level of agreementbetween the experiment and simulations, identify key discrepancies and to examine criti-cal aspects of modeling non-equilibrium radiating flows. Radiance profiles integrated overdiscreet wavelength regions, ranging from the Vacuum Ultra Violet (VUV) through to theNear Infra-Red (NIR), were compared in order to maximize both the spectral coverageand the number of experiments that could be used in the analysis. A previously definednon-equilibrium metric has been used to allow comparisons with several shots and revealtrends in the data. Overall, LAURA/HARA is shown to under-predict EAST by as much as40% and over-predict by as much as 12% depending on the shock speed. DPLR/NEQAIRis shown to under-predict EAST by as much as 50% and over-predict by as much as 20%depending on the shock speed. The one standard deviation scatter in the EAST resultswas calculated to be 31%. An estimate for the upper bound of the absolute error in wall-directed heat flux was calculated. Below 9 km/s, where the relative difference is large, theabsolute error in radiative heat flux due to non-equilibrium models is estimated to be lessthen 1 W/cm2. At the highest shock speed of 11 km/s, the error in non-equilibrium isestimated to be less than 20 W/cm2.
I. Introduction
Future Earth re-entry missions involving larger vehicles and higher entry velocities than previously en-countered motivate the improved understanding of radiative heating and associated uncertainties. An
example of such a mission is the next MPCV Orion flight, EM-1, which will undertake a Lunar return trajec-tory where radiation will be a significant source of heating. Understanding these uncertainties may influence
∗Senior Research Scientist, Aerothermodynamics Branch, and Senior Member AIAA.†Contact: [email protected]‡Senior Research Scientist, Aerothermodynamics Branch, and Associate Fellow AIAA
1 of 18
American Institute of Aeronautics and Astronautics
https://ntrs.nasa.gov/search.jsp?R=20160009760 2018-09-17T02:42:27+00:00Z
future margin policies,1 and hence the thermal protection system (TPS) material selection and thickness.A recent example of an attempt to better validate aerothermal calculations for flight is Exploration FlightTest 1 (EFT-1). EFT-1 entered Earth’s atmosphere from a highly elliptical earth orbit in December of 2014.The heat shield of EFT-1 was instrumented for the purposes of trajectory reconstruction and aerothermalmodel validation (including radiometers). At the velocity EFT-1 entered, radiative heating did not have asignificant impact on either the total peak heat flux or heat load, but was significant enough to influenceentry heating reconstruction. Since it is rare to have flight data available for verification and validation ofthe models implemented in computational tools, a detailed analysis to assess the level of agreement withstate of the art simulations is warranted. Due to the trajectory flown by EFT-1, a significant portion of theradiative heat flux occurred at lower pressures and, as such, there was a large portion of non-equilibrium gasin the shock layer. Therefore, the present analysis attempts to provide insight into the accuracy of theoreticalmodels in non-equilibrium by evaluating the level of agreement between flowfield/radiation simulations anddata provided by EAST experiments.
Using shock tube data to validate non-equilibrium conditions should only be attempted if the characteri-zation of equilibrium radiance is already well understood. Previous publications have focused on providing anextensive comparison between simulations and measurements of equilibrium radiation obtained in the EASTfacility.2,3 In the previous studies, the integrated value of equilibrium radiance was compared across severalspectral regions as a function of velocity. Equilibrium becomes the dominant component of the radiationas velocity, free-stream density and shock stand-off distance increase. Results showed excellent agreementbetween Hara, Neqair and EAST data for the UV through IR spectral regions; however, discrepancies wereidentified in the VUV. As a result of this analysis, a parametric uncertainty for Earth re-entry above 10 km/swas evaluated to be [9.0%, -6.3%] ± 17%. For conditions below 10 km/s, it was concluded that the flow didnot reach a sufficient level of equilibrium, and this was demonstrated via measurements of electron densityin the “steady state” region of the flow in EAST being substantially larger than equilibrium predictions.The best current theory for this larger than equilibrium electron number density in the “equilibrium”, orsteady state, region is due to the effect the deceleration of the shock has on the state of the gas. Since theshock deceleration is more prominent in the flow further behind the shock front, the assumption utilized inthis work is that the gas directly behind the shock, i.e., the non-equilibrium region, is relatively unaffected.
II. Description of the EAST Facility
The EAST facility at NASA Ames Research Center was developed to simulate high-enthalpy, “real gas”phenomena encountered by hypersonic vehicles entering planetary atmospheres. Experiments are performedto match flow parameters relevant to flight, such as velocity, static pressure, and atmospheric composition.The shock-heated test gas in the tube simulates conditions behind the bow shock of a re-entry vehicle. EASThas the capability of producing super-orbital shock speeds using an electric arc driver with a driven tubediameter of 10.16 cm.4,5 The region of valid test gas is located between the shock front and the contactsurface that separates the driver and driven gases. The test duration is defined as the axial distance betweenthese two points divided by the local shock velocity. The characteristics of the EAST arc driver result in testdurations of approximately 4 - 10 µs. Though short, this test duration is often sufficient to capture the peaknon-equilibrium shock radiation and the decay to equilibrium conditions. When the shocked gas arrives atthe location of the test section in the tube, spectrometers attached to Charge Coupled Devices (CCDs) aregated, and the spectral and spatial emission of the gas are analyzed. EAST utilizes four spectrometers pershot, each associated with four different wavelength ranges. These cameras are referred to as: VUV (∼ 120– 215 nm), UV/Vis (∼ 190 nm – 500 nm), Vis/NIR (∼ 480 nm – 900 nm), and IR (∼ 700 nm – 1650 nm).
III. Description of Simulation Tools
The non-equilibrium radiance results presented in this paper have been calculated from flowfield andradiation simulations, using two sets of codes, Laura/Hara and Dplr/Neqair. This section will brieflydetail the codes and some updates to the radiation codes relevant to this work. It is likely that furtherupdates to all of these codes (Laura, Hara, Dplr and Neqair) will be motivated by the comparisonswithin this work and to the EFT-1 flight data.6
2 of 18
American Institute of Aeronautics and Astronautics
III.A. LAURA
The Langley Aerothermodynamic Upwind Relaxation Algorithm (Laura) is a structured grid flow solver,specialized for hypersonic re-entry physics, utilizing state-of-the-art algorithms for CFD simulations.7,8
Fluxes are computed using Roe’s averaging9 and Yee’s Symmetric Total Variation Diminishing (STVD)10
formulation in order to obtain higher order accuracy.
III.B. HARA
The High-temperature Aerothermodynamic RAdiation (Hara) model applied in the present study is dis-cussed in detail by Johnston et al.11,12 A line-by-line approach is used for atoms and optically thick molecules,while a smeared band model is used for optically thin molecules. Hara is based on a set of atomic levels andlines from the National Institute of Standards and Technology (NIST)13 and Opacity Project databases.14
The atomic bound-free model is composed of cross sections from the Opacity project’s online TOPbase,15
which were curve fit by Johnston.11 An update to the NO non-Boltzmann model in Hara has also beendeveloped, as discussed in Johnston et al,16 where non-Boltzmann rates were tuned to match EAST shocktube data from Ref. 2. This update to the NO non-Boltzmann model is not included in any of the Haracalculations presented in this paper unless it is specifically stated, see section V.B.
III.C. DPLR
Dplr17–19 uses a finite-volume discretization to solve the reacting Navier-Stokes equations for fluids inthermochemical non-equilibrium on structured grids. While the software was originally designed for steady-state aerothermodynamic analysis of planetary entry vehicles, Dplr has evolved over the years to include abroad spectrum of numerical and physical models that enable it to accurately simulate most compressibleflows. Additional details on Dplr’s capabilities can be found in the references 17–19. The version of Dplrused in this work is the pre-release of v4.03.2. The new feature of this version relevant to this paper is theoption allowing for the equivalence of vibration and electron/electronic energy, i.e. Tv = Te. This paperprovides a preliminary validation of the results provided by this updated energy coupling in Dplr.
III.D. NEQAIR
Non-EQuilibrium AIr Radiation (Neqair) is a line-by-line radiation code which computes spontaneousemission, absorption and stimulated emission due to transitions between various energy states of chemicalspecies along a line-of-sight.20 Individual electronic transitions are considered for atoms and molecules,with the molecular band systems being resolved for each rovibronic line. Since the report of Whiting etal.,20 numerous updates have been incorporated into Neqair, such as: using the latest version of the NISTatomic database (version 5.0),21 using the bound-free cross sections from TOPbase,15 incorporating the CO2
database from CDSD-4000,22 parallelization and improvements to the mechanics of QSS. The current releaseversion of Neqair is known as v14.0.23 The calculations in this paper use what will become the next releaseof Neqair, v15.0. This is due to Neqair v14.0 not including non-Boltzmann rates for states responsiblefor emission from N2 2nd Positive, N2 Birge-Hopfield 1 and high lying atomic lines. Prior to recent updates,recent versions of Neqair would subsequently treat these state populations as Boltzmann, resulting in largeover-predictions of these bands and lines. A preliminary non-Boltzmann model was therefore introduced forthe C3Π state for N2 2nd Positive, while the states responsible for N2 Birge-Hopfield 1 and atomic lines notincluded in non-Boltzmann were set to be in Boltzmann equilibrium (at Te) with a state with the closestenergy or orbital structure that is included in the non-Boltzmann model. These errors had been overlookedin previous studies since N2 has not been a major contributor to radiative heating at lunar or hyperbolicreturn conditions. The electronic excitation rates for N atoms in Neqair have been updated to those ofHuo.24 This paper will show comparisons with the rates of Huo,24 and the rates of Park20 as implementedin v14.0.
3 of 18
American Institute of Aeronautics and Astronautics
IV. Methodology
IV.A. CFD Simulations
A two-dimensional grid of a 3 m sphere with 803 grid points on the stagnation line was used in the Dplrsolutions, while a 2.5 m sphere with 256 points was used in the Laura solutions. Both simulations used an11-species (N2, O2, NO, NO+, N+
2 , O+2 , N, O, N+, O+, e−) gas model in the computations. In addition to
chemical nonequilibrium, the flow field was assumed to be in thermal nonequilibrium as well. Consequently,a two-temperature (T-Tv) model was used. In the two-temperature model employed, the translational androtational modes of the molecules are assumed to be in equilibrium (T=Ttrans=Trot), and are distinctfrom the vibrational and electronic modes of the molecules and the temperature of the free electrons (Tv
=Tvib=Telec=Te−).
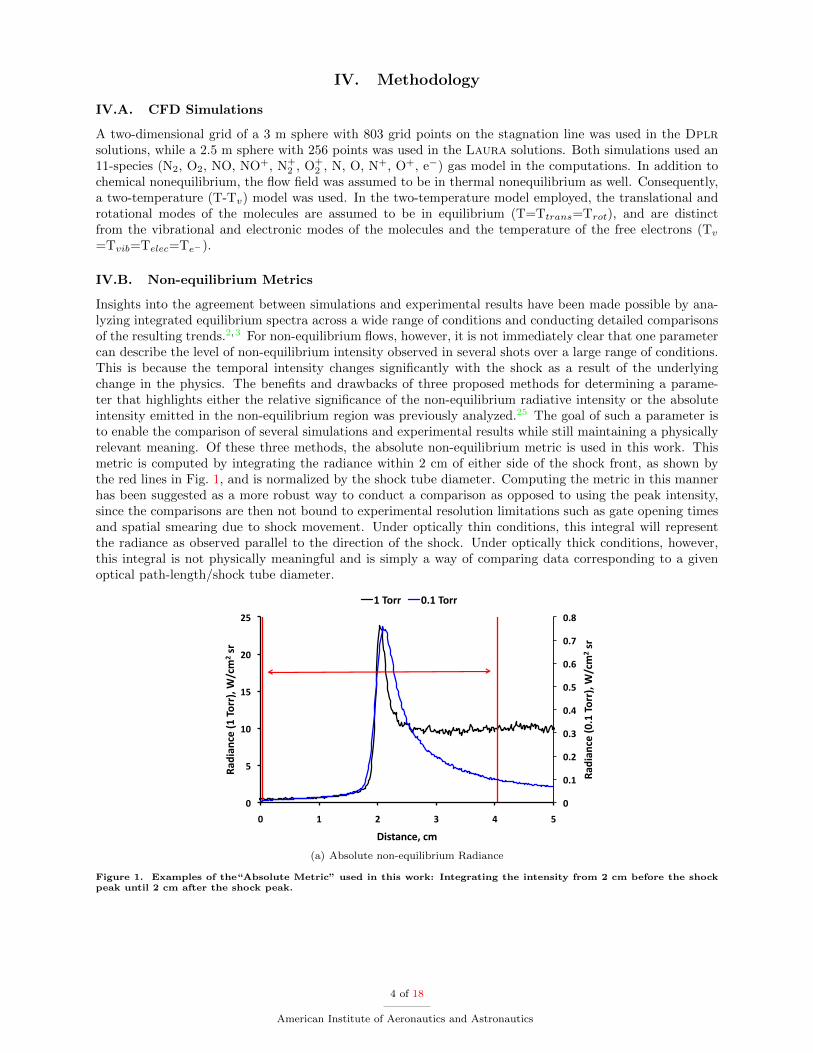
IV.B. Non-equilibrium Metrics
Insights into the agreement between simulations and experimental results have been made possible by ana-lyzing integrated equilibrium spectra across a wide range of conditions and conducting detailed comparisonsof the resulting trends.2,3 For non-equilibrium flows, however, it is not immediately clear that one parametercan describe the level of non-equilibrium intensity observed in several shots over a large range of conditions.This is because the temporal intensity changes significantly with the shock as a result of the underlyingchange in the physics. The benefits and drawbacks of three proposed methods for determining a parame-ter that highlights either the relative significance of the non-equilibrium radiative intensity or the absoluteintensity emitted in the non-equilibrium region was previously analyzed.25 The goal of such a parameter isto enable the comparison of several simulations and experimental results while still maintaining a physicallyrelevant meaning. Of these three methods, the absolute non-equilibrium metric is used in this work. Thismetric is computed by integrating the radiance within 2 cm of either side of the shock front, as shown bythe red lines in Fig. 1, and is normalized by the shock tube diameter. Computing the metric in this mannerhas been suggested as a more robust way to conduct a comparison as opposed to using the peak intensity,since the comparisons are then not bound to experimental resolution limitations such as gate opening timesand spatial smearing due to shock movement. Under optically thin conditions, this integral will representthe radiance as observed parallel to the direction of the shock. Under optically thick conditions, however,this integral is not physically meaningful and is simply a way of comparing data corresponding to a givenoptical path-length/shock tube diameter.
!"
!#$"
!#%"
!#&"
!#'"
!#("
!#)"
!#*"
!#+"
!"
("
$!"
$("
%!"
%("
!" $" %" &" '" ("
,-./-012"3!#$"456678"9
:1;
%"<6"
,-./-012"3$"456678"9
:1;
%"<6"
=/<>-0128"1;"
$"4566" !#$"4566"
(a) Absolute non-equilibrium Radiance
Figure 1. Examples of the“Absolute Metric” used in this work: Integrating the intensity from 2 cm before the shockpeak until 2 cm after the shock peak.
4 of 18
American Institute of Aeronautics and Astronautics
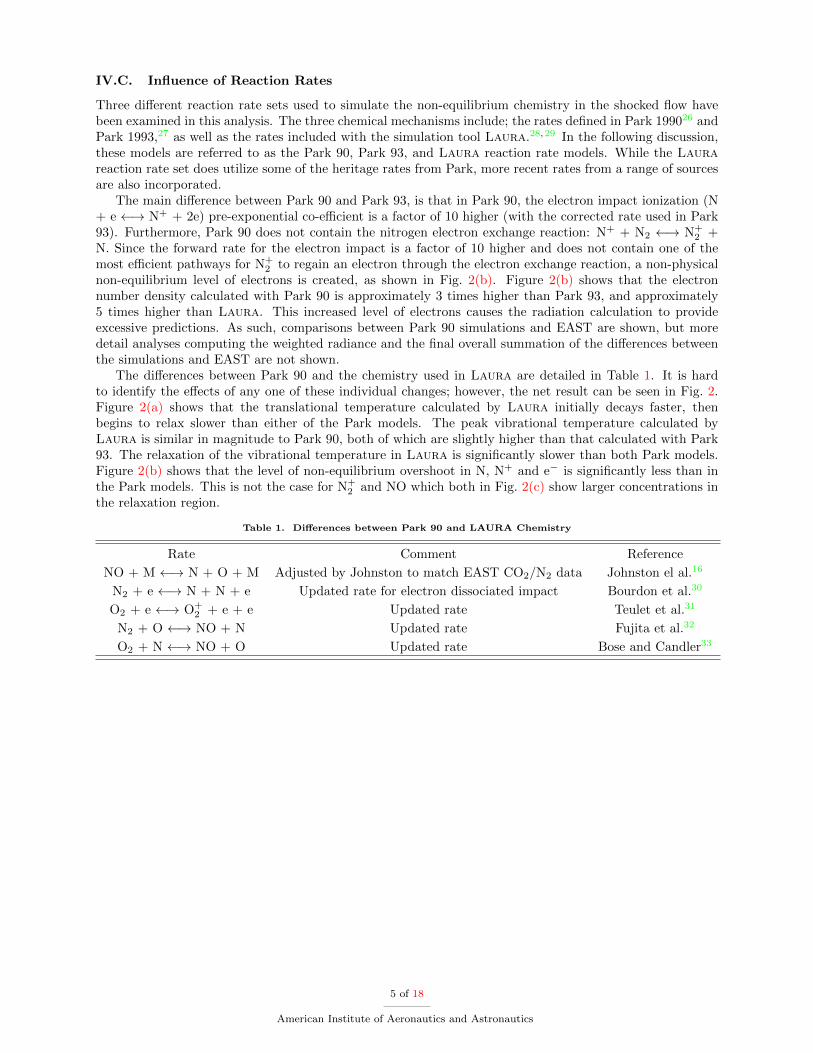
IV.C. Influence of Reaction Rates
Three different reaction rate sets used to simulate the non-equilibrium chemistry in the shocked flow havebeen examined in this analysis. The three chemical mechanisms include; the rates defined in Park 199026 andPark 1993,27 as well as the rates included with the simulation tool Laura.28,29 In the following discussion,these models are referred to as the Park 90, Park 93, and Laura reaction rate models. While the Laurareaction rate set does utilize some of the heritage rates from Park, more recent rates from a range of sourcesare also incorporated.
The main difference between Park 90 and Park 93, is that in Park 90, the electron impact ionization (N+ e ←→ N+ + 2e) pre-exponential co-efficient is a factor of 10 higher (with the corrected rate used in Park93). Furthermore, Park 90 does not contain the nitrogen electron exchange reaction: N+ + N2 ←→ N+
2 +N. Since the forward rate for the electron impact is a factor of 10 higher and does not contain one of themost efficient pathways for N+
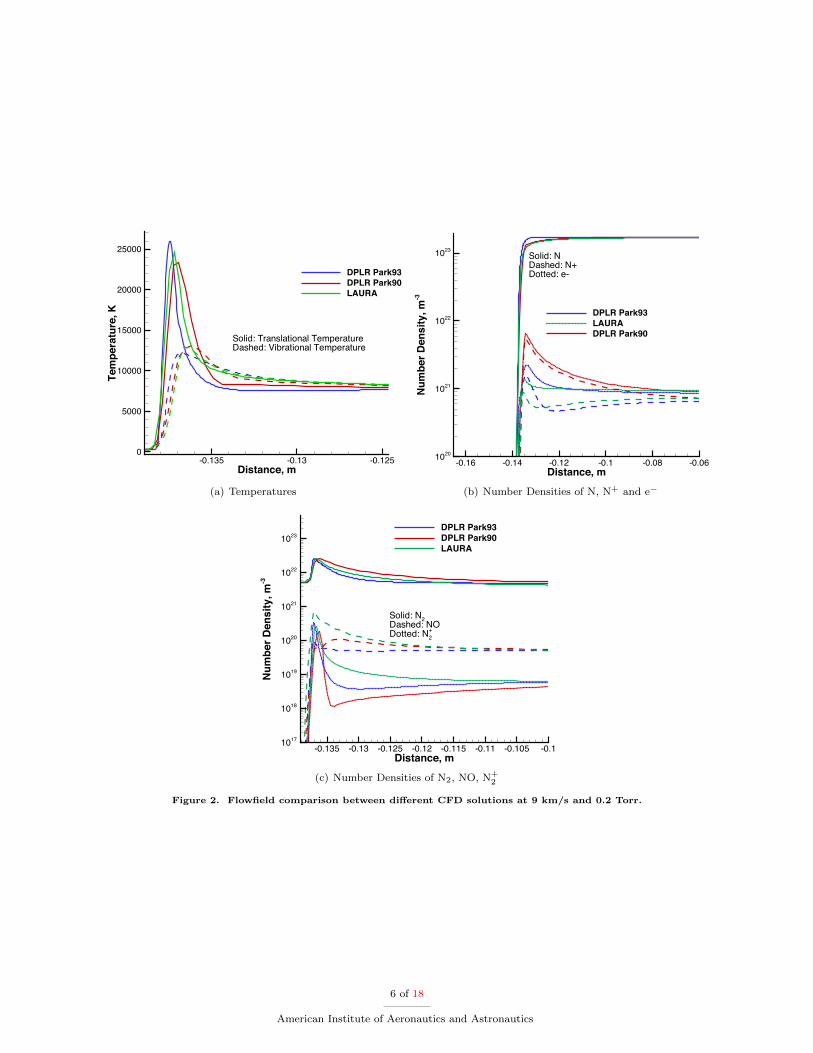
2 to regain an electron through the electron exchange reaction, a non-physicalnon-equilibrium level of electrons is created, as shown in Fig. 2(b). Figure 2(b) shows that the electronnumber density calculated with Park 90 is approximately 3 times higher than Park 93, and approximately5 times higher than Laura. This increased level of electrons causes the radiation calculation to provideexcessive predictions. As such, comparisons between Park 90 simulations and EAST are shown, but moredetail analyses computing the weighted radiance and the final overall summation of the differences betweenthe simulations and EAST are not shown.
The differences between Park 90 and the chemistry used in Laura are detailed in Table 1. It is hardto identify the effects of any one of these individual changes; however, the net result can be seen in Fig. 2.Figure 2(a) shows that the translational temperature calculated by Laura initially decays faster, thenbegins to relax slower than either of the Park models. The peak vibrational temperature calculated byLaura is similar in magnitude to Park 90, both of which are slightly higher than that calculated with Park93. The relaxation of the vibrational temperature in Laura is significantly slower than both Park models.Figure 2(b) shows that the level of non-equilibrium overshoot in N, N+ and e− is significantly less than inthe Park models. This is not the case for N+
2 and NO which both in Fig. 2(c) show larger concentrations inthe relaxation region.
Table 1. Differences between Park 90 and LAURA Chemistry
Rate Comment Reference
NO + M ←→ N + O + M Adjusted by Johnston to match EAST CO2/N2 data Johnston el al.16
N2 + e ←→ N + N + e Updated rate for electron dissociated impact Bourdon et al.30
O2 + e ←→ O+2 + e + e Updated rate Teulet et al.31
N2 + O ←→ NO + N Updated rate Fujita et al.32
O2 + N ←→ NO + O Updated rate Bose and Candler33
5 of 18
American Institute of Aeronautics and Astronautics
Distance, m
Tem
pera
ture
, K
-0.135 -0.13 -0.1250
5000
10000
15000
20000
25000
DPLR Park93DPLR Park90LAURA
Solid: Translational TemperatureDashed: Vibrational Temperature
(a) Temperatures
Distance, m
Num
ber D
ensi
ty, m
-3
-0.16 -0.14 -0.12 -0.1 -0.08 -0.061020
1021
1022
1023
DPLR Park93LAURADPLR Park90
Solid: NDashed: N+Dotted: e-
(b) Number Densities of N, N+ and e−
Distance, m
Num
ber D
ensi
ty, m
-3
-0.135 -0.13 -0.125 -0.12 -0.115 -0.11 -0.105 -0.11017
1018
1019
1020
1021
1022
1023DPLR Park93DPLR Park90LAURA
Solid: N2Dashed: NODotted: N2
+
(c) Number Densities of N2, NO, N+2
Figure 2. Flowfield comparison between different CFD solutions at 9 km/s and 0.2 Torr.
6 of 18
American Institute of Aeronautics and Astronautics
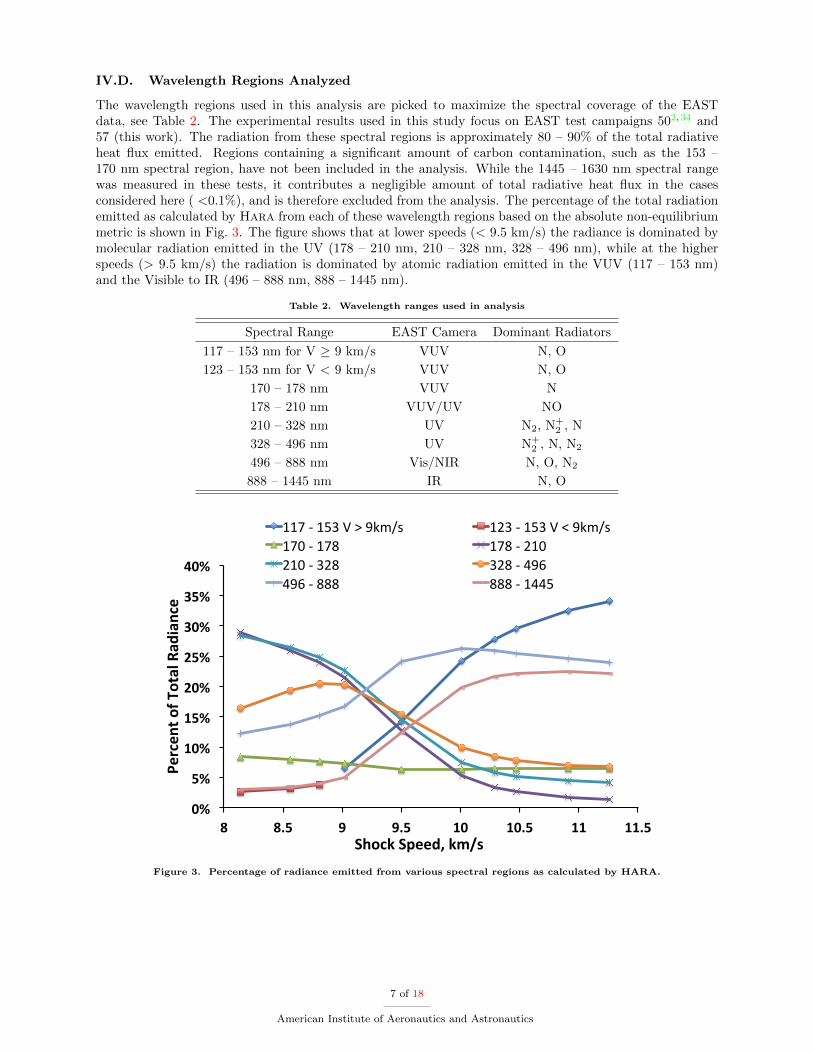
IV.D. Wavelength Regions Analyzed
The wavelength regions used in this analysis are picked to maximize the spectral coverage of the EASTdata, see Table 2. The experimental results used in this study focus on EAST test campaigns 502,34 and57 (this work). The radiation from these spectral regions is approximately 80 – 90% of the total radiativeheat flux emitted. Regions containing a significant amount of carbon contamination, such as the 153 –170 nm spectral region, have not been included in the analysis. While the 1445 – 1630 nm spectral rangewas measured in these tests, it contributes a negligible amount of total radiative heat flux in the casesconsidered here ( <0.1%), and is therefore excluded from the analysis. The percentage of the total radiationemitted as calculated by Hara from each of these wavelength regions based on the absolute non-equilibriummetric is shown in Fig. 3. The figure shows that at lower speeds (< 9.5 km/s) the radiance is dominated bymolecular radiation emitted in the UV (178 – 210 nm, 210 – 328 nm, 328 – 496 nm), while at the higherspeeds (> 9.5 km/s) the radiation is dominated by atomic radiation emitted in the VUV (117 – 153 nm)and the Visible to IR (496 – 888 nm, 888 – 1445 nm).
Table 2. Wavelength ranges used in analysis
Spectral Range EAST Camera Dominant Radiators
117 – 153 nm for V ≥ 9 km/s VUV N, O
123 – 153 nm for V < 9 km/s VUV N, O
170 – 178 nm VUV N
178 – 210 nm VUV/UV NO
210 – 328 nm UV N2, N+2 , N
328 – 496 nm UV N+2 , N, N2
496 – 888 nm Vis/NIR N, O, N2
888 – 1445 nm IR N, O
0%#
5%#
10%#
15%#
20%#
25%#
30%#
35%#
40%#
8# 8.5# 9# 9.5# 10# 10.5# 11# 11.5#
Percen
t#of#T
otal#Rad
iance#
Shock#Speed,#km/s#
117#$#153#V#>#9km/s# 123#$#153#V#<#9km/s#170#$#178# 178#$#210#210#$#328# 328#$#496#496#$#888# 888#$#1445#
Figure 3. Percentage of radiance emitted from various spectral regions as calculated by HARA.
7 of 18
American Institute of Aeronautics and Astronautics
V. Results
V.A. Simulations vs EAST
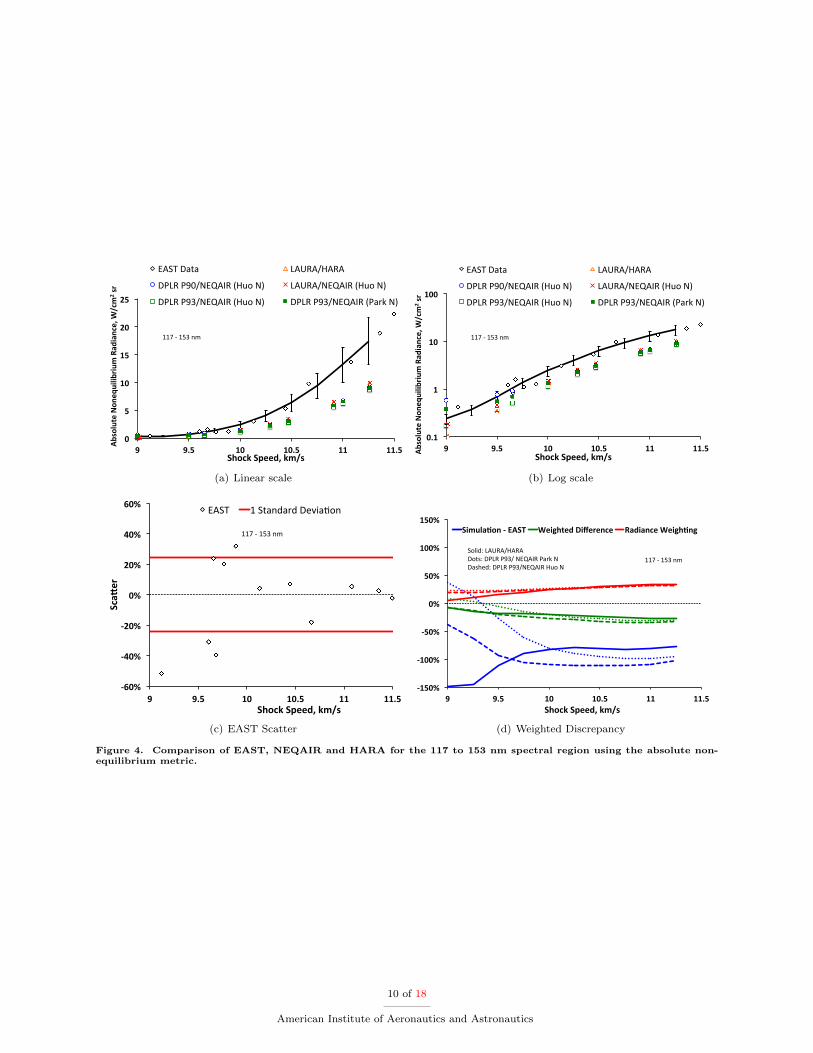
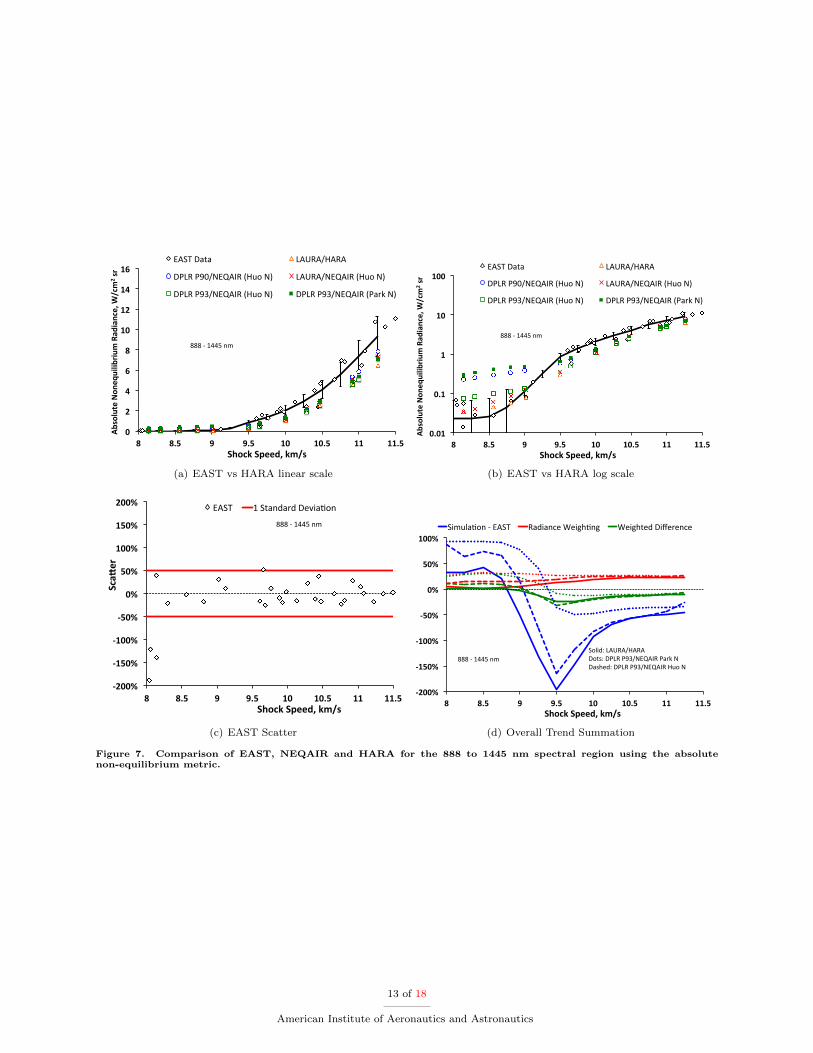
Using data from EAST tests 50 and 57, the absolute non-equilibrium metric is computed for the spectralregions listed in Table 2 and shown as a function of shock velocity in Figs. 4 – 7, with lines of best fitcreated. The same methodology was applied to results from Laura/Hara and Dplr/Neqair simulations.The results from this analysis are displayed in the same way for each spectral region as shown in Figs. 4 –7. The first and second figures in each set show the absolute non-equilibrium metric comparisons betweenEAST and the simulations on both linear and log scales. The third plot shows the scatter of the EAST dataaround the line of best fit. The standard deviation of the scatter is calculated and is used to estimate theuncertainty in the level of agreement between the EAST data and simulations. The standard deviation isshown in the figures as error bars on the line of best fit through the EAST data. Summing the standarddeviation over all spectral regions, weighted by the relative radiance measure in EAST for that specificregion vs the total radiance measured, provides an indication of the scatter in the EAST data for non-equilibrium. This calculation resulted in a one standard deviation scatter of 31%. Finally, the weighteddiscrepancy for each spectral range is shown. The “Simulation - EAST Discrepancy” line represents thedifference between either the Laura/Hara or Dplr/Neqair simulations and the line of best fit throughthe experimental data divided by the simulation result. The “Radiance Weighting” line represents thecontribution of that individual spectral region as a percentage of the total radiance emitted. The final resultfor each wavelength region is the “Weighted Discrepancy” line which is the relative difference between thesimulation and experiment multiplied by the percentage of contribution for that individual spectral regioncompared to the total radiance emitted, i.e. the “Simulation - EAST Discrepancy” line multiplied by the“Radiance Weighting” line.
Multiple scenarios are investigated when comparing the experimental results to the computed data;Laura/Hara, Laura/Neqair and Dplr/Neqair. The Dplr/Neqair simulations also have results fromdifferent chemistries, Park 90 and Park 93, and different electron impact Nitrogen excitation rates from eitherHuo24 (listed as “Huo N” in all figures) or Park20 (listed as “Park N” in all figures). Hara uses electronicimpact excitation rates for nitrogen compiled by Johnston et al,11,12 which include rates by Frost.35 Thesecombinations of calculations will help deduce whether differences between simulations and experiment aredue to flowfield issues (e.g. reaction rates, vibration-electron energy relaxation) or radiation modeling issues(non-Boltzmann modeling, spectral databases, excitation rates).
Radiance from atomic nitrogen and oxygen dominate the VUV spectral region, save for at lower shockspeeds where trace amounts of N2 and NO contribute. Figure 4 shows that there is generally a significantunder-prediction for all models and shock speeds. Laura/Hara under-predicts by as much as 150% around9 km/s, with an improving level of agreement with increasing shock speed, plateauing at approximately-80% from 10 km/s and above. The Dplr/Neqair solutions show a similar plateau level at the highershock speeds, but very different results for lower shock speeds. Given the substantianl difference betweenthe two Dplr/Neqair simulations and the differences between Laura/Hara and Laura/Neqair it isclear that these solutions are very sensitive to the flowfield, the electronic impact excitation rates, and thenon-Boltzmann modeling. The weighted difference between EAST and all models is within 12% at 9 km/sand increasing to an under-prediction of approximately 32% for the higher shock speeds. The reason forthe increase is predominantly due to the increasing contribution from the VUV to the total radiance asvelocity increases. This under-prediction in the VUV should be the focus of future experiments and modelvalidation/improvements.
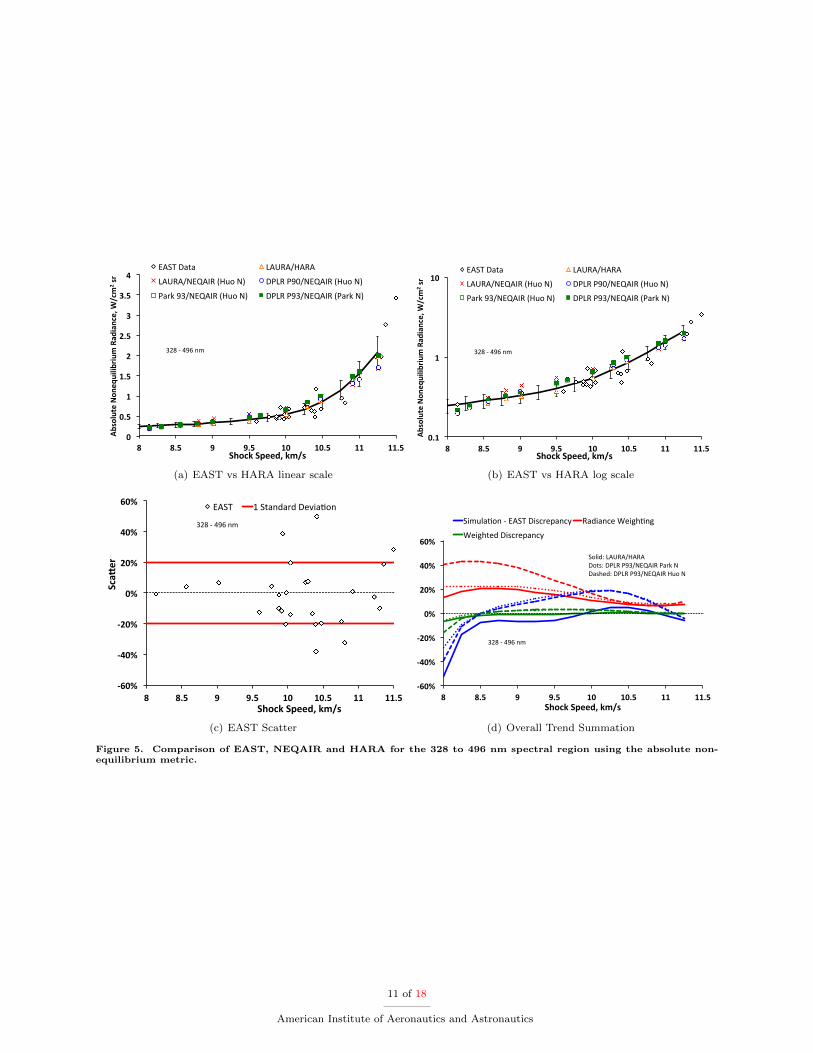
In the UV spectral region, 328 to 496 nm, N+2 first negative dominates, with small amounts of atomic
and molecular nitrogen depending on the shock speed. There is a significant under-prediction of approx-imately 30% to 50% at 9 km/s, see Fig. 5. The level of agreement between EAST and Laura/Haramonotonically improves with shock speed until approximately 10 km/s, after which there is excellent agree-ment with experiment (within 6%). This is likely due to the flow being closer to equilibrium at highershock speeds when the flow will equilibrate within 2 cm. Conversely, the Dplr/Neqair solutions show anover-prediction of approximately 20%. Due to the region being dominated by N+
2 first negative, there is nosignificant dependence on the choice of electron impact excitation rate. Furthermore, as the Laura/Haraand Laura/Neqair solutions give quite different answers, it can be established that in this wavelength rangethe non-Boltzmann modeling of N2 2nd Positive in the radiation code is the most sensitive parameter. Eventhough the Laura/Neqair results show an over-prediction between 8.5 and 10 km/s, both Laura/Hara
8 of 18
American Institute of Aeronautics and Astronautics
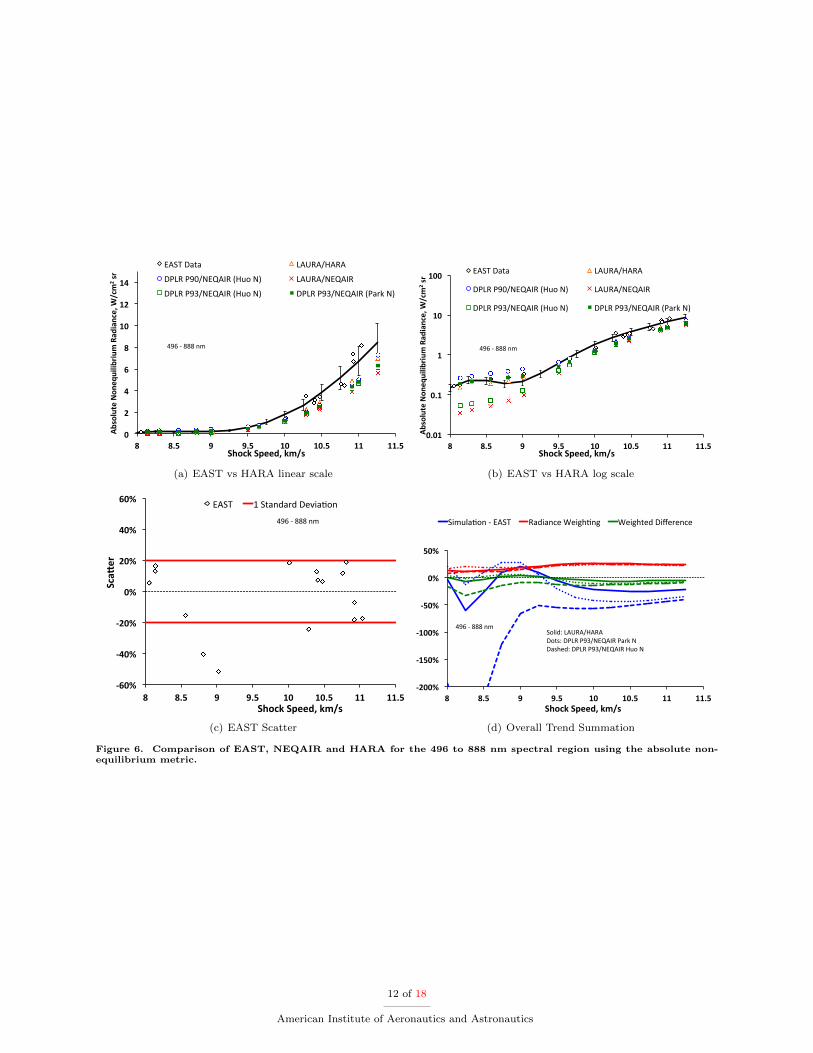
and Dplr/Neqair show excellent level of agreement for the UV spectral region.The Vis/NIR spectral region of 496 to 888 nm is dominated by atomic oxygen and nitrogen, as well as
N2 (in particular the 1st Positive transition) for the lower shock speed range. Figure 6 shows that for shockspeeds from 8 to approximately 9.5 km/s, there is a substantial difference between all the models. Thissuggests that the results are sensitive to the electron impact excitation rates, the radiation model for N2 1stPositive, and the flowfield generated by CFD. The level of agreement with Laura/Hara and Dplr/Neqairwith the electron impact excitation rates of Park20 is very good compared to EAST. However, when Neqairis run with the electron impact excitation rates of Huo,24 there is a significant under-prediction of the EASTresults at lower speed, by as much as 310%.
The IR spectral region of 888 to 1445 nm is dominated by atomic oxygen and nitrogen. Figure 7 shows thatall models over-predict the EAST result from 8 to 9 km/s, this is particularly true for the Dplr/Neqaircalculations with either Park 90 and Huo24 excitation rates or Park 93 and Park20 excitation rates. Allother models agree within approximately 25%. However, it should be noted that there is significant scatterin both the experimental data and the simulations at these lower speed conditions. Due to the differencesin the simulations, as shown in Fig. 7, it can be concluded that the radiance is very sensitive to the choiceof electron impact excitation rates. The maximum discrepancy of -200% occurs at 9.5 km/s with highervelocities showing improved agreement. This largest discrepancy is potentially due to the lack of EAST dataaround 9.5 km/s, and therefore may be a function of an ill-formed fit. Although this peak discrepancy isvery high, it occurs at a shock speed where the radiation is relatively low in this wavelength range, see 7(a).For higher speeds, all models agree within approximately 50%.
From the comparisons between Dplr/Neqair and EAST, the results indicate that better agreementis achieved with the electron impact excitation rates of Park20 for the VUV through to Vis/NIR spectralregions, while the rates of Huo24 provide better agreement in the IR. The rates of Huo24 should be ofhigher fidelity as they are based on ab initio calculations, so its unlikely that the rates of Park20 would bemore accurate for states contributing to the emission in the VUV through Red. As such, the poor level ofagreement obtained with the Huo24 excitation rates may be due to the way the different energy levels aregrouped together in Neqair’s non-Boltzmann formulation or might be due to the fact that many aspects ofthe radiation model have been tuned to match specific experiments or flight data while using the excitationrates of Park.
9 of 18
American Institute of Aeronautics and Astronautics
0"
5"
10"
15"
20"
25"
9" 9.5" 10" 10.5" 11" 11.5"
Absolute"Non
equilib
rium"Rad
iance,"W
/cm
2 "sr"
Shock"Speed,"km/s"
EAST%Data% LAURA/HARA%
DPLR%P90/NEQAIR%(Huo%N)% LAURA/NEQAIR%(Huo%N)%
DPLR%P93/NEQAIR%(Huo%N)% DPLR%P93/NEQAIR%(Park%N)%
117%=%153%nm%
(a) Linear scale
0.1$
1$
10$
100$
9$ 9.5$ 10$ 10.5$ 11$ 11.5$Absolute$Non
equilib
rium$Rad
iance,$W
/cm
2 $sr$
Shock$Speed,$km/s$
EAST%Data% LAURA/HARA%
DPLR%P90/NEQAIR%(Huo%N)% LAURA/NEQAIR%(Huo%N)%
DPLR%P93/NEQAIR%(Huo%N)% DPLR%P93/NEQAIR%(Park%N)%
117%=%153%nm%
(b) Log scale
!60%%
!40%%
!20%%
0%%
20%%
40%%
60%%
9% 9.5% 10% 10.5% 11% 11.5%
Sca/
er%
Shock%Speed,%km/s%
EAST% 1%Standard%Devia0on%
117%3%153%nm%
(c) EAST Scatter
!150%&
!100%&
!50%&
0%&
50%&
100%&
150%&
9& 9.5& 10& 10.5& 11& 11.5&Shock&Speed,&km/s&
Simula9on&!&EAST& Weighted&Difference& Radiance&Weigh9ng&
117#$#153#nm#Solid:#LAURA/HARA#Dots:#DPLR#P93/#NEQAIR#Park#N#Dashed:#DPLR#P93/NEQAIR#Huo#N#
(d) Weighted Discrepancy
Figure 4. Comparison of EAST, NEQAIR and HARA for the 117 to 153 nm spectral region using the absolute non-equilibrium metric.
10 of 18
American Institute of Aeronautics and Astronautics
0"
0.5"
1"
1.5"
2"
2.5"
3"
3.5"
4"
8" 8.5" 9" 9.5" 10" 10.5" 11" 11.5"
Absolute"Non
equilib
rium"Rad
iance,"W
/cm
2 "sr"
Shock"Speed,"km/s"
EAST%Data% LAURA/HARA%
LAURA/NEQAIR%(Huo%N)% DPLR%P90/NEQAIR%(Huo%N)%
Park%93/NEQAIR%(Huo%N)% DPLR%P93/NEQAIR%(Park%N)%
328%=%496%nm%
(a) EAST vs HARA linear scale
0.1$
1$
10$
8$ 8.5$ 9$ 9.5$ 10$ 10.5$ 11$ 11.5$
Absolute$Non
equilib
rium$Rad
iance,$W
/cm
2 $sr$
Shock$Speed,$km/s$
EAST%Data% LAURA/HARA%
LAURA/NEQAIR%(Huo%N)% DPLR%P90/NEQAIR%(Huo%N)%
Park%93/NEQAIR%(Huo%N)% DPLR%P93/NEQAIR%(Park%N)%
328%=%496%nm%
(b) EAST vs HARA log scale
!60%%
!40%%
!20%%
0%%
20%%
40%%
60%%
8% 8.5% 9% 9.5% 10% 10.5% 11% 11.5%
Sca0
er%
Shock%Speed,%km/s%
EAST% 1%Standard%Devia0on%
328%5%496%nm%
(c) EAST Scatter
!60%%
!40%%
!20%%
0%%
20%%
40%%
60%%
8% 8.5% 9% 9.5% 10% 10.5% 11% 11.5%Shock%Speed,%km/s%
Simula'on*+*EAST*Discrepancy* Radiance*Weigh'ng*
Weighted*Discrepancy*
328*+*496*nm*
Solid:*LAURA/HARA*Dots:*DPLR*P93/NEQAIR*Park*N*Dashed:*DPLR*P93/NEQAIR*Huo*N*
(d) Overall Trend Summation
Figure 5. Comparison of EAST, NEQAIR and HARA for the 328 to 496 nm spectral region using the absolute non-equilibrium metric.
11 of 18
American Institute of Aeronautics and Astronautics
0"
2"
4"
6"
8"
10"
12"
14"
8" 8.5" 9" 9.5" 10" 10.5" 11" 11.5"
Absolute"Non
equilib
rium"Rad
iance,"W
/cm
2 "sr"
Shock"Speed,"km/s"
EAST%Data% LAURA/HARA%
DPLR%P90/NEQAIR%(Huo%N)% LAURA/NEQAIR%
DPLR%P93/NEQAIR%(Huo%N)% DPLR%P93/NEQAIR%(Park%N)%
496%=%888%nm%
(a) EAST vs HARA linear scale
0.01$
0.1$
1$
10$
100$
8$ 8.5$ 9$ 9.5$ 10$ 10.5$ 11$ 11.5$
Absolute$Non
equilib
rium$Rad
iance,$W
/cm
2 $sr$
Shock$Speed,$km/s$
EAST%Data% LAURA/HARA%
DPLR%P90/NEQAIR%(Huo%N)% LAURA/NEQAIR%
DPLR%P93/NEQAIR%(Huo%N)% DPLR%P93/NEQAIR%(Park%N)%
496%=%888%nm%
(b) EAST vs HARA log scale
!60%%
!40%%
!20%%
0%%
20%%
40%%
60%%
8% 8.5% 9% 9.5% 10% 10.5% 11% 11.5%
Sca0
er%
Shock%Speed,%km/s%
EAST% 1%Standard%Devia0on%
496%5%888%nm%
(c) EAST Scatter
!200%%
!150%%
!100%%
!50%%
0%%
50%%
8% 8.5% 9% 9.5% 10% 10.5% 11% 11.5%Shock%Speed,%km/s%
Simula'on*+*EAST* Radiance*Weigh'ng* Weighted*Difference*
496*+*888*nm*Solid:*LAURA/HARA*Dots:*DPLR*P93/NEQAIR*Park*N*Dashed:*DPLR*P93/NEQAIR*Huo*N*
(d) Overall Trend Summation
Figure 6. Comparison of EAST, NEQAIR and HARA for the 496 to 888 nm spectral region using the absolute non-equilibrium metric.
12 of 18
American Institute of Aeronautics and Astronautics
0"
2"
4"
6"
8"
10"
12"
14"
16"
8" 8.5" 9" 9.5" 10" 10.5" 11" 11.5"
Absolute"Non
equilib
rium"Rad
iance,"W
/cm
2 "sr"
Shock"Speed,"km/s"
EAST%Data% LAURA/HARA%
DPLR%P90/NEQAIR%(Huo%N)% LAURA/NEQAIR%(Huo%N)%
DPLR%P93/NEQAIR%(Huo%N)% DPLR%P93/NEQAIR%(Park%N)%
888%<%1445%nm%
(a) EAST vs HARA linear scale
0.01$
0.1$
1$
10$
100$
8$ 8.5$ 9$ 9.5$ 10$ 10.5$ 11$ 11.5$
Absolute$Non
equilib
rium$Rad
iance,$W
/cm
2 $sr$
Shock$Speed,$km/s$
EAST%Data% LAURA/HARA%
DPLR%P90/NEQAIR%(Huo%N)% LAURA/NEQAIR%(Huo%N)%
DPLR%P93/NEQAIR%(Huo%N)% DPLR%P93/NEQAIR%(Park%N)%
888%<%1445%nm%
(b) EAST vs HARA log scale
!200%%
!150%%
!100%%
!50%%
0%%
50%%
100%%
150%%
200%%
8% 8.5% 9% 9.5% 10% 10.5% 11% 11.5%
Sca.
er%
Shock%Speed,%km/s%
EAST% 1%Standard%Devia0on%
888%3%1445%nm%
(c) EAST Scatter
!200%%
!150%%
!100%%
!50%%
0%%
50%%
100%%
8% 8.5% 9% 9.5% 10% 10.5% 11% 11.5%Shock%Speed,%km/s%
Simula'on*+*EAST* Radiance*Weigh'ng* Weighted*Difference*
888*+*1445*nm*Solid:*LAURA/HARA*Dots:*DPLR*P93/NEQAIR*Park*N*Dashed:*DPLR*P93/NEQAIR*Huo*N*
(d) Overall Trend Summation
Figure 7. Comparison of EAST, NEQAIR and HARA for the 888 to 1445 nm spectral region using the absolutenon-equilibrium metric.
13 of 18
American Institute of Aeronautics and Astronautics
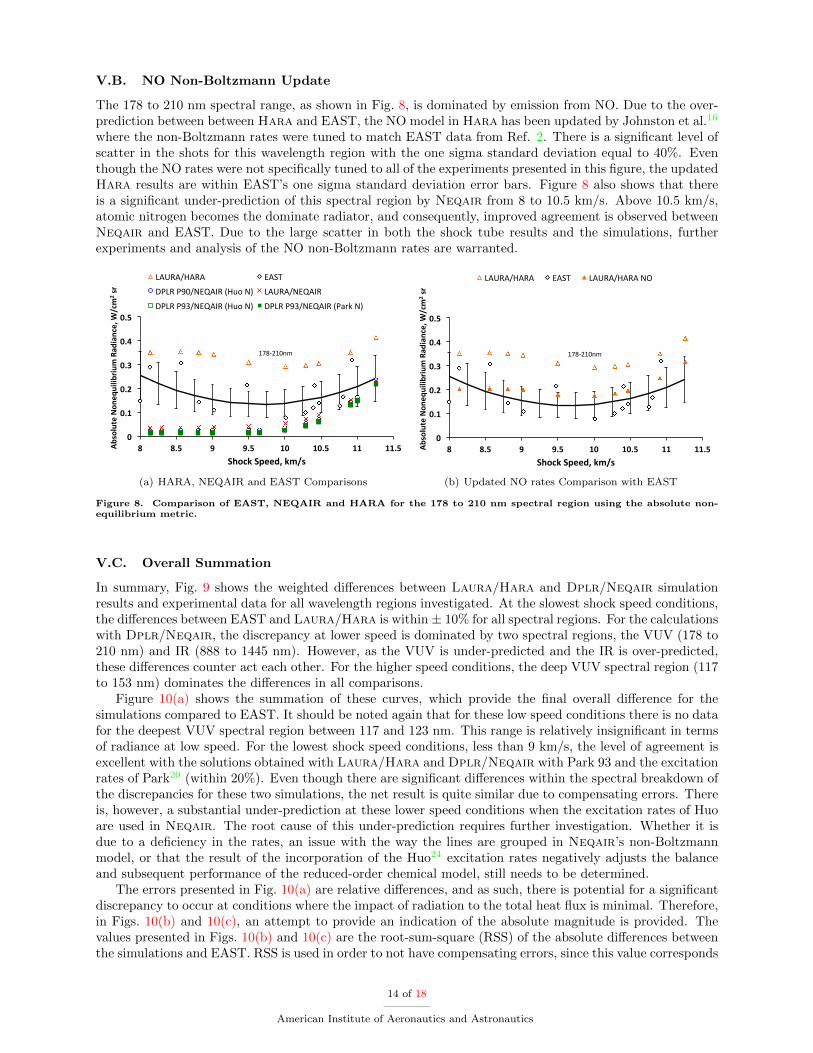
V.B. NO Non-Boltzmann Update
The 178 to 210 nm spectral range, as shown in Fig. 8, is dominated by emission from NO. Due to the over-prediction between between Hara and EAST, the NO model in Hara has been updated by Johnston et al.16
where the non-Boltzmann rates were tuned to match EAST data from Ref. 2. There is a significant level ofscatter in the shots for this wavelength region with the one sigma standard deviation equal to 40%. Eventhough the NO rates were not specifically tuned to all of the experiments presented in this figure, the updatedHara results are within EAST’s one sigma standard deviation error bars. Figure 8 also shows that thereis a significant under-prediction of this spectral region by Neqair from 8 to 10.5 km/s. Above 10.5 km/s,atomic nitrogen becomes the dominate radiator, and consequently, improved agreement is observed betweenNeqair and EAST. Due to the large scatter in both the shock tube results and the simulations, furtherexperiments and analysis of the NO non-Boltzmann rates are warranted.
0"
0.1"
0.2"
0.3"
0.4"
0.5"
8" 8.5" 9" 9.5" 10" 10.5" 11" 11.5"Absolute"Non
equilib
rium"Rad
iance,"W
/cm
2 "sr"
Shock"Speed,"km/s"
LAURA/HARA' EAST'
DPLR'P90/NEQAIR'(Huo'N)' LAURA/NEQAIR'
DPLR'P93/NEQAIR'(Huo'N)' DPLR'P93/NEQAIR'(Park'N)'
178=210nm'
(a) HARA, NEQAIR and EAST Comparisons
0"
0.1"
0.2"
0.3"
0.4"
0.5"
8" 8.5" 9" 9.5" 10" 10.5" 11" 11.5"Absolute"Non
equilib
rium"Rad
iance,"W
/cm
2 "sr"
Shock"Speed,"km/s"
LAURA/HARA' EAST' LAURA/HARA'NO'
1780210nm'
(b) Updated NO rates Comparison with EAST
Figure 8. Comparison of EAST, NEQAIR and HARA for the 178 to 210 nm spectral region using the absolute non-equilibrium metric.
V.C. Overall Summation
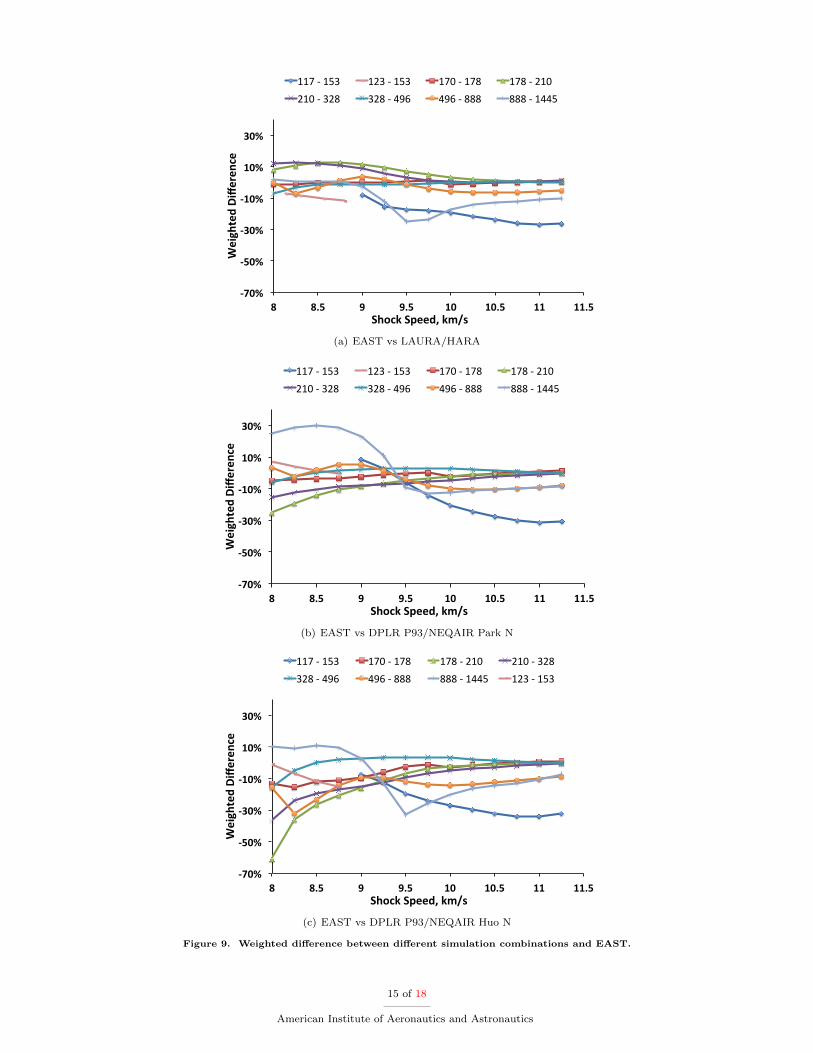
In summary, Fig. 9 shows the weighted differences between Laura/Hara and Dplr/Neqair simulationresults and experimental data for all wavelength regions investigated. At the slowest shock speed conditions,the differences between EAST and Laura/Hara is within ± 10% for all spectral regions. For the calculationswith Dplr/Neqair, the discrepancy at lower speed is dominated by two spectral regions, the VUV (178 to210 nm) and IR (888 to 1445 nm). However, as the VUV is under-predicted and the IR is over-predicted,these differences counter act each other. For the higher speed conditions, the deep VUV spectral region (117to 153 nm) dominates the differences in all comparisons.
Figure 10(a) shows the summation of these curves, which provide the final overall difference for thesimulations compared to EAST. It should be noted again that for these low speed conditions there is no datafor the deepest VUV spectral region between 117 and 123 nm. This range is relatively insignificant in termsof radiance at low speed. For the lowest shock speed conditions, less than 9 km/s, the level of agreement isexcellent with the solutions obtained with Laura/Hara and Dplr/Neqair with Park 93 and the excitationrates of Park20 (within 20%). Even though there are significant differences within the spectral breakdown ofthe discrepancies for these two simulations, the net result is quite similar due to compensating errors. Thereis, however, a substantial under-prediction at these lower speed conditions when the excitation rates of Huoare used in Neqair. The root cause of this under-prediction requires further investigation. Whether it isdue to a deficiency in the rates, an issue with the way the lines are grouped in Neqair’s non-Boltzmannmodel, or that the result of the incorporation of the Huo24 excitation rates negatively adjusts the balanceand subsequent performance of the reduced-order chemical model, still needs to be determined.
The errors presented in Fig. 10(a) are relative differences, and as such, there is potential for a significantdiscrepancy to occur at conditions where the impact of radiation to the total heat flux is minimal. Therefore,in Figs. 10(b) and 10(c), an attempt to provide an indication of the absolute magnitude is provided. Thevalues presented in Figs. 10(b) and 10(c) are the root-sum-square (RSS) of the absolute differences betweenthe simulations and EAST. RSS is used in order to not have compensating errors, since this value corresponds
14 of 18
American Institute of Aeronautics and Astronautics
!70%%
!50%%
!30%%
!10%%
10%%
30%%
8% 8.5% 9% 9.5% 10% 10.5% 11% 11.5%
Weighted%Diffe
rence%
Shock%Speed,%km/s%
117#$#153# 123#$#153# 170#$#178# 178#$#210#210#$#328# 328#$#496# 496#$#888# 888#$#1445#
(a) EAST vs LAURA/HARA
!70%%
!50%%
!30%%
!10%%
10%%
30%%
8% 8.5% 9% 9.5% 10% 10.5% 11% 11.5%
Weighted%Diffe
rence%
Shock%Speed,%km/s%
117#$#153# 123#$#153# 170#$#178# 178#$#210#210#$#328# 328#$#496# 496#$#888# 888#$#1445#
(b) EAST vs DPLR P93/NEQAIR Park N
!70%%
!50%%
!30%%
!10%%
10%%
30%%
8% 8.5% 9% 9.5% 10% 10.5% 11% 11.5%
Weighted%Diffe
rence%
Shock%Speed,%km/s%
117#$#153# 170#$#178# 178#$#210# 210#$#328#328#$#496# 496#$#888# 888#$#1445# 123#$#153#
(c) EAST vs DPLR P93/NEQAIR Huo N
Figure 9. Weighted difference between different simulation combinations and EAST.
15 of 18
American Institute of Aeronautics and Astronautics
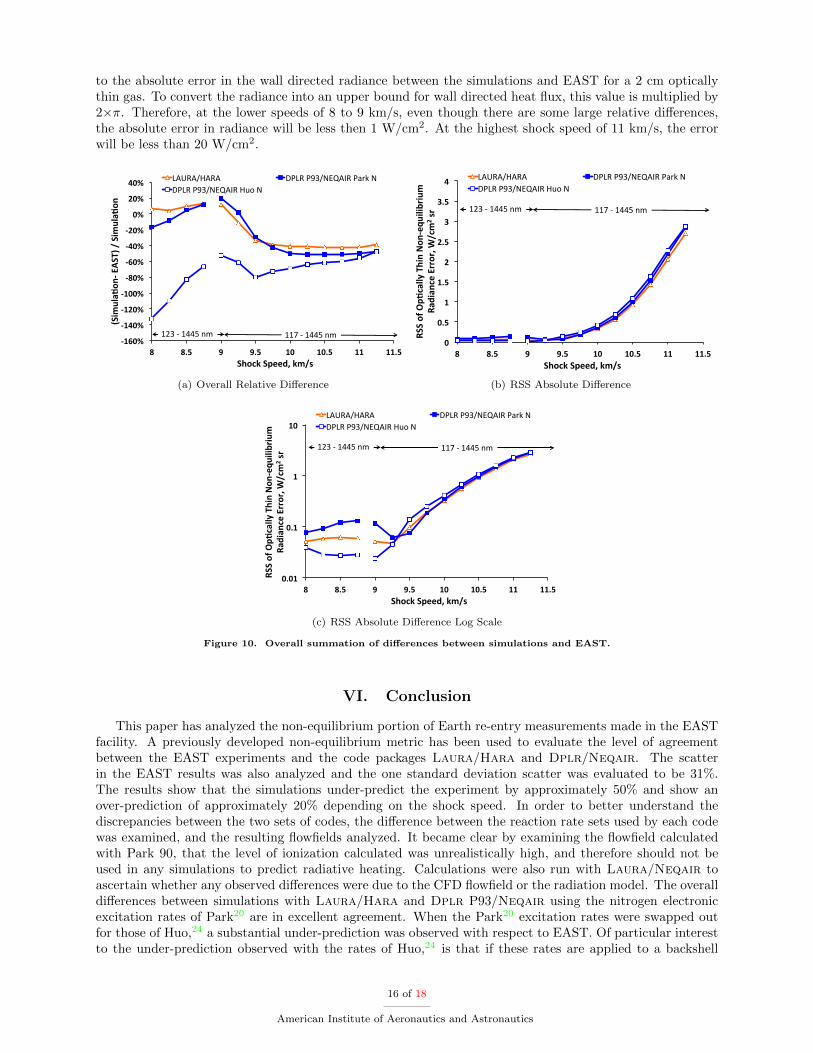
to the absolute error in the wall directed radiance between the simulations and EAST for a 2 cm opticallythin gas. To convert the radiance into an upper bound for wall directed heat flux, this value is multiplied by2×π. Therefore, at the lower speeds of 8 to 9 km/s, even though there are some large relative differences,the absolute error in radiance will be less then 1 W/cm2. At the highest shock speed of 11 km/s, the errorwill be less than 20 W/cm2.
!160%&
!140%&
!120%&
!100%&
!80%&
!60%&
!40%&
!20%&
0%&
20%&
40%&
8& 8.5& 9& 9.5& 10& 10.5& 11& 11.5&
(Sim
ula4
on!&E
AST)&/&Sim
ula4
on&
Shock&Speed,&km/s&
LAURA/HARA' DPLR'P93/NEQAIR'Park'N'DPLR'P93/NEQAIR'Huo'N'
123'7'1445'nm' 117'7'1445'nm'
(a) Overall Relative Difference
0"
0.5"
1"
1.5"
2"
2.5"
3"
3.5"
4"
8" 8.5" 9" 9.5" 10" 10.5" 11" 11.5"
RSS"of"Op1
cally"Thin"Non
;equ
ilibrium"
Radian
ce"Error,"W
/cm
2 "sr"
Shock"Speed,"km/s"
LAURA/HARA' DPLR'P93/NEQAIR'Park'N'DPLR'P93/NEQAIR'Huo'N'
123'7'1445'nm' 117'7'1445'nm'
(b) RSS Absolute Difference
0.01$
0.1$
1$
10$
8$ 8.5$ 9$ 9.5$ 10$ 10.5$ 11$ 11.5$
RSS$of$Op.
cally$Thin$Non
8equ
ilibrium$
Radian
ce$Error,$W
/cm
2 $sr$
Shock$Speed,$km/s$
LAURA/HARA' DPLR'P93/NEQAIR'Park'N'DPLR'P93/NEQAIR'Huo'N'
123'7'1445'nm' 117'7'1445'nm'
(c) RSS Absolute Difference Log Scale
Figure 10. Overall summation of differences between simulations and EAST.
VI. Conclusion
This paper has analyzed the non-equilibrium portion of Earth re-entry measurements made in the EASTfacility. A previously developed non-equilibrium metric has been used to evaluate the level of agreementbetween the EAST experiments and the code packages Laura/Hara and Dplr/Neqair. The scatterin the EAST results was also analyzed and the one standard deviation scatter was evaluated to be 31%.The results show that the simulations under-predict the experiment by approximately 50% and show anover-prediction of approximately 20% depending on the shock speed. In order to better understand thediscrepancies between the two sets of codes, the difference between the reaction rate sets used by each codewas examined, and the resulting flowfields analyzed. It became clear by examining the flowfield calculatedwith Park 90, that the level of ionization calculated was unrealistically high, and therefore should not beused in any simulations to predict radiative heating. Calculations were also run with Laura/Neqair toascertain whether any observed differences were due to the CFD flowfield or the radiation model. The overalldifferences between simulations with Laura/Hara and Dplr P93/Neqair using the nitrogen electronicexcitation rates of Park20 are in excellent agreement. When the Park20 excitation rates were swapped outfor those of Huo,24 a substantial under-prediction was observed with respect to EAST. Of particular interestto the under-prediction observed with the rates of Huo,24 is that if these rates are applied to a backshell
16 of 18
American Institute of Aeronautics and Astronautics
case where the flow is expanding, the rates of Huo24 would provide a substantial over-prediction.For increased clarity of the comparisons between the simulations and EAST, a breakdown of the compar-
isons by different spectral regions has been presented. This has highlighted where different spectral regions,and therefore which transitions, need to be the focus of further work. These include spectral regions thatare dominated by N2, N+
2 and NO as well the observed under-prediction in the VUV. To this extent, aninitial comparison was conducted with an updated NO non-Boltzmann model developed in Hara, whereimproved agreement was observed with EAST. Future analysis between the simulations and EAST wouldneed to focus on more detailed spatial comparisons of the radiance and comparisons of the spectral radiance.Furthermore, the framework for running radiation calculations for flight cases should be revisited based onthe results presented in this paper.
Acknowledgments
The authors would like to thank NASA’s Entry Systems Modeling project for their support of this work.Drs Aaron Brandis and Brett Cruden are supported through the NNA15BB15C contract between NASAAmes Research Center and AMA Inc. The authors would like to thank Drs. Joseph Schulz and MichaelBarnhardt for the help setting up the Dplr solutions. The authors would also like to thank Drs. JosephSchulz and Grant Palmer for their technical review of this work.
References
1Cozmuta, I., Wright, M., Laub, B., and Wilcoxson, W., “Defining Ablative Thermal Protection System Margins forPlanetary Entry Vehicles,” 42nd AIAA Thermophysics Conference, Honolulu, HI, 2011, AIAA-2011-3757.
2Brandis, A., Johnston, C., Cruden, B., Prabhu, D., and Bose, D., “Uncertainty Analysis and Validation of RadiationMeasurements for Earth Re-Entry,” Journal of Thermophysics and Heat Transfer , Vol. 29, No. 2, 2015, pp. 209–221.
3Brandis, A., Johnston, C., Cruden, B., and Prabhu, D., “Validation of High Speed Earth Atmospheric Entry RadiativeHeating from 9.5 to 15.5 km/s,” AIAA, Vol. AIAA 2012-2865, New Orleans, Louisiana, June 2012.
4Cruden, B., Martinez, R., Grinstead, J., and Olejniczak, J., “Simultaneous Vacuum-Ultraviolet Through Near-IR Ab-solute Radiation Measurement with Spatiotemporal Resolution in An Electric Arc Shock Tube,” 41st AIAA ThermophysicsConference, San Antonio, Texas, 2009, AIAA-2009-4240.
5Cruden, B., “Absolute Radiation Measurements in Earth and Mars Entry Condition,” Radiation and Gas-Surface Inter-action Phenomena in High-Speed Re-Entry, Vol. Von Karman Institute Lecture Series, 2014.
6Cruden, B. and Johnston, C., “Characterization of EFT-1 Radiative Heating and Radiometer Data,” 46th AIAA Ther-mophysics Conference, Washington, D.C., 2016, AIAA-2016-xxxx.
7Mazaheri, A., Gnoffo, P., Johnston, C., and Kleb, B., “LAURA Users Manual,” Tech. Rep. NASA TM 2010-216836,2010.
8Gnoffo, P., Gupta, R., and Shinn, J., “Conservation equations and physical models for hypersonic air flows in thermaland chemical nonequilibrium,” Tech. Rep. NASA TP-2867, 1989.
9Roe, P., “Approximate Riemann Solvers, Parameter Vectors, and Difference Schemes,” Journal of Computational Physics,Vol. 43, No. 2, 1981, pp. 357–372.
10Yee, H., “On Symmetric and Upwind TVD Schemes,” Tech. Rep. NASA TM-88325, 1986.11Johnston, C., Hollis, B., and Sutton, K., “Spectrum Modeling for Air Shock-Layer Radiation at Lunar-Return Condi-
tions,” Journal of Spacecraft and Rockets, Vol. 45, No. 5, 2008, pp. 865–878.12Johnston, C. O., Hollis, B., and Sutton, K., “Non-Boltzmann Modeling for Air Shock Layers at Lunar Return Conditions,”
Journal of Spacecraft and Rockets, Sep.-Oct. 2008.13Ralchenko, Y., “NIST Atomic Spectra Database, Version 3.1.0,” physics.nist.gov/PhysRefData/ASD/, July 2006, last
accessed September 3rd, 2007.14The Opacity Project Team, The Opacity Project , Vol. 1, Bristol and Philadelphia: Institute of Physics Publishing, 1995.15Cunto, W., Mendoza, C., Ochsenbein, F., and Zeippen, C., “TOPbase at the CDS,” Astronomy and Astrophysics,
Vol. 275, Aug. 1993, pp. L5–L8, see also http://cdsweb.u-strasbg.fr/topbase/topbase.html.16Johnston, C., Brandis, A., and Panesi, M., “Refinements to Afterbody Radiative Heating Simulations for Earth Entry,”
46th AIAA Thermophysics Conference, Washington, D.C., 2016.17Wright, M., A Family of Data-Parallel Relaxation Methods for the Navier-Stokes Equations, Ph.D. thesis, University of
Minnesota, 1997.18Wright, M., Candler, G., and Bose, D., “Data-Parallel Line Relaxation Method for the Navier-Stokes Equations,” AIAA
Journal , Vol. 36, No. 9, 1998, pp. 1603–1609.19Wright, M., White, T., and Mangini, N., “Data-Parallel Line Relaxation (DPLR) Code User Manual Acadia-Version
4.01.1,” NASA/TM-2009-215388, NASA Ames Research Center, October 2009.20Whiting, E., Park, C., Yen, L., Arnold, J., and Paterson, J., “NEQAIR96, Nonequilibrium and Equilibrium Radiative
Transport and Spectra Program: User’s Manual,” Technical Report NASA RP-1389, Ames Research Center, Moffett Field,Moffett Field, 1996.
17 of 18
American Institute of Aeronautics and Astronautics
21Kramida, A., Ralchenko, Y., Reader, J., and Team, N. A., “NIST Atomic Spectra Database, Version 5.0.0,”physics.nist.gov/asd/, July 2012, last accessed July, 2012.
22Tashkun, S. and Perevalov, V., “CDSD-4000: High-Resolution, High-Temperature Carbon Dioxide Spectroscopic Data-bank,” Journal of Quantitative Spectroscopy and Radiative Transfer , Vol. 112, No. 9, 2011, pp. 1403–1410.
23Cruden, B. and Brandis, A., “Updates to the NEQAIR Radiation Solver,” St. Andrews, Scotland, November 2014.24Huo, W., Liu, Y., Panesi, M., Munafo, A., Wray, A., and Carbon, D., “Electron-Impact Excitation Cross Sections for
Modeling Non-Equilibrium Gas,” Proceedings of the 53rd AIAA Aerospace Sciences Meeting and Exhibition, 2008 , Proceedingsof the 53rd AIAA Aerospace Sciences Meeting and Exhibition, 2008, AIAA, Kissimmee, Florida, 2015.
25Brandis, A., Johnston, C., Cruden, B., and Prabhu, D., “Investigation of Nonequilibrium Radiation for Mars Entry,”51st AIAA Aerospace Sciences Meeting, Grapevine, Texas, 2013, AIAA-2013-1055.
26Park, C., Nonequilibrium hypersonic aerothermodynamics, Wiley, New York, 1990.27Park, C., “Review of chemical-kinetic problems for future NASA missions, I. Earth entries,” Journal of Thermophysics
and Heat Transfer , Vol. 7, 1993, pp. 385–398.28Johnston, C., Mazaheri, A., Gnoffo, P., Kleb, B., and Bose, D., “Radiative Heating Uncertainty for Hyperbolic Earth
Entry, Part 1: Flight Simulation Modeling and Uncertainty,” Journal of Spacecraft and Rockets, Vol. 50, No. 1, 2013, pp. 19–38.29Johnston, C., Brandis, A., , Panesi, M., and Sutton, K., “Shock Layer Radiation Modeling and Uncertainty for Mars
Entry,” AIAA, Vol. AIAA 2012-2866, New Orleans, Louisiana, June 2012.30Bourdon, A. and Vervisch, P., “Electron-Vibration Energy Exchange Models in Nitrogen Plasma Flows,” Physical Review
E , Vol. 55, No. 4, 1997, pp. 4634–4641.31Teulet, P., Gonzalez, J., Mercado-Cabrera, A., Cressault, Y., and Gleizes, A., “One-dimensional hydro-kinetic modelling
of the decaying arc in air-PA66-copper mixtures: I. Chemical kinetics, thermodynamics, transport and radiative properties,”Journal of Physics D: Applied Physics, Vol. 42, 2009.
32Fujita, K., Yamada, T., and Ishii, N., “Impacts of Ablation Gas Kinetics on Hyperbolic Entry Radiative Heating,” 44thAIAA Aerospace Sciences Meeting and Exhibit , Reno, Nevada, 2006, AIAA-2006-1185.
33Bose, D. and Candler, G., “Thermal nonequilibrium rates of the Zeldovich reactions,” AIAA, Reno, Nevada, January1997, AIAA 1997-0133.
34Cruden, B., “Electron Density Measurement in Re-entry Shocks for Lunar Return,” Journal of Thermophysics and HeatTransfer , Vol. 26, 2012, pp. 222–230.
35Frost, R., Awakowicz, P., Summers, H. P., and Badnell, N., “Calculated Cross Sections and Measured Rate Coefficientsfor Electron-Impact Excitation of Neutral and Singly Ionized Nitrogen,” Journal of Applied Physics, Vol. 84, No. 6, 1998,pp. 2989–3003.
18 of 18
American Institute of Aeronautics and Astronautics