Embed Size (px)
Citation preview

Journal of Membrane Science, 42 (1969) 27-45
Elsevier Science Publishers B.V., Amsterdam - Printed in The Netherlands 27
INVESTIGATION OF LIQUID-LIQUID DEMIXING AND AGGREGATE FORMATION IN A MEMBRANE-FORMING SYSTEM BY MEANS OF PULSE-INDUCED CRITICAL SCATTERING (PICS)
J.A. RONNER, S. GROOT WASSINK and CA. SMOLDERS
Twente University, Department of Chemical Technology, P.O. Box 217, NL-7500 AE Enschede
(The Netherlands)
(Received June 26,1987; accepted in revised form March 8, 1988)
Summary
Phase separation phenomena in the quasi-ternary system cellulose acetate (CA)/dioxane/water, used as a typical system in the preparation of polymeric membranes for ultrafiltration and reverse osmosis applications, were investigated by means of pulse-induced critical scattering (PICS). Both the cloud point curve and spinodal curve were determined for CA concentrations up to 20% (w/w). The influence of maleic acid (used as an additive in order to improve the membrane performance) on the position of the binodal and spinodal curves and the demixing kinetics were investigated.
Introduction
In the development of membrane filtration processes, such as ultrafiltration (UF) and reverse osmosis (RO), the introduction of the phase inversion pro- cess by Loeb and Sourirajan [l] for the preparation of polymeric membranes has been an important contribution.
Basically, the starting point for membrane preparation, according to the phase inversion principle, is a quasi-ternary system, consisting of the polymer, a solvent and a nonsolvent. Because in most cases the polymer component shows a certain molecular weight distribution, it is generally not possible to consider the system as being truly ternary. Moreover, to improve the perform- ance or the mechanical properties of the membrane it is often necessary to use additives. Thus, in the preparation of polymeric membranes in practice mul- ticomponent systems are used.
During the phase inversion process a homogeneous polymer solution, cast as a film on a flat support, is immersed in a nonsolvent bath. The polymer solution may also be spun as a hollow fiber, of which the inside and/or the outside surface is contacted with nonsolvent. As a result of the exchange of
0376.7388/89/$03.50 0 1989 Elsevier Science Publishers B.V.

solvent and nonsolvent by diffusion, the composition at any place in the poly- mer solution film will change as a function of time. If the polymer solution film is regarded as a ternary system during this process, the composition change (as a function of time and place) can be represented as a certain pathway in the isothermal ternary diagram (Fig. 1)) starting at C (binary casting solu- tion). As soon as this composition pathway enters a two-phase region (e.g., the liquid-liquid demixing area II, defined by the binodal curve b) the system
becomes thermodynamically unstable. As a result of demixing, the membrane emerges as a two-phase system consisting of a solidifying continuous polymer- rich phase (D, ) and a liquid dispersed polymer-poor phase (D, ). These phases represent the membrane matrix and the pores, respectively. The resulting membrane structure is asymmetric. By changing the casting and/or the coag- ulation conditions a variety of membrane structures can be obtained, opening the way to application in various separation problems. Systems with compo- sitions in region I will not show liquid-liquid demixing. However, other demix- ing processes may occur here (according to a phase transition curve a), leading to solid structures with variable degrees of ordering. The common feature of the latter type of demixing process is the formation of polymer aggregates, which is possibly induced by crystallization of the polymer. Solidification of the polymer-rich phase that emerges during liquid-liquid demixing can occur in a similar way. Although both liquid-liquid demixing and aggregate forma- tion cause a certain degree of porosity in the final membrane, a clear difference can be observed between both kinds of porous structures, as was shown by Reuvers et al. for the system cellulose acetate/acetone/water [ 2 1.
Reuvers et al. [ 31 have presented a mathematical model which describes the course of the composition paths as a function of thermodynamical and fric- tional interactions in the ternary system. One of the most striking conse- quences of this model is the prediction of two distinctly different courses of membrane formation, characterized by “instantaneous” and “delayed” onset of liquid-liquid demixing, respectively. If the composition pathway in the ter-
Fig. 1. Phase diagram of a ternary membrane-forming system. See text for further explanation.

29
nary diagram, calculated as a function of time, intersects the binodal curve immediately upon immersion of the polymer solution film in the coagulation bath, liquid-liquid demixing may occur instantaneously. When the initial polymer concentration is not too high, the resulting membrane has a porous top layer with ultrafiltration characteristics. However, if the composition of the casting solution or the coagulation bath is changed, the composition path- way may adopt an initial course that does not intersect the binodal curve. In that case the composition path remains fixed in between C (Fig. 1, casting solution composition) and a point B, the interfacial boundary composition of the polymer solution. Because the model assumes local equilibrium at the in- terface between the polymer solution and the coagulation bath, B is defined as a binodal composition. Only when the diffusion front has proceeded through the whole polymer solution film, the composition pathway starts to shift away from C, resulting in a delayed intersection of the binodal curve and hence a delayed liquid-liquid demixing.
The delay time may allow a top layer with finite thickness to be formed, in which the polymer concentration increases until the obtained conformation of polymer molecules is “frozen” by gelation or transition of the glass point. Pro- vided that aggregate formation does not occur, membranes formed by this pro- cess of delayed onset of liquid-liquid demixing have a thick, dense top layer showing reverse osmosis, pervaporation or gas separation characteristics.
Reuvers et al. verified these predictions for several membrane-forming sys- tems by means of experiments. They showed that, in systems that show de- layed onset of liquid-liquid demixing, the delay time is proportional to the square of the film thickness. This supports the model prediction that in such systems the delay time for liquid-liquid demixing is related to the time neces- sary for the diffusion front to pass through the whole film. Secondly, it ap- peared that the model is capable of forecasting membrane morphology and performance from thermodynamical and frictional properties of the compo- nents used.
Essentially, the model describes diffusion processes in a ternary system, as long as demixing does not yet occur. For liquid-liquid demixing, the model also predicts when the composition pathway intersects the binodal. However, once the calculated composition path has intersected any phase transition curve, demixing phenomena may interfere with these diffusion processes. In this stage, the kinetics of demixing determines which compositions within the demixing region (described by the shifting composition path) can actually be reached, or, in other words, demixing kinetics determines the ultimate degree of super- saturation at which the calculated composition paths can still be used to de- scribe the system in an adequate way.
At this point, kinetical analysis of the system becomes important. Attention should be focused on two main issues:

30
1. Kinetics of liquid-liquid demixing in relation to the shift of the composition path, calculated by the model of Reuvers et al.
2. Kinetics of aggregate formation relative to that of liquid-liquid demixing, this issue being important only in those systems which allow both demixing mechanisms to occur.
Except for the delay time, described above and connected to the diffusional behaviour of the system, there is a further important kinetic parameter to be determined: the induction time for demixing. This is the time period during which a solution can exist as a one-phase system after it has been quenched to a metastable composition (e.g. by a temperature drop). Clearly, this parameter extends the validity range of the diffusion model within the metastable region. Induction times should be measured at different degrees of supersat’uration/ supercooling as a function of polymer concentration.
In this paper we will deal with a system from which reverse osmosis mem- branes can be prepared, namely cellulose acetate (CA)/dioxane/water. Be- sides a high desalination performance (i.e. a high salt rejection at a reasonable water flux), wet-dry reversibility of the membranes is often an important re- quirement. Membranes which are not wet-dry reversible have to be kept wet in order to retain the original properties. Especially in the case of cellulose acetate membranes (which offer many advantages in desalination applica- tions), wet storage can cause severe problems because of the susceptibility of this polymer to biological degradation. The use of biocides is an effective rem- edy, but for certain applications this involves a risk. Therefore, making dry- storage membranes would be more elegant.
To enable dry storage, the membrane structure should be able to resist the capillary forces that occur during drying and re-wetting the membrane. This ability is especially determined by the size of the smallest pores in the sublayer, just below the skin. Every attempt to enlarge these pores has to proceed by influencing the thermopdynamics and/or the kinetics of demixing. In practice, the use of additives (next to other modifications to the casting solution and the coagulation procedure) is necessary to obtain wet-dry reversible mem- branes. Dicarboxylic acid in particular (e.g. maleic acid) are frequently used for this purpose [ 4 1.
The objective of the work described in this paper was to obtain more fun- damental knowledge concerning the thermodynamics and kinetics of liquid- liquid demixing in the above-mentioned system, and to reveal the influence of maleic acid as a fourth component.
Pulse-induced critical scattering (PICS)
Equipment used We used pulse-induced critical scattering (PICS ) measurements to obtain
cloud points, spinodal temperatures and data on the kinetics of liquid-liquid

31
i Th.+h I i
stepper
Fig. 2. Schematic representation of the PICS experimental setup.
demixing. The PICS instrument was built following the design given by Gor- don et al. [ 5-91. A schematic representation of the PICS equipment is given in Fig. 2.
The sample consists of a solution containing polymer, solvent and nonsol- vent. A solution volume of about 70 ~1 is sealed in a capillary tube. The sample holder, which is connected to a stepper motor, can occupy two positions, one for homogenizing and one for measuring, respectively. In the homogenization position, the sample is placed in a hot air stream (at a constant temperature Th, about 90’ C ) during a time th. The time th can be chosen freely but remains constant during the experiment. After the sample has been homogenized com- pletely, the sample holder switches to the measurement position, quenching the sample to a temperature T,, in a thermostated water bath. In this position a laser beam passes axially through the sample. Before entering the capillary, the laser beam passes through a lens to obtain a narrow beam.
The intensity of the scattered light from the sample is measured at two dif- ferent angles (chosen arbitrarily at 30” and 90” ), at a constant temperature Tb and during a time period ti,. The scattered light is transferred to a photo- diode by means of glass fiber optics. After amplification, the intensity data are recorded and stored in an Apple II Plus microcomputer. Upon completion of the measurement the sample holder is switched to the homogenization position again.
The cycle described above is repeated several times while Tb changes slowly. Figure 3 shows a schematic representation of a recorder output of one experi- ment, consisting of 9 cycles. In Fig. 4, the light-scattering response of one of these cycles is pointed out in more detail. As a result of density fluctuations, which may result in demixing upon passing the cloud point, the scattering intensity increases from a baseline level to a maximum. Two kinds of scatter-

32
f
I30
_ Temperature (Tbl
Fig. 3. Recorder output of a PICS run, with a decrease in bath temperature (Tb) for successive pulses.
‘30
L
to 1 time - tb
Fig. 4. Extended registration of a single PICS measurement cycle.
ing should be distinguished: critical scattering and emulsion scattering [ 71. Critical scattering is caused by density fluctuations which do not yet lead to the formation of stable nuclei (and hence to liquid-liquid demixing). Typi- cally, the scattering intensity caused by these critical fluctuations increases slowly and reaches an equilibrium level within 10 sec. This level (dIc with respect to the baseline) increases gradually upon lowering the measurement temperature ( Tb) because both the amplitude and the frequency of the density fluctuations increase (see Fig. 3, curves a-e). The time necessary for the scat- tering intensity to reach the equilibrium level is due to the temperature equi- libration of the sample, which takes 2-3 sec.
At a temperature below the cloud point, density fluctuations result in the eventual formation of stable nuclei, after a certain induction time Y (Fig. 3, curves f, g). Emulsion formation as a result of liquid-liquid demixing causes

33
the scattering intensity to increase steeply (Fig. 3, curves f-i). This emulsion scattering (dl, with respect to the critical scattering level) does not reach an equilibrium level within the same time scale. At still lower measurement tem- peratures, r approaches zero and emulsion scattering completely overrules the critical scattering (Fig. 3, curves h, i) .
The PICS apparatus has been automatized. The Apple II Plus microcom- puter controls both the temperature-regulating system and the stepper motor (which switches the sample holder). The computer also stores and processes all intensity, time and temperature data. The automation aspects of the PICS apparatus will be discussed in more detail elsewhere [lo].
2. PIGS data processing
2a. Cloud point determination The cloud point is defined as the temperature at which the polymer solution
becomes metastable: below this temperature demixing can occur. Conse- quently, the cloud point follows directly from the recorder output (Fig. 3) by extrapolating the emulsion scattering effect (AI,) to zero. Clearly, the meas- uring time tb should be sufficient to detect induction times (z) of at least sev- eral seconds: together with the rate of temperature variation (dT,/dt), this determines the accuracy of determination of the cloud point.
2b. Determination of the spinodal temperature Before pointing out in which way PICS data can yield spinodal tempera-
tures, it is necessary to discuss spinodal demixing in more detail. At a given temperature, the existence of a “demixing gap” in the phase dia-
gram of a multicomponent system follows from the shape of the curve repre- senting the free energy of mixing (dG,) as a function of composition at that temperature. For polymer solutions, several expressions for dGM have been given in the literature [ 111. As soon as the dGM curve shows inflection points, the system can lower its Gibb’s free energy by splitting up into two phases. The double tangent to this curve yields the respective binodal compositions.
In principle, every system with a composition within a demixing gap will demix in the way described above. However, within the demixing region we can distinguish a metastable and an unstable area. Compositions within the meta- stable range can exist during a finite period of time (r) before phase separation occurs by nucleation and growth of one of the phases. This induction time is required because an energy barrier has to be overcome before stable nuclei can be formed. The resulting free energy difference dG, (for the formation of spherical nuclei) follows from eqn. (1) ,
AG,=-$nr31AG,(+4nr21al
where r is the radius of the nucleus, AG, is the volume free energy difference
34
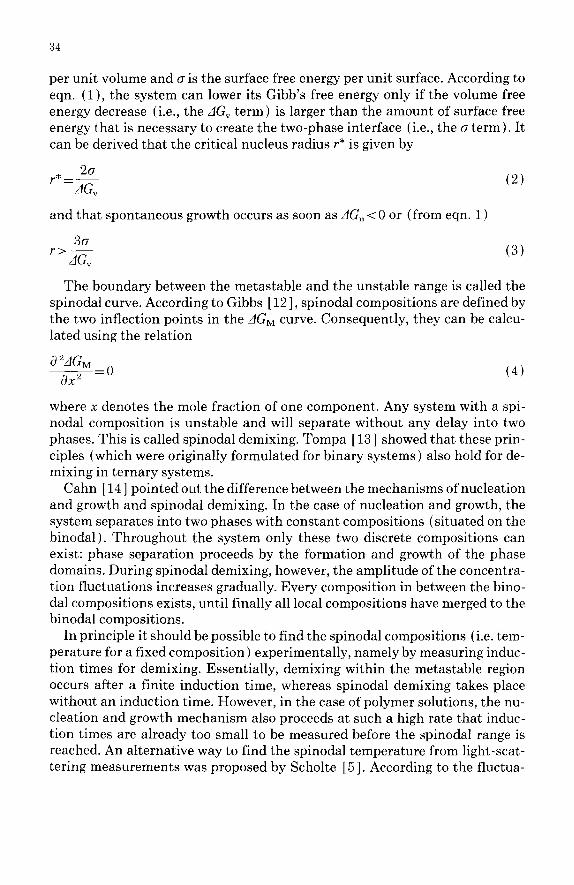
per unit volume and a is the surface free energy per unit surface. According to eqn. (1) , the system can lower its Gibb’s free energy only if the volume free energy decrease (i.e., the AG, term) is larger than the amount of surface free energy that is necessary to create the two-phase interface (i.e., the o term). It can be derived that the critical nucleus radius r* is given by
20
r*=dGv
and that spontaneous growth occurs as soon as AG, < 0 or (from eqn. 1)
30
,‘/1,
(2)
(3)
The boundary between the metastable and the unstable range is called the spinodal curve. According to Gibbs [ 121, spinodal compositions are defined by the two inflection points in the AGM curve. Consequently, they can be calcu- lated using the relation
(4)
where x denotes the mole fraction of one component. Any system with a spi- nodal composition is unstable and will separate without any delay into two phases. This is called spinodal demixing. Tompa [ 131 showed that these prin- ciples (which were originally formulated for binary systems) also hold for de- mixing in ternary systems.
Cahn [ 141 pointed out the difference between the mechanisms of nucleation and growth and spinodal demixing. In the case of nucleation and growth, the system separates into two phases with constant compositions (situated on the binodal). Throughout the system only these two discrete compositions can exist: phase separation proceeds by the formation and growth of the phase domains. During spinodal demixing, however, the amplitude of the concentra- tion fluctuations increases gradually. Every composition in between the bino- da1 compositions exists, until finally all local compositions have merged to the binodal compositions.
In principle it should be possible to find the spinodal compositions (i.e. tem- perature for a fixed composition) experimentally, namely by measuring induc- tion times for demixing. Essentially, demixing within the metastable region occurs after a finite induction time, whereas spinodal demixing takes place without an induction time. However, in the case of polymer solutions, the nu- cleation and growth mechanism also proceeds at such a high rate that induc- tion times are already too small to be measured before the spinodal range is reached. An alternative way to find the spinodal temperature from light-scat- tering measurements was proposed by Scholte [ 51. According to the fluctua-

35
$1 I
,’ ,’
,’ ,’ 4
,’ ,’ 9
,’ ,’
,’ ,’ dd
,’ ,’ 0
,’ *’ 0 D 0
0
f TS Td
Temperature (OCI -
Fig. 5. Reciprocal intensity data AI;’ as a function of temperature, leading to the spinodal tem- perature T, and the cloud point temperature Z’,,.
tion theory of Smoluchowsky and Einstein, extended by Zernike to cover mul- ticomponent systems (see, for instance, [ 51)) the light-scattering intensity is inversely proportional to d ‘dGM/d x2. Since, by definition, this term becomes zero at the spinodal (according to eqn. 4), the light-scattering intensity as a result of density fluctuations (AI, in Fig. 4) is expected to reach infinity on approaching the spinodal. Therefore, it should be possible to find the spinodal temperature by extrapolating d1, values to infinity or, in practice, by extrap- olating (Al,) -’ to zero (Fig. 5). Not only the spinodal temperature (T,) , but also the cloud point ( T,,) can be deduced from the break point in the reciprocal intensity data, as shown in Fig. 5.
2c. Investigation of the kinetics of phase separation The kinetics of phase separation involves three interesting aspects: (1) in-
duction time, (2) nucleation kinetics and (3) growth kinetics. 1. The presence of an induction period follows directly from the registration
of the scattering intensity as a function of time (e.g. Fig. 4). In particular measurements at low angles (in our case 30” ) are sufficiently sensitive to de- tect scattering by the particles present in the earliest stage of phase separation.
2,3. In principle, the increase of scattering intensity, as observed during phase separation, is caused by the formation and growth of nuclei and the simulta- neous formation and growth of secondary nuclei. According to Rayleigh (see e.g. [ 151) , the scattering intensity at time t is given by eqn. (5):
where
1 2
-$ (sin cy-_cos a!) (shape function) (6)

36
with
a=4nr;,(t)inB 1JIz” 2
and
(7a)
In eqns. (5)-( 7), I, denotes the intensity of the scattered light, measured at angle 6,1,, is the incident light intensity, N/V the number of scattering par- ticles per unit volume, VP the mean particle volume, fp the mean particle ra- dius, /1 the wavelength of the incident light and n, the refractive index of the sample medium. AH/sin 19 represents the scattering volume correction factor; A0 accounts for the nonideal geometry of the PICS apparatus (As> 1).
The investigation of nucleation and growth kinetics requires simultaneous and independent information about number and size of the scattering particles (i.e. the growing nuclei) as a function of time. One might assume that all nuclei are being formed instantaneously upon the creation of a thermodynamically instable situation (i.e. after an induction period), following by particle growth only, thereby interpreting the intensity vs. time curve as a growth curve.
From Rayleigh-Gans light scattering theory [ 151 it follows that the ratio of scattering intensities, measured at two different angles, is independent of the number of scattering particles (eqn. 8 ) :
I 30 p30 -_=-
I 90 p90
K
where P,,/P,, is only a function of the mean particle diameter (see eqns. 6 and 7) and K is an apparatus constant.
Consequently, the 130/190 ratio provides independent information about the mean particle diameter without needing any assumption concerning the num- ber of particles. This approach is valid only if multiple scattering does not occur: in practice this means that the use of this method is limited to the par- ticle size range for which the Rayleigh-Gans theory holds. In order to deter- mine this size range for our experimental set up, the instrument was calibrated by using homodisperse polystyrene latices with well-known particle diameters. In Fig. 6, the experimental 130/1go values for these latices are shown as a func- tion of the particle diameter. Comparison with the theoretical values (accord- ing to eqns. 5-8) yielded A0 and hence the apparatus constant K. Using a He/ Ne laser with a wavelength of 632.8 nm, the validity range of Rayleigh-Gans light scattering theory was found to extend to about 400 nm.
The measured particle diameter can also be substituted in the Rayleigh-

31
t ! 600
3
I1 J 190 c=o
500
300-
1 I ! I I 200 400 600
dpllatex) lnml -
Fig. 6. Z,0/Z90 vs. particle diameter-experimental data for polystyrene latices, measured with the PICS instrument.
Gans expression for the absolute intensity (eqn. 5) to yield the number of particles per unit volume. Absolute intensity data, obtained from our instru- ment, cannot be used for this purpose for the following reason. The point at which scattering from the sample is measured is situated along the capillary axis, a few millimetres away from the entry point of the laser beam. This dis- tance is necessary to prevent scattering by the glass seal from disturbing the measurement. As a result of light scattering in this preceding volume, IO at the measuring point depends not only on the distance along the capillary axis (which is kept constant), but also on the density of scattering particles in the preceding volume. Hence, IO is a function of time as well and therefore we cannot use absolute intensity data to obtain the number of nuclei, due to the axial position of the sample capillary in the laser beam. The intensity ratio of course remains unaffected by the above-mentioned effect. Placing the sample capillary perpendicular to the laser beam would be the solution to this problem. In that case, however, it is very hard to achieve and reproduce the correct position of the capillary, exactly centered in the laser beam. Secondly, the sam- ple dimensions in the PICS measurement are (necessarily) very small with respect to the laser beam when compared with conventional light-scattering instruments. Hence, in the perpendicular capillary position, the strongly curved

38
glass wall would cause the measurements to be disturbed by refraction and scattering of the laser beam.
Materials
Cellulose acetate (CA) was obtained from Eastman (E 398-3-6) and was dried before use. Number and weight averaged molecular weights were deter- mined by HPLC-LALLS: a,, ii&, were 24,400 and 42,100, respectively (J&l Mn=1.73).
Reagent grade 1,4-dioxane was obtained from Baker and was used without further purification. Water was demineralized and ultrafiltrated before use. Maleic acid was obtained from BDH and was used without further purification. Monodisperse polystyrene lattices for the calibration of the PICS instrument were kindly supplied by AKZO, Arnhem, The Netherlands.
Results and discussion
Binodal and spinodal curves Figure 7 shows binodal and spinodal curves for the system CA/dioxane/
water at 25 ‘C, obtained by PICS. Only a small part of the complete ternary diagram is relevant for our measurements and is shown in more detail (as indicated by the shaded area).
As is the case with conventional techniques for cloud point determination
O--A- ’ 65 - wt% dioxane
L&5 w __ 60
Fig. 7. Binodal and spinodal for the system CA/dioxane/water, obtained by PICS. 0, binodal curve; 0, spinodal curve; dashed line, binodal curve according to turbidity measurements [ 15 1.

39
for this particular system, data could be obtained only at moderate polymer concentrations because at higher concentrations homogeneous solutions can no longer be obtained. The dashed curve represents earlier data on the binodal curve, obtained by turbidity measurements [ 161.
When comparing both binodal curves, the PICS curve is situated at a slightly lower water content, i.e. left of the turbidity curve. This shift can be explained by the fact that light-scattering measurements are more sensitive than turbid- ity measurements. From these results, the critical point for this system at 25 o C is found to be situated above 8% (w/w) of polymer.
Altena and Smolders [ 171 and Reuvers and Smolders [ 181 calculated bin- odals, spinodals and critical points for different CA/solvent/water systems. They found that the critical point - at a constant temperature of 25’ C - did not vary too much upon changing the solvent characteristics, this being in agreement with the common theory that the critical point of a polymer/sol- vent/nonsolvent system is mainly determined by the polymer. Thus, for CA as the polymer, the critical point was calculated to be about 2% (w/w) of poly- mer. However, other measurements by Reuvers and Smolders [ 191 yielded a considerably higher value (5% (w/w) of polymer) for tetrahydrofuran and dioxane as solvents. These measurements involved phase separation experi- ments, performed on mixtures with a constant polymer concentration of 4% (w/w). Owing to the high degree of polydispersity of the CA used (M_,/ n;i, = 1.73 ) , the experimental value for the critical point was found to be strongly dependent on the initial selection of the CA concentration at which the phase separation experiments were carried out. The dependence of the critical point on polymer polydispersity has been described by Koningsveld [ 201. This phe- nomenon constitutes a serious complication when comparing our results with - scarcely available - literature data on CA binodals.
At polymer concentrations of 8% (w/w) and higher, binodal and spinodal curves determined according to our procedure are found to nearly coincide. In this range of polymer concentration the temperature intervals used in the ex- trapolation procedure to obtain the spinodal temperature (Fig. 5) remain small, causing the experimental binodal and spinodal temperatures to be almost the same. In the literature, only calculated spinodal curves for polymer/solvent/ nonsolvent systems have been reported [ 17,181. At polymer contents above the critical concentration, these curves deviate progressively from the binodal.
At this point we want to discuss the sensitivity of our measurements as a function of the light refraction behaviour of the solution under study. As we pointed out earlier, the reciprocal scattering intensity, occurring as a result of density fluctuations within the metastable region, can be extrapolated as a function of temperature to yield the spinodal. According to eqn. (5)) the scat- tering intensity I0 is proportional to the square refractive index increment ( (dn/ dc) T;.). This quantity denotes the dependence of the refractive index on solute concentration for a well-defined solute/solvent system at constant tempera-
40
ture ( o C) and wavelength (nm). Since critical scattering is caused by concen- tration fluctuations, dn/dc determines the accuracy of our measurements to a considerable extent.
In order to verify the validity of our experimental data, we reproduced the experiments on the polystyrene/cyclohexane system, reported earlier by Gor- don et al. [ 61. For this system ( (dn/dc),,;,,, = 0.172) we actually succeeded in applying the correct extrapolation procedure and to find spinodal tempera- tures in the expected range. As we will show in a forthcoming paper, the system polysulphone/dimethylacetamide/isopropanol also allows a correct extrapo- lation procedure to be applied ( (dnldc),,;,,, is roughly 0.21 for solutions of
polysulphone in different solvents ). For the system CA/dioxane/water it ap- peared that extrapolation could be performed only in the temperature range where emulsion scattering (as a result of liquid-liquid demixing) already oc- curs. For CA/dioxane, dn/dc is found to be more than a factor 10 lower than for the other systems mentioned above, causing scattering intensity levels to be more than 100 times lower than for the other systems. This might imply that for our ternary system this procedure does not yield a reasonable approx- imation of the spinodal temperature.
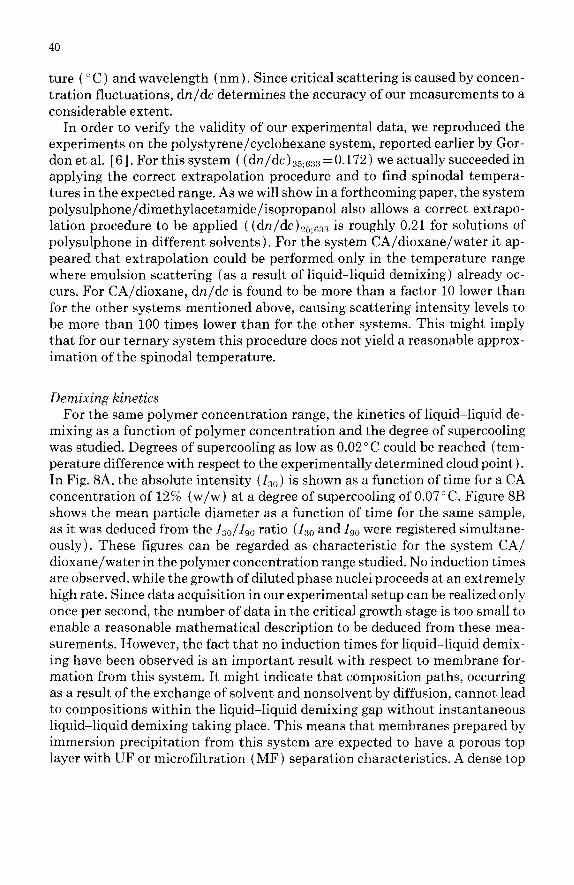
Demixing kinetics For the same polymer concentration range, the kinetics of liquid-liquid de-
mixing as a function of polymer concentration and the degree of supercooling was studied. Degrees of supercooling as low as 0.02 ‘C could be reached (tem- perature difference with respect to the experimentally determined cloud point). In Fig. 8A, the absolute intensity (13,,) is shown as a function of time for a CA concentration of 12% (w/w) at a degree of supercooling of 0.07’ C. Figure 8B shows the mean particle diameter as a function of time for the same sample, as it was deduced from the 1~30/1,0 ratio ( Ia and &, were registered simultane- ously). These figures can be regarded as characteristic for the system CA/ dioxane/water in the polymer concentration range studied. No induction times are observed, while the growth of diluted phase nuclei proceeds at an extremely high rate. Since data acquisition in our experimental setup can be realized only once per second, the number of data in the critical growth stage is too small to enable a reasonable mathematical description to be deduced from these mea- surements. However, the fact that no induction times for liquid-liquid demix- ing have been observed is an important result with respect to membrane for- mation from this system. It might indicate that composition paths, occurring as a result of the exchange of solvent and nonsolvent by diffusion, cannot lead to compositions within the liquid-liquid demixing gap without instantaneous liquid-liquid demixing taking place. This means that membranes prepared by immersion precipitation from this system are expected to have a porous top layer with UF or microfiltration (MF) separation characteristics. A dense top

41
5 10 15 time Is1 -
5 10 15 time (5) -
Fig. 8. Intensity ZzO taken from the recorder (A) and particle diameter d, (B) as a function of time for the system CA/dioxane/water. CA concentration: 12% (w/w); degree of supercooling: 0.07”C.
layer (for RO, pervaporation or gas separation purposes) could be obtained by introducing an evaporation step prior to immersion, or by creating such cir- cumstances that cause the composition path to cross the binodal not immedi- ately, but only after nonsolvent diffusion has proceeded through the whole polymer solution film, in other words, by causing the principle of delayed onset of liquid-liquid demixing to apply. In the system CA/dioxane/water, this could be achieved by adding solvent to the coagulation bath. Liquid-liquid demixing is delayed only at dioxane weight fractions in the coagulation bath (water) of 15% and higher [21].
We want to compare the IS,, vs. time plot (Fig. 8A) with the d, vs. time plot that was derived from the measured 130/190 ratio (Fig. 8B). In earlier investi- gations on the crystallization kinetics of membrane-forming systems that con- tain PPO [ 241, Avrami-type growth models were applied to the initial part of the absolute intensity vs. time curve (Fig. 8A). However, Fig. 8B - which is the actual growth curve - clearly shows a different initial curvature, for which the Avrami approach does not provide an adequate description. In general, exponential growth models {c& = d,,, [ 1 - exp ( -gt) ] } are expected to give a better description of this growth process than a free diffusion model (d,- t ‘13). This could imply that nucleation rates are so high that diffusion fronts for the growth stage do interfere from the earliest moment for which growth data could be obtained.
42
Effect of maleic acid The influence of maleic acid on the demixing behaviour of the system de-
scribed above was studied for CA/dioxane/water solutions that contained 2% (w/w) maleic acid. In contrast to the system without maleic acid, reproducible cloud points and spinodal temperatures could not be obtained for the system containing maleic acid. Severe difficulties in obtaining reproducible data for this system were already encountered by Bokhorst et al. [ 22 1. This can be due to the aging effect to which CA is susceptible in the presence of maleic acid, especially when the system is subjected to heat treatment (as is the case during PICS measurements). Subsequent heat treatments, performed on the same sample, cause the cloud point temperature to shift to a lower value. This is equivalent to a shift to higher water contents in the isothermal ternary phase diagram, i.e. a shift to the right. Thus, the liquid-liquid demixing gap becomes smaller, which indicates an increased solubility of CA at increased maleic acid content. However, because cloud points continue to change with time, at a rate which is strongly dependent on temperature, we think that the CA solubility is increased by an (acid catalyzed) chemical modification of the polymer rather than in a strictly physical way: maleic acid does not simply act as a solvent. Because at ambient temperatures this aging effect proceeds at a negligible low rate when compared with the membrane formation process, we did not con- sider this effect to be relevant in membrane formation itself.
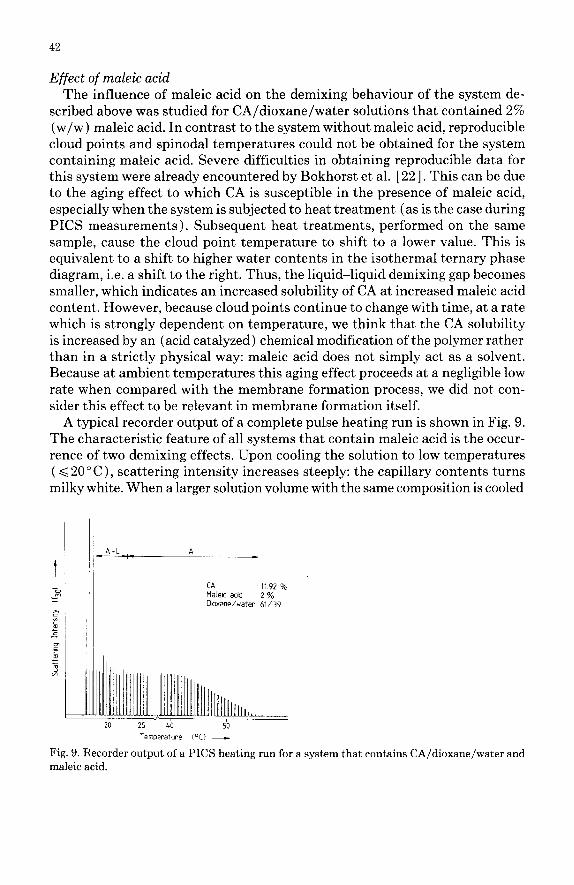
A typical recorder output of a complete pulse heating run is shown in Fig. 9. The characteristic feature of all systems that contain maleic acid is the occur- rence of two demixing effects. Upon cooling the solution to low temperatures ( d 20” C), scattering intensity increases steeply: the capillary contents turns milky white. When a larger solution volume with the same composition is cooled
A CA II 92 %
"- Mahc md 2 % Dome/water 61/39
A 2
;
e h =, LY
20 25
Temperature I"Cl -
Fig. 9. Recorder output of a PICS heating run for a system that contains CA/dioxane/water and
maleic acid.

43
slowly to within this temperature range, the system clearly separates into two phases as a result of liquid-liquid demixing. Upon raising the quenching tem- perature, the liquid-liquid demixing effect vanishes above the cloud point, but scattering intensity still does not reach an equilibrium level. This indicates that inhomogeneities are still being formed. At visual observation, these solu- tions are only a slightly turbid or even clear. This latter demixing effect only vanishes very gradually at much higher temperatures (40-50” C ). In the tem- perature range from 22 to about 4O”C, inhomogeneities are being detected which reach diameters of about 300 nm according to the measured 130/1g0 ratio. Un- like liquid-liquid demixing, this demixing process shows a strong hysteresis effect: when the solution is cooled slowly, it starts only at high degrees of su- percooling. Therefore, it shows a striking similarity with phase separation pro- cesses in which ordering phenomena occur, e.g. crystallization. We will define this demixing effect as aggregate formation. This effect is similar to the phe- nomena observed by Vasarhelyi et al. [ 231, who investigated the influence of maleic acid on the formation of RO membranes from CA/CTA blends by means of light transmission measurements and scanning electron microscopy. Light transmission experiments showed that membrane formation proceeds by the mechanism of delayed liquid-liquid demixing (in terms of the model by Reu- vers et al. ) . However, during the delay time for liquid-liquid demixing the tur- bidity of the polymer film already increases slightly (prior to a much steeper increase as a result of liquid-liquid demixing ).
The formation of inhomogeneities in membranes by another process than liquid-liquid demixing was confirmed by SEM photographs [ 231. Directly be- low the skin (which is not clearly visible itself) an intermediate layer can be distinguished of which both the porosity and the thickness increases with in- creasing maleic acid concentration in the casting solution.
The remarkable flux behaviour as a function of the maleic acid content of these membranes is explained by the typical porous structure, induced by ag- gregate formation in the intermediate layer [ 23 1.
Kinetics of aggregate formation in our maleic acid containing system pro- ceeds at a relatively low rate. As we pointed out above, high degrees of super- cooling/superheating are observed, as well as extremely long induction times at lower degrees of supercooling. The low temperature part of Fig. 9 shows that even the adopted homogenization procedure (45 set at 9O’C) was not suffi- cient to dissolve the aggregates completely. At a well-defined temperature (which, however, cannot be reproduced as a result of the above-mentioned aging effect) liquid-liquid demixing sets in at an extremely high rate (similar to the same system without maleic acid). This is a very important observation because it indicates that liquid-liquid demixing is not obstructed despite the fact that aggregate formation took place already.

44
Conclusions
Pulse-induced critical scattering (PICS) was used to obtain thermodynamic data (binodal and spinodal temperatures) and kinetic information (induction times and growth rates) on liquid-liquid demixing in a ternary membrane- forming system. For the system cellulose acetate (CA) /dioxane/water, the binodal curve obtained agrees reasonably well with other experimental data. The extrapolation method used to find the spinodal curve might lead to erro- neous results at higher polymer concentrations in this ternary system. Liquid- liquid demixing kinetics proceeds extremely fast within the CA concentration range studied. No induction times have been observed. Consequently, as soon as the composition pathway during membrane formation (as defined by Reu- vers [3] ) intersects the binodal curve, liquid-liquid demixing will occur. Be- cause this intersection takes place immediately after immersion of a binary (CA/dioxane ) casting solution in a pure water bath, membranes prepared from this system are expected to have a porous top layer and UF or MF separation characteristics. Membranes with a dense top layer (for RO, pervaporation or gas separation purposes) could be prepared by applying an evaporation step prior to immersion, or by adding dioxane to the coagulation bath. The latter procedure causes the composition pathway to adopt an initial course that does not intersect the binodal curve. This allows a thick, dense top layer to be formed prior to demixing.
Addition of 2% (w/w) maleic acid causes the system to show an increased tendency towards aggregate formation; this demixing process can be distin- guished clearly from liquid-liquid demixing by PICS. In membranes which are formed via the mechanism of delayed onset of liquid-liquid demixing, aggre- gate formation may affect the structure of that part of the membrane in which liquid-liquid demixing did not yet take place, causing an intermediate layer with increased porosity to be formed.
Acknowledgement
These investigations were supported by the Netherlands Foundation for the Technical Sciences (STW), future Technical Science Branch of the Nether- lands Organization for the Advancement of Pure Research (ZWO ).
References
1 S. Loeb and S. Sourirajan, Sea water demineralization by means of an osmotic membrane, Adv. Chem. Ser., 38 (1962) 117.
2 A.J. Reuvers, F.W. Altena and C.A. Smolders, Demixing and gelation behavior of ternary cellulose acetate solutions, J. Polym. Sci., Polym. Phys., 24 (1986) 793-804.

45
3
4
5
6
7
8
9
10 11
12
13 14
15 16
17
18
19 20
21 22
23
24
A.J. Reuvers, J.W.A. van den Berg and C.A. Smolders, Formation of membranes by means of immersion precipitation. Part I. A model to describe mass transfer during immersion pre- cipitation, J. Membrane Sci., 34 (1987) 45-65. Patent D 1,720,050, Verfahren zur Herstellung von CA-Membrane fur umgekehrte Osmose, Aerojet-General Corp., El Monte, Ca., U.S.A.; also U.S. Patent 3,673,084; Fr. Patent 1,507,885; U.K. Patent 1,152,569, all by the same Company. Th.G. Scholte, Light scattering of concentrated polydisperse polymer solutions, J. Polym. Sci., Part C, 39 (1972) 281-291. M. Gordon, J. Goldsbrough, B.W. Ready and K.W. Derham, Characterization by molecular weight, in: J.H.S. Green and R. Dietz (Eds.), Industrial Polymers, Transcripta Books, Lon- don, 1973, pp. 45-50. K.W. Derham, J. Goldsbrough and M. Gordon, Pulse-Induced Critical Scattering (PICS) from polymer solutions, J. Pure Appl. Chem., 38 (1974) 97-116. K.W. Derham, J. Goldsbrough, M. Gordon, R. Koningsveld and L.A. Kleintjens, Liquid- liquid phase separation in multicomponent polymer system. Molecular weight dependence of the pair-interaction parameter in the system polystyrene/cyclohexane, Makromol. Chem., Suppl., 1 (1975) 401-414. M. Gordon, P. Irvine and J.W. Kennedy, Phase diagrams and pulse induced critical scatter- ing, J. Polym. Sci., Polym. Symp., 61 (1977) 199-220. J.A. Ronner and G.J. Heezen, to be published. P.J. Flory, Principles of Polymer Chemistry, Cornell University Press, Ithaca, NY, 1953, p. 495. J.W. Gibbs, Collected Works, Vol. I, Dover Publications Reprint, New York, NY, 1961, p. 132. H. Tompa, Polymer Solutions, Butterworths, London, 1956, p. 182. J.W. Cahn, Phase separation by spinodal decomposition in isotropic systems, J. Chem. Phys., 42 (1965) 93-99. G. Oster, in: Physical Methods of Chemistry, Part IIIA, Interscience, New York, NY, 1972. F.W. Altena, J.S. Schroder, R. van de Hulst and C.A. Smolders, Thermoreversible gelation of cellulose acetate solutions studied by differential scanning calorimetry, J. Polym. Sci., Polym. Phys., 24 (1986) 1725-1734. F.W. Altena and C.A. Smolders, Calculation of liquid-liquid phase separation in a ternary system of a polymer in a mixture of a solvent and a nonsolvent, Macromolecules, 15 (1982) 1491-1497. A.J. Reuvers and C.A. Smolders, Formation of membranes by means of immersion precipi- tation. Part II. The mechanism of formation of membranes prepared from the system cellu- lose acetate-acetone-water, J. Membrane Sci., 34 (1987) 67-86. A.J. Reuvers, Thesis, University of Twente, Chap. 5,1987. R. Koningsveld, Liquid-liquid equilibria in quasi-ternary systems, Chem. Zvesti, 26 (1972) 263-287; Br. Polym. J., 7 (1975) 435. A.J. Reuvers, Thesis, University of Twente, Chap. 6, 1987. H. Bokhorst, F.W. Altena and C.A. Smolders, Formation of asymmetric cellulose acetate membranes, Desalination, 38 (1981) 349-360. K. Vasarhelyi, J.A. Ronner, M.H.V. Mulder and C.A. Smolders, Development of wet-dry reversible RO membranes with high performance from cellulose acetate and cellulose triace- tate blends, Desalination, 61 (1987) 211-235. J.G. Wijmans, H.J.J. Rutten and C.A. Smolders, Phase separation phenomena in solutions of poly(2,6-dimethyl-1,4-phenylene oxide) in mixtures of trichloroethylene, l-o&no1 and methanol: Relationship to membrane formation, J. Polym. Sci., Polym. Phys., 23 (1985) 1941-1955.

![Phase separation processes in polymer solutions in ...very low for polymer solutions [12]. Liquid-liquid demixing takes place by nucleation and growth of droplets of a polymer poor](https://img.pdfslide.us/doc/110x75/5f4cf1c5a47e7d6cb238c22b/phase-separation-processes-in-polymer-solutions-in-very-low-for-polymer-solutions.jpg)