Embed Size (px)
Citation preview
The 30th International Electric Propulsion Conference, Florence, Italy
September 17-20, 2007
1
Investigation of High-Energy Ions with High-Angle
Trajectories in Hall Thruster Plumes
IEPC-2007-31
Presented at the 30th International Electric Propulsion Conference, Florence, Italy
September 17-20, 2007
Regina M. Sullivan*
California Institute of Technology, Pasadena, CA, 91125,U.S.A.
Paul A. Torrey†
Cornell University, Ithaca, NY, 14853, U.S.A.
and
Lee K. Johnson‡
Jet Propulsion Laboratory, Pasadena, CA, 91109,U.S.A.
Abstract: Hall thruster plume ions with high-energy, high-angle trajectories are a
significant thruster integration concern. Ground tests of a BHT-200 Hall thruster (anode
voltage 250 V) show that at angles greater than 60 degrees, there is a large peak in ion
energy at about 30 eV with a high-energy tail, and a small but definite secondary peak at
about 220 eV. An analysis of the sputtering yield energy dependence indicates that these
higher energy ions have a greater impact on the total sputtering than the low energy ions. A
numerical study, using a modified version of the HP-Hall code, was conducted in a first
attempt at investigating this phenomenon. The HP-Hall simulations do not reveal the same
phenomena as the experiment.
I. Introduction
From an integration standpoint, Hall thrusters offer a challenge because of the high-energy ions that they
produce. Although most of these particles are confined to a narrow beam, those that end up at high angles off of the
thruster centerline are more likely to interact with surfaces in the environment. As a consequence, wear to sensitive
surfaces, as well as deposition of sputtered material in undesired locations, can result. Therefore, it is important to
fully characterize those ions with high-angle trajectories.
As will be discussed, the ions that end up with these trajectories have been found to fall within a range of
energies. Most of the ions are confined to low energies (below 50 eV), but a small proportion have significantly
higher energies (above 100 eV), with some having energies near that of the primary beam (250 eV). Although the
population of these high-energy ions is smaller, when sputtering yield is taken into account these ions can have a
greater impact on surface erosion. While the low-energy ions can be accounted for by charge exchange (CEX)
collisions and the mid-range-energy ions by elastic scattering [1], those ions with energies comparable to that of the
main beam cannot.
* PhD Candidate, Engineering and Applied Sciences, [email protected].
† Undergraduate research assistant, Applied and Engineering Physics, [email protected].
‡ Research Scientist, Propulsion and Thermal Engineering, [email protected].
The 30th International Electric Propulsion Conference, Florence, Italy
September 17-20, 2007
2
This study was undertaken for the purpose of characterizing the behavior these high-energy ions. Experimental
methods were used to fully quantify the proportion of high-energy ions at different trajectories and determine the
total sputtering yield of these ions. Additionally, modeling efforts were employed to determine whether a
commonly used Hall-thruster code could replicate the results, as well as to investigate the physics underlying the
generation of these ions.
II. Experimental Apparatus
In this study, a Busek BHT-200 Hall thruster, which has a nominal operating point of 250 V and 0.75 A, and
which uses an external cathode, was examined. The thruster was operated in a vacuum chamber at a nominal
pressure of 2x10⁻⁶ torr. A retarding potential analyzer (RPA) measured the energy spectrum of the thruster. The
RPA was mounted on a two-axis translation stage. This stage was fixed in the vertical direction, such that the probe
moved in a horizontal plane intersecting the central axis of the thruster plume.
The four-grid RPA used in this experiment was designed for use in various Hall thruster experiments. Figure 1
shows the main components of this RPA. This design employs a set of aligned molybdenum grids and a tungsten
collector plate, and has an acceptance angle of 15°. The insulators are made of a commercially available plastic
called Celazole. Like all RPAs, this design contains a “retarding” grid to which an increasing potential is applied.
Ions with potentials above this value pass through the grid, while ions with lower potentials are rejected. An I-V
curve is generated, showing the ion current admitted into the device at a given retarding potential. This is the
“integrated” current, so the derivative of the data must be taken to find the potential distribution. If one then
assumes that all of the ions are singly charged, then the ion energy can be found simply by multiplying the charge of
the ion by its potential. However, it should be noted that this assumption is not necessarily valid for Hall thrusters
[2], so in this paper will consider the ion potential distribution, rather than the ion energy, distribution generated by
the RPA.
The other main components of this RPA are the “screen” and “suppressor” grids and the collector plate. The
screen grid is set at a low negative voltage (~ -20V), to reject electrons. The suppressor grid is also set at a low
negative voltage (~ -20V), to counteract secondary electron emission (SEE). Secondary electrons are generated
when an ion with adequate energy collides with the collector, and if these electrons are allowed to escape cause
errors in the ion current measurement. The small negative voltage helps prevent the electrons from leaving the
RPA. Additionally, to further reduce SEE the collector plate is made from tungsten, a material which is resistant to
SEE.
PLASMA
Retarding grid (+0-300 V)
Suppressor grid (-20 V)
Screen grid (-30 V)
Outer grid (floating)
Collector plate
PLASMA
Retarding grid (+0-300 V)
Suppressor grid (-20 V)
Screen grid (-30 V)
Outer grid (floating)
Collector plate
Figure 1. Schematic of RPA used in the experiment.
The 30th International Electric Propulsion Conference, Florence, Italy
September 17-20, 2007
3
III. Numerical Model
A version of the HP-Hall code originally developed by J. M. Fife [3] and modified by researchers at JPL [4] was
used to model the SPT-100. HP-Hall simulates the channel and near field regions of a Hall-thruster using a “hybrid-
PIC” approach that employs standard particle-in-cell (PIC) methods for the ions, while using fluid equations to
examine the electrons. Rather than modeling each individual ion, the code tracks the motion of clusters of ions,
aptly named “superparticles” [3].
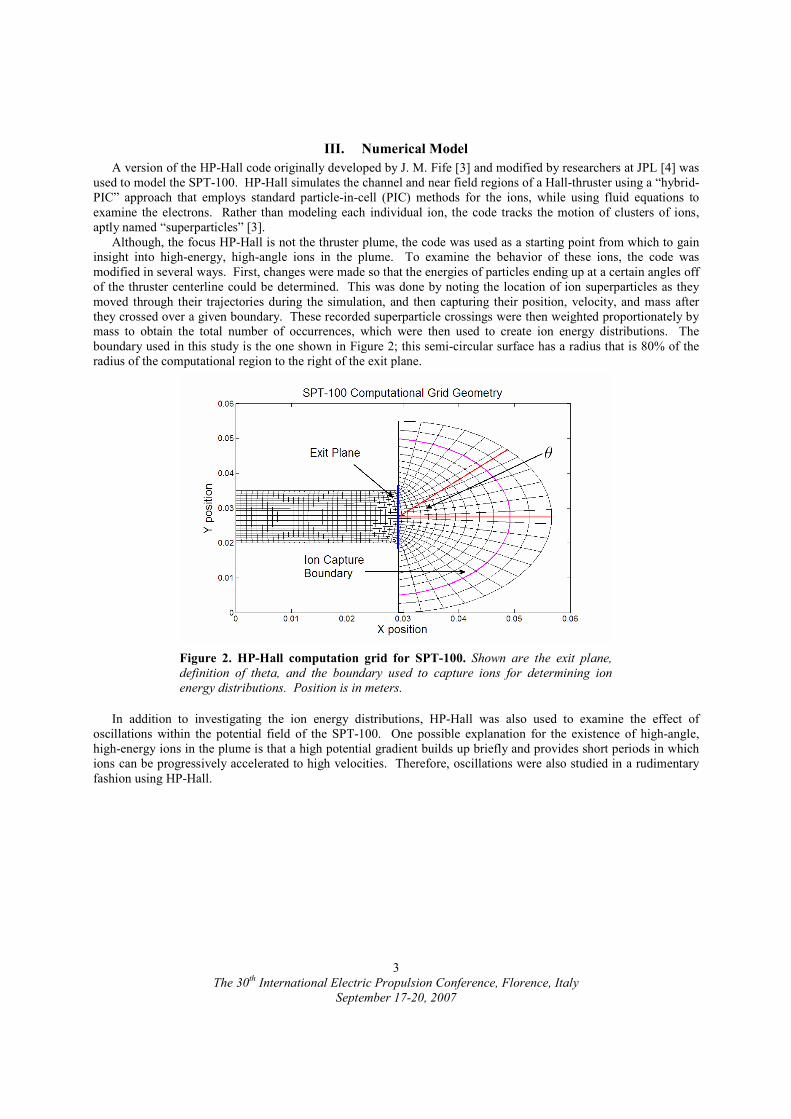
Although, the focus HP-Hall is not the thruster plume, the code was used as a starting point from which to gain
insight into high-energy, high-angle ions in the plume. To examine the behavior of these ions, the code was
modified in several ways. First, changes were made so that the energies of particles ending up at a certain angles off
of the thruster centerline could be determined. This was done by noting the location of ion superparticles as they
moved through their trajectories during the simulation, and then capturing their position, velocity, and mass after
they crossed over a given boundary. These recorded superparticle crossings were then weighted proportionately by
mass to obtain the total number of occurrences, which were then used to create ion energy distributions. The
boundary used in this study is the one shown in Figure 2; this semi-circular surface has a radius that is 80% of the
radius of the computational region to the right of the exit plane.
In addition to investigating the ion energy distributions, HP-Hall was also used to examine the effect of
oscillations within the potential field of the SPT-100. One possible explanation for the existence of high-angle,
high-energy ions in the plume is that a high potential gradient builds up briefly and provides short periods in which
ions can be progressively accelerated to high velocities. Therefore, oscillations were also studied in a rudimentary
fashion using HP-Hall.
Figure 2. HP-Hall computation grid for SPT-100. Shown are the exit plane,
definition of theta, and the boundary used to capture ions for determining ion
energy distributions. Position is in meters.
The 30th International Electric Propulsion Conference, Florence, Italy
September 17-20, 2007
4
IV. Results and Discussion
A. Results from the Experiment
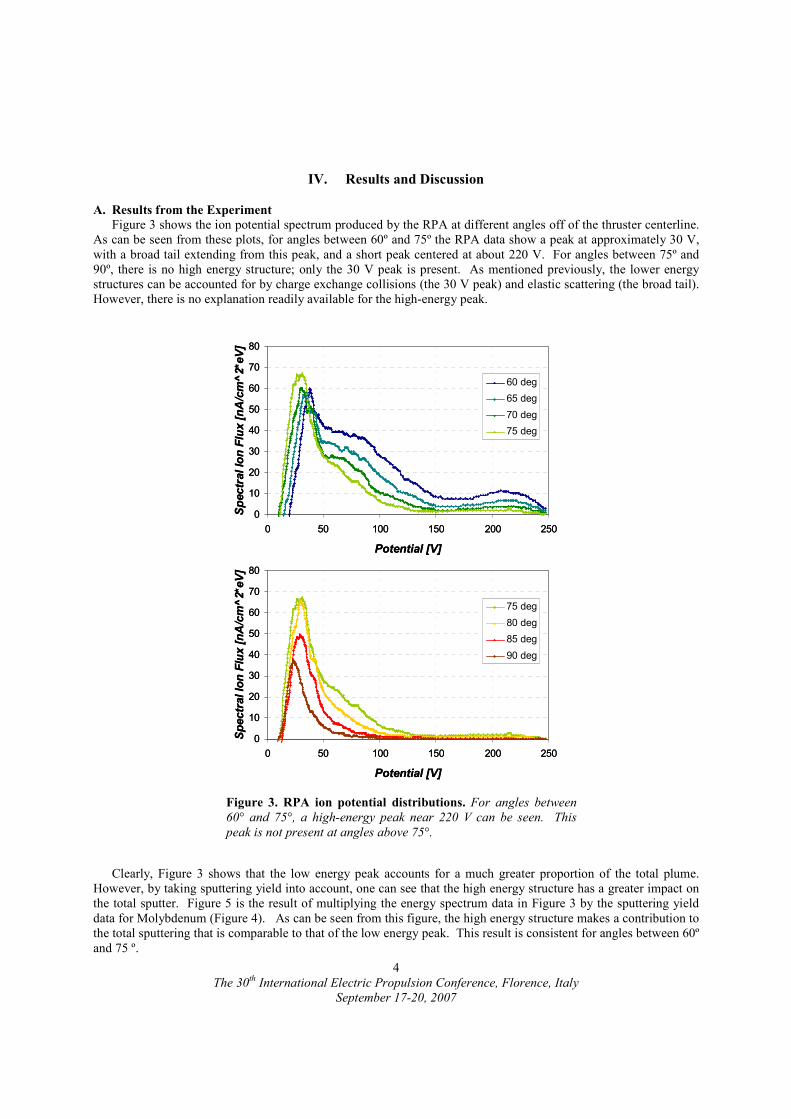
Figure 3 shows the ion potential spectrum produced by the RPA at different angles off of the thruster centerline.
As can be seen from these plots, for angles between 60º and 75º the RPA data show a peak at approximately 30 V,
with a broad tail extending from this peak, and a short peak centered at about 220 V. For angles between 75º and
90º, there is no high energy structure; only the 30 V peak is present. As mentioned previously, the lower energy
structures can be accounted for by charge exchange collisions (the 30 V peak) and elastic scattering (the broad tail).
However, there is no explanation readily available for the high-energy peak.
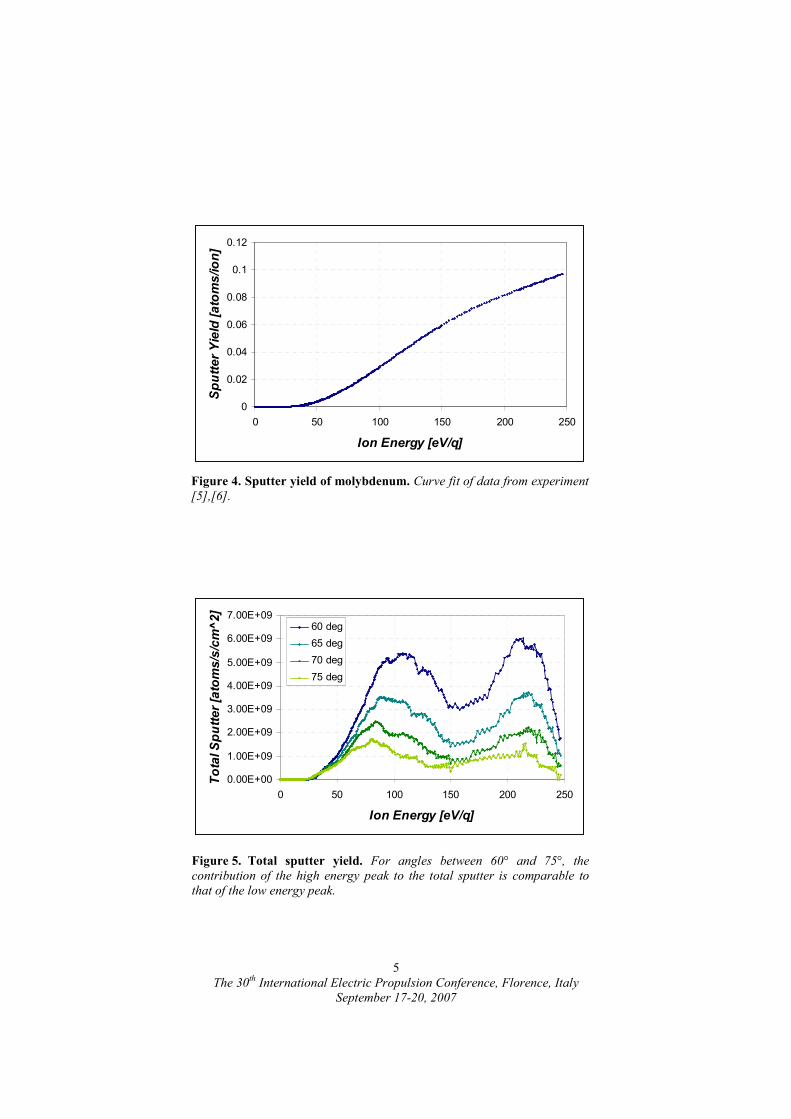
Clearly, Figure 3 shows that the low energy peak accounts for a much greater proportion of the total plume.
However, by taking sputtering yield into account, one can see that the high energy structure has a greater impact on
the total sputter. Figure 5 is the result of multiplying the energy spectrum data in Figure 3 by the sputtering yield
data for Molybdenum (Figure 4). As can be seen from this figure, the high energy structure makes a contribution to
the total sputtering that is comparable to that of the low energy peak. This result is consistent for angles between 60º
and 75 º.
0
10
20
30
40
50
60
70
80
0 50 100 150 200 250
Potential [V]
Spectral Ion Flux [nA/cm^2*eV]
60 deg
65 deg
70 deg
75 deg
0
10
20
30
40
50
60
70
80
0 50 100 150 200 250
Potential [V]
Spectral Ion Flux [nA/cm^2*eV]
75 deg
80 deg
85 deg
90 deg
0
10
20
30
40
50
60
70
80
0 50 100 150 200 250
Potential [V]
Spectral Ion Flux [nA/cm^2*eV]
60 deg
65 deg
70 deg
75 deg
0
10
20
30
40
50
60
70
80
0 50 100 150 200 250
Potential [V]
Spectral Ion Flux [nA/cm^2*eV]
75 deg
80 deg
85 deg
90 deg
Figure 3. RPA ion potential distributions. For angles between
60° and 75°, a high-energy peak near 220 V can be seen. This
peak is not present at angles above 75°.
The 30th International Electric Propulsion Conference, Florence, Italy
September 17-20, 2007
5
0.00E+00
1.00E+09
2.00E+09
3.00E+09
4.00E+09
5.00E+09
6.00E+09
7.00E+09
0 50 100 150 200 250
Ion Energy [eV/q]
Total Sputter [atoms/s/cm^2]
60 deg
65 deg
70 deg
75 deg
Figure 5. Total sputter yield. For angles between 60° and 75°, the
contribution of the high energy peak to the total sputter is comparable to
that of the low energy peak.
0
0.02
0.04
0.06
0.08
0.1
0.12
0 50 100 150 200 250
Ion Energy [eV/q]
Sputter Yield [atoms/ion]
Figure 4. Sputter yield of molybdenum. Curve fit of data from experiment
[5],[6].
The 30th International Electric Propulsion Conference, Florence, Italy
September 17-20, 2007
6
A. Results from the Model
1. Ion Energy Distributions
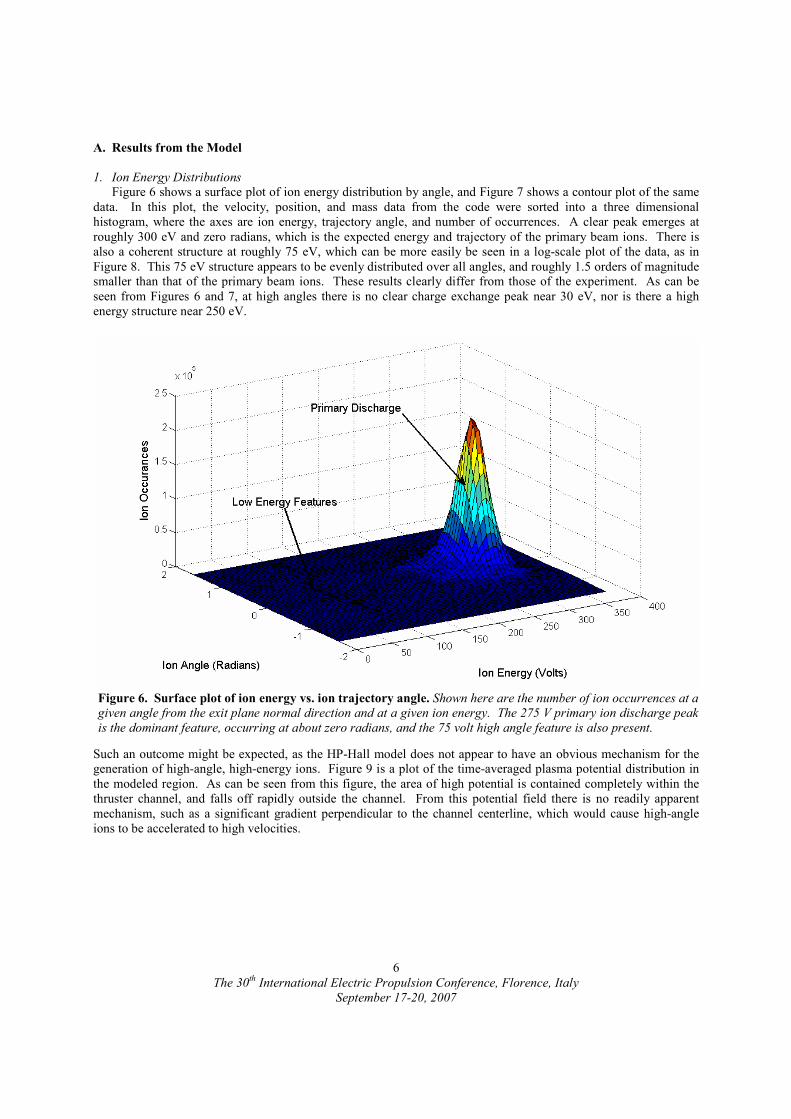
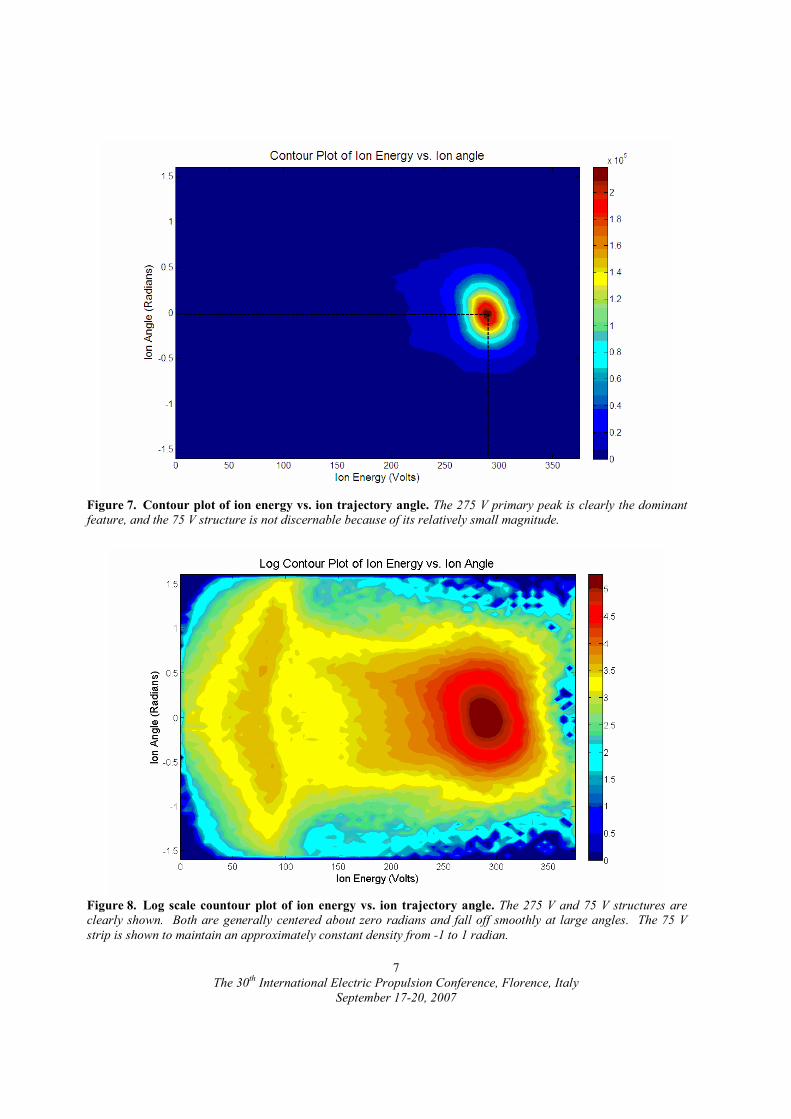
Figure 6 shows a surface plot of ion energy distribution by angle, and Figure 7 shows a contour plot of the same
data. In this plot, the velocity, position, and mass data from the code were sorted into a three dimensional
histogram, where the axes are ion energy, trajectory angle, and number of occurrences. A clear peak emerges at
roughly 300 eV and zero radians, which is the expected energy and trajectory of the primary beam ions. There is
also a coherent structure at roughly 75 eV, which can be more easily be seen in a log-scale plot of the data, as in
Figure 8. This 75 eV structure appears to be evenly distributed over all angles, and roughly 1.5 orders of magnitude
smaller than that of the primary beam ions. These results clearly differ from those of the experiment. As can be
seen from Figures 6 and 7, at high angles there is no clear charge exchange peak near 30 eV, nor is there a high
energy structure near 250 eV.
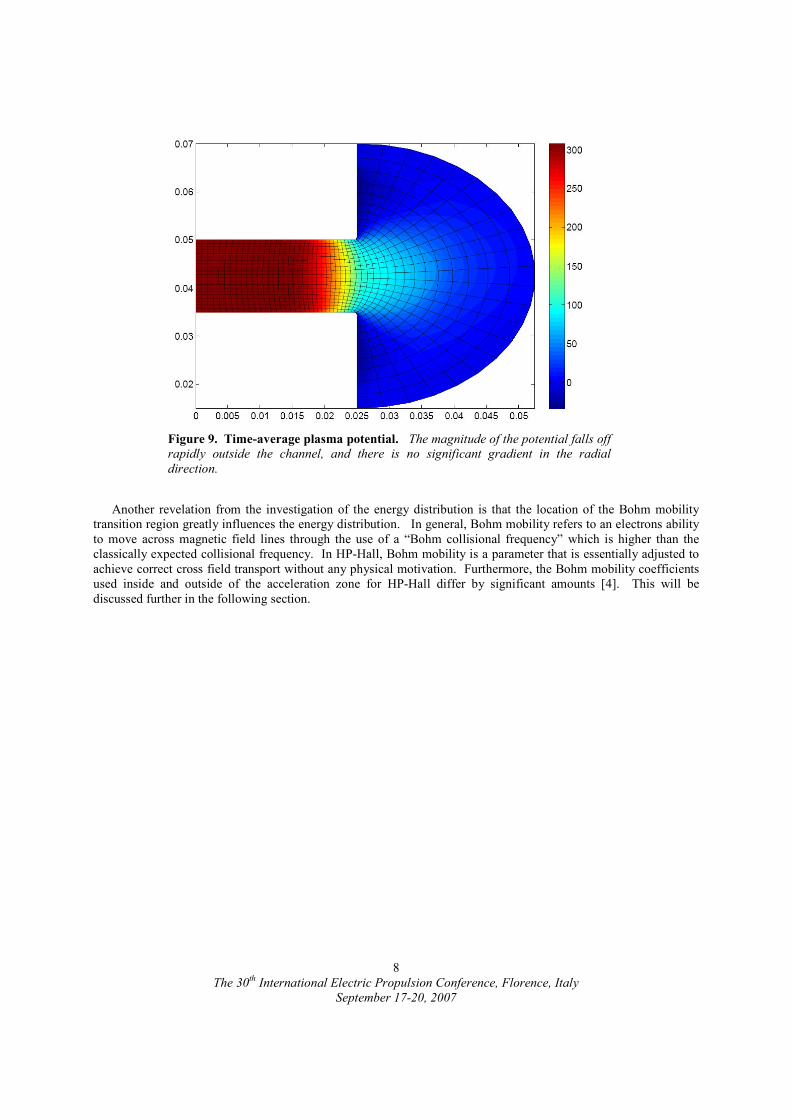
Such an outcome might be expected, as the HP-Hall model does not appear to have an obvious mechanism for the
generation of high-angle, high-energy ions. Figure 9 is a plot of the time-averaged plasma potential distribution in
the modeled region. As can be seen from this figure, the area of high potential is contained completely within the
thruster channel, and falls off rapidly outside the channel. From this potential field there is no readily apparent
mechanism, such as a significant gradient perpendicular to the channel centerline, which would cause high-angle
ions to be accelerated to high velocities.
Figure 6. Surface plot of ion energy vs. ion trajectory angle. Shown here are the number of ion occurrences at a
given angle from the exit plane normal direction and at a given ion energy. The 275 V primary ion discharge peak
is the dominant feature, occurring at about zero radians, and the 75 volt high angle feature is also present.
The 30th International Electric Propulsion Conference, Florence, Italy
September 17-20, 2007
7
Figure 8. Log scale countour plot of ion energy vs. ion trajectory angle. The 275 V and 75 V structures are
clearly shown. Both are generally centered about zero radians and fall off smoothly at large angles. The 75 V
strip is shown to maintain an approximately constant density from -1 to 1 radian.
Figure 7. Contour plot of ion energy vs. ion trajectory angle. The 275 V primary peak is clearly the dominant
feature, and the 75 V structure is not discernable because of its relatively small magnitude.
The 30th International Electric Propulsion Conference, Florence, Italy
September 17-20, 2007
8
Another revelation from the investigation of the energy distribution is that the location of the Bohm mobility
transition region greatly influences the energy distribution. In general, Bohm mobility refers to an electrons ability
to move across magnetic field lines through the use of a “Bohm collisional frequency” which is higher than the
classically expected collisional frequency. In HP-Hall, Bohm mobility is a parameter that is essentially adjusted to
achieve correct cross field transport without any physical motivation. Furthermore, the Bohm mobility coefficients
used inside and outside of the acceleration zone for HP-Hall differ by significant amounts [4]. This will be
discussed further in the following section.
Figure 9. Time-average plasma potential. The magnitude of the potential falls off
rapidly outside the channel, and there is no significant gradient in the radial
direction.
The 30th International Electric Propulsion Conference, Florence, Italy
September 17-20, 2007
9
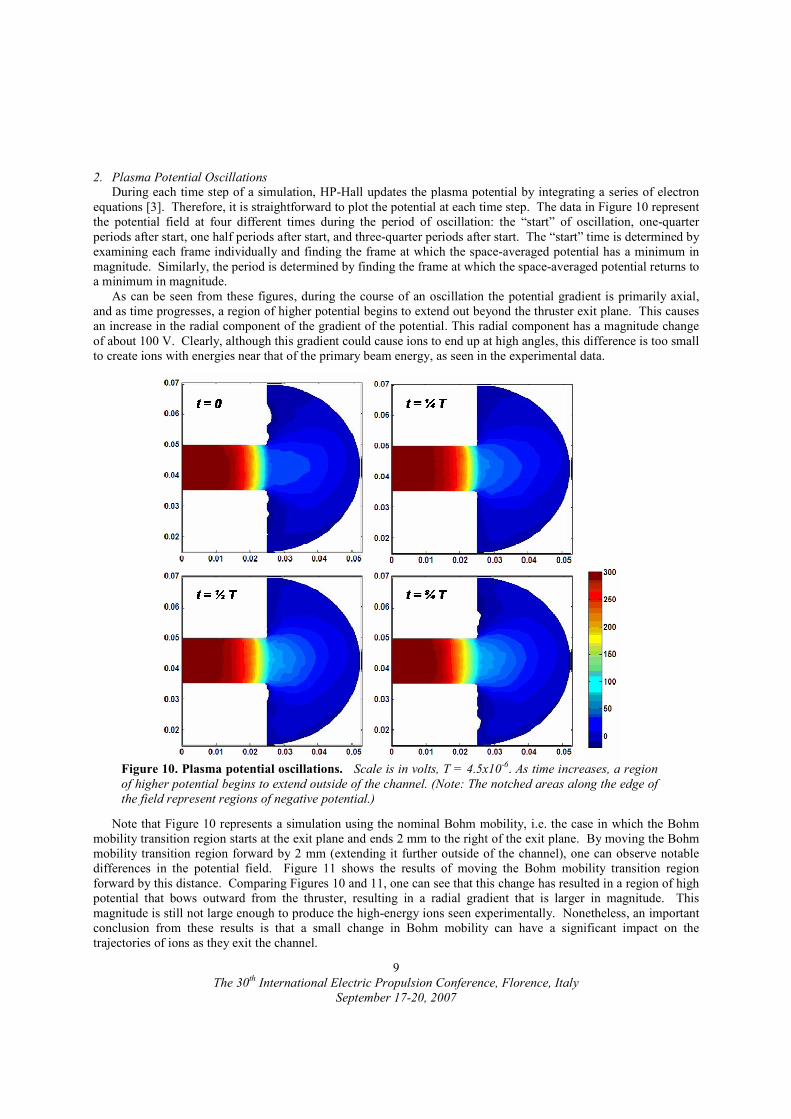
2. Plasma Potential Oscillations
During each time step of a simulation, HP-Hall updates the plasma potential by integrating a series of electron
equations [3]. Therefore, it is straightforward to plot the potential at each time step. The data in Figure 10 represent
the potential field at four different times during the period of oscillation: the “start” of oscillation, one-quarter
periods after start, one half periods after start, and three-quarter periods after start. The “start” time is determined by
examining each frame individually and finding the frame at which the space-averaged potential has a minimum in
magnitude. Similarly, the period is determined by finding the frame at which the space-averaged potential returns to
a minimum in magnitude.
As can be seen from these figures, during the course of an oscillation the potential gradient is primarily axial,
and as time progresses, a region of higher potential begins to extend out beyond the thruster exit plane. This causes
an increase in the radial component of the gradient of the potential. This radial component has a magnitude change
of about 100 V. Clearly, although this gradient could cause ions to end up at high angles, this difference is too small
to create ions with energies near that of the primary beam energy, as seen in the experimental data.
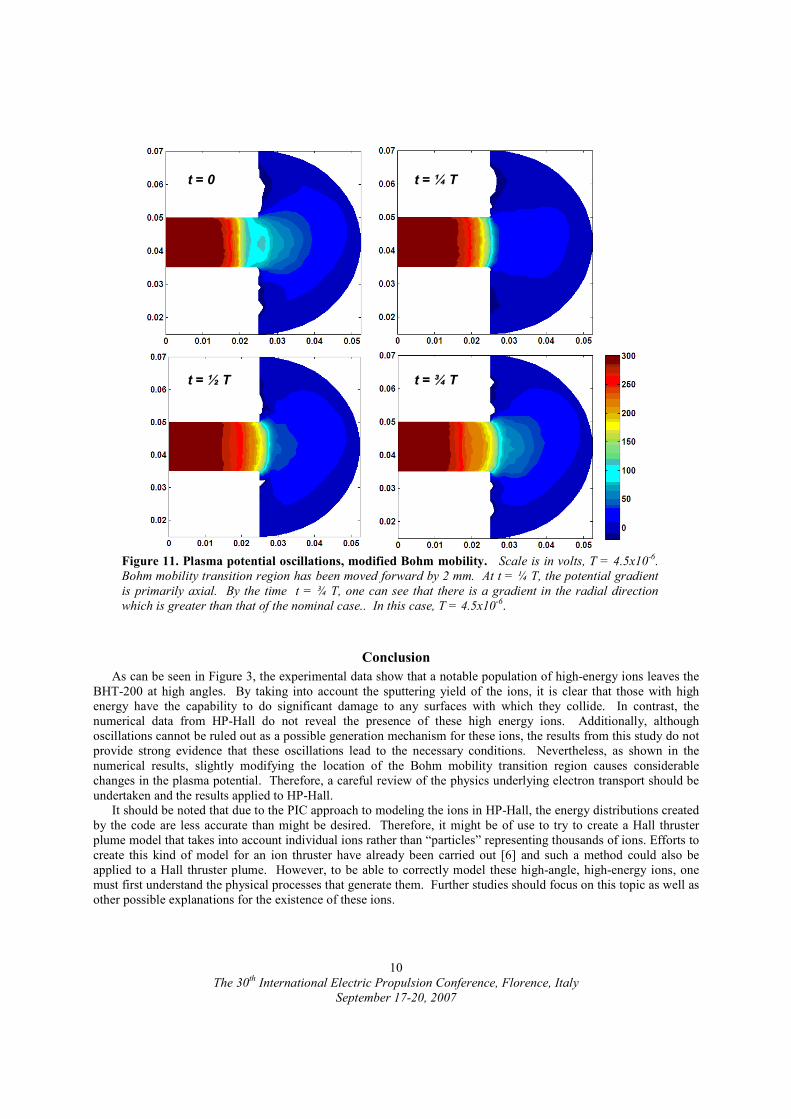
Note that Figure 10 represents a simulation using the nominal Bohm mobility, i.e. the case in which the Bohm
mobility transition region starts at the exit plane and ends 2 mm to the right of the exit plane. By moving the Bohm
mobility transition region forward by 2 mm (extending it further outside of the channel), one can observe notable
differences in the potential field. Figure 11 shows the results of moving the Bohm mobility transition region
forward by this distance. Comparing Figures 10 and 11, one can see that this change has resulted in a region of high
potential that bows outward from the thruster, resulting in a radial gradient that is larger in magnitude. This
magnitude is still not large enough to produce the high-energy ions seen experimentally. Nonetheless, an important
conclusion from these results is that a small change in Bohm mobility can have a significant impact on the
trajectories of ions as they exit the channel.
Figure 10. Plasma potential oscillations. Scale is in volts, T = 4.5x10
-6. As time increases, a region
of higher potential begins to extend outside of the channel. (Note: The notched areas along the edge of
the field represent regions of negative potential.)
The 30th International Electric Propulsion Conference, Florence, Italy
September 17-20, 2007
10
Conclusion
As can be seen in Figure 3, the experimental data show that a notable population of high-energy ions leaves the
BHT-200 at high angles. By taking into account the sputtering yield of the ions, it is clear that those with high
energy have the capability to do significant damage to any surfaces with which they collide. In contrast, the
numerical data from HP-Hall do not reveal the presence of these high energy ions. Additionally, although
oscillations cannot be ruled out as a possible generation mechanism for these ions, the results from this study do not
provide strong evidence that these oscillations lead to the necessary conditions. Nevertheless, as shown in the
numerical results, slightly modifying the location of the Bohm mobility transition region causes considerable
changes in the plasma potential. Therefore, a careful review of the physics underlying electron transport should be
undertaken and the results applied to HP-Hall.
It should be noted that due to the PIC approach to modeling the ions in HP-Hall, the energy distributions created
by the code are less accurate than might be desired. Therefore, it might be of use to try to create a Hall thruster
plume model that takes into account individual ions rather than “particles” representing thousands of ions. Efforts to
create this kind of model for an ion thruster have already been carried out [6] and such a method could also be
applied to a Hall thruster plume. However, to be able to correctly model these high-angle, high-energy ions, one
must first understand the physical processes that generate them. Further studies should focus on this topic as well as
other possible explanations for the existence of these ions.
t = 0 t = ¼ T
t = ½ T t = ¾ T
t = 0 t = ¼ T
t = ½ T t = ¾ T
Figure 11. Plasma potential oscillations, modified Bohm mobility. Scale is in volts, T = 4.5x10
-6.
Bohm mobility transition region has been moved forward by 2 mm. At t = ¼ T, the potential gradient
is primarily axial. By the time t = ¾ T, one can see that there is a gradient in the radial direction
which is greater than that of the nominal case.. In this case, T = 4.5x10⁻⁶.
The 30th International Electric Propulsion Conference, Florence, Italy
September 17-20, 2007
11
References
[1] Mikellides, I.G., Katz, I., Kuharski, R.A., and Mandell, M.J., “Elastic Scattering of Ions in Electrostatic
Thruster Plumes,” Journal of Propulsion and Power, Vol. 21, No. 1, 2005, pp. 111-118.
[2] Hofer, R.R., Haas, J.M., and Gallimore, A.D., “Ion Voltage Diagnostics in the Far-Field Plume of a High-
Specific Impulse Hall Thruster,” Joint Propulsion Conference and Exhibit, 2003-4556, AIAA, Ann Arbor, MI,
2003.
[3] Fife, J.M., “Hybrid-PIC Modeling and Electrostatic Probe Survey of Hall Thrusters,” PhD Thesis,
Massachusetts Institute of Technology, Sept. 1998.
[4] Hofer, R.R., Mikellides, I.G., and Goebel, D. M., “Wall Sheath and Electron Mobility Modeling in Hybrid-PIC
Hall Thruster Simulations,” Joint Propulsion Conference and Exhibit, 2007-5267, AIAA, Cincinnati, OH, 2007.
[5] Doerner, R. P., Whyte, D.G., Goebel, D.M., “Sputtering Yield Measurements During Low Energy Xenon
Plasma Bombardment,” Journal of Applied Physics, Vol. 93, No. 9, 2003, pp. 5816-5823.
[6] Morris, B., “Charge-Exchange Collision Dynamics and Ion Engine Grid Geometry Optimization, PhD Thesis,
California Institute of Technology, Sept. 2006.