Embed Size (px)
Citation preview
Investigation of heat generation sources in sonic infrared thermography using laser Doppler vibrometry
by R. Montanini*, F. Freni*
*Dept. of Industrial Chemistry and Materials Engineering, University of Messina, Viale F. Stagno D’Alcontres 31- 98166 Messina, Italy, [email protected], [email protected]
Abstract
This study aims to investigate the fundamental physics governing the damping-related heat generation and thermal diffusion processes in ultrasound excited infrared thermography. Experimental tests were carried out on a AISI 304 steel beam in which an array of synthetic defects, consisting of 27 flat-bottom holes filled with a viscous material, has been manufactured. The relationship between vibration mode shape, ultrasound excitation frequency and energy dissipation in defective areas is examined by means of concurrent measurements performed by means of sonic activated infrared thermography and scanning laser Doppler vibrometry.
1. Introduction
Sonic infrared thermography (also called vibrothermography) is a sensitive, very fast, and full-field imaging NDE technique that uses ultrasound-generated heat as defect detection mechanism. The basic principle is based on theory that, as defects may be areas where mechanical damping, plasticity and friction losses primarily take place, the high frequency vibration energy is converted into heat mainly in defects than in sound areas, resulting in a defect selective dark field method [1-3]. The reversible thermoelastic heating and cooling, caused by the induced vibrations in the tens of kilohertz range, are averaged out over the integration time of the IR camera, which is typically around one millisecond. Hence, only irreversible heating is imaged by the IR camera. The heating mechanism in sonic thermography is therefore different from that of stress pattern analysis by thermal emission (SPATE), in which the detection of periodic thermoelastic temperature variations is synchronized with the sinusoidal stress-induced heating and cooling.
Basically, two different approaches are used to implement sonic thermography. In the first one, known as ultrasound lock-in thermography (ULT), the high frequency ultrasonic wave used to excite the sample is amplitude modulated at a very low frequency (a few tens of mHz) and the recorded sequence of images is processed in the frequency domain, producing two images: an amplitude image and a phase image. This thermal imaging technique, which has been first developed by the research group of G. Busse in Stuttgart [4-6], has the advantage of being phase-sensitive, allowing flaw depth to be retrieved from the phase lag. In addition, it requires only a relatively low excitation power to heat the defect, thus preventing potential damage of the inspected part caused by high-amplitude vibrations. ULT has been proposed in recent years as an effective NDT method in a number of applications, such as imaging of aerospace structures [7], non-destructive testing of adhesive joints and riveted structures [8], maintenance of CFRP rims [9], qualification of industrial cast iron turbocharger components [10] and cracks detection in steel load bearing members [11]. Acoustic excitation can also be accomplished by using short sonic multi-frequency bursts (UBP) [12] or wideband frequency sweeps (UST) [13] in order to reduce the testing time and eliminate the effects related to the onset of undesirable standing wave patterns caused by ultrasound frequency matching with structural resonances.
In the second implementation, known as pulsed sonic thermography (PST), a high frequency (typically 20-40 KHz) vibration pulse is applied for a short time (normally less than one second) to produce localized frictional heating at the defect and an infrared camera is used to record the sequence of images of the entire time evolution of the heating process [3]. In this way very quick defect detection can be achieved. For typical complex shaped industrial parts, reflections from various boundaries of the specimen introduce countless conversions among the vibrational modes, leading to a very complicated sound pattern within the part that completely insonifies the regions under inspection during the application of the ultrasonic pulse. However, if a subsurface flaw is present, relative motion between opposing surfaces at the interface will occur, giving rise to concomitant local dissipation of mechanical energy. The flaw thus becomes an internal heating source, which propagates in the material through thermal diffusion and can be revealed by monitoring its effect on the surface temperature distribution.
While sonic thermography has been successfully applied to imaging defects in either metallic or non-metallic materials, both experimental works [14-17] and numerical simulations [18] provided evidence that heat generation mechanisms are, for a given sample geometry and constraint condition, strongly dependent on the ultrasonic frequency as well as tip-specimen coupling. Therefore, in order to predict defect detectability or identify heat generation sources, the excited mode shapes (vibration profiles) of the structure must be investigated.
Recent studies have shown that cracks heating in cracked metallic beams is primarily generated by frictional rubbing on crack faces and local plastic deformations past the crack tip [16-17]. As defects without contact surfaces (like air porosity in castings or delaminations in polymer composites) are considered, these mechanisms are no longer
11th International Conference on
Quantitative InfraRed Thermography
http://dx.doi.org/10.21611/qirt.2012.177
effective in explaining heat generation. Hence, vibration damping [14] and visco-elastic effects [19] are expected to play a key role in this case, providing the stress level is kept well within the point of yield.
Since the physical processes contributing to the measured temperature variations at the sample surface after mechanical excitation are rather complex, the use of artificial defects may be helpful in order to investigate the basic mechanisms of heat generation in sonic thermography. Recently, Renshaw et al. described a method to create viscous material-filled synthetic defects that generate heat when exposed to vibration [20]. They found that honey was able to fill drilled holes manufactured into a titanium beam sample, generating heat very efficiently when the beam is vibrating in resonant modes. Their experimental setup consisted of a piezoelectric stack transducer used to excite vibrations at specific frequencies corresponding to flexural resonances of the test beam and a laser vibrometer exploited to measure the vibration response.
In this paper a similar experiment was carried out to investigate the fundamental physics governing the heat generation and diffusion processes in ultrasound thermography. The heating response of a steel beam containing an array of viscous material-filled back-drilled holes was evaluated by using a low power ultrasonic harmonic excitation, concurrently measuring the vibration profile of the beam at specific eigenmodes by means of a scanning laser Doppler vibrometer.
2. Materials and methods
2.1. Specimen fabrication
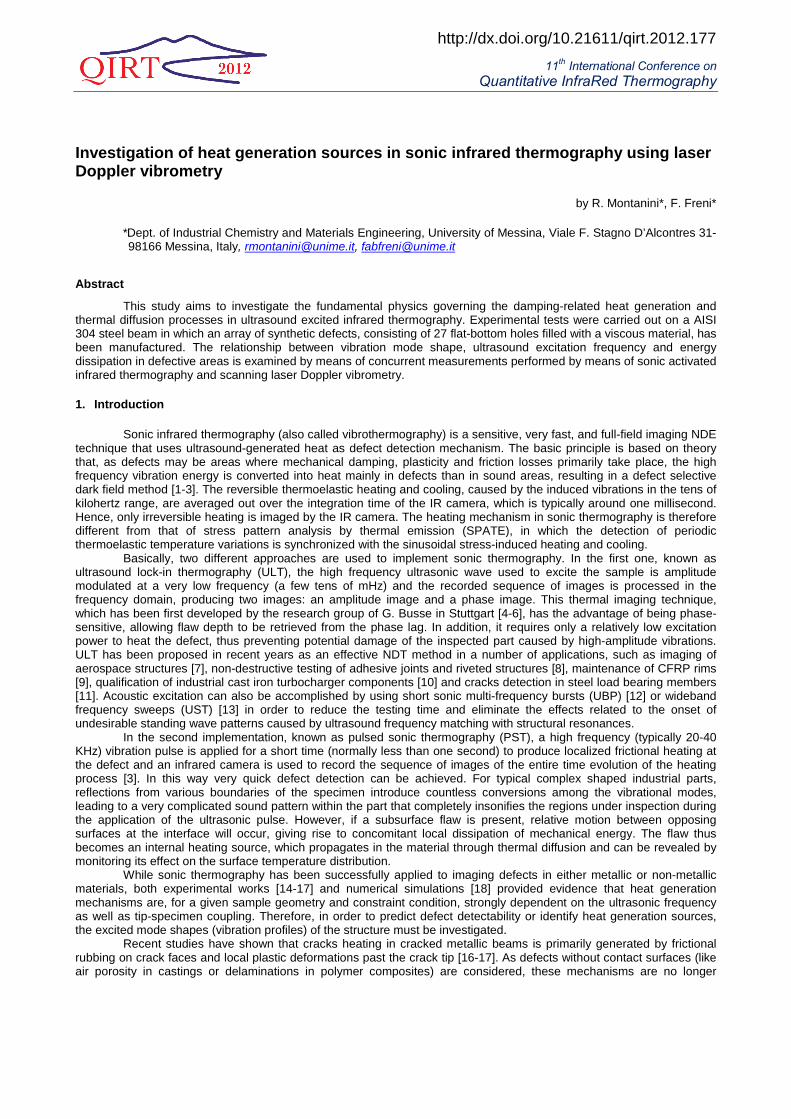
An array of artificial defects consisting of 9×3 flat-bottom back-drilled holes was manufactured in a AISI 304 steel beam having dimensions (L×W×H) of 320×50×8 mm. The holes have a diameter of 8.5 mm, a depth of 6 mm, a horizontal spacing of 36 mm, and a vertical spacing of 14 mm (figure 1). The synthetic defects were filled with honey, using the same method described in [20], and then covered with a thin layer of matt paint that serves both to trap the viscous filling material and to increase the emissivity of the sample surface.
Fig. 1. Schematic drawing of test beam with flat-bottom viscous filled synthetic defects (not in scale, dimensions in mm)
2.2. Experimental setup
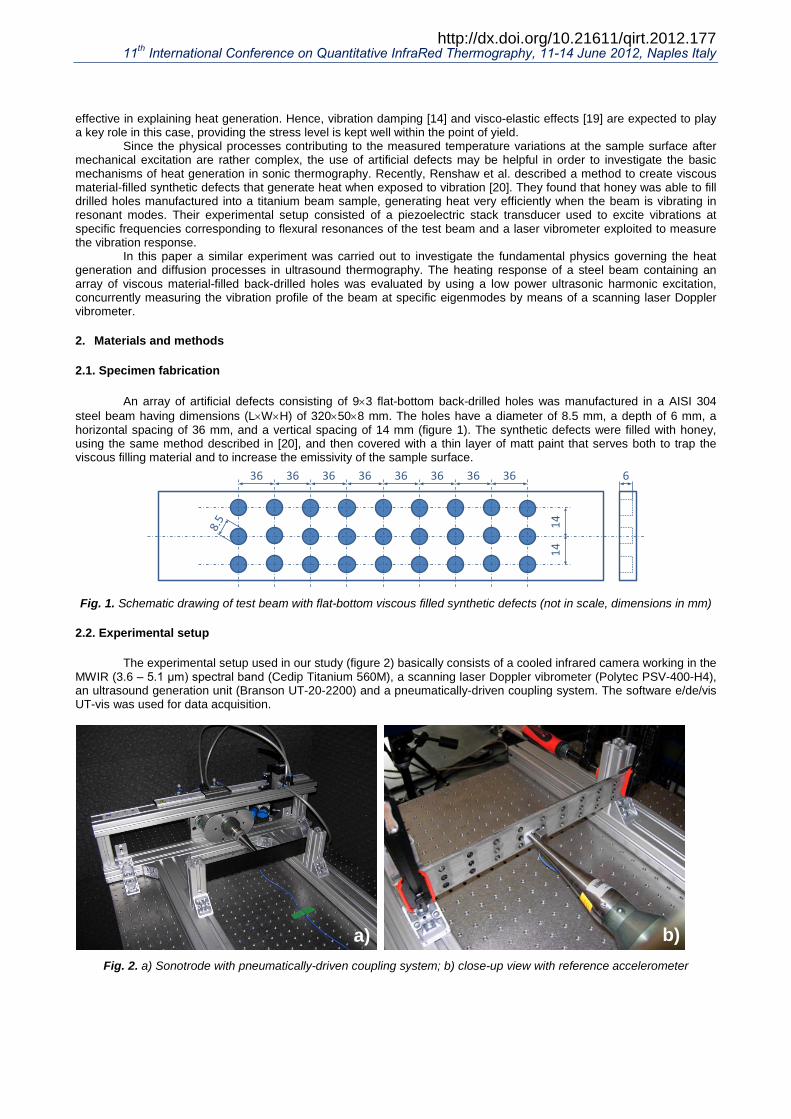
The experimental setup used in our study (figure 2) basically consists of a cooled infrared camera working in the MWIR (3.6 – 5.1 μm) spectral band (Cedip Titanium 560M), a scanning laser Doppler vibrometer (Polytec PSV-400-H4), an ultrasound generation unit (Branson UT-20-2200) and a pneumatically-driven coupling system. The software e/de/vis UT-vis was used for data acquisition.
Fig. 2. a) Sonotrode with pneumatically-driven coupling system; b) close-up view with reference accelerometer
14
36 36 36 36 36 36 36 36
14
6
a) b)
11th International Conference on Quantitative InfraRed Thermography, 11-14 June 2012, Naples Italy
http://dx.doi.org/10.21611/qirt.2012.177
The ultrasound generator and the pneumatically-driven coupling system were mounted on a optical table together with fixtures used for clamping the test beam, which was rigidly fixed at both ends using two M10 bolts for each side. Vibration and heating data were measured across an area of about 300×40 mm.
The sonotrode of the ultrasound generation unit was coupled to the beam through a thin foil of Teflon. A careful alignment of the pneumatically-driven system was made to allow efficient injection of ultrasound energy into the specimen, avoiding excessive pre-loading of the beam. Tests were performed by varying the site of energy input (i.e. the relative position of the sonotrode horn) as well as the ultrasonic amplitude.
Both the laser vibrometer head and the infrared camera were positioned in front of the accessible beam surface, one above each other, with their axes focused onto the symmetry plane of the clamped specimen. The laser beam was carefully aligned perpendicularly to the target surface (in order to measure the out-of-plane component of the velocity vector), while the IR camera viewed the target surface with a small tilt angle (about ten degrees). A piezoelectric accelerometer was also mounted on the rear surface of the beam to provide a reference signal for phase information.
All the experimental tests were performed inside a (3×2×2) m3 pseudo semi-anechoic chamber, realized by means of 50 mm thick corrugated PU foam panels bonded to 3 mm of spring foam.
2.3. Experimental procedure
Out-of-plane vibrational velocity measurements were carried out by scanning laser Doppler vibrometry (LDV) upon definition of a 13 x 3 grid on the accessible specimen surface. A preliminary test was performed by using a sweep ultrasonic excitation signal in the 15.5 - 19.5 kHz frequency range, in order to identify the beam resonance modes. Three measurements were made for each point, and hence averaged to compute the FFT spectrum with 6400 spectral lines. Then the beam was excited, at each resonant frequency, with a single frequency sine signal at 16% (about 350 W) nominal amplitude power, and the vibration and heating response of the beam surface were measured simultaneously.
Average vibration amplitudes were calculated by computing the frequency response function with respect to the signal of the reference accelerometer. Heating profiles were obtained by averaging the temperature values measured across the three defective regions (i.e., subsurface holes) belonging to the same beam section (beam sections are identified by different colours in the following figures). Average heating profiles have then been plotted as a function of time and the mean temperature rise slopes have been calculated by performing a linear regression of the experimental data.
3. Results
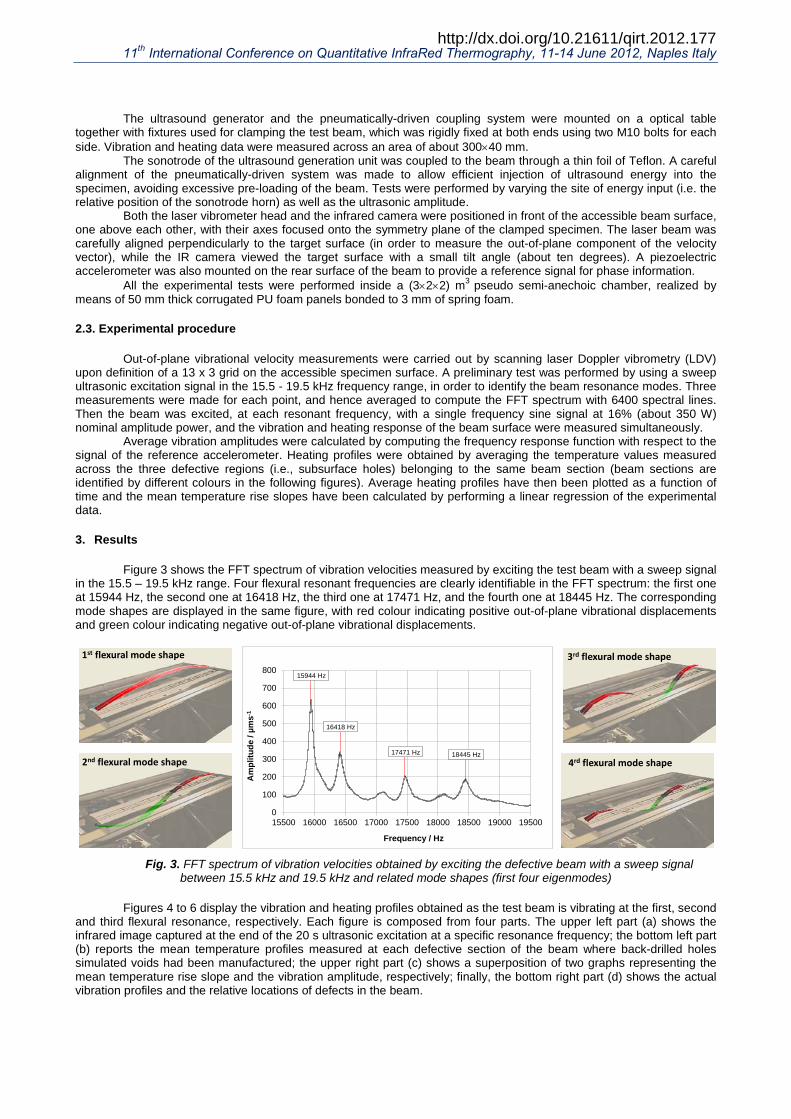
Figure 3 shows the FFT spectrum of vibration velocities measured by exciting the test beam with a sweep signal in the 15.5 – 19.5 kHz range. Four flexural resonant frequencies are clearly identifiable in the FFT spectrum: the first one at 15944 Hz, the second one at 16418 Hz, the third one at 17471 Hz, and the fourth one at 18445 Hz. The corresponding mode shapes are displayed in the same figure, with red colour indicating positive out-of-plane vibrational displacements and green colour indicating negative out-of-plane vibrational displacements.
Fig. 3. FFT spectrum of vibration velocities obtained by exciting the defective beam with a sweep signal
between 15.5 kHz and 19.5 kHz and related mode shapes (first four eigenmodes)
Figures 4 to 6 display the vibration and heating profiles obtained as the test beam is vibrating at the first, second and third flexural resonance, respectively. Each figure is composed from four parts. The upper left part (a) shows the infrared image captured at the end of the 20 s ultrasonic excitation at a specific resonance frequency; the bottom left part (b) reports the mean temperature profiles measured at each defective section of the beam where back-drilled holes simulated voids had been manufactured; the upper right part (c) shows a superposition of two graphs representing the mean temperature rise slope and the vibration amplitude, respectively; finally, the bottom right part (d) shows the actual vibration profiles and the relative locations of defects in the beam.
0
100
200
300
400
500
600
700
800
15500 16000 16500 17000 17500 18000 18500 19000 19500
Am
plitu
de /
µms-
1
Frequency / Hz
15944 Hz
17471 Hz
16418 Hz
18445 Hz
1st flexural mode shape
2nd flexural mode shape
3rd flexural mode shape
4rd flexural mode shape
11th International Conference on Quantitative InfraRed Thermography, 11-14 June 2012, Naples Italy
http://dx.doi.org/10.21611/qirt.2012.177
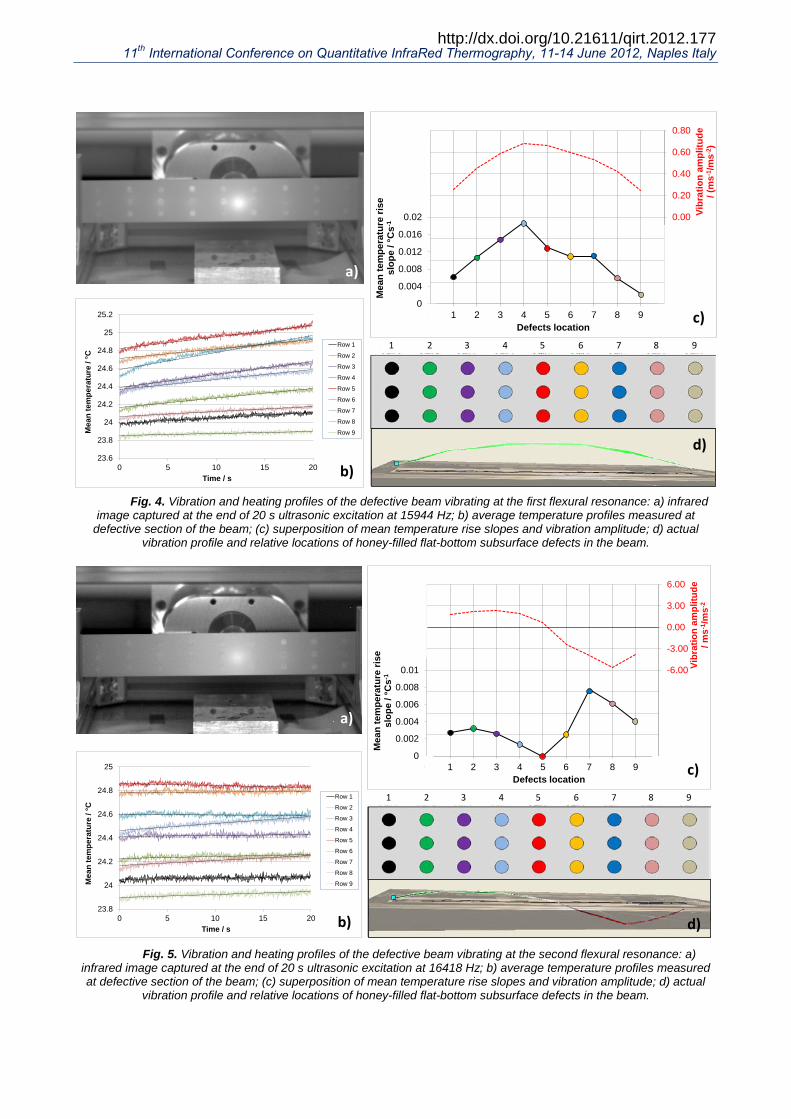
Fig. 4. Vibration and heating profiles of the defective beam vibrating at the first flexural resonance: a) infrared
image captured at the end of 20 s ultrasonic excitation at 15944 Hz; b) average temperature profiles measured at defective section of the beam; (c) superposition of mean temperature rise slopes and vibration amplitude; d) actual
vibration profile and relative locations of honey-filled flat-bottom subsurface defects in the beam.
Fig. 5. Vibration and heating profiles of the defective beam vibrating at the second flexural resonance: a)
infrared image captured at the end of 20 s ultrasonic excitation at 16418 Hz; b) average temperature profiles measured at defective section of the beam; (c) superposition of mean temperature rise slopes and vibration amplitude; d) actual
vibration profile and relative locations of honey-filled flat-bottom subsurface defects in the beam.
23.6
23.8
24
24.2
24.4
24.6
24.8
25
25.2
0 5 10 15 20
Mea
n te
mpe
ratu
re /
°C
Time / s
Row 1
Row 2
Row 3
Row 4
Row 5
Row 6
Row 7
Row 8
Row 9
1 2 3 4 5 6 7 8 9
a)
b)
d)
-0.80
-0.60
-0.40
-0.20
0.00
0.20
0.40
0.60
0.80
0
0.004
0.008
0.012
0.016
0.02
0.024
0.028
0.032
0.036
0.04
0 1 2 3 4 5 6 7 8 9 10
Vibr
atio
n am
plitu
de
/ (m
s-1 /m
s-2 )
Mea
n te
mpe
ratu
re ri
se
slop
e / °
Cs-
1
Defects locationc)
23.8
24
24.2
24.4
24.6
24.8
25
0 5 10 15 20
Mea
n te
mpe
ratu
re /
°C
Time / s
Row 1
Row 2
Row 3
Row 4
Row 5
Row 6
Row 7
Row 8
Row 9
1 2 3 4 5 6 7 8 9
-18.00
-15.00
-12.00
-9.00
-6.00
-3.00
0.00
3.00
6.00
0
0.002
0.004
0.006
0.008
0.01
0.012
0.014
0.016
0.018
0.02
0 1 2 3 4 5 6 7 8 9 10
Vibr
atio
n am
plitu
de
/ ms-
1 /ms-
2
Mea
n te
mpe
ratu
re ri
se
slop
e / °
Cs-
1
Defects location
a)
b) d)
c)
11th International Conference on Quantitative InfraRed Thermography, 11-14 June 2012, Naples Italy
http://dx.doi.org/10.21611/qirt.2012.177

Fig. 6. Vibration and heating profiles of the defective beam vibrating at the third flexural resonance: a) infrared
image captured at the end of 20 s ultrasonic excitation at 17471 Hz; b) average temperature profiles measured at defective section of the beam; (c) superposition of mean temperature rise slopes and vibration amplitude; d) actual
vibration profile and relative locations of honey-filled flat-bottom subsurface defects in the beam.
4. Discussion
In this study the fundamental physics governing the heat generation and diffusion processes in sonic infrared thermography has been investigated by carrying out concurrent measurements of the heating response and the vibrational mode shape on a steel beam in which an array of synthetics defects consisting of honey-filled flat-bottom holes have been made to simulate void flaws. The source of heat generation in sonic thermography is usually a combination of different concomitant heating mechanisms [16] and strongly depends on the overall shape of the specimen and the location of defect within the pattern of resonances [17]. Designing specific laboratory experiments on bench test sample targets provides a means to determine contributions from different heat-generating mechanisms. In our experiment, friction losses and plasticity do not occur, since there are no contact surfaces than can generate heat by frictional rubbing nor plastic deformations (because of the low ultrasonic power used to excite the specimen). Therefore, the only dissipative mechanism that can explain heat generation in defective regions is vibration damping related to visco-elastic effects.
The obtained results, reported in figures 4 to 6, show that, for each eigenmode, subsurface defects located in regions near antinodes heated significantly, while those located in regions near antinodes barely heat. Therefore, our experiments suggest that there is a strong correlation between the damping-related heating rate of void-type subsurface defects and the actual mode shape of the vibrating structure when the latter is excited at one of its resonance frequency. For low power ultrasonic excitation, as that considered in this study, the maximum temperature increase at defect location was typically about 0.48°C for the first mode, 0.21°c for the second mode and 0.16°C for the third mode. Although rather low, this temperature difference might be easily detected also by an uncooled infrared camera.
Moreover, it can be highlighted that velocity amplitudes are proportional to defects mean temperature rise slope; hence, the vibration amplitude affects the amount of heat generated. In fact, FFT analysis shows different resonance peak amplitudes, equal to 640 µm∙s-1 for the first mode, 346 µm∙s-1 for the second mode, 208 µm∙s-1 for the third mode and 184 µm∙s-1 for the fourth mode, thus following the same trend as defects heating rate. A larger vibration amplitude corresponds to a faster heating of the defect. The fourth flexural resonance, whose amplitude is much lower than minor order modes, did not produce an appreciable heating of the defective regions, and for this reason results have not been reported here. After the link between vibration input and thermal output has been established, it will be possible to find the minimum threshold vibrational amplitude that allows reliable flaw detection for a specific sample geometry.
The influence of holes size and depth on the amount of heat generated was not investigated in this study. Smaller synthetic defects placed at greater depth underneath the beam surface are expected to generate less heat for a certain vibration amplitude. Further experiments are needed to prove this statement.
23.8
24
24.2
24.4
24.6
24.8
25
0 5 10 15 20
Mea
n te
mpe
ratu
re /
°C
Time / s
Row 1
Row 2
Row 3
Row 4
Row 5
Row 6
Row 7
Row 8
Row 9
1 2 3 4 5 6 7 8 9
-9.00
-7.50
-6.00
-4.50
-3.00
-1.50
0.00
1.50
3.00
0
0.001
0.002
0.003
0.004
0.005
0.006
0.007
0.008
0.009
0.01
0 1 2 3 4 5 6 7 8 9 10
Vibr
atio
n am
plitu
de
/ ms-
1 /ms-
2
Mea
n te
mpe
ratu
re ri
se
slop
e / °
Cs-
1
Defects location
a)
b) d)
c)
11th International Conference on Quantitative InfraRed Thermography, 11-14 June 2012, Naples Italy
http://dx.doi.org/10.21611/qirt.2012.177
Another aspect of practical interest would be to compare the effect of the type of ultrasonic excitation (ULT, UST, UBP, PST) at matched vibration amplitudes to investigate the relative efficiency of each approach in terms of heat generation.
5. Conclusions
Although vibrothermography has proven to be a useful NDT technique for the detection of different kind of buried flaws, there is still a lack of understanding of the physics governing the heat generation process in vibrating defects. More experimental studies are needed to help explaining the heating mechanisms and their correlation with the resonant pattern of the structure, especially as complex geometries are considered. This will lay the bases for the development of more reliable theoretical and numerical models allowing to calculate the surface temperature produced by buried heat sources (defects) when mechanically excited in the ultrasonic range.
REFERENCES
[1] Mignogna R. B., Green R. E., Duke J., Henneke E. G., Reifsnider K. L., “Thermographic investigation of high-power ultrasonic heating in materials”, Ultrasonics 7, p.159-163, 1981.
[2] Rantala J., Wu D., Busse G., “NDT of polymer materials using lock-in thermography with water-coupled ultrasonic excitation”, NDT&E International, vol. 31(1), pp.43-49, 1998.
[3] Favro L.D., Han X., Ouyang Z., Sun G., Sui H., Thomas R.L., “Infrared imaging of defects heated by a sonic pulse”, Review of Scientific Instruments, vol. 71(6), pp.2418-2421, 2000.
[4] Rantala J., Wu D., Salerno A., Busse G., “Lock-in thermography with mechanical loss angle heating at ultrasonic frequencies”, Proceedings of 3rd International Conference on Quantitative Infrared Thermography (QIRT96), Stuttgart (Germany), 1996.
[5] Rantala J., Wu D., Busse G., "Amplitude modulated lock-in vibrothermography for NDE of polymers and composites", Res. Nondestr. Eval. 7, p. 215-218, 1996.
[6] Salerno A., Dillenz A., Wu D., Rantala J., Busse G., "Progress in ultrasound lockin thermography", Proceedings of 4th International Conference on Quantitative Infrared Thermography (QIRT 98), Lodz (Poland), 1998.
[7] Zweschper Th., Dillenz A., Busse G., "Ultrasound lockin thermography - a defect-selective NDT method for the inspection of aerospace structures", Insight, vol. 43(3), p. 173-9, 2001.
[8] Zweschper Th., Dillenz A., Busse G., "NDE of adhesive joints and riveted structures with lock-in thermography methods", Proceedings of International Conference on Thermal Sensing and Imaging Diagnostic Applications (Thermosense XXIII), Orlando, Florida, 2001.
[9] Gleiter A., Spießberger C., Busse G., "Lock-in thermography with optical or ultrasound excitation", Proceedings of the 10th International Conference of the Slovenian Society for Non-Destructive Testing, Ljubljana, Slovenia, 2009.
[10] Montanini R., Rossi, Freni F., “Ultrasound lock-in thermography as a quantitative technique for quality control assessment of c G.L. ast iron turbocharger components”, Proceedings of 10th International Conference on Quantitative Infrared Thermography (QIRT10), Québec City (Canada), 2010.
[11] Plum R., Ummenhofer T., “Ultrasound excited thermography of load bearing members used in constructional steelwork”, Proceedings of 9th International Conference on Quantitative Infrared Thermography (QIRT08), Krakow (Poland), 2008.
[12] Zweschper Th., Dillenz A., Riegert G., Scherling D., Busse G., "Ultrasound excited thermography using frequency modulated elastic waves", Insight, vol. 45 (3), p.178-82, 2003.
[13] Gleiter A., Spießberger C., Zweschper Th., Busse G., “Improved ultrasound activated lockin-thermography using frequency analysis of material defects”, Journal of Quantitative Infrared Thermography, vol. 4(2), p.155-164, 2007.
[14] Morbidini M., Cawley P. , Barden T., Almond D., Duffour P., “Prediction of the thermosonic signal from fatigue cracks in metals using vibration damping measurements”, Journal of Applied Physics, vol. 100, pp.104905, 2006.
[15] Renshaw J., Holland S.D., Thompson R.B., “Measurement of crack opening stresses and crack closure stress profiles from heat generation in vibrating cracks”, Applied Physics Letters, vol. 93, pp. 081914, 2008.
[16] Renshaw J., Chen J.C., Holland S.D., Thompson R.B., “The sources of heat generation in vibrothermography”, NDT&E International, vol. 44, pp. 736-39, 2011.
[17] Holland S.D., Uhl C., Ouyang Z., Bantel T., Li M., Meeker W.Q., Lively J., Brasche L., Eisenmann D., “Quantifying the vibrothermographic effect”, NDT&E International, vol. 44, pp. 775-82, 2011.
[18] Plum R., Ummenhofer T., “Structural-thermal FE simulation of vibration and heat generation of cracked steel plates due to ultrasound excitation used for vibrothermography“, in Proc. of 10th International Conference on Quantitative Infrared Thermography (QIRT), July 27-30, 2010, Québec City (Canada), 8 pp., 2010.
[19] Homma C., Rothenfusser M., Baumann J., Shannon R., “Study of the heat generation mechanism in acoustic thermography”, Proceedings of Review of progress in quantitative nondestructive evaluation, American Institute of Physics, vol. 26, 2006.
[20] Renshaw J., Holland S.D., Barnard D.J., “Viscous material-filled synthetic defects for vibrothermography”, NDT&E International, vol. 42, pp.753-56, 2009.
11th International Conference on Quantitative InfraRed Thermography, 11-14 June 2012, Naples Italy
http://dx.doi.org/10.21611/qirt.2012.177