Embed Size (px)
Citation preview
Purdue UniversityPurdue e-Pubs
International Compressor Engineering Conference School of Mechanical Engineering
1986
Investigation of Gas Pressure Pulsation Influence inan Outlet Pipeline on Reciprocating CompressorWorkM. Luszczycki
Follow this and additional works at: https://docs.lib.purdue.edu/icec
This document has been made available through Purdue e-Pubs, a service of the Purdue University Libraries. Please contact [email protected] foradditional information.Complete proceedings may be acquired in print and on CD-ROM directly from the Ray W. Herrick Laboratories at https://engineering.purdue.edu/Herrick/Events/orderlit.html
Luszczycki, M., "Investigation of Gas Pressure Pulsation Influence in an Outlet Pipeline on Reciprocating Compressor Work" (1986).International Compressor Engineering Conference. Paper 582.https://docs.lib.purdue.edu/icec/582
INVESTIGATION OF GAS PRESSURE PULSATION INFLUENCE IN AN OUTLET .PIPELINE ON RECIPROCATIJ'E. COMPRESSOR WORK
Marian :tuszczycki, Docent of Mechanical Engineering
The Institute of Industrial Apparatus and Energetics, Politechnika Krakowska, Krak6w, Poland
ABSTP.J.CT
In the paper, the influence of pressure pulsations on an indicator diagram as well as the components of overall volumetric efficiency are discussed. Next, an attempt is made to determine a quantitativa increment of power demand for compression when induced by pressure pulsations in an outlet pipeline. A way of calculating is explained and the required dependencies are given to determine this increment. The presented theoretical considerations have been verified experimentally using a laboratory test stand specially prep~ red for that purpose. The results of experimental investigations confirmed the correctness of the theoretical considerations presented.
INI'3.0DUCTION
Gas pressure pulsations in an outlet pipeline have a negative effect on both a reciprocating compressor work and compressed gas installation. In result of the pulsatj.on effect upon compressor work the indicated power and capacity are changed. There are instances when energy losses caused by press1re pulsations reached 40 % of the indicated power values at a given compressor stage. A decrease in capacity results from the unfavorable effect of pressure pulsations upon an indicator diagram and a deterioration of cylinder filling due to an increased temperature of its walls, Apart from that, gas pressure pulsations cause an increase of the maximum pressure in the cylinder during its working cycle, which in turn produces excessive stresses both in the cylinder elements and crank mechanism thus reducing their life. Additionally, pressure pulsations cause a considerably fa.ster wear and contribute to frequent failures of compressor valves. There are cases when the elimination of the excessive pressure pulsations increased a service life of the valYes by several ti;nes [1) • [2) • [8].
958
TIE INFLill;N:;:;: OF ?,~E:SSUfu--;; ?UlSATIOUS ON AN INDICJ-.TOR DHGR.t.M
Gas pressure pulsations in an outlet pipeline induce direct
pressure changes in a compressor cylinder duri~~ discharge. In this
way both the shape and area of the indicator diagra:n ?.re changed.
Fig. 1 presents six. characteristic indicator diagrams distorted in
result of pressure pulsations in an outlet pipeline /broken line/ against the ba.ckgro1:nd of a typical indicator· diagram /full J ine/,
i.e. the diagram with no pulsation effect. The diagrams illustrate all theoretically possible cases of pressure pulsa.t ion effect. in a.n
outlet pipeline upon the indicated power and delivery of a compressor. It has been assumed that a discharge val'lre closes precisely
in the inner dead centre /InC/ and. there is no effect of the inlet pipeline upon compressor work. The diagrams in Fig. 1 correspond
to the following cases:
• indicated power is greater th."!,n pulsation-free power, delivery
of a compressor is lower; N.- N.b , m"""' mb /Fig. 1a/ J. J. p p
• indicated power equals pulsation-free power, delivery of a.
compressor is lower; N. = N.b , ~- ~ /Fig. 1b/ J. J. p op
• indicated power equals pulsation-free power, delivery of a
compressor is higher; N. == N.b , m"'"' ffi. /Fig. 1c/ 1 1 p op
• indicated power is greater than pulsation-free power, delivery of a compressor is higher; N.=- N.b, m""" :ID.. /Fig. 1d/
1 1 p Dp
• indica.ted po11rer is greater than pulsation-free power, delive
ries of a compressor are equal; N. :- N.b , m = m_ /Fig. 1e/ 1 1 p op
• indicated power is lesser than pulsation-free power, delivery
of a compressor is lower; N.""" lif.b , m....., mb /Fig. 1f/ 1 1 p p
Fig. 2 presents some real indicator diagrams taken during the
occurrence of excessive pressure pulsations in an out let pipeline.
The diagrams illustrate some cases theoretically presented in Fig.1 and they originate from the investigations conducted by the author
as well as from the references. It should be told that not all cases shown in Fig. 1 a.nd sometimes simplified occur in practice. The pub
lished resu.J.ts of the investigations concerning pressure pulsation effect upon a compressor work as well a.s the individual research
conducted by the author may form a. basis to claim that in each case
of the excessive pressure pulsations in an outlet pipeline the indicated power is greater that pulsation-free power. This power grows with the increase of a pressure pulsation amplitude in the
pipeline. Similar is a case of capacity which generally decreases
though to a smaller degree with an increase of a pressure pulsation
amplitude. On the other hand, in each case of the excessive pressure pulsations both the isothermal and general compressor efficie
ncies are lower tha..TJ. those a.t a pulsation-free state.
959
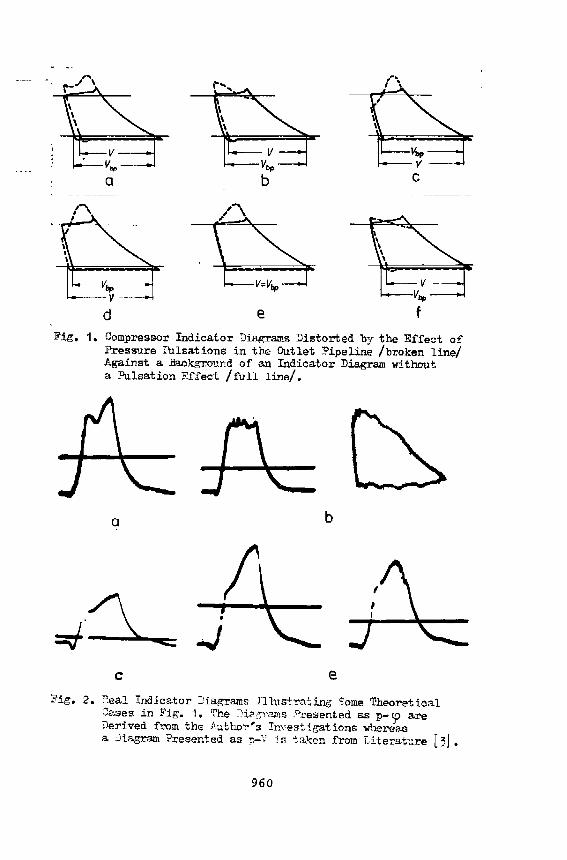
Fig. 1.
e Compressor Indicator Diagrams ~istorted by the Effect of Pressure Pulsations in the Outlet Pipeline /broken line/ Against a Background of an Indicator Diagram without a Pulsation Effect /full line/.
a b
c e Fig. 2. ::':eal Inil.ica.tor J.iagra.ms I1 lttstt"n.-:;.ing Some Theoretical
Oases in Fig. 1. 'l'r-e :!i?:·~r=s -'-'resented as p- cp a.re nerived from the .Author"'s ID\'es'!:. ir;ations whereas a Diagram ?resented as p-V 5r; -:~ken from Litera.t':lre [~].
960
THE INFLu-ENCE UPON THE COM?ONZNI'S OF AN OV'~R}.LL VOLUMBI'RIC l':FFICBNCY
l measurement of only delivery of a compressor is not a sufficient indicator to estimate a pressure pulsation effect in an outlet pipeline upon a compressor work because it may be subject to the significant variations under the unchanged working conditio~s due to the changing parameters pd' td and 'i'd of a suction med~um. A change of parameters causes a cha.Ilge in density of a suction medium which in turn changes a delivery of a compressor.
The effect of pressure pulsations upon the delivery of a compressor can be estimated more accurately by a comparison of a overall volumetric efficiency which is formulated as follows:
m A =
mt "' Go V8
n qa (1)
where:
m - real delivery of a compressor measured in outlet pipeline, mt - theoretical delivery of a compressor, v - swept cylinder volume, n - compressor shaft rotational spe~d, ~ d - auction medium density.
The overall volumetric efficiency is also determined as a product of the following coefficients: clearance volume, throttling, heating and leakage and each of those describes an influence of a given design or motion quantity upon the delivery of a compressor:
( 2)
Next, the effect of pressure pulsation in an outlet pipeline upon each component factor will be analysed.
The Influence Upon a Clearance Volume Coefficient A 0
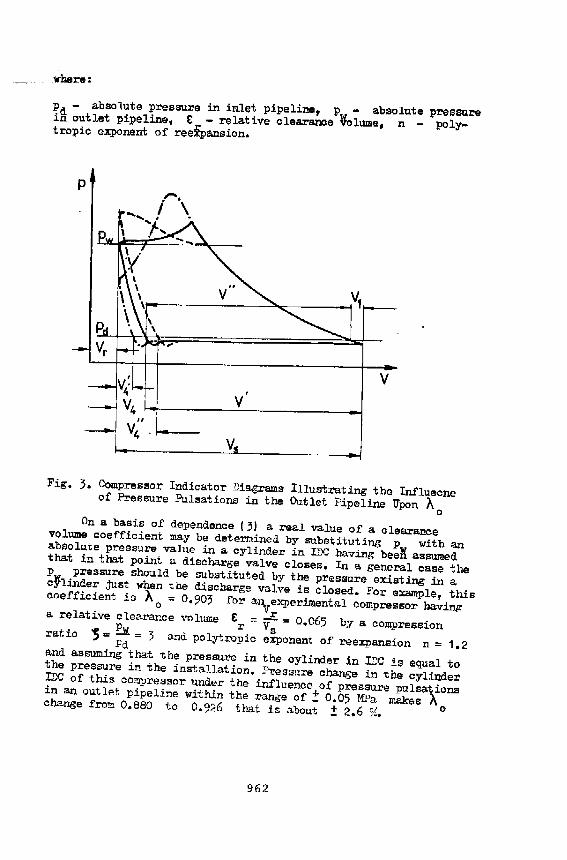
A pressure pulsation effect upon clearance volume coefficient is illustrated by the indicator diagrams in Figs. 1 and ;.
This phenomenon can be described as follows: in result of gas pressure pulsations in an outlet pipeline the pressure in the cylinder in me may be higher or lower than the pressure in that po:int at a pulsation-free state. In such cases a reexpansive process is either longer or shorter. Therefore, a volume to which fresh medium V - V t1. /Fig. ;/ may be sucked in for a given cycle is subject to v~iations within a range from V - V4 to V - V~ thus producing a change of capacity. A cle~ance volume goef1'1cient may be expressed with a dependence:
v' = 1 - E r 13)
961
_where:
p - absolute pressure in inlet pipeline, p - absolute presSD.re ift outlet pipeline, £ - relative clearance ~lume, n - pol~ tropic exponent of reeipansion.
Fig. 3. Compressor Indicator Diagrams Illustrating the In!luecne of Pressure Pulsations in tl'>..e Outlet Pipeline Upon A 0
On a basis of dependence 13) a real value of a clearance volume coefficient may be determined by substituting p with an absolute pressure value in a cylinder in TIJC having beeN assumed that in that point a discharge valve closes. In a general case the p pressure should be substituted by the pressure existing in a cJlinder just when the discharge valve is closed. For eX8Jllple, this coefficient is A 0
= 0. 903 for anveXperimentfl,l compressor having a relative clearance volume £ = Vr = 0.065 by a compression P r s ratio 'S = ...l!"' 3 a!'ld polytropic exponent of reexpansion n == 1.2 Pd and assuming that "the pressure in the cylinder in DC is equal to the pressure in the installation. Pressure change in the cylinder :me of this compre,ssor under the influence of pressure pulsations in an outlet pipeline within the range of:!: 0.05 MPa makes A change from 0.880 to 0.926 t~t is about ± 2.6 ~. 0
962
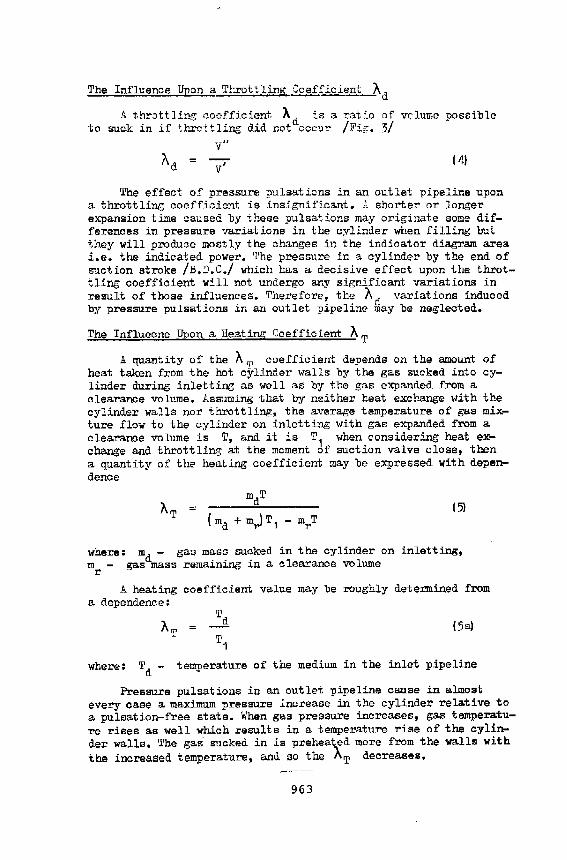
The Influence Upon a Tt·..rott lin~r, Gcefficient Ad
A t~r:>":tliQI! ;~e~fici:nt Ad is a ra~:'..o of vdurne possible to suck ~n ~f i:h.ro •• hng d1d not occu~ /Fl.,;. 3/
v"
v' 141
Tr~ effect of pressure pulsations in an outlet pipeline upon a throttling coefficient is insignificant. ,~ shorter or longer expansion time caused by these pulsations may originate some differences in pressure variations in the cylinder when filling but they will produce mostly the changes in the indicator diagram area i.e. the indicated power. The pressure in a cylinder by trA end of suction stroke /B.D.C./ which has a decisive effect upon the throttling coefficient will not undergo any sir,nificant variations in result of those influences. Therefore, the Ad variations induced by pressure pulsations in an outlet pipeline may be neglected.
The Influecne Upon a Heating Coefficient AT
A quantity of the A 'P coefficient depends on the amount of heat taken from the hot cylinder walls by the gas sucked into cylinder during inletting as well as by the gas eXpanded from a clearance volu.me. Assuming that by neither heat exc!>..ange with the cylinder walls nor throttling, the average temperature of gas mixture flow to the cylinder on inletting with gas expanded from a clearance volume is T, and it is T1 when considering heat exchange and throttling at the moment of suction valve close, then a quantity of the heat.ing coefficient may be expressed with dependence
AT - 151
where: md - gas mass sucked in the cylinder on inletting, mr - gas mass remaining in a clearance volume
A heating coefficient value may be roughly determined from a dependence:
Td
T1 15al
where: Td- temperature of the medium in the inlet pipeline
Pressure pulsations in an outlet pipeline cause in almost every case a maximum pressure increase in the cylinder relative to a pulsation-free state. When gas pressure increases, gas temperature rises as well which results in a temperature rise of the cylinder walls. The gas sucked in is preheated more from the walls with the increased temperature, and so the AT decreases.
963
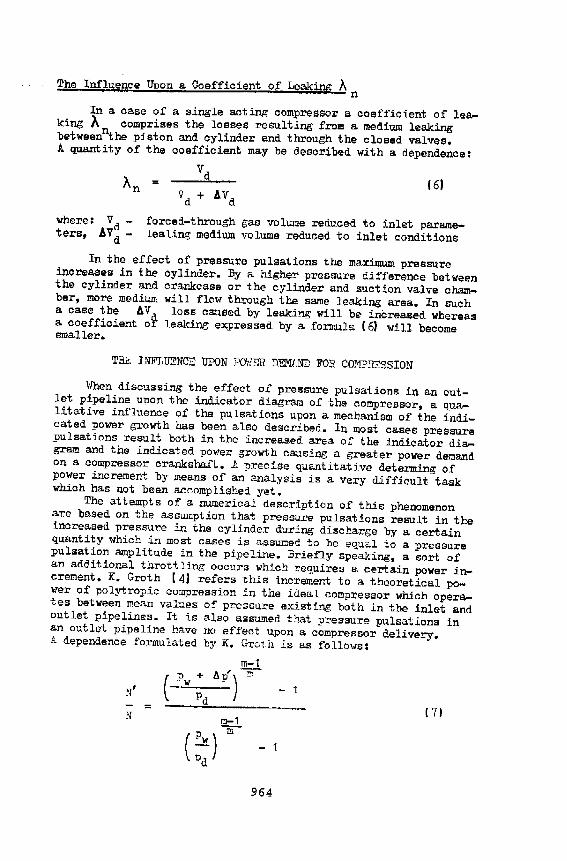
The Inf'lue~ce Upon a Coefficient of Lea.king A n
In a case of a single acting compressor a coefficient of leaking A comprises the losses resulting from a medium leaking betweenothe piston and cylinder and through the closed valves. A quantity of the coefficient may be described with a dependence:
vd 'A = n ( 6)
Vd + AVd
where: V d -ters, AV d -
forced-through gas volume reduced to inlet paramelealing medium volume reduced to inlet conditions
In the effect of pressure pulsations the maximum pressure increases in the cylinder. By a highe~ pressure difference between the cylinder and crankcase or t.he cylinder and suction valve chamber, more medium will flow through the same leaking area. In such a case tr~ AV loss caused by leaking will be increased whereas a coefficient o~ leaking expressed by a formula (6) will become smaller.
THE INFLUENCE UPON PO'di'iR DEMf..ND FOR COJir:?Y':SSION
When discussing the effect of pressure pulsations in an outlet pipeline upon the indicator diagram of the compressor, a qualitative influence of the pulsations upon a mechanism of the indicated power growth has been also described. In most cases pressure pulsations result both in the increased area of the indicator dia.. gram and the indicated power growth causing a greater power demand on a compressor crankshaft. A precise quantitative determing of power increment by means of an analysis is a very difficult task which has not been accomplished yet. The attempts of a numerical description of this phenomenon are based on the assumption that pressure pulsations result in the increased pressure in the cylinder during discharge by a certain quantity which in most cases is assumed to be equ<1.l to a pressure pulsation amplitude in the pipeline. Briefly speaking, a sort of an ruiditional throttling occu:rs which requires a certain power increment. K. Groth [ 4) refers this increment to a. theoretical power of polytropic compression in the ideal compressor which operates between mean values of pressure existing both in the inlet and outlet pipelines. It is also assumed that pressure pulsations in an outlet pipeline have no effect upon a compressor delivery. A dependence fornrulated by K. Groth is as follows:
m-1
( Pw ;d Ap') ""F - 1 N'
N ( 71
964
where: N' - power demand for polytropic compression in the ideal compressor j_ncreased by power increment caused by power pulsat-ions in an outlet pipeline of the !J. p' amplitude, N - power demand for polytropic compressor in the ideal compressor. Ap - pres-sure pulsation amplitude in outlet pipeline. m - polytropic eXponent of compression.
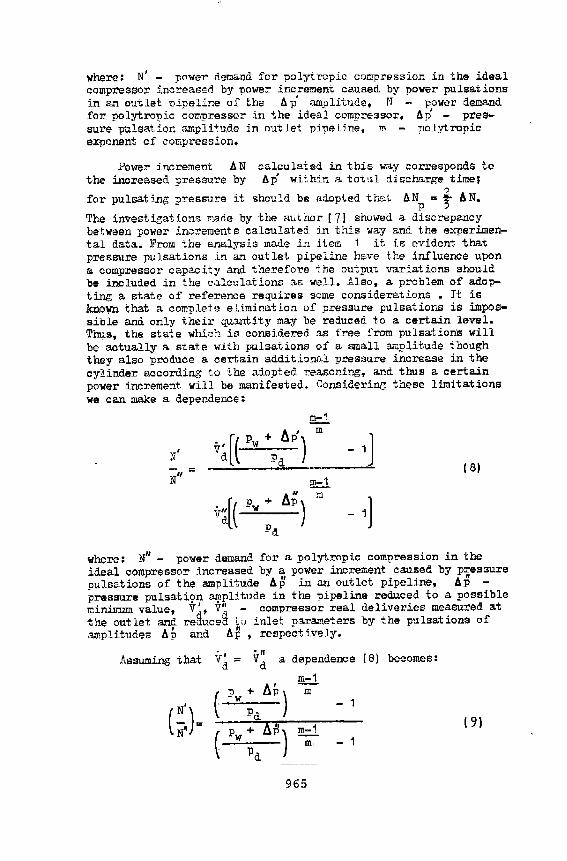
Power increment AN calcu lai: ed in this w:c1.y corresponds to t-he increased pressure by flp within il. totn.l disch1;.rge time;
? for pulsating J:lressure it should be ;1.dopted throl.t flNP = 3 AN.
The investigations made by the author [71 showed a discrepancy between power increments calculated. in this way and the experimental data. From the analysis made in item 1 it is evident that pressure pulsations in an outlet pipeline h~ve tr~ influence upon a compressor capacity and therefore the outpu1: variations shou-ld be included in the c3.lculations as well •. nso, a problem of adopting a state of reference requires some considerations • It is kno~ that a complete elimination of pressure pulsations is impossible and only their qu:lntity may be reduced to a certain level. 'l'lru.s, the state which is considered as free from pulsations will be actually a state with pulsations of a small a.r.Jplitude though they also produce a certain additional pressure increase in the cylinder according to the adopted reasoniro,.g, and thus a certain power increment will be manifested. Consj_dering these limitations we can make a dependence:
m-1
v~[( Pw +P:p')
m
- 1] N' = (8)
N" m-1
v~[( pw+ ~p) m
pd - 1]
where: N'' - power demand for a polytropic compression in the ideal compressor increased by a power increment caused by pressure nulsations of the amplitude llp in an outlet pipeline, /lp -pressure pulsati9n ~plitude in the pipeline reduced to a possible minimum value, V', V" - compre·ssor real deliveries measured at the out let and reaucea to inlet parameters by the pulsa.t ions of amplitudes llp and llp , respectively •
v' . " (81 becomes: Assuming that d = vd a dependence
m-1
Pw + M') ( m
N' - 1
(;.)= pd 19)
Pw + A~) ID;:1 ( m, - 1
:Pa
965
Using a test stand it is possible to 1ete~ine precisely power increment resulted from the excessive pressure p~lsations in an outlet pipeline in relation to a red~ced pressure pulsation state by comparing the indicated power N, supplied either to cranksi'..aft N or to electric driYing motor N
1• J. following
dependence exists between these powers: e
N. -: ~ \ ?m "' Nel ? m ? el ( 10)
where: ? - compressor mechanical efficiency, ? e 1 - electric motor ef~ciency.
By 2.. ccnEtE.::tt !"C:z:t.ionsl ~peed end \,~.:::~in ~ c~!"ta.in \-F ... :~"ia.t i~:; ::s.:::ge, t~e e:ficiencies ? ~ e.nc ? "'' ~.zxs connan'.: ·:e..::::es. In s--..:ch ~a.ses -tte ::a:ti~E' of 1iria :-es:?e:::=zs:-r·e ra~·~·e~:, b~-:h i:r.d.ic~teci a.nd s--..:pplied or elect~::"ic C':le e~t:&l e~h ot!:e:- ..
The u.nde=-take:n Zc:lside=e:t.ion~ have sho•rrn ths.:r pres~::e p~lsa.tion~ in z,n ou:.lst :;:·i?eline effeo~ both :;;~n·Jer a.nd deli"·e~' of : hef ccx;-:--essc::- .. The :..ndic3.t~=- ..,.;hi'J'h ~lee in:: !1:d.es teh vG..ri2..t icns of ~hss.e "t"v~~ ~uantii:ias is ?-- t:~i-: teBa.r-Ad cf e2ect=-ic ene~w· per c1:bic n:etre cf the fc~:::ed-tZot:.;-t~ neC.i":ltz: cf i:1le:, naranete~a ...
( 11)
'·rhe=e: N~ .. , - e2.eot~i:. p~~te:- .s..bs.:o:."'beC. by d~iY'i:1g rnc-:c=.,. V.. -=ea.l de:j.ve:~-y~Cf a cor.:~presso:: mea.su::ed. 2-i 1:26 o'!ltlet and reC.u5ed to inlet ~a~a~e~ers.
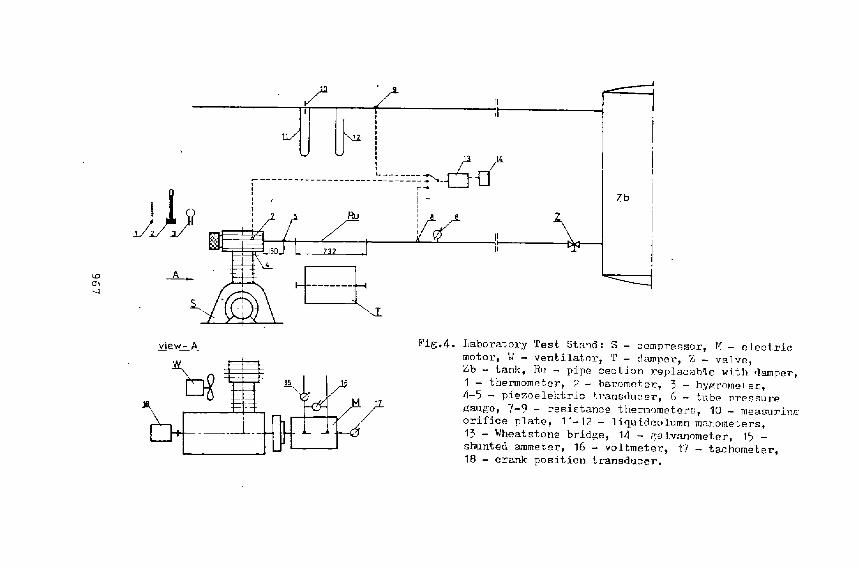
TIE EXPERIMENTAL INVESTIG.P.TIOHS ANI: AJ-IALYSIS OF RESULTS
T'n;;;: eJ:?e~imen--.: al investisat.icns E.i!!led a-t the e~t imat io~ o! oor~e~:nes~ cf ~he ~=esen~ed theo~e~ic~~ :o~side~a~ions as well e..s ;·e::-.::":•in(; "'- p::-sc~ica:.l us2.bil:ty of d.e:;>9nden::es (B) and ( :?1. The ir-!Y~~:i:;==.:~ic~z w~=e ::cn:iuc-.;ed o::: a ::!.2-b~::-e-to~! teet stand sto".~ sch~!:1Z-L-iaa.l::r i:1 Fig .. l" The ~:a .. ~d ;.ias speciall? ma.d.e fo::-:es:i!l;' :ha c;-e::~ .. .-:io!::~-l effica=:l cf ..... ~=:.en.:~ tJ~e:;: o~ ~=-es~!:'e P"~lsa..~i::::i C.a:::pe::-s 2-n6. tes:.::""-..~ ;as ;::-es~'::.~E p~ :..s2:t io~ effect in
:~~~I;:;~~~?~~~~:~~~~~s~~~:~~~~s:c:~~~~~~;~~n:~~~;~~~;~;;i~~;e~n a.e::-iE-..1 zcrr.:-:-e:=;sc~. T"~s e:::~:;:re:z~~= ~".tzw dri· ... e~ '-''i 'L!l a DC mo:.c:\<-;c=ki~~ in ::.. ~i::pl.:fied ~\r~rd-Lec::12-:'5. s:,·=~:er..J -:.c ?="='_t .. icls a. p:::ss.ibili-::-- c: 2-:-! :.:1:.:.n.:.: i~ ... ~ -:-z~~ia.b2.~ a.:l,j·:.~-tcent :;f r::i~7 :cr:z.l £peed ·v~ithi::. 2- ~~3.-.:!:i.-~2..~ ::-E.~~ '::~ 2JC .; ~500 =;n:l..,
T:.':~ l e3': g '-.:e::'e ~· :.~ie:i c-.. :;1: .;..~ :=.. ccr.:.::":::"E:Z~or '='~n2': ant :::""o-ta-c icnal s7eed f. ~ 110·: ::-:;:--:::; ~ .. r~:. -:'~.!.~" ~~Lt;:-~::zi~:-J. :-~.:ri~:1:=: ..... ~~~:.~~ !=em 2 ~G L,
.~~1 ~h= ~~~~~=:~;c~~;; ~~L;~~~~~~~ ~1:!:~!;~~~ ~~~s~:~=~~~;;s~~2·~~;
.:":l:'l&"i ;i~~::.ine .e-~ v:e::..l z.: :he f:::.~.:.c't~.:= .. :r.:.cn:s cf :;:-e:=~..t:.:"e vc..=iatio:ns i:! ~. ~c:r.:_:-=e:;-s::=:: 1'\ .. -;_i~'is~., ~nc.. sls:-o b:::!"& the ele;t:!'ic 't'Ot:ter a.!1~
;.~;~~~~;~~ t2-~rl c~~~::-~:~~~c-;~~~: ~e~;~~s~~~~:~e~~~~~~~~ o~f~:=s~~:~ 966
))y \D ___!:,____ m --l
~ -
view- A
bg
/ ./,.-i- .[1
1T ~! L _____ ::::~-6-d
Zb
---------- ------- 1 .------------ -
7 • R11 z
g Fig.4. J,aboratory 'fest Stand: S - compressor, I-1 - electric
motor, \·1 - ventilator, 'f - dcul"per, Z - valve, Zb - tanl~, R11 - pipe cec Lion replacab'le with i!amper, 1 - thermometer, 2 - barometer, ) - hygrometer, tl-5 - piezoelektric transflucer, G - tube pressure gauge, -/-9 - resistance thermc.meters, 10 - measurin~r orifice plate, 11-12 - l iqu ideo lumn manometers, 13 - Wheatstone bridge, 14 - ~alvanometer, 1') -shunted ammeter, 1G - voltmeter, 17 - tachometer, 18 - crank position transducer.
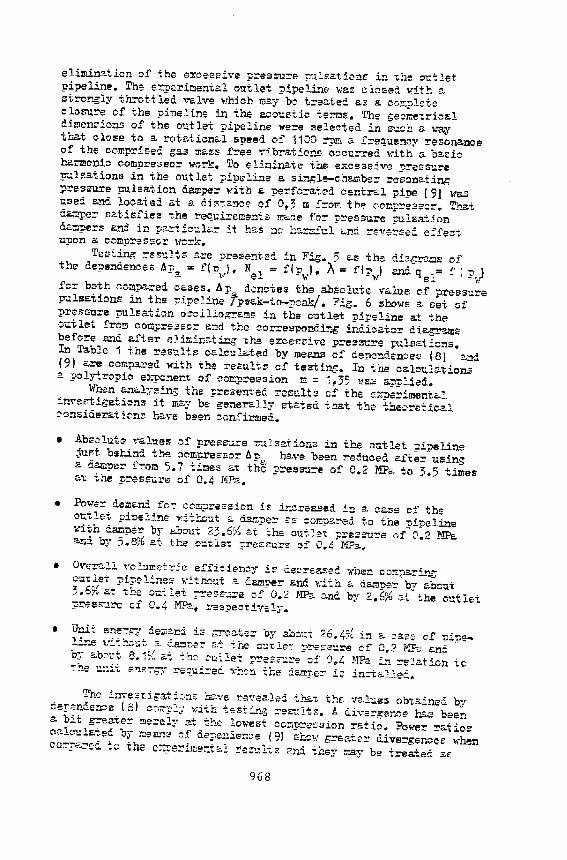
elimin!<:ticn of the e:r.ces:oive p~es<m!'e :;m:satione in -.;he ou-t let uineline. The e~erimental outlet ~i~eline wa~ closed with a strcr~ly throttled ~alve which may-be treate~ as 3. CC~?lete closure cf the uipe:ine in the a.coustic t.e=s. The gecme-.;rical diroen!l'icns of the-outlet nipeline we:::-e selected in s'-"ch a v:ay tP-""t close to a rotational sPeed of 1100 ~ a frequenoy resonance of the ocmprisea gas ma:t!'l f!'ee vibrations occurred with a ba"io harmonic comnresso:::- work. To elinlnate the e~ceseive pressure ~~leations in the outlet niueline a sL1gle-ch~~er resonatinb ?res~re pulsation ~amper~ with a perforated central pipe [9) was ~sed and loca:t ed at a ciista.nce of 0,3 m from the cor::p~es;;:cr. Th.~t d~pe~ s~tisfie~ the re~uire~&nts made for pres~re ~lsation d:=m~r:; and in pa.rtico..:.la::- it ha.s :lO hs.:::r.!ul <:;.nC. r$.rerse.:. e!'fect upon a. com:press.c~ \-tt;rk.
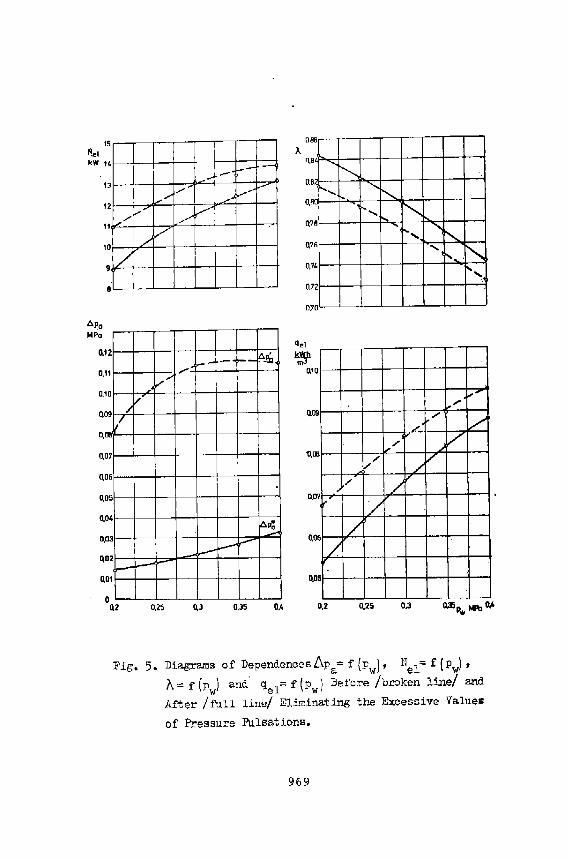
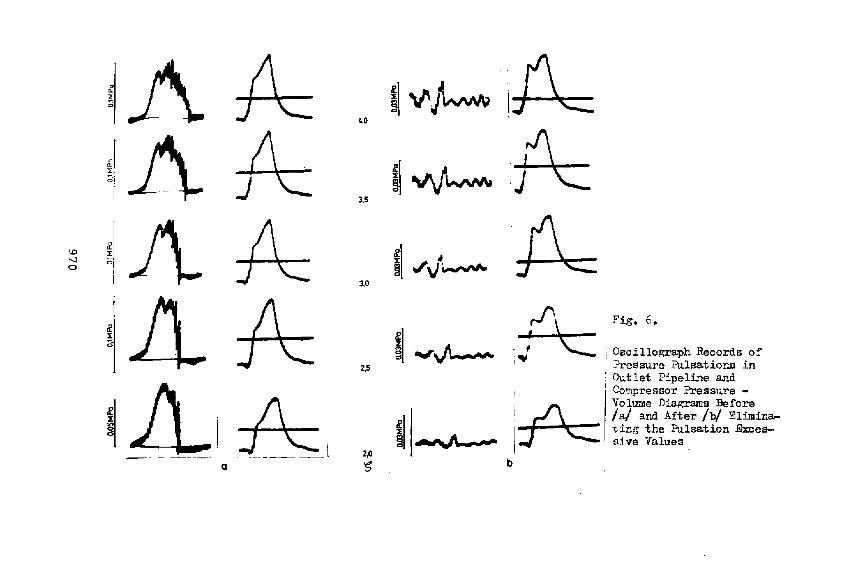
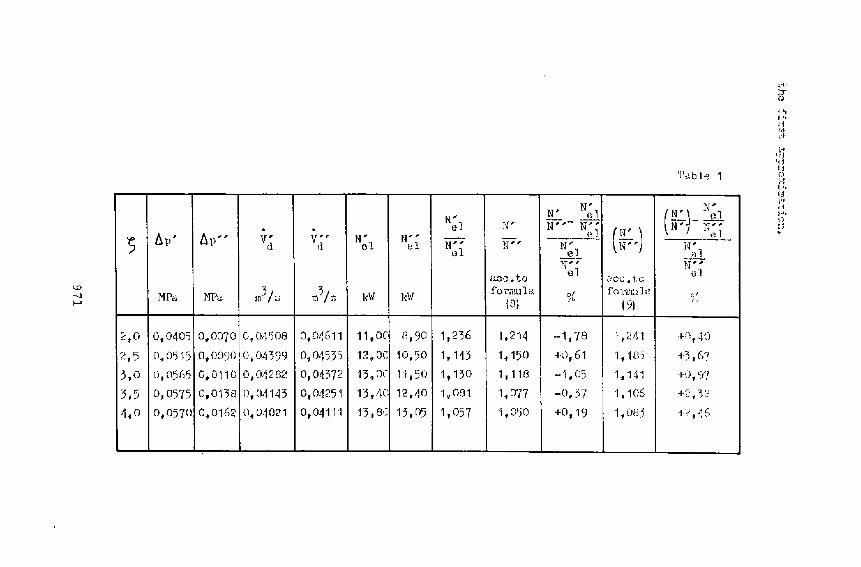
Te~ting res~lts are presented in Fig. 5 as the di~~s of the dependences Apa ::: f(p"rl, N61 = f(pw)' A"' f{:;\) and qel"' f ( P.) fer b~th carnpe.red cases. lip denotes the a.bsalute va.lue of pre-SS'.l:te p-<.tlsations in f,he pipeline fpeak-to-peak/. Fig. 6 shows a set of pressure pulsation o~cillagrams in the outlet pipeline at the cutlet fro~ compressor a~d the corresponding indicator diagrams before and after elimine.tiilg ,.hs ezceelJ;ive pres::>:ure F'~lsa.tions. In Table 1 the res1.:.lts calculated by meens of ~ependenoes (8) a~ (9) are compared with the re~lts cf testing. In the calculations a polytropic e::pc.:1ent. ~f e:'ilt}:l::."easion ::!! "' 1, 35 ~re.s a.;J~!.ied. Wben e..::~al:.-~ing the :p:-esenteC. :::esults Gf the expe~imenta!. inYs..,.tie;atio;:J~ it m:o..y be generally stated 'tb..a.t the thee:::-e"tic.al ~onsideration~ have been ccnfirmed.
• Abrrolute values cf nress-.<re -:::~ba.tions in the outlet pipeline just bshi:1:i the oemnressor A; have been recuoed a.fter using a d~per from 5.7 times a.t ih~ pressure of 0.2 MPa to 3.5 times a;: the p:::oess-.:re of 0.4- MP;:o..
• Power demani for com:preseicn is ir.c:::-eased in a case of the ·:n::tlet niueline ¥.itX;ut a de.:r.:le:::' £-s eo~".:le:.::-ed to the DiPeline -..rith C.~p~;:l." by i<.bout 2).6% f..( the cut:et pressu::.-e of-0:2 MPa ani by 5.B;-{ <.>.t the o~-.;le-:; ?ressure of 0.4 MPa.
• 0\•erall vol:=e!:o:ic efficiency is d.ec~ea:oeC. \';hen co::r.pa.ring o-.;tl_.t r;i-:;el.:ne:'.' ;..-.:.tr.eut a G.al'nPer &nd Kith a d.a.mner b-,, a.b::.._t 3-.6:;.!; a( ,b.e o~i; let ?!'E"S~J.re of- 0.2 MPa. and by z.G% at" the outlet :?:rr;e.~.J.~ cf 0.4 M:P.2., r;s~eotivsl::r.
• Ur..it ~nerg-; ci.e;.;;snd. is- t,rii!e.ter by ab:n.:t 26.47~ in <c ::ase cf niu~ ~:!:r..e 'lr.:.t~ut a. -=.~:_c;e:: c;:t the outlet ~!'s:.:::S"!!~e of 0 .. 2 MPa. e.n~ ~ by 2.b:-ut. 8.1S·!. ~i -the cut~e-: :;:=es;;..:.~e cf ~e-4 ~!Pa !.n =e2.ation to -:he u.::it e!le::;y req_-u.!.z:eC.. "'li'hen the= ia..~pe~ i~ in::talleC.e.
Th~ in't"e;:st.i§'a.ti:-.ns hE"-'"'e ra~tealed -tr..E..t thE ":al-:rsz obtained. by deren~erce (B) cc.~J<::~· ~.~ith testing rez-~lts. A di'\'"srganz~ has been a bit greate:o: merely at the lo~red co::r:::ression ratb. Power ra.tioe Calct: la~e~ b~ l:lSarl::' c:f :ie?Snien:)e ( 9) ShOW 1;:::'6a.i.e:::o G.i Verger.ces Khsn co~p~=e~ ~o the e~e~L~e~t~~ ~~~lt~ ~~a thEy ~~Y be t~eate~ a~
968
5
"'·' kW 1 4
J
2
1
10
9
0.1 2
0.1 , 0.1 0
[....--"" :..--
/
1./ ao 917 / o.~
0.0 7
0.06
aos
0.04
0.03
1....--""
v /
v-;;;
2 1---I-!.--
ao
0.0 1
0 0.2 0.25
1-- ---·" ,.......... v ...... __...
./ v
>-- - ,__ ll..eQ
ll.~
I--p
l--
0.3 0,35 0,4
OB6
A ll,B
O,B 2
O,R 0
Q7 e
Q76
0,74
0.72
0.70
0
Cl09
0.07
0.06
0,05
' .........
/
0.2
~ '- r---...
r-, ~ ' ' "" .... ~ ....
~· 1'-,' ~ ....
J..-"' /
/ v ... [.,,/ v
v,.. / v
/ /
/ /
·- -'~'--0.25 0,3
Fig. 5. Diagrams of Dependences ~Pa"" f {PwJ, Nel"' f (Pw)'
A"" f (pw) and. qel"' f (Pw) Before /broken line/ and
After /full line/ Eliminating the Excessive Values
of Pressure Pulsations.
969
~jA A "0 ~~~~~
~~A -A ~ vJww.. If\: 3.5 I
1.0 ~~A A .Pc: -..) i\ 1 0 § t/\}~
3.0
~11 -A 1\...,~ ~\ Fig. 6.
2.5
; J '== j Oscillograph Records of ?ressure Pulsationu in
~lL : Outlet Pipeline and
AI I Compressor Pressure -'A Yolums Diagr""s Bsfore
t ' /a/ and After /b/ Elimina.-
______ I ~ ~ I t~ng the Pulsation Excea-
2,0 s.1ve Values
. ------~~· Q ~ b
\D -.l f-'
'l\:ble 1
N' w N' N' (;] (N'\ e1
• • e 1 N' W ,- if" , fi''F ifi7 " , " , , V, V,, N, N' , e 1 ( N ) <" 1
) up up d rl el ,!11 N" W' N'. . w· -w--- I (:ll el al
w' N-;-;- j
2.ec .. to e 1 :~cc. t c u 1
MPo. r~ 3;., 3/~ J';/ J.·W fora1UlP. 01 formt<l<' ,,, - ·•r"- 111 ~ m '' r • lBl l'• !9) .. ,
:? 1 0 0,040'5 0#0070 O,Or1'508 0,0~611 11,0C 8 1 90 1,236 1,214 -1,78 1,241 ·1-i\10
2,5 0,0115 01 0090 O,Oft399 01 0453') 12,0C 10,50 1,143 11 150 +1l161 1
118'1 +3,67
3,0 0,0565 0,0110 0,0~282 0,04372 13,Dr Ji,SO ·1,130 1,118 -·1,05 1,141 +i\~17
3,5 0,0575 0,01)8 01 04143 01 04251 13,4C 12,40 11 00'1 1,077 -0,37 1,106 +2,'52
4,0 0,0570 0,0162 0,0,1021 0,04111 13,8C 15,05 1"057 i,O'iO +0 1 19 11083 +?,~6
<+ ::r (J)
"• ·~· Jj
'·l -l+ \-)
'rJ '!J lj
f~ ~· ~·· i1 i•) ,, '"' n p
F DrAL REMARKS
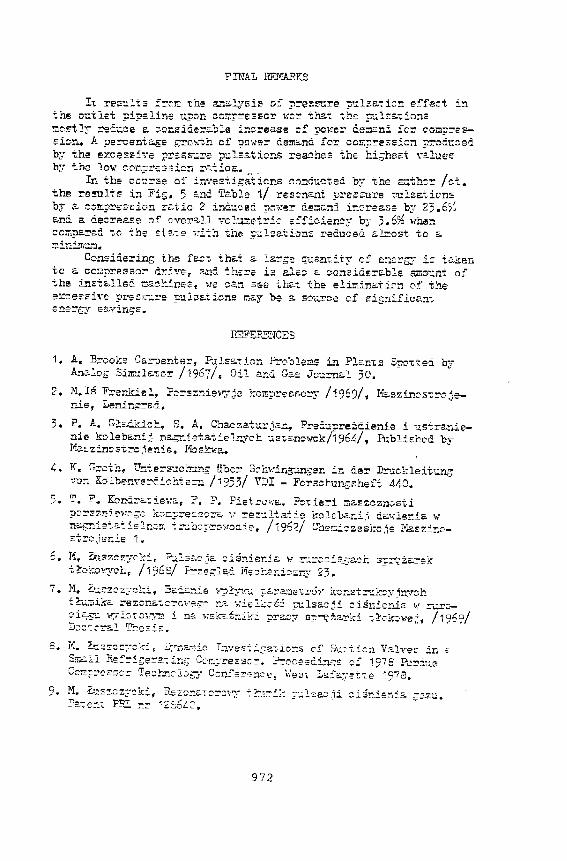
l't reE:!2:t s :::crt th~ ~~~J..y·si~ o: :!l:'"e;;!.S""~re p~l~a~ i~n effe:t in -:he outlEt ~iDeline un~-n cornr-~e:=so!; y;c~ t~t tbc ~l~E:.-;.i~ns ~e:eotl\ ::ett:;e~ e. conzide=~b:e- inc::ea.ge c! -r-.ovre~ de::~n:i fc~ cv!:l::-::-essic-:l ... A percentage src~ ..... ""'~h of prnn:~r dem~nd- fo!: cor.p!'"e.;;eicn pr~it:~ed b:t the e::z:ces:sise :;J!'SSS".:::::-e :;:r.::ls&tic!'!S rea!!hs::l the hi;:;hed \"2-lue:::< b .. r thE low cc·r:r::;:res5io~ rc:..:io:a.
u In the co;=se o!" inv£siigoaticns ~cndi;,~ted br the EU.t.h:-~ /ct., the :::-esult z in Fi~;. 5 ;;nd T;,;,ble 1/ res=n~"lt p!'e::~re ~ls~ticn-:: by & oc!rip~s~~io:n =.-c: .• tio 2 ind.uoed :;xn~sr d.~~~::td ir..~ree.s; by 23.6~~ a.na. a 6..ecrease of oyera.:!.l ~rc l:l:::et:::ic e:'!'iciency b:1 3. 6% ~~he::-. compa~ed to the £1 ;.:e 'L""i:th th&- ;--~lsa:ticn~ reC.uced E-L"!:ost to ~ ':Ti.ir.:.i!!r.:...~.
Ccnziderir~; tht; fa:::."t that G. la::""ge qua.-~ti"ty c! ene:'b:r i~ ta-ken tc a.. cc~rJ~esso:!' d!:'i"teT and. -:hE::oe is als=- ~ ~onsid.sra.ble 6.o7.l0~"1't of -:.he in;e't~lled ma~f'-ines, 'tJ!S can :;~e thz:..t. the- eli~ina:t i~n c-f the e:.:~essive prs~~~:-e P"J.lsa.:tionE mz.y be ?- s~urce of eignifican-r, sne:;g;y- sa. yin~:;'.
1. A. E:rcoks Carpenter, PJ:lse.t icn Problen1s in Pl2.ntrs Spc1:ted. b:r A~~~os Siw~la-;,o~ /1967/. Oil a~Q Gas Jc~:::nal 30.
2. M.Iii F:!:er.lciel, P:;,r~z:nie~,oyje kompresc.o:::•y /1969/ 1 JVs.szin::>s:!'o,)enie, Lenint:::-a.i.
3. P. A~ G~&ikic~~ s. A. Chaczat~rj~~, ~et~~reZtienie i ustra~ienie kc-lebani~ ne.;;r.ietat.:.elr:...7ch :;.s-;,a.no~rok/196LJ • ft;bliched by I'ia~zincst!':o jenie, l''L'lskwa.
~4 K. G:-~tn, IT:~:te:::-~::clT..z.ng fibe::- Si:.'h"k-:ing-J.n-;sn .:.n cis= Dr".lckleii1,;_~3 ''::1::1 Ko::.benv-e:::-f.ich'te= /~'353/ YDI - Forsor..uP.£3heft 440.
) • T. F. Koi:O.~E..: ier;2--, P. ? • P.:.et ~a~!.~a,. ?c't ie=i rn2..~zcznosti ?:"r::;z.n_i.g'\1--·~f;C kv-r::~:n."'e£!!0::"~ v ~ez~.:.lta..-: :.e l::olEba.r:i;:~ d2.~rler:ia '-'f n~;nie:_r;/:i.el~::rr. :::-.;b:.~~~::~,.!~di£, /i962/ Cher:"i.:.zeskcje Ma~z::.r:c-s"'t: ~c 5er:2.e 1 •
7 ~ 11~ Zt.:.szc z:tcki., Ez:.:..a~is -i"~'~J-'""1-.~:;. pE.::-2.T::Iet.!'ci~ .. kor..~t :--..:..k~:'t' ~n:\"ch t~~::nik& =-ez~na:.~::oc1··e~-:: na. ;.riel~:::SC pt:.lsacji ::i.Snie!1i~ v,' ::-"~r;:ci~:.: \r.:tl:.~~niy~n i na 'lf:'sk~ir:.ik.: ?!"a:::~~ o:;~Ze..rki t1'~ko\-:e~~• /1969/ D~::t:=-~1 T:.~esi::::.
~· M. b.:::=:::~=:--~~:.:..'F :=:rn~ic L""'l·ve:;;~ .:..c;a~ic:-rs c-f ::=;:;.:·t.i:::n V&l'\.'"'e:;: in E
2!n2.ll Re:=.ige::-z::J.ng; Ccr.:;:!:"ezs::::*. P=oceed.i:l=~~ ::: 1978 P .. ~:;i·c.i.e C::rr?:'"'?ES~::- Tt;;~!-..ncJ..::'b-:r" C,:nf-=~~nc~~ \·les\ Lg,:fa:t~e-tte 1978.
9.- M. !t.::.~:.e::z.::t~ic:.'l Re'Z.~:!E:..-:~:::::t~.-'1- -t::-.1:::.:..~: :;:·.:l:=::a:~.~i ~iSr..ie:rlia. ~:u~. ?a-: e~: P!E. ::::-- .-:2 S6L:;.
972