Embed Size (px)
Citation preview
UNLV Theses, Dissertations, Professional Papers, and Capstones
5-1-2013
Investigation of Crashes and Identifying the Best Practices for Investigation of Crashes and Identifying the Best Practices for
Setting up Speed Zones in Towns Along Rural Highways in Setting up Speed Zones in Towns Along Rural Highways in
Nevada Nevada
Krishna Prasad Shrestha University of Nevada, Las Vegas
Follow this and additional works at: https://digitalscholarship.unlv.edu/thesesdissertations
Part of the Civil Engineering Commons, and the Transportation Commons
Repository Citation Repository Citation Shrestha, Krishna Prasad, "Investigation of Crashes and Identifying the Best Practices for Setting up Speed Zones in Towns Along Rural Highways in Nevada" (2013). UNLV Theses, Dissertations, Professional Papers, and Capstones. 1888. http://dx.doi.org/10.34917/4478307
This Thesis is protected by copyright and/or related rights. It has been brought to you by Digital Scholarship@UNLV with permission from the rights-holder(s). You are free to use this Thesis in any way that is permitted by the copyright and related rights legislation that applies to your use. For other uses you need to obtain permission from the rights-holder(s) directly, unless additional rights are indicated by a Creative Commons license in the record and/or on the work itself. This Thesis has been accepted for inclusion in UNLV Theses, Dissertations, Professional Papers, and Capstones by an authorized administrator of Digital Scholarship@UNLV. For more information, please contact [email protected].
INVESTIGATION OF CRASHES AND IDENTIFYING THE BEST PRACTICES FOR
SETTING UP SPEED ZONES IN TOWNS ALONG RURAL
HIGHWAYS IN NEVADA
By
Krishna Prasad Shrestha
Bachelor’s Degree in Civil Engineering
Pulchowk Campus, Institute of Engineering
Tribhuvan University, Nepal
2010
A thesis submitted in partial fulfillment of the requirements for the
Master of Science in Engineering - Civil and Environmental Engineering
Department of Civil and Environmental Engineering and Construction
Howard R. Hughes College of Engineering
The Graduate College
University of Nevada, Las Vegas
May 2013
Copyright by Krishna Prasad Shrestha, 2013
All Rights Reserved
ii
THE GRADUATE COLLEGE
We recommend the thesis prepared under our supervision by
Krishna Prasad Shrestha
entitled
Investigation of Crashes and Identifying the Best Practices for Setting up Speed Zones in
Towns Along Rural Highways in Nevada
be accepted in partial fulfillment of the requirements for the degree of
Master of Science in Engineering – Civil Engineering Department of Civil and Environmental Engineering and Construction
Pramen P. Shrestha, Ph.D., Committee Chair
Aly Said, Ph.D., Committee Member
Ying Tian, Ph.D., Committee Member
Ozkan Eren, Ph.D., Graduate College Representative
Tom Piechota, Ph.D., Interim Vice President for Research &
Dean of the Graduate College
May 2013
iii
ABSTRACT
Investigation of Crashes and Identifying the Best Practices for Setting up Speed
Zones in Towns Along Rural Highways in Nevada
By
Krishna Prasad Shrestha
Dr. Pramen P. Shrestha, Examination Committee Chair
Assistant Professor
Department of Civil and Environmental Engineering and Construction
University of Nevada, Las Vegas
In 2010, 51,664 crashes occurred in Nevada. Only about 9% of those crashes
occurred in rural areas of the state. However, if only fatal crashes are considered, 41% of
those fatal crashes occurred in rural areas. Generally, speed zones are provided in towns
along rural highways to reduce speed-related crashes. However, a guideline is necessary
for a consistent procedure to setup speed zones throughout the state. The main objectives
of this study are to determine factors associated with crashes and to identify the best
practices for setting up speed zones in towns along rural highways.
Eleven towns along rural highways of Nevada were identified by the Nevada
Department of Transportation (NDOT) Technical Advisor Panel (TAP) for crash data
analysis. Ten year of crash data for these towns were collected and analyzed. The result
showed that the percentage of fatal crashes in these towns was 0.89% for 9 years. For all
the rural areas in Nevada, the percentage of fatal crashes in 2010 was 2.00%. Regression
analyses showed a strong correlation between the number of crashes and the percentage
of vehicles exceeding posted speed limits in these towns.
iv
Based on the survey data and various state DOT speed limit guidelines, the 85th
percentile speed was the most important factor for determining the speed limit for a speed
zone. If proper enforcement is ensured, speed zones can be effective to reduce the
number of crashes in towns along rural highways.
The study results will assist in formulating a speed-zone guideline for towns along the
rural highways of Nevada. Recommendations to prepare the speed-zone guideline are
provided as well as the limitations of the study.
Keywords: crash severity analysis, speed limit guideline, speed zone guideline,
Nevada Department of Transportation (NDOT), towns of Nevada, rural highways of
Nevada
v
ACKNOWLEDGEMENTS
I would like to express my sincere thanks to Dr. Pramen P. Shrestha, my advisor and
the Chair of the Advisory Committee, for introducing me to the world of the academic
research. I appreciate the time and effort he has invested to guide me up to this stage of
my academic career. It is my great privilege to have such a helpful and understanding
professor as my advisor.
Many thanks to the thesis committee members, Dr. Aly Said, Dr. Ying Tian, and Dr.
Ozkan Eren for their support and feedback for the thesis. I appreciate the constructive
feedbacks received from them which gave me an opportunity to make improvements to
this thesis.
I am grateful to the Nevada Department of Transportation (NDOT) for funding this
study. The NDOT has played a very important role for this study – from selecting the 11
towns for the study to providing crash data of those towns. The NDOT also provided
radar guns and a measuring wheel for the site data collection.
I am very thankful to the representatives of state Departments of Transportation of the
U.S. for providing questionnaire responses despite their busy work schedules. Their
responses were very useful to identify the best practices for setting up speed zones in
towns along rural highways.
I would also like to thank Mr. Kishor Shrestha for helping me with the site data
collection for this research.
I cannot forget Ms. Julie Longo, Technical Writer at the College of Engineering, and
Ms. Carol Turner, Consultant at Writing Center, for proofreading and copy-editing this
thesis.
vi
Finally none of this would have been possible without the help and support from my
family, especially my sister Ms. Buddha Laxmi Shrestha. She always encouraged me to
believe in myself and guided me in every step of my life. Her unconditional love and
support is first reason that I have been up to this point of my life. Also, I cannot forget
my brother, Mr. Babu Krishna Shrestha, for doing everything he can, for my better
future. Many thanks go to my mother, Ms. Ganga Laxmi Shrestha, and my father, Mr.
Hari Krishna Shrestha, for their never-ending love and support.

vii
DEDICATION
To my sister, brother, mother, and father,
thank you all for your love and support in every step of my life.
I love you all.
viii
TABLE OF CONTENTS
ABSTRACT ....................................................................................................................... iii
ACKNOWLEDGEMENTS ................................................................................................ v
DEDICATION .................................................................................................................. vii
LIST OF TABLES ............................................................................................................. xi
LIST OF FIGURES ......................................................................................................... xiv
CHAPTER 1 INTRODUCTION ..................................................................................... 1 Overview of the Study ................................................................................................... 2 Study Objectives ............................................................................................................ 4
CHAPTER 2 LITERATURE REVIEW .......................................................................... 5
Factors Affecting the Operating Speeds and Speed Limits ........................................... 6 Road Characteristics ............................................................................................... 7 Roadside Environment ............................................................................................ 8
Human Factors ........................................................................................................ 8 Factors Affecting Crashes and Their Severities ............................................................. 8
Statistical Models to Determine Factors Affecting Crash Severities...................... 9 Effect of the Speed Limit on Crashes ................................................................... 15
Speed Reduction Techniques ....................................................................................... 17 Effect of Police Enforcement on Speed Reduction ............................................... 19 Effect of Radar Technology on Speed and Crash Reduction ............................... 20 Effect of Speed-Camera on Speed Reduction ....................................................... 20
Effect of Dynamic Speed Display on Speed Reduction ....................................... 21 Traffic Calming ..................................................................................................... 22
Guidelines for Establishing Speed Zones .................................................................... 24 NHTSA Highway Speed Management Guidelines No. 19 ................................... 25
Florida DOT Speed-Zone Manual ........................................................................ 25 Oregon DOT Speed-Zone Manual ........................................................................ 27
Massachusetts DOT Speed-Zone Manual ............................................................. 28 Texas DOT Speed-Zone Manual .......................................................................... 28 Wyoming DOT Speed-Zone Manual .................................................................... 29
Wisconsin DOT Speed-Zone Manual ................................................................... 30 North Carolina DOT Speed-Zone Guidelines ....................................................... 31
Montana DOT Speed-Zone Manual...................................................................... 32 Missouri DOT Speed-Zone Guideline .................................................................. 33 Louisiana DOT Speed-Zone Manual .................................................................... 34
Kentucky DOT Speed-Zone Manual .................................................................... 35 Idaho Transportation Department Speed-Zone Guidelines .................................. 36 Georgia DOT Speed-Zone Guidelines .................................................................. 38 Arizona DOT Speed-Zone Guidelines .................................................................. 39
California DOT Speed-Zone Manual.................................................................... 40 FHWA Manual on Uniform Traffic Control Devices (MUTCD) ........................ 42 Recommended Practices of the Institute of Transportation Engineers (ITE) ....... 43 Nevada Statutes Related to the Speed Limit ......................................................... 43
ix
CHAPTER 3 RESEARCH METHODOLOGY ............................................................ 45 Statistical Models ......................................................................................................... 47
Ordinary Least Squares Model ............................................................................. 47 Binary Logit Model............................................................................................... 47
Multinomial Logit Model ..................................................................................... 47 Research Hypotheses ............................................................................................ 48 Null Hypotheses .................................................................................................... 48
Limitations ................................................................................................................... 49
CHAPTER 4 DATA COLLECTION ............................................................................ 50 Crash Data .................................................................................................................... 50 Site Data ....................................................................................................................... 51
Location of Data Collection .................................................................................. 51
Spot Speed Data Collection Criteria ..................................................................... 53
Questionnaire Survey Data .......................................................................................... 54
CHAPTER 5 RESULTS................................................................................................ 56 Crash Data Results ....................................................................................................... 56
Crash Data by Town ............................................................................................. 57
Distribution of Crashes Based on Various Crash Factors ..................................... 61 Crash Data Comparison ........................................................................................ 70
Crash Severity Prediction Models Using MNL Model and Binary Logit Model . 74 Site Data Results .......................................................................................................... 82
Descriptive Statistics of Spot Speed Data ............................................................. 83
Road and Roadside Characteristics ....................................................................... 84 Correlations Between Crashes and Speed Values ................................................ 89
Survey Questionnaire Results ...................................................................................... 92
Crashes and Fatalities vs. Miles ............................................................................ 92
Top Reasons for Crashes on Rural Highways ...................................................... 96 State Speed-Zone Legislature ............................................................................... 97
Traffic Engineer’s Personal View ....................................................................... 103 Issues of the Local Communities ........................................................................ 108 Factors That Affect in Setting up a Speed Limit ................................................ 113
CHAPTER 6 CONCLUSIONS AND RECOMMENDATIONS ............................... 116 Crash Statistics ........................................................................................................... 116
Speed-Zone Guideline ................................................................................................ 117 Best Practices ............................................................................................................. 118
APPENDIX A CRASH STATISTICS BY TOWN ................................................... 120
APPENDIX B TIME FACTORS ASSOCIATED WITH CRASHES ...................... 127
APPENDIX C SITE DATA COLLECTION FORMS .............................................. 131
APPENDIX D SITE MAPS OF TOWNS UNDER STUDY .................................... 144
APPENDIX E CUMULATIVE SPOT SPEEDS AND 85TH
PERCENTILE SPEEDS ..
........................................................................................................... 156
x
APPENDIX F CORRELATION COEFFICIENTS BETWEEN CRASHES AND
SPEED VALUES .................................................................................................... 168
APPENDIX G QUESTIONNAIRE SURVEY FORM .............................................. 209
REFERENCES ............................................................................................................... 221
VITA ............................................................................................................................... 236
xi
LIST OF TABLES
Table 1 Summary of Literature Related to the Effect of Road Characteristics on
Speed ............................................................................................................. 7
Table 2 Summary of Literature Related to the Effect of Increase in Posted Speed
Limit on Crashes ......................................................................................... 16 Table 3 Summary of Literature Related to the Effect of Police Enforcement on
Speed ........................................................................................................... 19 Table 4 Summary of Literature Related to the Effect of Radar Technology on
Speed and Crashes ....................................................................................... 20 Table 5 Summary of Literature Related to the Effect of Dynamic Display on Speed
Reduction .................................................................................................... 22
Table 6 Summary of Literature Related to the Traffic Calming .................................. 23 Table 7. Prevailing Speed Reduction (Adapted From Missouri Department of
Transportation (MoDOT, 2010)) ................................................................. 34
Table 8 Ball-Bank Reading and Speed Limit (Adapted From ITD (1997)) ................ 37 Table 9 Levels of Parking and Pedestrian Activities (Adapted From ITD (1997)) ..... 38
Table 10 Spot Speed Data Collection Location Details ............................................... 52 Table 11 Spot Speed Data Collection Time and Conditions........................................ 53 Table 12 Overall Crash Statistics of the 11 Towns Under Study ................................ 57
Table 13 Fatal Crashes and Fatalities by Towns .......................................................... 58 Table 14 Distribution of Crashes Based on Road Conditions...................................... 62
Table 15 Distribution of Crashes Based on Weather Conditions ................................ 63 Table 16 Distribution of Crashes Based on Road Lighting ......................................... 63
Table 17 Distribution of Crashes Based on Primary Vehicle Most Harmful Events ... 64 Table 18 Distribution of Crashes Based on Collision Types ....................................... 65
Table 19 Distribution of Crashes Based on Primary Vehicle Driver Factor ................ 65 Table 20 Distribution of Crashes Based on Primary Vehicle Actions ......................... 66 Table 21 Distribution of Crashes Based on Primary Vehicle Types Involved in the
Crashes ........................................................................................................ 67 Table 22 Distribution of Crashes Based on Number of Vehicles Involved ................. 67
Table 23 Mileage and Crash Statistics of the 11 Towns Under Study......................... 71 Table 24 Compaisons of Mileage and Crash Statistics Between Towns Under Study
and All Rural Areas of Nevada ................................................................... 72 Table 25 Population and Crash Statistics of the 11 Towns Under Study .................... 72 Table 26 Compaisons of Population and Crash Statistics (2010) between towns
under study and all rural areas of Nevada ................................................... 73
Table 27 Comparison of Percentage of Fatalities between towns under study and all
rural areas of Neavada ................................................................................. 74 Table 28 Category Codes Used to Develop Statistical Models for Predicting Crash
Severities ..................................................................................................... 75 Table 29 Relative Risk Ratios for Significant Factors (Multinominal Logit Model) .. 77 Table 30 The Overall Effect of Different Predictor Variables on Crash Injuries
(MNL Model) .............................................................................................. 78 Table 31 Odds Ratios for Significant Factors (Binary Logit Model) .......................... 79
xii
Table 32 The Overall Effect of Different Predictor Variables on Crash Injuries
(Binary Logistic Model) .............................................................................. 80 Table 33 Margins of the Factors That are Likely to Result in Injury Crashes ............. 81 Table 34 Marginal Effects on Probablility of Injury by Changing Variables From
Base Value ................................................................................................... 82 Table 35 Descriptive Statistics of Spot Speed Analysis .............................................. 84 Table 36 Longitudinal Properties of the Highways Under Study ................................ 85 Table 37 Sectional Properties of the Highways Under Study ...................................... 85 Table 38 Surrounding Characteristics of the Highways .............................................. 86
Table 39 Traffic Control Devices on the Highways .................................................... 87 Table 40 Characteristics of the Speed Zones ............................................................... 88 Table 41 Presence of Curves in Transition Zone ......................................................... 88 Table 42 Highway Speed-Zone Data – Pedestrian Interaction, Train Crossing, and
Speed-Zone Length ..................................................................................... 89 Table 43 Overview of All Coefficients of Correlation ................................................ 91
Table 44 Overview of All Pseudo R2 Values ............................................................... 92
Table 45 Questionnaire Survey Response Statistics .................................................... 92
Table 46 Highway and Crash Statistics ....................................................................... 94 Table 47 Crashes and Fatalities per 1,000 Miles in Rural State Highways for
Different States ............................................................................................ 95
Table 48 Top Reasons for Crashes (Sorted According to the Count) .......................... 96 Table 49 Top Factors Influencing a Decision in Setting up a Speed Zone ................ 103
Table 50 Number of Complaints from Communities of Towns Along Rural
Highways ................................................................................................... 109 Table 51 Total Crashes per Year by Town ................................................................ 121
Table 52 Non-fatal Injury-Causing Crashes per Year by Town ................................ 122
Table 53 No. of PDO Crashes per Year by Town...................................................... 123 Table 54 Non-fatal Injuries per Year by Town .......................................................... 124 Table 55 Average Injuries per Non-fatal Injury-Causing Crashes by Town ............. 125
Table 56 PDO Crashes Vs. Non-fatal Injury-Causing Crashes ................................. 126 Table 57 Crash Distribution by Hour ......................................................................... 128
Table 58 Crash Distribution by Day .......................................................................... 129 Table 59 Crash Distribution by Month ...................................................................... 130
Table 60 Correlation between Number of Crashes and Percentage of Vehicles
Exceeding Posted Speed Limit .................................................................. 169 Table 61 Correlation between Number of Crashes and Posted Speed Limit ............. 171 Table 62 Correlation between Number of Crashes and 85
th Percentile Speed .......... 173
Table 63 Correlation between Number of Crashes and Mean Speed ........................ 175
Table 64 Correlation between Number of Crashes and Median Speed ..................... 177 Table 65 Correlation between Number of Non-fatal Injury-Causing Crashes and
Percentage of Vehicles Exceeding Posted Speed Limit ............................ 179 Table 66 Correlation between Number of Non-fatal Injury-Causing Crashes and
Posted Speed Limit .................................................................................... 181 Table 67 Correlation between Number of Non-fatal Injury-Causing Crashes and
85th
Percentile Speed ................................................................................. 183
xiii
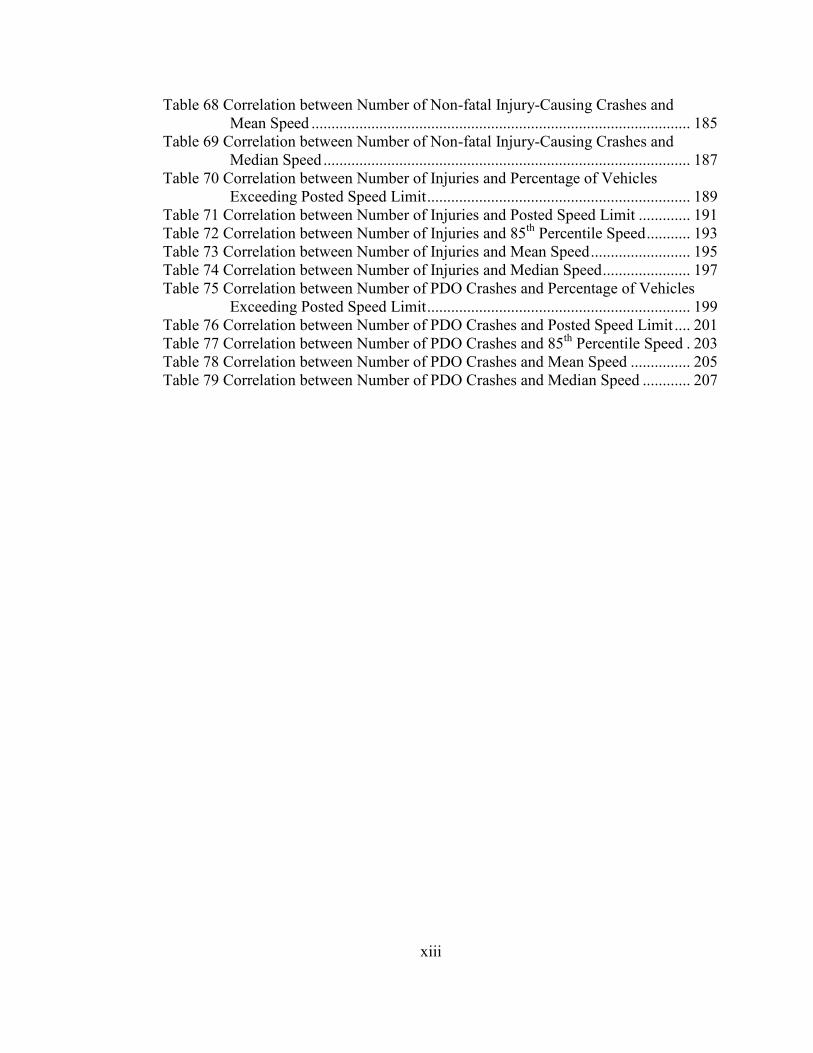
Table 68 Correlation between Number of Non-fatal Injury-Causing Crashes and
Mean Speed ............................................................................................... 185 Table 69 Correlation between Number of Non-fatal Injury-Causing Crashes and
Median Speed ............................................................................................ 187
Table 70 Correlation between Number of Injuries and Percentage of Vehicles
Exceeding Posted Speed Limit .................................................................. 189 Table 71 Correlation between Number of Injuries and Posted Speed Limit ............. 191 Table 72 Correlation between Number of Injuries and 85
th Percentile Speed ........... 193
Table 73 Correlation between Number of Injuries and Mean Speed ......................... 195
Table 74 Correlation between Number of Injuries and Median Speed ...................... 197 Table 75 Correlation between Number of PDO Crashes and Percentage of Vehicles
Exceeding Posted Speed Limit .................................................................. 199 Table 76 Correlation between Number of PDO Crashes and Posted Speed Limit .... 201
Table 77 Correlation between Number of PDO Crashes and 85th
Percentile Speed . 203 Table 78 Correlation between Number of PDO Crashes and Mean Speed ............... 205
Table 79 Correlation between Number of PDO Crashes and Median Speed ............ 207
xiv
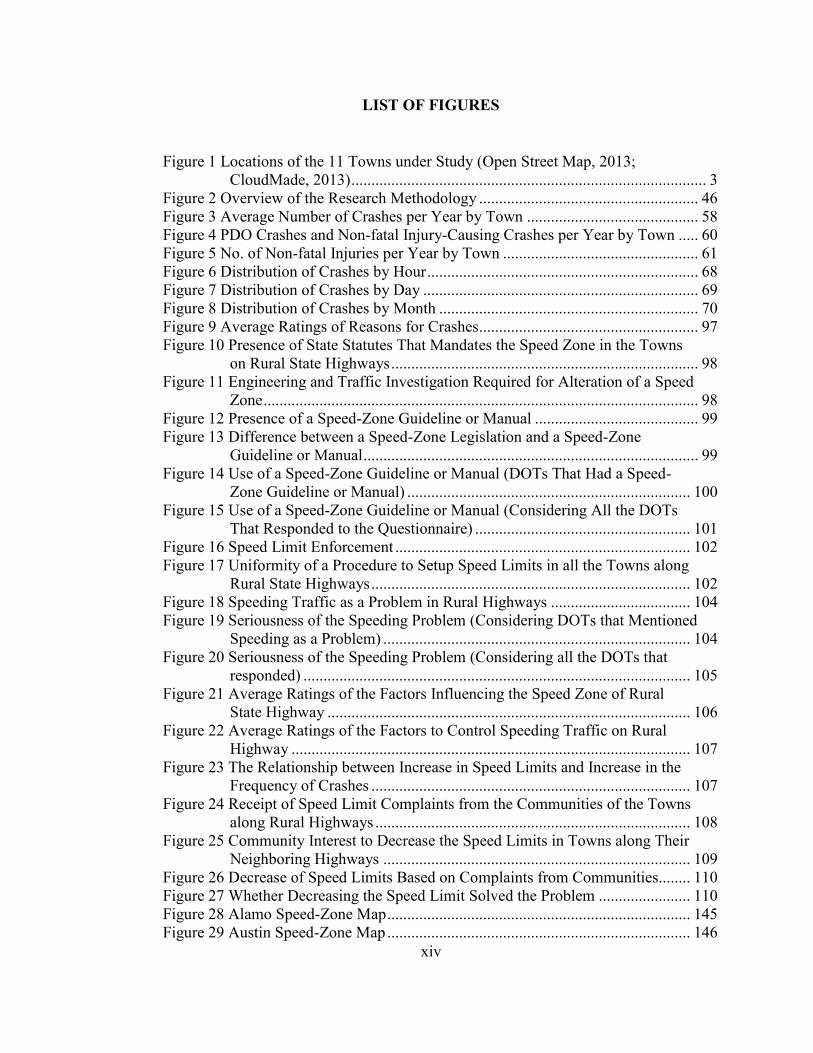
LIST OF FIGURES
Figure 1 Locations of the 11 Towns under Study (Open Street Map, 2013;
CloudMade, 2013) ......................................................................................... 3
Figure 2 Overview of the Research Methodology ....................................................... 46 Figure 3 Average Number of Crashes per Year by Town ........................................... 58 Figure 4 PDO Crashes and Non-fatal Injury-Causing Crashes per Year by Town ..... 60 Figure 5 No. of Non-fatal Injuries per Year by Town ................................................. 61 Figure 6 Distribution of Crashes by Hour .................................................................... 68
Figure 7 Distribution of Crashes by Day ..................................................................... 69 Figure 8 Distribution of Crashes by Month ................................................................. 70 Figure 9 Average Ratings of Reasons for Crashes....................................................... 97
Figure 10 Presence of State Statutes That Mandates the Speed Zone in the Towns
on Rural State Highways ............................................................................. 98 Figure 11 Engineering and Traffic Investigation Required for Alteration of a Speed
Zone ............................................................................................................. 98 Figure 12 Presence of a Speed-Zone Guideline or Manual ......................................... 99
Figure 13 Difference between a Speed-Zone Legislation and a Speed-Zone
Guideline or Manual .................................................................................... 99 Figure 14 Use of a Speed-Zone Guideline or Manual (DOTs That Had a Speed-
Zone Guideline or Manual) ....................................................................... 100 Figure 15 Use of a Speed-Zone Guideline or Manual (Considering All the DOTs
That Responded to the Questionnaire) ...................................................... 101 Figure 16 Speed Limit Enforcement .......................................................................... 102
Figure 17 Uniformity of a Procedure to Setup Speed Limits in all the Towns along
Rural State Highways ................................................................................ 102
Figure 18 Speeding Traffic as a Problem in Rural Highways ................................... 104 Figure 19 Seriousness of the Speeding Problem (Considering DOTs that Mentioned
Speeding as a Problem) ............................................................................. 104
Figure 20 Seriousness of the Speeding Problem (Considering all the DOTs that
responded) ................................................................................................. 105
Figure 21 Average Ratings of the Factors Influencing the Speed Zone of Rural
State Highway ........................................................................................... 106
Figure 22 Average Ratings of the Factors to Control Speeding Traffic on Rural
Highway .................................................................................................... 107 Figure 23 The Relationship between Increase in Speed Limits and Increase in the
Frequency of Crashes ................................................................................ 107
Figure 24 Receipt of Speed Limit Complaints from the Communities of the Towns
along Rural Highways ............................................................................... 108 Figure 25 Community Interest to Decrease the Speed Limits in Towns along Their
Neighboring Highways ............................................................................. 109 Figure 26 Decrease of Speed Limits Based on Complaints from Communities........ 110 Figure 27 Whether Decreasing the Speed Limit Solved the Problem ....................... 110 Figure 28 Alamo Speed-Zone Map ............................................................................ 145 Figure 29 Austin Speed-Zone Map ............................................................................ 146
xv
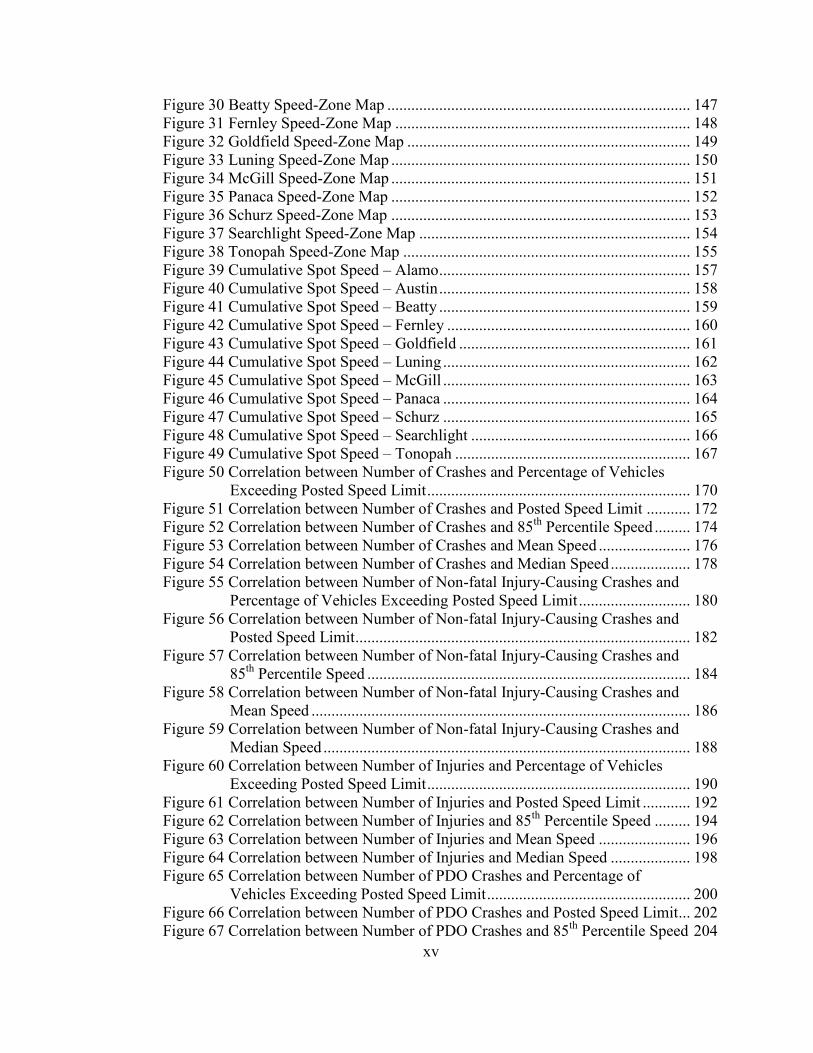
Figure 30 Beatty Speed-Zone Map ............................................................................ 147 Figure 31 Fernley Speed-Zone Map .......................................................................... 148 Figure 32 Goldfield Speed-Zone Map ....................................................................... 149 Figure 33 Luning Speed-Zone Map ........................................................................... 150
Figure 34 McGill Speed-Zone Map ........................................................................... 151 Figure 35 Panaca Speed-Zone Map ........................................................................... 152 Figure 36 Schurz Speed-Zone Map ........................................................................... 153 Figure 37 Searchlight Speed-Zone Map .................................................................... 154 Figure 38 Tonopah Speed-Zone Map ........................................................................ 155
Figure 39 Cumulative Spot Speed – Alamo ............................................................... 157 Figure 40 Cumulative Spot Speed – Austin ............................................................... 158 Figure 41 Cumulative Spot Speed – Beatty ............................................................... 159 Figure 42 Cumulative Spot Speed – Fernley ............................................................. 160
Figure 43 Cumulative Spot Speed – Goldfield .......................................................... 161 Figure 44 Cumulative Spot Speed – Luning .............................................................. 162
Figure 45 Cumulative Spot Speed – McGill .............................................................. 163 Figure 46 Cumulative Spot Speed – Panaca .............................................................. 164
Figure 47 Cumulative Spot Speed – Schurz .............................................................. 165 Figure 48 Cumulative Spot Speed – Searchlight ....................................................... 166 Figure 49 Cumulative Spot Speed – Tonopah ........................................................... 167
Figure 50 Correlation between Number of Crashes and Percentage of Vehicles
Exceeding Posted Speed Limit .................................................................. 170
Figure 51 Correlation between Number of Crashes and Posted Speed Limit ........... 172 Figure 52 Correlation between Number of Crashes and 85
th Percentile Speed ......... 174
Figure 53 Correlation between Number of Crashes and Mean Speed ....................... 176
Figure 54 Correlation between Number of Crashes and Median Speed .................... 178
Figure 55 Correlation between Number of Non-fatal Injury-Causing Crashes and
Percentage of Vehicles Exceeding Posted Speed Limit ............................ 180 Figure 56 Correlation between Number of Non-fatal Injury-Causing Crashes and
Posted Speed Limit .................................................................................... 182 Figure 57 Correlation between Number of Non-fatal Injury-Causing Crashes and
85th
Percentile Speed ................................................................................. 184 Figure 58 Correlation between Number of Non-fatal Injury-Causing Crashes and
Mean Speed ............................................................................................... 186 Figure 59 Correlation between Number of Non-fatal Injury-Causing Crashes and
Median Speed ............................................................................................ 188 Figure 60 Correlation between Number of Injuries and Percentage of Vehicles
Exceeding Posted Speed Limit .................................................................. 190
Figure 61 Correlation between Number of Injuries and Posted Speed Limit ............ 192 Figure 62 Correlation between Number of Injuries and 85
th Percentile Speed ......... 194
Figure 63 Correlation between Number of Injuries and Mean Speed ....................... 196 Figure 64 Correlation between Number of Injuries and Median Speed .................... 198 Figure 65 Correlation between Number of PDO Crashes and Percentage of
Vehicles Exceeding Posted Speed Limit ................................................... 200 Figure 66 Correlation between Number of PDO Crashes and Posted Speed Limit... 202 Figure 67 Correlation between Number of PDO Crashes and 85
th Percentile Speed 204

xvi
Figure 68 Correlation between Number of PDO Crashes and Mean Speed .............. 206 Figure 69 Correlation between Number of PDO Crashes and Median Speed ........... 208
1
CHAPTER 1
INTRODUCTION
Half a century back, the number of traffic fatalities in United States (U.S.) was
increasing rapidly (National Highway Traffic Safety Administration [NHTSA], 2012).
However, the number of such fatalities has been decreasing since 2005. The Nevada
Department of Transportation report shows that the number of fatalities in Nevada had
been decreasing from 2006 to 2009 (NDOT, 2012). Nevertheless, the numbers of fatal
crashes per 100 million Vehicle Miles Traveled (VMT) in Nevada were higher than the
national averages from year 2001 to 2009. Nevada is among the top ten states with the
highest crash rates in the U.S. In order to reduce the number of traffic crashes and
resulting fatalities, investigation of crashes becomes necessary.
The major reasons for crashes fall into four main categories: the vehicle factor, the
driver factor, the roadway factor, and the roadside factor. As evident by Toyota’s $50
million investment for Toyota Collaborative Safety Research Center (CSRC) in 2011,
huge investments have been made to develop better and safer technologies for motor
vehicles (Toyota Motor Sales, U.S.A., Inc. Toyota, 2013). Some of the technologies
developed for active safety include the anti-lock brake system, the brake assistant,
traction control, vehicle stability control, radar cruise control, the lane-keeping assist, the
navigation-brake assist, night view, and approaching vehicle audible system (Toyota
Motor Corporation, 2013). However, the development of vehicle safety technologies
alone is not enough for a safer road. A driver education is crucial for safer road,
especially concerning youth drivers (NHTSA, 1994).
2
Idaho Transportation Department states that the severity of crashes depends on the
vehicle speed (IDT, 1997). However, the probability of crashes depends more on the
differential speeds than on the absolute speeds. Various transition zone treatments have
been investigated and practiced to reduce the speed of vehicles that are approaching
towns along rural highways (Torbic et al., 2012).
Overview of the Study
In 2010, 51,664 crashes occurred in Nevada. Out of those crashes, Property Damage
Only (PDO), injury, and fatal crashes were 63.40%, 36.15%, and 0.45% respectively.
About 9% of those crashes occurred in the rural areas. Among all these categories of
crashes that occurred in Nevada, 10% of PDO crashes, 8% of injury crashes, and 41% of
fatal crashes occurred in rural areas of the state (NDOT, 2012). This shows that a higher
percentage of the fatal crashes occurred in the rural areas as compared to injury crashes
and PDO crashes. Therefore, in order to reduce speed-related crashes in the towns along
rural highways in Nevada, NDOT is funding this study to identify the best practices in
setting up speed zones in these areas.
Many states already have some form of speed-zone guideline or manual to quickly
process and resolve complaints related to speed zones. However, the Nevada Department
of Transportation (NDOT) does not yet have such guideline or manual. A guideline for
setting up speed zones in towns along the rural highways is necessary for consistent
procedure to setup speed zone throughout the state. The guideline, once prepared, should
be followed by all the district traffic engineers of the NDOT.
3
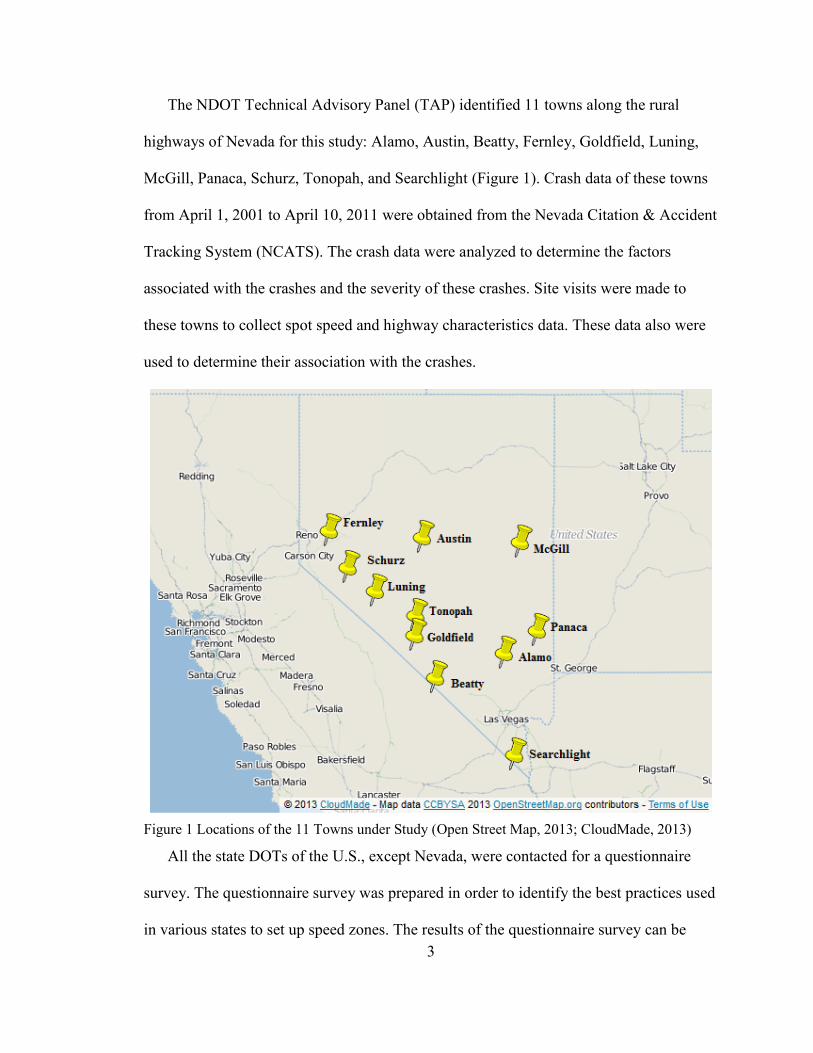
The NDOT Technical Advisory Panel (TAP) identified 11 towns along the rural
highways of Nevada for this study: Alamo, Austin, Beatty, Fernley, Goldfield, Luning,
McGill, Panaca, Schurz, Tonopah, and Searchlight (Figure 1). Crash data of these towns
from April 1, 2001 to April 10, 2011 were obtained from the Nevada Citation & Accident
Tracking System (NCATS). The crash data were analyzed to determine the factors
associated with the crashes and the severity of these crashes. Site visits were made to
these towns to collect spot speed and highway characteristics data. These data also were
used to determine their association with the crashes.
Figure 1 Locations of the 11 Towns under Study (Open Street Map, 2013; CloudMade, 2013)
All the state DOTs of the U.S., except Nevada, were contacted for a questionnaire
survey. The questionnaire survey was prepared in order to identify the best practices used
in various states to set up speed zones. The results of the questionnaire survey can be
4
used to formulate a speed-zone guideline for towns along the rural highways of Nevada.
Once the guideline is prepared, it will aid NDOT officials in their decision-making
process to efficiently handle community requests related to speed zones. Conclusions and
recommendations to prepare speed-zone guideline as well as a discussion of the
limitations of the study are provided.
Study Objectives
The overall goal of this study is to determine the factors that must be considered
while setting up speed zones in towns along the rural highways. The main objectives of
this study are:
1) To determine the factors associated with crashes;
2) To determine the factors that affect a speed limit;
3) To identify the best practices used by other state DOTs when setting up the speed
zones in towns along their rural highways; and
4) To provide recommendations for preparing a speed-zone guideline for towns
along the rural highways in Nevada.
5
CHAPTER 2
LITERATURE REVIEW
Federal Highway Administration study (2000) showed that people travel 1.5 times
more on urban roads in comparison to rural roads. However, more than half the total
fatalities as well as more than half the speed-related fatalities occurred in rural areas in
1999. The reason of higher fatalities in rural roads is that rural roads have a higher
incidence of severe crashes than urban roads; they also have rougher terrain; longer
intervals between a crash and the time of discovery, and a lower level of available trauma
care.
The FHWA (2012, p. 21)’s Manual on Uniform Traffic Control Devices (MUTCD)
defined a design speed as “a selected speed used to determine the various geometric
design features of a roadway.” Some transportation professions have cited the design
speed as a limiting factor for determining a maximum speed limit (Idaho Transportation
Department [ITD], 1997). However, determination of speed limits for realistic speed
zones should not be associated with the design speeds of the road. The design speed is
selected to determine the geometry of a roadway while a speed limit should be
determined based on the prevailing speeds of freely-flowing vehicles. This is based on a
fundamental concept that the majority of motorists drive at a reasonably safe and prudent
speed for existing roadway and roadside conditions. This will result in voluntary
compliance of the posted speed limit. However, if the posted speed limit is higher or
lower than the speed dictated by roadway and traffic conditions, it will result in decreased
compliance and more difficulty in speed-limit enforcement. Najjar et al. (2000) suggested
that most motorists tend to drive at a speed depending upon the roadway conditions rather
6
than the speed limit. Hence, setting an unrealistically low speed limit is likely to result in
more variation in speed, resulting in more crashes. Dudek and Ullman (1987) found that
the reduction in speed limit had a detrimental effect on driver compliance to the speed
limits for both local and non-local drivers.
A number of studies were reviewed related to factors affecting the operating speed,
crash and their severities; determination of realistic speed limit; various speed reduction
techniques; and various state DOT guidelines for establishing speed zones. These studies
are summarized in following sections.
Factors Affecting the Operating Speeds and Speed Limits
The operating speed is affected by various factors that can be categorized into three
main categories: 1) road characteristics, 2) roadside environment, and 3) human factors.
A speed limit acceptable to all parties (drivers, residents, legislators, and enforcement
officers) is the one that is determined under favorable weather and prevailing traffic
conditions (AASHTO, 1994). For changes in speed limits, the Institute of Transportation
Engineering (ITE, 1993) suggested that an unbiased engineering study is needed to
examine following conditions: roadside development, road and shoulder characteristics,
pedestrian and bicycle activity, speed limits on adjoining road segments, crash experience
or potential and population density.
Jarvis and Hoban (1989) found that the speed limit depends upon the road cross
section, abutting development, intersections, traffic signals, presence of parks, and
pedestrian or cycle activities. Other numerous studies have found that the speeds at which
7
drivers operate their vehicles depend upon road and roadside characteristics. The findings
of those studies are presented in following sections.
Road Characteristics
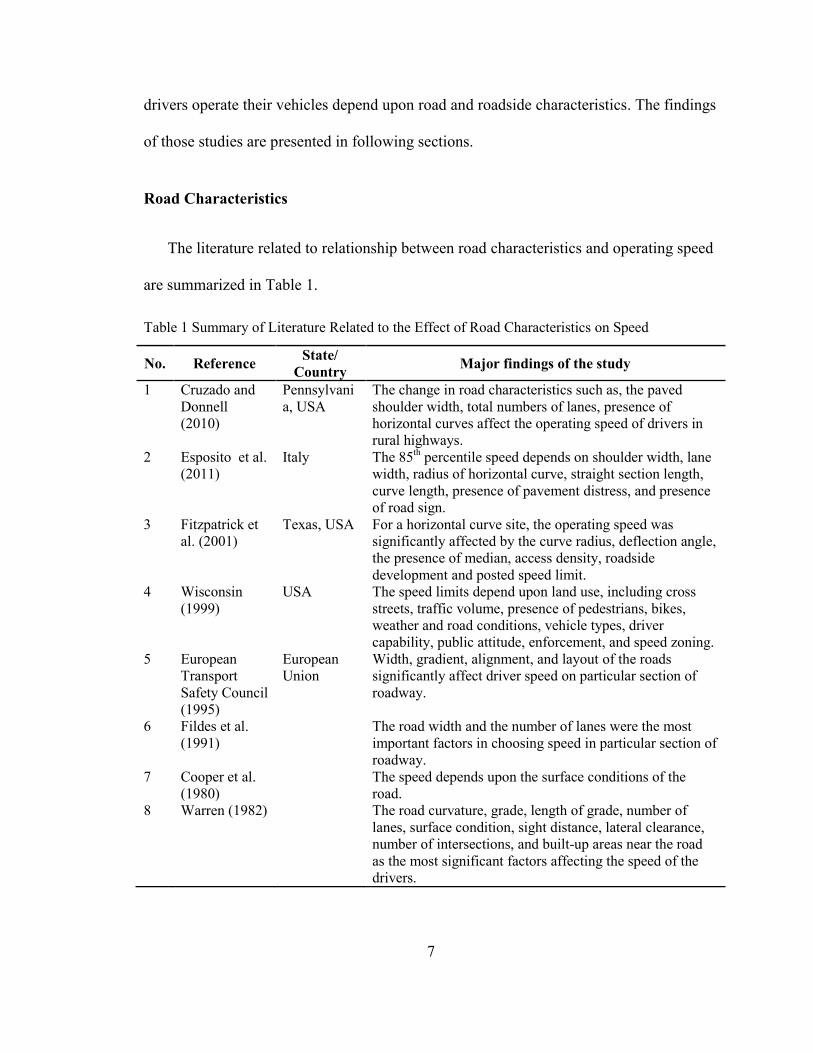
The literature related to relationship between road characteristics and operating speed
are summarized in Table 1.
Table 1 Summary of Literature Related to the Effect of Road Characteristics on Speed
No. Reference State/
Country Major findings of the study
1 Cruzado and
Donnell
(2010)
Pennsylvani
a, USA
The change in road characteristics such as, the paved
shoulder width, total numbers of lanes, presence of
horizontal curves affect the operating speed of drivers in
rural highways.
2 Esposito et al.
(2011)
Italy The 85th percentile speed depends on shoulder width, lane
width, radius of horizontal curve, straight section length,
curve length, presence of pavement distress, and presence
of road sign.
3 Fitzpatrick et
al. (2001)
Texas, USA For a horizontal curve site, the operating speed was
significantly affected by the curve radius, deflection angle,
the presence of median, access density, roadside
development and posted speed limit.
4 Wisconsin
(1999)
USA The speed limits depend upon land use, including cross
streets, traffic volume, presence of pedestrians, bikes,
weather and road conditions, vehicle types, driver
capability, public attitude, enforcement, and speed zoning.
5 European
Transport
Safety Council
(1995)
European
Union
Width, gradient, alignment, and layout of the roads
significantly affect driver speed on particular section of
roadway.
6 Fildes et al.
(1991)
The road width and the number of lanes were the most
important factors in choosing speed in particular section of
roadway.
7 Cooper et al.
(1980)
The speed depends upon the surface conditions of the
road.
8 Warren (1982) The road curvature, grade, length of grade, number of
lanes, surface condition, sight distance, lateral clearance,
number of intersections, and built-up areas near the road
as the most significant factors affecting the speed of the
drivers.
8
Roadside Environment
An operating speed of the vehicles depends on the roadside environment. A study
conducted by Horst and Ridder (2007) showed that the roadside infrastructure – trees,
guardrails, barriers, panels, and emergency lanes – impacts drivers' behaviors on speed
and lane positioning. The speed of a car was dependent upon how far the trees or
guardrail was. For more than 4.5-m away, there was no impact upon the speed; however,
the shorter the distance, the slower the speed of the car. When there was a combination of
trees and guardrail, drivers tended to keep their cars away from the right side;
nevertheless, if there were only trees, there was no influence on the lateral position.
Tignor and Warren (1990) found that the number of access points and nearby commercial
development were the most important factors in determining the speed of the drivers.
Human Factors
Two literature related to the association between human factors and the operating
speed were reviewed. Hassan and Abdel-Aty (2012) used questionnaire survey to
measure aberrant driving behavior of young drivers. The study found that young drivers
are drive very fast because of their habit of being late and their habit of racing the cars.
Elvik (2002) found four factors that affect the choice of optimum speed limits: societal,
road user, taxpayer, and residential.
Factors Affecting Crashes and Their Severities
Elvik (2012) stated that speed is one of the most important factors causing injury
crashes. Rämä (1999) found that crashes occurred more during rain and snowfall. Jonah
9
(1986) and Evans Wasielewski (1983) concluded that young drivers take more risks
while driving and hence are more likely to get involved in the injury crashes. Lee and
Mannering (2002) found that roadside features such as, median width, shoulder width,
vertical curve length, and guardrail distance from the shoulder have a significant
correlation with the frequency and severity of crashes. Jordan (1998) found that the
children were injured by car crashes after they returned home than in school premises.
Statistical Models to Determine Factors Affecting Crash Severities
Some studies had used various modeling approaches such as, binary logistic
regression, multinomial logit model, support vector machine model, non-parametric
classification tree technique, Bayesian multivariate Poisson lognormal model, and mixed
logit model to determine the factors that have association with severities of crashes.
These study findings are summarized below.
Binary logistic regression.
Chen et al. (2012) determined the factors that had significant effect on the severity of
intersection crashes. Twelve factors related to driver characteristics, vehicle features,
environmental and road conditions, and crash characteristics were considered for
analysis. Using binary logistic regression, a total of 12,144 cases were analyzed to
determine the significant factors that affected the severity of intersection crashes.
Initially, univariate analysis was performed for each variable to determine the significant
factors that contributed to the fatal crashes. Twelve variables – namely, driver gender,
driver age, vehicle type, weather condition, light condition, speed zone, traffic control

10
type, month, day of week, time of day, crash type, and seat belt usage – were considered
for univariate analysis. Those factors that were significantly correlated with severities of
intersection crashes at alpha level 0.05 were selected for the multivariate model.
Ten factors, except month and day of week, were found to be significant; these were
used for the multivariate analysis. The results showed that seven factors significantly
affected the severity of intersection crashes: driver gender, age, speed zone, traffic
control type, time of crash, crash type, and seatbelt use. The results showed that crashes
involving males and old drivers (age 65 and above) had higher odds of a fatal outcome.
Similarly, crashes were more fatal when they involved pedestrians, drivers not wearing
seatbelts, speeds of more than 50 kph, and those occurring between midnight and early
morning (12:00 AM to 5:59 AM). The results also showed that crashes occurring in
intersections that had no traffic control devices were more fatal than in intersections with
some kind of traffic control devices.
Multinomial logit model.
Xie et al. (2012) analyzed injury severities involved in single-vehicle crashes on rural
highways in Florida. A total of 4,285 crash data from 2005 were used for the analysis. To
determine the significant correlation with the level of injuries, 53 explanatory variables
were collected relating to driver information, vehicle information, crash information,
weather and lighting, roadway, and speed. The multinomial logit (MNL) model and a
latent class logit (LCL) model based on MNL model were used for data analysis. Five
injury outcomes were considered in terms of severity, namely, no injury, possible injury,
non-incapacitated injury, incapacitated injury, and fatal injury. For MNL and LCL
11
modeling, 53 potential explanatory variables were selected for analysis. Thirty one
explanatory variables were found to have significant correlation with severity level of
injury at alpha level 0.05. The results showed that such factors as driver age, driving
under the influence, seatbelt usage, points of impact, lighting condition, speed, the first
and second most harmful events, and ethnicity all had significant correlation with the
severity level of the driver’s injury.
The authors also compared the results of the MNL and LCL models by analyzing the
marginal effect and prediction accuracy of these models. The marginal effect quantifies
the overall effect of variables under consideration on the crash injury outcomes. The
authors found no difference in marginal effects of these two models. However, the test
for prediction accuracy, which evaluates the goodness-of-fit of the models, showed that
the LCL model predicted the injury severity outcomes better than the MNL model by
about 37%.
Support vector machine model.
Li et al. (2012) estimated the effect of various factors on crash injury severity by the
use of Support Vector Mechanics (SVM). The authors also compared the results of the
SVM model with the traditional Ordered Probit (OP) method. For this analysis, a total of
5,538 crash records in the State of Florida were used from 326 freeway segments that had
a deceleration lane and an exit ramp. An influence area up to 1,500 feet (458 m) upstream
and 1,000 feet (305 m) downstream of the painted nose at the exit ramp was considered.
Five levels of injury severity – no-injury, possible injury, non-incapacitating injury,
incapacitating injury, and fatal injury – were categorized for the purposes of analysis.
12
This study also considered 37 explanatory variables related to ramp type, number of main
lanes, the number of ramp lanes, the length of the deceleration lane, exit ramp, surface
type, shoulder type, width, speed light condition, weather, road surface, crash type, and
use of drugs.
The first set of SVM analysis was done by dividing data in a 4:1 ratio into training
data and testing data. The model predicted five levels of injury severity with an accuracy
of 79.6% for training data and 48.8% for testing data. In order to improve the accuracy of
the predictions, the level of injury was reduced to two classes. The model developed after
that change showed an improved accuracy of 83.8% for training data and 57.6% for
testing data. Similarly, the OP model was developed using the same set of training and
testing data. The results showed that the SVM model had a higher prediction accuracy
compared to the OP model, with 48.8% versus 44.0%, respectively, for testing data.
The authors also conducted a sensitivity analysis, using the OP model, to determine
the relationship between the explanatory variables and the crash injury severity. The
results showed that the number of main lanes on a freeway, the type of land use in
surrounding area, the length of the entire exit ramp, the shoulder width of the freeway
main lane, freeway pavement surface conditions, lighting conditions, weather conditions,
alcohol/drug involvement, and rear-end and sideswipe collision types all were
significantly correlated to the injury severity in crashes. The authors also compared the
relationship between the explanatory variables and crash injury levels of the SVM and
OP models. They concluded that there were inconsistent results for two variables: the
length of the exit ramp and the shoulder width of freeway main lanes. Researchers
13
concluded that the results provided by SVM model were more reasonable in compared to
OP model.
Non-parametric classification tree technique.
Chang and Wang (2006) applied the Classification and Regression Tree (CART), a
non-parametric model, to analyze the relationship of traffic injury severity with 20
predictor variables related to:
1. Temporal characteristics (e.g., time of crash),
2. Highway/environmental characteristics (e.g., lighting condition or speed limit),
3. Driver/vehicle characteristics (e.g., driver age, vehicle type), and
4. Accident variables (e.g., collision type or contributing circumstances).
A total of 12,604 crash records involving 29,673 vehicles in Taipei, Taiwan in 2001
were divided into training and testing data. The data from first eight months were used
for the training model, and rest of the data was used for testing of the model.
The overall accuracy of the model prediction was about 90.3% for training data and
91.7% for testing data. The study showed that vehicle type was the single most influential
variable for classifying injury severity in a traffic crash. It also showed that pedestrians,
motorcycles, and bicycle riders were the most vulnerable to severe injuries. Also collision
type, contributing circumstances, and actions of the driver or vehicle were found to be
important factors in determining the severity of crash injuries. The study concluded that
the CART was a good technique for the analysis of crash injury severity.
14
Bayesian multivariate Poisson lognormal model.
Aguero-Valverde and Jovanis (2009) used a full Bayes multivariate Poisson-
lognormal model to predict the crash frequency of different severity levels. The crash
frequency prediction was combined with expected cost data in order to rank road
segments for safety improvements. In addition, they compared the results of the
multivariate model with those obtained from the independent or univariate Poisson-
lognormal model.
Crash data from District 2-0 of the Pennsylvania Department of Transportation
(PennDOT) was used to develop the models. For each crash record, the data included five
severity levels: deaths, major injuries, moderate injuries, minor injuries, and PDO
crashes.
The study results showed that using the multivariate model instead of the univariate
model significantly improved the accuracy of crash frequency estimates for each level of
severity. By using the multivariate model, the average standard deviation of crash
frequency estimates was reduced by 20%. Similarly, standard deviations of crash
frequency estimates for fatal and major injuries were reduced by 41% and 48%
respectively.
Mixed logit model.
Milton et al. (2008) developed a model to estimate the proportion of various injury-
severity levels, based on the reported accident frequencies on specific roadway segments.
This model allowed the prediction of a severity distribution of accidents on a given
roadway segment as a function of roadway, traffic, and weather-related variables. A
15
mixed logit model was used for the analysis. The data of 274 roadway segments of
Washington State’s multi-lane divided highways were used. The crash data was collected
for 1990 to 1994.
Crash data of 22,568 crashes were used for the study. Due to a limited number of fatal
and disabling injury crashes, only three categories of crashes were used: PDO; possible
injury; and injury, which included evident injury, disabling injury, and fatality.
The factors found to be random included average daily traffic per lane, average
annual snowfall for PDO, the percentage of trucks for possible injury, average daily truck
traffic, and number of interchanges per mile. Other factors, for example, horizontal
curves, number of grade brakes per mile, and pavement frictions were found to be fixed
in nature.
The study concluded that the mixed logit model was able to account for the segment-
specific heterogeneity arising from a number of factors relating to roadway
characteristics. Environmental factors, driver behavior, vehicle type, and interactions
were among these factors.
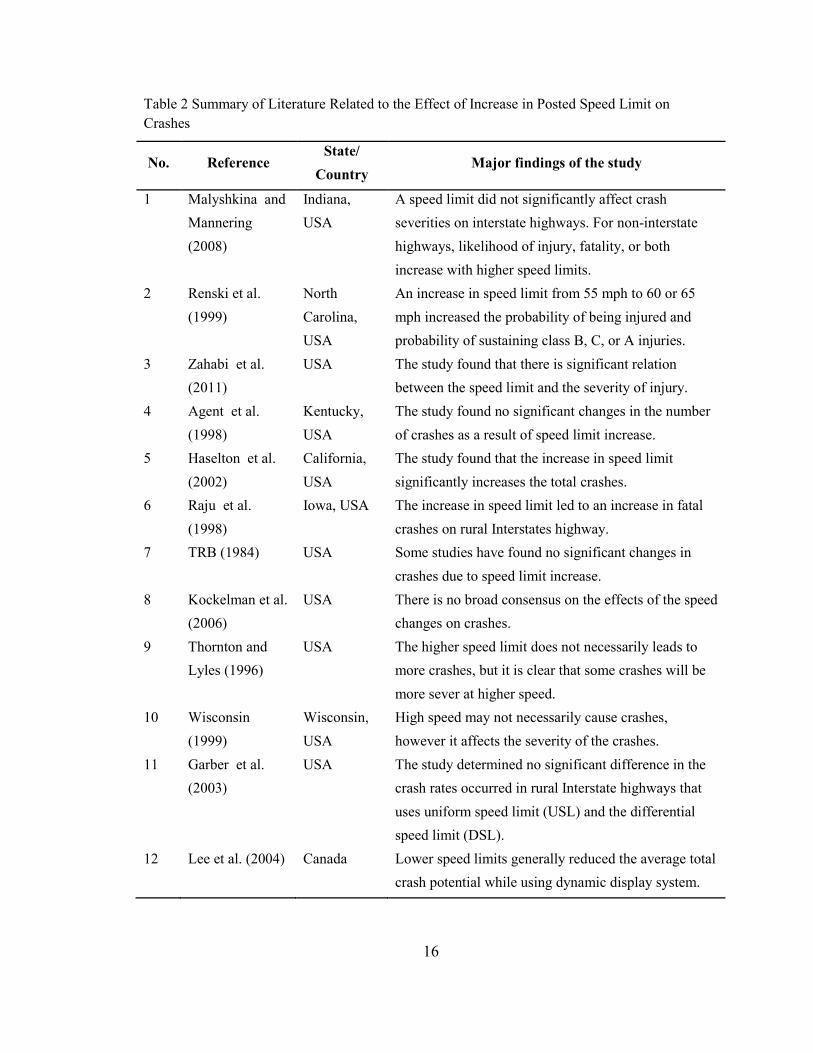
Effect of the Speed Limit on Crashes
The literature related to the effect of increased posted speed limit on the crashes and
their severities have been reviewed and the main findings of these studies are
summarized in Table 2.
16
Table 2 Summary of Literature Related to the Effect of Increase in Posted Speed Limit on
Crashes
No. Reference State/
Country Major findings of the study
1 Malyshkina and
Mannering
(2008)
Indiana,
USA
A speed limit did not significantly affect crash
severities on interstate highways. For non-interstate
highways, likelihood of injury, fatality, or both
increase with higher speed limits.
2 Renski et al.
(1999)
North
Carolina,
USA
An increase in speed limit from 55 mph to 60 or 65
mph increased the probability of being injured and
probability of sustaining class B, C, or A injuries.
3 Zahabi et al.
(2011)
USA The study found that there is significant relation
between the speed limit and the severity of injury.
4 Agent et al.
(1998)
Kentucky,
USA
The study found no significant changes in the number
of crashes as a result of speed limit increase.
5 Haselton et al.
(2002)
California,
USA
The study found that the increase in speed limit
significantly increases the total crashes.
6 Raju et al.
(1998)
Iowa, USA The increase in speed limit led to an increase in fatal
crashes on rural Interstates highway.
7 TRB (1984) USA Some studies have found no significant changes in
crashes due to speed limit increase.
8 Kockelman et al.
(2006)
USA There is no broad consensus on the effects of the speed
changes on crashes.
9 Thornton and
Lyles (1996)
USA The higher speed limit does not necessarily leads to
more crashes, but it is clear that some crashes will be
more sever at higher speed.
10 Wisconsin
(1999)
Wisconsin,
USA
High speed may not necessarily cause crashes,
however it affects the severity of the crashes.
11 Garber et al.
(2003)
USA The study determined no significant difference in the
crash rates occurred in rural Interstate highways that
uses uniform speed limit (USL) and the differential
speed limit (DSL).
12 Lee et al. (2004) Canada Lower speed limits generally reduced the average total
crash potential while using dynamic display system.
17
Speed Reduction Techniques
This section includes the studies evaluating the effectiveness of different types of
police enforcement, radar technologies, speed-camera technology, dynamic-speed display
systems, and various traffic calming methods used in arterial roads and transition zone.
A project called “Managing Speeds of Traffic on European Roads” determined three
key issues related to speed of traffic in that continent (Kallberg et al., 1999). The study
determined the acceptable ranges of speeds for drivers on various types of roads and
under various traffic conditions and also factors affecting the drivers’ choices of speed.
Speed behavior is not only driven by motivation, but also by external feedback factors
as perceived by the driver, such as road design elements and the behavior of other road
users in his or her surroundings. Factors affecting the driver’s choice of speed have been
investigated mainly by means of interviews with drivers and pedestrians. The factors
contributing to higher speeds are the speeds of other vehicles, the mood of the driver, the
acceptability of the present speed, enforcement, and road design.
The study also summarized a variety of measures and tools that are currently used for
speed management. These measures were divided into three categories. The first involved
informative and legal measures, including posted speed limits, variable speed limits,
vehicle and driver-type specific speed limits, penalty systems for speeding, speed
recommendation signs, in-vehicle information of the prevailing speed limit, feedback on
speed (roadside or in-vehicle), and education and publicity campaigns. The second
involved measures related to road design, including speed reduction measures, such as
speed humps, road narrowing, and horizontal deflections; roundabouts, village gateways,
pavement markings, rumble strips and other pavement treatments, visibility and visual
18
guidance, traffic calming, and self-explaining roads. The final measures are intervening
measures, and include conventional speed enforcement, automated speed enforcement,
adaptive cruise control, and in-vehicle speed limiters.
This study prepared recommendations for speed management on different kinds of
roads. The recommendations outlined the process for determining the target speeds for
roads. During this process, such factors as the impact of speed on travel time, vehicle
operating costs, crashes, and pollution must be assessed. Once the speed limit is decided,
then various speed management measures should be applied in order to bring the speed of
the vehicles within the targeted speed. The authors recommended speed management
measures and tools, such as harmonization of speed limits in different European
countries, development of European guidelines for urban speed management, wider use
of speed enforcement, and adaption of in-vehicle speed limiters.
In 1998, the Transportation Research Board (TRB) formed a committee to review
current practices for setting and enforcing speed limits (TRB, 1998). This study was
conducted to provide guidance to state and local governments on appropriate methods of
setting speed limits as well as other related enforcement strategies. The report
summarized six critical areas of setting and enforcing speed limits. They are:
Factors affecting the determination of appropriate speed limits;
Effects of speed on safety, travel time, and operating costs;
Methods for setting up speed limits;
Speed enforcement;
Speed management strategies; and
Guidance on setting and enforcing speed limits.
19
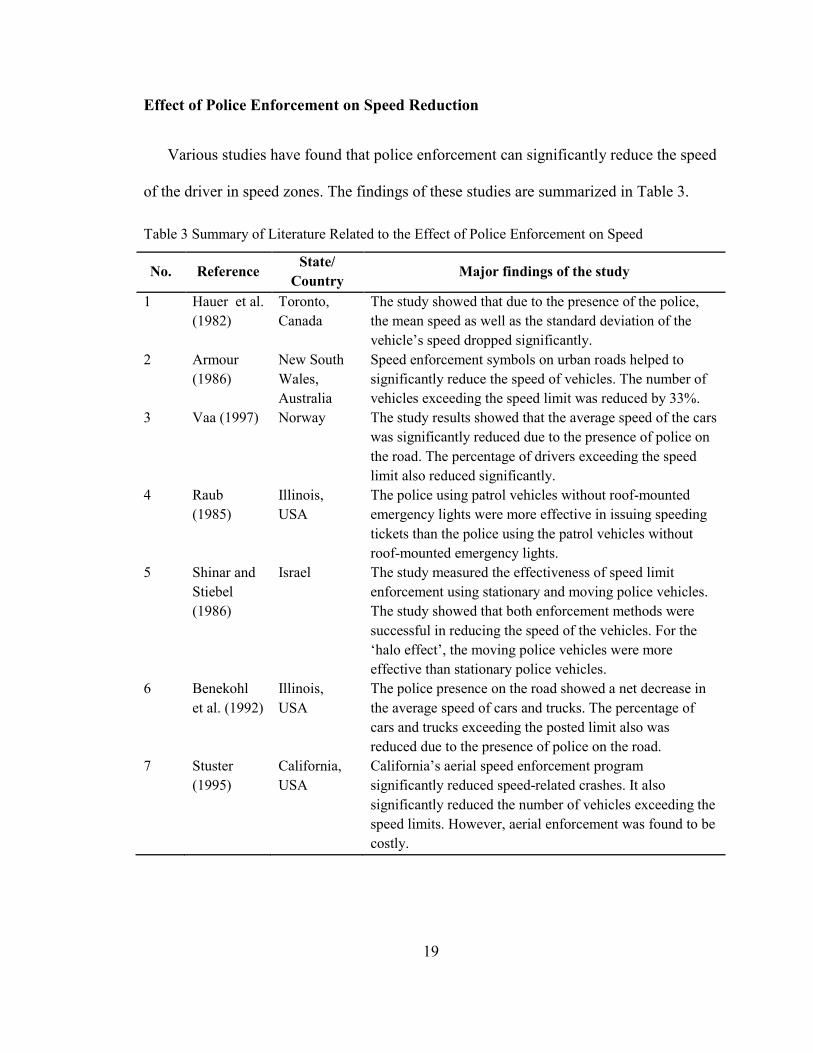
Effect of Police Enforcement on Speed Reduction
Various studies have found that police enforcement can significantly reduce the speed
of the driver in speed zones. The findings of these studies are summarized in Table 3.
Table 3 Summary of Literature Related to the Effect of Police Enforcement on Speed
No. Reference State/
Country Major findings of the study
1 Hauer et al.
(1982)
Toronto,
Canada
The study showed that due to the presence of the police,
the mean speed as well as the standard deviation of the
vehicle’s speed dropped significantly.
2 Armour
(1986)
New South
Wales,
Australia
Speed enforcement symbols on urban roads helped to
significantly reduce the speed of vehicles. The number of
vehicles exceeding the speed limit was reduced by 33%.
3 Vaa (1997) Norway The study results showed that the average speed of the cars
was significantly reduced due to the presence of police on
the road. The percentage of drivers exceeding the speed
limit also reduced significantly.
4 Raub
(1985)
Illinois,
USA
The police using patrol vehicles without roof-mounted
emergency lights were more effective in issuing speeding
tickets than the police using the patrol vehicles without
roof-mounted emergency lights.
5 Shinar and
Stiebel
(1986)
Israel The study measured the effectiveness of speed limit
enforcement using stationary and moving police vehicles.
The study showed that both enforcement methods were
successful in reducing the speed of the vehicles. For the
‘halo effect’, the moving police vehicles were more
effective than stationary police vehicles.
6 Benekohl
et al. (1992)
Illinois,
USA
The police presence on the road showed a net decrease in
the average speed of cars and trucks. The percentage of
cars and trucks exceeding the posted limit also was
reduced due to the presence of police on the road.
7 Stuster
(1995)
California,
USA
California’s aerial speed enforcement program
significantly reduced speed-related crashes. It also
significantly reduced the number of vehicles exceeding the
speed limits. However, aerial enforcement was found to be
costly.
20
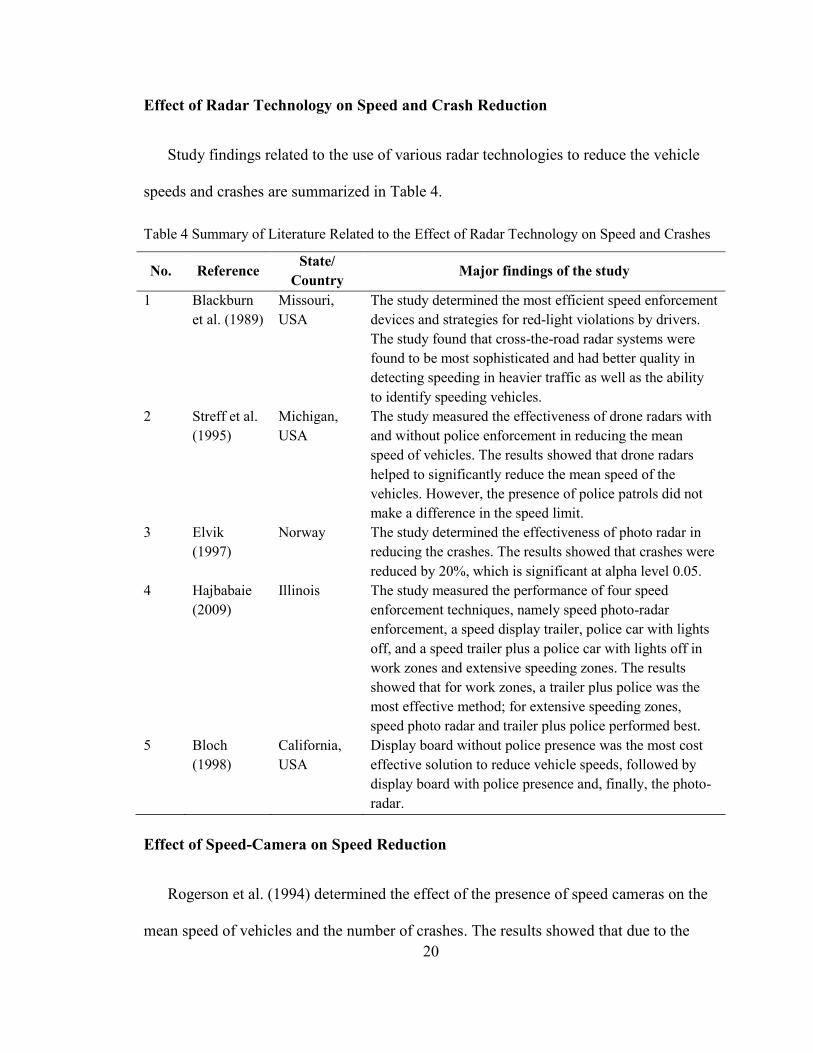
Effect of Radar Technology on Speed and Crash Reduction
Study findings related to the use of various radar technologies to reduce the vehicle
speeds and crashes are summarized in Table 4.
Table 4 Summary of Literature Related to the Effect of Radar Technology on Speed and Crashes
No. Reference State/
Country Major findings of the study
1 Blackburn
et al. (1989)
Missouri,
USA
The study determined the most efficient speed enforcement
devices and strategies for red-light violations by drivers.
The study found that cross-the-road radar systems were
found to be most sophisticated and had better quality in
detecting speeding in heavier traffic as well as the ability
to identify speeding vehicles.
2 Streff et al.
(1995)
Michigan,
USA
The study measured the effectiveness of drone radars with
and without police enforcement in reducing the mean
speed of vehicles. The results showed that drone radars
helped to significantly reduce the mean speed of the
vehicles. However, the presence of police patrols did not
make a difference in the speed limit.
3 Elvik
(1997)
Norway The study determined the effectiveness of photo radar in
reducing the crashes. The results showed that crashes were
reduced by 20%, which is significant at alpha level 0.05.
4 Hajbabaie
(2009)
Illinois The study measured the performance of four speed
enforcement techniques, namely speed photo-radar
enforcement, a speed display trailer, police car with lights
off, and a speed trailer plus a police car with lights off in
work zones and extensive speeding zones. The results
showed that for work zones, a trailer plus police was the
most effective method; for extensive speeding zones,
speed photo radar and trailer plus police performed best.
5 Bloch
(1998)
California,
USA
Display board without police presence was the most cost
effective solution to reduce vehicle speeds, followed by
display board with police presence and, finally, the photo-
radar.
Effect of Speed-Camera on Speed Reduction
Rogerson et al. (1994) determined the effect of the presence of speed cameras on the
mean speed of vehicles and the number of crashes. The results showed that due to the
21
presence of a speed camera, the percentage of vehicles exceeding their speed limits
reduced; however, no significant reduction in the mean speed of the vehicles was found.
It also was found that there was no significant change in the crash frequency at the test
sites.
Teed and Lund (1993) found more speed limit violations where new laser device
were used as compared to similar locations where conventional police radar were used.
However, the difference was not significant at alpha level 0.10. The study also found that
most of the cars that speeded 20 mph over the limit had radar detectors in their vehicles.
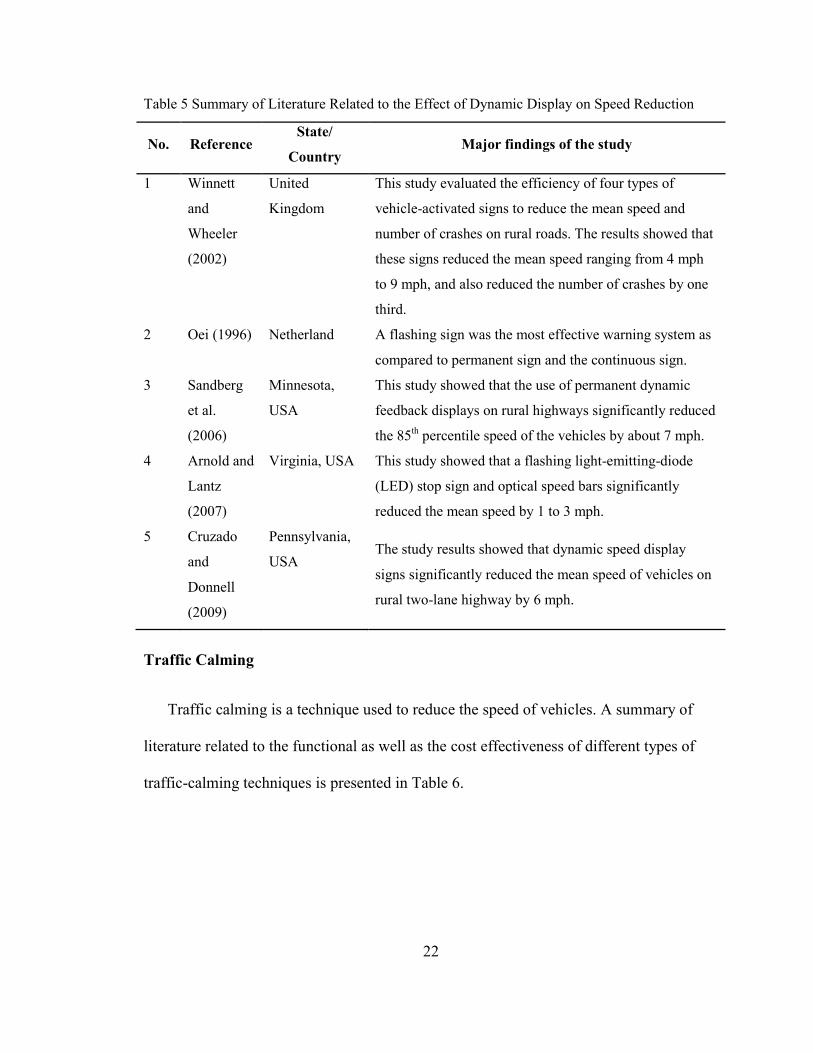
Effect of Dynamic Speed Display on Speed Reduction
Numerous studies related to the use of dynamic speed display in reducing the speed
showed that this method is effective in reducing the speed. The findings related to these
studies are summarized in Table 5.
22
Table 5 Summary of Literature Related to the Effect of Dynamic Display on Speed Reduction
No. Reference State/
Country Major findings of the study
1 Winnett
and
Wheeler
(2002)
United
Kingdom
This study evaluated the efficiency of four types of
vehicle-activated signs to reduce the mean speed and
number of crashes on rural roads. The results showed that
these signs reduced the mean speed ranging from 4 mph
to 9 mph, and also reduced the number of crashes by one
third.
2 Oei (1996) Netherland A flashing sign was the most effective warning system as
compared to permanent sign and the continuous sign.
3 Sandberg
et al.
(2006)
Minnesota,
USA
This study showed that the use of permanent dynamic
feedback displays on rural highways significantly reduced
the 85th percentile speed of the vehicles by about 7 mph.
4 Arnold and
Lantz
(2007)
Virginia, USA This study showed that a flashing light-emitting-diode
(LED) stop sign and optical speed bars significantly
reduced the mean speed by 1 to 3 mph.
5 Cruzado
and
Donnell
(2009)
Pennsylvania,
USA The study results showed that dynamic speed display
signs significantly reduced the mean speed of vehicles on
rural two-lane highway by 6 mph.
Traffic Calming
Traffic calming is a technique used to reduce the speed of vehicles. A summary of
literature related to the functional as well as the cost effectiveness of different types of
traffic-calming techniques is presented in Table 6.
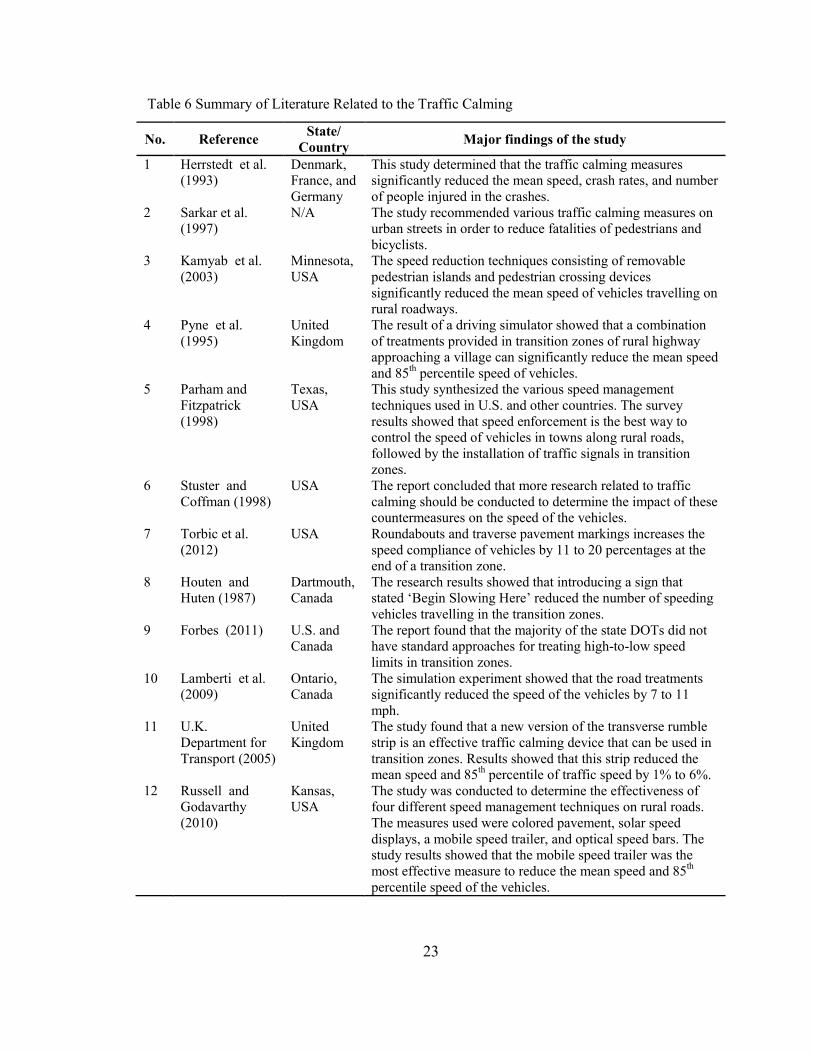
23
Table 6 Summary of Literature Related to the Traffic Calming
No. Reference State/
Country Major findings of the study
1 Herrstedt et al.
(1993)
Denmark,
France, and
Germany
This study determined that the traffic calming measures
significantly reduced the mean speed, crash rates, and number
of people injured in the crashes.
2 Sarkar et al.
(1997)
N/A The study recommended various traffic calming measures on
urban streets in order to reduce fatalities of pedestrians and
bicyclists.
3 Kamyab et al.
(2003)
Minnesota,
USA
The speed reduction techniques consisting of removable
pedestrian islands and pedestrian crossing devices
significantly reduced the mean speed of vehicles travelling on
rural roadways.
4 Pyne et al.
(1995)
United
Kingdom
The result of a driving simulator showed that a combination
of treatments provided in transition zones of rural highway
approaching a village can significantly reduce the mean speed
and 85th
percentile speed of vehicles.
5 Parham and
Fitzpatrick
(1998)
Texas,
USA
This study synthesized the various speed management
techniques used in U.S. and other countries. The survey
results showed that speed enforcement is the best way to
control the speed of vehicles in towns along rural roads,
followed by the installation of traffic signals in transition
zones.
6 Stuster and
Coffman (1998)
USA The report concluded that more research related to traffic
calming should be conducted to determine the impact of these
countermeasures on the speed of the vehicles.
7 Torbic et al.
(2012)
USA Roundabouts and traverse pavement markings increases the
speed compliance of vehicles by 11 to 20 percentages at the
end of a transition zone.
8 Houten and
Huten (1987)
Dartmouth,
Canada
The research results showed that introducing a sign that
stated ‘Begin Slowing Here’ reduced the number of speeding
vehicles travelling in the transition zones.
9 Forbes (2011) U.S. and
Canada
The report found that the majority of the state DOTs did not
have standard approaches for treating high-to-low speed
limits in transition zones.
10 Lamberti et al.
(2009)
Ontario,
Canada
The simulation experiment showed that the road treatments
significantly reduced the speed of the vehicles by 7 to 11
mph.
11 U.K.
Department for
Transport (2005)
United
Kingdom
The study found that a new version of the transverse rumble
strip is an effective traffic calming device that can be used in
transition zones. Results showed that this strip reduced the
mean speed and 85th percentile of traffic speed by 1% to 6%.
12 Russell and
Godavarthy
(2010)
Kansas,
USA
The study was conducted to determine the effectiveness of
four different speed management techniques on rural roads.
The measures used were colored pavement, solar speed
displays, a mobile speed trailer, and optical speed bars. The
study results showed that the mobile speed trailer was the
most effective measure to reduce the mean speed and 85th
percentile speed of the vehicles.
24
Guidelines for Establishing Speed Zones
The objective of speed zoning, as stated in the Uniform Vehicle Code, is to fix the
speed limit that is “reasonable and safe for a given section of roadway.” According to a
survey by the Institute of Transportation Engineering (1993), there are inconsistencies in
speed zoning provided by various agencies in counties and municipalities as well as state
DOTs. The inconsistencies were related to the location of speed zones, posted speed
limits in zones, and enforcement tolerance. The report emphasized that speed zones only
are established on the basis of an engineering study. The posted speed limit in speed
zoning should be 85th
percentile speed. Each speed zone should be restudied within five
years to determine the appropriate speed limit. While establishing the speed limit, it is
recommended that the nearest 5-mph increment to the 85th
percentile speed be set. The
engineering study also should take into account various factors, for example, geometric
design, roadside development, road and shoulder surface types, pedestrian and bicycle
activity, and crash history of the location. The government agency should coordinate
properly for the implementation of speed zones and the enforcement policies.
The Federal Highway Administration (FHWA) has developed an expert system to
determine the speed limits in speed zones (Srinivasan et al., 2006). This study reviewed
previous studies related to the impact of speed limit changes, the relationship between
site characteristics and operating speeds, enforcement, and methods to set speed limits.
The system is now available online as a USLIMITS2 (2013).
Various state Departments of Transportation have developed speed-zone guideline or
manuals to setup speed zones in particular stretch of arterial roads. The summary of
guidelines and manuals of Florida, Oregon, Massachusetts, Texas, Wyoming, Wisconsin,
25
North Carolina, Montana, Missouri, Louisiana, Kentucky, Idaho, Georgia, Arizona, and
California are presented in this section.
NHTSA Highway Speed Management Guidelines No. 19
The NHTSA (2006) published the Highway Safety Program Guideline No. 19
regarding speed management. This guideline describes the necessity of speed
management and the various engineering countermeasures; communication strategies;
enforcement countermeasures; and legislation, regulations, and policies to reduce the
speed of vehicles. The guideline emphasizes compliance with the FHWA (2012) Manual
on Uniform Traffic Control Devices (MUTCD) to establish speed limits, train traffic
engineers related to speed management, and apply appropriate traffic-calming techniques
for reducing speed in pedestrian areas. This report also stressed communication strategies
to let drivers and road users know the consequences of speeding traffic. It also discussed
the importance of enforcement measures in managing the speed of the vehicles. Finally,
the report demanded that effective public policies be developed to support speed
management strategies and countermeasures.
Florida DOT Speed-Zone Manual
In 2010, Florida Department of Transportation (FDOT) prepared a manual for Speed
Zoning for Highways, Roads, and Streets in Florida. This manual is used by the state
traffic engineering and operations office, district traffic operations offices, Florida
counties, and municipalities. The intent of this manual is to improve traffic safety by
26
establishing standard speed limits on various types of roads. This manual explains in
detail the principles, philosophies, and procedures of realistic speed zoning.
Florida has a statute for allowable speed limits on various types of roads. For
example, 65 mph is the limit for highways outside an urban area of 5,000 or more persons
and having at least four lanes divided by a median strip. For county roads, the limit is 60
mph. If any alterations of speed should be done in any section of the road, Florida
Statutes require an engineering and traffic investigation to be conducted. Basic
investigations should be conducted to determine the 85th
percentile speed, upper limit of
10 mph pace, and average test run speed.
The manual recommended measuring the speed of vehicles during traffic
investigations by conducting a spot speed check. The spot speed should be checked in
such a way that drivers will not realize that their speeds are being monitored. Otherwise,
distorted data will be collected, and the speed data analysis will be unrealistic.
This manual also highlighted the importance of the location and timing of the spot
speed check during traffic investigations, and suggested the sample size of the spot
speeds. The manual showed how to calculate the 85th
percentile speed and how to
determine the speed limit. It emphasized requiring speed reduction traffic signs in speed
zones in compliance with the MUTCD.
Finally, the manual recommended the use of variable speed limit (VSL) systems at
speed zones. VSL is a type of Intelligent Transportation System that utilizes real-time
traffic speed and volume detection, weather information, crash, and congestion, and road
surface conditions in order to determine the appropriate safety driving speed. The manual
recommended that the traffic engineering study should determine the length of graduated
27
speed zones. The manual stressed uniform speed zoning and enforcement throughout the
State of Florida.
Oregon DOT Speed-Zone Manual
The Speed-Zone Manual prepared by Oregon Department of Transportation (ODOT,
2011) identifies practices that should be followed for completing speed zones in Oregon.
The manual stresses setting an appropriate balance between travel time and risk for the
specific highway section. The manual specifically mentions that speed zoning must be set
based on an engineering study, required by the statute. The speed limit should be changed
if there is road construction, if there is a change in roadside development, or significant
changes in traffic volumes.
The engineering studies to be conducted are statistical analyses of
The speed distribution of free flowing vehicles;
Change in roadway geometric features;
Pedestrians and bicycle movements; and
Types and density of adjacent land use, enforcement, crash history, public
testimony, traffic volumes, and number of access points.
The manual emphasizes that speed zones should not be treated as a tool to warn
motorists of hazardous conditions. It also requires that enforcement of speed limits within
the speed zones should be uniform. This manual gives a step-by-step process of when and
how to set the speed zones.
28
Massachusetts DOT Speed-Zone Manual
In 2005, the Massachusetts Highway Department (MassDOT) developed Procedures
for Speed Zoning on State and Municipal Roadways. The manual states that “speed limit
shall be established only after engineering and traffic investigation has been conducted in
compliance with established traffic engineering practices” (MassDOT, 2005). One of the
prerequisites for establishing a speed zone is that a comprehensive engineering study at
that location should be conducted. This is necessary to determine a safe speed limit that is
reasonable for motorists as well as for enforcing officers.
The guide identified the 85th
percentile speed of vehicles as the national standard for
establishing safe speed limits. In the engineering study, the data of speed of vehicles,
conditions of roads, crash records, etc., must be collected before establishing the speed
zones. The manual also stated that in rural highways, the minimum length of speed zone
should be one-half mile, when possible. It also recommended that speed limit signs be
provided in speed zones. Finally, the manual stated that every speed-zone regulation
should be approved by the Chief Deputy Registrar for the Register of Motor Vehicles and
the State Traffic Engineer for Massachusetts Highways.
Texas DOT Speed-Zone Manual
The Texas Department of Transportation (TXDOT) also has developed a manual for
establishing speed zones (TXDOT, 2011) titled Procedures for Establishing Speed Zones.
This manual has a comprehensive set of guidelines for TXDOT traffic engineers to
follow when establishing speed zones. The manual consists of various traffic engineering
studies that have been conducted as an aid to help deciding on speed zones, the speed-
29
zone approval process, and application of advisory speeds. The manual has the following
procedures that should be followed to set speed limits for Texas highways.
Speed limits on all roadways should be based on 85th
percentile of the speed.
The posted speed limit should be based on the 85th
percentile speed; even the
inferred design speed is lower than the resulting posted speed limit.
Setting arbitrarily lower speed limits is not good engineering practice.
The appropriate warning signs should be posted if a section of road has a posted
speed limit in excess of the roadways’ inferred design speed.
New roads should be designed to accommodate the highest anticipated posted
speed limit, based on the roadways’ initial or ultimate function.
Wyoming DOT Speed-Zone Manual
To determine appropriate speed limit, the Wyoming DOT’s Traffic Studies Manual
(WYDOT, 2011) recommended the use of the FHWA (2012) MUTCD as well as a web-
based tool developed by FHWA as part of National Cooperative Highway Research
Program Project 3-67. WYDOT’s traffic studies manual provides a separate section for
determining the advisory speed for curves. The manual describes the two methods to
determine the advisory speed for curves: the design speed method and the ball-bank
indicator method. The ball banking method can be used for older roads without design
detail; for newer roads with design details, the design speed equation can be used. Design
speed method can be calculated if the curve radius, super-elevation, and side friction
factor are known. For the ball-banking method, field experiments still have to be
conducted. The manual also provides a method to determine advisory speeds for truck.
30
Wisconsin DOT Speed-Zone Manual
Wisconsin DOT’s Traffic Guidelines Manual (2009) provides detailed information
regarding setting up speed zones. The manual defines speed zone as “a section of street or
highway where speed limit different than the statutory speed limit has been established.”
Wisconsin DOT conducts the speed studies to setup speed zones based on residents’
complaints or number of crashes. The factors taken under consideration in setting up
speed zones are:
Speed parameters: 85th
percentile speed, mean speed
Crash record
Road’s geometrics (lane widths, curves, roadside hazards, sight distances etc.)
Density and roadside development in terms of the number of driveways and
access points where vehicles
Shoulder widths and roadway and shoulder conditions
Conflicts with parking practices, and pedestrian and bicycle activity.
Current level of enforcement
The manual recommended providing speed limits at increments of 10 mph rather than
5 mph. However, it does allow the use of speed limits at an increment of 5mph when
justified. It recommends at minimum of a 0.3-miles-long speed zone. The
transitional/step-down speed zones cannot be used unless there is a change in the physical
characteristics of the roadway. Even if transitional speed zones are used, there should not
be more than two step-downs. The speed limits of those step-downs should be based on
the 85th
percentile speed.
31
The manual recommended measuring the spot speed of at least 15 vehicles during
light to medium traffic conditions, instead of during rush hours in each direction. The
spot speed should not be measured in intersections. If the speed test resulted in new speed
limit, all the documents related to speed studies should be submitted to the department for
approval. The manual also provides guidelines for setting up speed zones in schools
zones and in intersections.
North Carolina DOT Speed-Zone Guidelines
The North Carolina Guidelines for the Establishment of Restrictive Speed Limits
(1995) recommended conducting a traffic study to setup a speed limit in rural highways
other than speed limit provided by the statutes. The following factors should be
considered while setting up speed limit:
85th
percentile speed
Roadway characteristics including roadway surface characteristics and shoulder
characteristics
Alignment of roadway
Roadside development
Intersections
The manual recommended providing the speed limit of 35 mph or less in a road if the
roadside development is at least 75%. The manual also recommended providing the
speed limit of 35 mph or less in soil or gravel roads.
The manual does not allow establishing a school zone in interstate and controlled
access highways. Along other highways, school zone will be allowed if the school
32
property abuts the highways. The maximum suggested length of school speed zone is 500
ft upstream and downstream of the school. The speed limit in the school-zone can be up
to 10 mph less than the 85th
percentile speed. However, it should not be less than 25 mph
in any case.
Montana DOT Speed-Zone Manual
The Montana Traffic Engineering Manual (2007) includes a stepwise process for
setting up speed limits in their highways. The steps to set up the speed limit are:
Request for speed study
Meet with local officials
Local concurrence to conduct speed study
Determine study parameters
Collection of data
Analyze data
Disseminate study results
Review and comment on study
Presentation to Montana transportation commission
Implementation of special speed zone
The manual has identified some primary factors to be considered while setting up
speed limit: 85th
percentile speed, pace, speed profile, and Montana. Factors such as,
development, transition zones, adjacent sections, crashes/hazardous conditions, highway
geometrics, pedestrian/school/senior centers, parking, traffic mix, and seasonal factors
33
should be considered while setting up speed limits in highways. They provided detailed
explanation for conducting traffic studies. The manual recommended collecting spot
speed data of at least 100 vehicles in each direction during traffic study.
Missouri DOT Speed-Zone Guideline
The Missouri Speed Limit Guidelines (2010) recommended setting up at least 2-mile
long speed zones for unincorporated or “non-community” areas. The guidelines consist of
a procedure for conducting traffic study. During traffic study, the 85th
percentile speed,
upper limit of the 10 mph pace, or average test run speed data is collected to determine
the speed limits of speed zones. The guidelines recommended selecting speed limits in 5
mph increment; however the speed limit cannot be more than 3 mph of the prevailing
speed. In an average test run method, at least two runs in each direction of highways
should be conducted and speeds are to be recorded at 0.1 miles interval.
The guidelines mentioned that traffic-engineers have discretion to reduce the speed
limits derived from the traffic study in any speed zones based on some factors. Table 7
lists those factors, corresponding speed reduction methods.
The spot speed of vehicles should be measured as close to the center of the speed
zone as possible. If the speed-zone length is more than a mile, at least two spots should
be chosen for spot speed measurement. If the difference between these two measured
speeds is less than 5 mph, then minimum value should be selected or two speed zones
with two different speed limits can be provided.
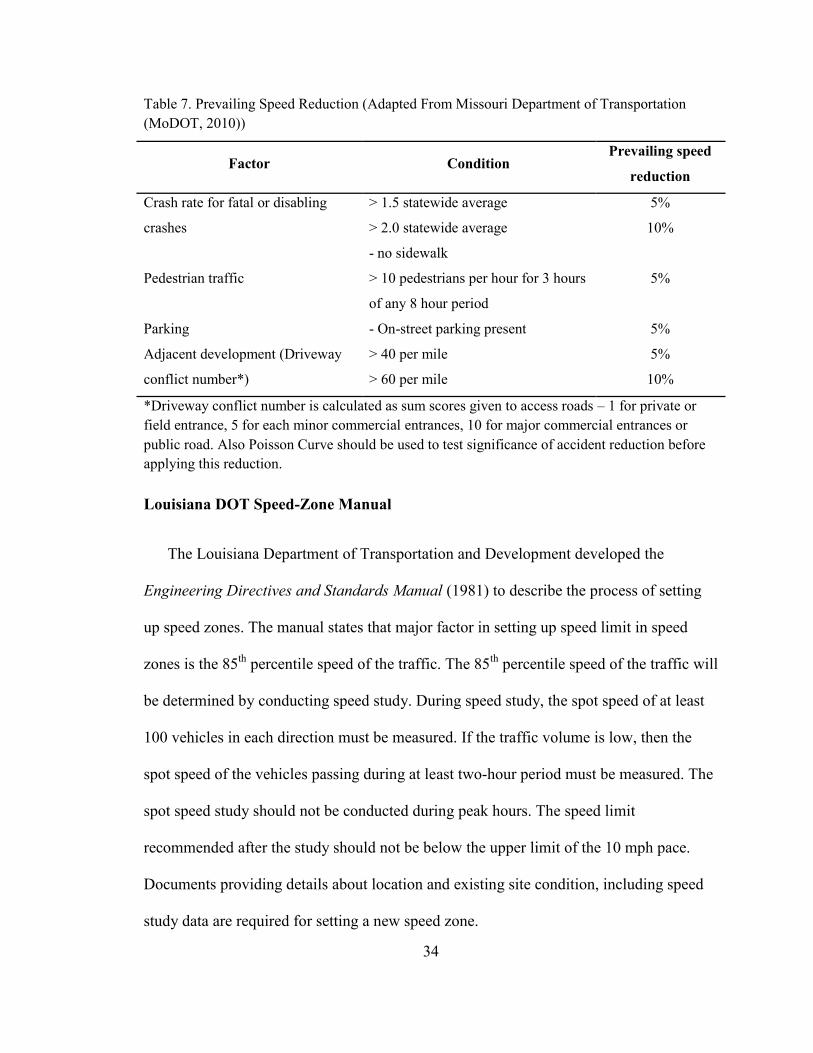
34
Table 7. Prevailing Speed Reduction (Adapted From Missouri Department of Transportation
(MoDOT, 2010))
Factor Condition Prevailing speed
reduction
Crash rate for fatal or disabling
crashes
> 1.5 statewide average 5%
> 2.0 statewide average 10%
Pedestrian traffic
- no sidewalk
> 10 pedestrians per hour for 3 hours
of any 8 hour period
5%
Parking - On-street parking present 5%
Adjacent development (Driveway
conflict number*)
> 40 per mile 5%
> 60 per mile 10%
*Driveway conflict number is calculated as sum scores given to access roads – 1 for private or
field entrance, 5 for each minor commercial entrances, 10 for major commercial entrances or
public road. Also Poisson Curve should be used to test significance of accident reduction before
applying this reduction.
Louisiana DOT Speed-Zone Manual
The Louisiana Department of Transportation and Development developed the
Engineering Directives and Standards Manual (1981) to describe the process of setting
up speed zones. The manual states that major factor in setting up speed limit in speed
zones is the 85th
percentile speed of the traffic. The 85th
percentile speed of the traffic will
be determined by conducting speed study. During speed study, the spot speed of at least
100 vehicles in each direction must be measured. If the traffic volume is low, then the
spot speed of the vehicles passing during at least two-hour period must be measured. The
spot speed study should not be conducted during peak hours. The speed limit
recommended after the study should not be below the upper limit of the 10 mph pace.
Documents providing details about location and existing site condition, including speed
study data are required for setting a new speed zone.
35
The manual recommended in providing minimum length of a speed zone as 1,000 ft
for 25 mph and 30 mph speed limit. For a 50 mph speed limit, the recommended
minimum length of speed zone is 2,500 ft. The manual recommended up to six speed
changes per mile while setting up transition zones. The interval of speed changes should
be less than 10 mph.
It also states that traffic engineers can consider some of the following factors
while setting up the speed limit.
Road surface characteristics, shoulder condition, grade alignment and sight
distance
50th percentile speed and the pace speed
Roadside development and road surface friction
Safe speed for curves or hazardous locations within the zone
Parking practices and pedestrian activity
Other factors that can be considered include traffic volumes, crash history of last
year, and traffic control devices.
Kentucky DOT Speed-Zone Manual
The Kentucky Traffic Operation Guidance Manual (2012) recommended conducting
engineering study in accordance with the Manual on Uniform Traffic Control Devices to
setup speed zones. The 85th
percentile speed of vehicles, crash history, and location of
speed zone are required data for setting up speed zones. The speed limit should be
reasonable, adequate, and appropriate and should be reviewed regularly by the district.
The manual states that advisory speed warning signs should be provided in road
36
intersections and in turning roads, instead of speed zones. Normal transitions, as
mentioned in the manual are 55 mph to 45 mph and 35 mph to 25 mph.
The manual recommended reducing 10 mph speed in school zones from normal
posted speed limit. Generally, the speed limits in school zones should not be less than 25
mph nor more than 45 mph. However, lower speed limits can be provided based on
factors like sight distance, roadway conditions, and crash history of the road.
Idaho Transportation Department Speed-Zone Guidelines
Speed Limits and Speed Zones: A Guide to Establishing Speed Zones in Idaho (ITD,
1997) presents concepts and methods that have been based on over 40 years of
engineering experience and observations. Speed zones are not the solution to all traffic
problems nor will it be effective without enforcement and education. These guidelines
point out that the speed limit should be set so that most of the drivers follow it
voluntarily. In turn, this eliminates the need for heavy law enforcement. According to the
manual, in general, such factors as accident rates or geometric features do not need to be
considered separately or in combination with other data because the effect of all those
factors are already reflected in the 85th
percentile speed. Also an upper limit of a 10-mph
pace might be a better alternative to 85th
percentile speed when the 10-mph pace contains
a high percentage of vehicles and the 85th
percentile speed appears inappropriately high.
The manual emphasizes uniformity and consistency of the speed limit throughout the
state so that it is easy to support and defend speed zoning to local officials, the courts, or
the public when revisions or changes are requested. The manual follows the MUTCD for
the factors to be considered in engineering studies to set speed limits. These factors are:
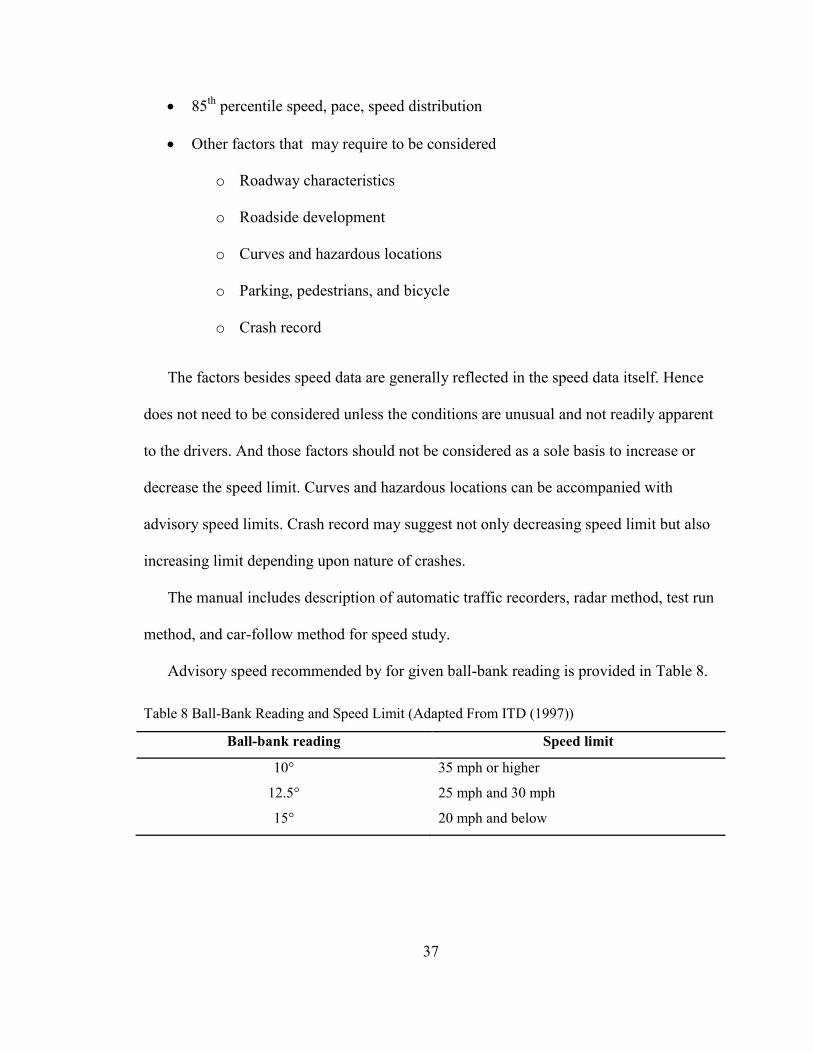
37
85th
percentile speed, pace, speed distribution
Other factors that may require to be considered
o Roadway characteristics
o Roadside development
o Curves and hazardous locations
o Parking, pedestrians, and bicycle
o Crash record
The factors besides speed data are generally reflected in the speed data itself. Hence
does not need to be considered unless the conditions are unusual and not readily apparent
to the drivers. And those factors should not be considered as a sole basis to increase or
decrease the speed limit. Curves and hazardous locations can be accompanied with
advisory speed limits. Crash record may suggest not only decreasing speed limit but also
increasing limit depending upon nature of crashes.
The manual includes description of automatic traffic recorders, radar method, test run
method, and car-follow method for speed study.
Advisory speed recommended by for given ball-bank reading is provided in Table 8.
Table 8 Ball-Bank Reading and Speed Limit (Adapted From ITD (1997))
Ball-bank reading Speed limit
10° 35 mph or higher
12.5° 25 mph and 30 mph
15° 20 mph and below
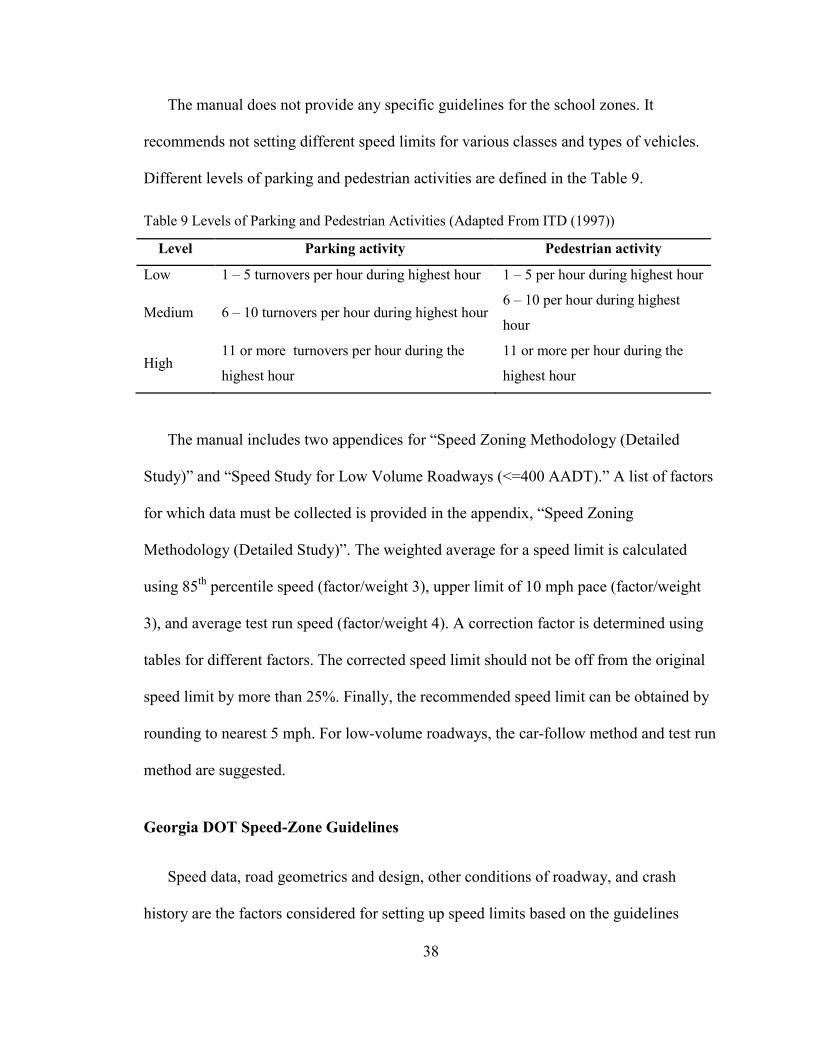
38
The manual does not provide any specific guidelines for the school zones. It
recommends not setting different speed limits for various classes and types of vehicles.
Different levels of parking and pedestrian activities are defined in the Table 9.
Table 9 Levels of Parking and Pedestrian Activities (Adapted From ITD (1997))
Level Parking activity Pedestrian activity
Low 1 – 5 turnovers per hour during highest hour 1 – 5 per hour during highest hour
Medium 6 – 10 turnovers per hour during highest hour 6 – 10 per hour during highest
hour
High 11 or more turnovers per hour during the
highest hour
11 or more per hour during the
highest hour
The manual includes two appendices for “Speed Zoning Methodology (Detailed
Study)” and “Speed Study for Low Volume Roadways (<=400 AADT).” A list of factors
for which data must be collected is provided in the appendix, “Speed Zoning
Methodology (Detailed Study)”. The weighted average for a speed limit is calculated
using 85th
percentile speed (factor/weight 3), upper limit of 10 mph pace (factor/weight
3), and average test run speed (factor/weight 4). A correction factor is determined using
tables for different factors. The corrected speed limit should not be off from the original
speed limit by more than 25%. Finally, the recommended speed limit can be obtained by
rounding to nearest 5 mph. For low-volume roadways, the car-follow method and test run
method are suggested.
Georgia DOT Speed-Zone Guidelines
Speed data, road geometrics and design, other conditions of roadway, and crash
history are the factors considered for setting up speed limits based on the guidelines
39
prepared by Georgia Department of Transportation (2012). The speed determined using
those factors is finally confirmed by test driving. The manual does not allow a speed limit
below 25 mph in state routes. For state highway segments, the minimum allowed speed
limit is 35 mph. The manual does not provide specific details about how the speed limit is
calculated and how the factors affecting the speed limits are taken into account.
For school zones, there should be multiple grades and enrollment of over 250 students
and staff. A change in speed limit is not allowed within a school zone. The speed limit
should not be reduced at the same mile point as the beginning of school zone. Also, a
speed zone change should occur at least 0.02 miles farther from school zone to allow
sufficient spacing between the school zone and the speed limit sign.
Arizona DOT Speed-Zone Guidelines
The Arizona Department of Transportation’s Traffic Engineering Policies,
Guidelines, and Procedures (2000) points out the need of setting speed limits that the
drivers will consider prudent and reasonably safe. It recommends not setting
unreasonable speeds based on design speed. Several factors are required to be considered
along with the 85th
percentile in order to determine proper speed limits. Those factors are:
Length of section
Alignment
Roadway width and shoulders
Surface condition
Sight distance
Traffic volume
40
Accident experience
Maximum comfortable speed on curves
Side friction (roadside development)
Parking practices and pedestrian activity
Signal progression
For such locations as horizontal curves, warning signs with an advisory speed sign
may be used. For other locations where speed zones are deemed necessary, first speed
data are must collected. If electrical or mechanical devices are used for data collection,
then data has to be collected for 24 hours. In case of radar, if average daily traffic is less
than 2,000, a minimum of 50 vehicles in each direction has to be collected within a
maximum of two hours’ time limit. If the average daily traffic is at least 2000, a sample
of at least 100 per direction must be collected within a maximum time limit of two hours.
To establish a speed zone, the state traffic engineer has to submit speed regulations, a
transmittal memorandum, and the traffic engineering study to the appropriate regional
traffic engineer. If approved, then installation or confirmed dates will be entered into the
speed regulation database.
California DOT Speed-Zone Manual
The California Manual on Uniform Traffic Control Devices (2012) is FHWA’s
MUTCD 2009 Edition as amended for use in California. It has a few modifications
related to speed limits in Section 2B.13 Speed Limit Sign as compared to original one.
This manual emphasizes the need for engineering and traffic surveys instead of an
engineering study for setting a speed limit. Also, it provides support for the 85th
41
percentile as a basis of setting the speed limit, since setting speeds arbitrarily low will
result in more violators. According to the manual, the studies should be conducted at least
once every 5, 7 or 10 years for revising the speed limits. There was no fixed time period
mentioned in original manual for revising speed limit. Instead of setting a speed limit
within 5 mph of the 85th
percentile, the manual provides the option to reduce the posted
speed by 5 mph if justified or if the speed limit is obtained by rounding up the 85th
percentile speed.
The manual lists requirements of engineering and traffic survey as:
Speed study
Crash records
Highway, traffic, and roadside conditions not readily apparent to the driver
The manual also lists requirement of speed studies, some of which are as listed
below:
There should not be alteration of driver speed because of concentrated law
enforcement, or other reasons.
Spot speed location should be representative of driver speed for whole section. If
required multiple sections can be chosen for single section. The location of those
spot should be chosen so that there is minimum effect stop sign or traffic signals.
Study should be conducted off-peak hour on weekend.
Weather should be fair and usual.
Speed data of minimum of 50 vehicles is required.
Speed zone should be at least 0.5 miles except in transition areas.
42
Speed zoning should be in 10 mph increment for rural area. For urban area 5 mph
increment are preferable.
FHWA Manual on Uniform Traffic Control Devices (MUTCD)
The FHWA (2012) has prepared the MUTCD, which is approved as the National
Standard. It has a section (Section 2B.13) for speed limit signs, and gives some
information about the procedure to establish a speed zone. According to the manual, a
speed zone shall be established on the basis of an engineering study. The engineering
study shall include an analysis of speed distribution of the traffic. If the speed limit is
reduced by more than 10 mph, then a “Reduced Speed Limit Ahead” sign should be
posted to aware drivers. To reevaluate non-statutory speed limits, states and local
agencies should conduct engineering studies for any significant changes in number of
travel lanes, parking lanes, bicycle lanes, traffic control signal coordination, and traffic
volumes.
It recommends a speed limit within 5 mph of the 85th
percentile speed. For signalized
intersections, speed studies should be conducted at about ½ mile from the intersection to
avoid obtaining skewed results because of traffic control. Some of the factors that may be
considered for setting new speed limit or revising existing ones are:
Road characteristics, shoulder condition, grade, alignment, and sight distance
The pace
Roadside development and environment
Parking practices and pedestrian activity
Reported crash experience for at least a 12-month period
43
A changeable message sign displaying the speed limit or the speed of approaching
driver may be installed. A sign displaying the speed of the approaching driver should be
accompanied by the speed limit sign.
Recommended Practices of the Institute of Transportation Engineers (ITE)
In 1987, a taskforce was formed to develop guidelines in selecting segments of
highway where the national speed limit of 55 mph could be raised (ITE, 1987). The
proposal to upgrade the speed limit of a highway depended upon many factors; for
example, it would not be appropriate to allow a speed limit of more than 55 mph for those
interstate highways whose design speeds are lower in some segments. The task force
found that after the U.S. Congress enacted the 55-mph national maximum speed limit in
1974, the U.S. fatality rate dropped abruptly. Nonetheless, the sharp drop in fatalities also
was due to improvements in vehicle design, highway design, medical capability,
availability of emergency medical service, driver behavior, and other factors. However,
several factors relating to the 55-mph speed limit led to the reduced fatality rate. This
speed limit reduced the average driving speed and variations in speed, allowed more time
to understand and react to situations, and provided a long breaking distance.
Nevada Statutes Related to the Speed Limit
Nevada Revised Statutes includes three chapters, NRS-484 – Traffic laws (2011),
NRS-484A – Traffic laws generally (2013), and NRS-484B Rules of the road (2013),
related to traffic speed limits. However, all the contents in NRS 484 have been replaced
by NRS 484A and 484B. The purposes of those chapters are to “establish traffic laws
44
which are uniform throughout the state of Nevada” and to “minimize the difference
between the traffic laws of the State of Nevada and those of other states”. The statute
allows the Nevada Department of Transportation to prescribe and eliminate speed zones
after necessary studies have been made. It gives the Department of Transportation a right
to “establish the speed limits for motor vehicles on highways which are constructed and
maintained by the Department of Transportation.” The maximum speed allowed by
statute is 75 mph. The speed limit for school zone, as set by state statute, is 15 mph. For
the school crossing zone, the speed limit, as set by the statute, is 25 mph.
45
CHAPTER 3
RESEARCH METHODOLOGY
The study was divided into six phases as shown in Figure 2. During the first phase,
the scope and the objectives of the study were defined. In the second phase, various
literature were reviewed related to factors affecting speeds and crashes, crash data
analysis techniques, speed-zone guidelines, and speed reduction techniques. In the third
phase, crash data were collected from the NDOT. The research team visited the 11 towns
under study to collect the spot speed and road characteristics data of those towns. A
questionnaire survey was conducted to determine the best practices used by state DOTs
of the U.S. while setting up speed zones in towns along their rural highways. In the next
phase, the crash data, site data, and survey data that had been collected were analyzed.
Then the best practices for setting up speed zones were identified. Finally, conclusions
and recommendations were made for preparing the speed-zone guideline for towns along
rural highways of Nevada.
The crash data of towns obtained from the NDOT were analyzed to compare the
towns based on a number of factors, including injury crashes, injuries, average injuries
per non-fatal injury-causing crashes, and PDO crashes per year. Descriptive statistics
were used to analyze these crash data of the past nine years. The site spot speed data
collected were used to anlyze their correlations with the number of crashes occurred in
these towns. The Pearson correlation test was used to determine the correlations between
the spot speed parameters and the number of crashes. Ordinary least squares models were
developed to determine the percentage variations of crashes explained by these
parameters. Two statistical modeling techniques namely binary logit model, and
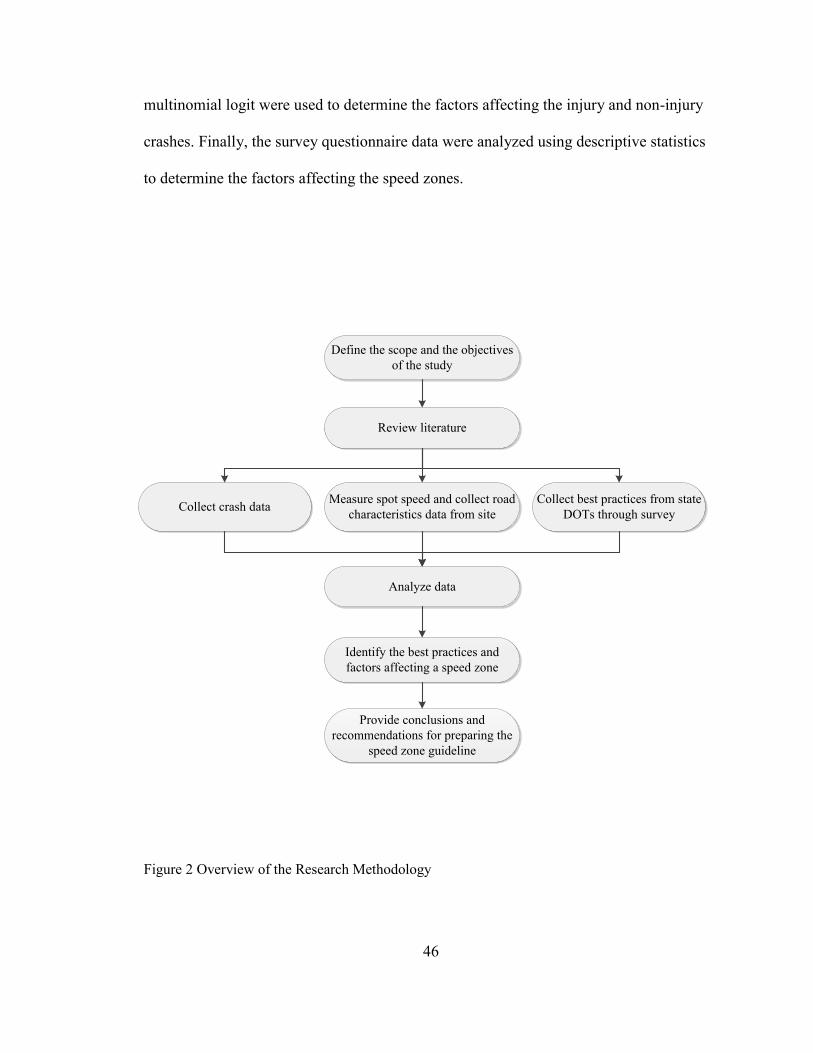
46
multinomial logit were used to determine the factors affecting the injury and non-injury
crashes. Finally, the survey questionnaire data were analyzed using descriptive statistics
to determine the factors affecting the speed zones.
Figure 2 Overview of the Research Methodology
Define the scope and the objectives
of the study
Review literature
Collect crash dataMeasure spot speed and collect road
characteristics data from site
Collect best practices from state
DOTs through survey
Analyze data
Identify the best practices and
factors affecting a speed zone
Provide conclusions and
recommendations for preparing the
speed zone guideline
47
Statistical Models
Rrdinary least squares models, binary logit models, and multinomial logit models
were developed for the study.
Ordinary Least Squares Model
The models based on the Ordinary Least Squares (OLS) regression were used to find
the correlations between speed variables and crash variables. Various speed parameters –
mean speed, median speed, and percentage of vehicles exceeding posted the speed limits
– were calculated from the spot-speed data collected in each town. Coefficients of
correlation (Pearson’s r) between the speed parameters and crash statistics were
calculated to measure the correlation among those variables. Pseudo R2 values also were
calculated to quantify the percentages of crash statistics as explained by each of those
speed parameters.
Binary Logit Model
For the binary logit models, response variable was the injury i.e. whether or not the
crash was injury crash. The predictor variables included factors such as, road conditions,
weather conditions, and road lighting. The models were used to find out the factors that
significantly affected the possibility of the crashes being injury crashes.
Multinomial Logit Model
For the models based on the multinomial logit model (MNL), the response variable
was crash severity with five outcomes: PDO, claimed, non-incapacitating, incapacitating,
48
and fatal. The models were developed to identify the factors that significantly affected the
crash severities.
Research Hypotheses
The research hypothesis related to Pearson correlations is the correlation coefficients
of the number of crashes to other speed variables are significantly different from zero.
For ordinary least squares models, the research hypothesis is that the coefficients of
predictor variables (speed parameters) are significantly different from zero. The research
hypothesis related to binary logit models and multinomial logit models is that the
coefficients of all the predictor variables (road conditions, weather, etc.) in the model are
significantly different from zero.
Null Hypotheses
For ordinary least squares models, the null hypothesis states that the coefficients of
independent variables (speed parameters) are equal to zero. Similarly for binary and
multinomial logit models, the null hypothesis states that all the coefficients of predictor
variables are equal to zero. Mathematically they can be expressed as
β1 = β2 = β2 = β2 ……………. = βn = 0
Where β1, β2, ……………., βn are the coefficients of the independent predictor
variables.
49
Limitations
The towns were selected based on the complaints about the higher number of crashes.
Thus the results of the analysis are applicable only to the towns under study and cannot
be generalized.
While developing ordinary least squares models, the spot speed data collected in 2012
was correlated with the historical crash statistics (2002-2010) to determine the
association between the number of crashes and speed parameters. The assumptions made
in this analysis are that the drivers’ behavior of the vehicles passing through the towns
under study has not changed significantly nor have the roadways and roadside
characteristics. The crash data of Schurz were obtained from US 95 and US 95A while
the speed data were collected only from US 95. Also, for Tonopah, the crash data were
obtained from US 95 and US 6 while the speed data were collected only from US 6. The
sample sizes of the data was very small (11), which could result in a poor statistical
analysis. The pseudo R2 parameter was used instead of R
2 to account for the error that
can be caused by a very small sample size. Use of data from more towns would produce
more accurate statistical analysis and results. All the predictor variables considered for
developing binary logit and MNL regressions may not have causal effect.
The crash data of the towns used for comparison purpose consist of the crashes that
occurred only in the vicinity of the towns in one or two highways, whereas crash data
from all the rural areas of Nevada include the crashes that occurred in all the rural areas
of Nevada.
50
CHAPTER 4
DATA COLLECTION
Three sets of data were collected for the analysis: the historical crash data were
obtained from the NDOT; spot speed and site characteristics data were collected from
field visit; and questionnaire data were collected from the survey. The details of data
collection processes for each set of data are described below.
Crash Data
In order to analyze the crash data, the 11 towns along rural highways of Nevada were
identified by NDOT TAP. The towns under study were Alamo, Austin, Beatty, Fernley,
Goldfield, Luning, McGill, Panaca, Schurz, Tonopah, and Searchlight. The residents of
these towns complained to NDOT that high number of crashes occurred in these towns.
Crash data from April 1, 2001 to April 10, 2011 were obtained from the NCATS, a
system used by NDOT. However, data from only 9 calendar years from 2002 to 2010
were analyzed to identify the factors associated with the crashes.
The data obtained from NDOT contained a total of 38 variables, out of which 16
variables were independent variables. It should be noted that some data for these
variables were not recorded for a number of crashes. Also, some variables were not
applicable to all the crashes. For example, variables related to the secondary vehicle, such
as, ‘Secondary Vehicle Type’ and ‘Secondary Vehicle Action’ were not applicable to
crashes involving only one vehicle. Also, such variables as ‘Factors Non-motor’ was
recorded for a very few crashes. Thus, those variables that have very limited data set
were not used in the analysis.
51
Site Data
For all the 11 towns under the study, spot speeds, road-surface characteristics, and
roadside characteristics for the section of highways were collected. A guideline provided
by NDOT was followed for spot speed data collection. A radar gun was used to collect
speed data. A simple measuring wheel was used to measure distances of various points
along the highways. Spot speed data were collected separately for cars, trucks, and buses
in each direction. Two locations were selected to collect spot speed data in Fernley,
Searchlight, and Tonopah. In remaining towns, only one location was chosen for each
town. Multiple locations were chosen so that the angle between line of sight of the radar
and travel direction of the vehicles is less than 15°. Those spot speed data were combined
for analysis. Different statistical parameters – 85th
percentile speed, mean speed, median
speed, and percentage exceeding posted speed – were calculated from the speed data.
Location of Data Collection
For each town, various roadway and roadside characteristics were collected. Some of
the site data collected included step down speed limits, school-zone speed limits, the
overall roadside development environment, the presence of schools, the presence of
pedestrian facilities, the type of median separator, weather conditions, the number of
lanes, and lane widths. The forms used to collect site data are presented in appendix:
SITE DATA COLLECTION FORMS. Speed-zone maps were drawn for all the sites
using the collected data and Google Maps. The details of the location of each towns are
presented in Table 10.
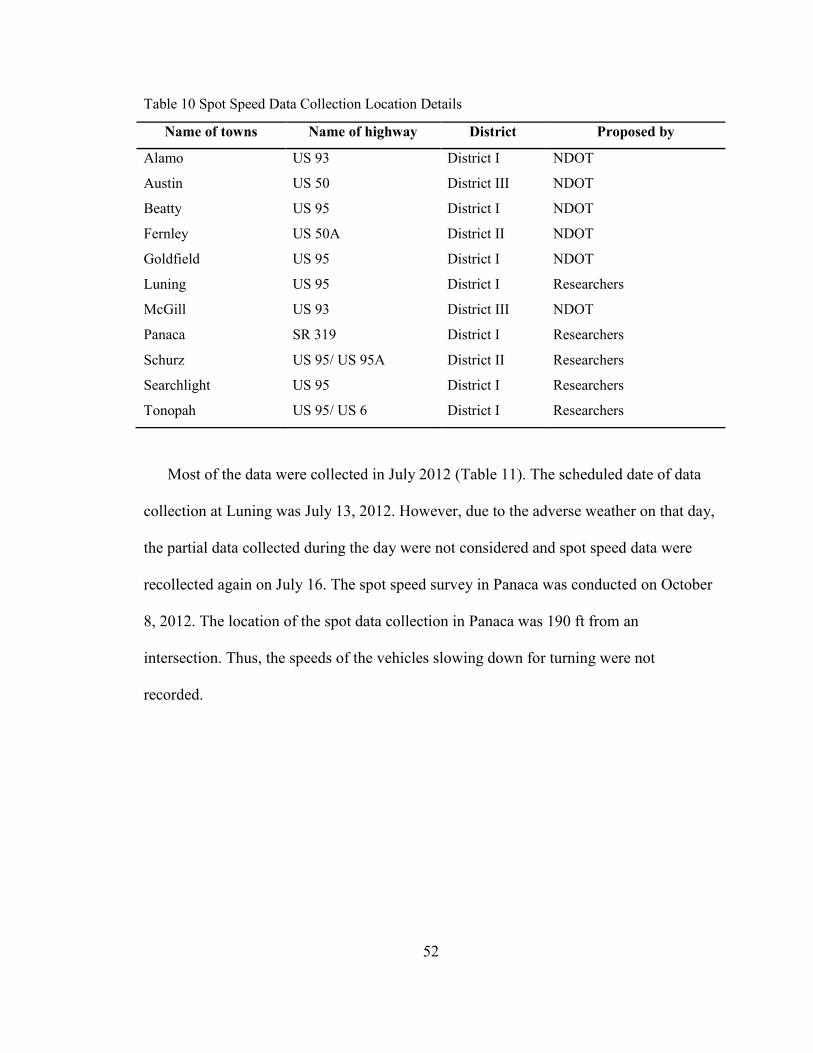
52
Table 10 Spot Speed Data Collection Location Details
Name of towns Name of highway District Proposed by
Alamo US 93 District I NDOT
Austin US 50 District III NDOT
Beatty US 95 District I NDOT
Fernley US 50A District II NDOT
Goldfield US 95 District I NDOT
Luning US 95 District I Researchers
McGill US 93 District III NDOT
Panaca SR 319 District I Researchers
Schurz US 95/ US 95A District II Researchers
Searchlight US 95 District I Researchers
Tonopah US 95/ US 6 District I Researchers
Most of the data were collected in July 2012 (Table 11). The scheduled date of data
collection at Luning was July 13, 2012. However, due to the adverse weather on that day,
the partial data collected during the day were not considered and spot speed data were
recollected again on July 16. The spot speed survey in Panaca was conducted on October
8, 2012. The location of the spot data collection in Panaca was 190 ft from an
intersection. Thus, the speeds of the vehicles slowing down for turning were not
recorded.
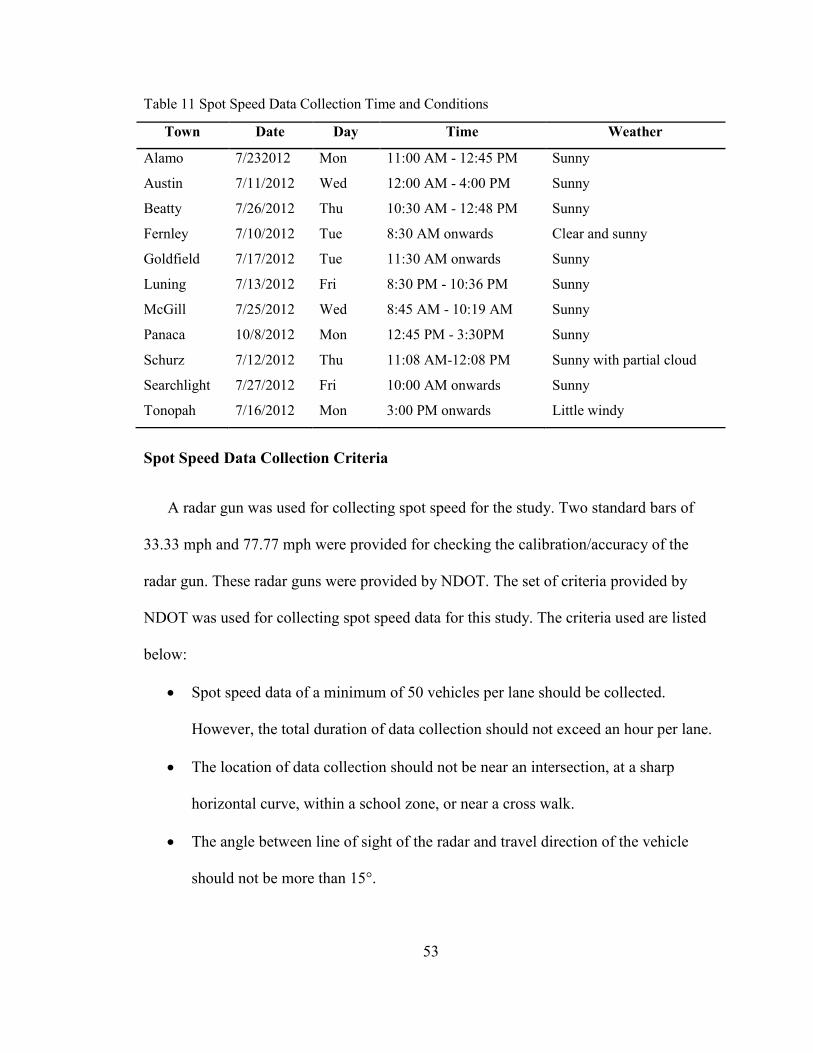
53
Table 11 Spot Speed Data Collection Time and Conditions
Town Date Day Time Weather
Alamo 7/232012 Mon 11:00 AM - 12:45 PM Sunny
Austin 7/11/2012 Wed 12:00 AM - 4:00 PM Sunny
Beatty 7/26/2012 Thu 10:30 AM - 12:48 PM Sunny
Fernley 7/10/2012 Tue 8:30 AM onwards Clear and sunny
Goldfield 7/17/2012 Tue 11:30 AM onwards Sunny
Luning 7/13/2012 Fri 8:30 PM - 10:36 PM Sunny
McGill 7/25/2012 Wed 8:45 AM - 10:19 AM Sunny
Panaca 10/8/2012 Mon 12:45 PM - 3:30PM Sunny
Schurz 7/12/2012 Thu 11:08 AM-12:08 PM Sunny with partial cloud
Searchlight 7/27/2012 Fri 10:00 AM onwards Sunny
Tonopah 7/16/2012 Mon 3:00 PM onwards Little windy
Spot Speed Data Collection Criteria
A radar gun was used for collecting spot speed for the study. Two standard bars of
33.33 mph and 77.77 mph were provided for checking the calibration/accuracy of the
radar gun. These radar guns were provided by NDOT. The set of criteria provided by
NDOT was used for collecting spot speed data for this study. The criteria used are listed
below:
Spot speed data of a minimum of 50 vehicles per lane should be collected.
However, the total duration of data collection should not exceed an hour per lane.
The location of data collection should not be near an intersection, at a sharp
horizontal curve, within a school zone, or near a cross walk.
The angle between line of sight of the radar and travel direction of the vehicle
should not be more than 15°.
54
Every effort should be made to conceal the fact that speeds of the vehicles are
being recorded. Speeds should be measured from an anonymously parked car so
that drivers do not change their speed.
The spot speed survey should be conducted on the weekdays from 8:00 AM to
5:00 PM.
The survey should be conducted in favorable driving conditions. The spot speed
data should not be collected during strong wind, snow, road maintenance, and
other unfavorable driving conditions.
Questionnaire Survey Data
Speed-zone guidelines and/or speed-zone manuals of various states were reviewed in
order to collect various approaches used by the state DOTs. To determine the recent best
practices for providing speed zones, a questionnaire was prepared and sent to NDOT for
feedback. After the feedback the questionnaire was sent to state DOT representatives.
The questionnaire contained six different sections:
General information
Rural state highways and crash data
Speed-zone legislature
Speed-zone guidelines or manuals
Traffic engineer’s personal view
Issues of local communities
55
The first section of the survey contained questions regarding contact information of
the state DOT representatives who responded to the questionnaire. The information
collected in this section was not used for any analysis. The second section included seven
questions related to the total mileage of highways and crash statistics of the state. The
information collected in this section was used to compare crash statistics of different
states. The third and fourth sections were focused on collecting information about current
speed-zone manuals and legislation related to speed zones in various states. Personal
views of traffic personnel were collected in the fifth section. This section collects the
opinions of traffic personnel that might be different from those stated in their manuals.
The last section contained questions about the current scenario of the community
complaints regarding speed zones in their states.
The questionnaire was prepared and sent as a document file. The reason for using a
document attachment instead of a standard online survey system was to allow multiple
persons in each DOT to fill in different sections of the questionnaire. Also, this allowed
each DOT to stop and continue the questionnaire at any time, as compared to online
surveys. The full questionnaire can be found in the appendix: QUESTIONNAIRE
SURVEY FORM.
All the state DOTs of the U.S., except Nevada, were contacted for collecting
responses to the survey questionnaire. E-mail and phone calls were used for
communicating with state DOT representatives starting from first week of May to second
week of October, 2012. After continuous follow-ups, survey questionnaire responses
were received from 37 states.
56
CHAPTER 5
RESULTS
The results of the study are subdivided into three categories: crash data results, site
data results, and survey questionnaire results.
In crash data results, the descriptive statistics as well as results of the crash severity
analysis models are presented. Descriptive statistics include the distributions of crashes
by town and based on different factors associated with the crashes. Crash data of 11
towns combined were compared with that of all rural areas of Nevada. In crash severity
prediction models, severity of crashes as well as odds that crashes would involve injury
were calculated.
In site data results, the correlations of the crash data and speed data are presented. It
also include the characteristics of the speed zones, roadway, and roadside environment of
the highways of the 11 towns under study.
Finally, in the survey questionnaire results, the descriptive statistics of the responses
are presented. Average ratings as well as response counts for different factors related to
the crashes, speed zones, enforcements etc. have been calculated and presented.
Crash Data Results
Crash records of 11 towns from 2002 to 2010 were collected and analyzed. Overall
statistics of the study are shown in Table 12. This table indicates that there were a total of
3 fatal crashes in all those towns, combined. That means, on an average, one fatal crash
occurred in each of the three years (= 9/3) in those towns. There was total 4 fatality in
these towns that results in one fatality in every two and a quarter years (=9/4). There were
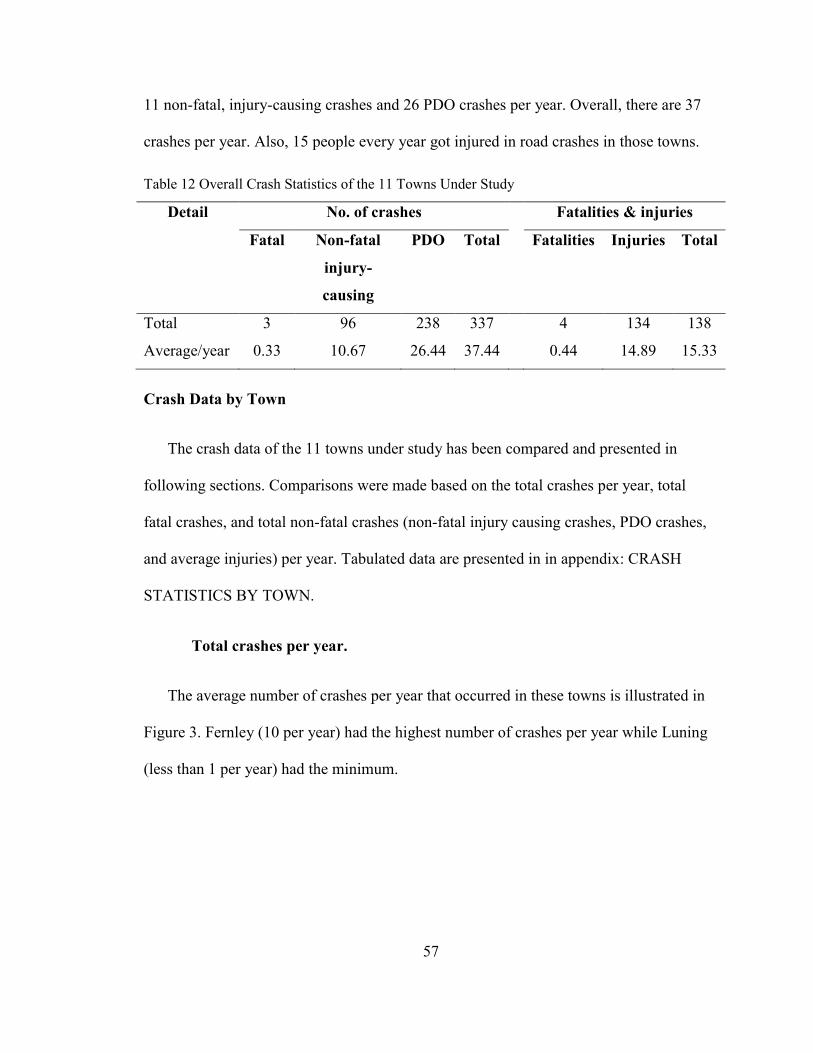
57
11 non-fatal, injury-causing crashes and 26 PDO crashes per year. Overall, there are 37
crashes per year. Also, 15 people every year got injured in road crashes in those towns.
Table 12 Overall Crash Statistics of the 11 Towns Under Study
Detail No. of crashes Fatalities & injuries
Fatal Non-fatal
injury-
causing
PDO Total Fatalities Injuries Total
Total 3 96 238 337 4 134 138
Average/year 0.33 10.67 26.44 37.44 0.44 14.89 15.33
Crash Data by Town
The crash data of the 11 towns under study has been compared and presented in
following sections. Comparisons were made based on the total crashes per year, total
fatal crashes, and total non-fatal crashes (non-fatal injury causing crashes, PDO crashes,
and average injuries) per year. Tabulated data are presented in in appendix: CRASH
STATISTICS BY TOWN.
Total crashes per year.
The average number of crashes per year that occurred in these towns is illustrated in
Figure 3. Fernley (10 per year) had the highest number of crashes per year while Luning
(less than 1 per year) had the minimum.
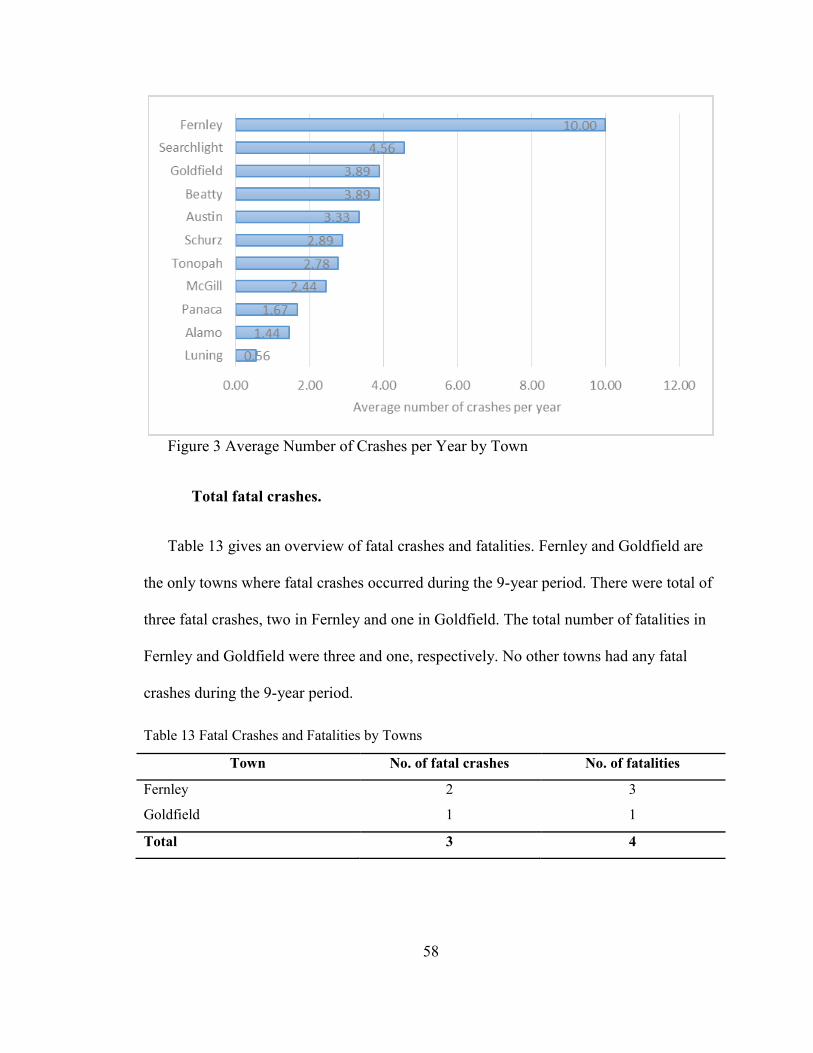
58
Figure 3 Average Number of Crashes per Year by Town
Total fatal crashes.
Table 13 gives an overview of fatal crashes and fatalities. Fernley and Goldfield are
the only towns where fatal crashes occurred during the 9-year period. There were total of
three fatal crashes, two in Fernley and one in Goldfield. The total number of fatalities in
Fernley and Goldfield were three and one, respectively. No other towns had any fatal
crashes during the 9-year period.
Table 13 Fatal Crashes and Fatalities by Towns
Town No. of fatal crashes No. of fatalities
Fernley 2 3
Goldfield 1 1
Total 3 4
59
Total non-fatal crashes per year.
The non-fatal crashes were divided into non-fatal injury-causing crashes and PDO
crashes. These crash data for each of these towns were analyzed to compare among the
11 towns. Figure 4 shows the average number of PDO crashes and non-fatal injury-
causing crashes per year respectively that occurred in these towns. The data showed that
Fernley has the highest number of PDO crashes and non-fatal injury-causing crashes per
year among all the towns under study.
The average number of PDO crashes per year per town was two for the towns under
study. There were 7 PDO crashes per year in Fernley, whereas, the number of such
crashes per year in Luning was less than one.
Twenty-two non-fatal injury-causing crashes occurred in Fernley, which accounted
for about a quarter of all the non-fatal injury-causing crashes in all the towns, combined.
There was zero non-fatal injury-causing crash that occurred in Luning. Other towns had
non-fatal injury-causing crashes in between 3 to 13.
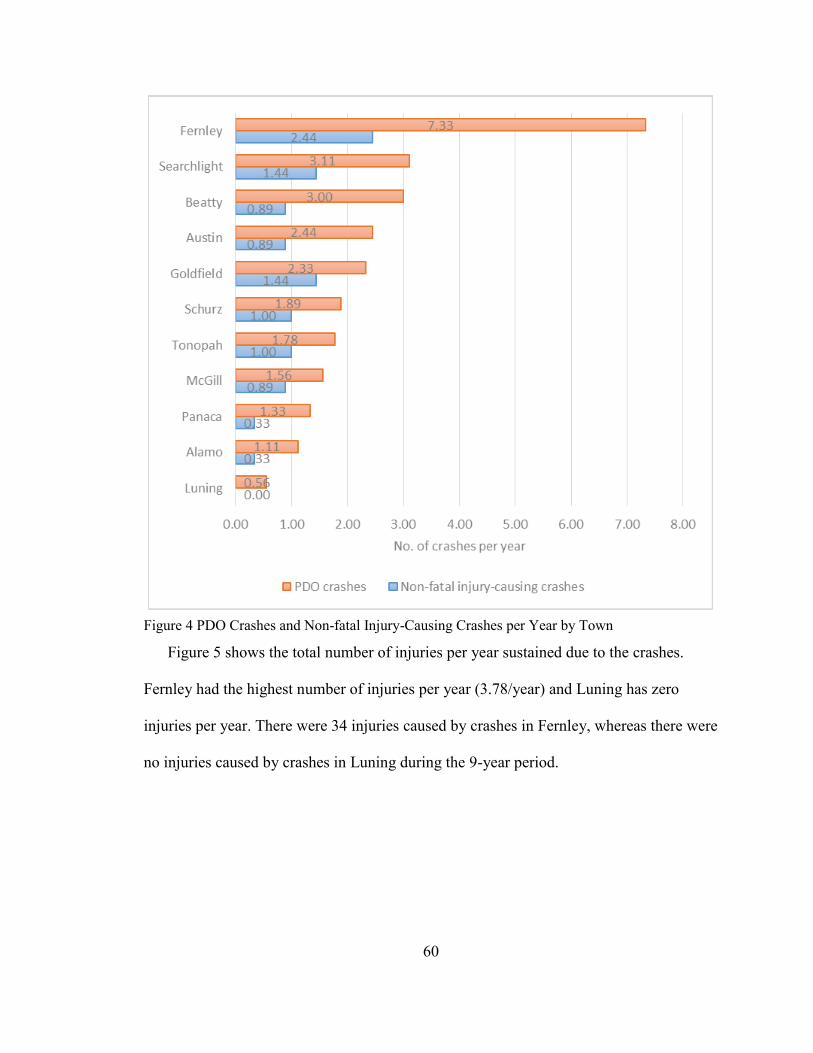
60
Figure 4 PDO Crashes and Non-fatal Injury-Causing Crashes per Year by Town
Figure 5 shows the total number of injuries per year sustained due to the crashes.
Fernley had the highest number of injuries per year (3.78/year) and Luning has zero
injuries per year. There were 34 injuries caused by crashes in Fernley, whereas there were
no injuries caused by crashes in Luning during the 9-year period.
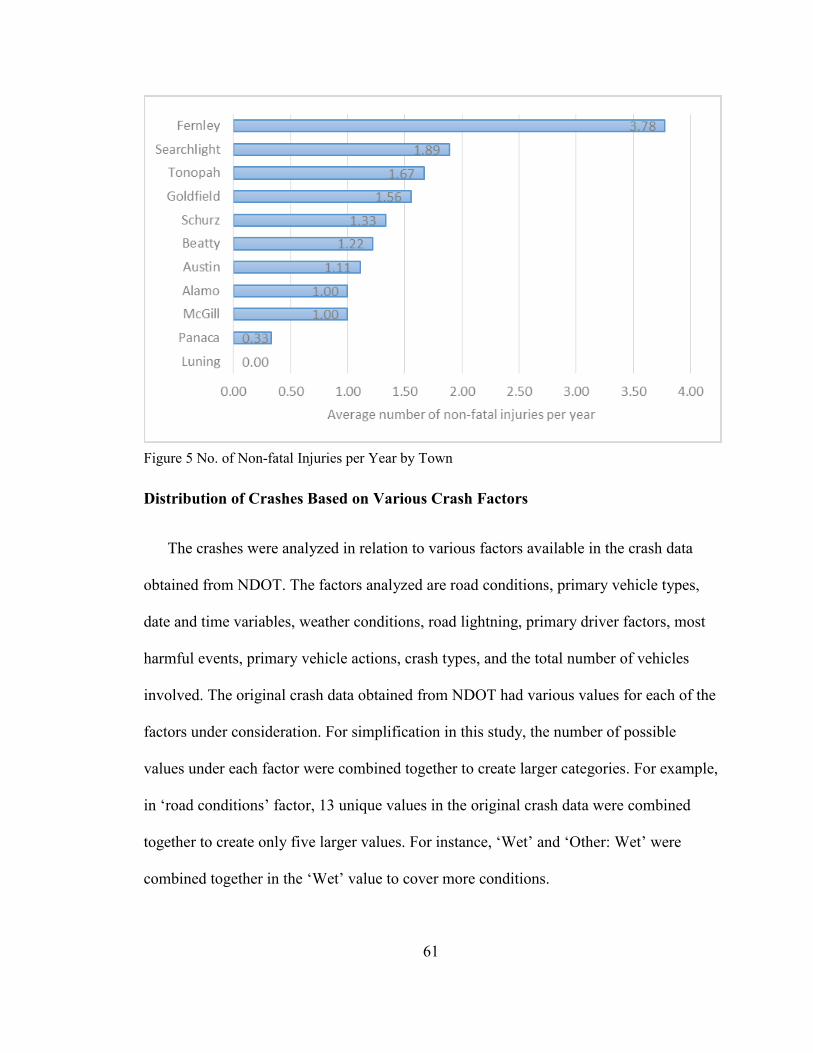
61
Figure 5 No. of Non-fatal Injuries per Year by Town
Distribution of Crashes Based on Various Crash Factors
The crashes were analyzed in relation to various factors available in the crash data
obtained from NDOT. The factors analyzed are road conditions, primary vehicle types,
date and time variables, weather conditions, road lightning, primary driver factors, most
harmful events, primary vehicle actions, crash types, and the total number of vehicles
involved. The original crash data obtained from NDOT had various values for each of the
factors under consideration. For simplification in this study, the number of possible
values under each factor were combined together to create larger categories. For example,
in ‘road conditions’ factor, 13 unique values in the original crash data were combined
together to create only five larger values. For instance, ‘Wet’ and ‘Other: Wet’ were
combined together in the ‘Wet’ value to cover more conditions.
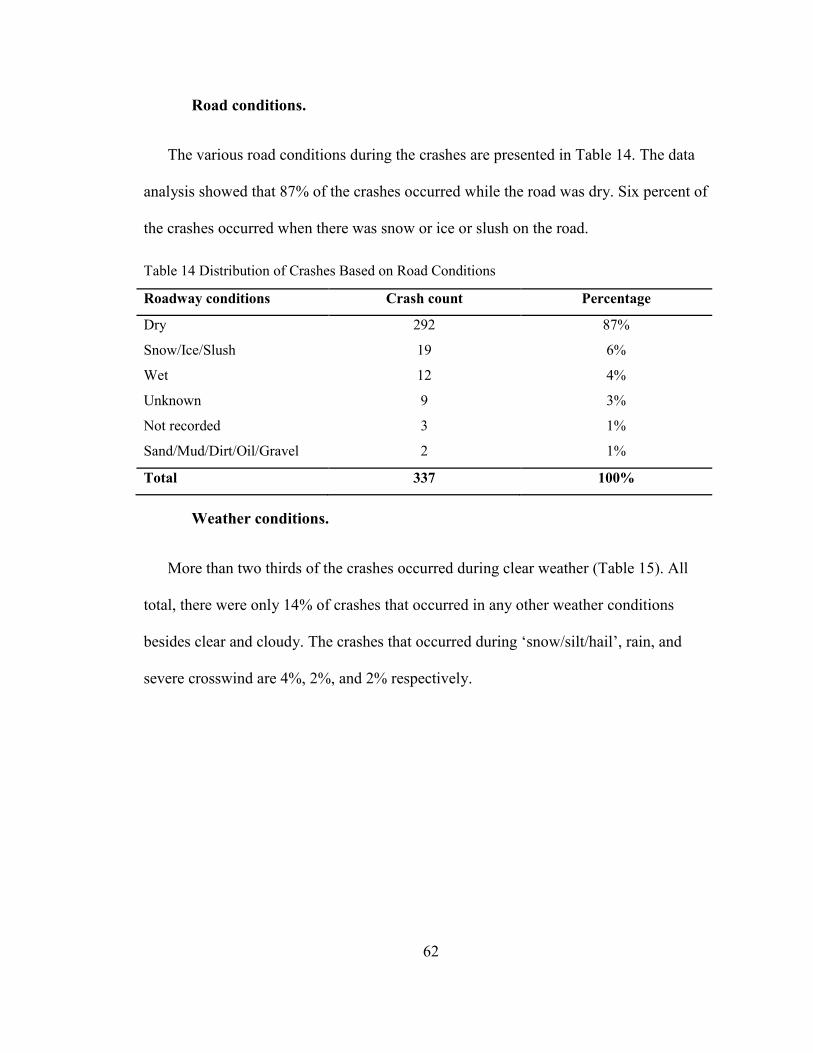
62
Road conditions.
The various road conditions during the crashes are presented in Table 14. The data
analysis showed that 87% of the crashes occurred while the road was dry. Six percent of
the crashes occurred when there was snow or ice or slush on the road.
Table 14 Distribution of Crashes Based on Road Conditions
Roadway conditions Crash count Percentage
Dry 292 87%
Snow/Ice/Slush 19 6%
Wet 12 4%
Unknown 9 3%
Not recorded 3 1%
Sand/Mud/Dirt/Oil/Gravel 2 1%
Total 337 100%
Weather conditions.
More than two thirds of the crashes occurred during clear weather (Table 15). All
total, there were only 14% of crashes that occurred in any other weather conditions
besides clear and cloudy. The crashes that occurred during ‘snow/silt/hail’, rain, and
severe crosswind are 4%, 2%, and 2% respectively.
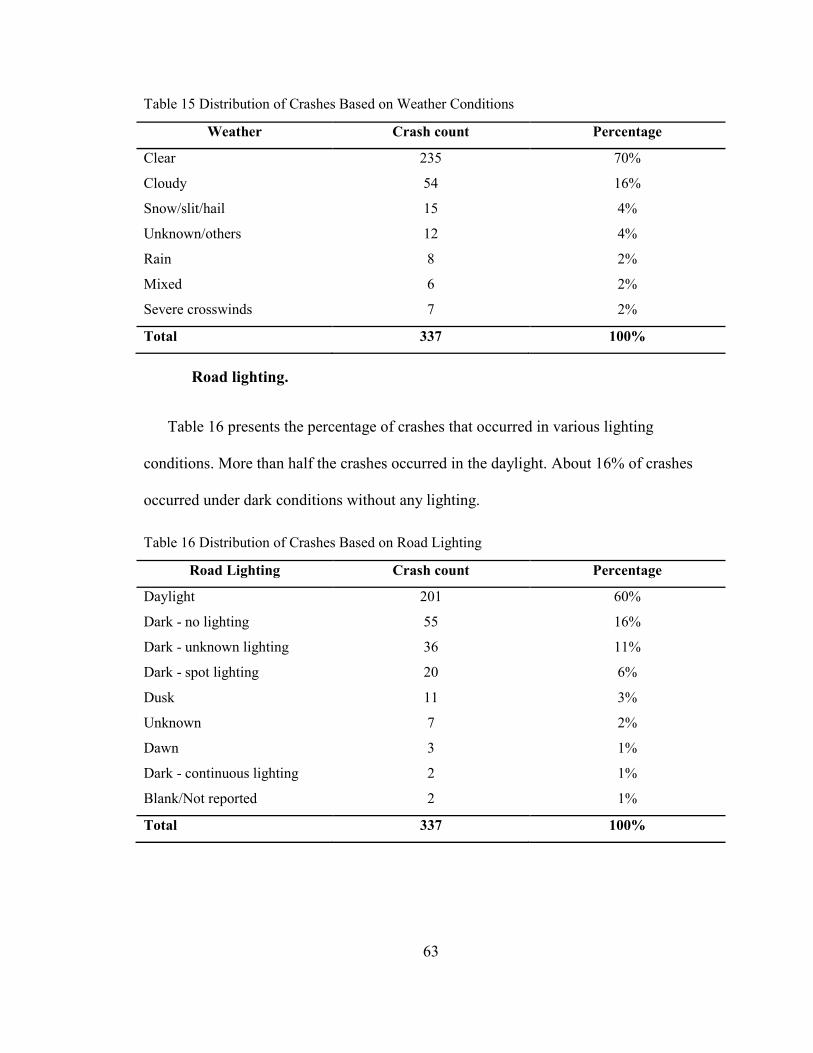
63
Table 15 Distribution of Crashes Based on Weather Conditions
Weather Crash count Percentage
Clear 235 70%
Cloudy 54 16%
Snow/slit/hail 15 4%
Unknown/others 12 4%
Rain 8 2%
Mixed 6 2%
Severe crosswinds 7 2%
Total 337 100%
Road lighting.
Table 16 presents the percentage of crashes that occurred in various lighting
conditions. More than half the crashes occurred in the daylight. About 16% of crashes
occurred under dark conditions without any lighting.
Table 16 Distribution of Crashes Based on Road Lighting
Road Lighting Crash count Percentage
Daylight 201 60%
Dark - no lighting 55 16%
Dark - unknown lighting 36 11%
Dark - spot lighting 20 6%
Dusk 11 3%
Unknown 7 2%
Dawn 3 1%
Dark - continuous lighting 2 1%
Blank/Not reported 2 1%
Total 337 100%
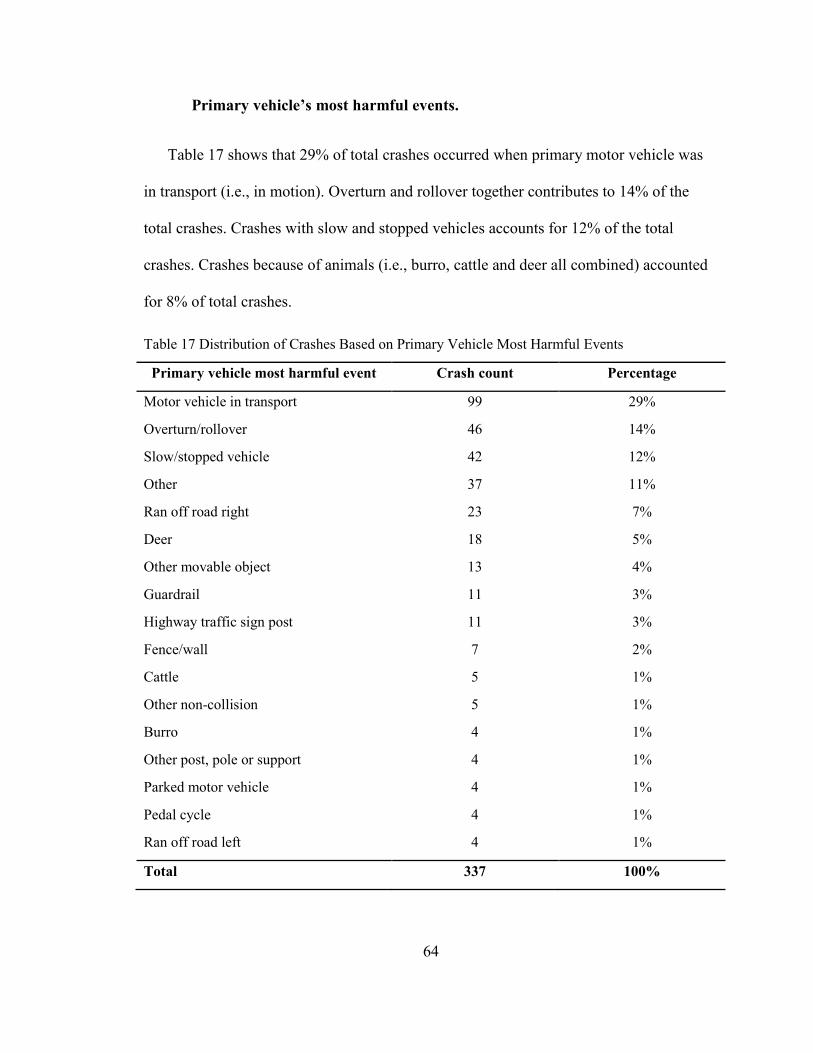
64
Primary vehicle’s most harmful events.
Table 17 shows that 29% of total crashes occurred when primary motor vehicle was
in transport (i.e., in motion). Overturn and rollover together contributes to 14% of the
total crashes. Crashes with slow and stopped vehicles accounts for 12% of the total
crashes. Crashes because of animals (i.e., burro, cattle and deer all combined) accounted
for 8% of total crashes.
Table 17 Distribution of Crashes Based on Primary Vehicle Most Harmful Events
Primary vehicle most harmful event Crash count Percentage
Motor vehicle in transport 99 29%
Overturn/rollover 46 14%
Slow/stopped vehicle 42 12%
Other 37 11%
Ran off road right 23 7%
Deer 18 5%
Other movable object 13 4%
Guardrail 11 3%
Highway traffic sign post 11 3%
Fence/wall 7 2%
Cattle 5 1%
Other non-collision 5 1%
Burro 4 1%
Other post, pole or support 4 1%
Parked motor vehicle 4 1%
Pedal cycle 4 1%
Ran off road left 4 1%
Total 337 100%
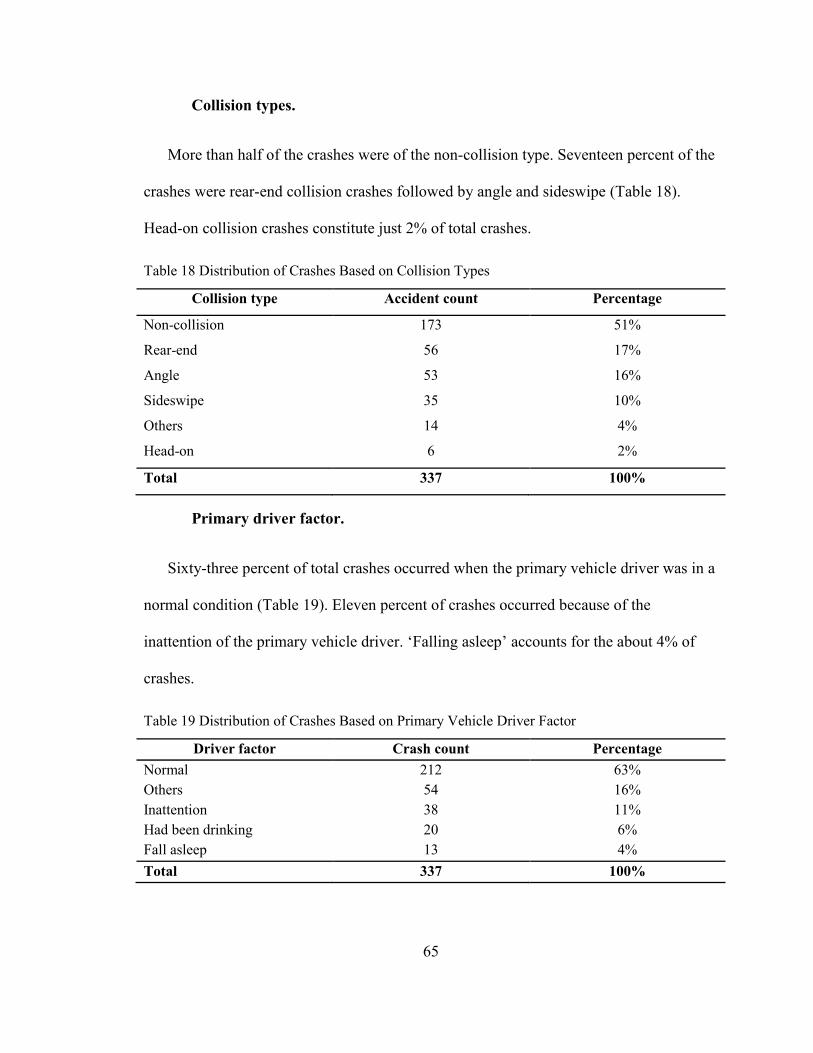
65
Collision types.
More than half of the crashes were of the non-collision type. Seventeen percent of the
crashes were rear-end collision crashes followed by angle and sideswipe (Table 18).
Head-on collision crashes constitute just 2% of total crashes.
Table 18 Distribution of Crashes Based on Collision Types
Collision type Accident count Percentage
Non-collision 173 51%
Rear-end 56 17%
Angle 53 16%
Sideswipe 35 10%
Others 14 4%
Head-on 6 2%
Total 337 100%
Primary driver factor.
Sixty-three percent of total crashes occurred when the primary vehicle driver was in a
normal condition (Table 19). Eleven percent of crashes occurred because of the
inattention of the primary vehicle driver. ‘Falling asleep’ accounts for the about 4% of
crashes.
Table 19 Distribution of Crashes Based on Primary Vehicle Driver Factor
Driver factor Crash count Percentage
Normal 212 63%
Others 54 16%
Inattention 38 11%
Had been drinking 20 6%
Fall asleep 13 4%
Total 337 100%
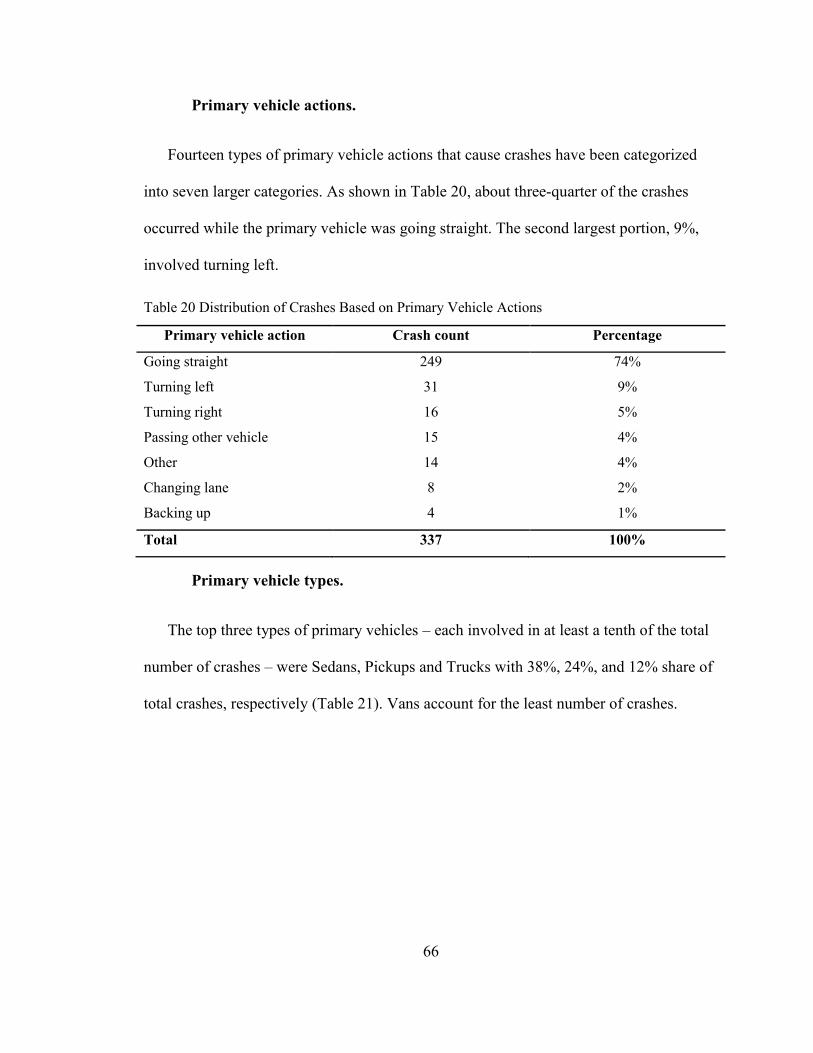
66
Primary vehicle actions.
Fourteen types of primary vehicle actions that cause crashes have been categorized
into seven larger categories. As shown in Table 20, about three-quarter of the crashes
occurred while the primary vehicle was going straight. The second largest portion, 9%,
involved turning left.
Table 20 Distribution of Crashes Based on Primary Vehicle Actions
Primary vehicle action Crash count Percentage
Going straight 249 74%
Turning left 31 9%
Turning right 16 5%
Passing other vehicle 15 4%
Other 14 4%
Changing lane 8 2%
Backing up 4 1%
Total 337 100%
Primary vehicle types.
The top three types of primary vehicles – each involved in at least a tenth of the total
number of crashes – were Sedans, Pickups and Trucks with 38%, 24%, and 12% share of
total crashes, respectively (Table 21). Vans account for the least number of crashes.
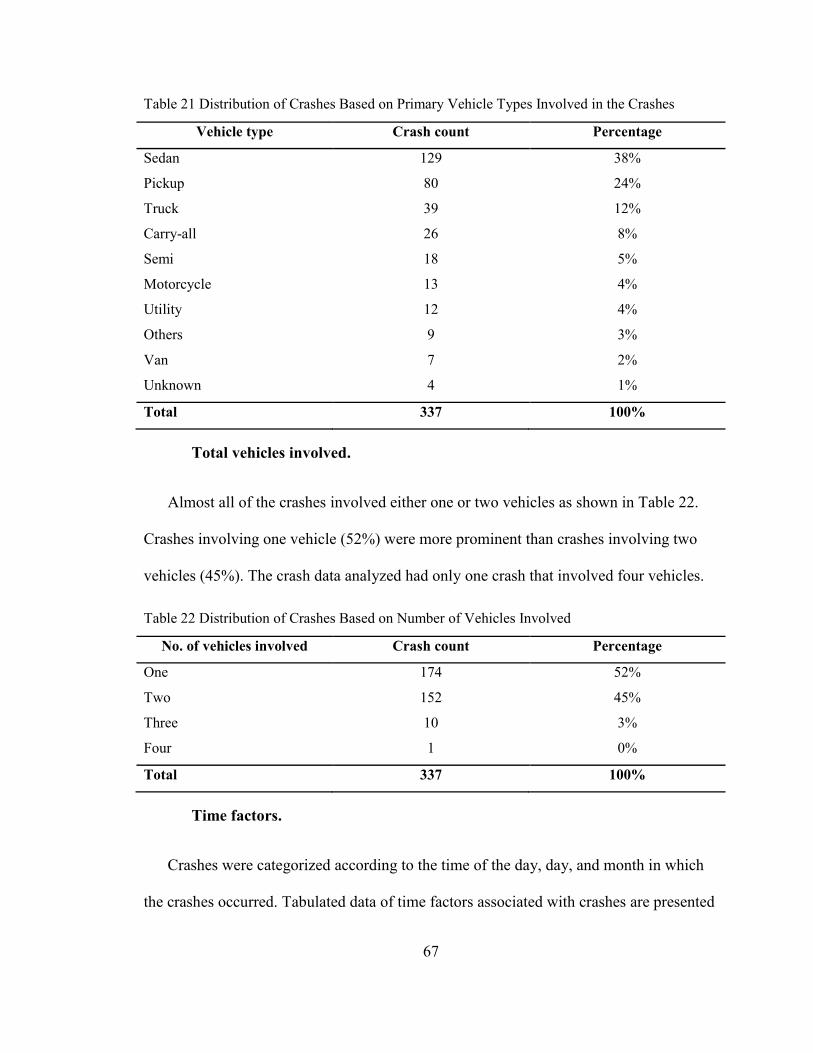
67
Table 21 Distribution of Crashes Based on Primary Vehicle Types Involved in the Crashes
Vehicle type Crash count Percentage
Sedan 129 38%
Pickup 80 24%
Truck 39 12%
Carry-all 26 8%
Semi 18 5%
Motorcycle 13 4%
Utility 12 4%
Others 9 3%
Van 7 2%
Unknown 4 1%
Total 337 100%
Total vehicles involved.
Almost all of the crashes involved either one or two vehicles as shown in Table 22.
Crashes involving one vehicle (52%) were more prominent than crashes involving two
vehicles (45%). The crash data analyzed had only one crash that involved four vehicles.
Table 22 Distribution of Crashes Based on Number of Vehicles Involved
No. of vehicles involved Crash count Percentage
One 174 52%
Two 152 45%
Three 10 3%
Four 1 0%
Total 337 100%
Time factors.
Crashes were categorized according to the time of the day, day, and month in which
the crashes occurred. Tabulated data of time factors associated with crashes are presented
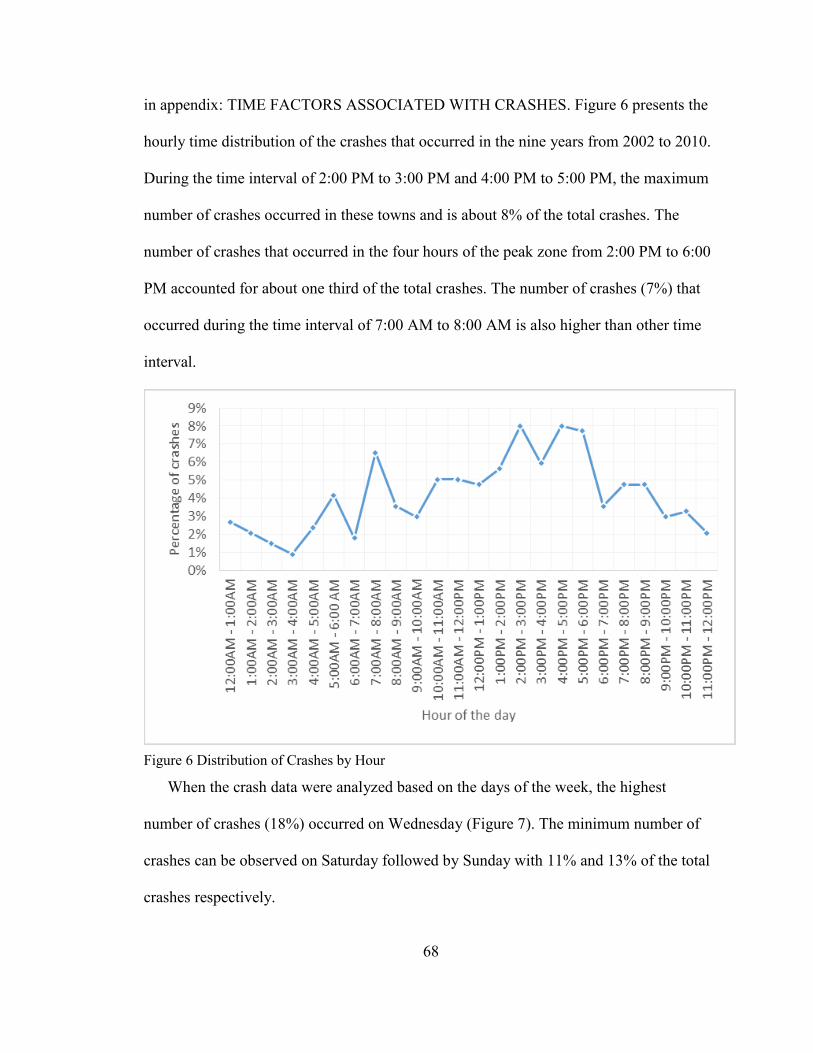
68
in appendix: TIME FACTORS ASSOCIATED WITH CRASHES. Figure 6 presents the
hourly time distribution of the crashes that occurred in the nine years from 2002 to 2010.
During the time interval of 2:00 PM to 3:00 PM and 4:00 PM to 5:00 PM, the maximum
number of crashes occurred in these towns and is about 8% of the total crashes. The
number of crashes that occurred in the four hours of the peak zone from 2:00 PM to 6:00
PM accounted for about one third of the total crashes. The number of crashes (7%) that
occurred during the time interval of 7:00 AM to 8:00 AM is also higher than other time
interval.
Figure 6 Distribution of Crashes by Hour
When the crash data were analyzed based on the days of the week, the highest
number of crashes (18%) occurred on Wednesday (Figure 7). The minimum number of
crashes can be observed on Saturday followed by Sunday with 11% and 13% of the total
crashes respectively.
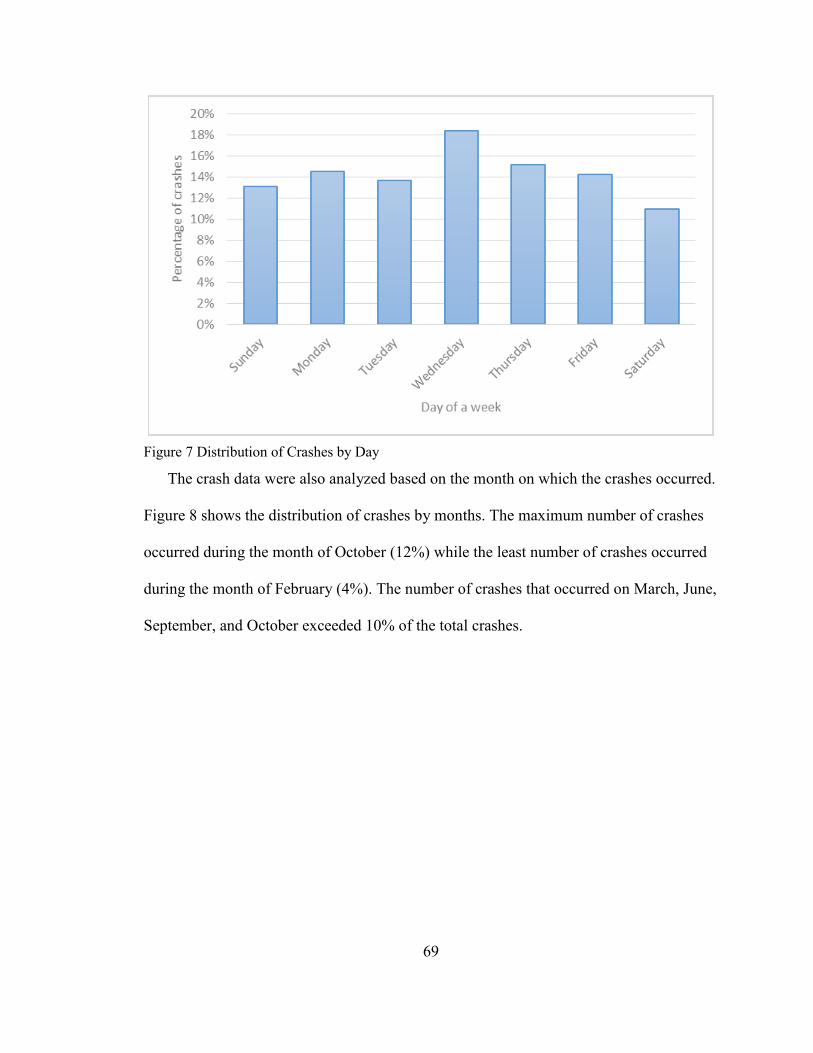
69
Figure 7 Distribution of Crashes by Day
The crash data were also analyzed based on the month on which the crashes occurred.
Figure 8 shows the distribution of crashes by months. The maximum number of crashes
occurred during the month of October (12%) while the least number of crashes occurred
during the month of February (4%). The number of crashes that occurred on March, June,
September, and October exceeded 10% of the total crashes.
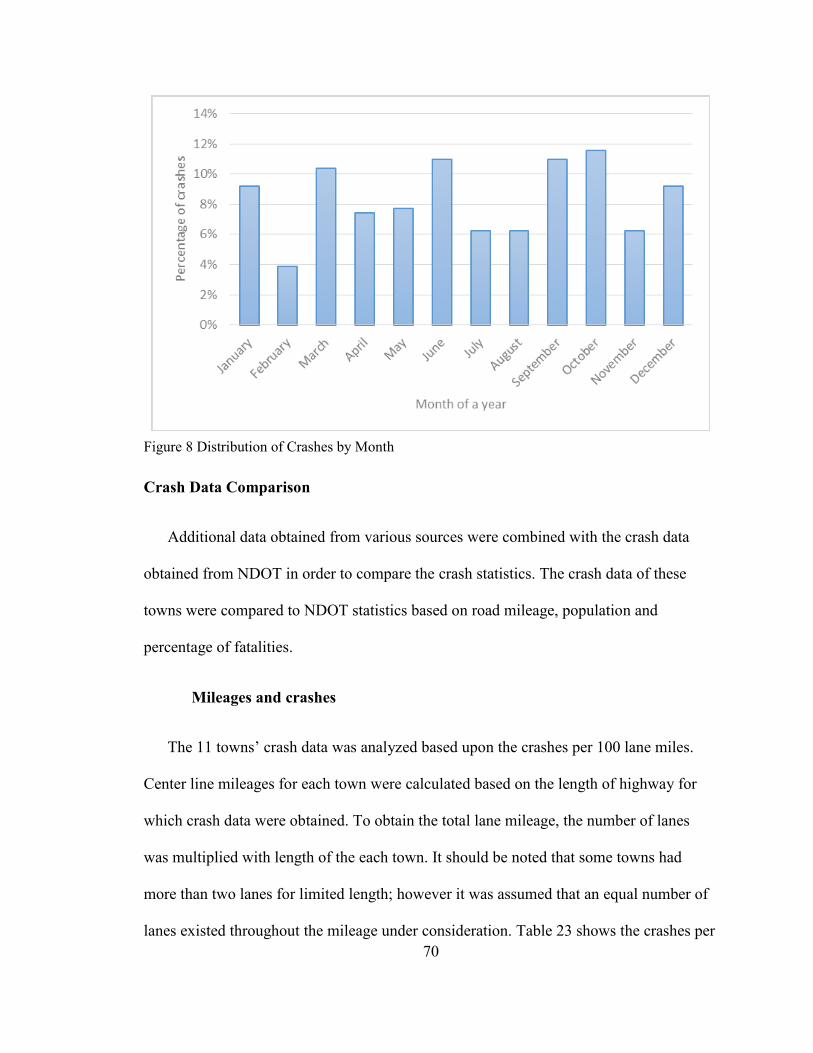
70
Figure 8 Distribution of Crashes by Month
Crash Data Comparison
Additional data obtained from various sources were combined with the crash data
obtained from NDOT in order to compare the crash statistics. The crash data of these
towns were compared to NDOT statistics based on road mileage, population and
percentage of fatalities.
Mileages and crashes
The 11 towns’ crash data was analyzed based upon the crashes per 100 lane miles.
Center line mileages for each town were calculated based on the length of highway for
which crash data were obtained. To obtain the total lane mileage, the number of lanes
was multiplied with length of the each town. It should be noted that some towns had
more than two lanes for limited length; however it was assumed that an equal number of
lanes existed throughout the mileage under consideration. Table 23 shows the crashes per
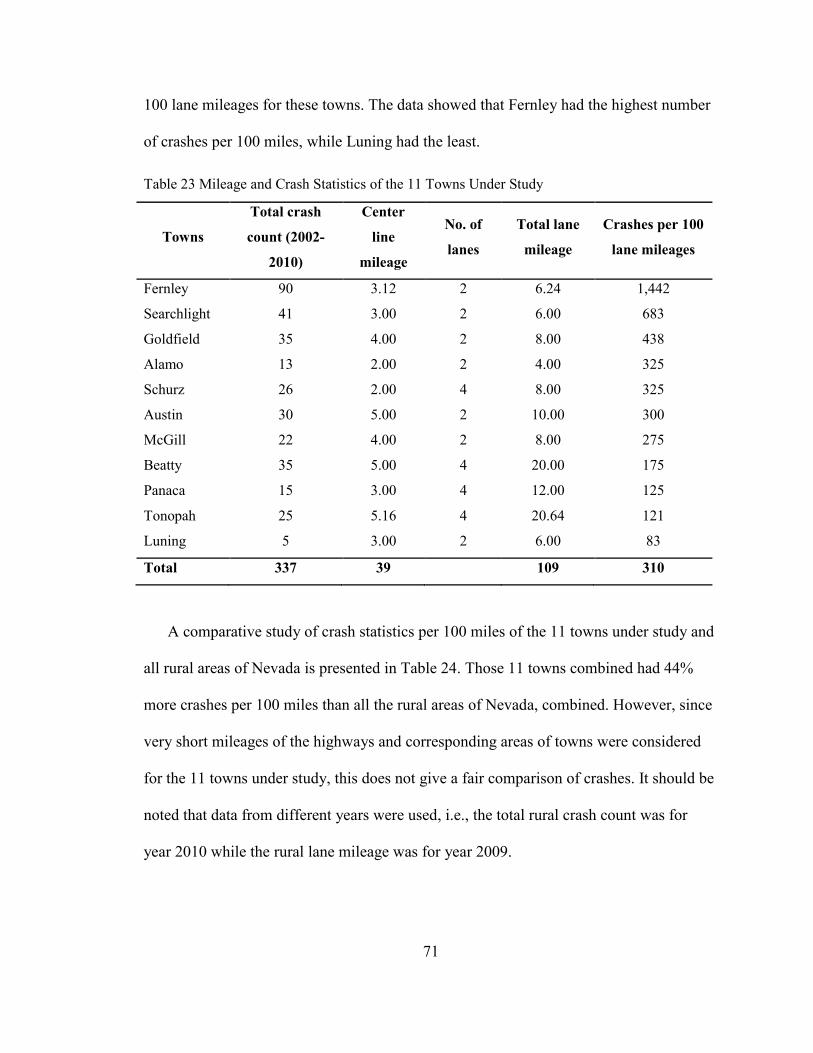
71
100 lane mileages for these towns. The data showed that Fernley had the highest number
of crashes per 100 miles, while Luning had the least.
Table 23 Mileage and Crash Statistics of the 11 Towns Under Study
Towns
Total crash
count (2002-
2010)
Center
line
mileage
No. of
lanes
Total lane
mileage
Crashes per 100
lane mileages
Fernley 90 3.12 2 6.24 1,442
Searchlight 41 3.00 2 6.00 683
Goldfield 35 4.00 2 8.00 438
Alamo 13 2.00 2 4.00 325
Schurz 26 2.00 4 8.00 325
Austin 30 5.00 2 10.00 300
McGill 22 4.00 2 8.00 275
Beatty 35 5.00 4 20.00 175
Panaca 15 3.00 4 12.00 125
Tonopah 25 5.16 4 20.64 121
Luning 5 3.00 2 6.00 83
Total 337 39
109 310
A comparative study of crash statistics per 100 miles of the 11 towns under study and
all rural areas of Nevada is presented in Table 24. Those 11 towns combined had 44%
more crashes per 100 miles than all the rural areas of Nevada, combined. However, since
very short mileages of the highways and corresponding areas of towns were considered
for the 11 towns under study, this does not give a fair comparison of crashes. It should be
noted that data from different years were used, i.e., the total rural crash count was for
year 2010 while the rural lane mileage was for year 2009.
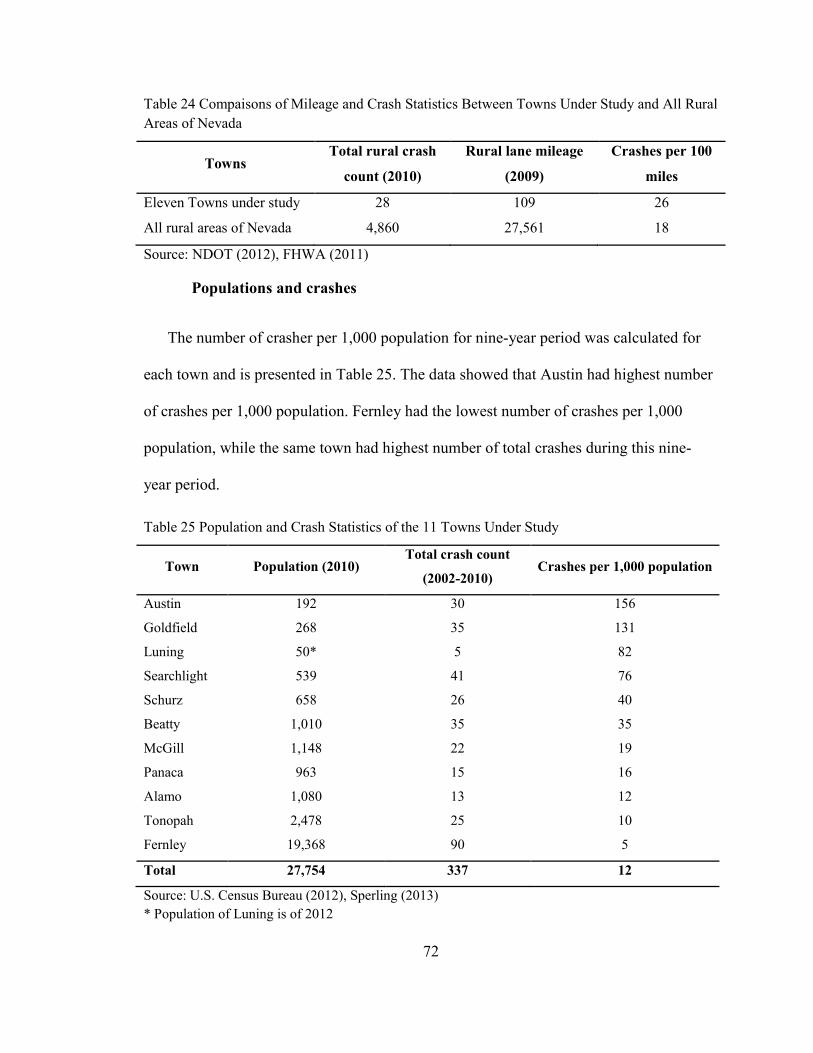
72
Table 24 Compaisons of Mileage and Crash Statistics Between Towns Under Study and All Rural
Areas of Nevada
Towns Total rural crash
count (2010)
Rural lane mileage
(2009)
Crashes per 100
miles
Eleven Towns under study 28 109 26
All rural areas of Nevada 4,860 27,561 18
Source: NDOT (2012), FHWA (2011)
Populations and crashes
The number of crasher per 1,000 population for nine-year period was calculated for
each town and is presented in Table 25. The data showed that Austin had highest number
of crashes per 1,000 population. Fernley had the lowest number of crashes per 1,000
population, while the same town had highest number of total crashes during this nine-
year period.
Table 25 Population and Crash Statistics of the 11 Towns Under Study
Town Population (2010) Total crash count
(2002-2010) Crashes per 1,000 population
Austin 192 30 156
Goldfield 268 35 131
Luning 50* 5 82
Searchlight 539 41 76
Schurz 658 26 40
Beatty 1,010 35 35
McGill 1,148 22 19
Panaca 963 15 16
Alamo 1,080 13 12
Tonopah 2,478 25 10
Fernley 19,368 90 5
Total 27,754 337 12
Source: U.S. Census Bureau (2012), Sperling (2013)
* Population of Luning is of 2012
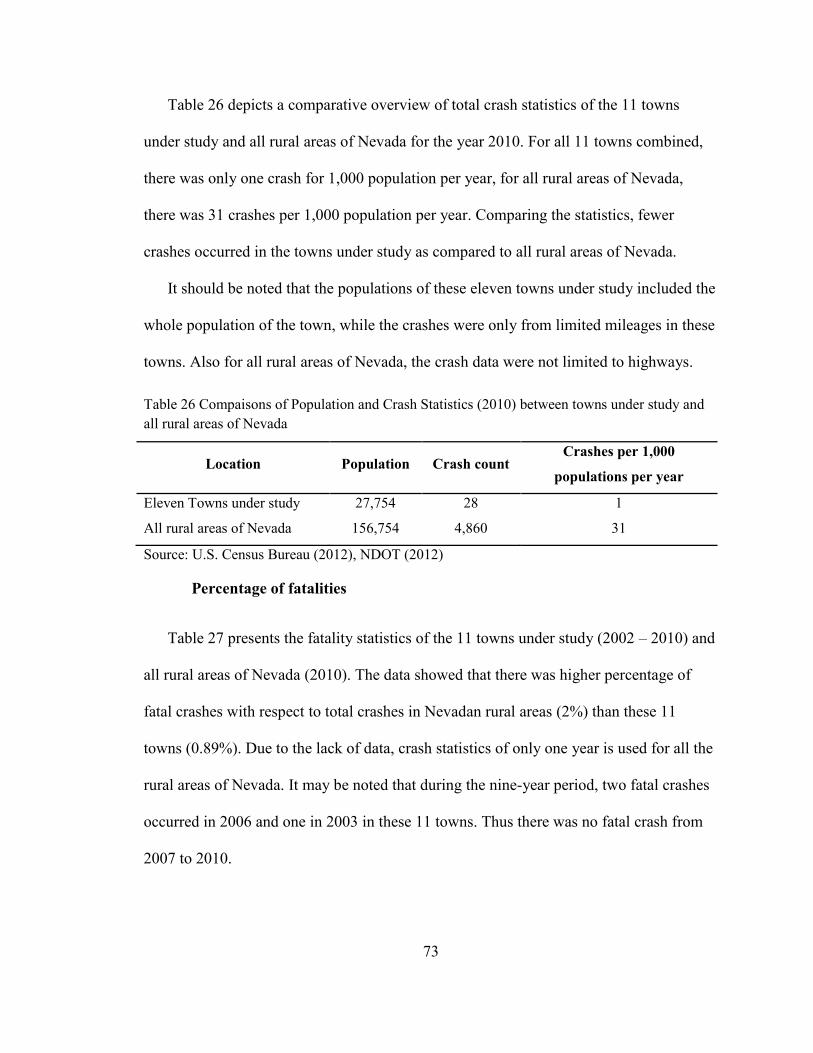
73
Table 26 depicts a comparative overview of total crash statistics of the 11 towns
under study and all rural areas of Nevada for the year 2010. For all 11 towns combined,
there was only one crash for 1,000 population per year, for all rural areas of Nevada,
there was 31 crashes per 1,000 population per year. Comparing the statistics, fewer
crashes occurred in the towns under study as compared to all rural areas of Nevada.
It should be noted that the populations of these eleven towns under study included the
whole population of the town, while the crashes were only from limited mileages in these
towns. Also for all rural areas of Nevada, the crash data were not limited to highways.
Table 26 Compaisons of Population and Crash Statistics (2010) between towns under study and
all rural areas of Nevada
Location Population Crash count Crashes per 1,000
populations per year
Eleven Towns under study 27,754 28 1
All rural areas of Nevada 156,754 4,860 31
Source: U.S. Census Bureau (2012), NDOT (2012)
Percentage of fatalities
Table 27 presents the fatality statistics of the 11 towns under study (2002 – 2010) and
all rural areas of Nevada (2010). The data showed that there was higher percentage of
fatal crashes with respect to total crashes in Nevadan rural areas (2%) than these 11
towns (0.89%). Due to the lack of data, crash statistics of only one year is used for all the
rural areas of Nevada. It may be noted that during the nine-year period, two fatal crashes
occurred in 2006 and one in 2003 in these 11 towns. Thus there was no fatal crash from
2007 to 2010.

74
Table 27 Comparison of Percentage of Fatalities between towns under study and all rural areas of
Neavada
Location Fatal crashes Crash count Percentage of
fatal crashes
Eleven towns under consideration
(2002-2010) 3 337 0.89%
All rural areas of Nevada (2010) 97 4,860 2.00%
Source: NDOT (2012)
Crash Severity Prediction Models Using MNL Model and Binary Logit Model
Two statistical models were developed to analyze the crash data: 1) multinomial logit
(MNL) model to predict the 5 different levels of severity of crashes and 2) binary logit
model to predict the injury crashes. The five levels of severities analyzed in the
multinomial logit model were no injury or PDO, claimed, non-incapacitating,
incapacitating, and fatal. In binary logit model, only non-fatal crashes were analyzed and
response variable was no injury or PDO and injury. In the first model, 337 crash data
were used, for the second model 334 non-fatal crash data were used. The category codes
used for the analysis are listed in Table 28.
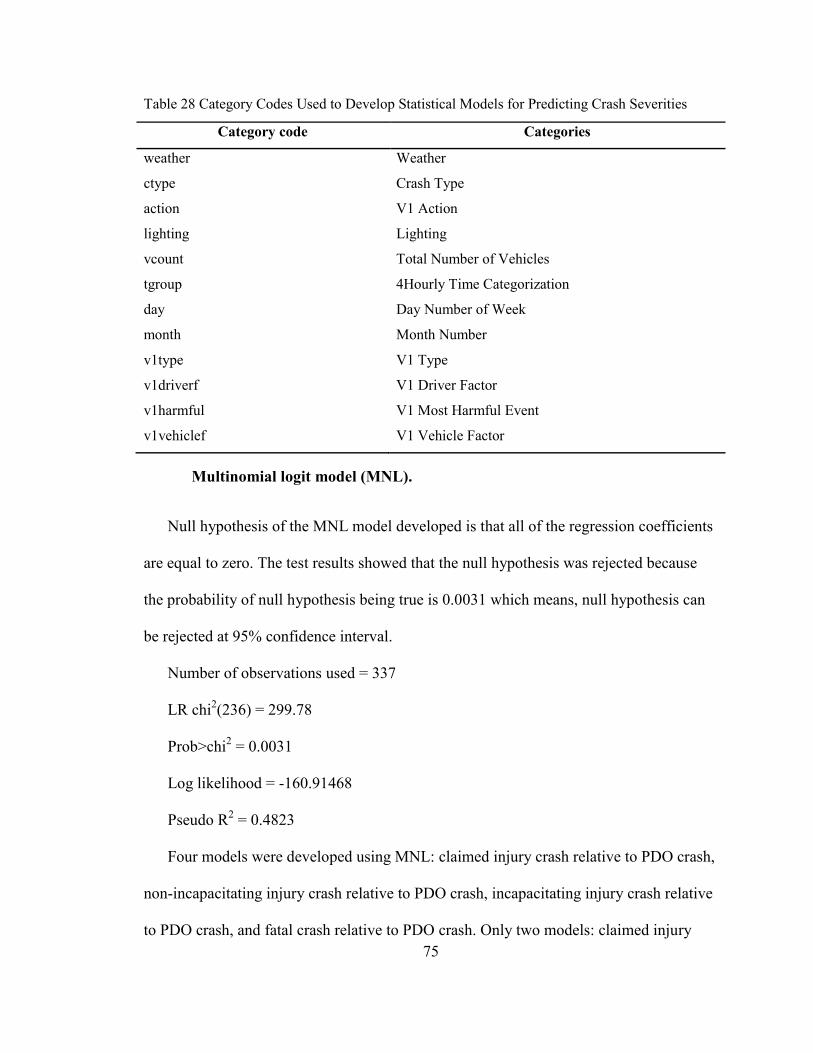
75
Table 28 Category Codes Used to Develop Statistical Models for Predicting Crash Severities
Category code Categories
weather Weather
ctype Crash Type
action V1 Action
lighting Lighting
vcount Total Number of Vehicles
tgroup 4Hourly Time Categorization
day Day Number of Week
month Month Number
v1type V1 Type
v1driverf V1 Driver Factor
v1harmful V1 Most Harmful Event
v1vehiclef V1 Vehicle Factor
Multinomial logit model (MNL).
Null hypothesis of the MNL model developed is that all of the regression coefficients
are equal to zero. The test results showed that the null hypothesis was rejected because
the probability of null hypothesis being true is 0.0031 which means, null hypothesis can
be rejected at 95% confidence interval.
Number of observations used = 337
LR chi2(236) = 299.78
Prob>chi2 = 0.0031
Log likelihood = -160.91468
Pseudo R2 = 0.4823
Four models were developed using MNL: claimed injury crash relative to PDO crash,
non-incapacitating injury crash relative to PDO crash, incapacitating injury crash relative
to PDO crash, and fatal crash relative to PDO crash. Only two models: claimed injury
76
crashes relative to PDO crashes and non-incapacitating injury crashes relative to PDO
crashes had statistically significant predictor variables.
Table 29 lists the predictor variables and corresponding Relative Risk Ratio (RRR) of
the factors that significantly affect the crash severity.
The relative risk of crashes on June being claimed rather than PDO, relative to crash
on January, is 0.111 when other variables in the model are kept constant. Thus crashes on
January were 9 times (=1/0.111) more likely to be claimed as compared to crashes on
June. In comparison to crashes on October, crashes on January were 8(=1/0.123) times
more likely to be claimed than PDO.
Table 29 shows that the crashes being claimed were very high for motorcycle as
compared to crashes involving car, pickup/van, or heavy vehicle. Also, the crashes
caused by speeding were 18 (=1/0.056) times more likely to be a claimed crash than
crashes caused by inattention.
Crashes caused by a primary vehicle passing another vehicle were 46 times more
likely to be non-incapacitating crashes than crashes that occurred when primary vehicle
was going straight. The results also showed that crashes that occurred on weekdays were
36 times more likely to be non-incapacitating than crashes that occurred on weekends.
Drunk drivers were 7 times more likely to be involved in the non-incapacitating
crashes than the drivers in normal conditions. An interesting observation is that speeding
was less likely to cause non-incapacitating crashes as compared to inattention. In other
words, inattention is likely to result into more severe crashes than speeding.
It may be noted that the lighting factors were not found to have significant effects on
the MNL models discussed here (i.e., models in which days were categorized into
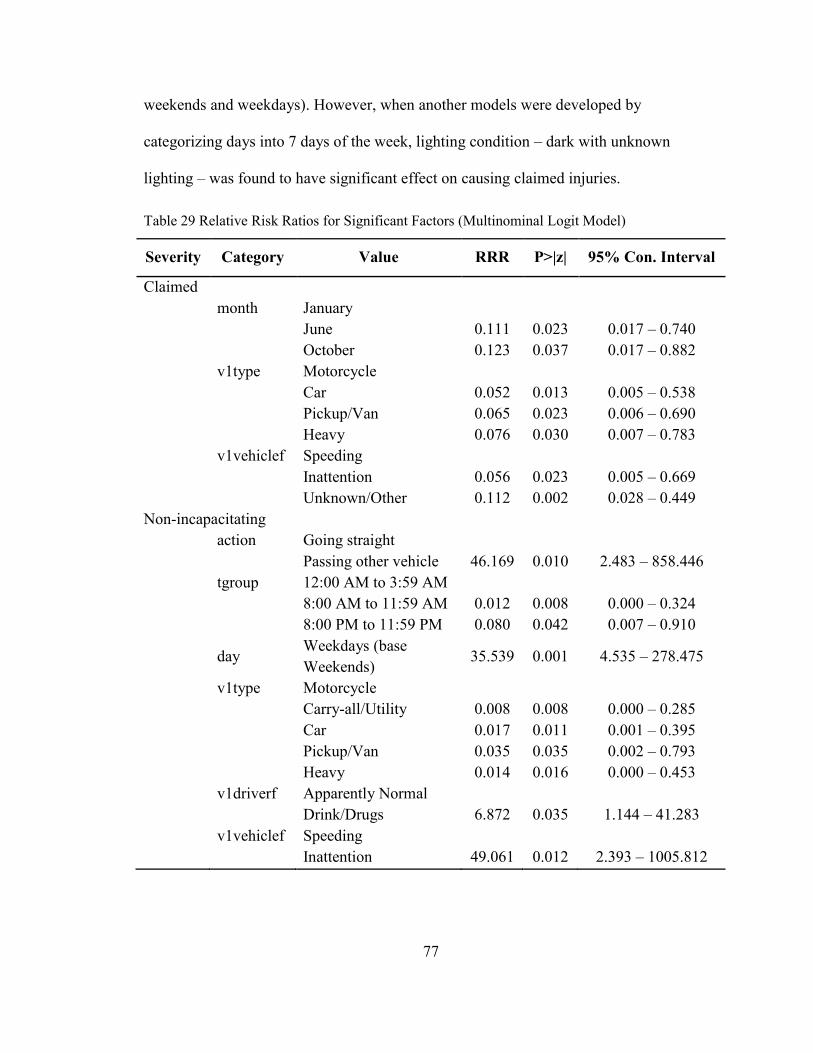
77
weekends and weekdays). However, when another models were developed by
categorizing days into 7 days of the week, lighting condition – dark with unknown
lighting – was found to have significant effect on causing claimed injuries.
Table 29 Relative Risk Ratios for Significant Factors (Multinominal Logit Model)
Severity Category Value RRR P>|z| 95% Con. Interval
Claimed
month January
June 0.111 0.023 0.017 – 0.740
October 0.123 0.037 0.017 – 0.882
v1type Motorcycle
Car 0.052 0.013 0.005 – 0.538
Pickup/Van 0.065 0.023 0.006 – 0.690
Heavy 0.076 0.030 0.007 – 0.783
v1vehiclef Speeding
Inattention 0.056 0.023 0.005 – 0.669
Unknown/Other 0.112 0.002 0.028 – 0.449
Non-incapacitating
action Going straight
Passing other vehicle 46.169 0.010 2.483 – 858.446
tgroup 12:00 AM to 3:59 AM
8:00 AM to 11:59 AM 0.012 0.008 0.000 – 0.324
8:00 PM to 11:59 PM 0.080 0.042 0.007 – 0.910
day Weekdays (base
Weekends) 35.539 0.001 4.535 – 278.475
v1type Motorcycle
Carry-all/Utility 0.008 0.008 0.000 – 0.285
Car 0.017 0.011 0.001 – 0.395
Pickup/Van 0.035 0.035 0.002 – 0.793
Heavy 0.014 0.016 0.000 – 0.453
v1driverf Apparently Normal
Drink/Drugs 6.872 0.035 1.144 – 41.283
v1vehiclef Speeding
Inattention 49.061 0.012 2.393 – 1005.812
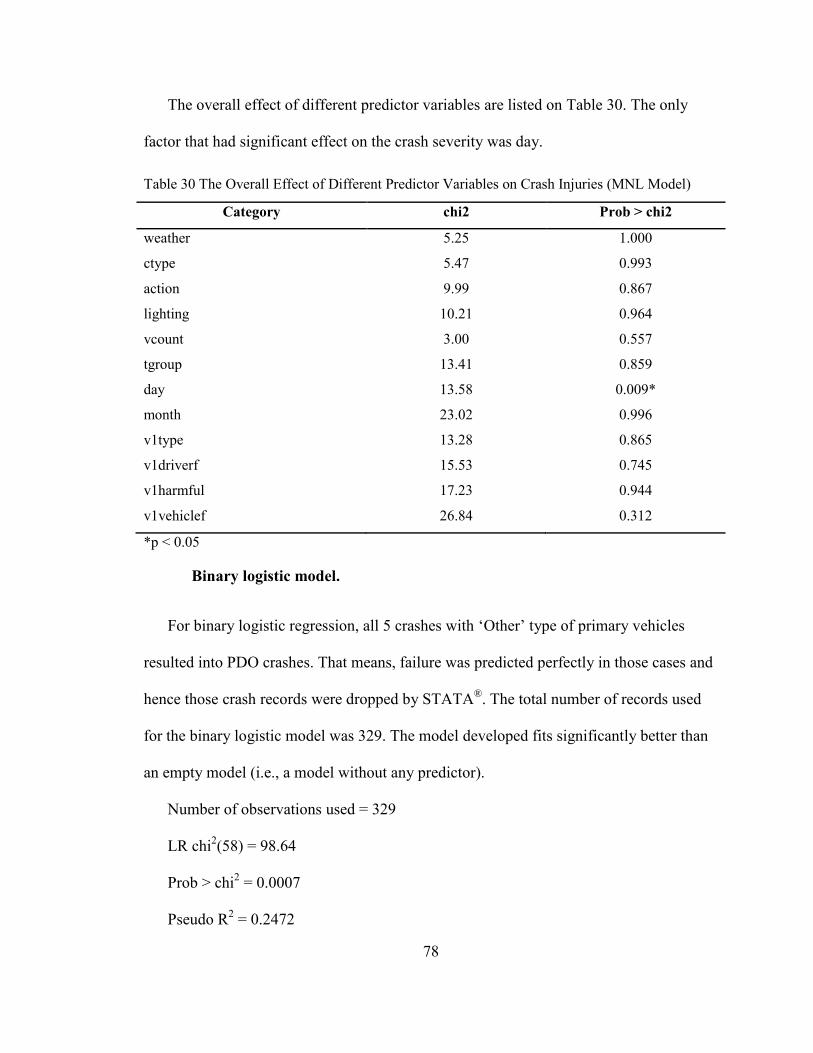
78
The overall effect of different predictor variables are listed on Table 30. The only
factor that had significant effect on the crash severity was day.
Table 30 The Overall Effect of Different Predictor Variables on Crash Injuries (MNL Model)
Category chi2 Prob > chi2
weather 5.25 1.000
ctype 5.47 0.993
action 9.99 0.867
lighting 10.21 0.964
vcount 3.00 0.557
tgroup 13.41 0.859
day 13.58 0.009*
month 23.02 0.996
v1type 13.28 0.865
v1driverf 15.53 0.745
v1harmful 17.23 0.944
v1vehiclef 26.84 0.312
*p < 0.05
Binary logistic model.
For binary logistic regression, all 5 crashes with ‘Other’ type of primary vehicles
resulted into PDO crashes. That means, failure was predicted perfectly in those cases and
hence those crash records were dropped by STATA®. The total number of records used
for the binary logistic model was 329. The model developed fits significantly better than
an empty model (i.e., a model without any predictor).
Number of observations used = 329
LR chi2(58) = 98.64
Prob > chi2 = 0.0007
Pseudo R2 = 0.2472
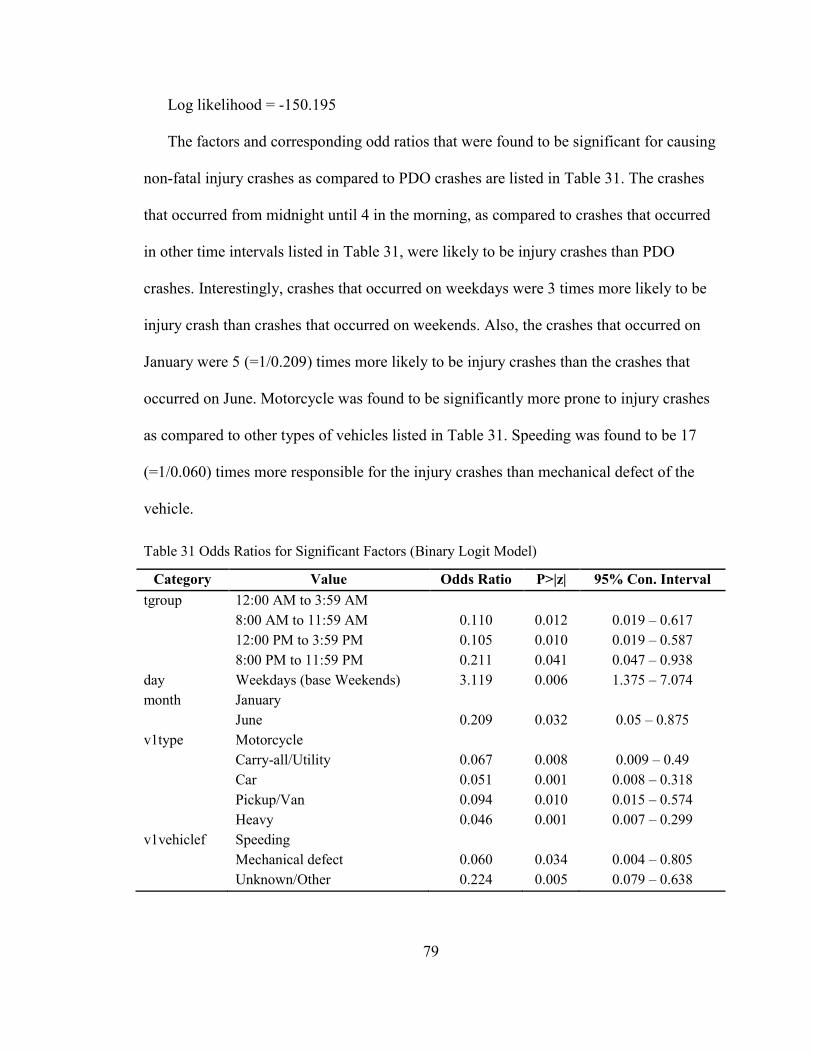
79
Log likelihood = -150.195
The factors and corresponding odd ratios that were found to be significant for causing
non-fatal injury crashes as compared to PDO crashes are listed in Table 31. The crashes
that occurred from midnight until 4 in the morning, as compared to crashes that occurred
in other time intervals listed in Table 31, were likely to be injury crashes than PDO
crashes. Interestingly, crashes that occurred on weekdays were 3 times more likely to be
injury crash than crashes that occurred on weekends. Also, the crashes that occurred on
January were 5 (=1/0.209) times more likely to be injury crashes than the crashes that
occurred on June. Motorcycle was found to be significantly more prone to injury crashes
as compared to other types of vehicles listed in Table 31. Speeding was found to be 17
(=1/0.060) times more responsible for the injury crashes than mechanical defect of the
vehicle.
Table 31 Odds Ratios for Significant Factors (Binary Logit Model)
Category Value Odds Ratio P>|z| 95% Con. Interval
tgroup 12:00 AM to 3:59 AM
8:00 AM to 11:59 AM 0.110 0.012 0.019 – 0.617
12:00 PM to 3:59 PM 0.105 0.010 0.019 – 0.587
8:00 PM to 11:59 PM 0.211 0.041 0.047 – 0.938
day Weekdays (base Weekends) 3.119 0.006 1.375 – 7.074
month January
June 0.209 0.032 0.05 – 0.875
v1type Motorcycle
Carry-all/Utility 0.067 0.008 0.009 – 0.49
Car 0.051 0.001 0.008 – 0.318
Pickup/Van 0.094 0.010 0.015 – 0.574
Heavy 0.046 0.001 0.007 – 0.299
v1vehiclef Speeding
Mechanical defect 0.060 0.034 0.004 – 0.805
Unknown/Other 0.224 0.005 0.079 – 0.638
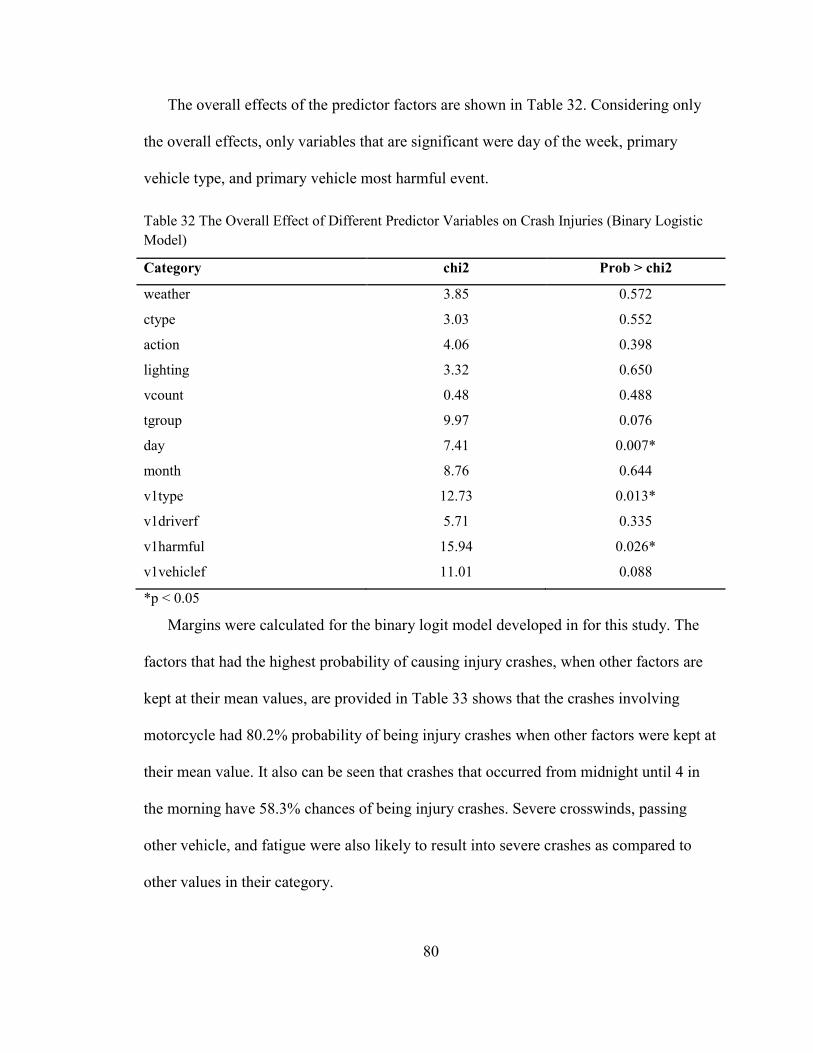
80
The overall effects of the predictor factors are shown in Table 32. Considering only
the overall effects, only variables that are significant were day of the week, primary
vehicle type, and primary vehicle most harmful event.
Table 32 The Overall Effect of Different Predictor Variables on Crash Injuries (Binary Logistic
Model)
Category chi2 Prob > chi2
weather 3.85 0.572
ctype 3.03 0.552
action 4.06 0.398
lighting 3.32 0.650
vcount 0.48 0.488
tgroup 9.97 0.076
day 7.41 0.007*
month 8.76 0.644
v1type 12.73 0.013*
v1driverf 5.71 0.335
v1harmful 15.94 0.026*
v1vehiclef 11.01 0.088
*p < 0.05
Margins were calculated for the binary logit model developed in for this study. The
factors that had the highest probability of causing injury crashes, when other factors are
kept at their mean values, are provided in Table 33 shows that the crashes involving
motorcycle had 80.2% probability of being injury crashes when other factors were kept at
their mean value. It also can be seen that crashes that occurred from midnight until 4 in
the morning have 58.3% chances of being injury crashes. Severe crosswinds, passing
other vehicle, and fatigue were also likely to result into severe crashes as compared to
other values in their category.
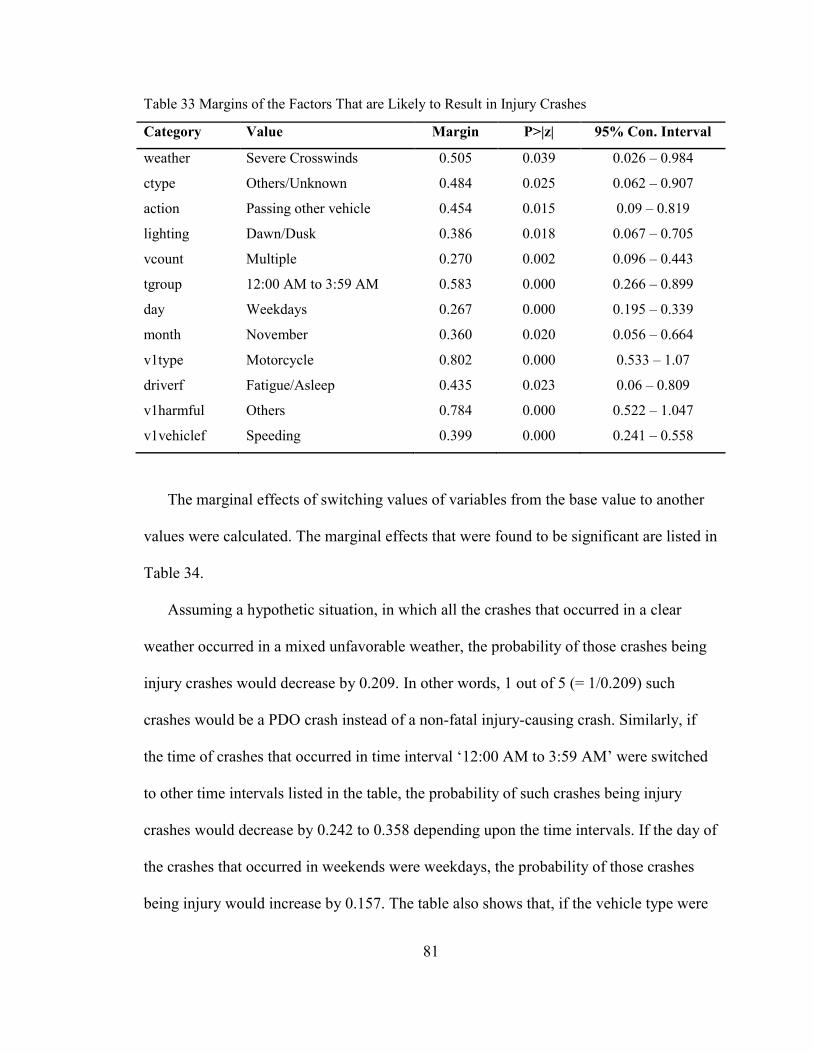
81
Table 33 Margins of the Factors That are Likely to Result in Injury Crashes
Category Value Margin P>|z| 95% Con. Interval
weather Severe Crosswinds 0.505 0.039 0.026 – 0.984
ctype Others/Unknown 0.484 0.025 0.062 – 0.907
action Passing other vehicle 0.454 0.015 0.09 – 0.819
lighting Dawn/Dusk 0.386 0.018 0.067 – 0.705
vcount Multiple 0.270 0.002 0.096 – 0.443
tgroup 12:00 AM to 3:59 AM 0.583 0.000 0.266 – 0.899
day Weekdays 0.267 0.000 0.195 – 0.339
month November 0.360 0.020 0.056 – 0.664
v1type Motorcycle 0.802 0.000 0.533 – 1.07
driverf Fatigue/Asleep 0.435 0.023 0.06 – 0.809
v1harmful Others 0.784 0.000 0.522 – 1.047
v1vehiclef Speeding 0.399 0.000 0.241 – 0.558
The marginal effects of switching values of variables from the base value to another
values were calculated. The marginal effects that were found to be significant are listed in
Table 34.
Assuming a hypothetic situation, in which all the crashes that occurred in a clear
weather occurred in a mixed unfavorable weather, the probability of those crashes being
injury crashes would decrease by 0.209. In other words, 1 out of 5 (= 1/0.209) such
crashes would be a PDO crash instead of a non-fatal injury-causing crash. Similarly, if
the time of crashes that occurred in time interval ‘12:00 AM to 3:59 AM’ were switched
to other time intervals listed in the table, the probability of such crashes being injury
crashes would decrease by 0.242 to 0.358 depending upon the time intervals. If the day of
the crashes that occurred in weekends were weekdays, the probability of those crashes
being injury would increase by 0.157. The table also shows that, if the vehicle type were
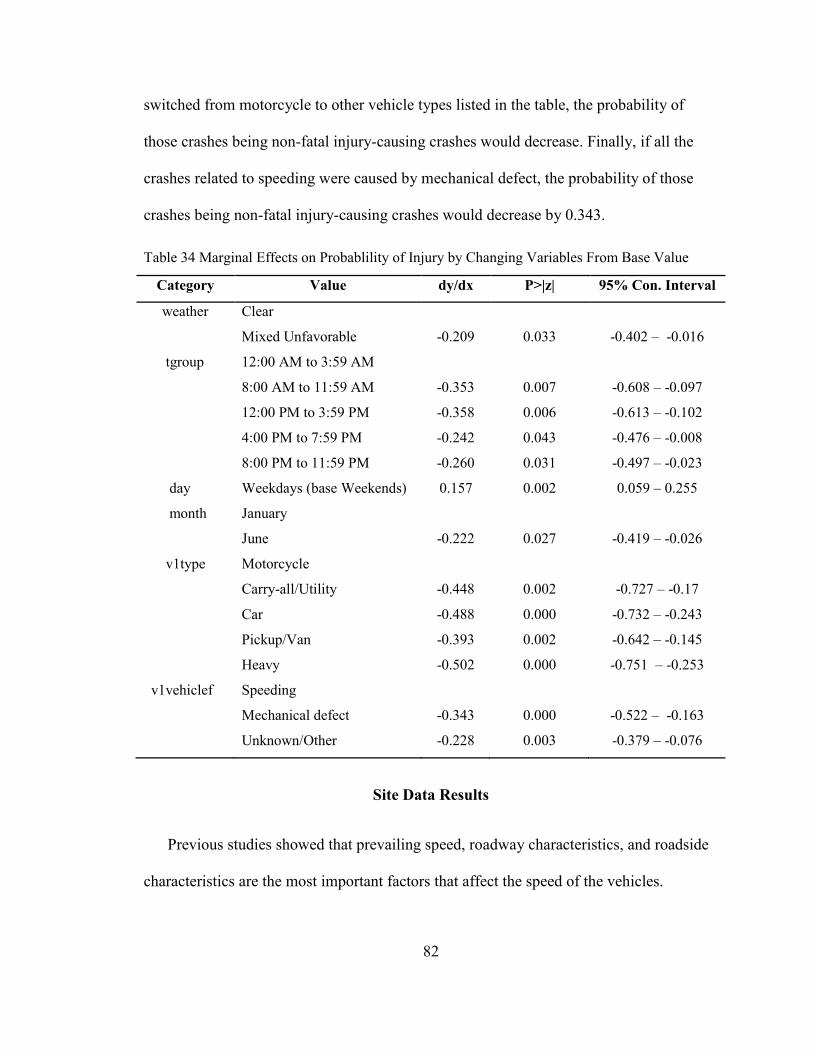
82
switched from motorcycle to other vehicle types listed in the table, the probability of
those crashes being non-fatal injury-causing crashes would decrease. Finally, if all the
crashes related to speeding were caused by mechanical defect, the probability of those
crashes being non-fatal injury-causing crashes would decrease by 0.343.
Table 34 Marginal Effects on Probablility of Injury by Changing Variables From Base Value
Category Value dy/dx P>|z| 95% Con. Interval
weather Clear
Mixed Unfavorable -0.209 0.033 -0.402 – -0.016
tgroup 12:00 AM to 3:59 AM
8:00 AM to 11:59 AM -0.353 0.007 -0.608 – -0.097
12:00 PM to 3:59 PM -0.358 0.006 -0.613 – -0.102
4:00 PM to 7:59 PM -0.242 0.043 -0.476 – -0.008
8:00 PM to 11:59 PM -0.260 0.031 -0.497 – -0.023
day Weekdays (base Weekends) 0.157 0.002 0.059 – 0.255
month January
June -0.222 0.027 -0.419 – -0.026
v1type Motorcycle
Carry-all/Utility -0.448 0.002 -0.727 – -0.17
Car -0.488 0.000 -0.732 – -0.243
Pickup/Van -0.393 0.002 -0.642 – -0.145
Heavy -0.502 0.000 -0.751 – -0.253
v1vehiclef Speeding
Mechanical defect -0.343 0.000 -0.522 – -0.163
Unknown/Other -0.228 0.003 -0.379 – -0.076
Site Data Results
Previous studies showed that prevailing speed, roadway characteristics, and roadside
characteristics are the most important factors that affect the speed of the vehicles.
83
Therefore, these factors are considered in most of the speed-zone guidelines and manuals
of state DOTs.
Some of the roadway and roadside characteristics collected during the field visit
included, the width of roadway, number of lanes, number of access roads, number of
buildings/houses/stores, the presence of pedestrian facilities, and the speed transition
zone. Drawings were prepared showing the transition zones, their lengths, and the
roadside environments, based on the data recorded in the field and the Google maps. The
site drawings are presented in appendix: SITE MAPS OF TOWNS UNDER STUDY.
Descriptive Statistics of Spot Speed Data
Table 35 shows that the 85th
percentile speeds of these towns were higher than the
posted speed limit in all the towns. The data also showed that mean speed was higher
than the posted speed limit in five towns, namely, Austin, Beatty, Fernley, Searchlight,
and Schurz. Also, the median speed was higher than the posted speed limit in Beatty,
Fernley, Searchlight, and Schurz. Except for Goldfield and Alamo, more than 15% of
traffic was travelling faster than the posted speed limit in all other towns. The percentage
of traffic exceeding the posted speed limit ranged from 12% in Alamo to 84% in Fernley.
For towns with a posted speed limit of 25 mph (Austin, Beatty, Fernley, Goldfield,
McGill, and Searchlight), the 85th
percentile speed ranged from 25 to 30 mph. The mean
speed as well as median speed for those towns ranged from 22 to 28 mph. The
cumulative spot speed graph used to calculate the 85th
percentile speed are presented in
appendix: CUMULATIVE SPOT SPEEDS AND 85TH
PERCENTILE SPEEDS .
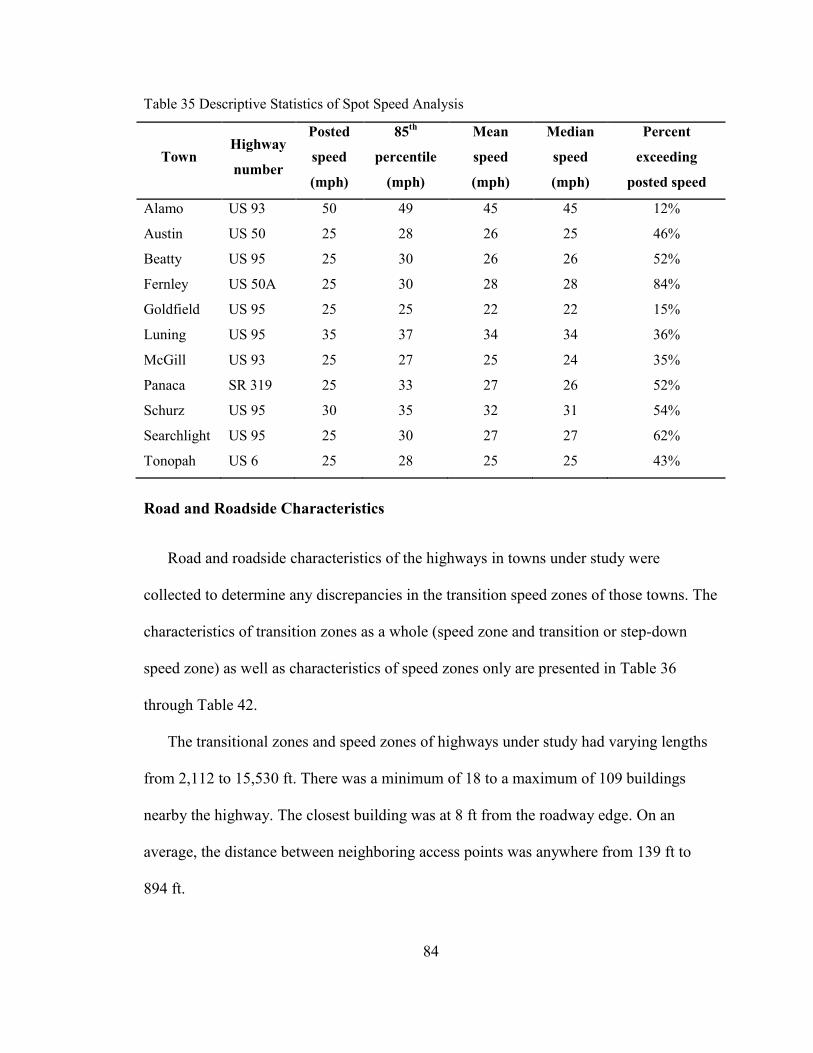
84
Table 35 Descriptive Statistics of Spot Speed Analysis
Town Highway
number
Posted
speed
(mph)
85th
percentile
(mph)
Mean
speed
(mph)
Median
speed
(mph)
Percent
exceeding
posted speed
Alamo US 93 50 49 45 45 12%
Austin US 50 25 28 26 25 46%
Beatty US 95 25 30 26 26 52%
Fernley US 50A 25 30 28 28 84%
Goldfield US 95 25 25 22 22 15%
Luning US 95 35 37 34 34 36%
McGill US 93 25 27 25 24 35%
Panaca SR 319 25 33 27 26 52%
Schurz US 95 30 35 32 31 54%
Searchlight US 95 25 30 27 27 62%
Tonopah US 6 25 28 25 25 43%
Road and Roadside Characteristics
Road and roadside characteristics of the highways in towns under study were
collected to determine any discrepancies in the transition speed zones of those towns. The
characteristics of transition zones as a whole (speed zone and transition or step-down
speed zone) as well as characteristics of speed zones only are presented in Table 36
through Table 42.
The transitional zones and speed zones of highways under study had varying lengths
from 2,112 to 15,530 ft. There was a minimum of 18 to a maximum of 109 buildings
nearby the highway. The closest building was at 8 ft from the roadway edge. On an
average, the distance between neighboring access points was anywhere from 139 ft to
894 ft.
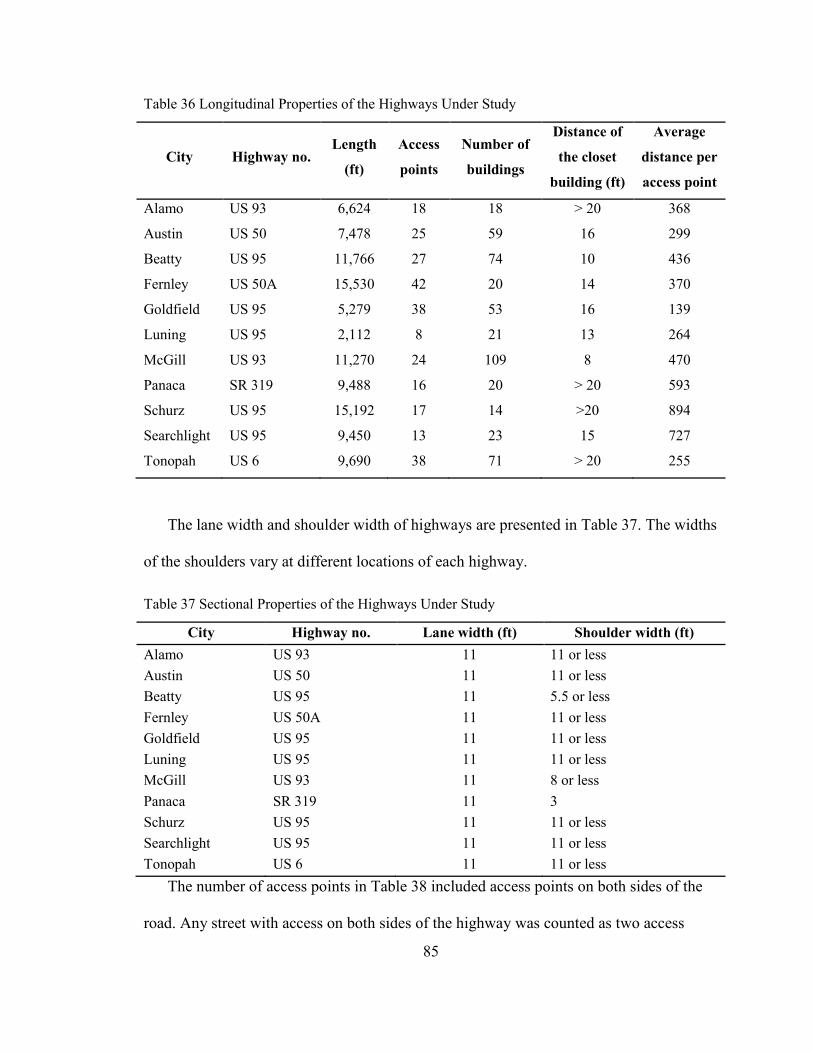
85
Table 36 Longitudinal Properties of the Highways Under Study
City Highway no. Length
(ft)
Access
points
Number of
buildings
Distance of
the closet
building (ft)
Average
distance per
access point
Alamo US 93 6,624 18 18 > 20 368
Austin US 50 7,478 25 59 16 299
Beatty US 95 11,766 27 74 10 436
Fernley US 50A 15,530 42 20 14 370
Goldfield US 95 5,279 38 53 16 139
Luning US 95 2,112 8 21 13 264
McGill US 93 11,270 24 109 8 470
Panaca SR 319 9,488 16 20 > 20 593
Schurz US 95 15,192 17 14 >20 894
Searchlight US 95 9,450 13 23 15 727
Tonopah US 6 9,690 38 71 > 20 255
The lane width and shoulder width of highways are presented in Table 37. The widths
of the shoulders vary at different locations of each highway.
Table 37 Sectional Properties of the Highways Under Study
City Highway no. Lane width (ft) Shoulder width (ft)
Alamo US 93 11 11 or less
Austin US 50 11 11 or less
Beatty US 95 11 5.5 or less
Fernley US 50A 11 11 or less
Goldfield US 95 11 11 or less
Luning US 95 11 11 or less
McGill US 93 11 8 or less
Panaca SR 319 11 3
Schurz US 95 11 11 or less
Searchlight US 95 11 11 or less
Tonopah US 6 11 11 or less
The number of access points in Table 38 included access points on both sides of the
road. Any street with access on both sides of the highway was counted as two access
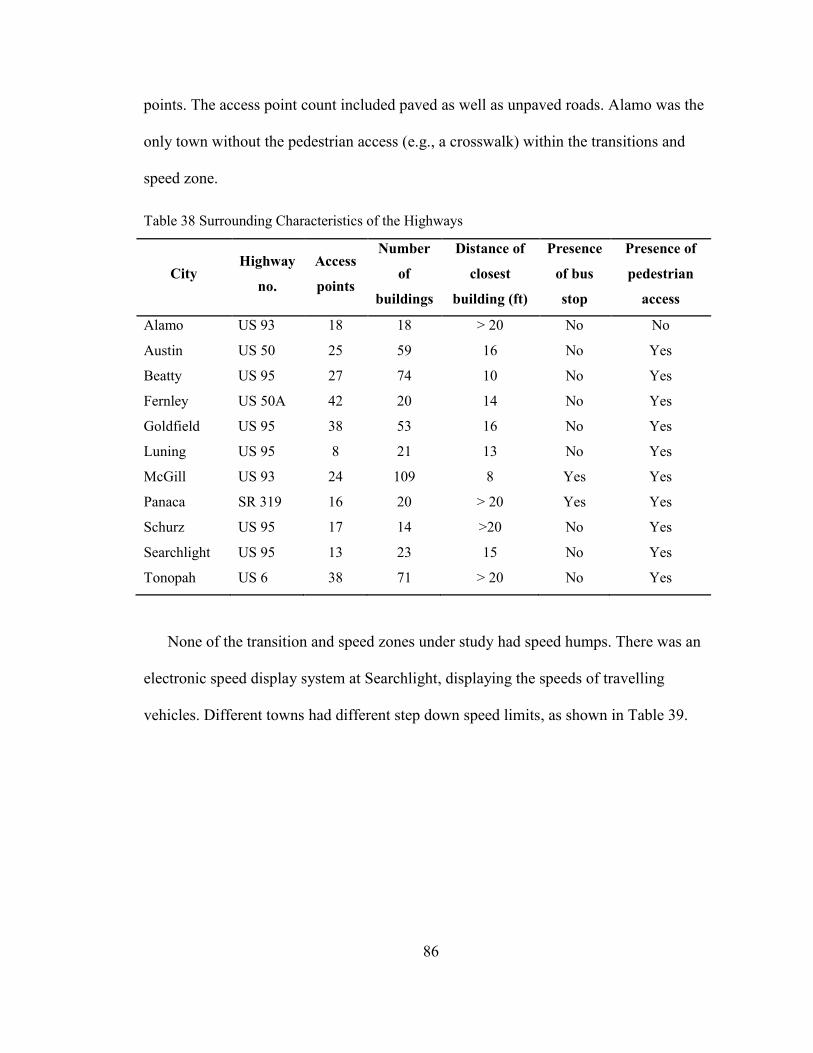
86
points. The access point count included paved as well as unpaved roads. Alamo was the
only town without the pedestrian access (e.g., a crosswalk) within the transitions and
speed zone.
Table 38 Surrounding Characteristics of the Highways
City Highway
no.
Access
points
Number
of
buildings
Distance of
closest
building (ft)
Presence
of bus
stop
Presence of
pedestrian
access
Alamo US 93 18 18 > 20 No No
Austin US 50 25 59 16 No Yes
Beatty US 95 27 74 10 No Yes
Fernley US 50A 42 20 14 No Yes
Goldfield US 95 38 53 16 No Yes
Luning US 95 8 21 13 No Yes
McGill US 93 24 109 8 Yes Yes
Panaca SR 319 16 20 > 20 Yes Yes
Schurz US 95 17 14 >20 No Yes
Searchlight US 95 13 23 15 No Yes
Tonopah US 6 38 71 > 20 No Yes
None of the transition and speed zones under study had speed humps. There was an
electronic speed display system at Searchlight, displaying the speeds of travelling
vehicles. Different towns had different step down speed limits, as shown in Table 39.
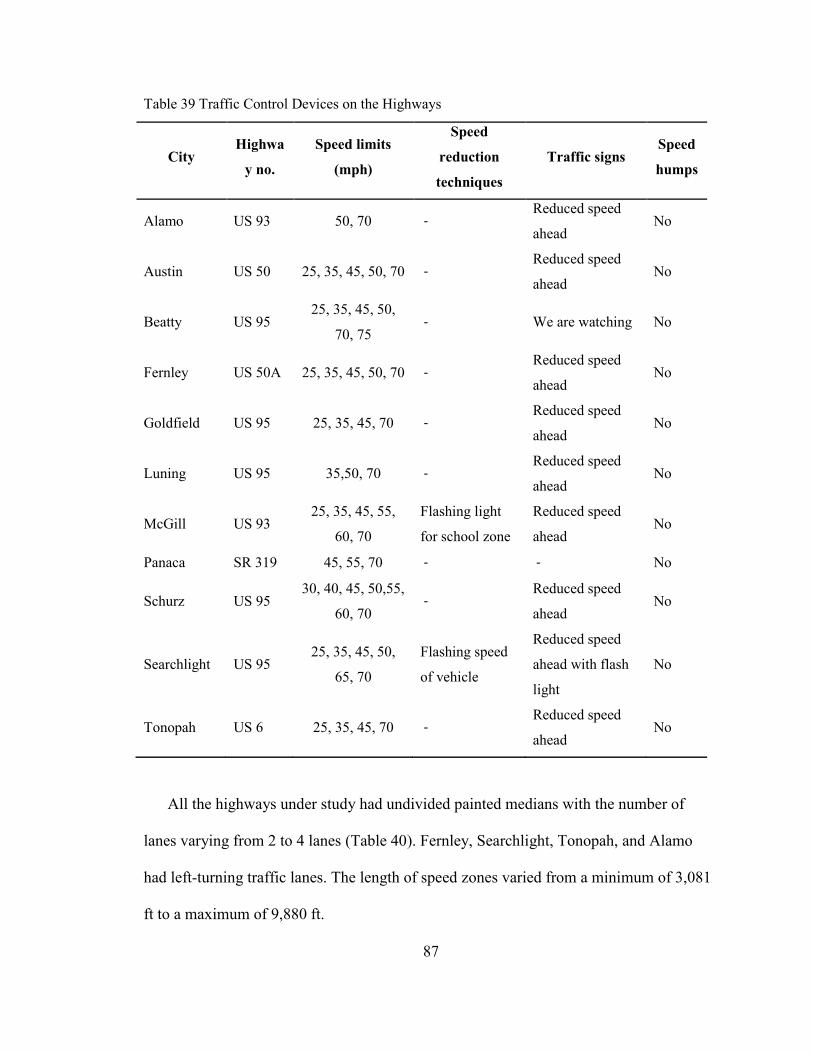
87
Table 39 Traffic Control Devices on the Highways
City Highwa
y no.
Speed limits
(mph)
Speed
reduction
techniques
Traffic signs Speed
humps
Alamo US 93 50, 70 - Reduced speed
ahead No
Austin US 50 25, 35, 45, 50, 70 - Reduced speed
ahead No
Beatty US 95 25, 35, 45, 50,
70, 75 - We are watching No
Fernley US 50A 25, 35, 45, 50, 70 - Reduced speed
ahead No
Goldfield US 95 25, 35, 45, 70 - Reduced speed
ahead No
Luning US 95 35,50, 70 - Reduced speed
ahead No
McGill US 93 25, 35, 45, 55,
60, 70
Flashing light
for school zone
Reduced speed
ahead No
Panaca SR 319 45, 55, 70 - - No
Schurz US 95 30, 40, 45, 50,55,
60, 70 -
Reduced speed
ahead No
Searchlight US 95 25, 35, 45, 50,
65, 70
Flashing speed
of vehicle
Reduced speed
ahead with flash
light
No
Tonopah US 6 25, 35, 45, 70 - Reduced speed
ahead No
All the highways under study had undivided painted medians with the number of
lanes varying from 2 to 4 lanes (Table 40). Fernley, Searchlight, Tonopah, and Alamo
had left-turning traffic lanes. The length of speed zones varied from a minimum of 3,081
ft to a maximum of 9,880 ft.
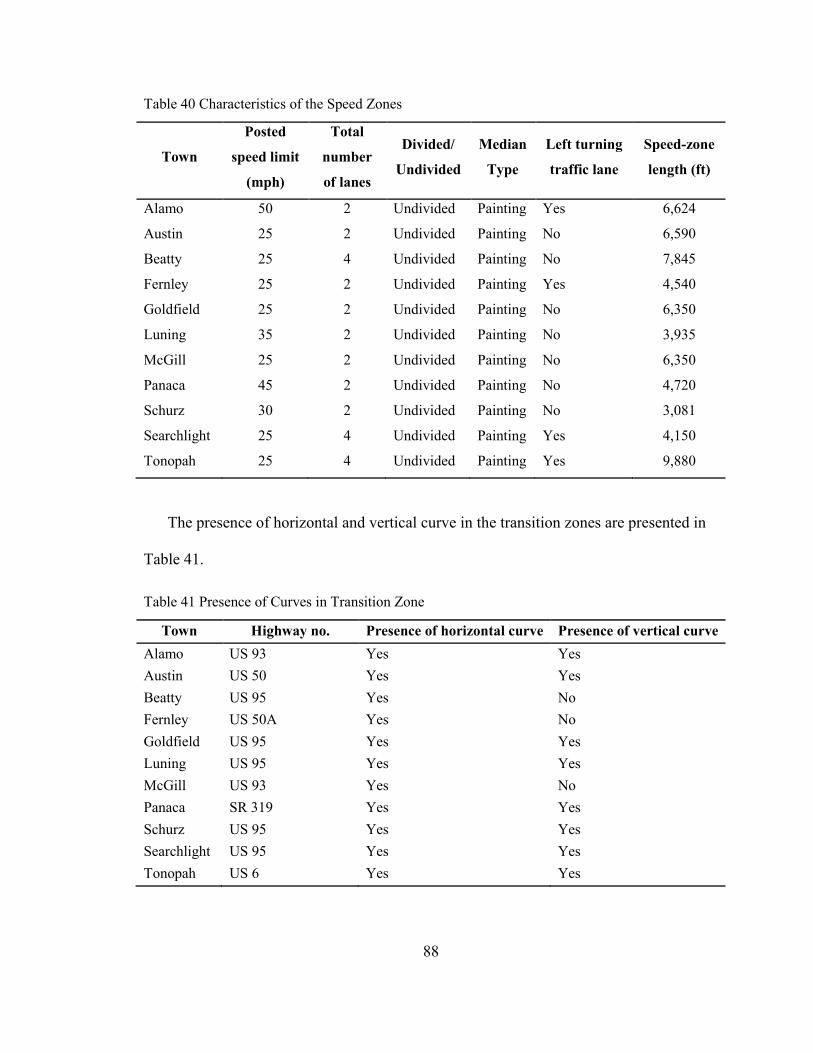
88
Table 40 Characteristics of the Speed Zones
Town
Posted
speed limit
(mph)
Total
number
of lanes
Divided/
Undivided
Median
Type
Left turning
traffic lane
Speed-zone
length (ft)
Alamo 50 2 Undivided Painting Yes 6,624
Austin 25 2 Undivided Painting No 6,590
Beatty 25 4 Undivided Painting No 7,845
Fernley 25 2 Undivided Painting Yes 4,540
Goldfield 25 2 Undivided Painting No 6,350
Luning 35 2 Undivided Painting No 3,935
McGill 25 2 Undivided Painting No 6,350
Panaca 45 2 Undivided Painting No 4,720
Schurz 30 2 Undivided Painting No 3,081
Searchlight 25 4 Undivided Painting Yes 4,150
Tonopah 25 4 Undivided Painting Yes 9,880
The presence of horizontal and vertical curve in the transition zones are presented in
Table 41.
Table 41 Presence of Curves in Transition Zone
Town Highway no. Presence of horizontal curve Presence of vertical curve
Alamo US 93 Yes Yes
Austin US 50 Yes Yes
Beatty US 95 Yes No
Fernley US 50A Yes No
Goldfield US 95 Yes Yes
Luning US 95 Yes Yes
McGill US 93 Yes No
Panaca SR 319 Yes Yes
Schurz US 95 Yes Yes
Searchlight US 95 Yes Yes
Tonopah US 6 Yes Yes
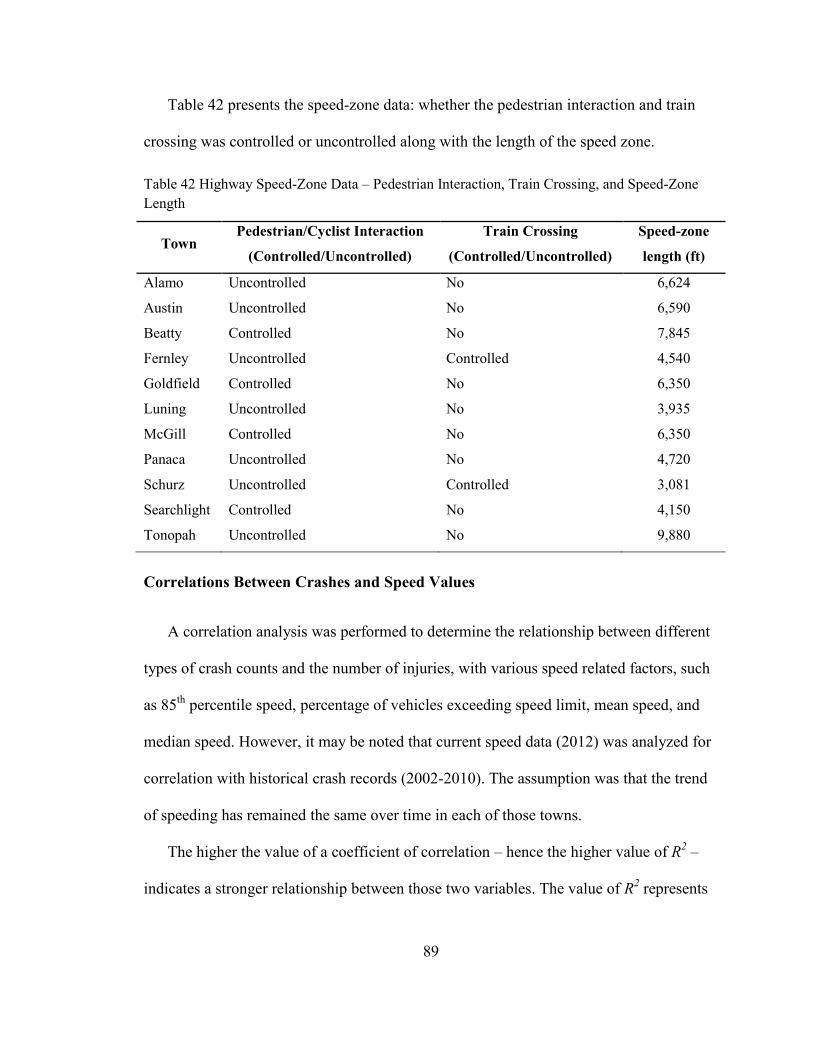
89
Table 42 presents the speed-zone data: whether the pedestrian interaction and train
crossing was controlled or uncontrolled along with the length of the speed zone.
Table 42 Highway Speed-Zone Data – Pedestrian Interaction, Train Crossing, and Speed-Zone
Length
Town Pedestrian/Cyclist Interaction
(Controlled/Uncontrolled)
Train Crossing
(Controlled/Uncontrolled)
Speed-zone
length (ft)
Alamo Uncontrolled No 6,624
Austin Uncontrolled No 6,590
Beatty Controlled No 7,845
Fernley Uncontrolled Controlled 4,540
Goldfield Controlled No 6,350
Luning Uncontrolled No 3,935
McGill Controlled No 6,350
Panaca Uncontrolled No 4,720
Schurz Uncontrolled Controlled 3,081
Searchlight Controlled No 4,150
Tonopah Uncontrolled No 9,880
Correlations Between Crashes and Speed Values
A correlation analysis was performed to determine the relationship between different
types of crash counts and the number of injuries, with various speed related factors, such
as 85th
percentile speed, percentage of vehicles exceeding speed limit, mean speed, and
median speed. However, it may be noted that current speed data (2012) was analyzed for
correlation with historical crash records (2002-2010). The assumption was that the trend
of speeding has remained the same over time in each of those towns.
The higher the value of a coefficient of correlation – hence the higher value of R2 –
indicates a stronger relationship between those two variables. The value of R2 represents
90
the percentage of the change in value of dependent variable, as explained by that
particular independent variable.
Overview of all coefficients of correlations.
The coefficient of correlation shows the relationship between two variables. A
positive value of coefficient of correlation represents that an increase in value of one
variable increases the value of the other variable, and vice versa. Table 43 shows that all
the crash parameters under study have a negative correlation with all the speed
parameters under study except the percentage exceeding the posted speed. Thus the
increase in percentages exceeding the posted speed increases the number of different
types of crashes. This correlation is significant at alpha level 0.05, except for non-fatal
injury-causing crashes. The tabulated data as well as corresponding scatterplots are
presented in appendix: CORRELATION COEFFICIENTS BETWEEN CRASHES AND
SPEED VALUES.
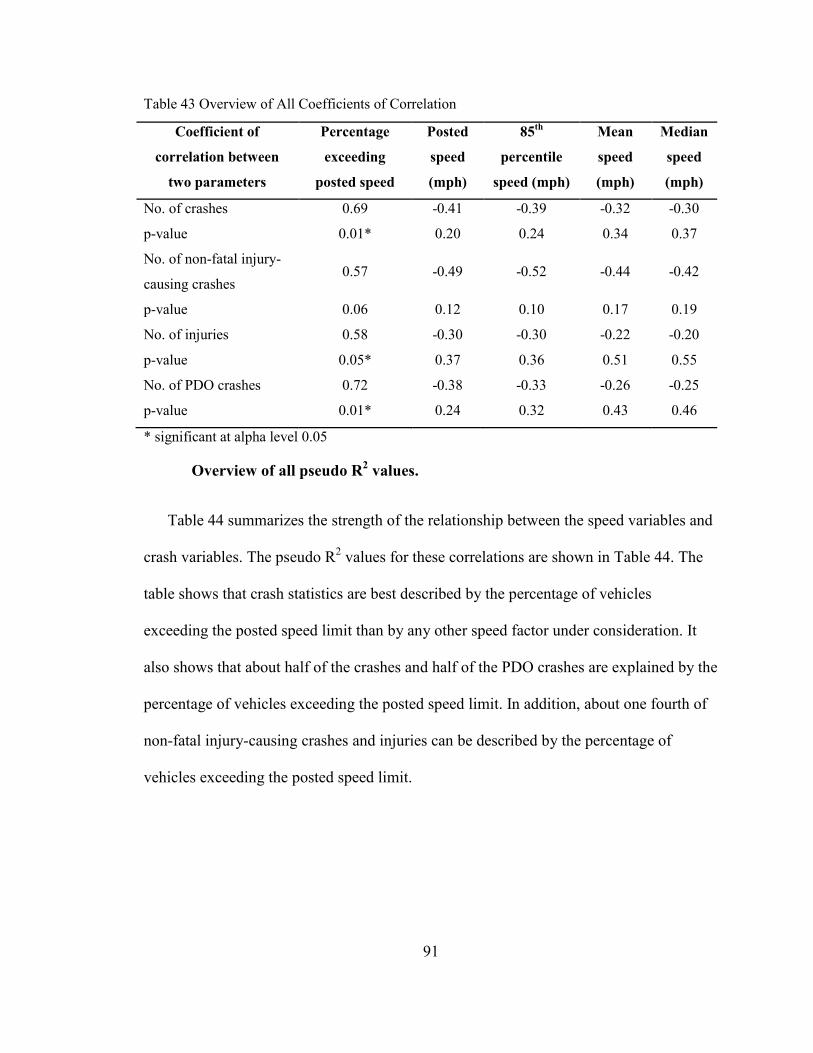
91
Table 43 Overview of All Coefficients of Correlation
Coefficient of
correlation between
two parameters
Percentage
exceeding
posted speed
Posted
speed
(mph)
85th
percentile
speed (mph)
Mean
speed
(mph)
Median
speed
(mph)
No. of crashes 0.69 -0.41 -0.39 -0.32 -0.30
p-value 0.01* 0.20 0.24 0.34 0.37
No. of non-fatal injury-
causing crashes 0.57 -0.49 -0.52 -0.44 -0.42
p-value 0.06 0.12 0.10 0.17 0.19
No. of injuries 0.58 -0.30 -0.30 -0.22 -0.20
p-value 0.05* 0.37 0.36 0.51 0.55
No. of PDO crashes 0.72 -0.38 -0.33 -0.26 -0.25
p-value 0.01* 0.24 0.32 0.43 0.46
* significant at alpha level 0.05
Overview of all pseudo R2 values.
Table 44 summarizes the strength of the relationship between the speed variables and
crash variables. The pseudo R2 values for these correlations are shown in Table 44. The
table shows that crash statistics are best described by the percentage of vehicles
exceeding the posted speed limit than by any other speed factor under consideration. It
also shows that about half of the crashes and half of the PDO crashes are explained by the
percentage of vehicles exceeding the posted speed limit. In addition, about one fourth of
non-fatal injury-causing crashes and injuries can be described by the percentage of
vehicles exceeding the posted speed limit.
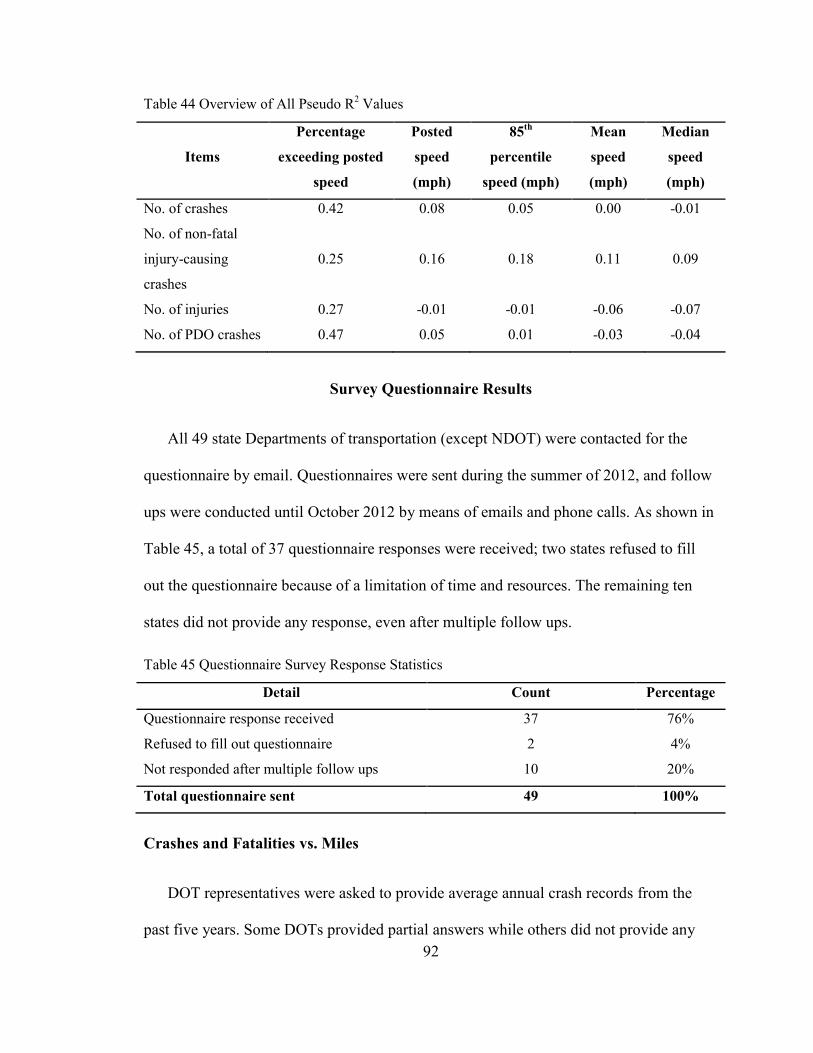
92
Table 44 Overview of All Pseudo R2 Values
Items
Percentage
exceeding posted
speed
Posted
speed
(mph)
85th
percentile
speed (mph)
Mean
speed
(mph)
Median
speed
(mph)
No. of crashes 0.42 0.08 0.05 0.00 -0.01
No. of non-fatal
injury-causing
crashes
0.25 0.16 0.18 0.11 0.09
No. of injuries 0.27 -0.01 -0.01 -0.06 -0.07
No. of PDO crashes 0.47 0.05 0.01 -0.03 -0.04
Survey Questionnaire Results
All 49 state Departments of transportation (except NDOT) were contacted for the
questionnaire by email. Questionnaires were sent during the summer of 2012, and follow
ups were conducted until October 2012 by means of emails and phone calls. As shown in
Table 45, a total of 37 questionnaire responses were received; two states refused to fill
out the questionnaire because of a limitation of time and resources. The remaining ten
states did not provide any response, even after multiple follow ups.
Table 45 Questionnaire Survey Response Statistics
Detail Count Percentage
Questionnaire response received 37 76%
Refused to fill out questionnaire 2 4%
Not responded after multiple follow ups 10 20%
Total questionnaire sent 49 100%
Crashes and Fatalities vs. Miles
DOT representatives were asked to provide average annual crash records from the
past five years. Some DOTs provided partial answers while others did not provide any
93
numbers. Also, few DOTs provided data based on fewer than 5 years duration. Table 46
lists the statistics provided by the DOTs. North Carolina had 73,000 miles of rural state
highways, which is more than any other state’s rural state highway mileage. Rhode Island
had only 400 miles of rural state highways, which is the least of all.
A general overview of crash statistics is presented in Table 47. Michigan had the
highest average annual crashes per 1,000 miles on rural state highways, while Maine had
the lowest average annual crashes per 1,000 miles. Similarly, Arizona had the highest
average annual fatalities per 1,000 miles on rural state highway, while Maine had the
lowest. Seventy-five percent of crashes in West Virginia occurred on rural state
highways. Only one percent of crashes in Massachusetts occurred on rural state
highways. It also can be seen that 89% of the total fatalities occurred in rural highways in
Montana which is the highest among all. Massachusetts had only 4% of the total crashes
that occurred on rural state highways which is the least among all.
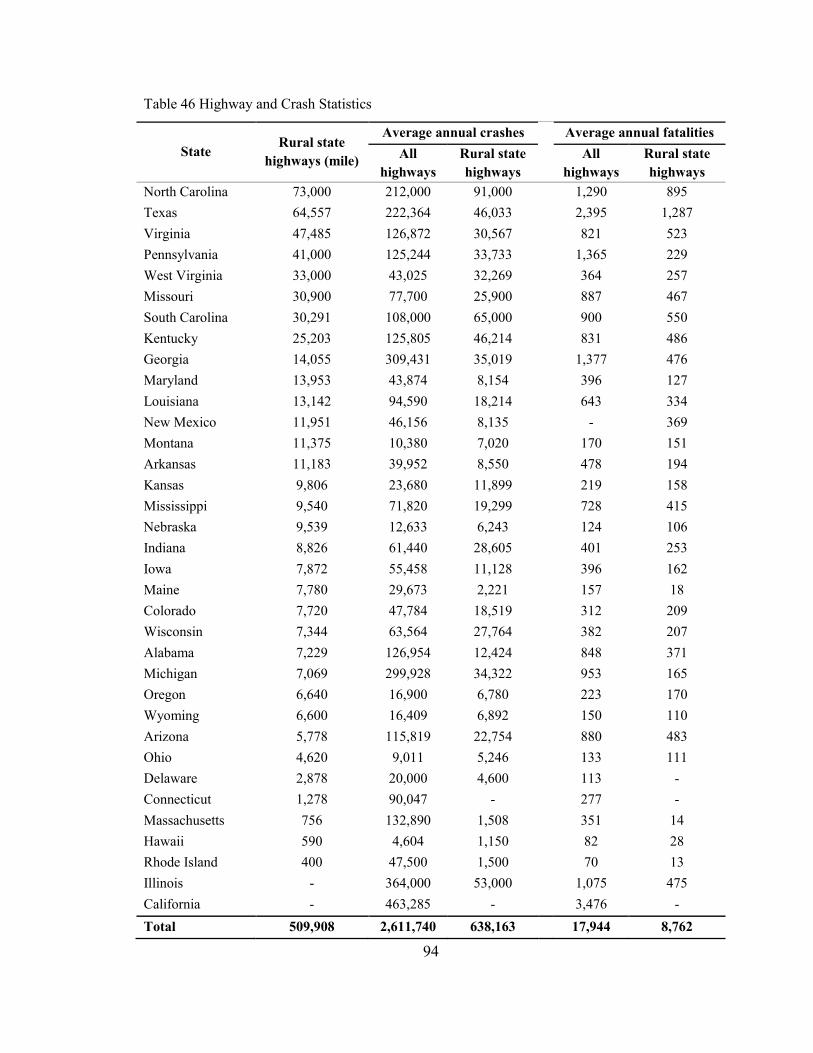
94
Table 46 Highway and Crash Statistics
State Rural state
highways (mile)
Average annual crashes Average annual fatalities
All
highways
Rural state
highways
All
highways
Rural state
highways
North Carolina 73,000 212,000 91,000 1,290 895
Texas 64,557 222,364 46,033 2,395 1,287
Virginia 47,485 126,872 30,567 821 523
Pennsylvania 41,000 125,244 33,733 1,365 229
West Virginia 33,000 43,025 32,269 364 257
Missouri 30,900 77,700 25,900 887 467
South Carolina 30,291 108,000 65,000 900 550
Kentucky 25,203 125,805 46,214 831 486
Georgia 14,055 309,431 35,019 1,377 476
Maryland 13,953 43,874 8,154 396 127
Louisiana 13,142 94,590 18,214 643 334
New Mexico 11,951 46,156 8,135 - 369
Montana 11,375 10,380 7,020 170 151
Arkansas 11,183 39,952 8,550 478 194
Kansas 9,806 23,680 11,899 219 158
Mississippi 9,540 71,820 19,299 728 415
Nebraska 9,539 12,633 6,243 124 106
Indiana 8,826 61,440 28,605 401 253
Iowa 7,872 55,458 11,128 396 162
Maine 7,780 29,673 2,221 157 18
Colorado 7,720 47,784 18,519 312 209
Wisconsin 7,344 63,564 27,764 382 207
Alabama 7,229 126,954 12,424 848 371
Michigan 7,069 299,928 34,322 953 165
Oregon 6,640 16,900 6,780 223 170
Wyoming 6,600 16,409 6,892 150 110
Arizona 5,778 115,819 22,754 880 483
Ohio 4,620 9,011 5,246 133 111
Delaware 2,878 20,000 4,600 113 -
Connecticut 1,278 90,047 - 277 -
Massachusetts 756 132,890 1,508 351 14
Hawaii 590 4,604 1,150 82 28
Rhode Island 400 47,500 1,500 70 13
Illinois - 364,000 53,000 1,075 475
California - 463,285 - 3,476 -
Total 509,908 2,611,740 638,163 17,944 8,762
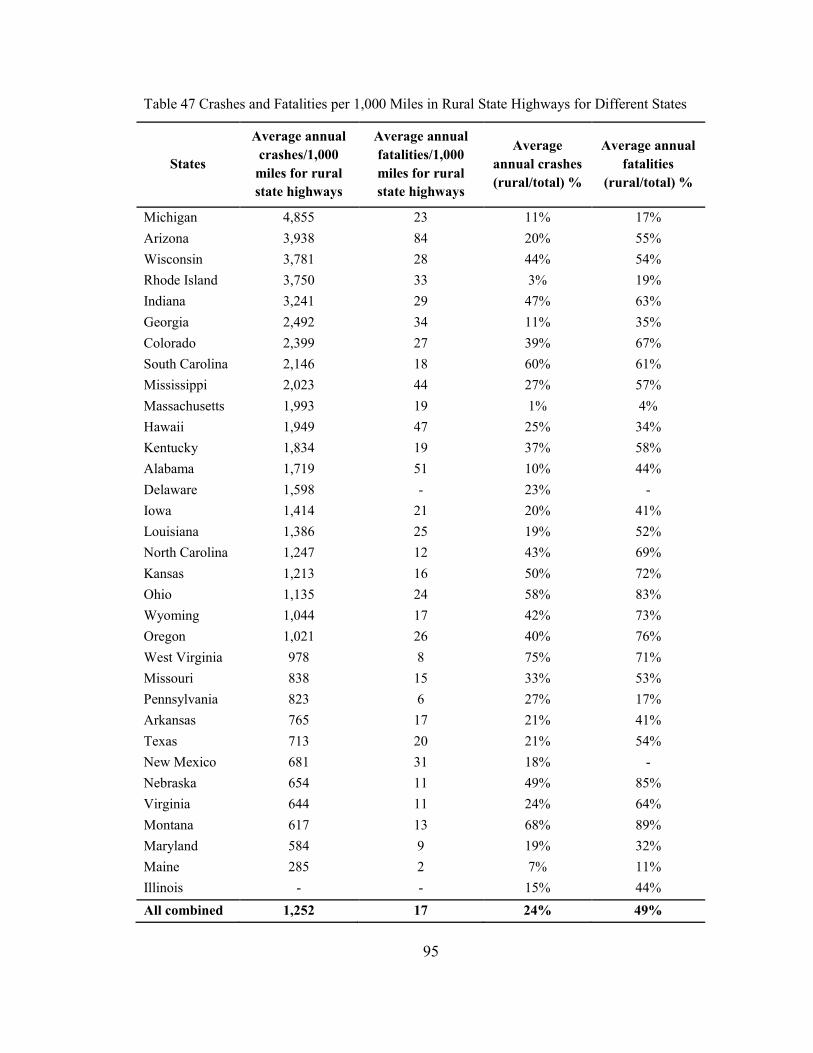
95
Table 47 Crashes and Fatalities per 1,000 Miles in Rural State Highways for Different States
States
Average annual
crashes/1,000
miles for rural
state highways
Average annual
fatalities/1,000
miles for rural
state highways
Average
annual crashes
(rural/total) %
Average annual
fatalities
(rural/total) %
Michigan 4,855 23 11% 17%
Arizona 3,938 84 20% 55%
Wisconsin 3,781 28 44% 54%
Rhode Island 3,750 33 3% 19%
Indiana 3,241 29 47% 63%
Georgia 2,492 34 11% 35%
Colorado 2,399 27 39% 67%
South Carolina 2,146 18 60% 61%
Mississippi 2,023 44 27% 57%
Massachusetts 1,993 19 1% 4%
Hawaii 1,949 47 25% 34%
Kentucky 1,834 19 37% 58%
Alabama 1,719 51 10% 44%
Delaware 1,598 - 23% -
Iowa 1,414 21 20% 41%
Louisiana 1,386 25 19% 52%
North Carolina 1,247 12 43% 69%
Kansas 1,213 16 50% 72%
Ohio 1,135 24 58% 83%
Wyoming 1,044 17 42% 73%
Oregon 1,021 26 40% 76%
West Virginia 978 8 75% 71%
Missouri 838 15 33% 53%
Pennsylvania 823 6 27% 17%
Arkansas 765 17 21% 41%
Texas 713 20 21% 54%
New Mexico 681 31 18% -
Nebraska 654 11 49% 85%
Virginia 644 11 24% 64%
Montana 617 13 68% 89%
Maryland 584 9 19% 32%
Maine 285 2 7% 11%
Illinois - - 15% 44%
All combined 1,252 17 24% 49%
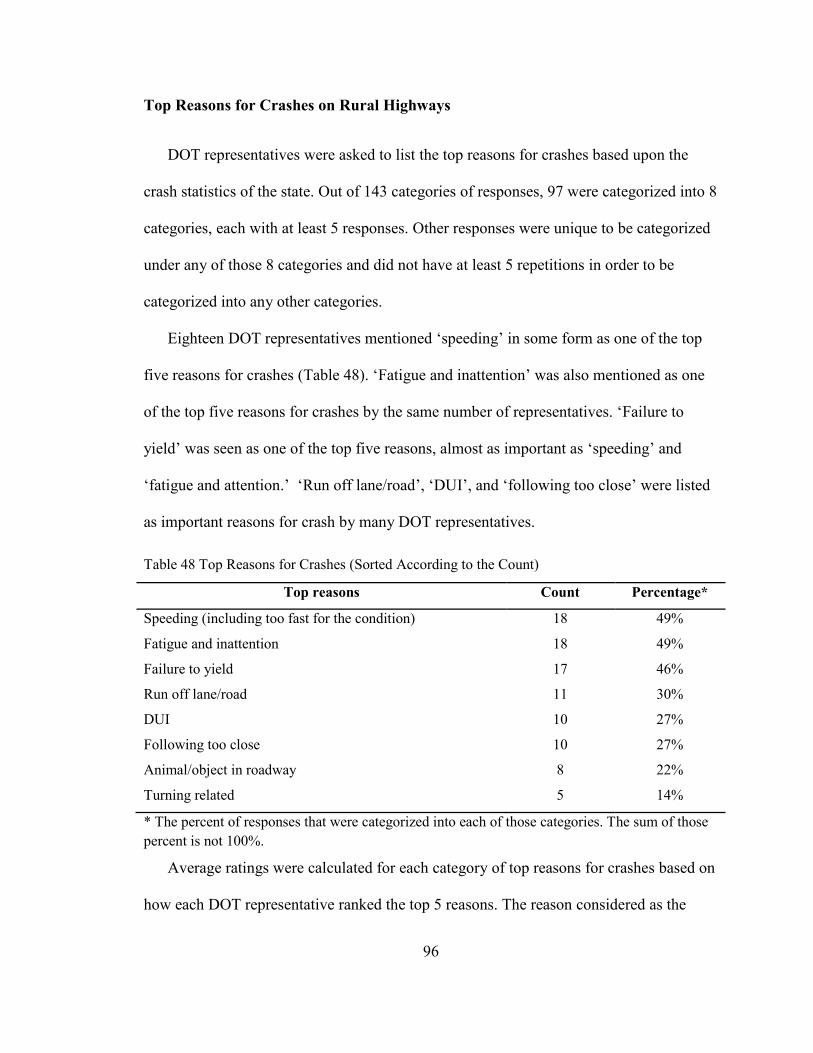
96
Top Reasons for Crashes on Rural Highways
DOT representatives were asked to list the top reasons for crashes based upon the
crash statistics of the state. Out of 143 categories of responses, 97 were categorized into 8
categories, each with at least 5 responses. Other responses were unique to be categorized
under any of those 8 categories and did not have at least 5 repetitions in order to be
categorized into any other categories.
Eighteen DOT representatives mentioned ‘speeding’ in some form as one of the top
five reasons for crashes (Table 48). ‘Fatigue and inattention’ was also mentioned as one
of the top five reasons for crashes by the same number of representatives. ‘Failure to
yield’ was seen as one of the top five reasons, almost as important as ‘speeding’ and
‘fatigue and attention.’ ‘Run off lane/road’, ‘DUI’, and ‘following too close’ were listed
as important reasons for crash by many DOT representatives.
Table 48 Top Reasons for Crashes (Sorted According to the Count)
Top reasons Count Percentage*
Speeding (including too fast for the condition) 18 49%
Fatigue and inattention 18 49%
Failure to yield 17 46%
Run off lane/road 11 30%
DUI 10 27%
Following too close 10 27%
Animal/object in roadway 8 22%
Turning related 5 14%
* The percent of responses that were categorized into each of those categories. The sum of those
percent is not 100%.
Average ratings were calculated for each category of top reasons for crashes based on
how each DOT representative ranked the top 5 reasons. The reason considered as the
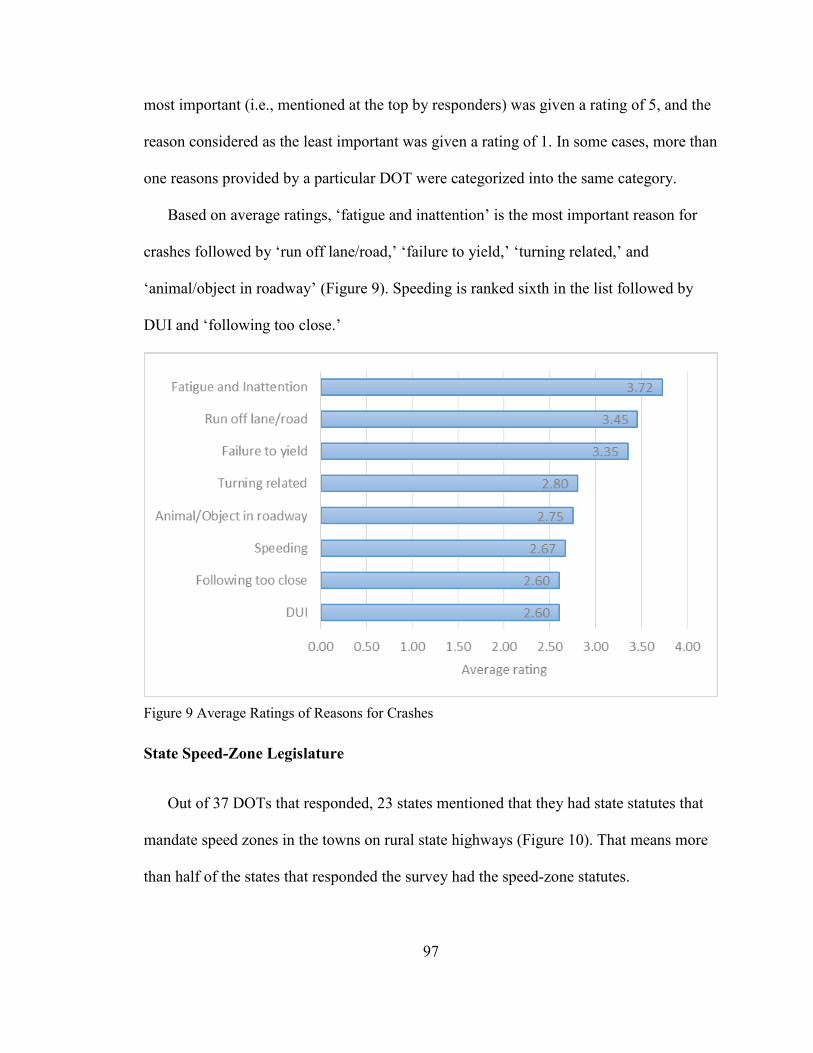
97
most important (i.e., mentioned at the top by responders) was given a rating of 5, and the
reason considered as the least important was given a rating of 1. In some cases, more than
one reasons provided by a particular DOT were categorized into the same category.
Based on average ratings, ‘fatigue and inattention’ is the most important reason for
crashes followed by ‘run off lane/road,’ ‘failure to yield,’ ‘turning related,’ and
‘animal/object in roadway’ (Figure 9). Speeding is ranked sixth in the list followed by
DUI and ‘following too close.’
Figure 9 Average Ratings of Reasons for Crashes
State Speed-Zone Legislature
Out of 37 DOTs that responded, 23 states mentioned that they had state statutes that
mandate speed zones in the towns on rural state highways (Figure 10). That means more
than half of the states that responded the survey had the speed-zone statutes.
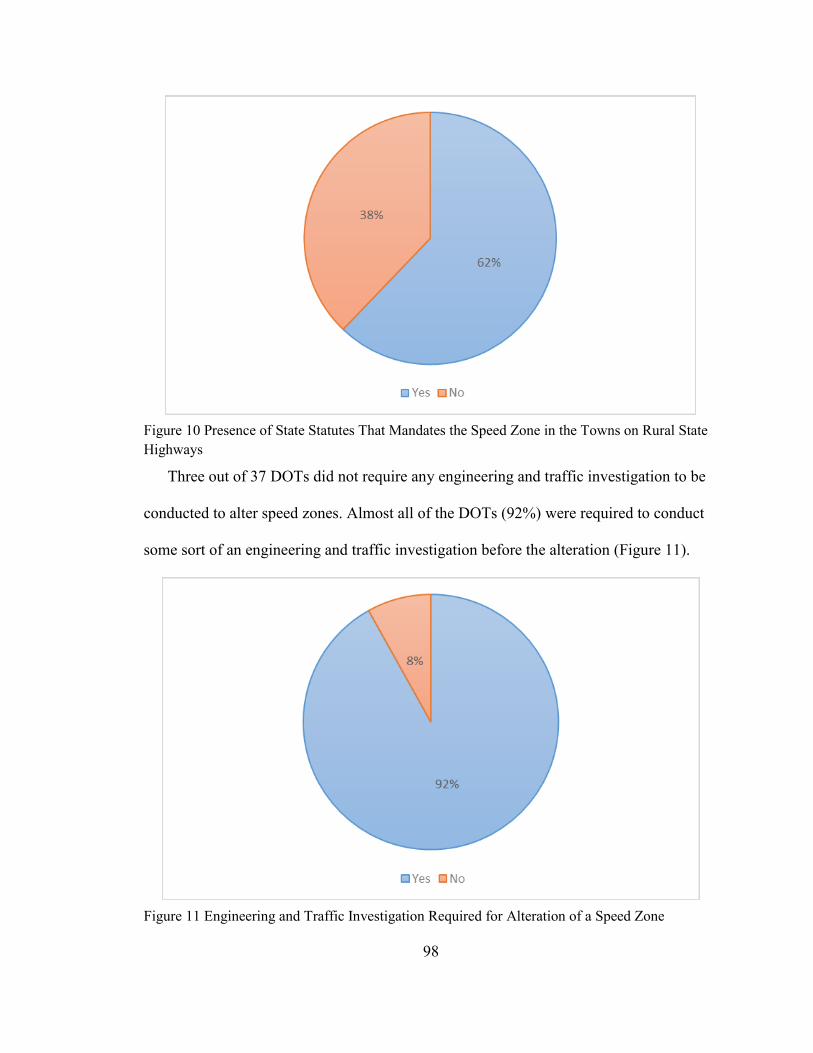
98
Figure 10 Presence of State Statutes That Mandates the Speed Zone in the Towns on Rural State
Highways
Three out of 37 DOTs did not require any engineering and traffic investigation to be
conducted to alter speed zones. Almost all of the DOTs (92%) were required to conduct
some sort of an engineering and traffic investigation before the alteration (Figure 11).
Figure 11 Engineering and Traffic Investigation Required for Alteration of a Speed Zone
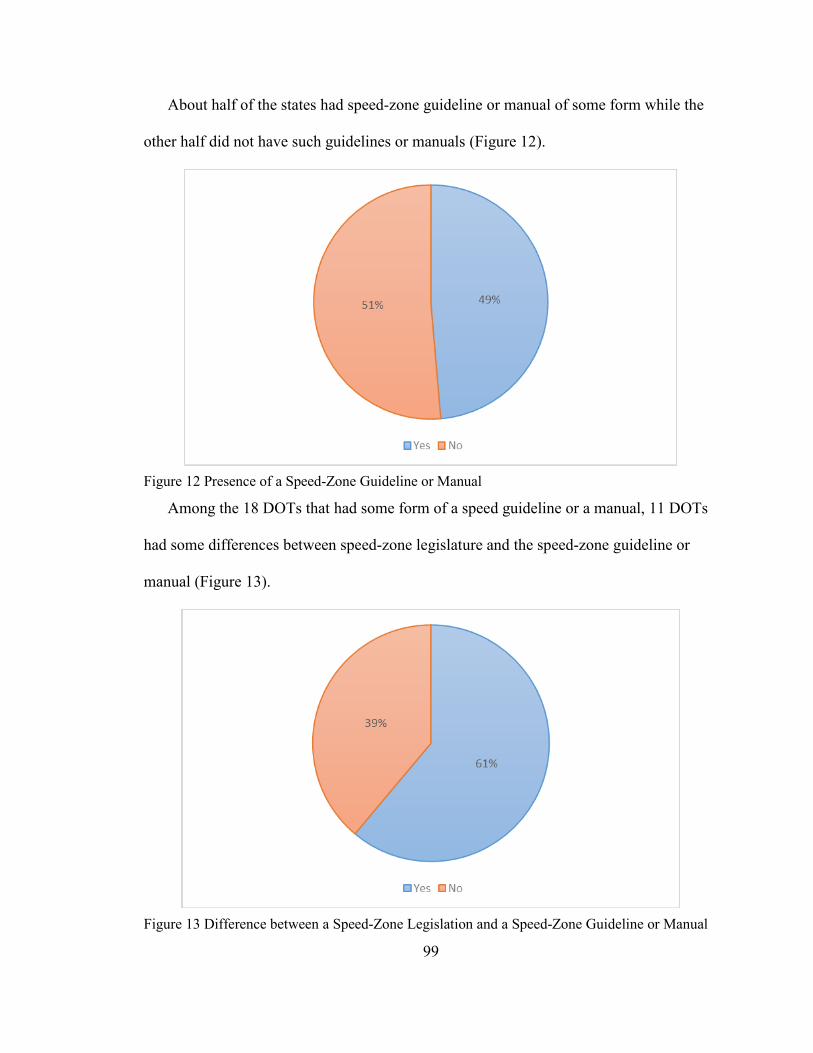
99
About half of the states had speed-zone guideline or manual of some form while the
other half did not have such guidelines or manuals (Figure 12).
Figure 12 Presence of a Speed-Zone Guideline or Manual
Among the 18 DOTs that had some form of a speed guideline or a manual, 11 DOTs
had some differences between speed-zone legislature and the speed-zone guideline or
manual (Figure 13).
Figure 13 Difference between a Speed-Zone Legislation and a Speed-Zone Guideline or Manual
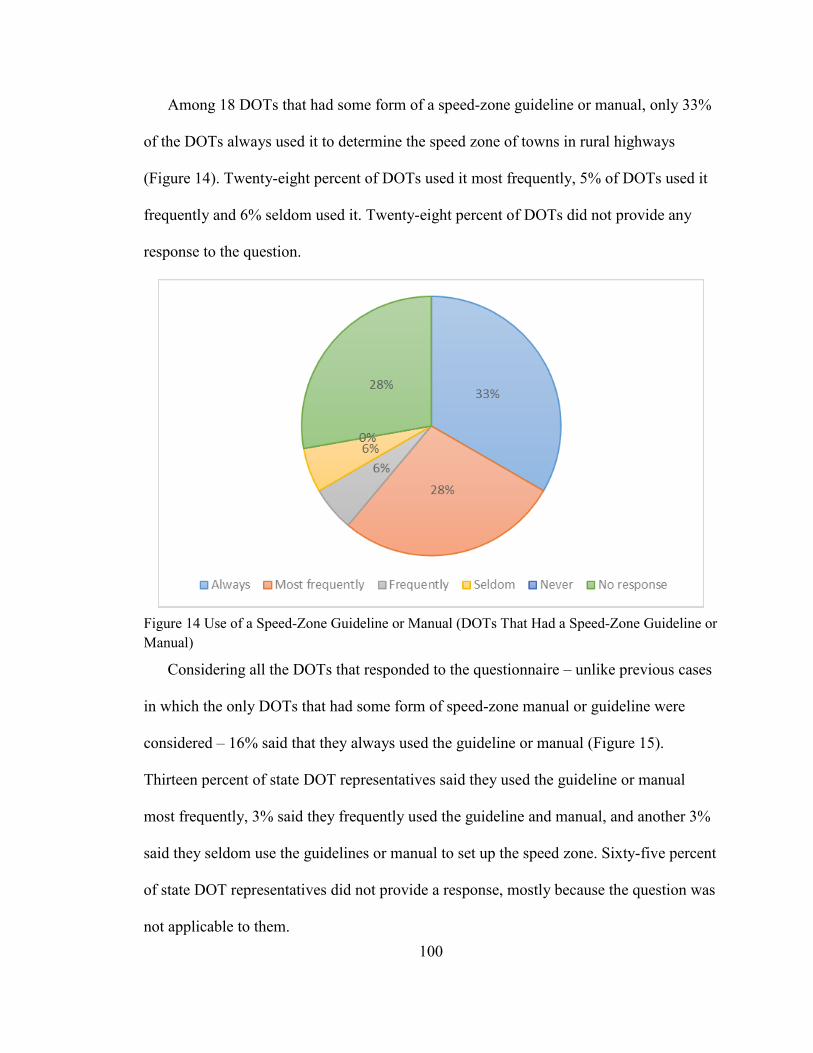
100
Among 18 DOTs that had some form of a speed-zone guideline or manual, only 33%
of the DOTs always used it to determine the speed zone of towns in rural highways
(Figure 14). Twenty-eight percent of DOTs used it most frequently, 5% of DOTs used it
frequently and 6% seldom used it. Twenty-eight percent of DOTs did not provide any
response to the question.
Figure 14 Use of a Speed-Zone Guideline or Manual (DOTs That Had a Speed-Zone Guideline or
Manual)
Considering all the DOTs that responded to the questionnaire – unlike previous cases
in which the only DOTs that had some form of speed-zone manual or guideline were
considered – 16% said that they always used the guideline or manual (Figure 15).
Thirteen percent of state DOT representatives said they used the guideline or manual
most frequently, 3% said they frequently used the guideline and manual, and another 3%
said they seldom use the guidelines or manual to set up the speed zone. Sixty-five percent
of state DOT representatives did not provide a response, mostly because the question was
not applicable to them.
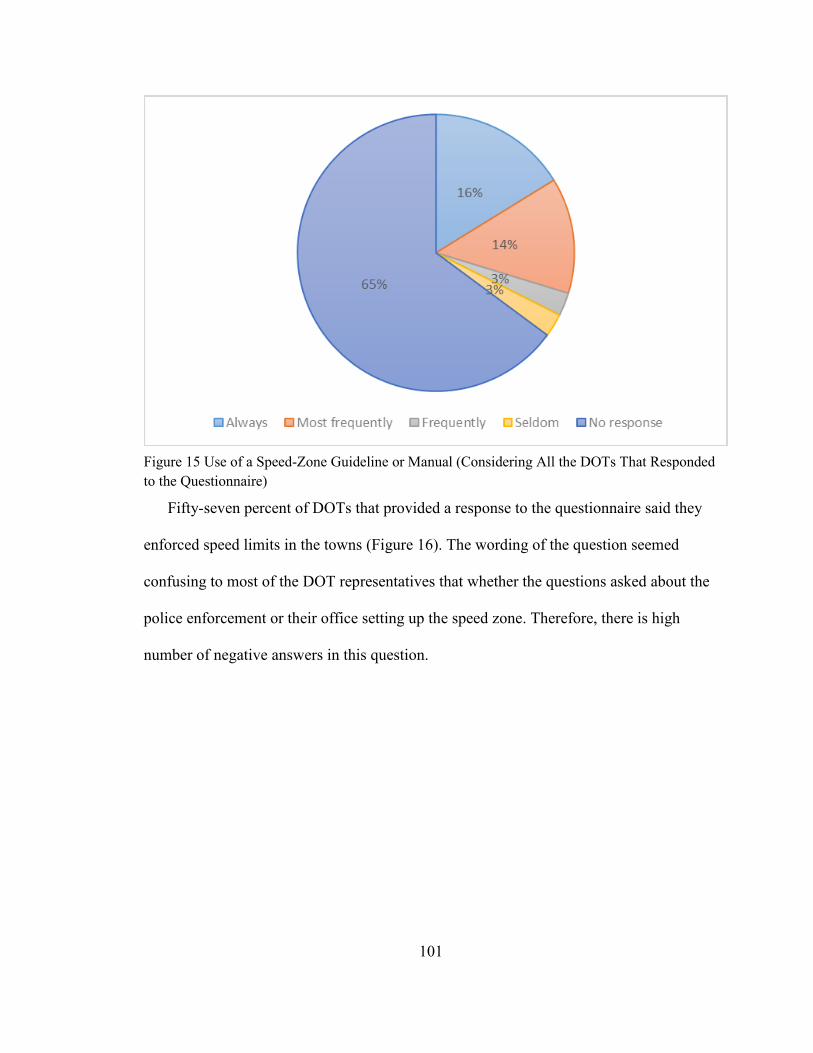
101
Figure 15 Use of a Speed-Zone Guideline or Manual (Considering All the DOTs That Responded
to the Questionnaire)
Fifty-seven percent of DOTs that provided a response to the questionnaire said they
enforced speed limits in the towns (Figure 16). The wording of the question seemed
confusing to most of the DOT representatives that whether the questions asked about the
police enforcement or their office setting up the speed zone. Therefore, there is high
number of negative answers in this question.
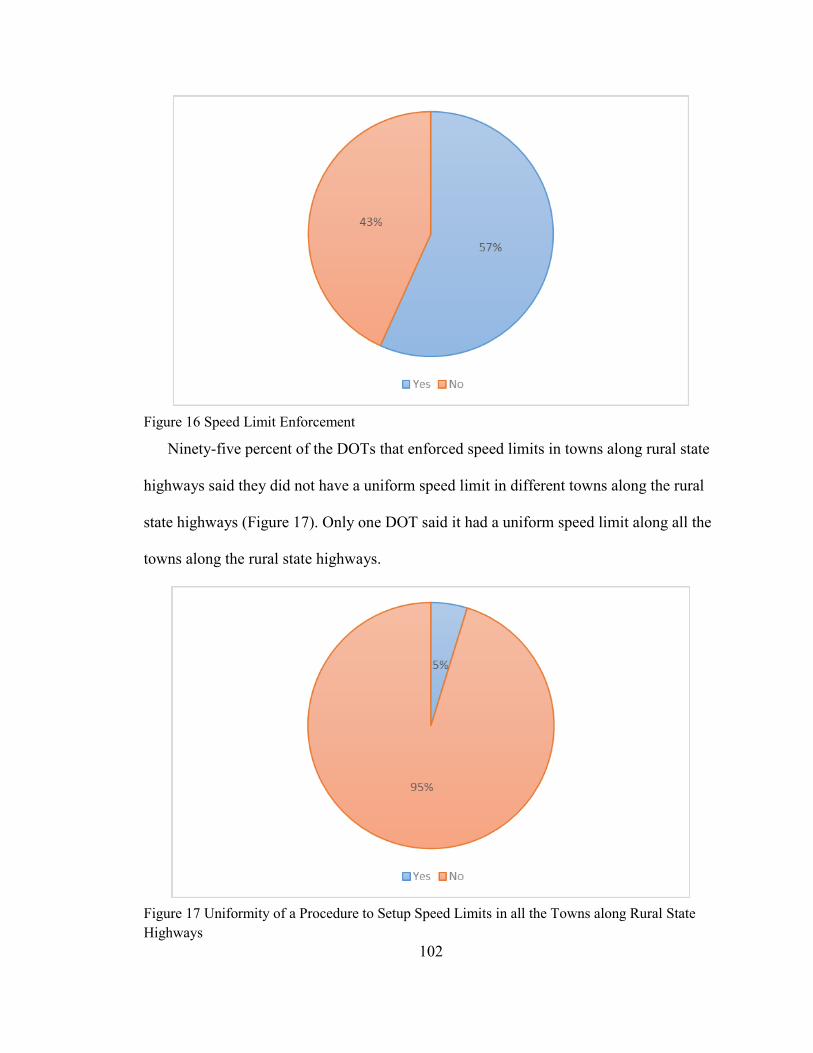
102
Figure 16 Speed Limit Enforcement
Ninety-five percent of the DOTs that enforced speed limits in towns along rural state
highways said they did not have a uniform speed limit in different towns along the rural
state highways (Figure 17). Only one DOT said it had a uniform speed limit along all the
towns along the rural state highways.
Figure 17 Uniformity of a Procedure to Setup Speed Limits in all the Towns along Rural State
Highways
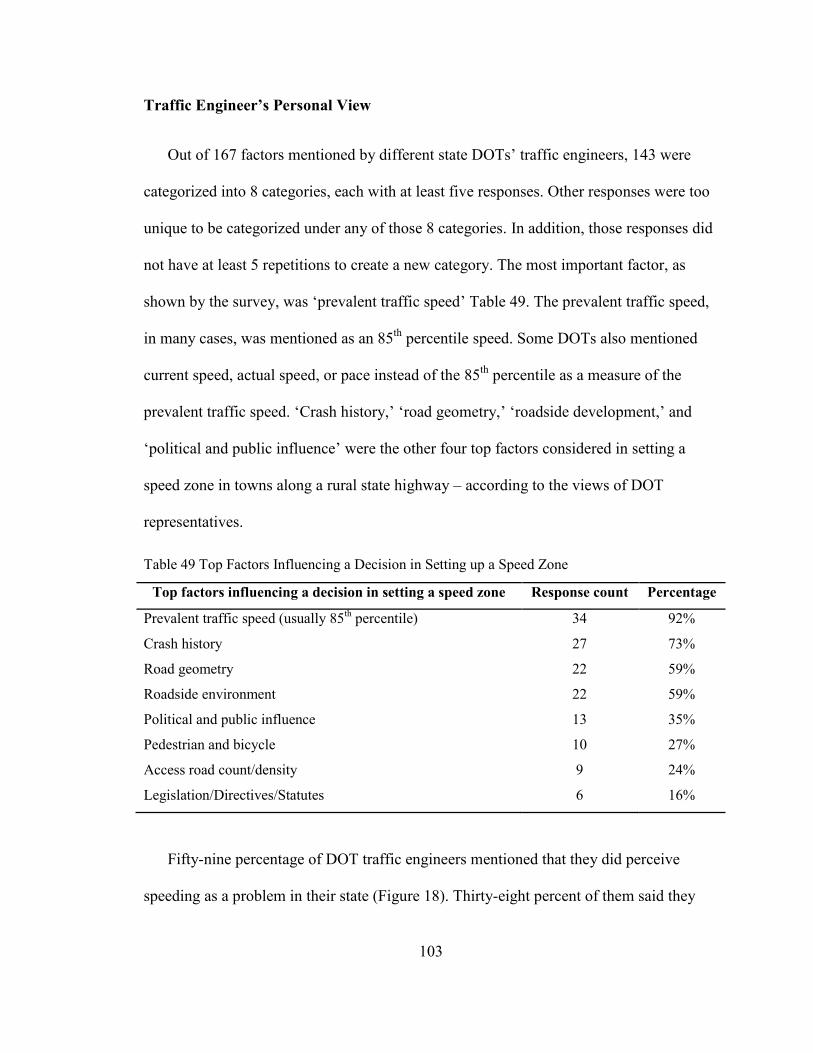
103
Traffic Engineer’s Personal View
Out of 167 factors mentioned by different state DOTs’ traffic engineers, 143 were
categorized into 8 categories, each with at least five responses. Other responses were too
unique to be categorized under any of those 8 categories. In addition, those responses did
not have at least 5 repetitions to create a new category. The most important factor, as
shown by the survey, was ‘prevalent traffic speed’ Table 49. The prevalent traffic speed,
in many cases, was mentioned as an 85th
percentile speed. Some DOTs also mentioned
current speed, actual speed, or pace instead of the 85th
percentile as a measure of the
prevalent traffic speed. ‘Crash history,’ ‘road geometry,’ ‘roadside development,’ and
‘political and public influence’ were the other four top factors considered in setting a
speed zone in towns along a rural state highway – according to the views of DOT
representatives.
Table 49 Top Factors Influencing a Decision in Setting up a Speed Zone
Top factors influencing a decision in setting a speed zone Response count Percentage
Prevalent traffic speed (usually 85th percentile) 34 92%
Crash history 27 73%
Road geometry 22 59%
Roadside environment 22 59%
Political and public influence 13 35%
Pedestrian and bicycle 10 27%
Access road count/density 9 24%
Legislation/Directives/Statutes 6 16%
Fifty-nine percentage of DOT traffic engineers mentioned that they did perceive
speeding as a problem in their state (Figure 18). Thirty-eight percent of them said they
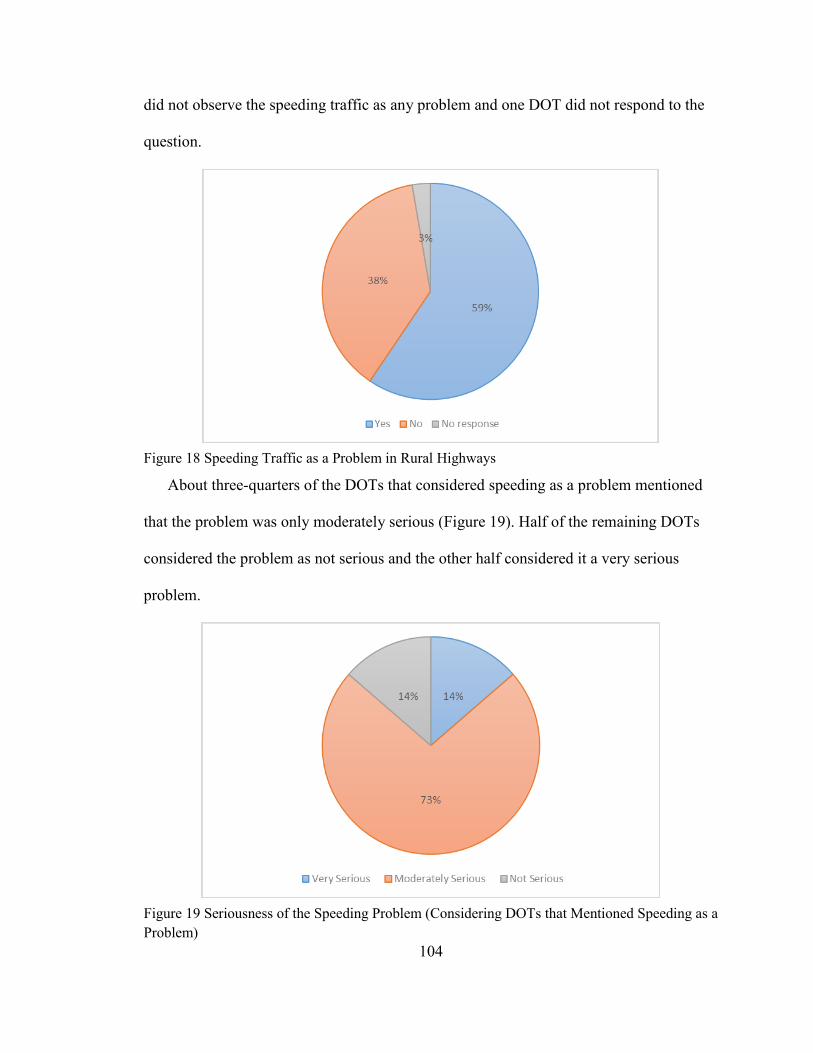
104
did not observe the speeding traffic as any problem and one DOT did not respond to the
question.
Figure 18 Speeding Traffic as a Problem in Rural Highways
About three-quarters of the DOTs that considered speeding as a problem mentioned
that the problem was only moderately serious (Figure 19). Half of the remaining DOTs
considered the problem as not serious and the other half considered it a very serious
problem.
Figure 19 Seriousness of the Speeding Problem (Considering DOTs that Mentioned Speeding as a
Problem)
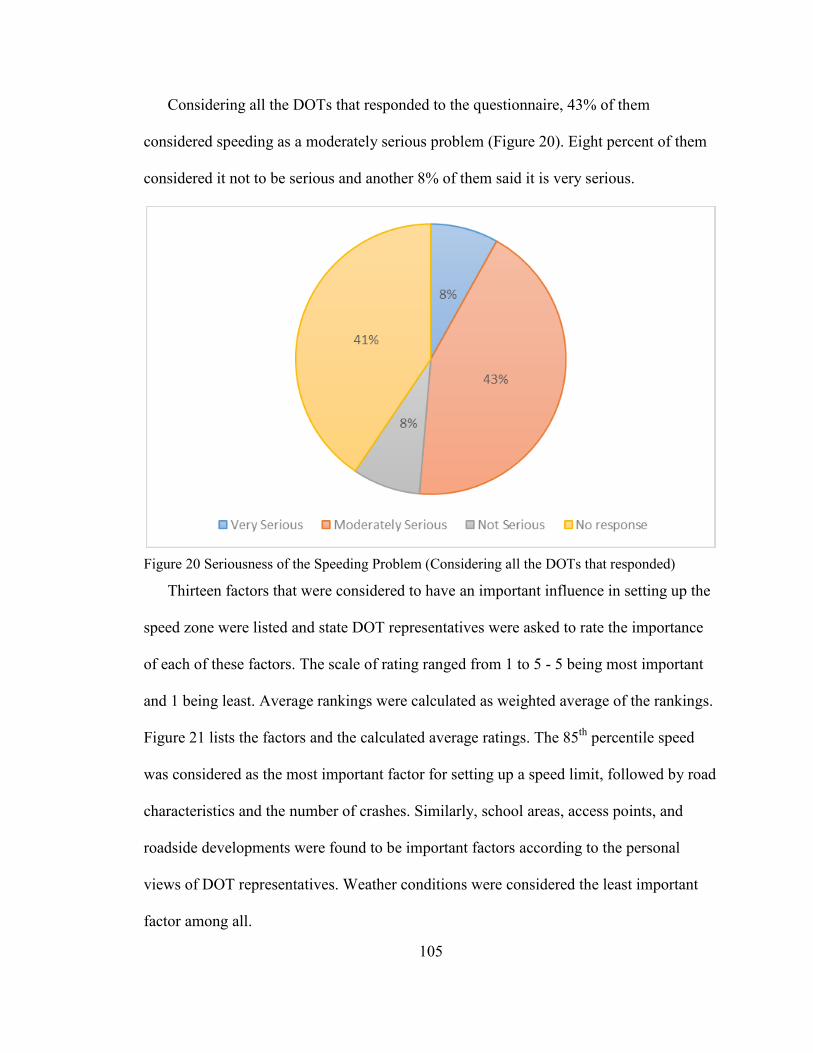
105
Considering all the DOTs that responded to the questionnaire, 43% of them
considered speeding as a moderately serious problem (Figure 20). Eight percent of them
considered it not to be serious and another 8% of them said it is very serious.
Figure 20 Seriousness of the Speeding Problem (Considering all the DOTs that responded)
Thirteen factors that were considered to have an important influence in setting up the
speed zone were listed and state DOT representatives were asked to rate the importance
of each of these factors. The scale of rating ranged from 1 to 5 - 5 being most important
and 1 being least. Average rankings were calculated as weighted average of the rankings.
Figure 21 lists the factors and the calculated average ratings. The 85th
percentile speed
was considered as the most important factor for setting up a speed limit, followed by road
characteristics and the number of crashes. Similarly, school areas, access points, and
roadside developments were found to be important factors according to the personal
views of DOT representatives. Weather conditions were considered the least important
factor among all.
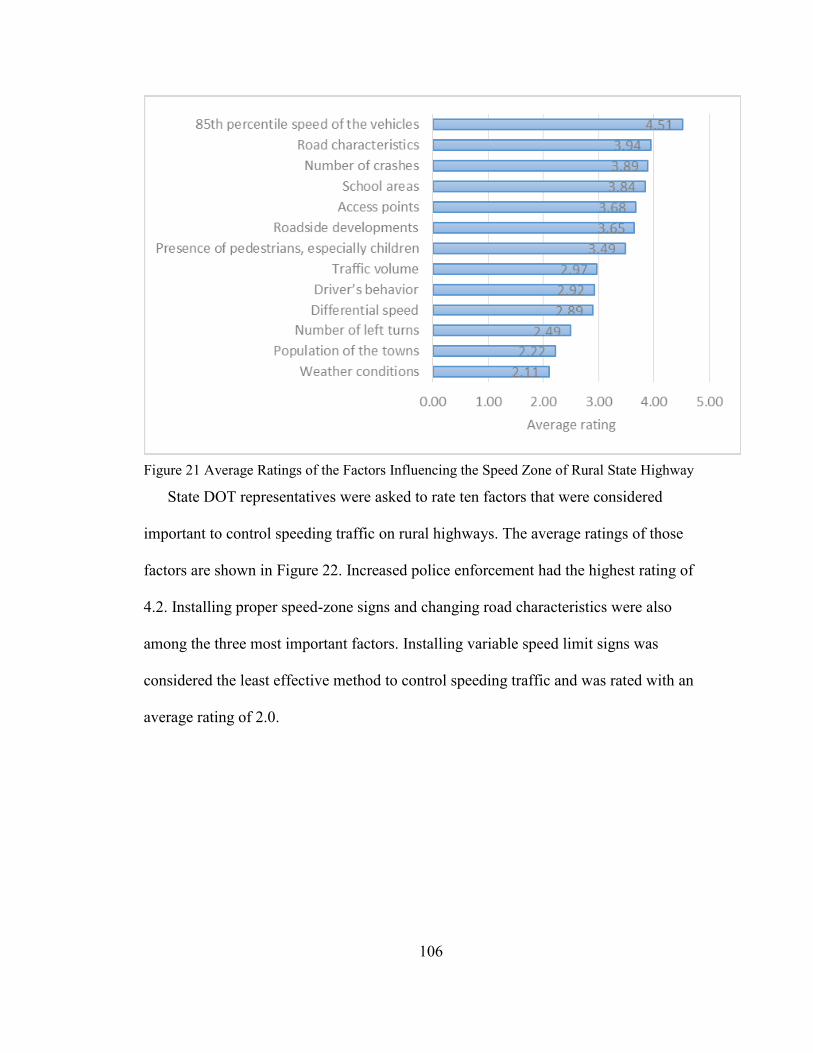
106
Figure 21 Average Ratings of the Factors Influencing the Speed Zone of Rural State Highway
State DOT representatives were asked to rate ten factors that were considered
important to control speeding traffic on rural highways. The average ratings of those
factors are shown in Figure 22. Increased police enforcement had the highest rating of
4.2. Installing proper speed-zone signs and changing road characteristics were also
among the three most important factors. Installing variable speed limit signs was
considered the least effective method to control speeding traffic and was rated with an
average rating of 2.0.
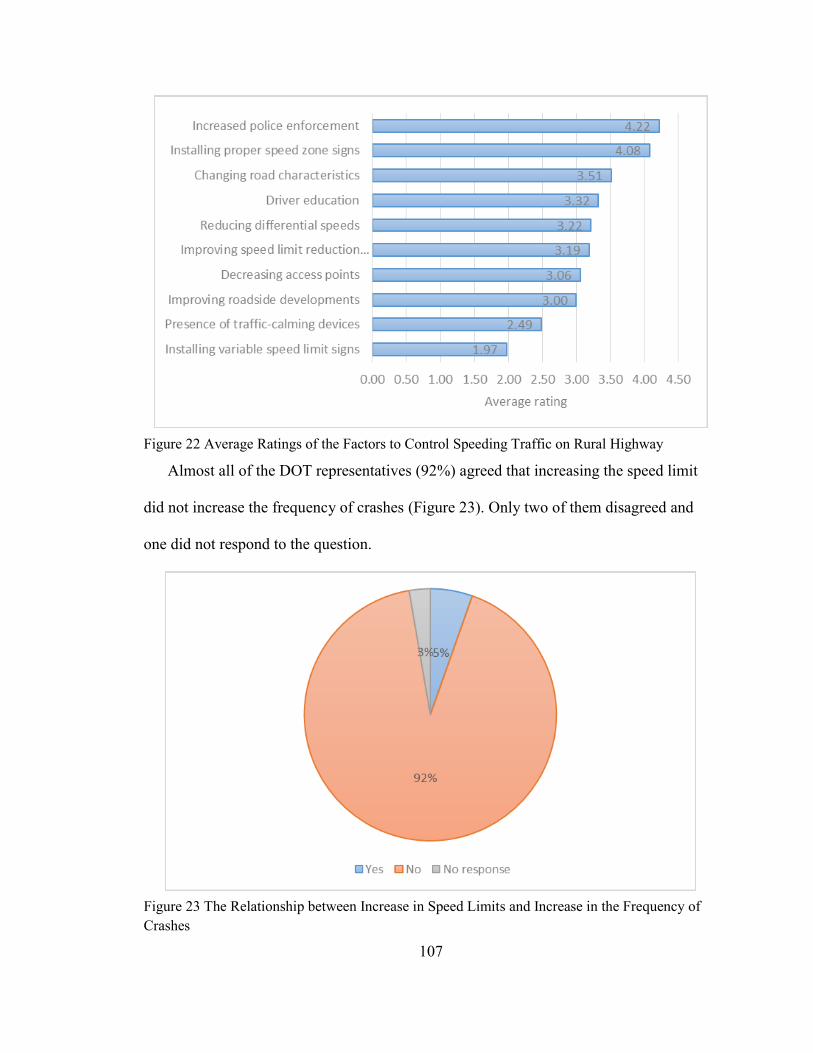
107
Figure 22 Average Ratings of the Factors to Control Speeding Traffic on Rural Highway
Almost all of the DOT representatives (92%) agreed that increasing the speed limit
did not increase the frequency of crashes (Figure 23). Only two of them disagreed and
one did not respond to the question.
Figure 23 The Relationship between Increase in Speed Limits and Increase in the Frequency of
Crashes
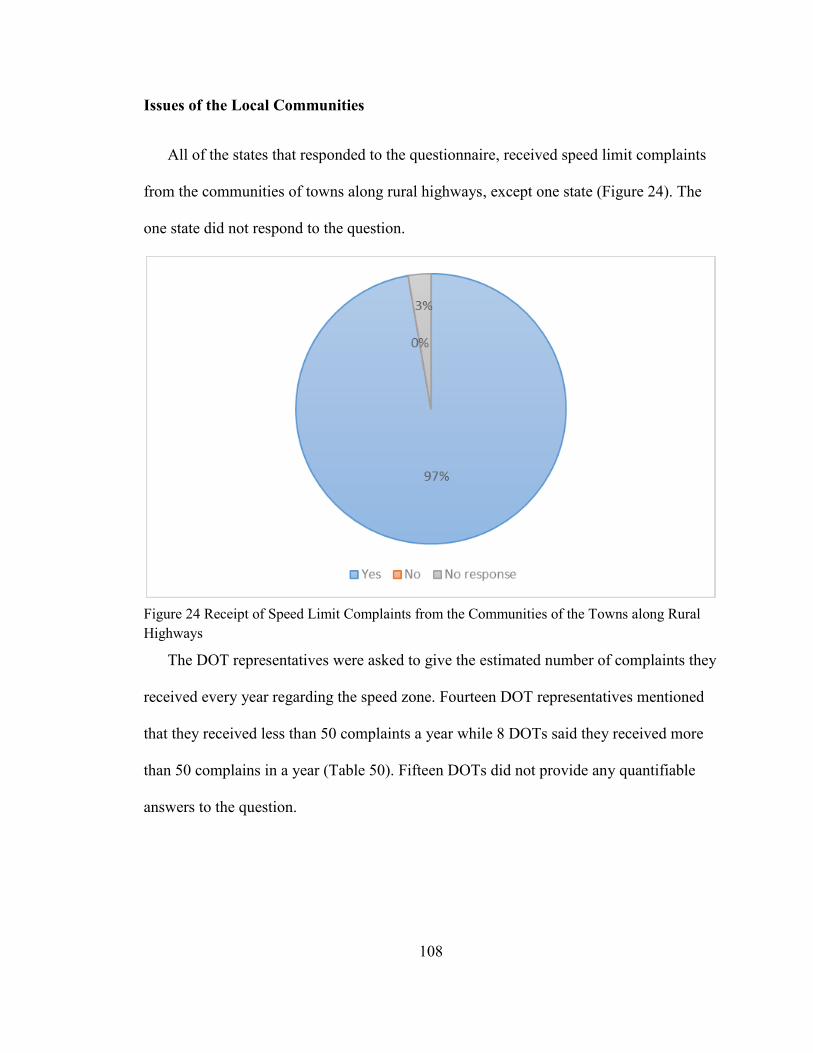
108
Issues of the Local Communities
All of the states that responded to the questionnaire, received speed limit complaints
from the communities of towns along rural highways, except one state (Figure 24). The
one state did not respond to the question.
Figure 24 Receipt of Speed Limit Complaints from the Communities of the Towns along Rural
Highways
The DOT representatives were asked to give the estimated number of complaints they
received every year regarding the speed zone. Fourteen DOT representatives mentioned
that they received less than 50 complaints a year while 8 DOTs said they received more
than 50 complains in a year (Table 50). Fifteen DOTs did not provide any quantifiable
answers to the question.
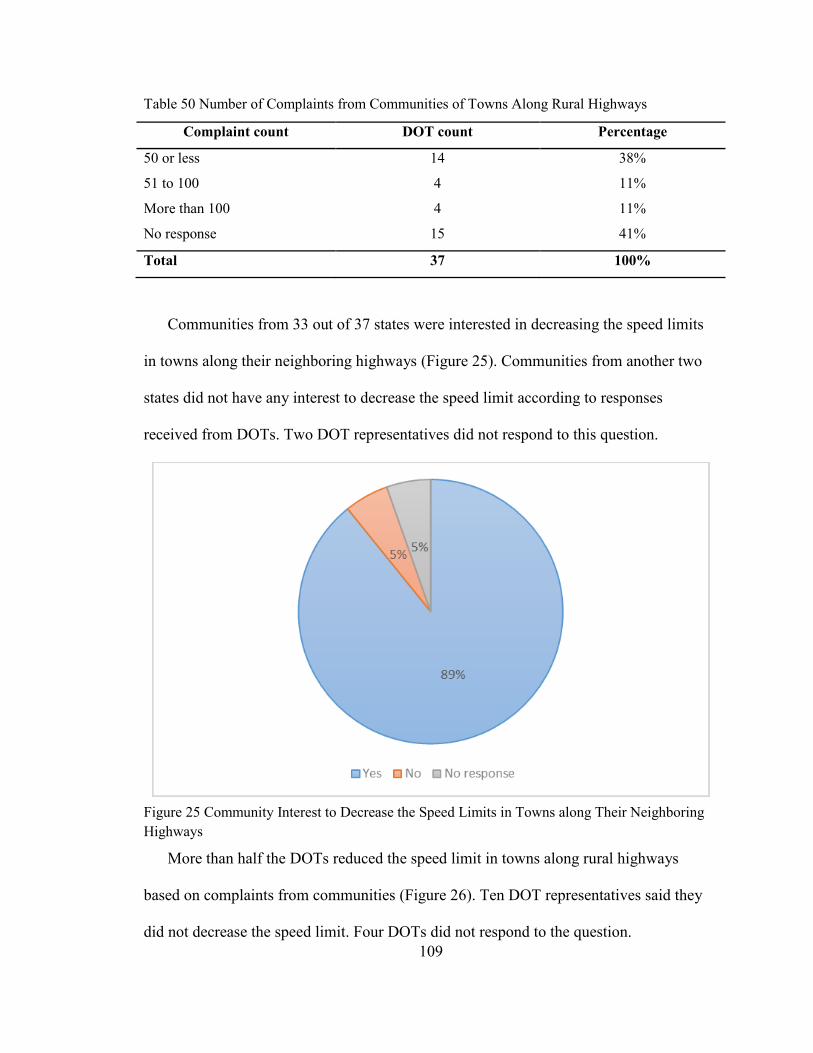
109
Table 50 Number of Complaints from Communities of Towns Along Rural Highways
Complaint count DOT count Percentage
50 or less 14 38%
51 to 100 4 11%
More than 100 4 11%
No response 15 41%
Total 37 100%
Communities from 33 out of 37 states were interested in decreasing the speed limits
in towns along their neighboring highways (Figure 25). Communities from another two
states did not have any interest to decrease the speed limit according to responses
received from DOTs. Two DOT representatives did not respond to this question.
Figure 25 Community Interest to Decrease the Speed Limits in Towns along Their Neighboring
Highways
More than half the DOTs reduced the speed limit in towns along rural highways
based on complaints from communities (Figure 26). Ten DOT representatives said they
did not decrease the speed limit. Four DOTs did not respond to the question.
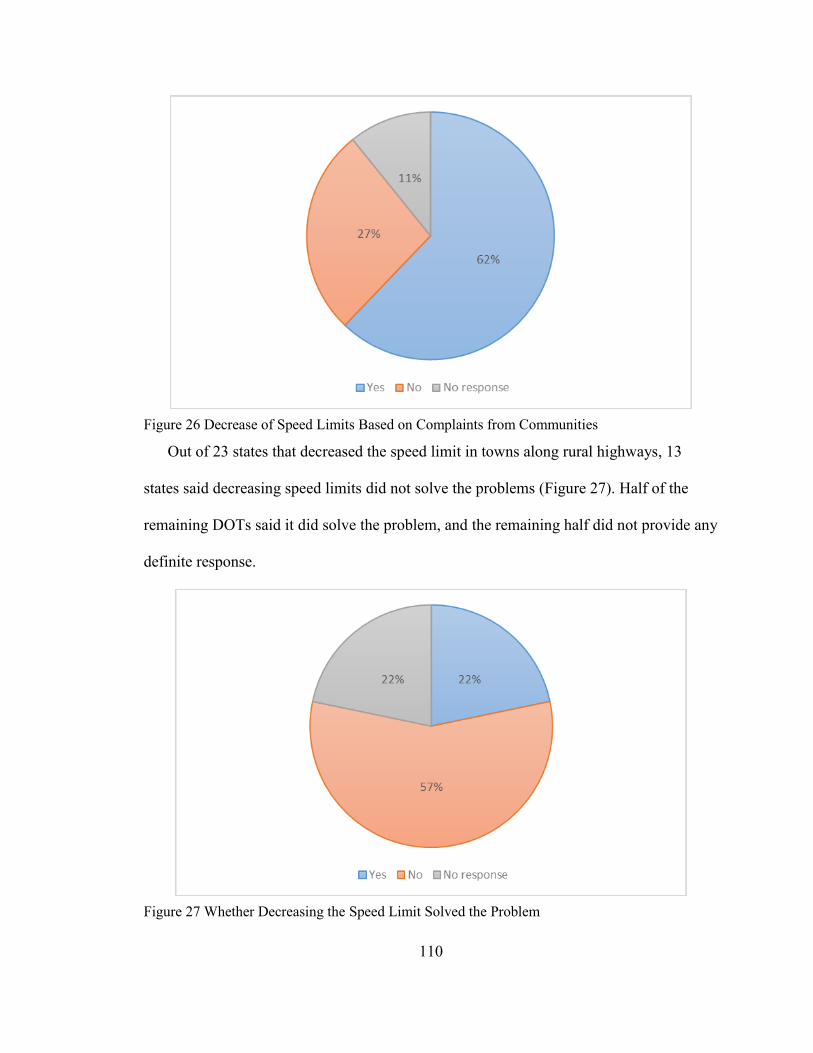
110
Figure 26 Decrease of Speed Limits Based on Complaints from Communities
Out of 23 states that decreased the speed limit in towns along rural highways, 13
states said decreasing speed limits did not solve the problems (Figure 27). Half of the
remaining DOTs said it did solve the problem, and the remaining half did not provide any
definite response.
Figure 27 Whether Decreasing the Speed Limit Solved the Problem
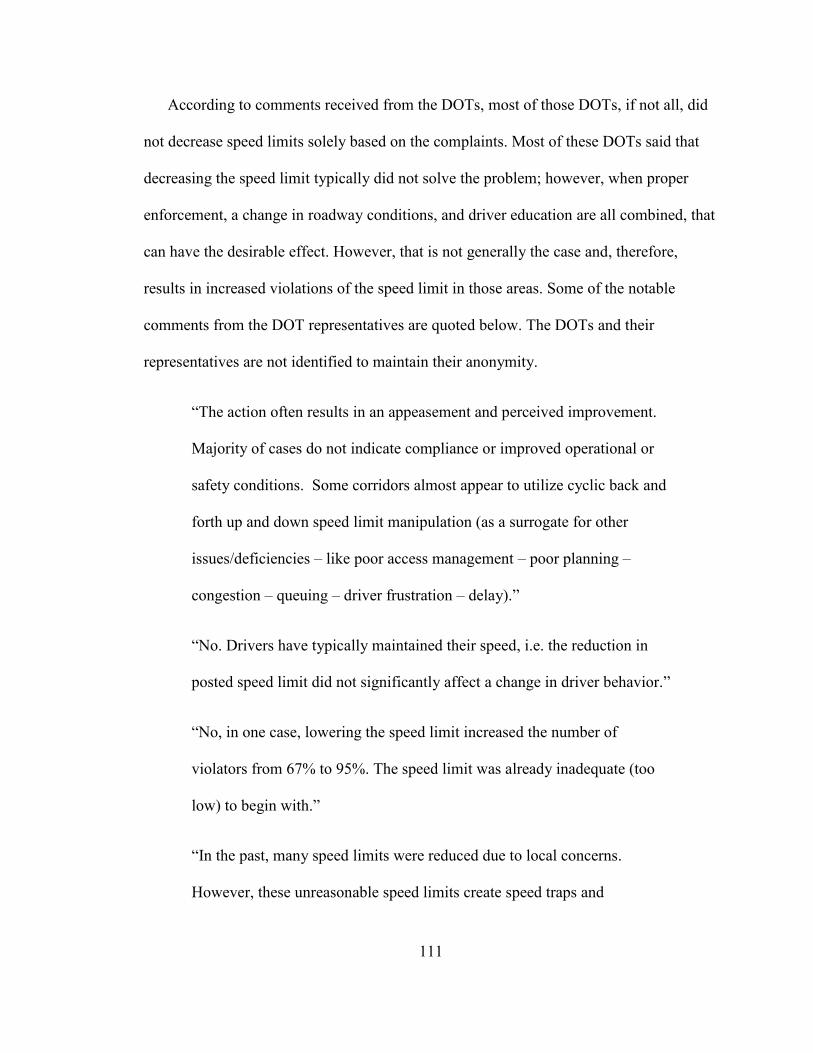
111
According to comments received from the DOTs, most of those DOTs, if not all, did
not decrease speed limits solely based on the complaints. Most of these DOTs said that
decreasing the speed limit typically did not solve the problem; however, when proper
enforcement, a change in roadway conditions, and driver education are all combined, that
can have the desirable effect. However, that is not generally the case and, therefore,
results in increased violations of the speed limit in those areas. Some of the notable
comments from the DOT representatives are quoted below. The DOTs and their
representatives are not identified to maintain their anonymity.
“The action often results in an appeasement and perceived improvement.
Majority of cases do not indicate compliance or improved operational or
safety conditions. Some corridors almost appear to utilize cyclic back and
forth up and down speed limit manipulation (as a surrogate for other
issues/deficiencies – like poor access management – poor planning –
congestion – queuing – driver frustration – delay).”
“No. Drivers have typically maintained their speed, i.e. the reduction in
posted speed limit did not significantly affect a change in driver behavior.”
“No, in one case, lowering the speed limit increased the number of
violators from 67% to 95%. The speed limit was already inadequate (too
low) to begin with.”
“In the past, many speed limits were reduced due to local concerns.
However, these unreasonable speed limits create speed traps and
112
complaints that the speeds are too low. Over the past five years we have
been trying to increase speeds based on 85th
percentile speeds.”
“If we receive a complaint from a community, we still conduct a speed
study in accordance with our policy. If the speed limit is decreased, it
generally does not solve any problems as most drivers continue to drive at
a speed they are comfortable with regardless of what the speed limit is.”
“I don’t believe that just giving in to the communities and posting the
lower speeds does any good, you see only small decreases in speed as a
result, all it really does is change the issue from lowering the speed to one
of compliance, you have to change the drivers perception by changing the
roadway environment and giving the drivers a reason that they should
slow down.”
“Decreases in SL are never made based solely on a complaint. They are
made after investigation and conduct of engineering study. Those SL
reductions based on sound engineering judgment typically do have an
impact.”
“It can be effective with proper enforcement. Proper engineering,
education and enforcement ultimately lead to safer roads. It takes all three
for success.”
113
Factors That Affect in Setting up a Speed Limit
The representatives of state DOTs who reported that engineering and traffic
investigation is required for alteration of speed zones answered that they follow the
process mentioned in their traffic manual to set up speed limits in highways. Some
factors mentioned by DOT representatives that affect the process of setting up a speed
zone are:
Spot speed studies,
o Calculation of 85th
percentile,
o Upper limit of 10 mph pace,
o Trial runs
Crash history,
Study of the top factors affecting the speed limit,
o Roadway characteristics (design, pavement, width, geometry, traffic
control device conditions)
o Roadside environment
o Volume of pedestrians
o Presence of parking
o Number of access point
Anticipated speed limit violation rate
Emphasizing law enforcement along with their study recommendation
The state DOT representatives who reported the speed limit was not uniform in all the
towns along the rural state highways mentioned that the major criteria for establishing the
114
speed limits in towns along rural state highways are basic speed laws, roadway functional
classifications, and the upper limit of the 5- or 10- mph pace. One DOT representative
mentioned that that state was “in the process of removing the ability of local authorities
to pass an ordinance to establish a speed limit within the city limits.” This would result in
a more uniform speed limit throughout the state.
Many DOT representatives mentioned that they are considering their current
legislations and guidelines or manuals as a basis of setting up speed limits. Some
mentioned that they perform the studies mentioned in their state speed-zone legislation.
One DOT representative expressed his doubt on whether the guideline had been followed
properly or not. Also, this DOT was in the process of examining the speed limits to figure
out the answer.
Based on the responses received, the best practices to determine the speed zone in
towns along rural state highways are as listed below:
Consideration of statutory speed limits;
Consideration of existing speed-zone guidelines;
Determining reasonable, realistic, self-regulating, and defendable speed by:
o Conducting of an engineering study to find out the 85th
percentile speed
which is the most agreed upon measure of prevailing traffic speeds;
o Taking proper precautions while conducting speed studies, such as
choosing a proper day and time so that the collected speed data is
representative of normal traffic conditions and determining if the
equipment used is well maintained;
115
o Taking into account, such factors as crash history, road geometry, roadside
environment, and “political and public influence;”
o Balancing the community desire and the speed the traffic wishes to go;
Use of proper warning signs;
Conducting before and after studies;
Consistency in setting up speed-zone determination process.
116
CHAPTER 6
CONCLUSIONS AND RECOMMENDATIONS
The conclusions and recommendations of the study have been categorized into three
parts. The first part includes the conclusions and recommendations obtained from
analyses of crash statistics. The second part includes the conclusions and
recommendations related to the speed-zone guideline. The third part continues the
conclusions and recommendations of second part by providing the best practices found
from review of literature as well as from the results of survey questionnaires.
Crash Statistics
The crash record analyzed in this study shows that most of crashes in the rural towns
occurred in favorable conditions. For example, 87% of total crashes occurred when road
was in dry condition, 70% of crashes occurred in clear weather, 60% of crashes occurred
in daylight, and 63% of crashes occurred when driver was in normal condition. Similarly,
74% of crashes occurred while primary vehicle was going straight. It shows that lesser
crashes have occurred in unfavorable conditions like snow, dark, rain etc. - possibly
because drivers are more alert in unfavorable driving conditions. However, the reason
behind fewer crashes during favorable driving conditions might also be the fact that the
weather in most of the towns in Nevada is favorable throughout the year and lesser
people drives at night. Those factors were not considered in detail in this study. More
detailed study can be conducted with emphasis on those factors for more definite answer
to those uncertainties.
117
Regression analyses shows that no. of crashes, no. of injuries and no. of PDO crashes
were significantly correlated with percentage of vehicles exceeding posted speed limits.
The pseudo R2 value shows that 42% of total crash count, 27% injury count and 47% of
PDO crash count can be explained by percentage of vehicles exceeding posted speed
limits only. Thus speed enforcement is very important factor in order to reduce the
number of crashes.
The multinomial logit model shows that the claimed injury crashes were significantly
correlated with the month when the crashes occurred, vehicle types and vehicle factors
associated with the crashes. The non-incapacitating injuries were correlated with vehicle
actions, time of the day, days of the week (weekend or weekdays), vehicle types, driver
factors, and vehicle factors associated with the crashes. The binary logit model shows
that injury crashes were significantly correlated with time of the day, days of the week
(weekend and weekdays), month, vehicle types, and vehicle factors associated with the
crashes.
Speed-Zone Guideline
Speed-zone guideline is very important tool to ensure uniform process in setting up
speed zones in towns along rural highways throughout Nevada. The findings and the
recommendations provided in this report can be used as a starting point to develop proper
speed-zone guideline. Once the guideline is prepared, it should be updated regularly.
Lessons learned, development of latest technologies, and related researches are some of
the aspects to be considered while updating the guideline. Preparing, publishing, and
distributing “A Rule of Majority” pamphlet – providing concise information on how
118
speed zones are setup in layman terms - can be an effective tool to increase the public
awareness about the process to setup speed zone. Such information is likely to decrease
the community complaints related to speed zones, especially community requests to
reduce a speed limit.
Best Practices
As per the responses from state DOTs, ‘speeding’ and ‘fatigue & inattention’ are two
top reasons for crashes. ‘Failure to yield’, ‘run off lane/road’ are other important reasons
for crashes followed by ‘DUI’ which is ranked fifth in the list of the important reasons.
Only half of the DOT representatives that responded to the questionnaire have a speed-
zone guideline or manual. Many DOTs did not have uniform process in setting up speed
zones in their towns along rural highways.
‘Prevailing speed’ (usually represented by 85th
percentile) is the most important factor
deciding features of speed zones as per the traffic engineer’s personal view. ‘Crash
history’, ‘road geometry’, ‘roadside environment’, and ‘political and public influence’ are
other four important factors deciding features of speed zones.
Fifty-nine percent of DOT representatives responded that speeding in rural highways
is a problem in their state. About three fourth of them mentioned that the problem is
moderately serious. Half the remaining DOT representatives said it is not a serious
problem while other half mentioned it is a very serious problem.
Based on the average rating, increasing ‘police enforcement’ is the most important
factor to control speeding in rural highways. Other important factors included ‘installing
119
proper speed-zone signs’, ‘changing road characteristics’, ‘driver education’, and
‘reducing differential speeds’.
All the DOT representatives, but two, said that increasing speed limits will not
increase frequency of crashes. Communities in most of the states have an interest to
decrease the speed limits in their neighboring highways. In more than half the states that
responded to the questionnaire, speed limits have been decreased based on complains
received from the public. Half of them said that reducing speed limits did not solve the
problems.

120
APPENDIX A CRASH STATISTICS BY TOWN
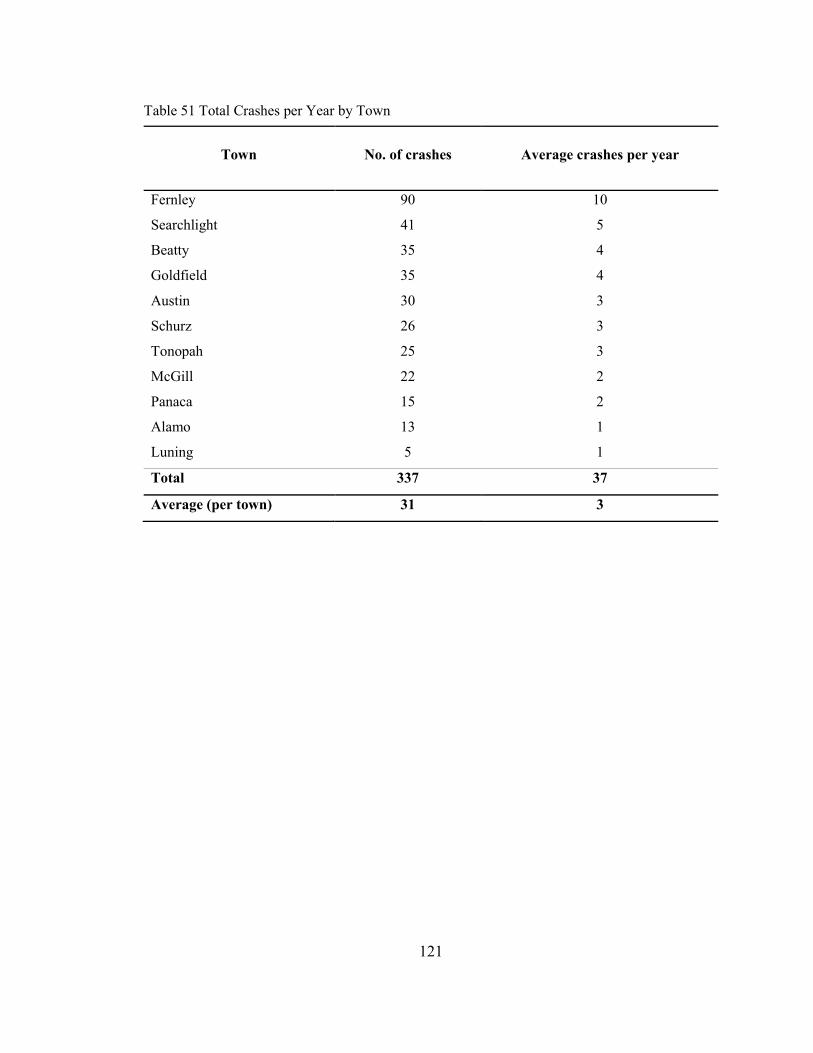
121
Table 51 Total Crashes per Year by Town
Town No. of crashes Average crashes per year
Fernley 90 10
Searchlight 41 5
Beatty 35 4
Goldfield 35 4
Austin 30 3
Schurz 26 3
Tonopah 25 3
McGill 22 2
Panaca 15 2
Alamo 13 1
Luning 5 1
Total 337 37
Average (per town) 31 3
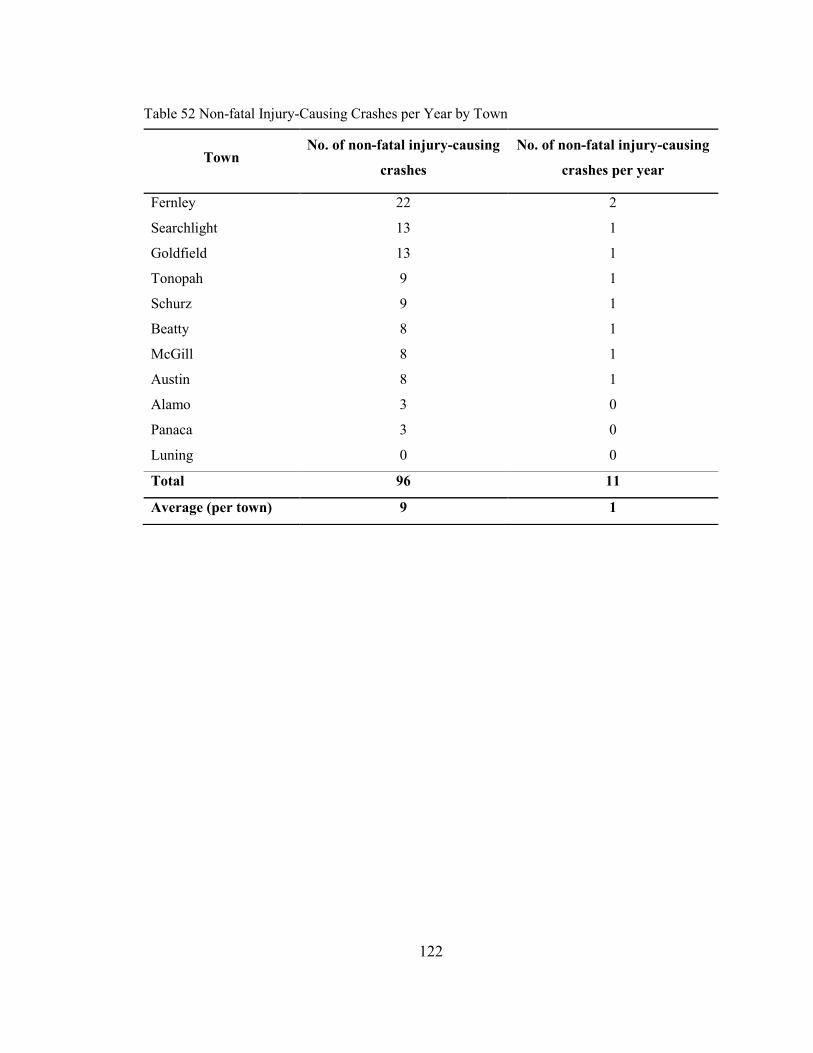
122
Table 52 Non-fatal Injury-Causing Crashes per Year by Town
Town No. of non-fatal injury-causing
crashes
No. of non-fatal injury-causing
crashes per year
Fernley 22 2
Searchlight 13 1
Goldfield 13 1
Tonopah 9 1
Schurz 9 1
Beatty 8 1
McGill 8 1
Austin 8 1
Alamo 3 0
Panaca 3 0
Luning 0 0
Total 96 11
Average (per town) 9 1
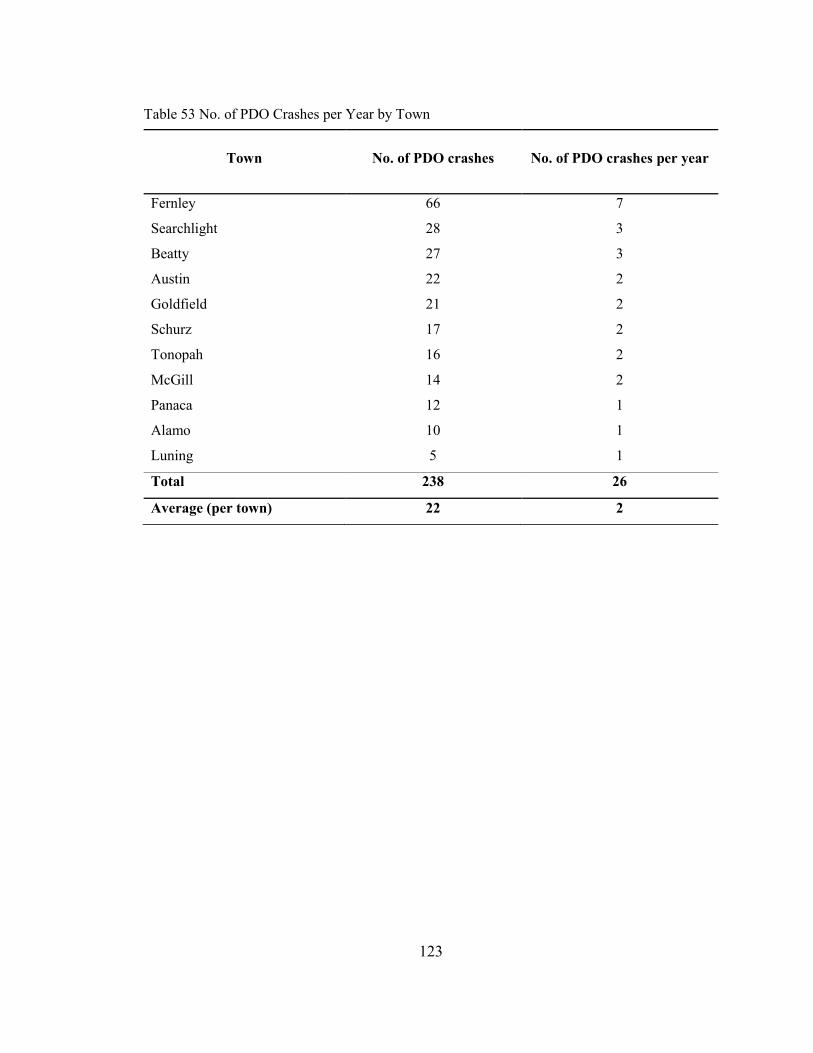
123
Table 53 No. of PDO Crashes per Year by Town
Town No. of PDO crashes No. of PDO crashes per year
Fernley 66 7
Searchlight 28 3
Beatty 27 3
Austin 22 2
Goldfield 21 2
Schurz 17 2
Tonopah 16 2
McGill 14 2
Panaca 12 1
Alamo 10 1
Luning 5 1
Total 238 26
Average (per town) 22 2
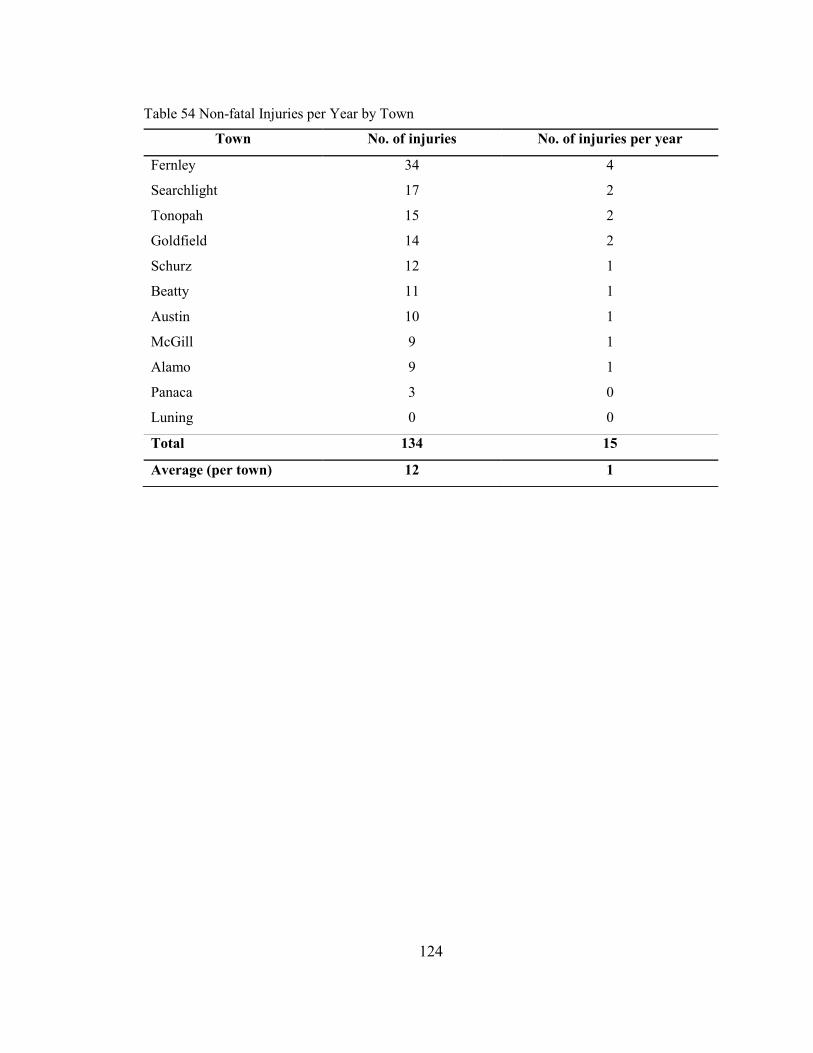
124
Table 54 Non-fatal Injuries per Year by Town
Town No. of injuries No. of injuries per year
Fernley 34 4
Searchlight 17 2
Tonopah 15 2
Goldfield 14 2
Schurz 12 1
Beatty 11 1
Austin 10 1
McGill 9 1
Alamo 9 1
Panaca 3 0
Luning 0 0
Total 134 15
Average (per town) 12 1
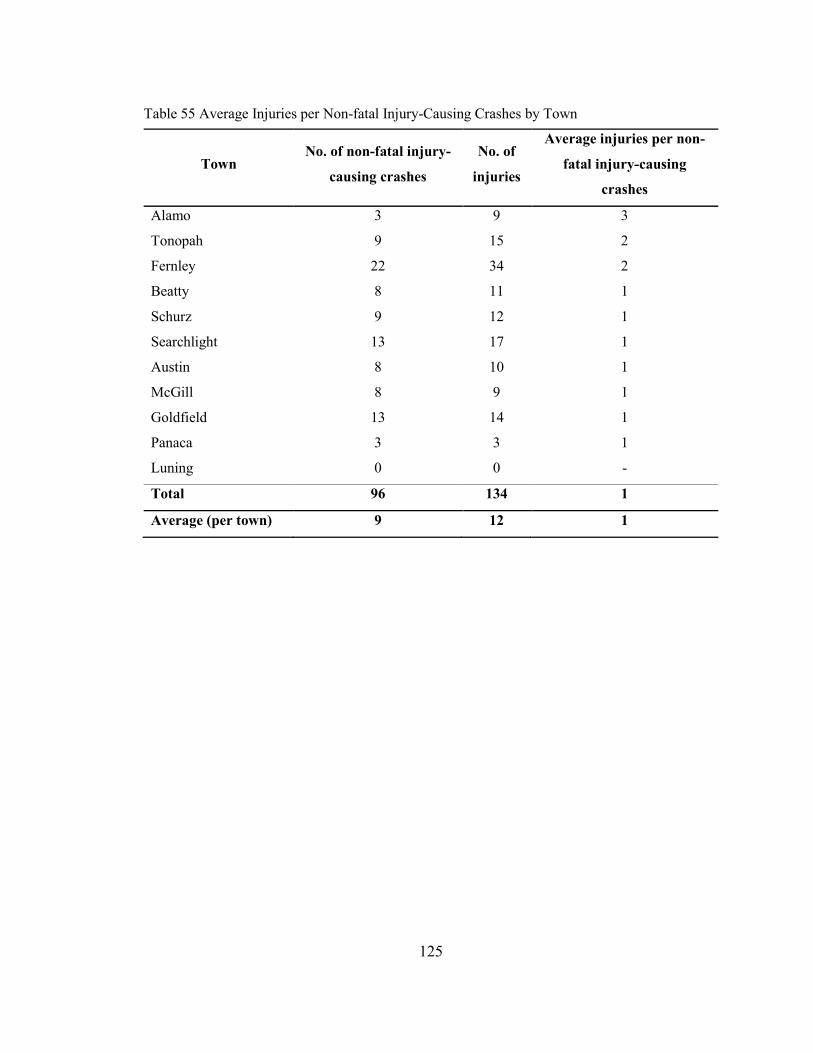
125
Table 55 Average Injuries per Non-fatal Injury-Causing Crashes by Town
Town No. of non-fatal injury-
causing crashes
No. of
injuries
Average injuries per non-
fatal injury-causing
crashes
Alamo 3 9 3
Tonopah 9 15 2
Fernley 22 34 2
Beatty 8 11 1
Schurz 9 12 1
Searchlight 13 17 1
Austin 8 10 1
McGill 8 9 1
Goldfield 13 14 1
Panaca 3 3 1
Luning 0 0 -
Total 96 134 1
Average (per town) 9 12 1
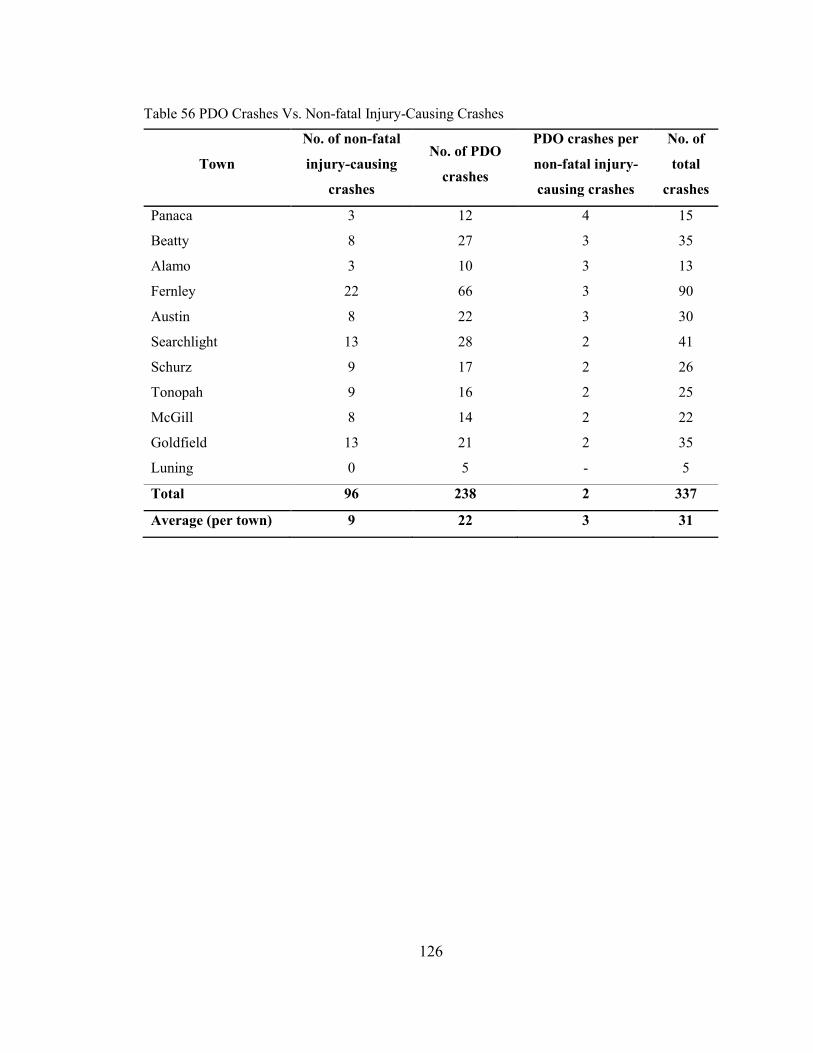
126
Table 56 PDO Crashes Vs. Non-fatal Injury-Causing Crashes
Town
No. of non-fatal
injury-causing
crashes
No. of PDO
crashes
PDO crashes per
non-fatal injury-
causing crashes
No. of
total
crashes
Panaca 3 12 4 15
Beatty 8 27 3 35
Alamo 3 10 3 13
Fernley 22 66 3 90
Austin 8 22 3 30
Searchlight 13 28 2 41
Schurz 9 17 2 26
Tonopah 9 16 2 25
McGill 8 14 2 22
Goldfield 13 21 2 35
Luning 0 5 - 5
Total 96 238 2 337
Average (per town) 9 22 3 31

127
APPENDIX B TIME FACTORS ASSOCIATED WITH CRASHES
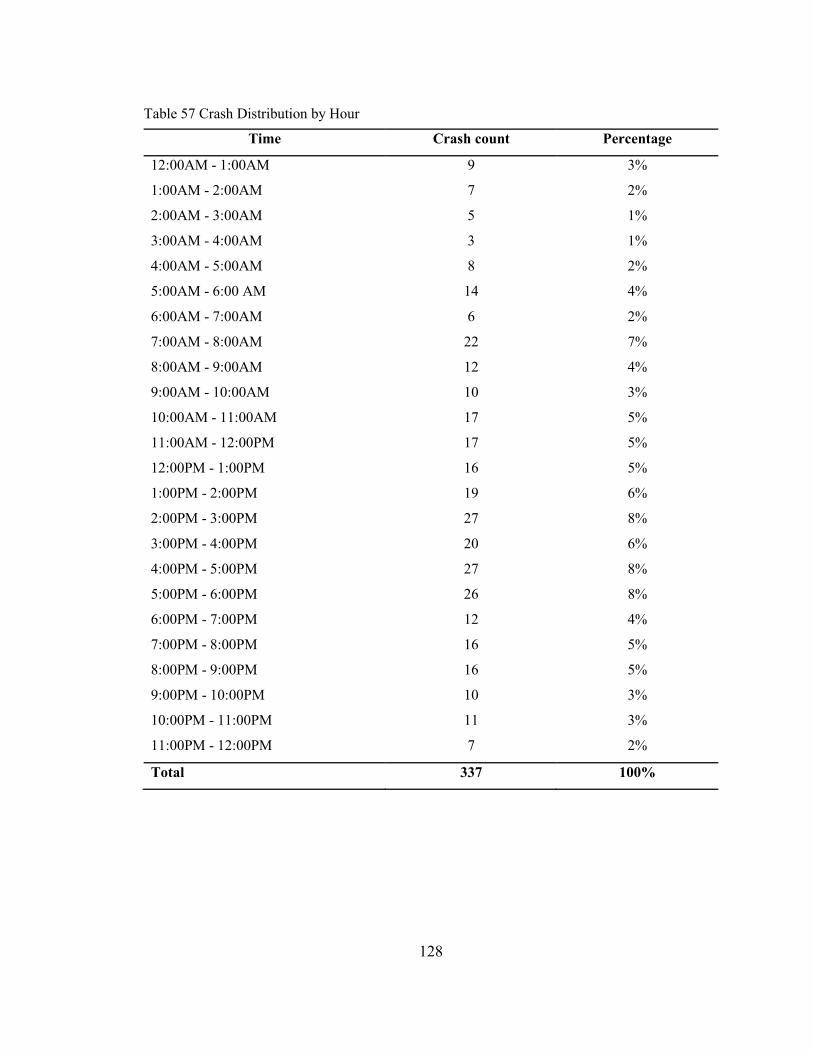
128
Table 57 Crash Distribution by Hour
Time Crash count Percentage
12:00AM - 1:00AM 9 3%
1:00AM - 2:00AM 7 2%
2:00AM - 3:00AM 5 1%
3:00AM - 4:00AM 3 1%
4:00AM - 5:00AM 8 2%
5:00AM - 6:00 AM 14 4%
6:00AM - 7:00AM 6 2%
7:00AM - 8:00AM 22 7%
8:00AM - 9:00AM 12 4%
9:00AM - 10:00AM 10 3%
10:00AM - 11:00AM 17 5%
11:00AM - 12:00PM 17 5%
12:00PM - 1:00PM 16 5%
1:00PM - 2:00PM 19 6%
2:00PM - 3:00PM 27 8%
3:00PM - 4:00PM 20 6%
4:00PM - 5:00PM 27 8%
5:00PM - 6:00PM 26 8%
6:00PM - 7:00PM 12 4%
7:00PM - 8:00PM 16 5%
8:00PM - 9:00PM 16 5%
9:00PM - 10:00PM 10 3%
10:00PM - 11:00PM 11 3%
11:00PM - 12:00PM 7 2%
Total 337 100%
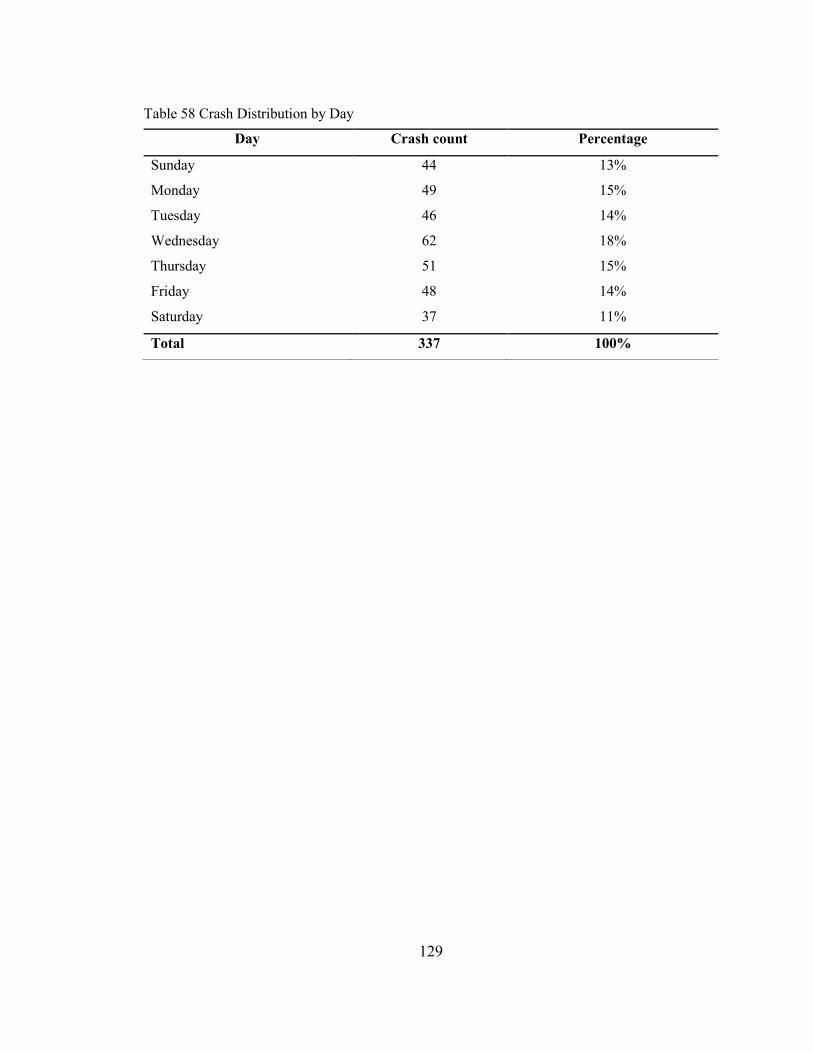
129
Table 58 Crash Distribution by Day
Day Crash count Percentage
Sunday 44 13%
Monday 49 15%
Tuesday 46 14%
Wednesday 62 18%
Thursday 51 15%
Friday 48 14%
Saturday 37 11%
Total 337 100%
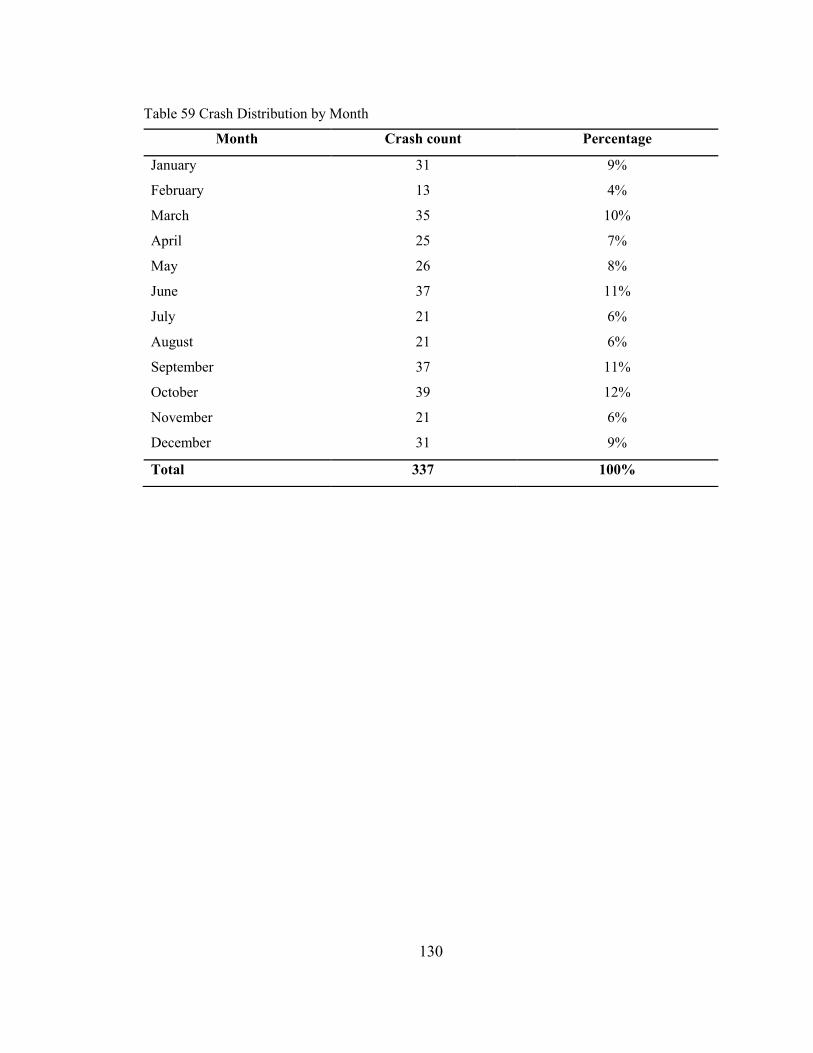
130
Table 59 Crash Distribution by Month
Month Crash count Percentage
January 31 9%
February 13 4%
March 35 10%
April 25 7%
May 26 8%
June 37 11%
July 21 6%
August 21 6%
September 37 11%
October 39 12%
November 21 6%
December 31 9%
Total 337 100%

131
APPENDIX C SITE DATA COLLECTION FORMS
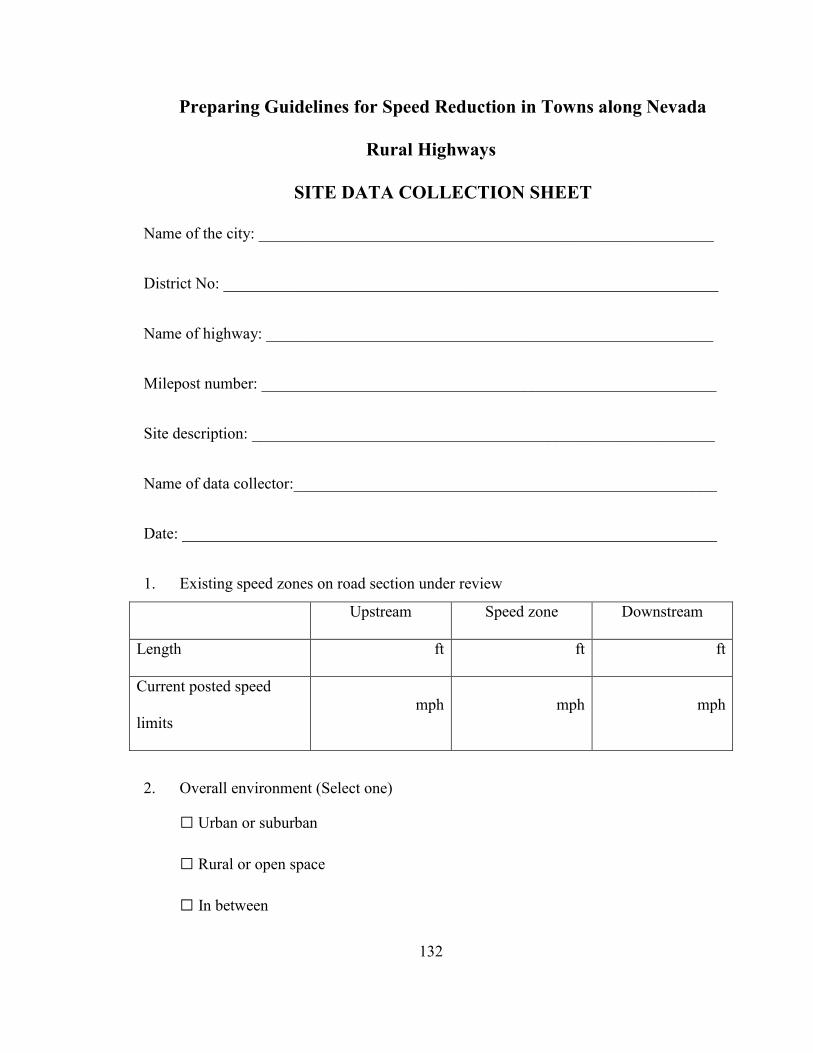
132
Preparing Guidelines for Speed Reduction in Towns along Nevada
Rural Highways
SITE DATA COLLECTION SHEET
Name of the city: _________________________________________________________
District No: ______________________________________________________________
Name of highway: ________________________________________________________
Milepost number: _________________________________________________________
Site description: __________________________________________________________
Name of data collector:_____________________________________________________
Date: ___________________________________________________________________
1. Existing speed zones on road section under review
Upstream Speed zone Downstream
Length ft ft ft
Current posted speed
limits
mph mph mph
2. Overall environment (Select one)
□ Urban or suburban
□ Rural or open space
□ In between
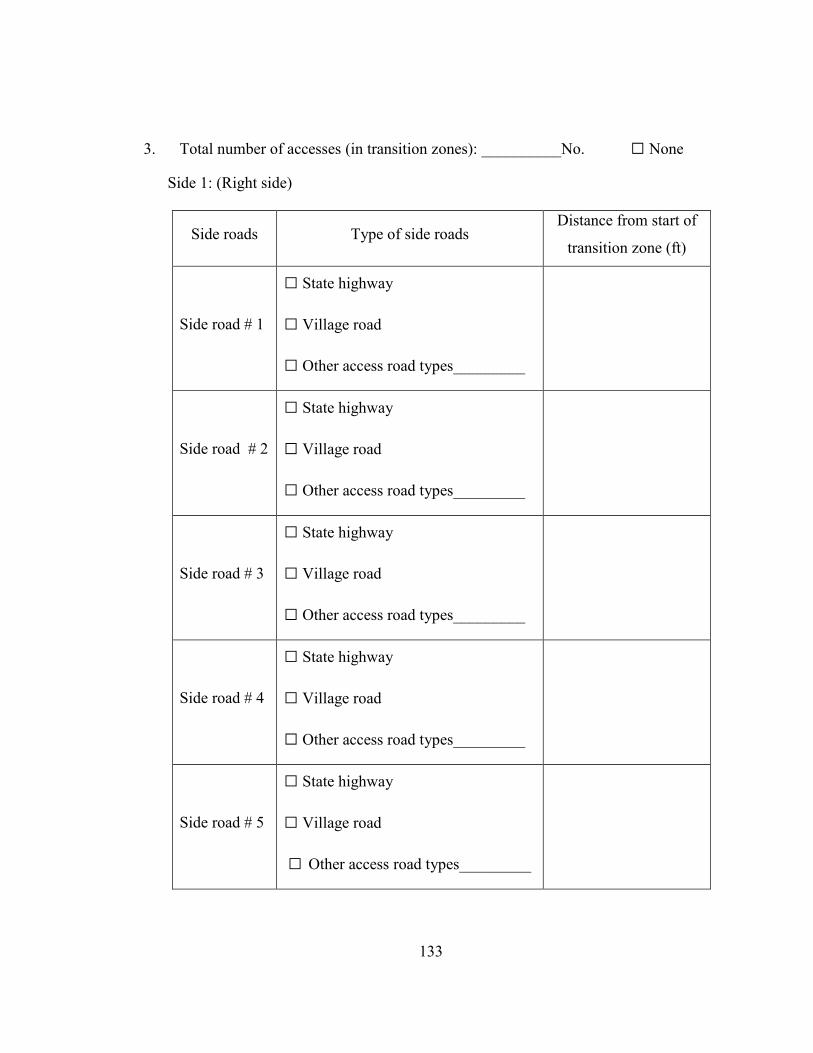
133
3. Total number of accesses (in transition zones): __________No. □ None
Side 1: (Right side)
Side roads Type of side roads Distance from start of
transition zone (ft)
Side road # 1
□ State highway
□ Village road
□ Other access road types_________
Side road # 2
□ State highway
□ Village road
□ Other access road types_________
Side road # 3
□ State highway
□ Village road
□ Other access road types_________
Side road # 4
□ State highway
□ Village road
□ Other access road types_________
Side road # 5
□ State highway
□ Village road
□ Other access road types_________
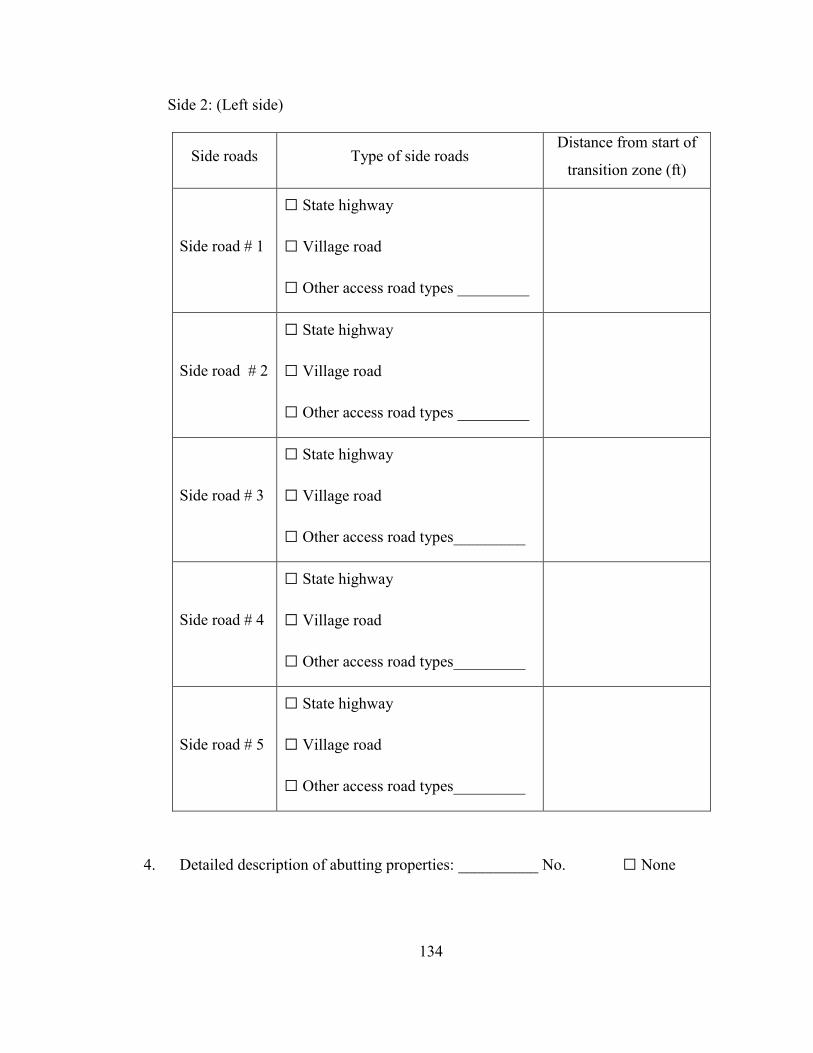
134
Side 2: (Left side)
Side roads Type of side roads Distance from start of
transition zone (ft)
Side road # 1
□ State highway
□ Village road
□ Other access road types _________
Side road # 2
□ State highway
□ Village road
□ Other access road types _________
Side road # 3
□ State highway
□ Village road
□ Other access road types_________
Side road # 4
□ State highway
□ Village road
□ Other access road types_________
Side road # 5
□ State highway
□ Village road
□ Other access road types_________
4. Detailed description of abutting properties: __________ No. □ None
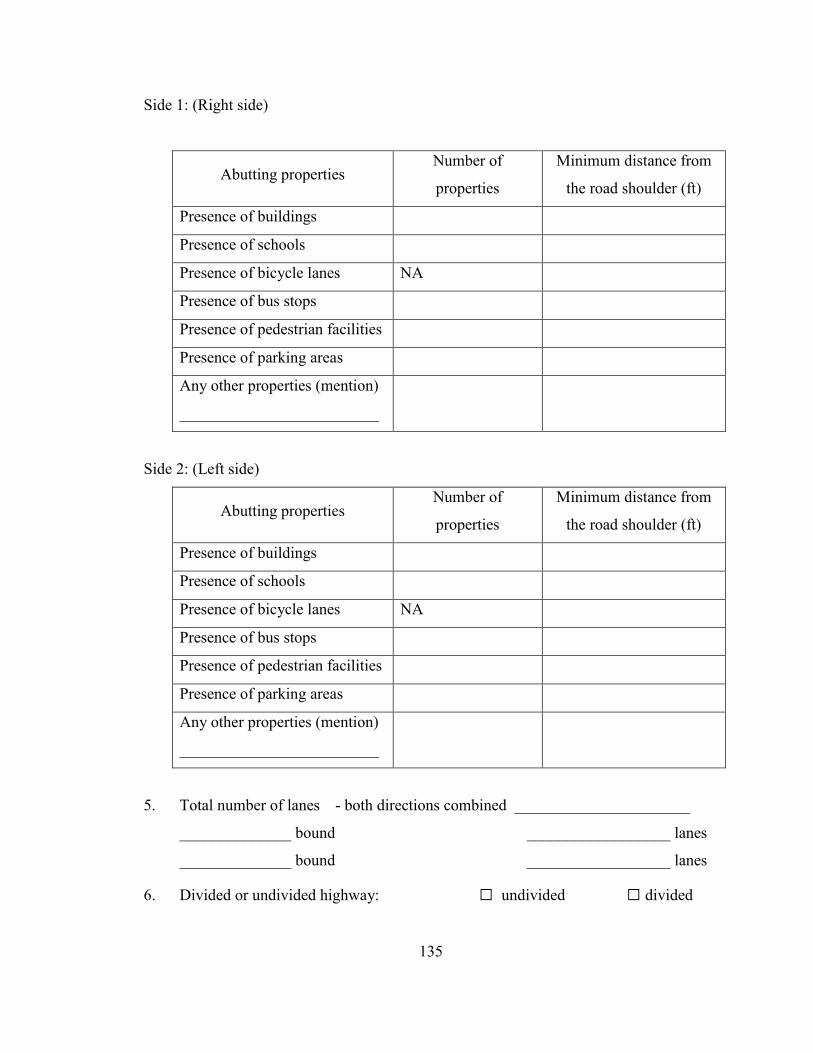
135
Side 1: (Right side)
Abutting properties Number of
properties
Minimum distance from
the road shoulder (ft)
Presence of buildings
Presence of schools
Presence of bicycle lanes NA
Presence of bus stops
Presence of pedestrian facilities
Presence of parking areas
Any other properties (mention)
_________________________
Side 2: (Left side)
Abutting properties Number of
properties
Minimum distance from
the road shoulder (ft)
Presence of buildings
Presence of schools
Presence of bicycle lanes NA
Presence of bus stops
Presence of pedestrian facilities
Presence of parking areas
Any other properties (mention)
_________________________
5. Total number of lanes - both directions combined ______________________
______________ bound __________________ lanes
______________ bound __________________ lanes
6. Divided or undivided highway: □ undivided □ divided
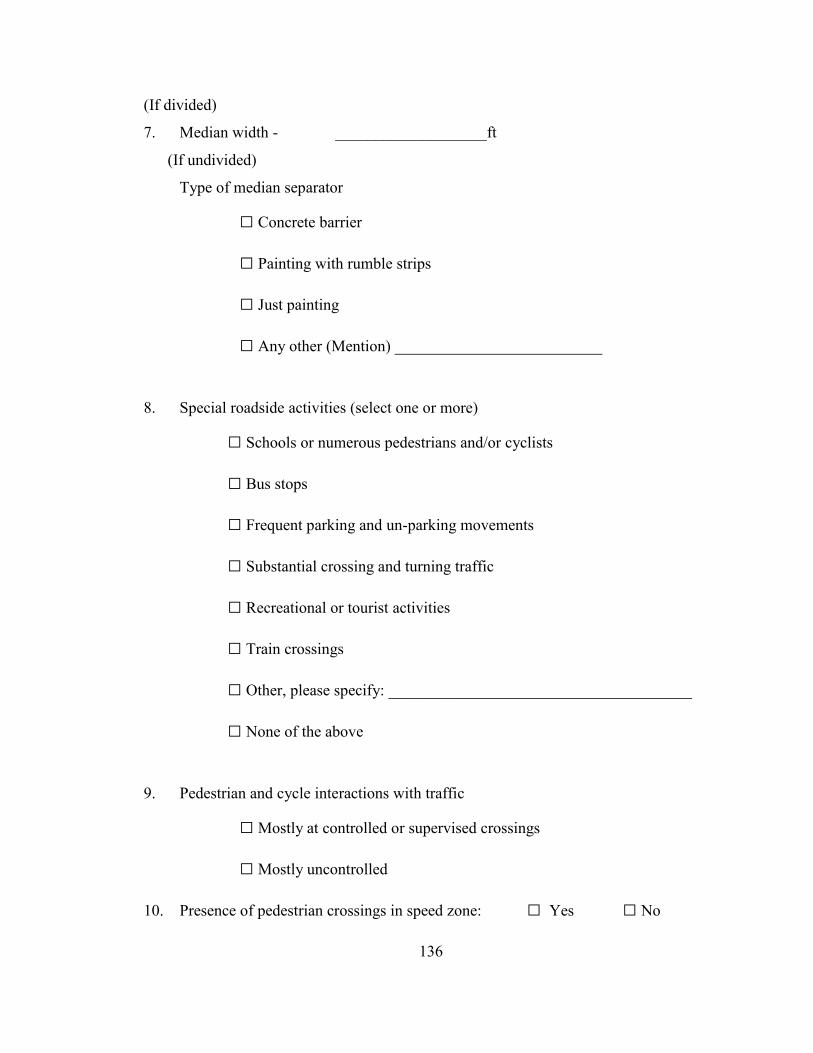
136
(If divided)
7. Median width - ___________________ft
(If undivided)
Type of median separator
□ Concrete barrier
□ Painting with rumble strips
□ Just painting
□ Any other (Mention) __________________________
8. Special roadside activities (select one or more)
□ Schools or numerous pedestrians and/or cyclists
□ Bus stops
□ Frequent parking and un-parking movements
□ Substantial crossing and turning traffic
□ Recreational or tourist activities
□ Train crossings
□ Other, please specify: ______________________________________
□ None of the above
9. Pedestrian and cycle interactions with traffic
□ Mostly at controlled or supervised crossings
□ Mostly uncontrolled
10. Presence of pedestrian crossings in speed zone: □ Yes □ No
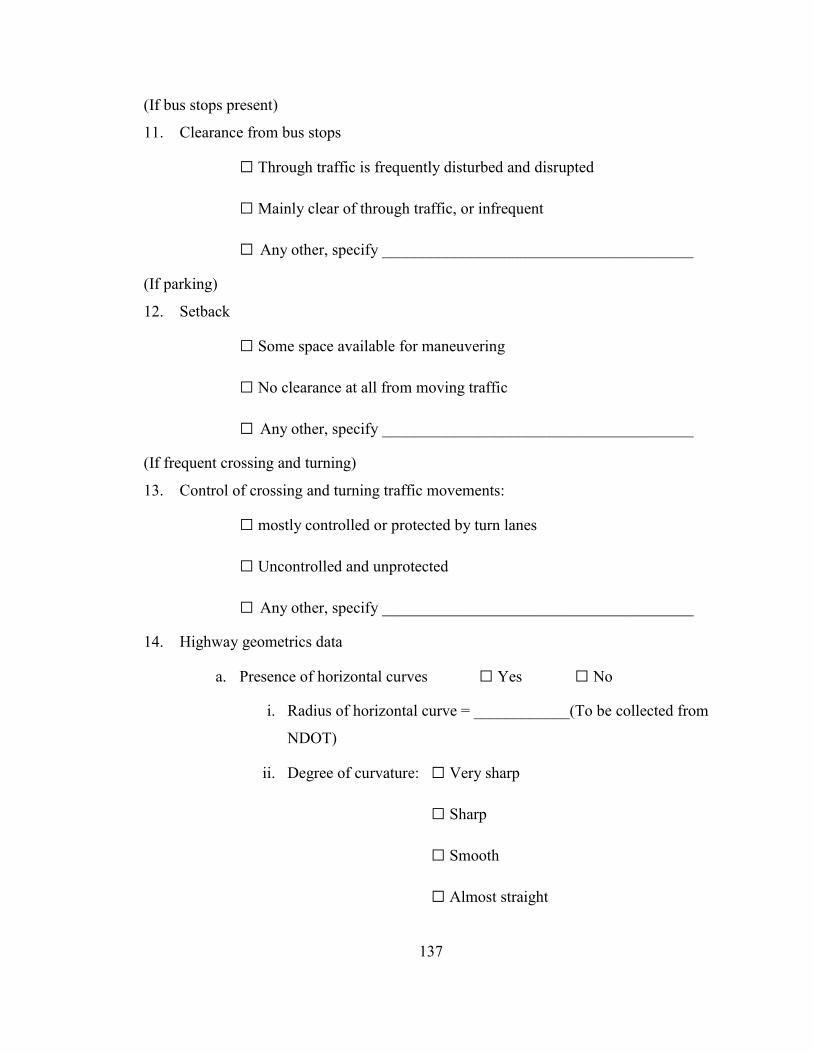
137
(If bus stops present)
11. Clearance from bus stops
□ Through traffic is frequently disturbed and disrupted
□ Mainly clear of through traffic, or infrequent
□ Any other, specify _______________________________________
(If parking)
12. Setback
□ Some space available for maneuvering
□ No clearance at all from moving traffic
□ Any other, specify _______________________________________
(If frequent crossing and turning)
13. Control of crossing and turning traffic movements:
□ mostly controlled or protected by turn lanes
□ Uncontrolled and unprotected
□ Any other, specify _______________________________________
14. Highway geometrics data
a. Presence of horizontal curves □ Yes □ No
i. Radius of horizontal curve = ____________(To be collected from
NDOT)
ii. Degree of curvature: □ Very sharp
□ Sharp
□ Smooth
□ Almost straight
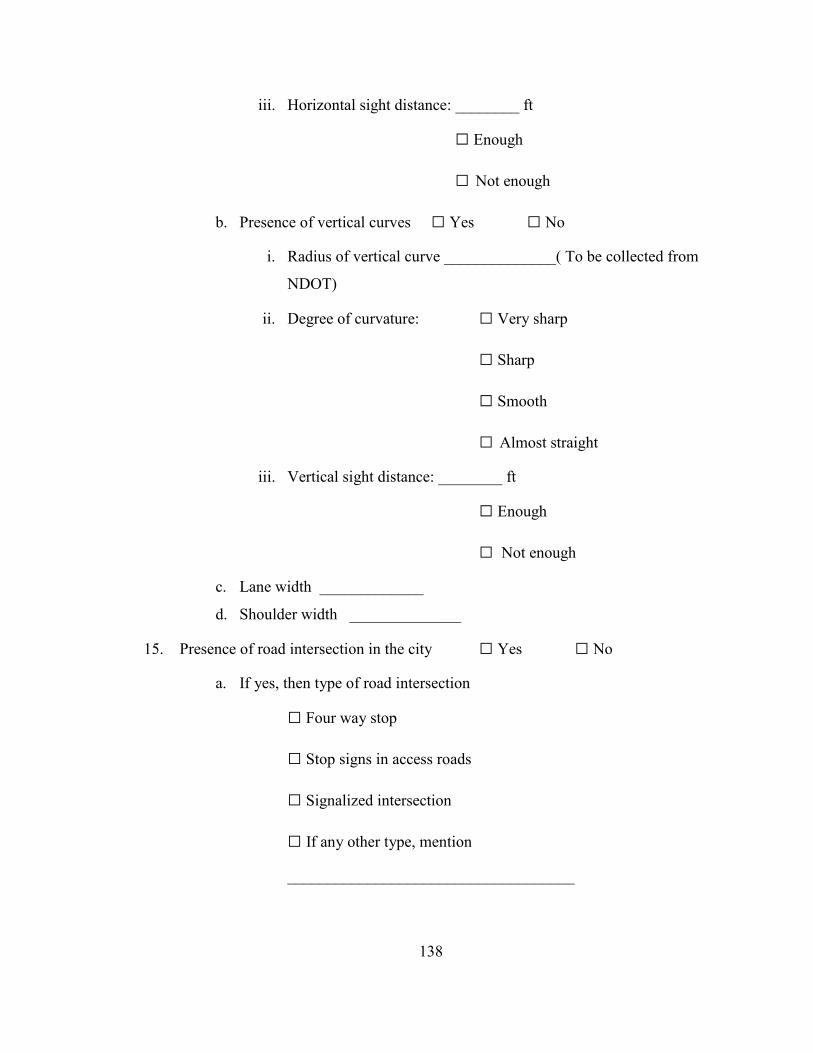
138
iii. Horizontal sight distance: ________ ft
□ Enough
□ Not enough
b. Presence of vertical curves □ Yes □ No
i. Radius of vertical curve ______________( To be collected from
NDOT)
ii. Degree of curvature: □ Very sharp
□ Sharp
□ Smooth
□ Almost straight
iii. Vertical sight distance: ________ ft
□ Enough
□ Not enough
c. Lane width _____________
d. Shoulder width ______________
15. Presence of road intersection in the city □ Yes □ No
a. If yes, then type of road intersection
□ Four way stop
□ Stop signs in access roads
□ Signalized intersection
□ If any other type, mention
____________________________________
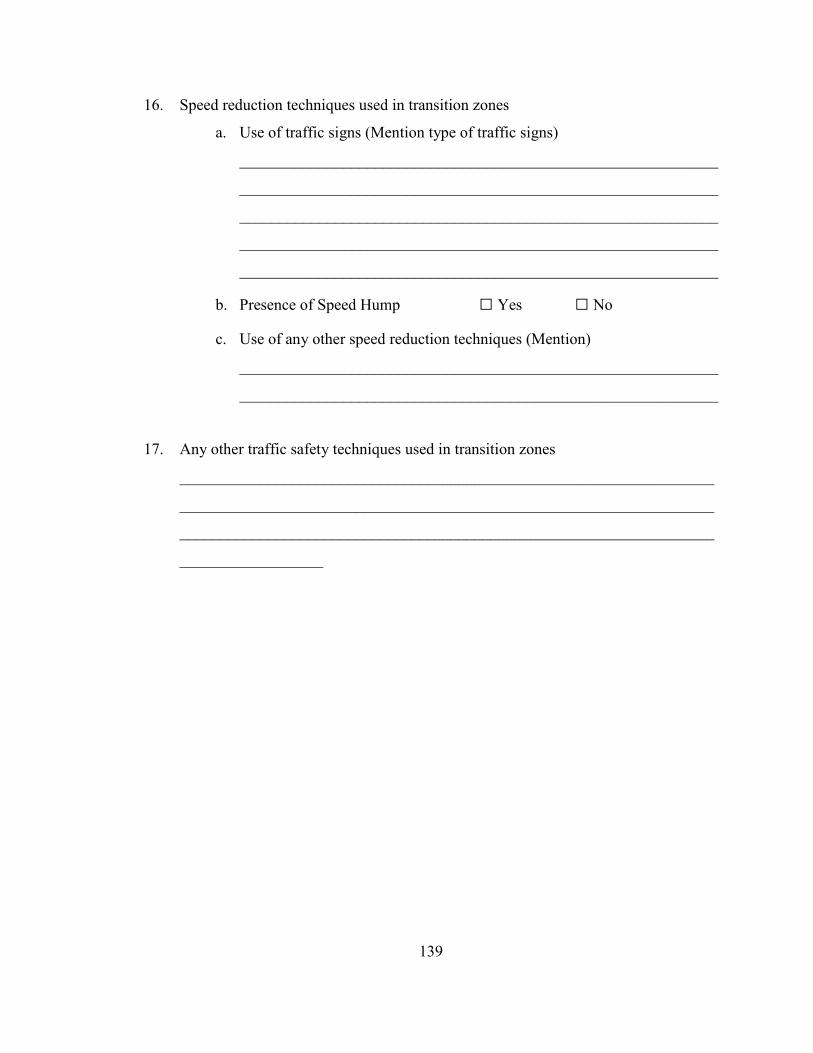
139
16. Speed reduction techniques used in transition zones
a. Use of traffic signs (Mention type of traffic signs)
____________________________________________________________
____________________________________________________________
____________________________________________________________
____________________________________________________________
____________________________________________________________
b. Presence of Speed Hump □ Yes □ No
c. Use of any other speed reduction techniques (Mention)
____________________________________________________________
____________________________________________________________
17. Any other traffic safety techniques used in transition zones
___________________________________________________________________
___________________________________________________________________
___________________________________________________________________
__________________
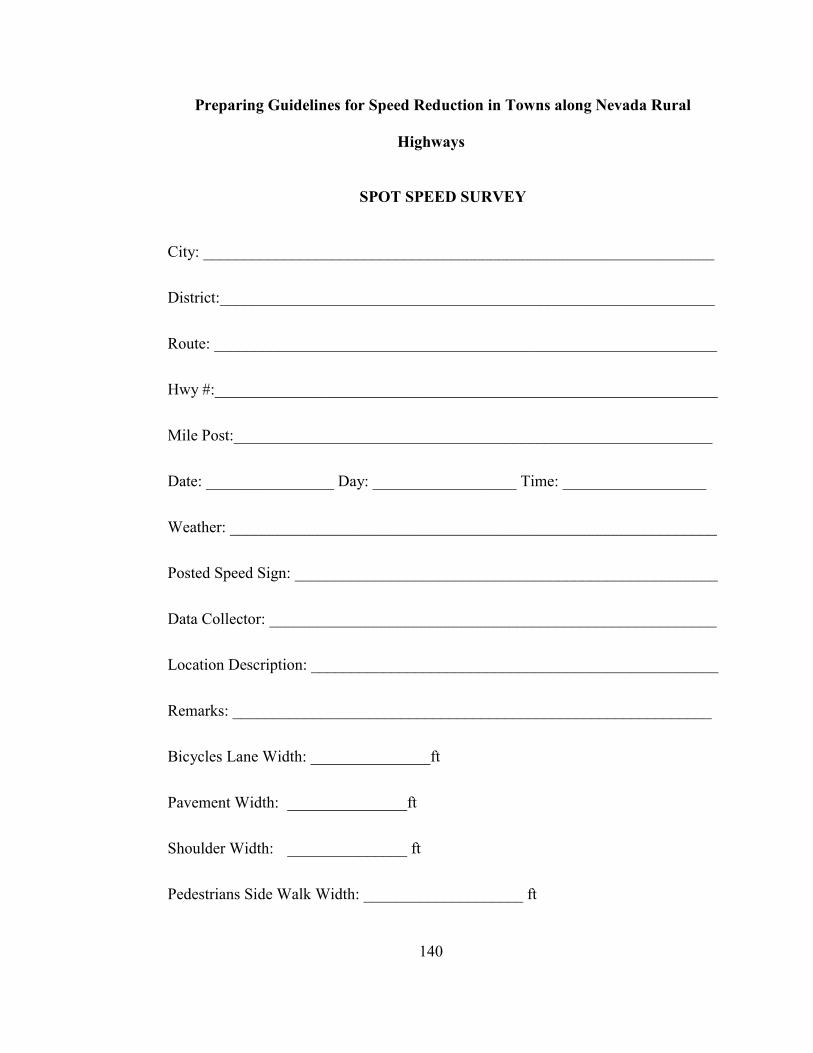
140
Preparing Guidelines for Speed Reduction in Towns along Nevada Rural
Highways
SPOT SPEED SURVEY
City: ________________________________________________________________
District:______________________________________________________________
Route: _______________________________________________________________
Hwy #:_______________________________________________________________
Mile Post:____________________________________________________________
Date: ________________ Day: __________________ Time: __________________
Weather: _____________________________________________________________
Posted Speed Sign: _____________________________________________________
Data Collector: ________________________________________________________
Location Description: ___________________________________________________
Remarks: ____________________________________________________________
Bicycles Lane Width: _______________ft
Pavement Width: _______________ft
Shoulder Width: _______________ ft
Pedestrians Side Walk Width: ____________________ ft
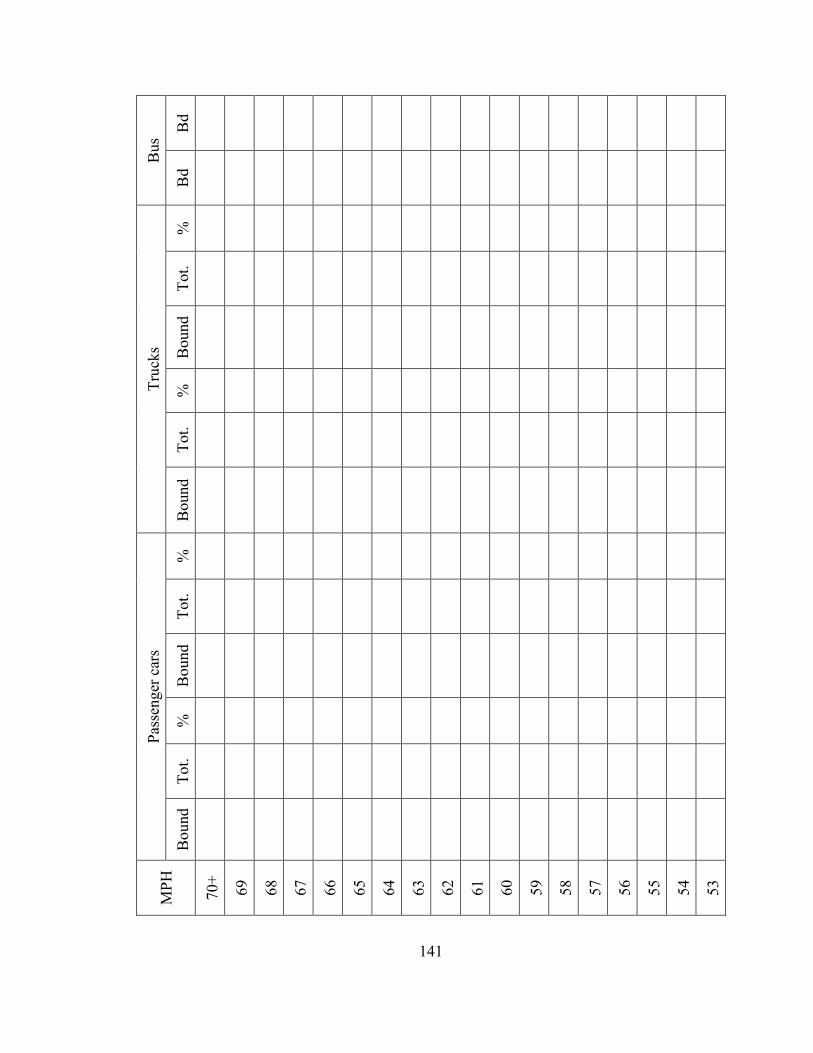
141
Bus
Bd
Bd
Tru
cks
%
Tot.
Bound
%
Tot.
Bound
Pas
senger
car
s
%
Tot.
Bound
%
Tot.
Bound
MP
H
70+
69
68
67
66
65
64
63
62
61
60
59
58
57
56
55
54
53
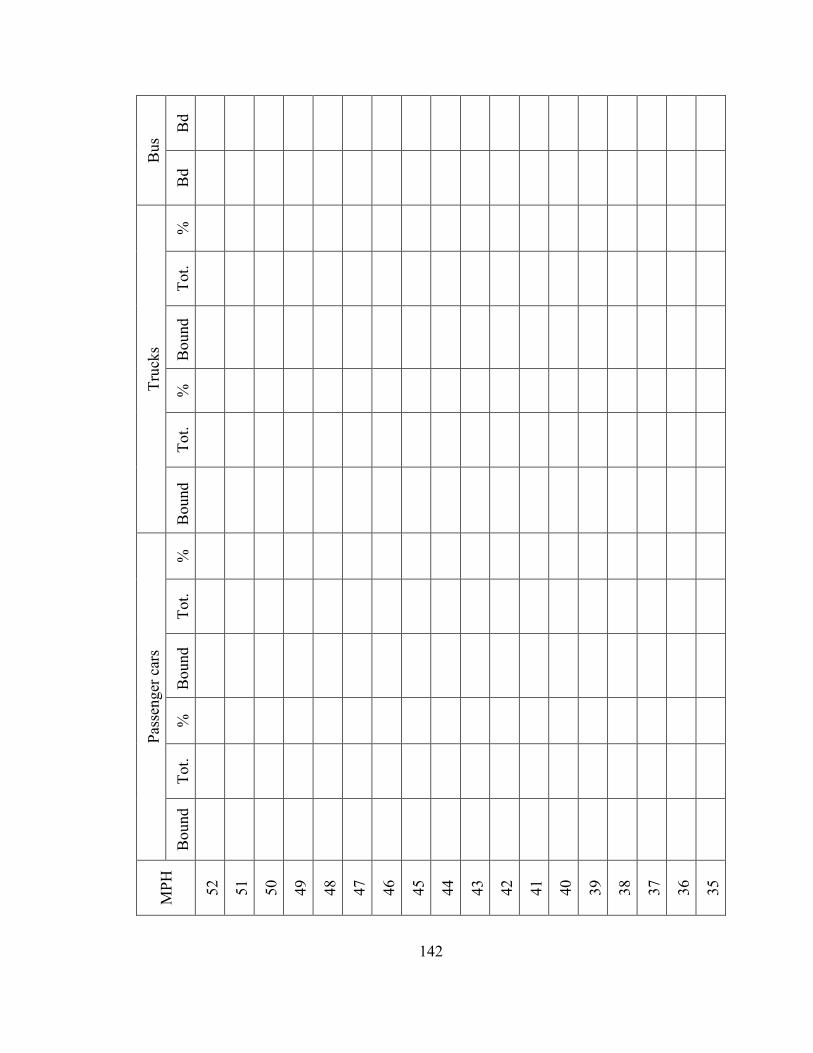
142
Bus
Bd
Bd
Tru
cks
%
Tot.
Bound
%
Tot.
Bound
Pas
senger
car
s
%
Tot.
Bound
%
Tot.
Bound
MP
H
52
51
50
49
48
47
46
45
44
43
42
41
40
39
38
37
36
35
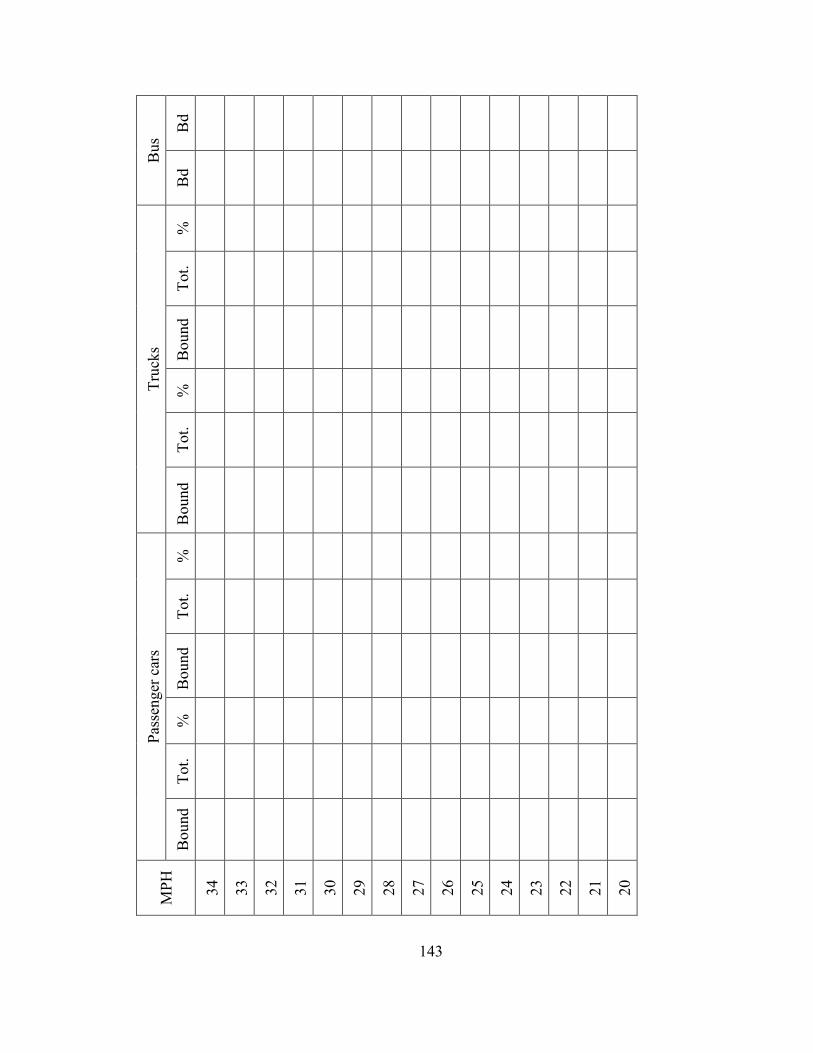
143
Bus
Bd
Bd
Tru
cks
%
Tot.
Bound
%
Tot.
Bound
Pas
senger
car
s
%
Tot.
Bound
%
Tot.
Bound
MP
H
34
33
32
31
30
29
28
27
26
25
24
23
22
21
20

144
APPENDIX D SITE MAPS OF TOWNS UNDER STUDY
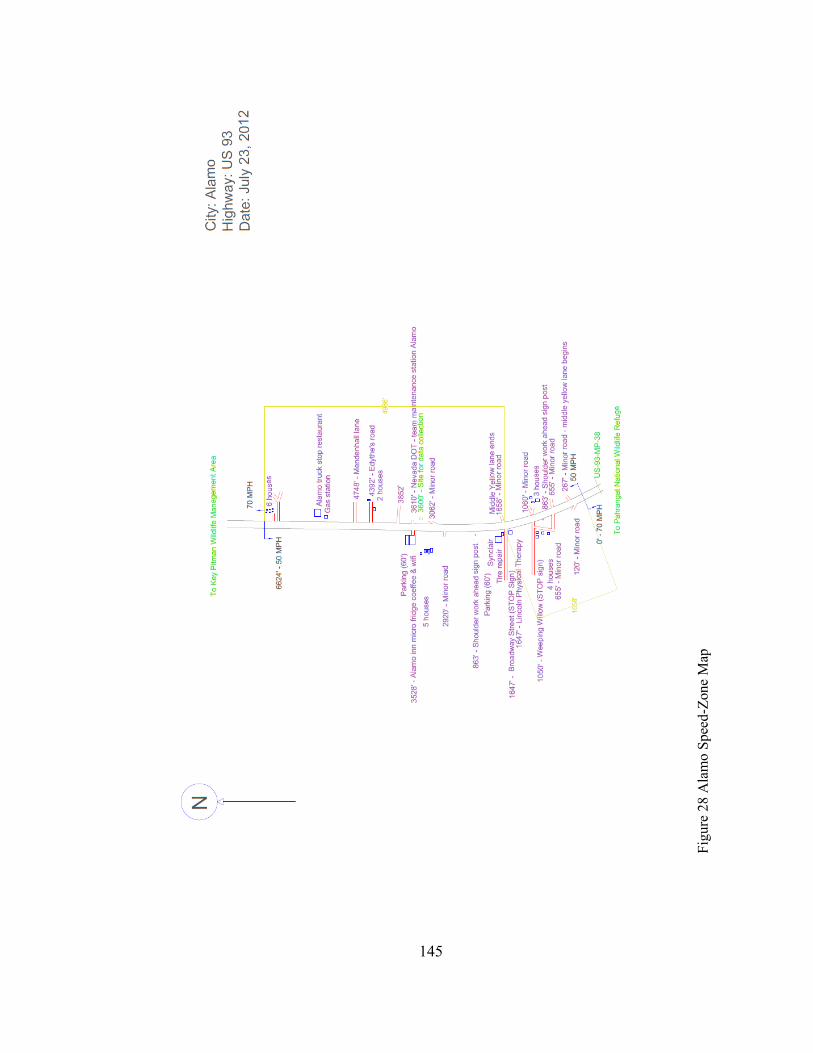
145
Fig
ure
28
Ala
mo
Sp
eed
-Zone
Map
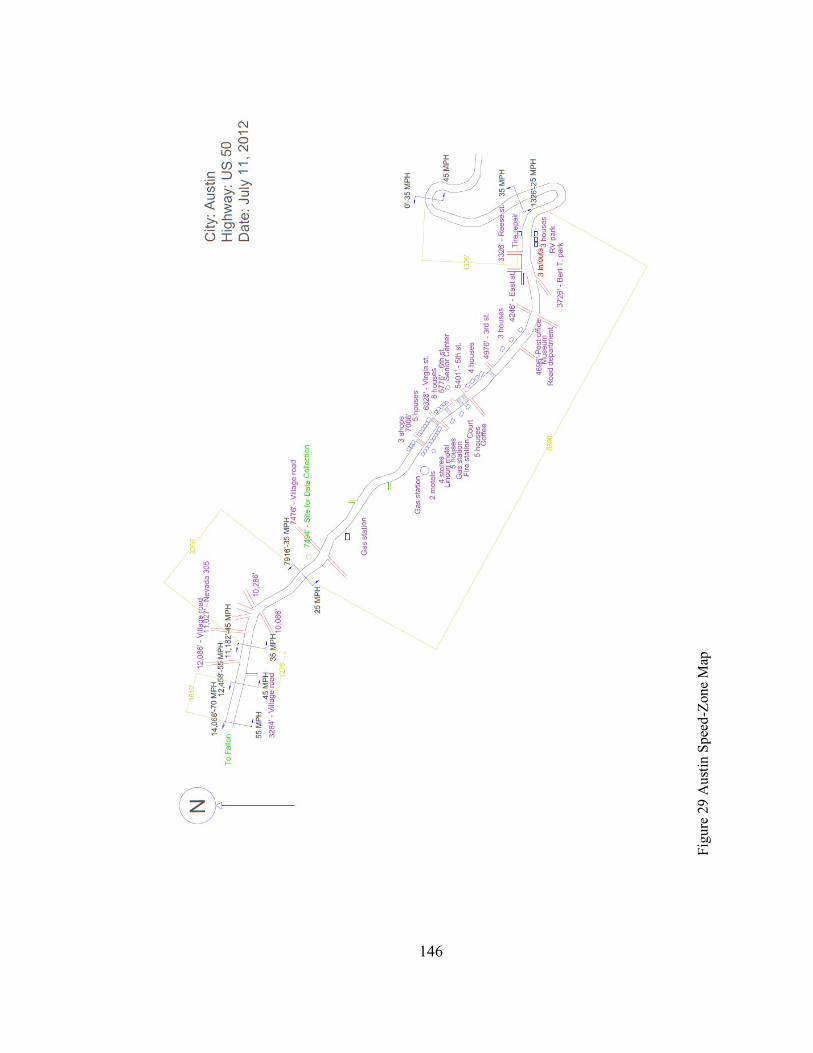
146
Fig
ure
29
Au
stin
Sp
eed
-Zone
Map
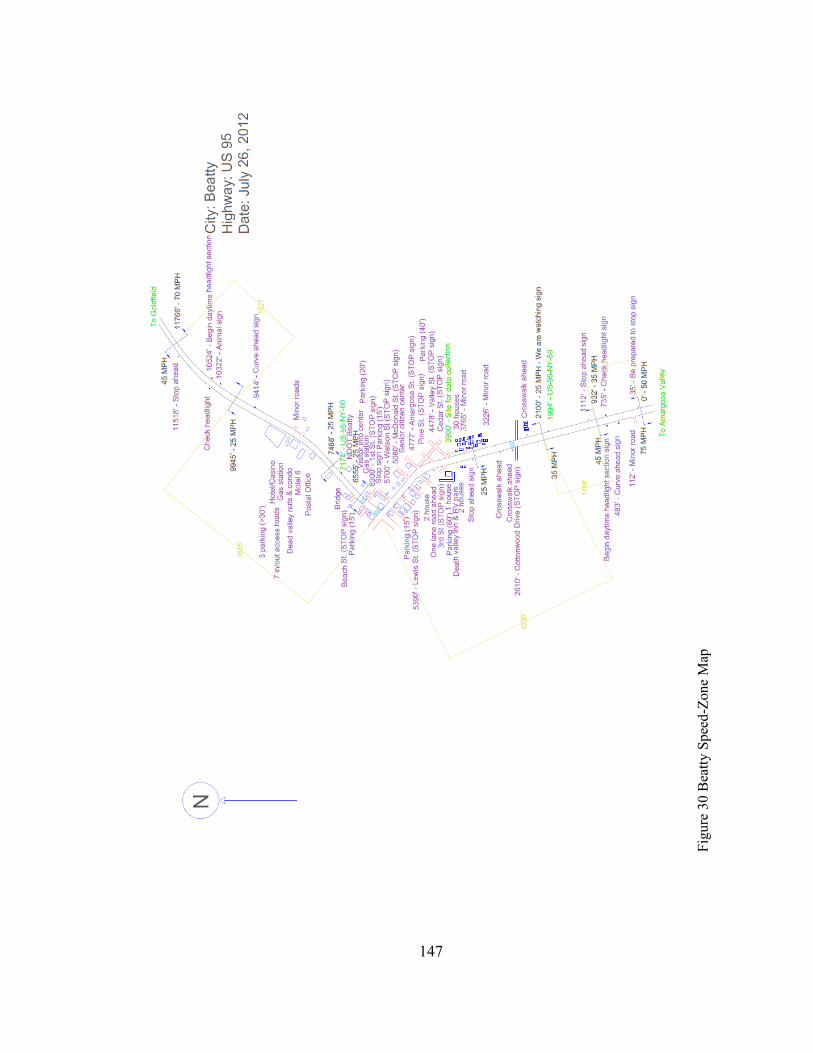
147
Fig
ure
30
Bea
tty
Sp
eed
-Zone
Map
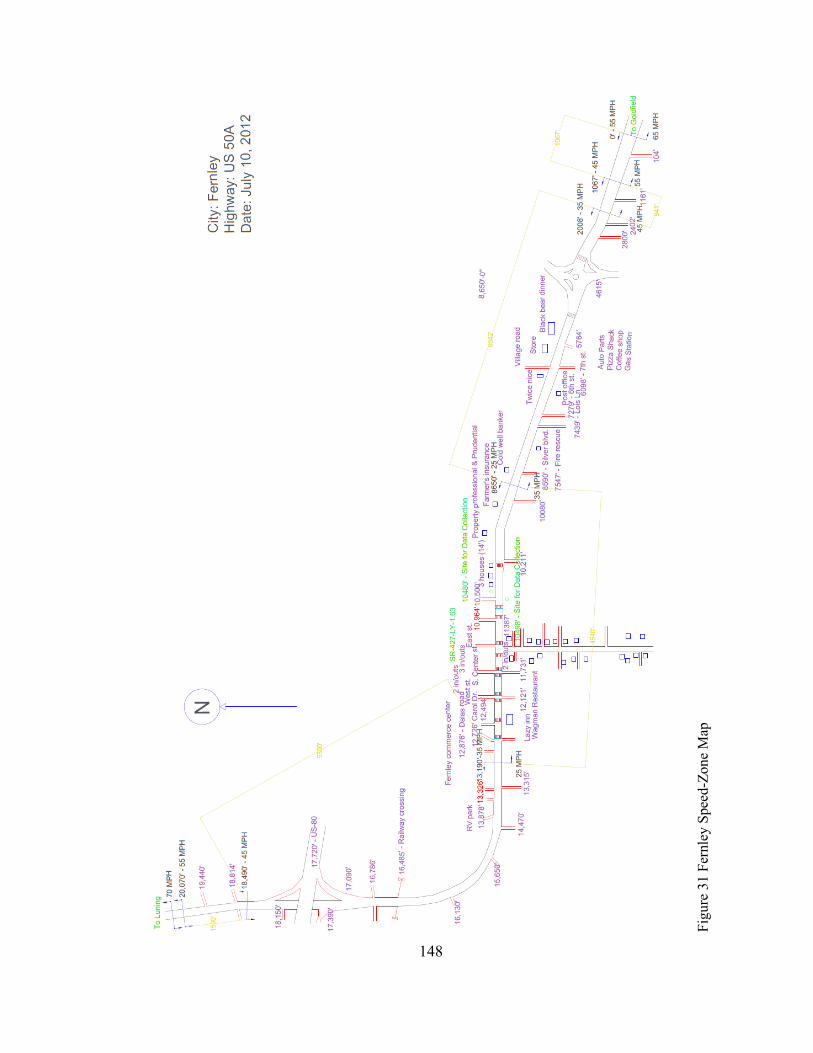
148
Fig
ure
31
Fer
nle
y S
pee
d-Z
on
e M
ap
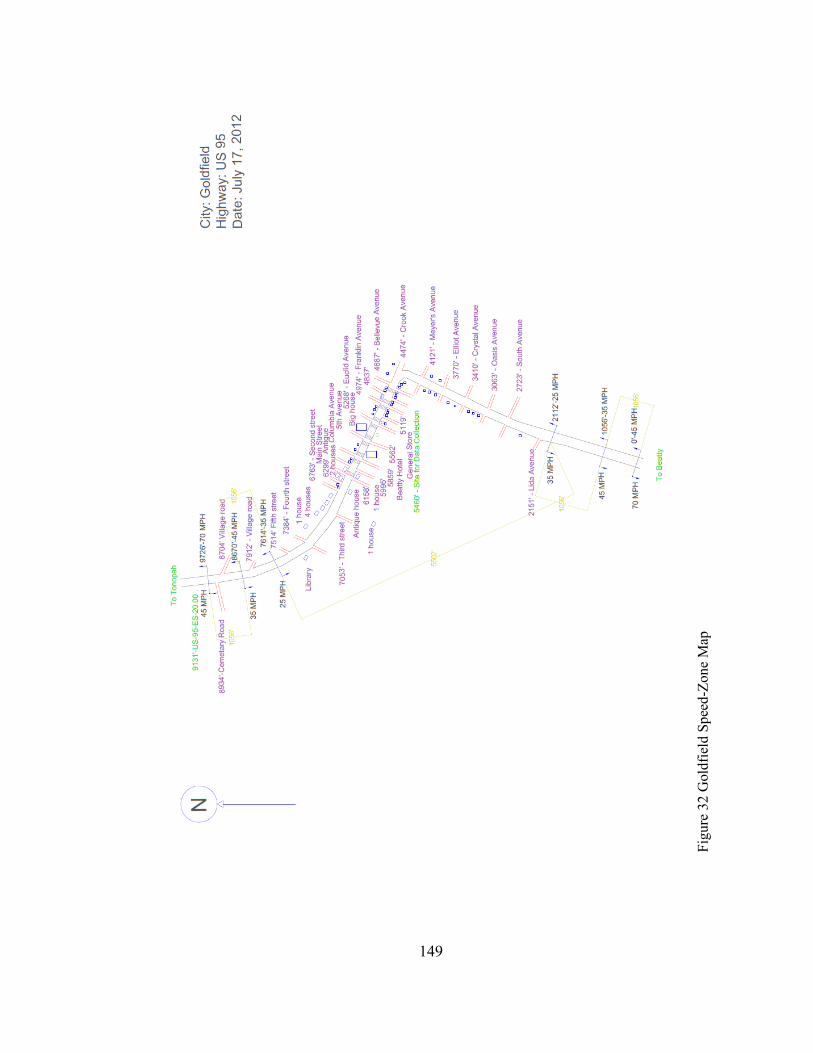
149
Fig
ure
32
Gold
fiel
d S
pee
d-Z
one
Map
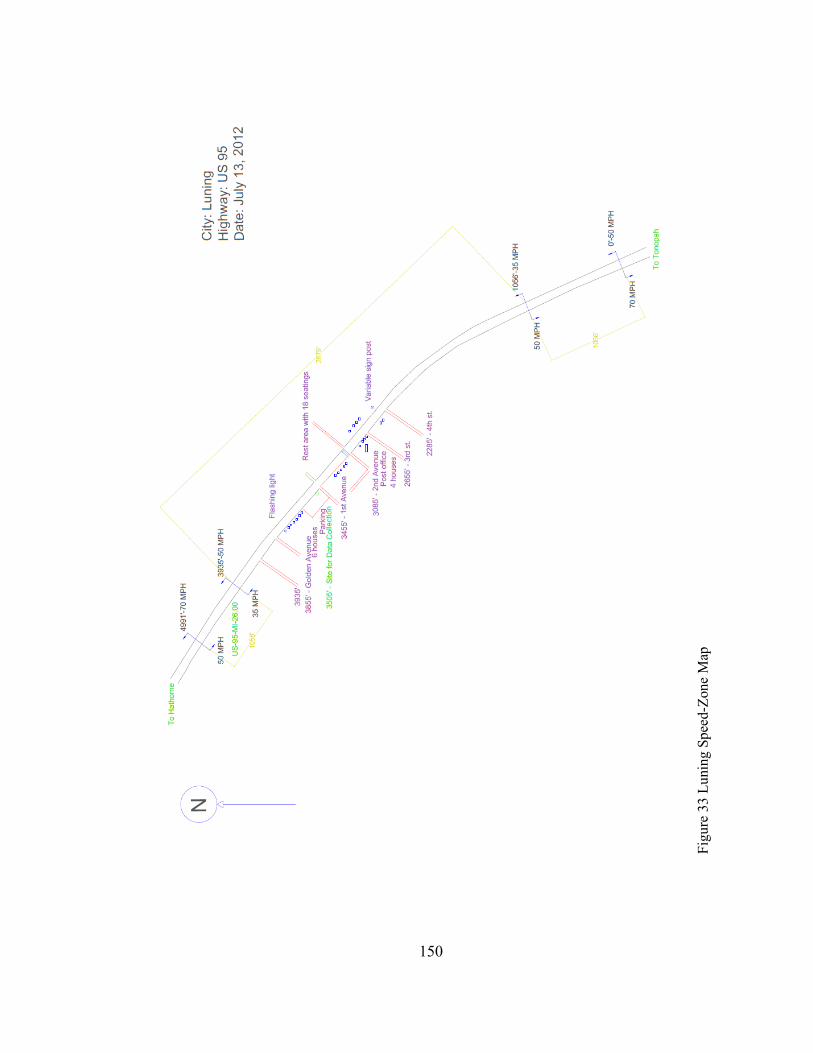
150
Fig
ure
33
Lu
nin
g S
pee
d-Z
one
Map
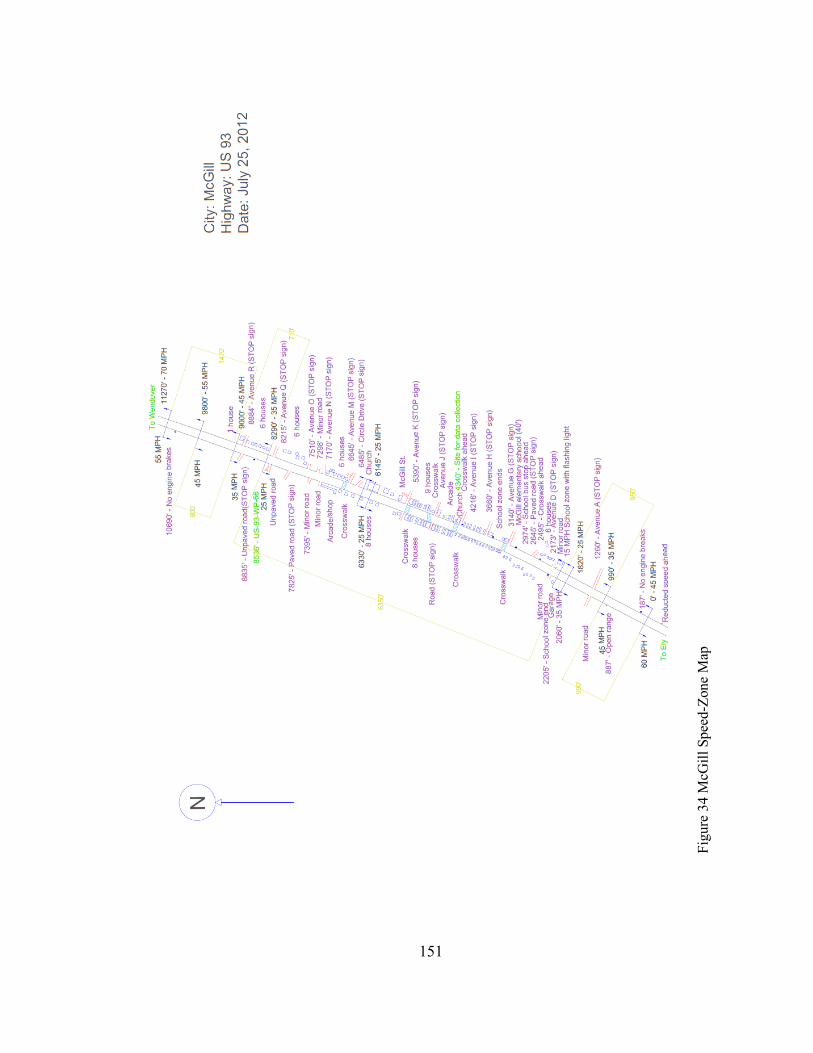
151
Fig
ure
34
McG
ill
Sp
eed-Z
one
Map
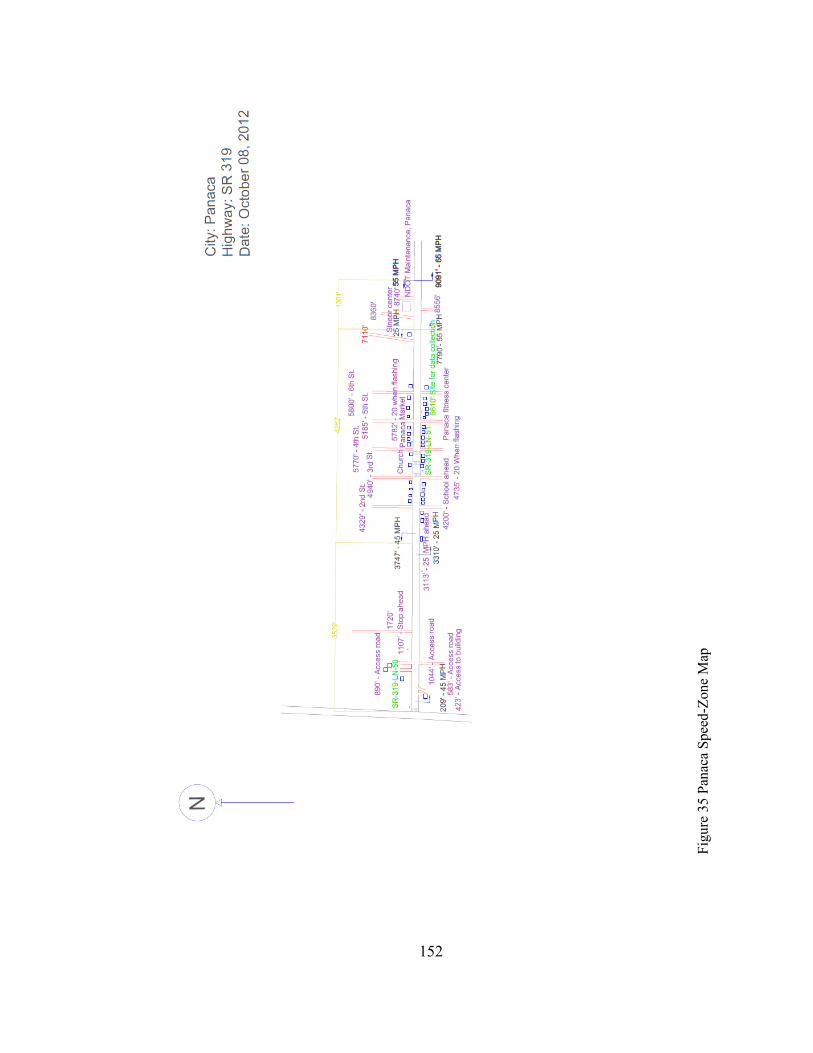
152
Fig
ure
35
Pan
aca
Sp
eed
-Zone
Map
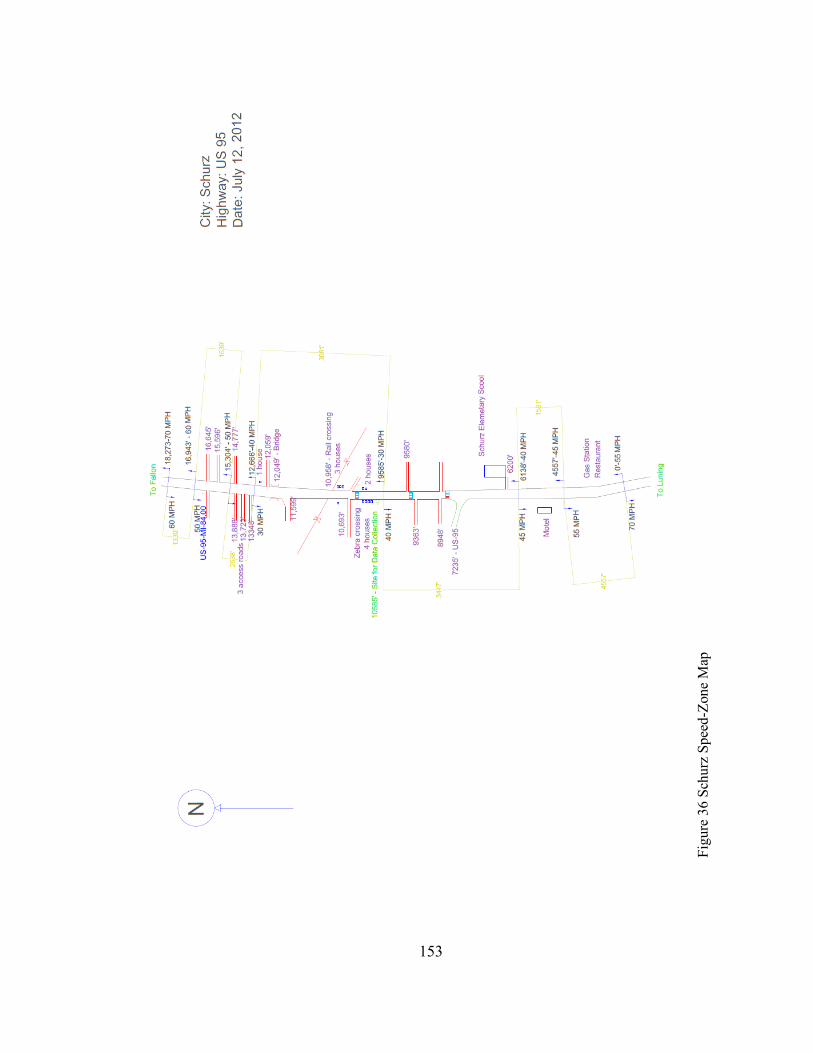
153
Fig
ure
36
Sch
urz
Sp
eed
-Zone
Map
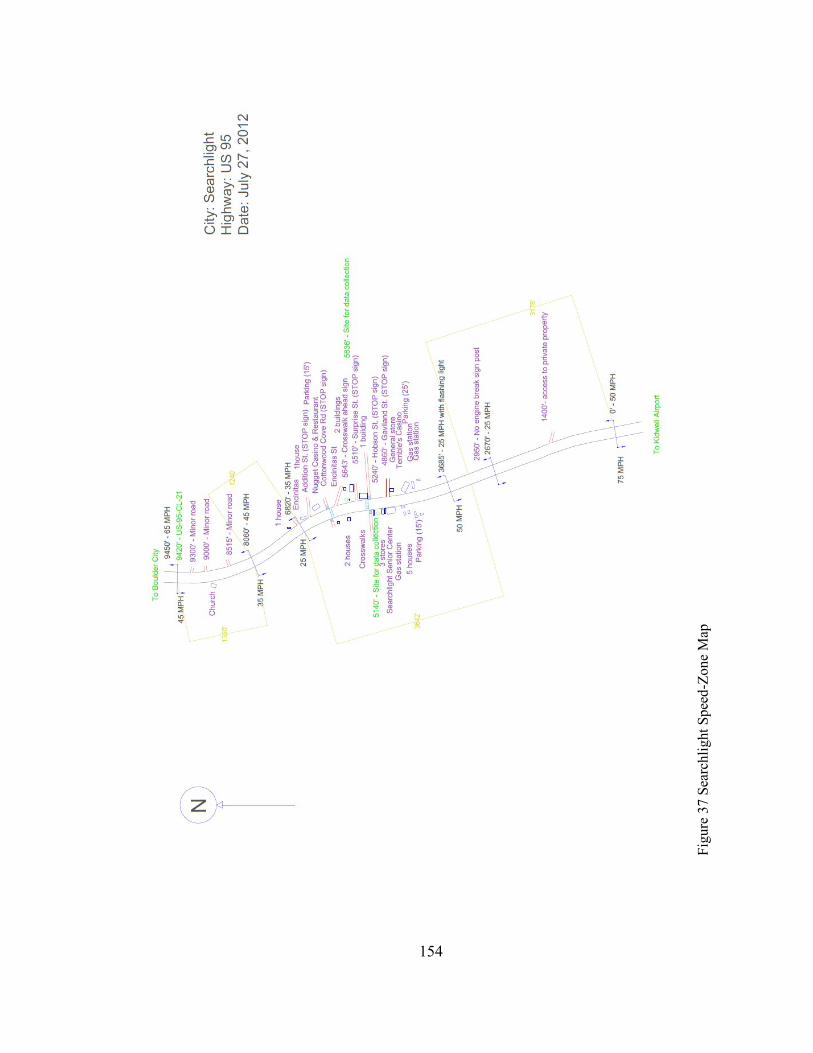
154
Fig
ure
37
Sea
rch
lig
ht
Spee
d-Z
one
Map
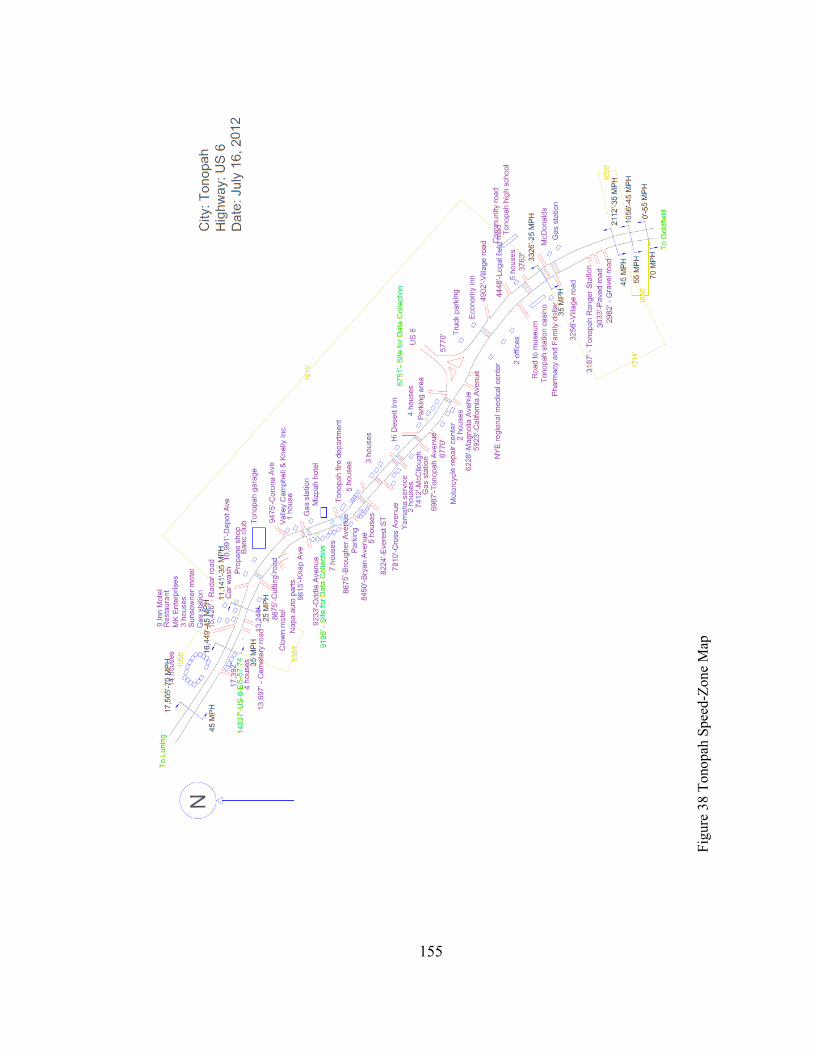
155
Fig
ure
38
To
no
pah
Sp
eed-Z
one
Map

156
APPENDIX E CUMULATIVE SPOT SPEEDS AND 85TH
PERCENTILE SPEEDS
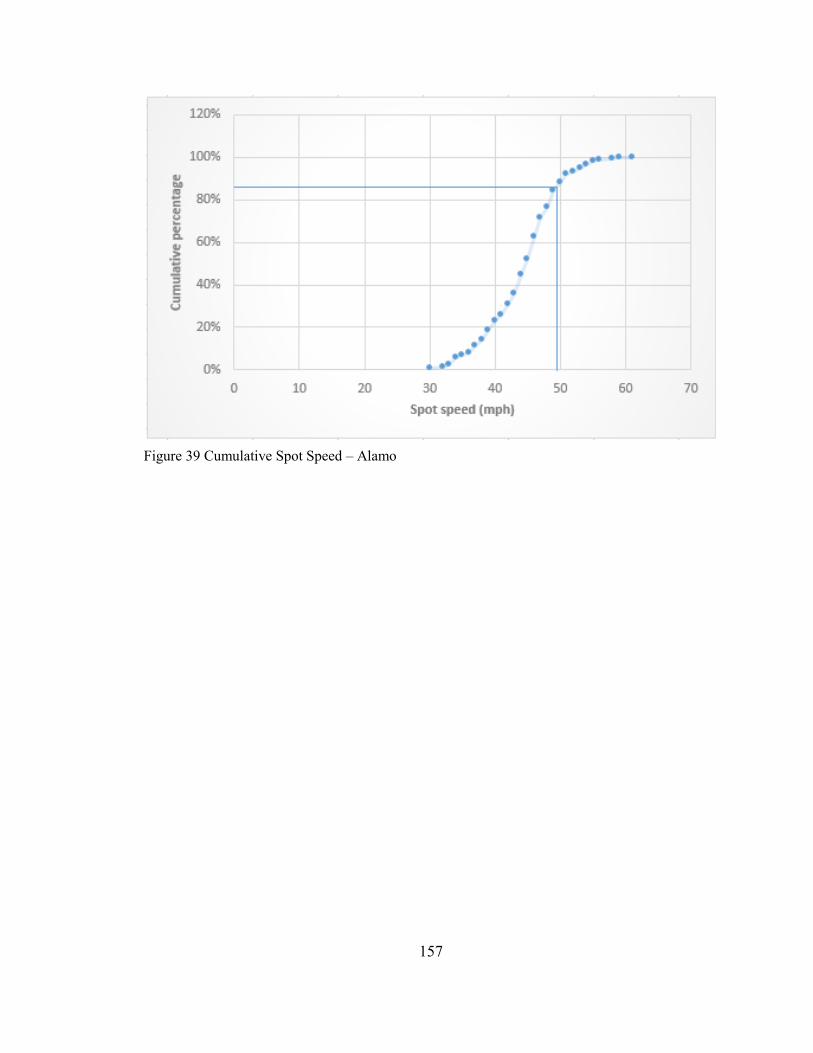
157
Figure 39 Cumulative Spot Speed – Alamo
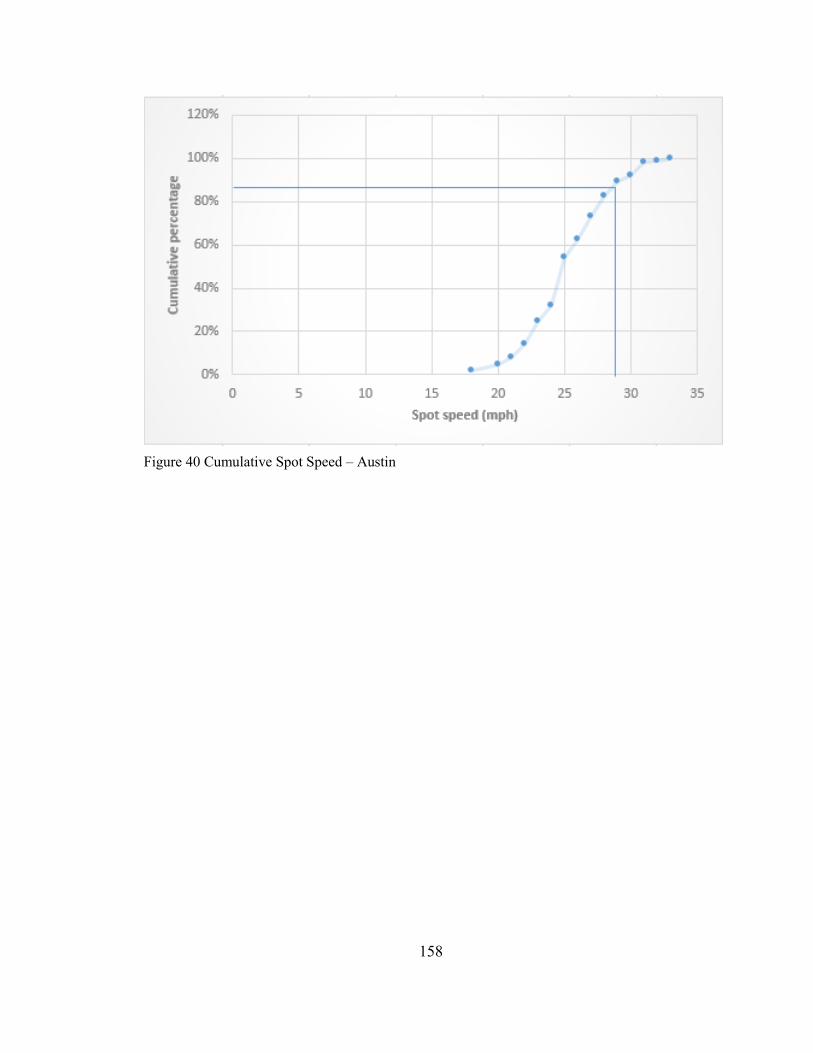
158
Figure 40 Cumulative Spot Speed – Austin
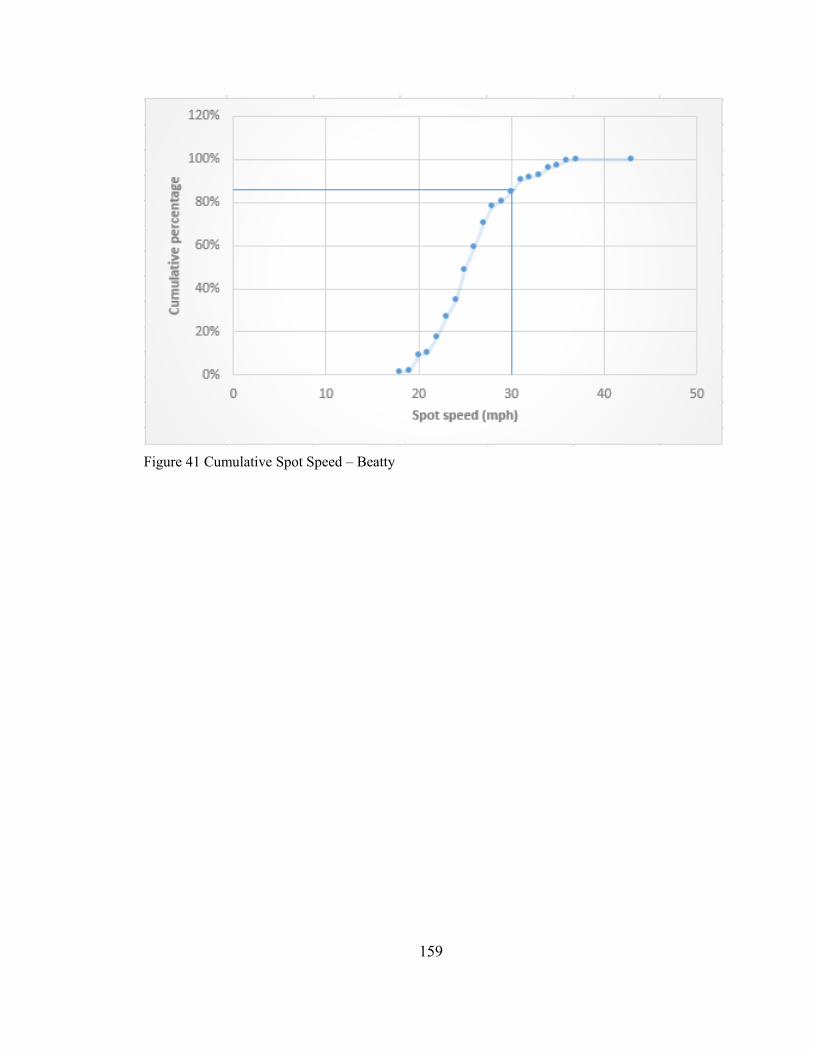
159
Figure 41 Cumulative Spot Speed – Beatty
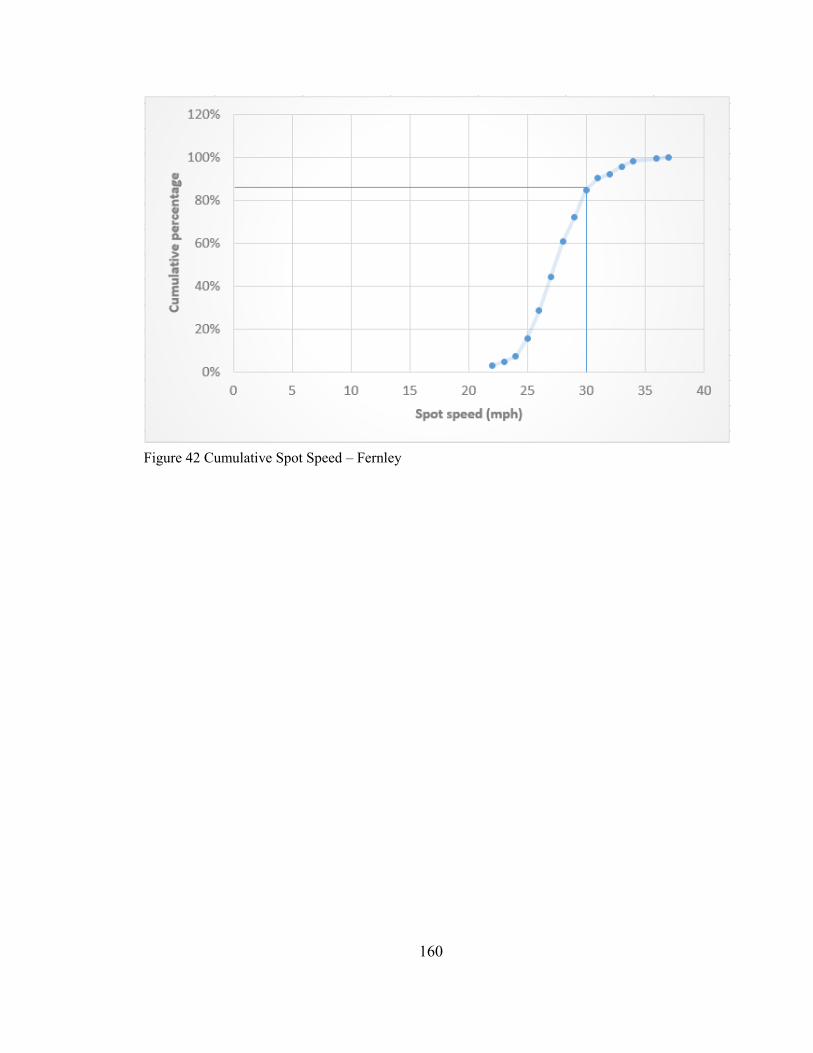
160
Figure 42 Cumulative Spot Speed – Fernley
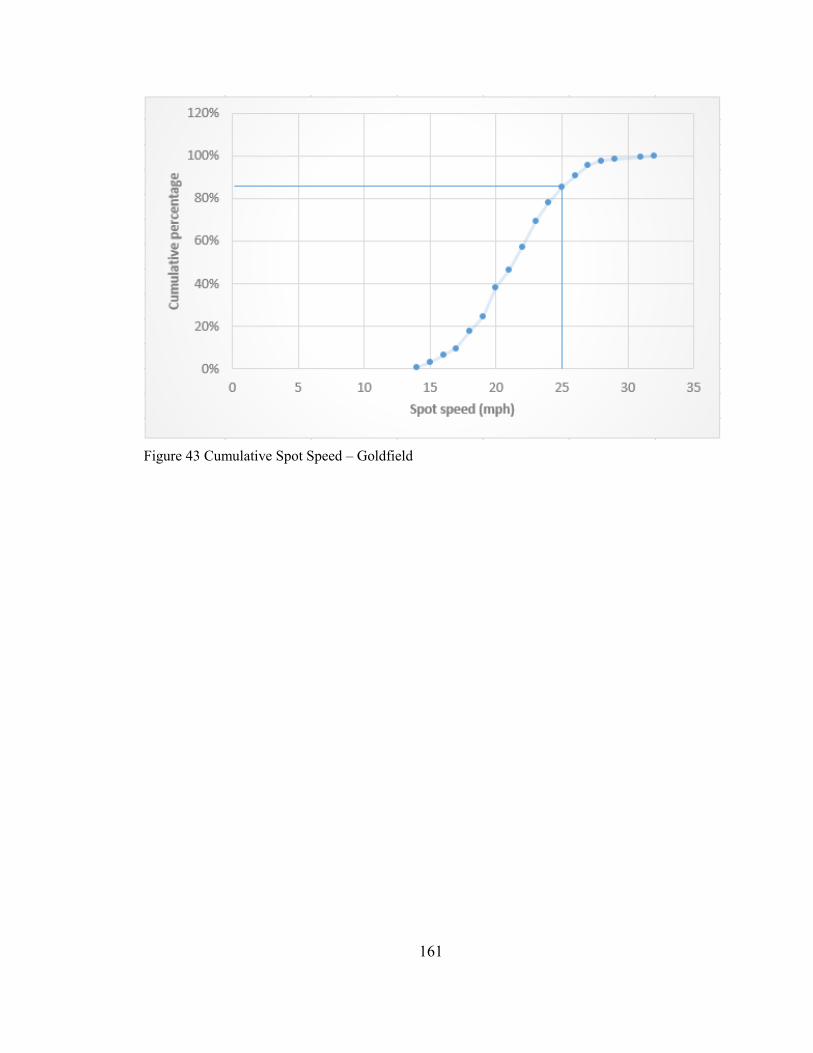
161
Figure 43 Cumulative Spot Speed – Goldfield
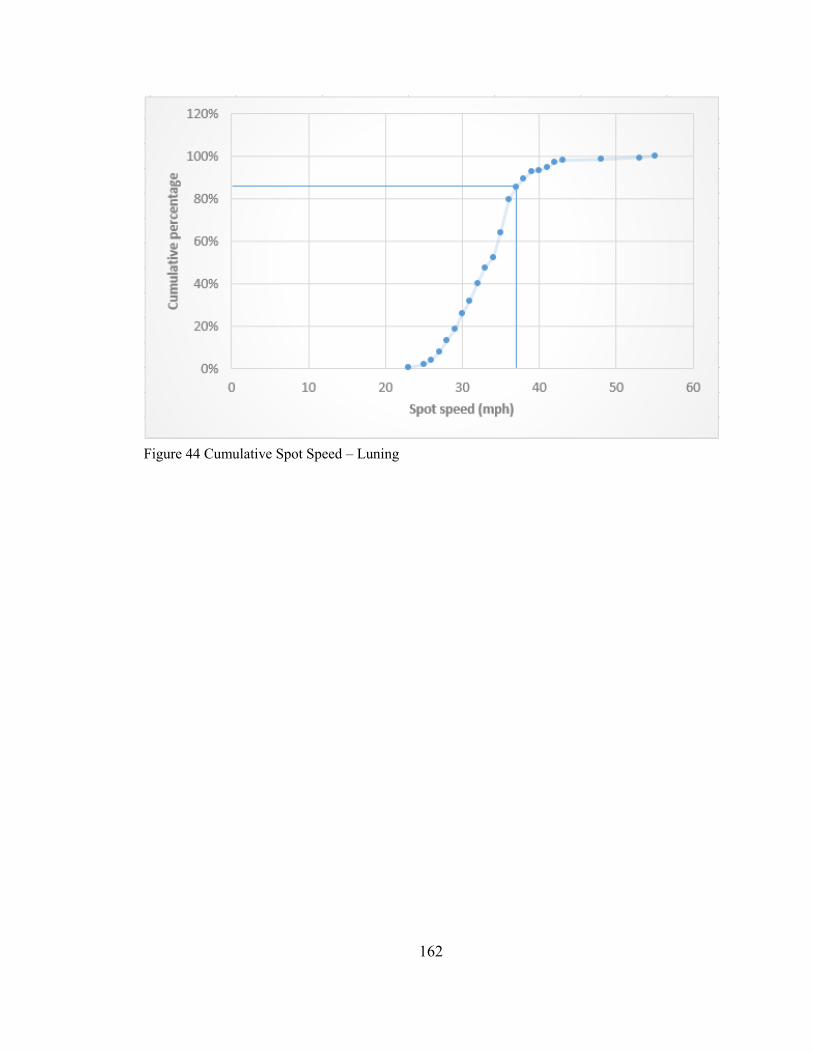
162
Figure 44 Cumulative Spot Speed – Luning
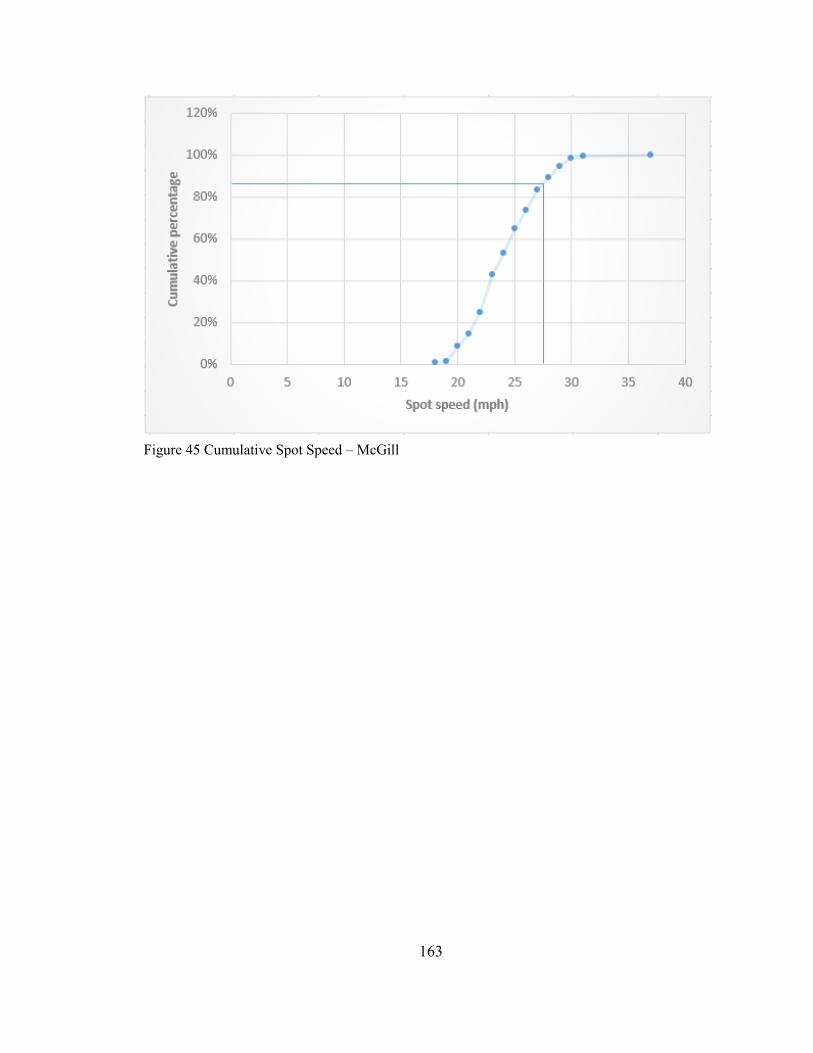
163
Figure 45 Cumulative Spot Speed – McGill
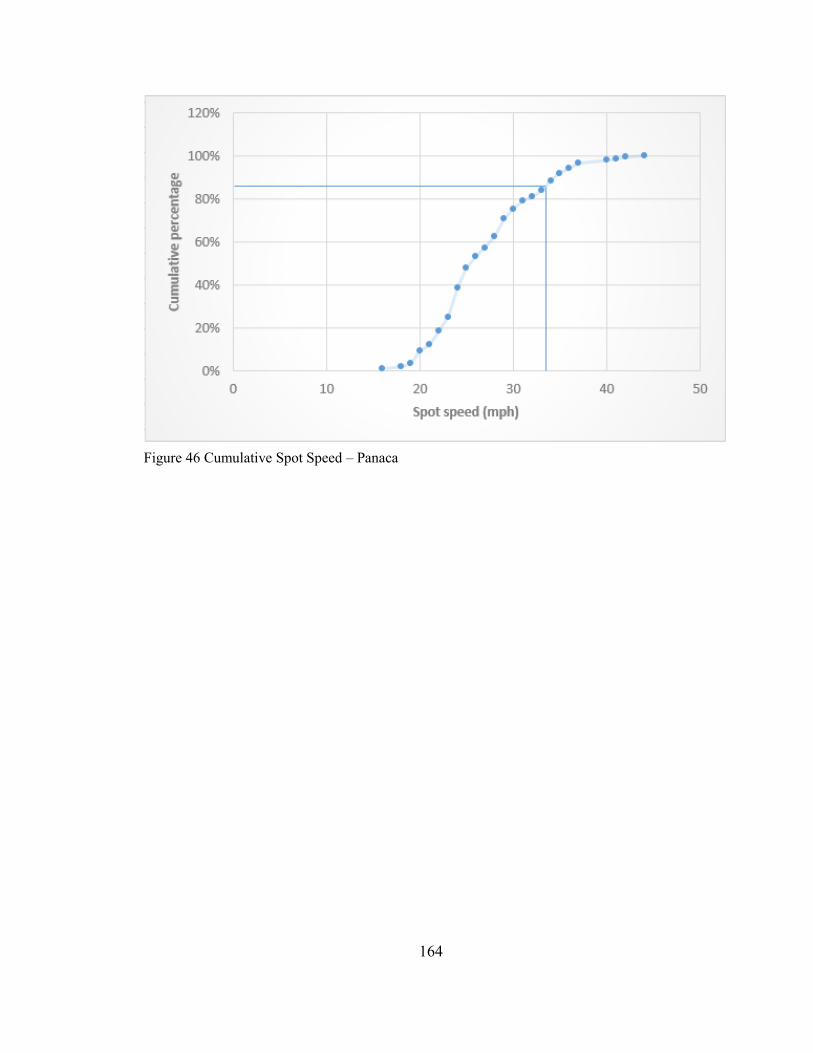
164
Figure 46 Cumulative Spot Speed – Panaca
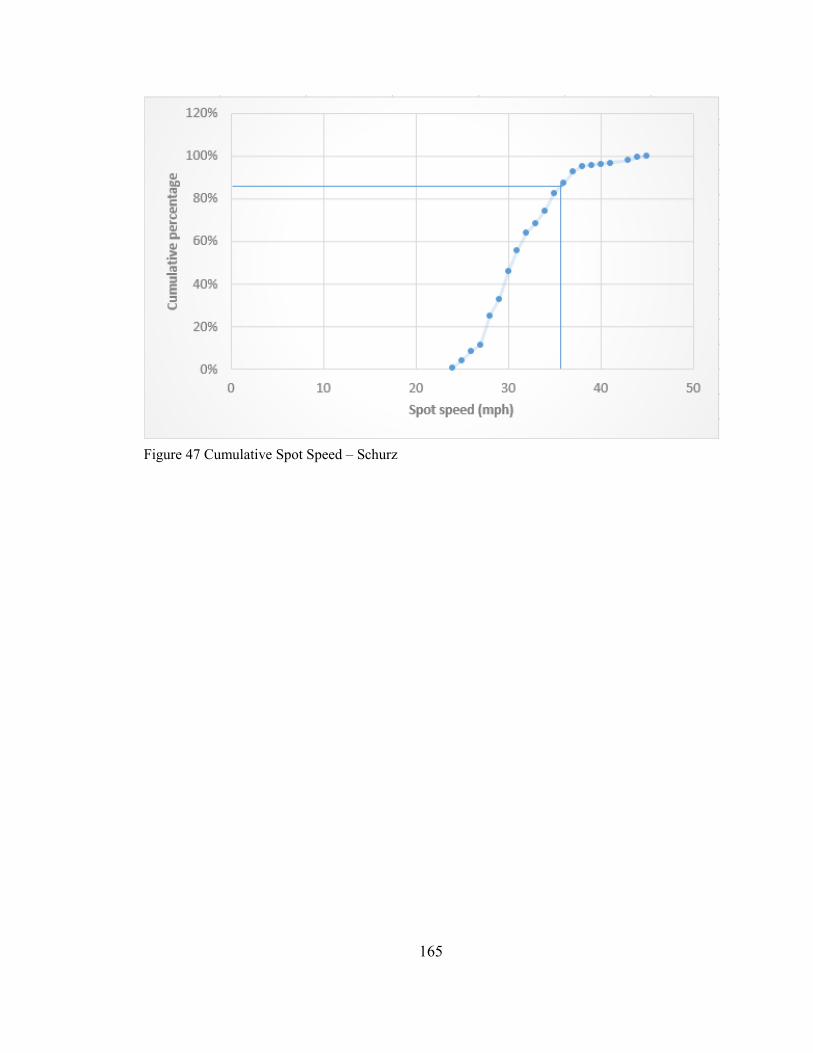
165
Figure 47 Cumulative Spot Speed – Schurz
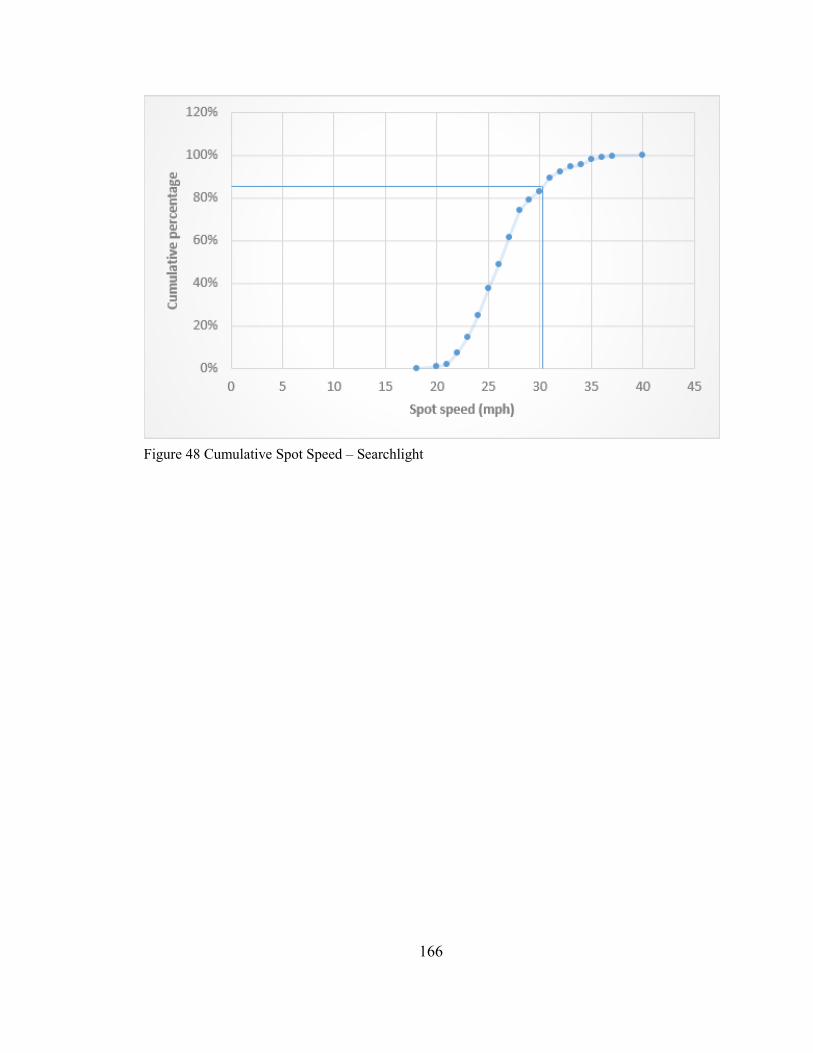
166
Figure 48 Cumulative Spot Speed – Searchlight
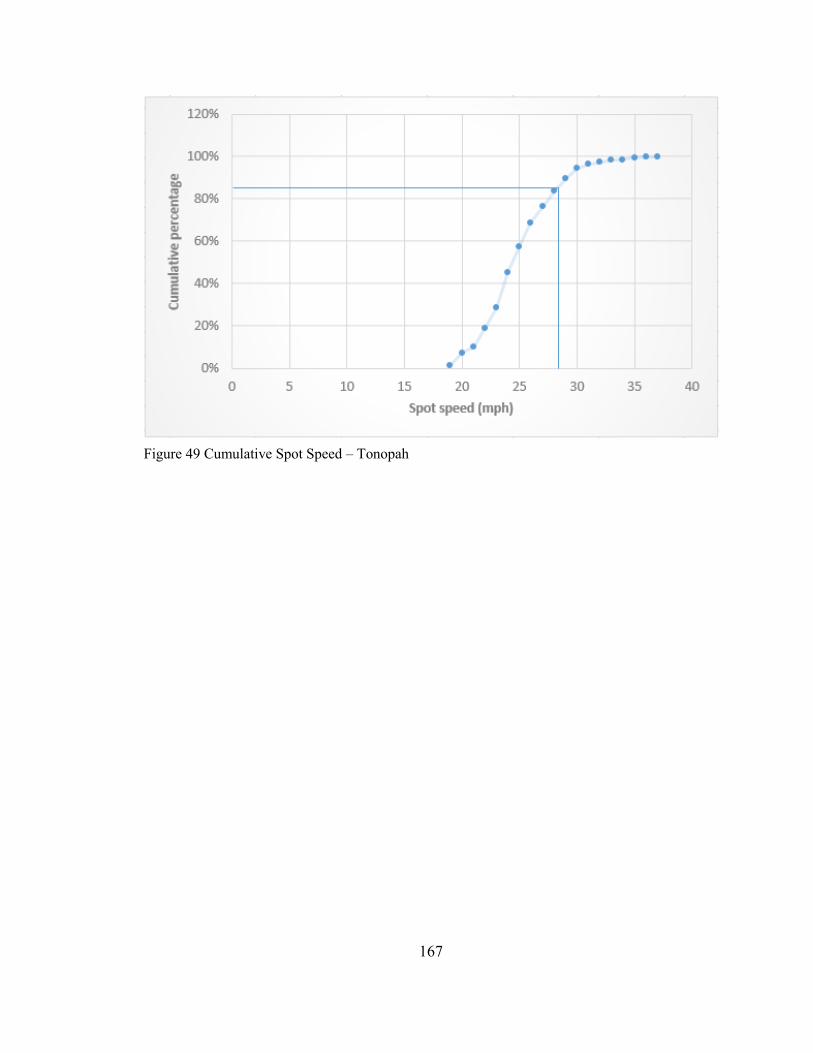
167
Figure 49 Cumulative Spot Speed – Tonopah
168
APPENDIX F CORRELATION COEFFICIENTS BETWEEN CRASHES AND
SPEED VALUES
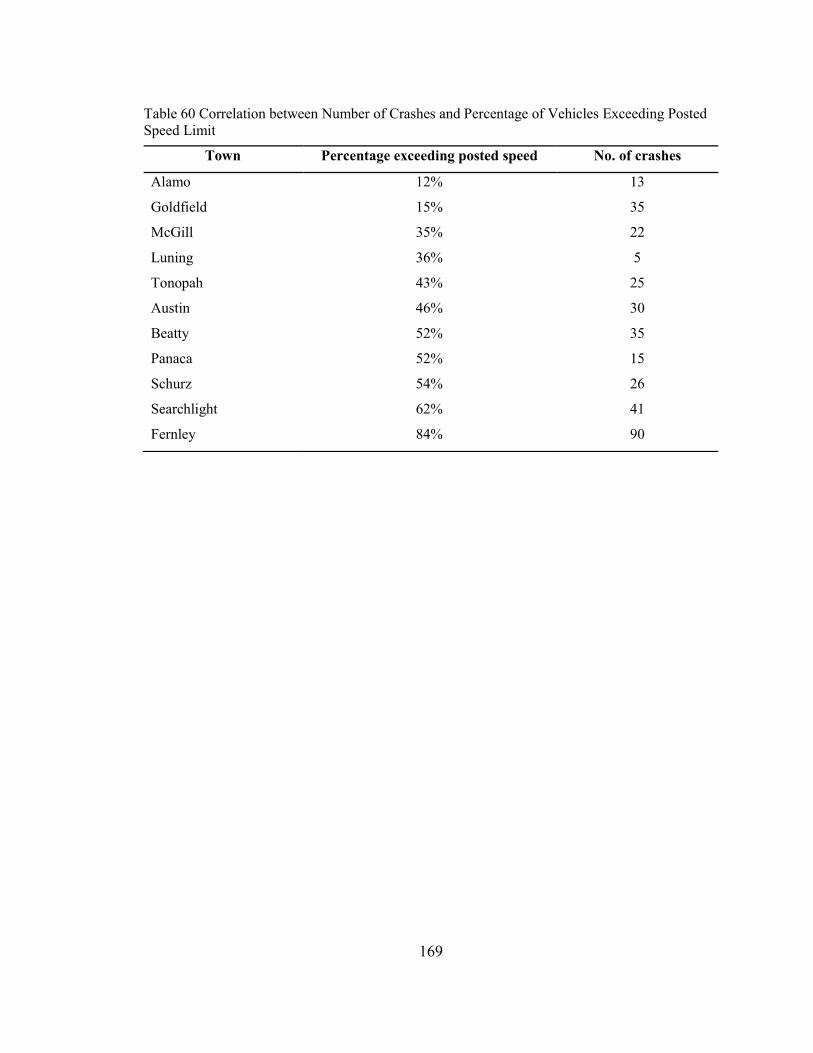
169
Table 60 Correlation between Number of Crashes and Percentage of Vehicles Exceeding Posted
Speed Limit
Town Percentage exceeding posted speed No. of crashes
Alamo 12% 13
Goldfield 15% 35
McGill 35% 22
Luning 36% 5
Tonopah 43% 25
Austin 46% 30
Beatty 52% 35
Panaca 52% 15
Schurz 54% 26
Searchlight 62% 41
Fernley 84% 90
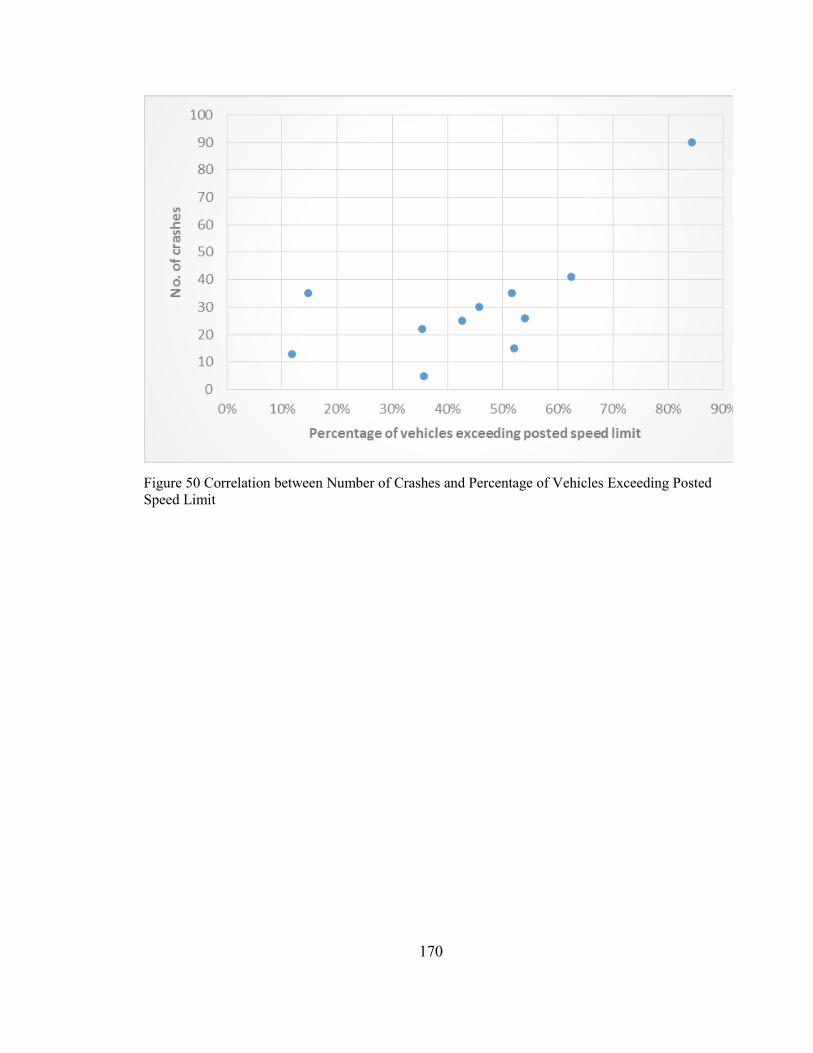
170
Figure 50 Correlation between Number of Crashes and Percentage of Vehicles Exceeding Posted
Speed Limit
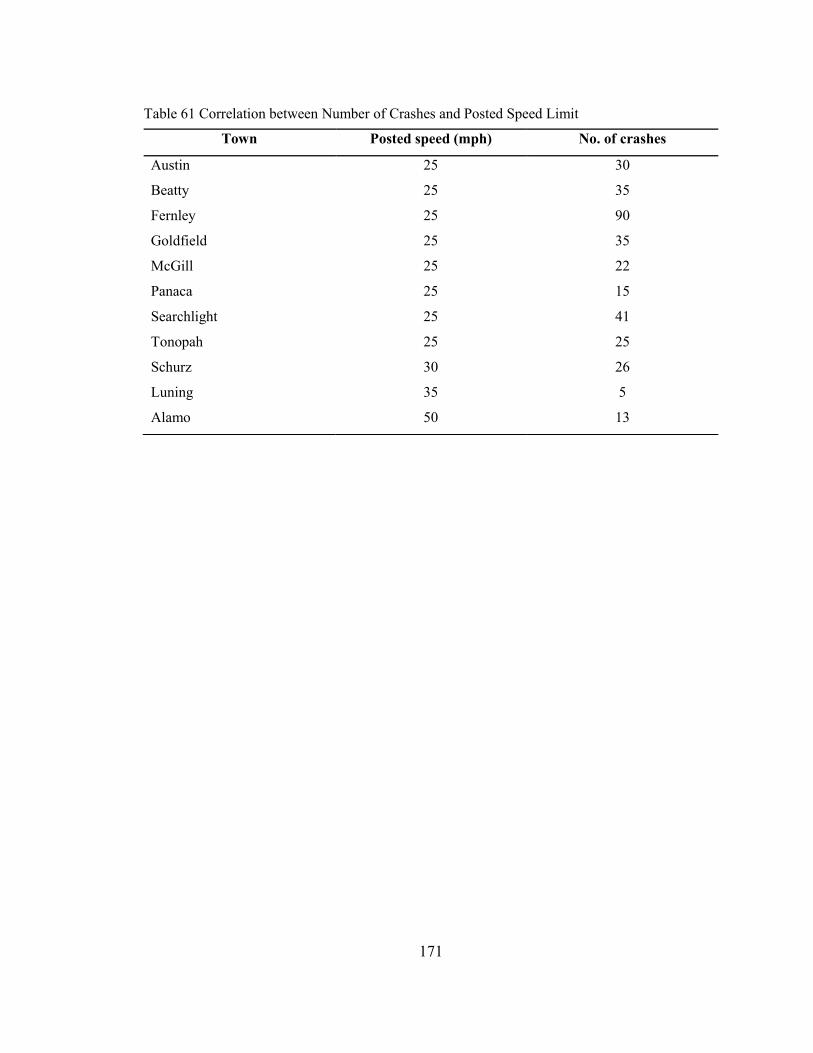
171
Table 61 Correlation between Number of Crashes and Posted Speed Limit
Town Posted speed (mph) No. of crashes
Austin 25 30
Beatty 25 35
Fernley 25 90
Goldfield 25 35
McGill 25 22
Panaca 25 15
Searchlight 25 41
Tonopah 25 25
Schurz 30 26
Luning 35 5
Alamo 50 13
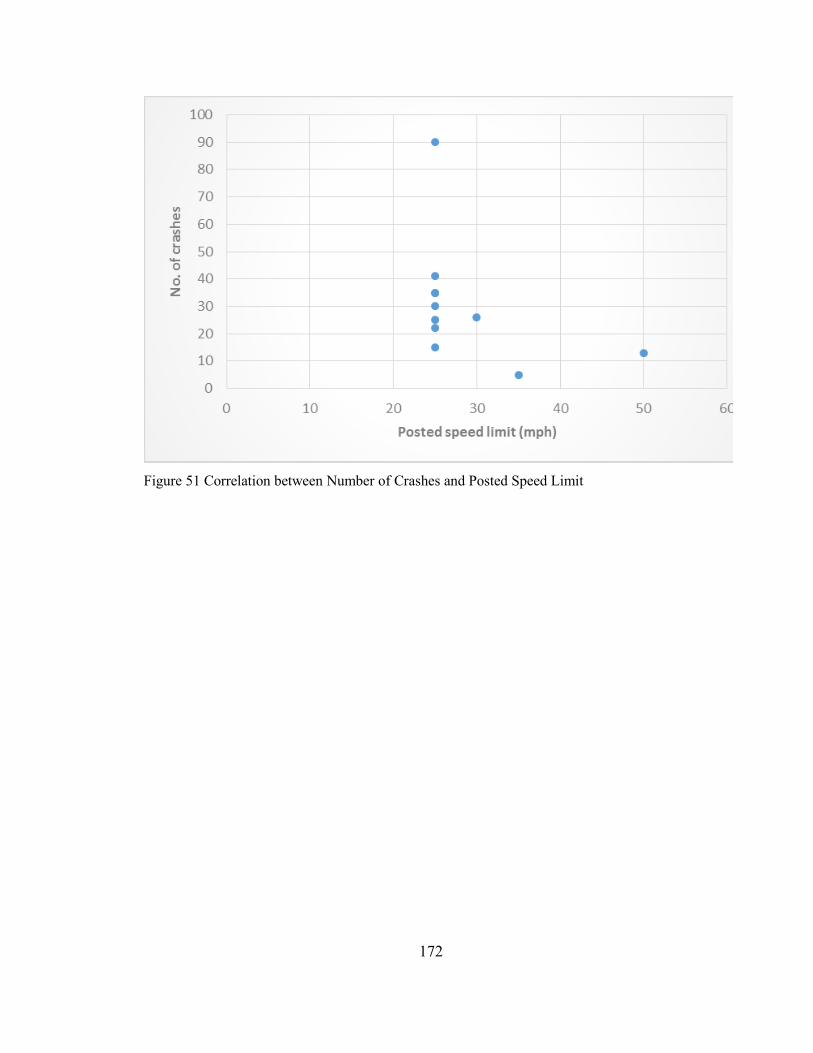
172
Figure 51 Correlation between Number of Crashes and Posted Speed Limit

173
Table 62 Correlation between Number of Crashes and 85th Percentile Speed
Town 85th
percentile speed (mph) No. of crashes
Goldfield 25 35
McGill 27 22
Austin 28 30
Tonopah 28 25
Beatty 30 35
Fernley 30 90
Searchlight 30 41
Schurz 35 26
Luning 37 5
Panaca 47 15
Alamo 49 13
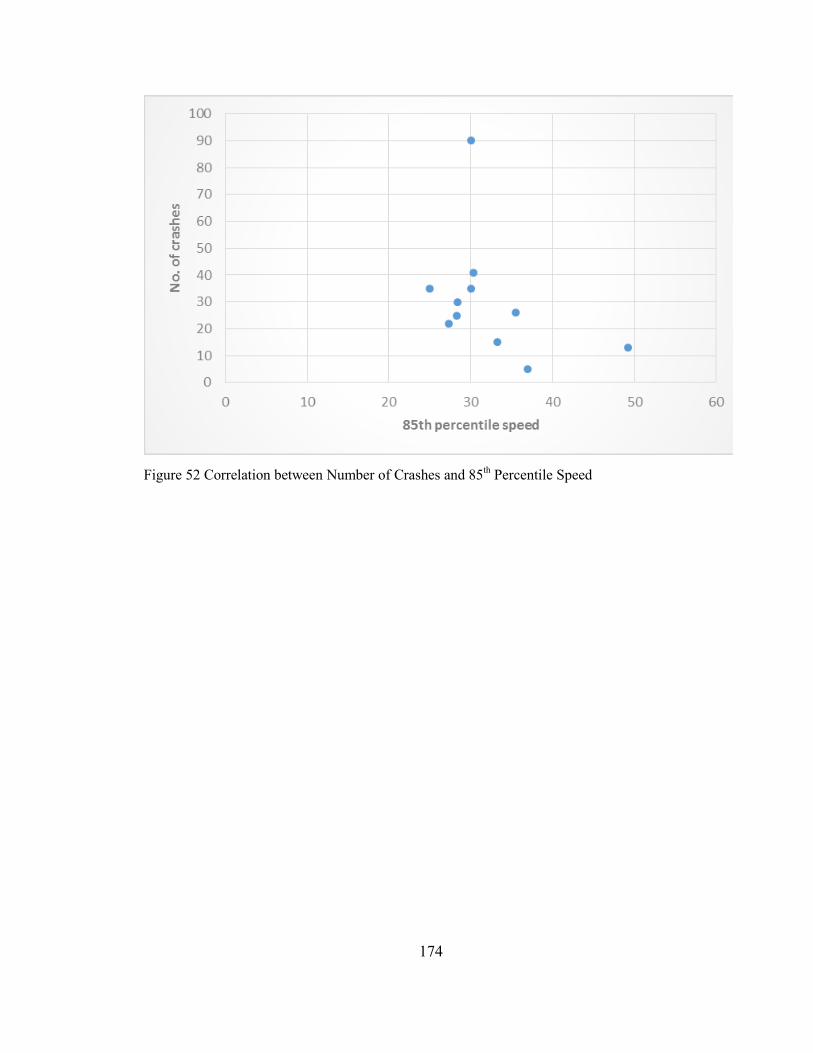
174
Figure 52 Correlation between Number of Crashes and 85th Percentile Speed
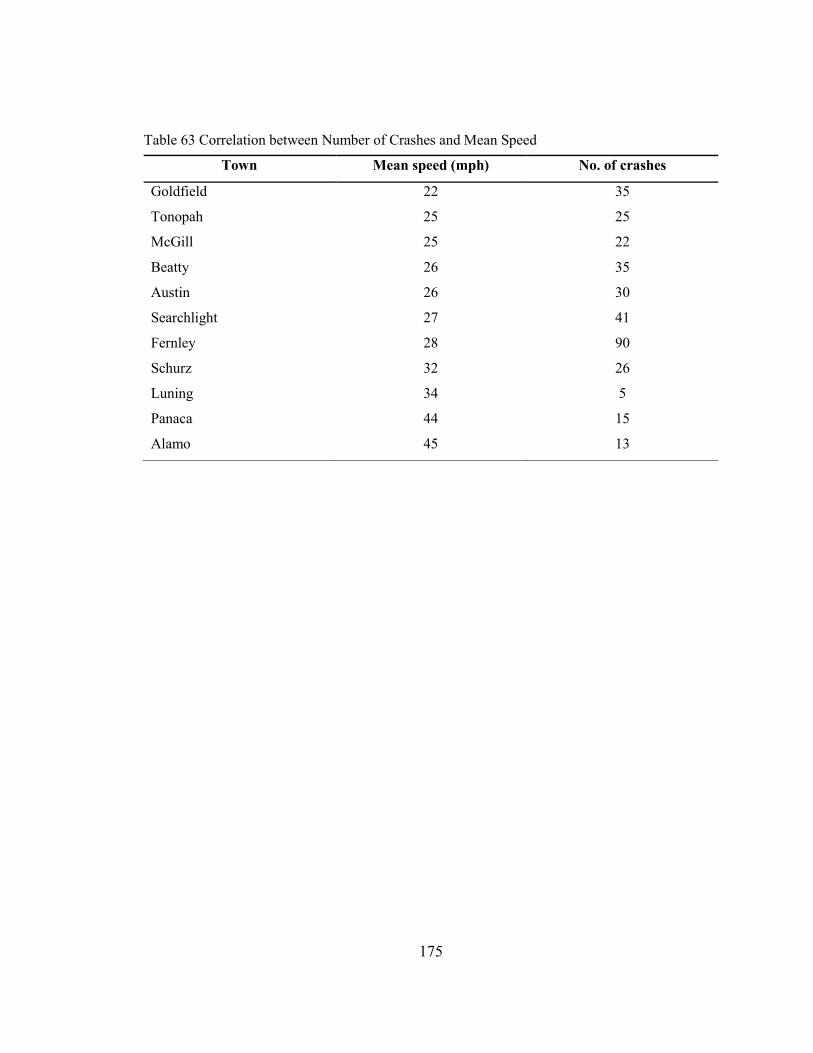
175
Table 63 Correlation between Number of Crashes and Mean Speed
Town Mean speed (mph) No. of crashes
Goldfield 22 35
Tonopah 25 25
McGill 25 22
Beatty 26 35
Austin 26 30
Searchlight 27 41
Fernley 28 90
Schurz 32 26
Luning 34 5
Panaca 44 15
Alamo 45 13
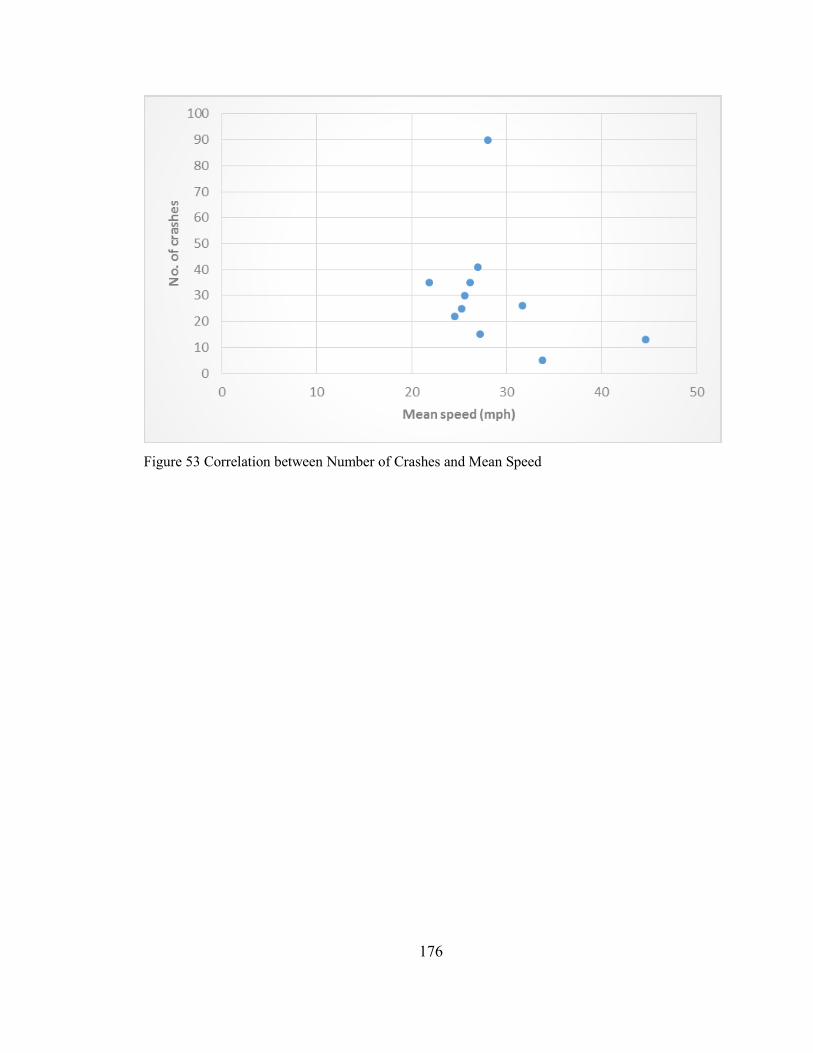
176
Figure 53 Correlation between Number of Crashes and Mean Speed

177
Table 64 Correlation between Number of Crashes and Median Speed
Town Median speed (mph) No. of crashes
Goldfield 22 35
McGill 24 22
Austin 25 30
Tonopah 25 25
Beatty 26 35
Searchlight 27 41
Fernley 28 90
Schurz 31 26
Luning 34 5
Panaca 43 15
Alamo 45 13
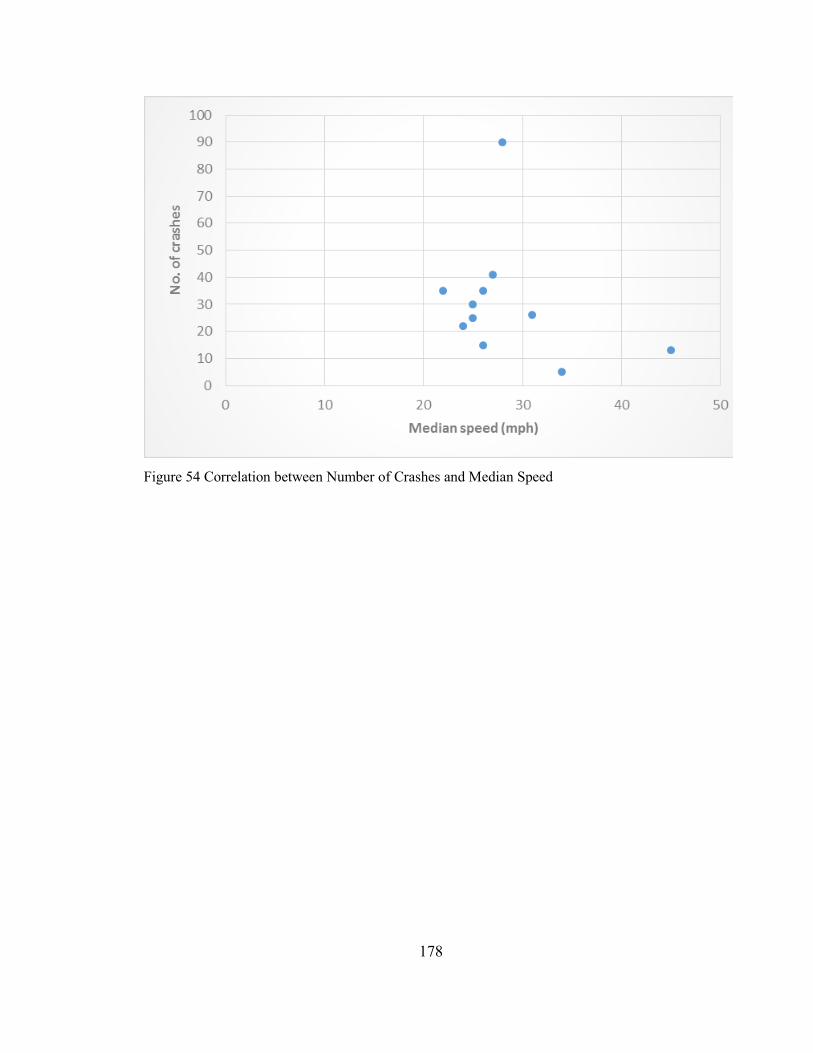
178
Figure 54 Correlation between Number of Crashes and Median Speed
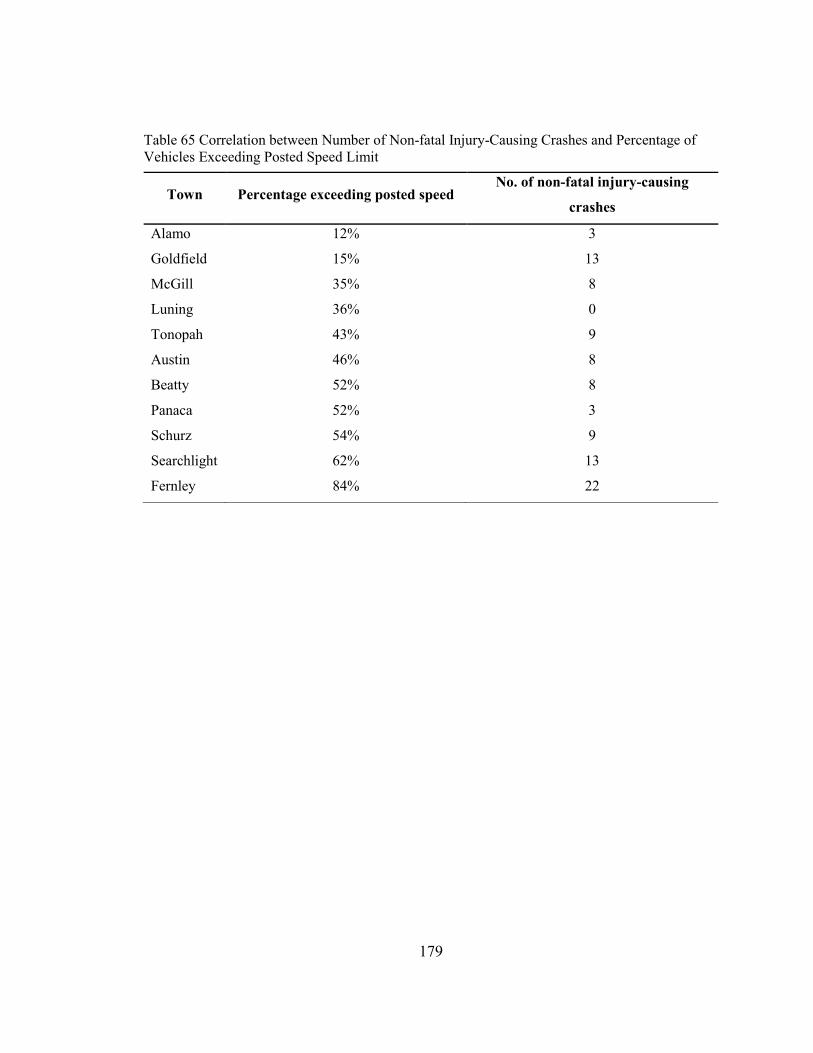
179
Table 65 Correlation between Number of Non-fatal Injury-Causing Crashes and Percentage of
Vehicles Exceeding Posted Speed Limit
Town Percentage exceeding posted speed No. of non-fatal injury-causing
crashes
Alamo 12% 3
Goldfield 15% 13
McGill 35% 8
Luning 36% 0
Tonopah 43% 9
Austin 46% 8
Beatty 52% 8
Panaca 52% 3
Schurz 54% 9
Searchlight 62% 13
Fernley 84% 22
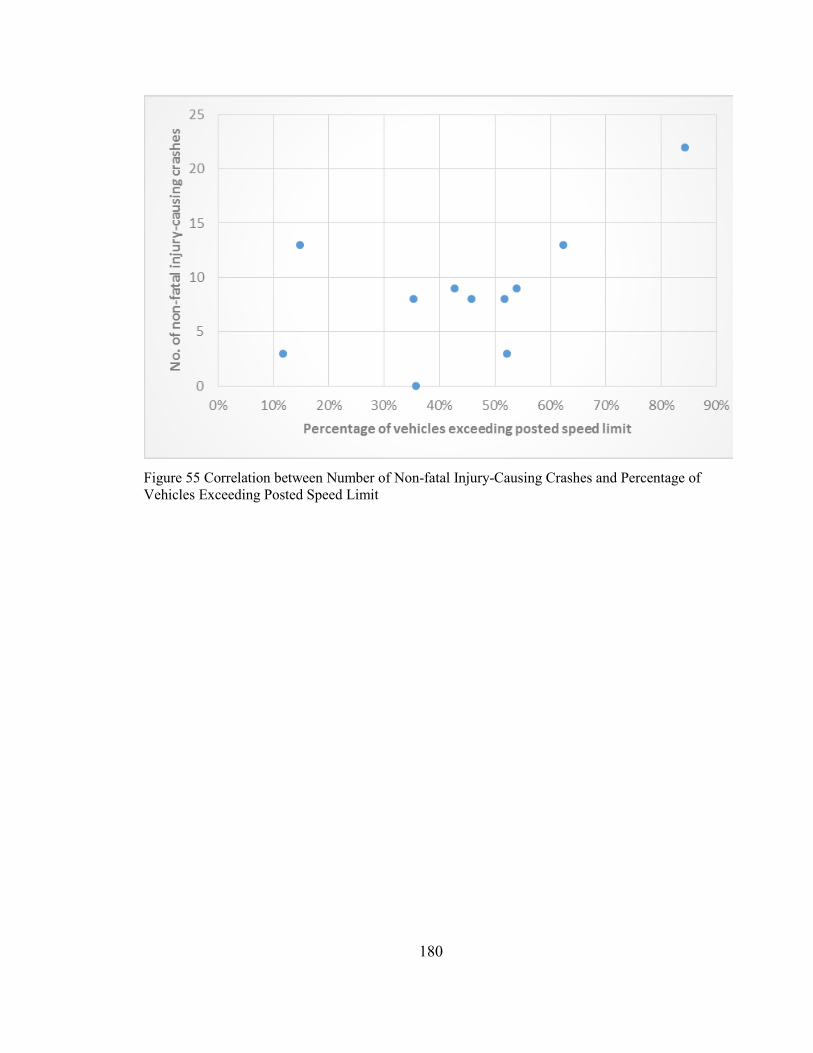
180
Figure 55 Correlation between Number of Non-fatal Injury-Causing Crashes and Percentage of
Vehicles Exceeding Posted Speed Limit
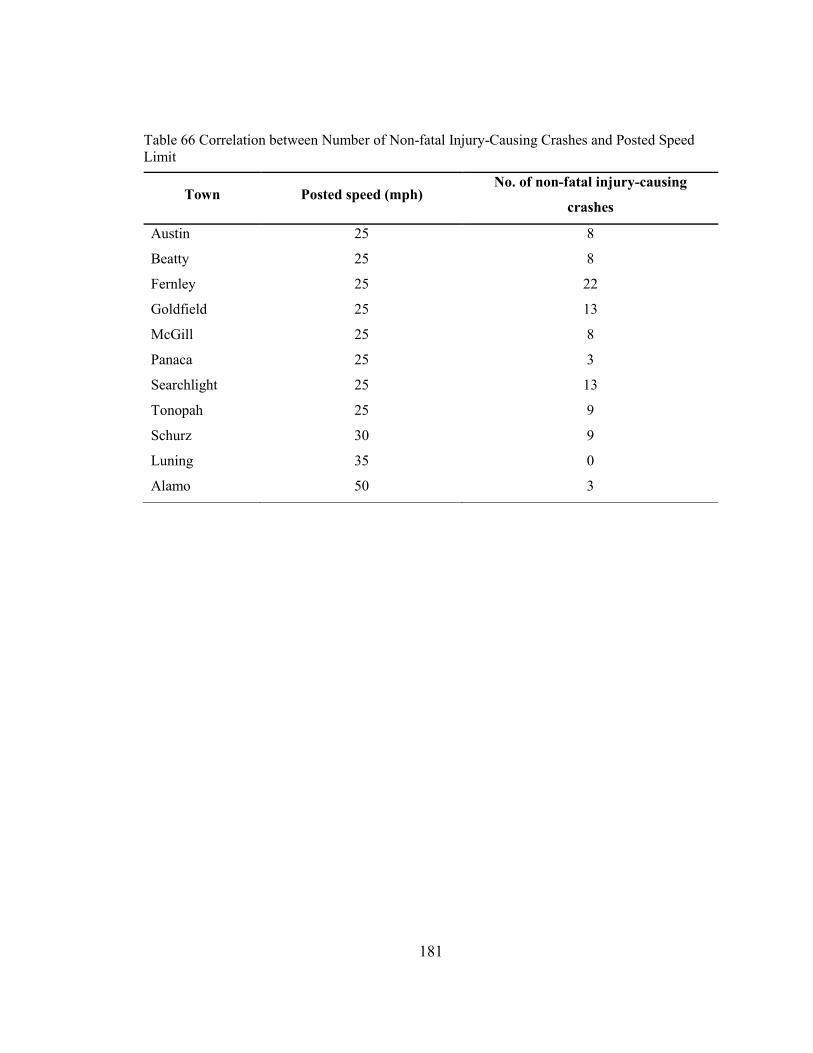
181
Table 66 Correlation between Number of Non-fatal Injury-Causing Crashes and Posted Speed
Limit
Town Posted speed (mph) No. of non-fatal injury-causing
crashes
Austin 25 8
Beatty 25 8
Fernley 25 22
Goldfield 25 13
McGill 25 8
Panaca 25 3
Searchlight 25 13
Tonopah 25 9
Schurz 30 9
Luning 35 0
Alamo 50 3
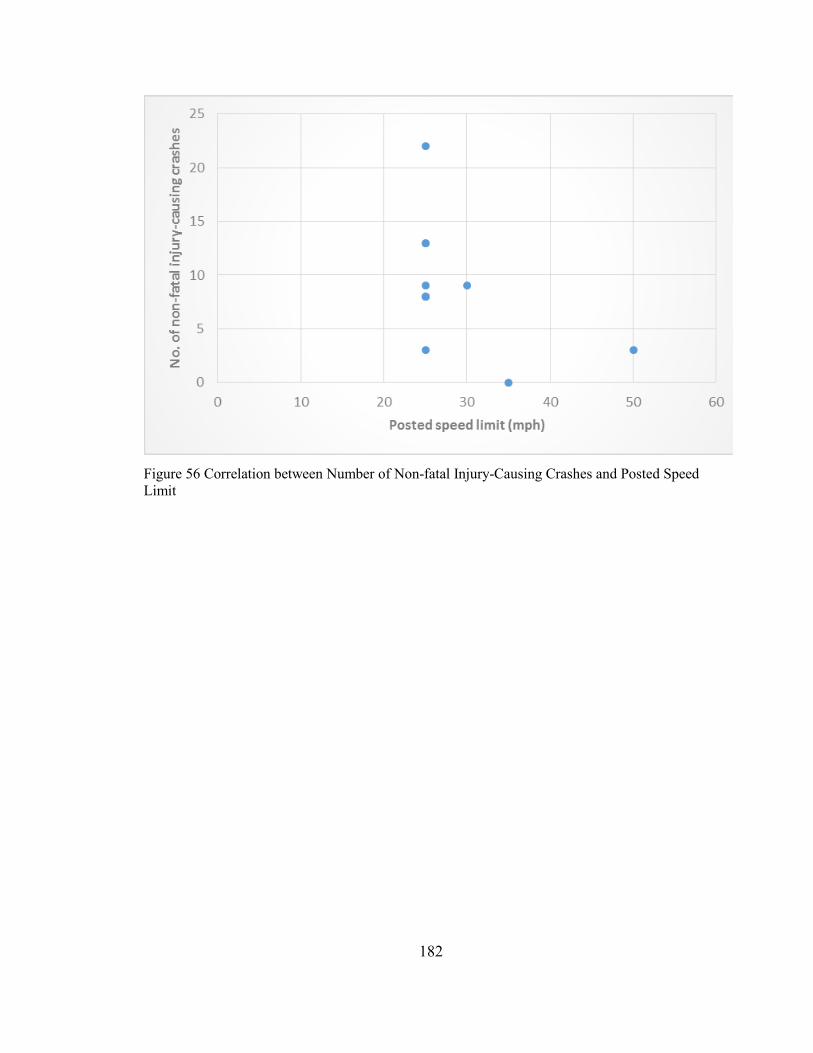
182
Figure 56 Correlation between Number of Non-fatal Injury-Causing Crashes and Posted Speed
Limit
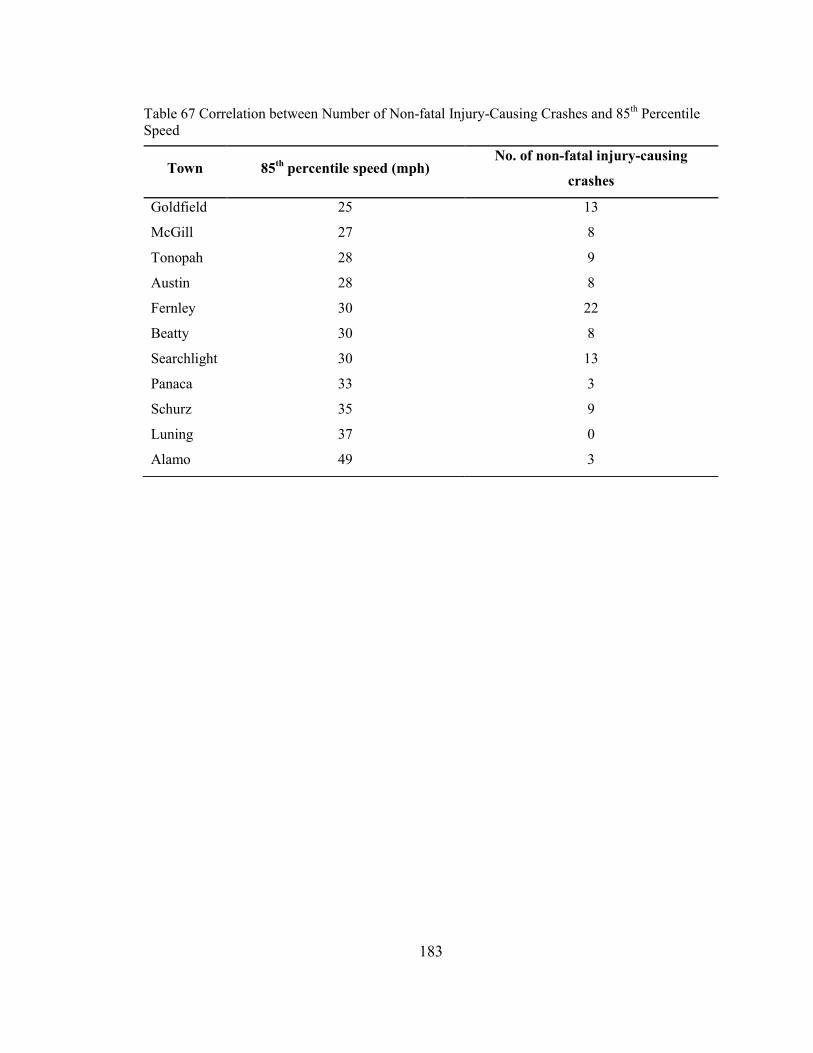
183
Table 67 Correlation between Number of Non-fatal Injury-Causing Crashes and 85th Percentile
Speed
Town 85th
percentile speed (mph) No. of non-fatal injury-causing
crashes
Goldfield 25 13
McGill 27 8
Tonopah 28 9
Austin 28 8
Fernley 30 22
Beatty 30 8
Searchlight 30 13
Panaca 33 3
Schurz 35 9
Luning 37 0
Alamo 49 3
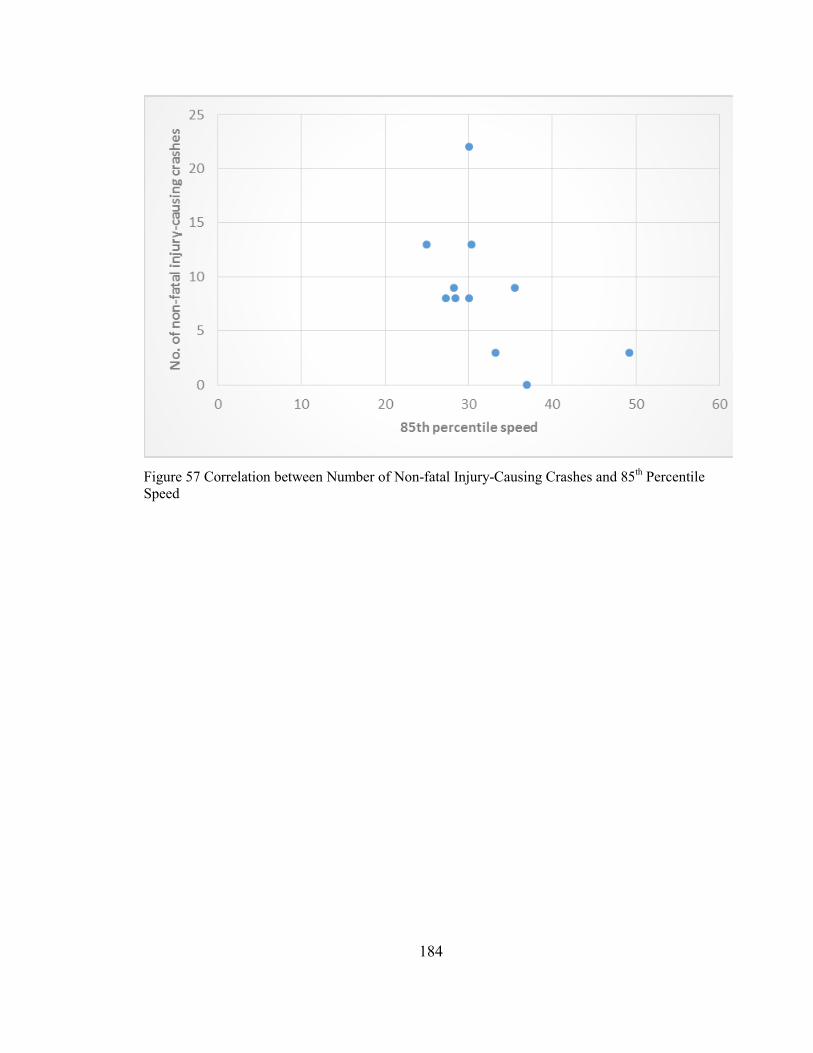
184
Figure 57 Correlation between Number of Non-fatal Injury-Causing Crashes and 85th Percentile
Speed
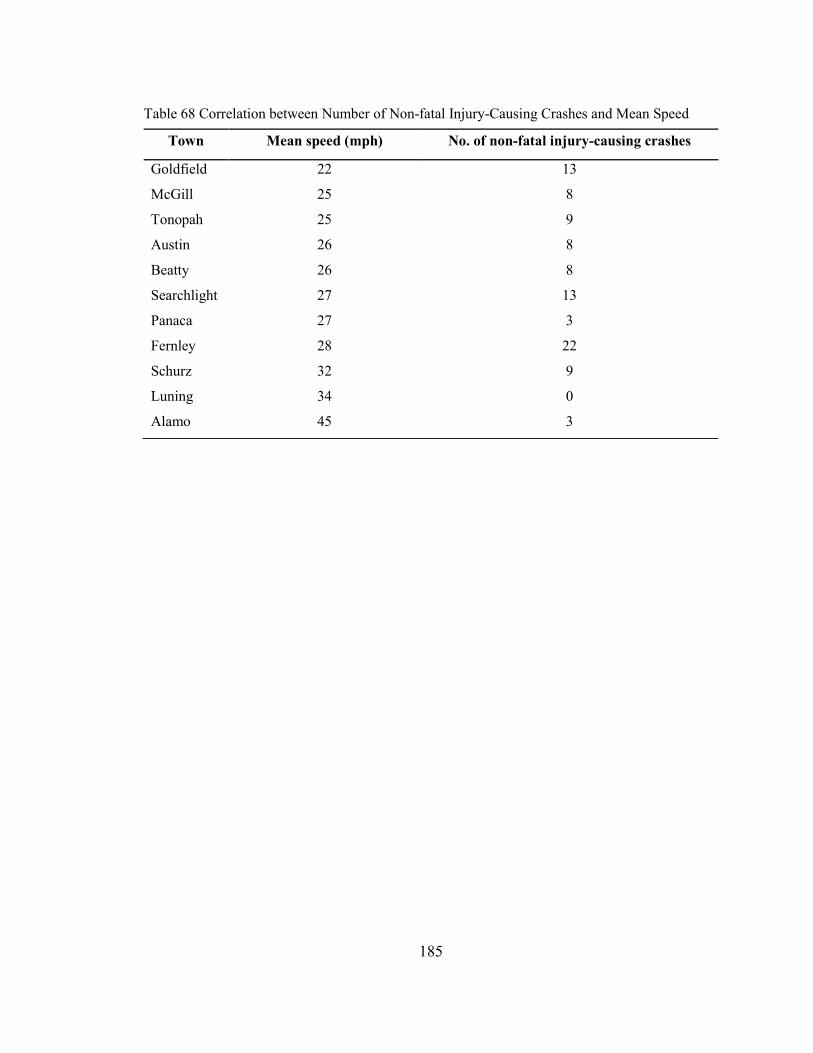
185
Table 68 Correlation between Number of Non-fatal Injury-Causing Crashes and Mean Speed
Town Mean speed (mph) No. of non-fatal injury-causing crashes
Goldfield 22 13
McGill 25 8
Tonopah 25 9
Austin 26 8
Beatty 26 8
Searchlight 27 13
Panaca 27 3
Fernley 28 22
Schurz 32 9
Luning 34 0
Alamo 45 3
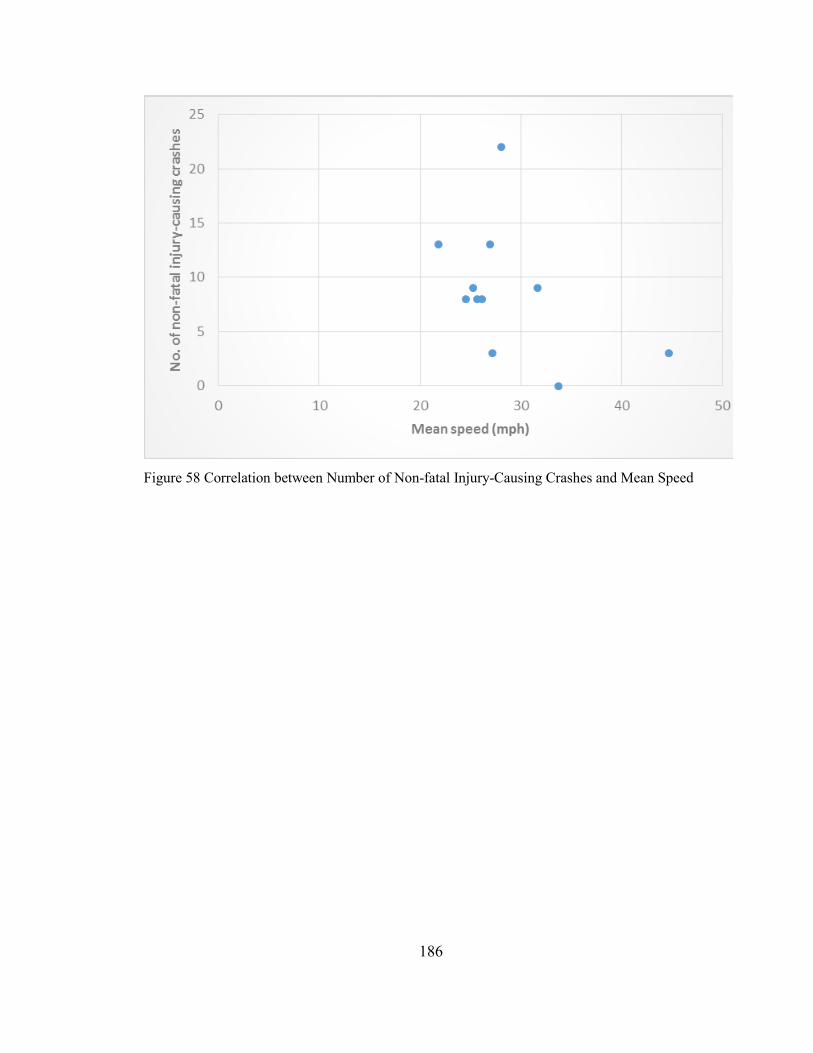
186
Figure 58 Correlation between Number of Non-fatal Injury-Causing Crashes and Mean Speed
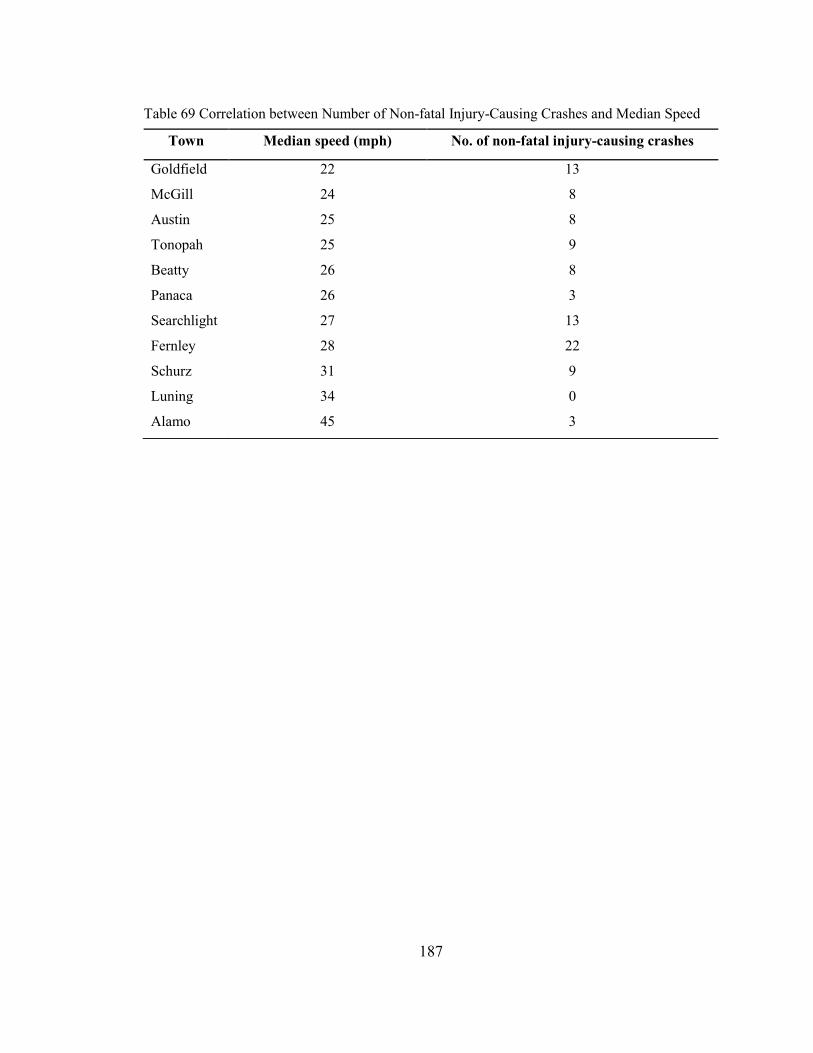
187
Table 69 Correlation between Number of Non-fatal Injury-Causing Crashes and Median Speed
Town Median speed (mph) No. of non-fatal injury-causing crashes
Goldfield 22 13
McGill 24 8
Austin 25 8
Tonopah 25 9
Beatty 26 8
Panaca 26 3
Searchlight 27 13
Fernley 28 22
Schurz 31 9
Luning 34 0
Alamo 45 3
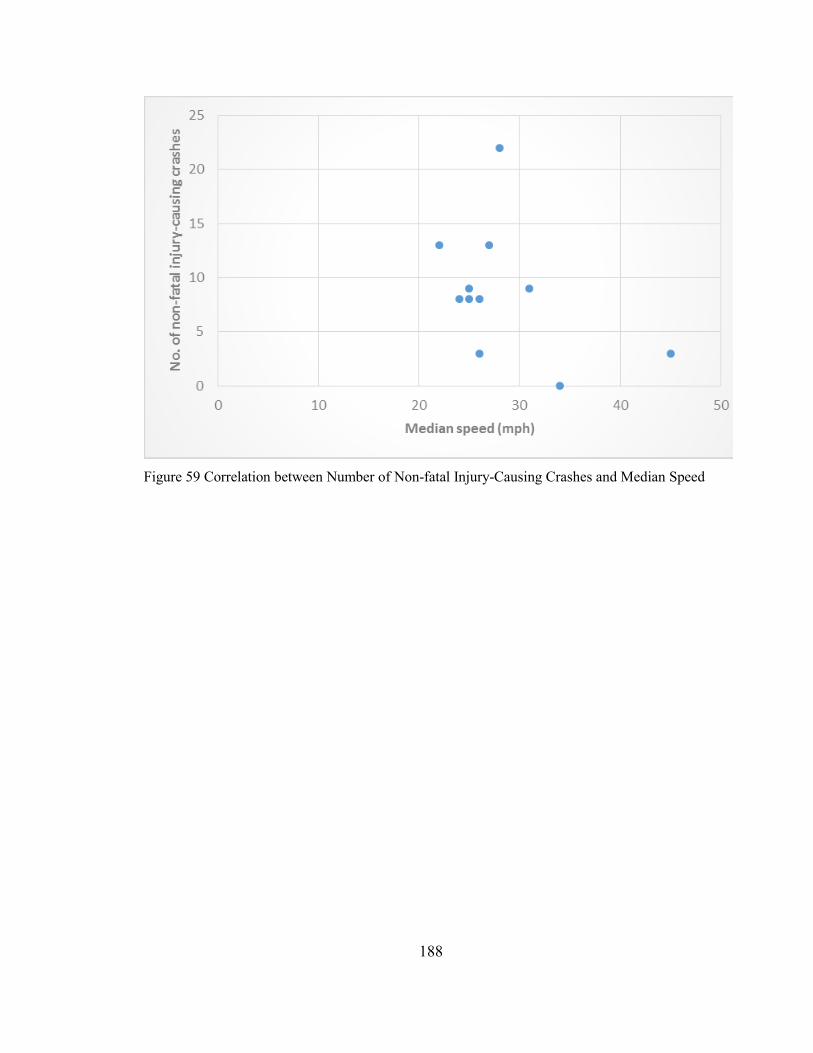
188
Figure 59 Correlation between Number of Non-fatal Injury-Causing Crashes and Median Speed
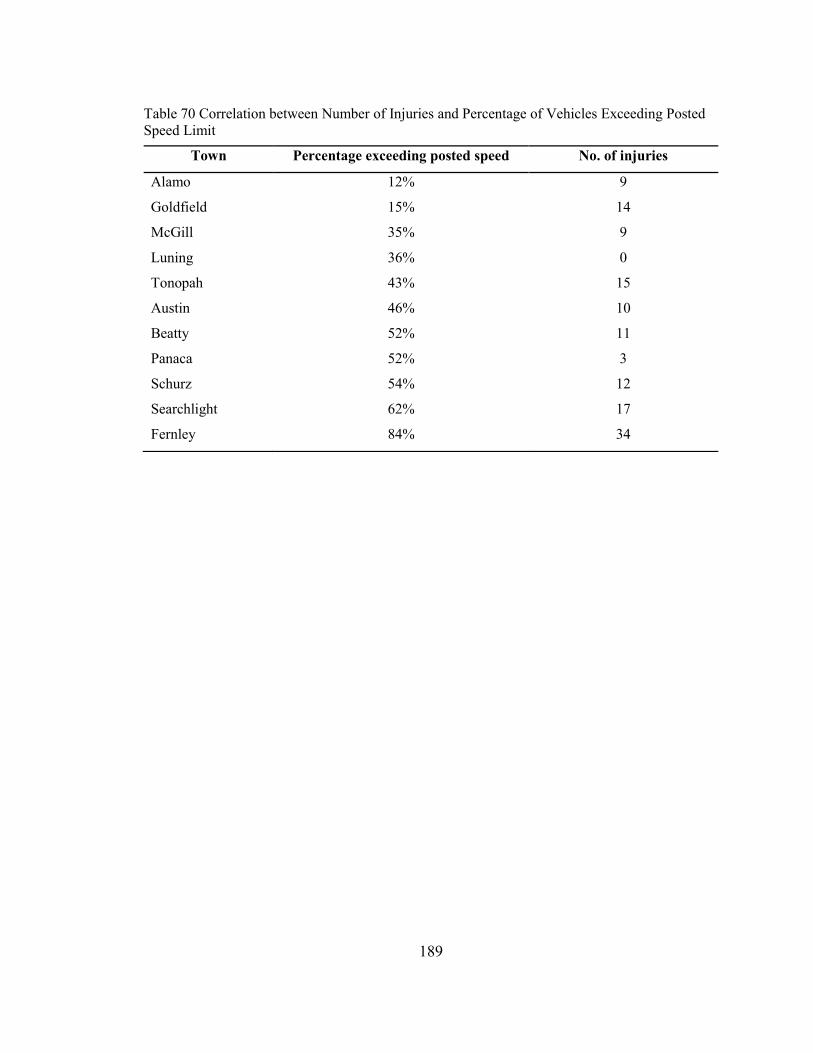
189
Table 70 Correlation between Number of Injuries and Percentage of Vehicles Exceeding Posted
Speed Limit
Town Percentage exceeding posted speed No. of injuries
Alamo 12% 9
Goldfield 15% 14
McGill 35% 9
Luning 36% 0
Tonopah 43% 15
Austin 46% 10
Beatty 52% 11
Panaca 52% 3
Schurz 54% 12
Searchlight 62% 17
Fernley 84% 34
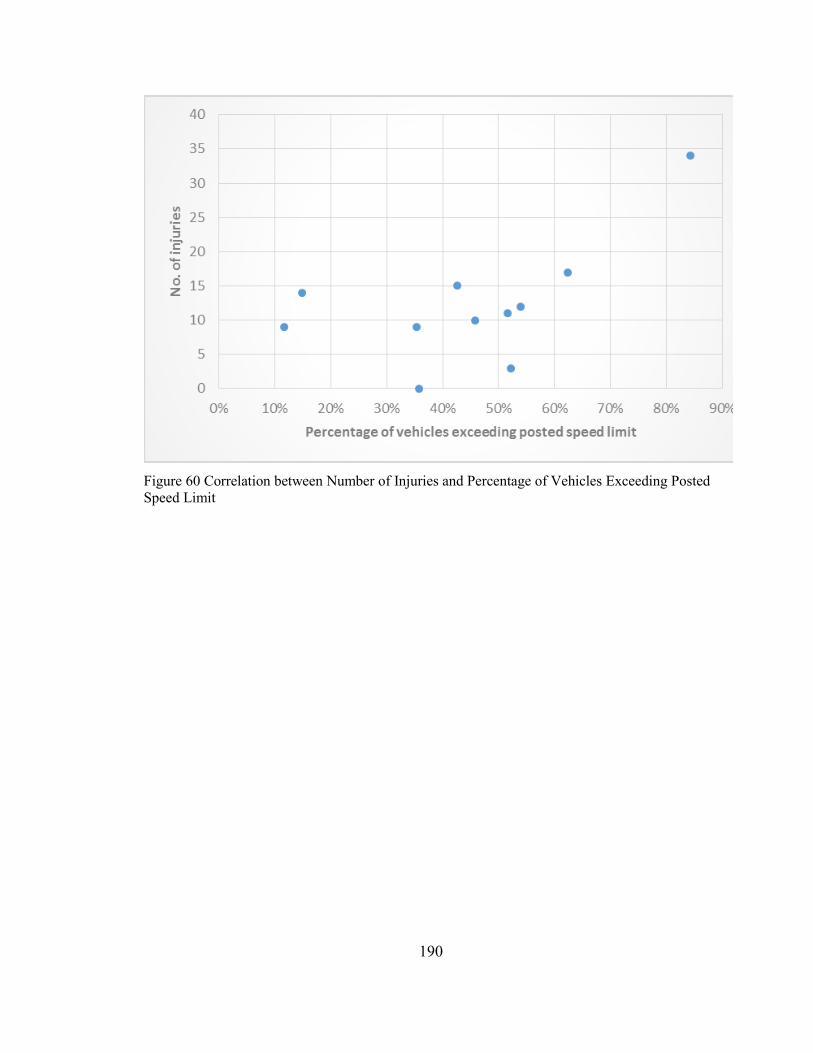
190
Figure 60 Correlation between Number of Injuries and Percentage of Vehicles Exceeding Posted
Speed Limit
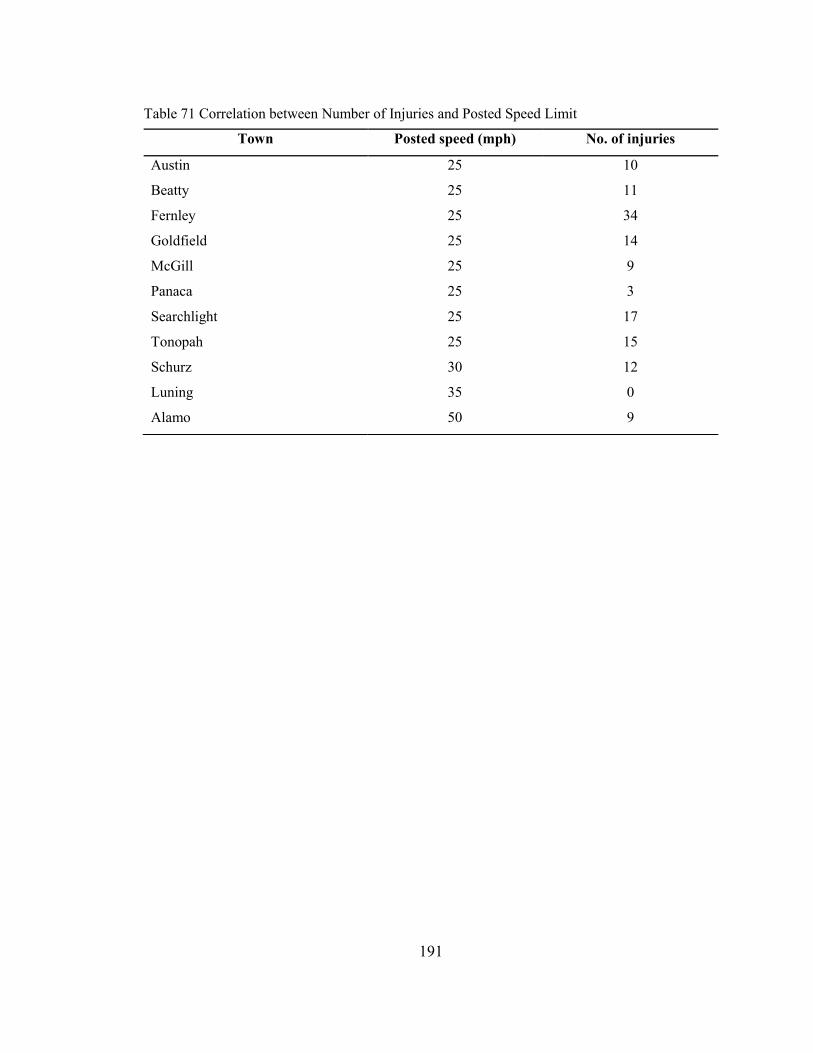
191
Table 71 Correlation between Number of Injuries and Posted Speed Limit
Town Posted speed (mph) No. of injuries
Austin 25 10
Beatty 25 11
Fernley 25 34
Goldfield 25 14
McGill 25 9
Panaca 25 3
Searchlight 25 17
Tonopah 25 15
Schurz 30 12
Luning 35 0
Alamo 50 9
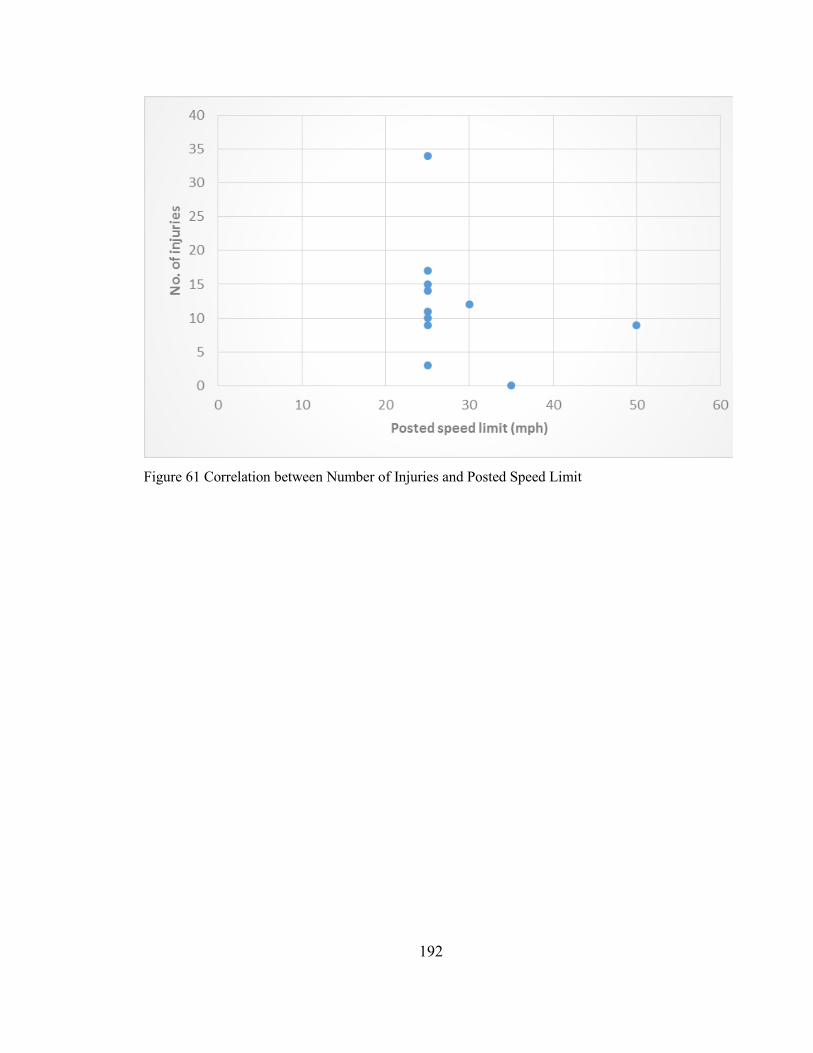
192
Figure 61 Correlation between Number of Injuries and Posted Speed Limit

193
Table 72 Correlation between Number of Injuries and 85th Percentile Speed
Town 85th
percentile speed (mph) No. of injuries
Goldfield 25 14
McGill 27 9
Tonopah 28 15
Austin 28 10
Fernley 30 34
Beatty 30 11
Searchlight 30 17
Panaca 33 3
Schurz 35 12
Luning 37 0
Alamo 49 9
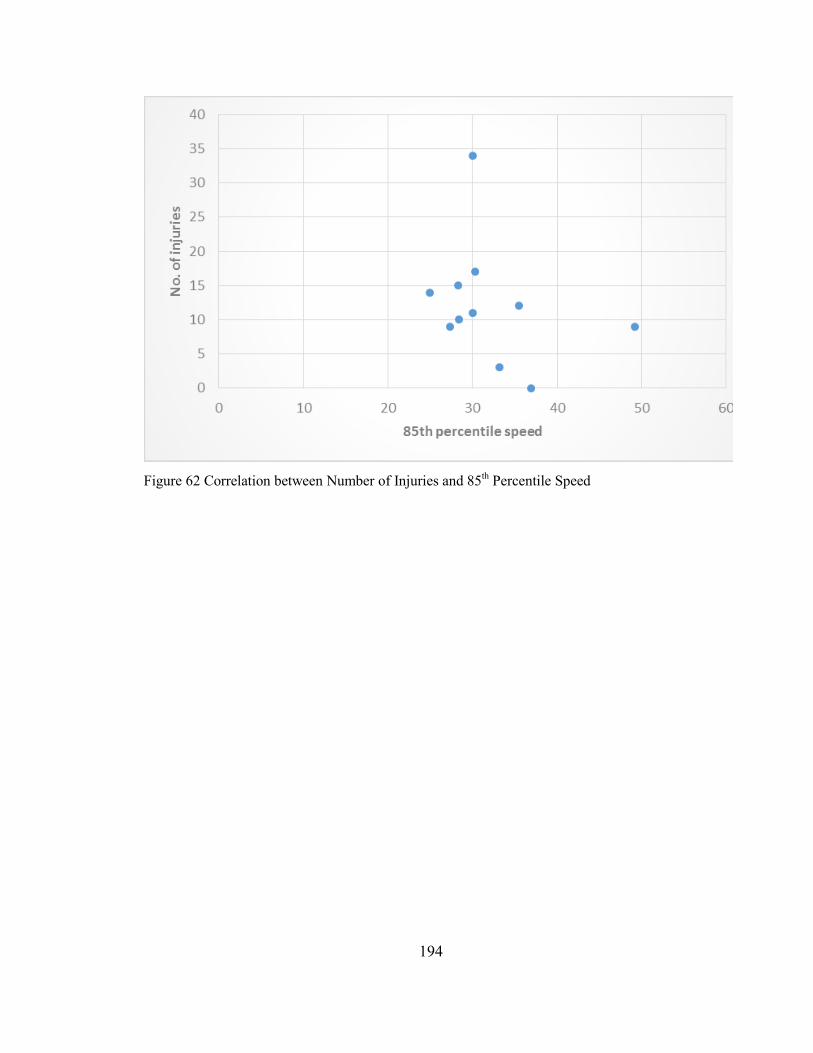
194
Figure 62 Correlation between Number of Injuries and 85th Percentile Speed
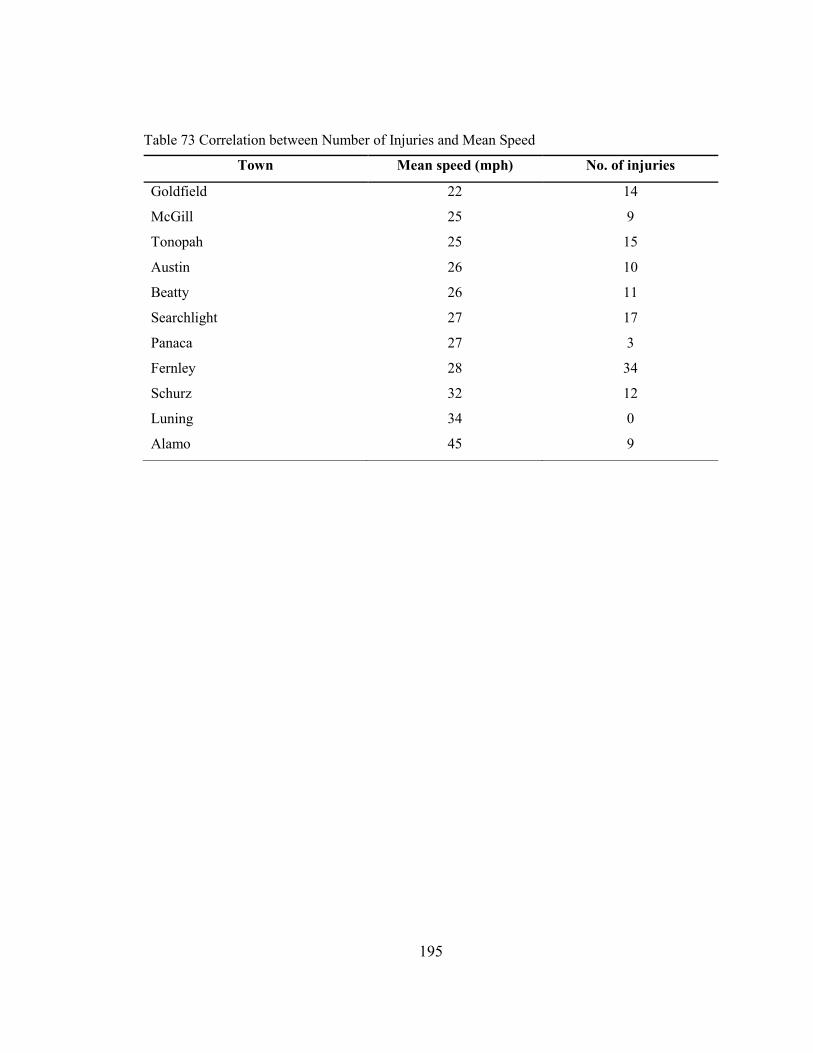
195
Table 73 Correlation between Number of Injuries and Mean Speed
Town Mean speed (mph) No. of injuries
Goldfield 22 14
McGill 25 9
Tonopah 25 15
Austin 26 10
Beatty 26 11
Searchlight 27 17
Panaca 27 3
Fernley 28 34
Schurz 32 12
Luning 34 0
Alamo 45 9
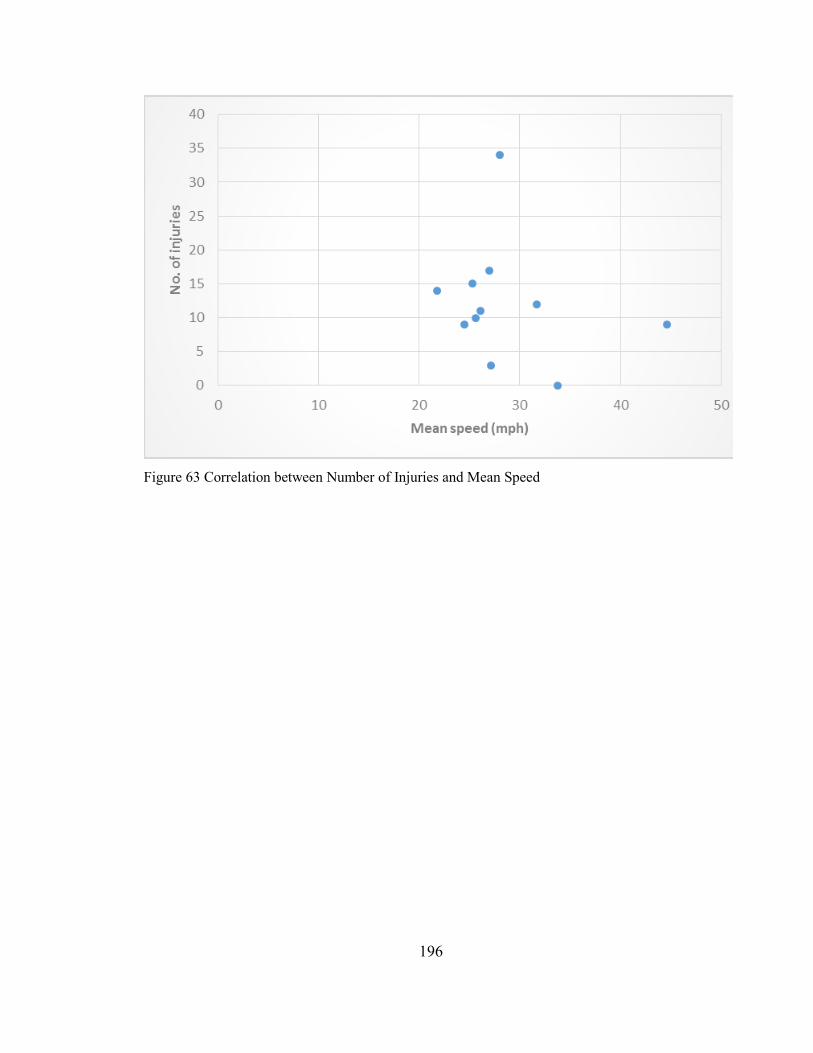
196
Figure 63 Correlation between Number of Injuries and Mean Speed

197
Table 74 Correlation between Number of Injuries and Median Speed
Town Median speed (mph) No. of Injuries
Goldfield 22 14
McGill 24 9
Austin 25 10
Tonopah 25 15
Beatty 26 11
Panaca 26 3
Searchlight 27 17
Fernley 28 34
Schurz 31 12
Luning 34 0
Alamo 45 9
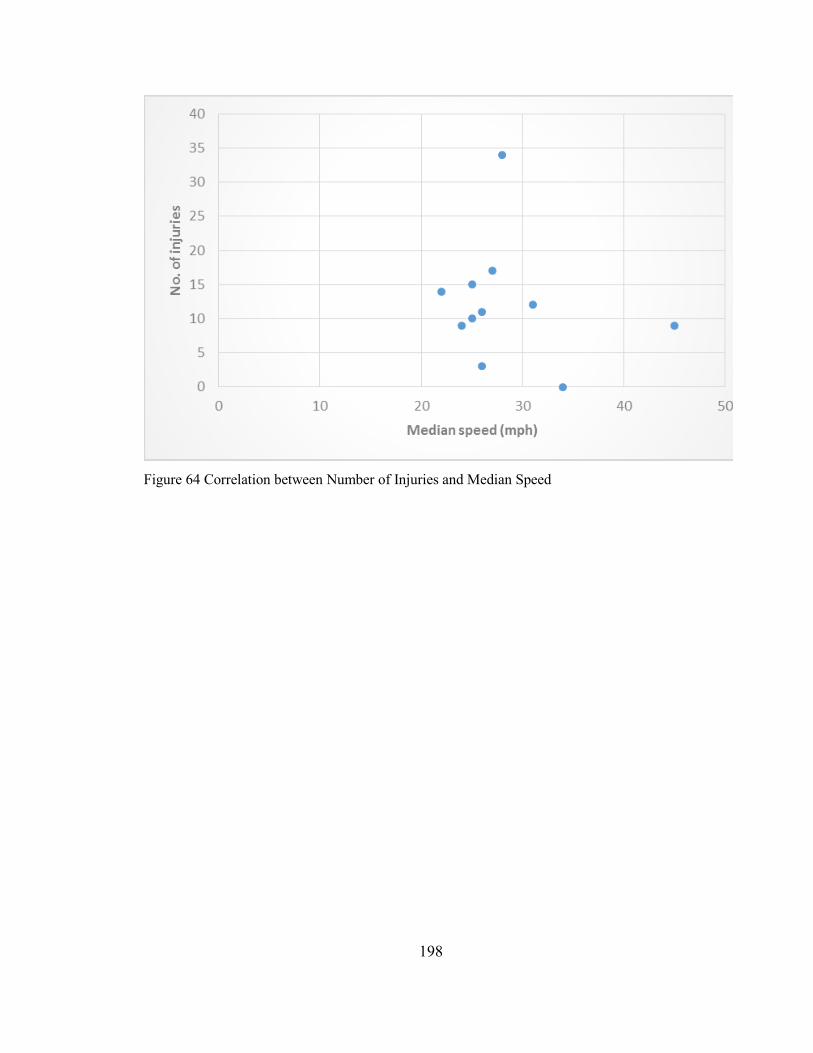
198
Figure 64 Correlation between Number of Injuries and Median Speed
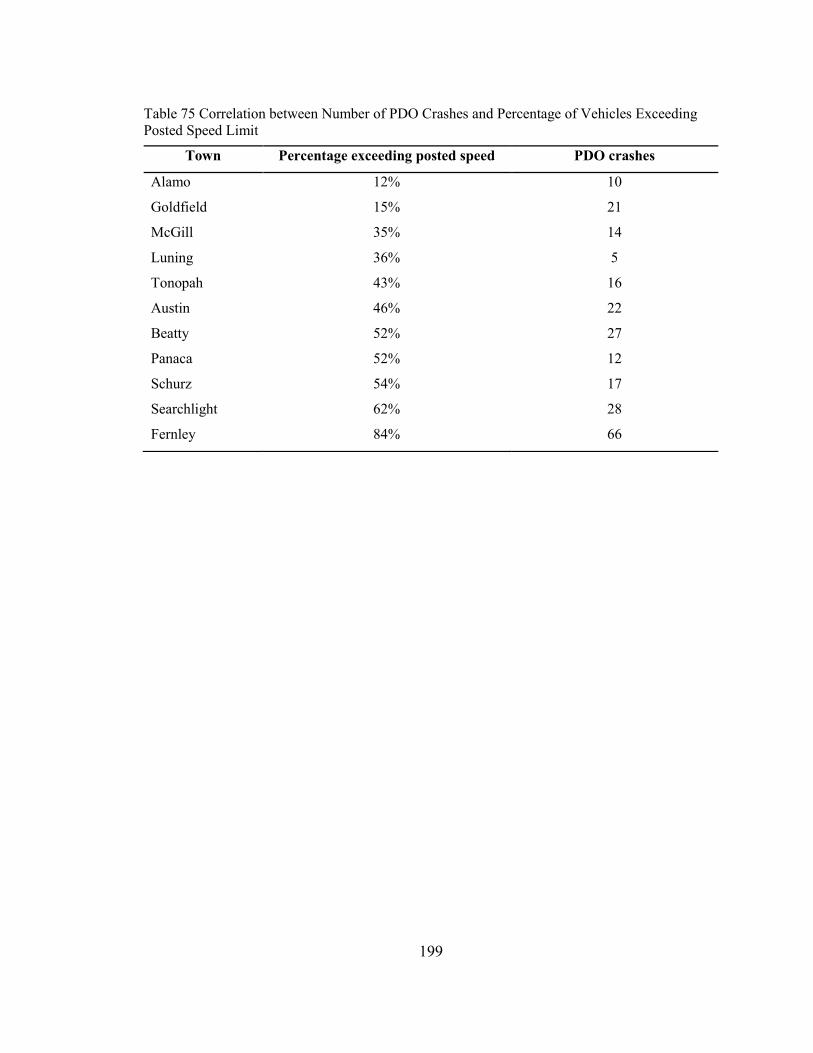
199
Table 75 Correlation between Number of PDO Crashes and Percentage of Vehicles Exceeding
Posted Speed Limit
Town Percentage exceeding posted speed PDO crashes
Alamo 12% 10
Goldfield 15% 21
McGill 35% 14
Luning 36% 5
Tonopah 43% 16
Austin 46% 22
Beatty 52% 27
Panaca 52% 12
Schurz 54% 17
Searchlight 62% 28
Fernley 84% 66
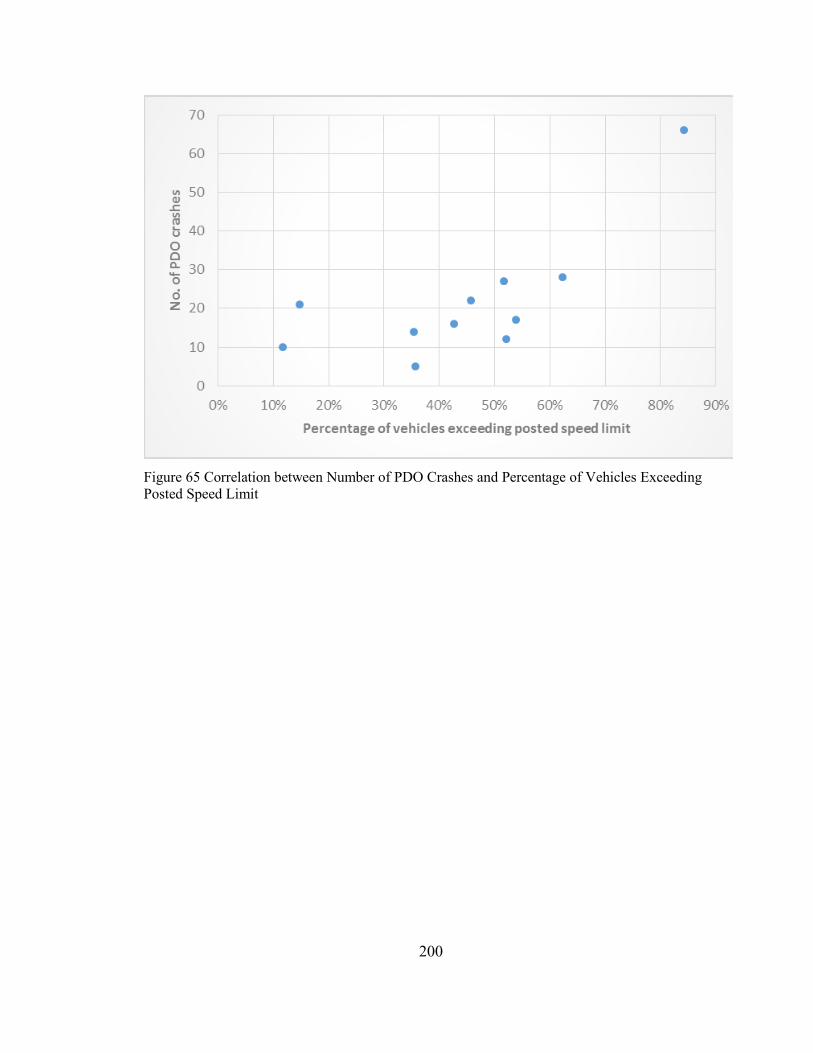
200
Figure 65 Correlation between Number of PDO Crashes and Percentage of Vehicles Exceeding
Posted Speed Limit
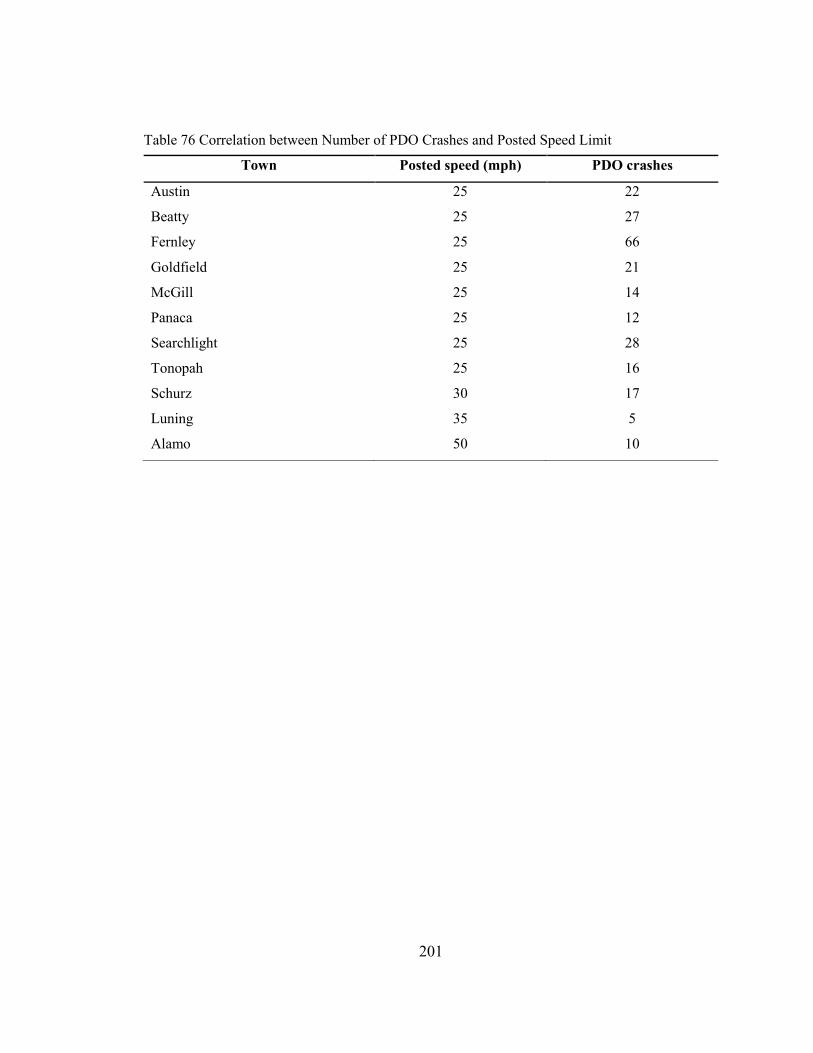
201
Table 76 Correlation between Number of PDO Crashes and Posted Speed Limit
Town Posted speed (mph) PDO crashes
Austin 25 22
Beatty 25 27
Fernley 25 66
Goldfield 25 21
McGill 25 14
Panaca 25 12
Searchlight 25 28
Tonopah 25 16
Schurz 30 17
Luning 35 5
Alamo 50 10
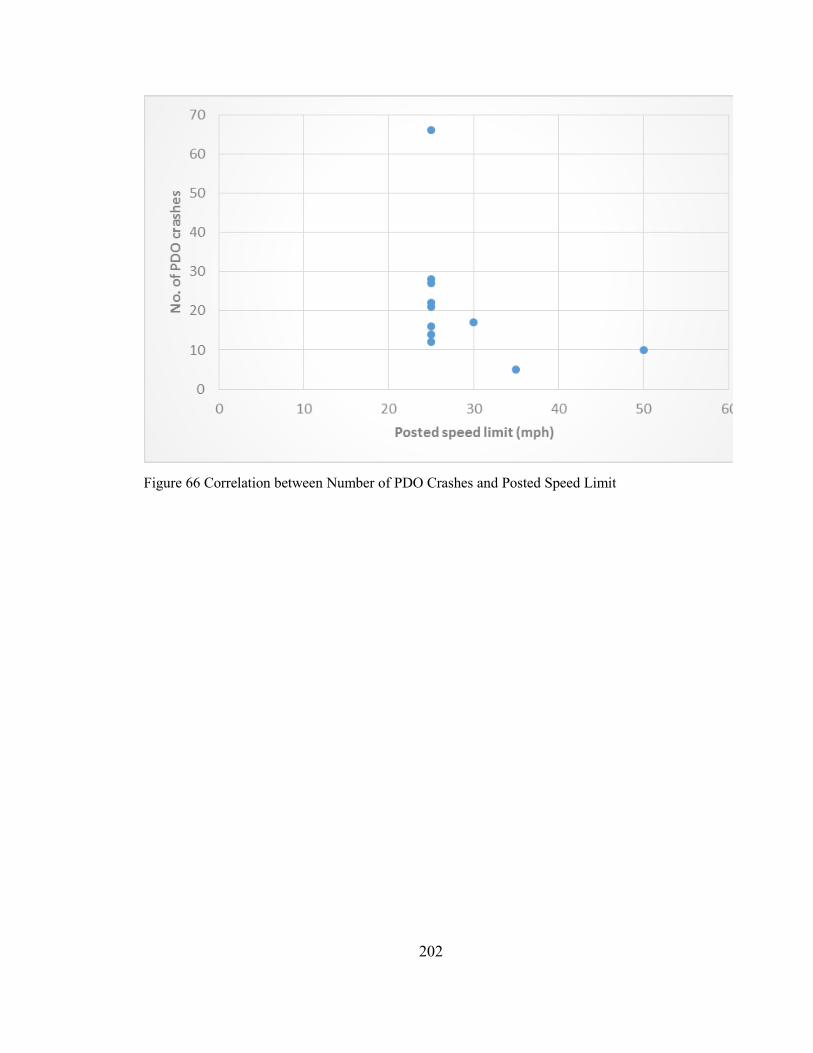
202
Figure 66 Correlation between Number of PDO Crashes and Posted Speed Limit
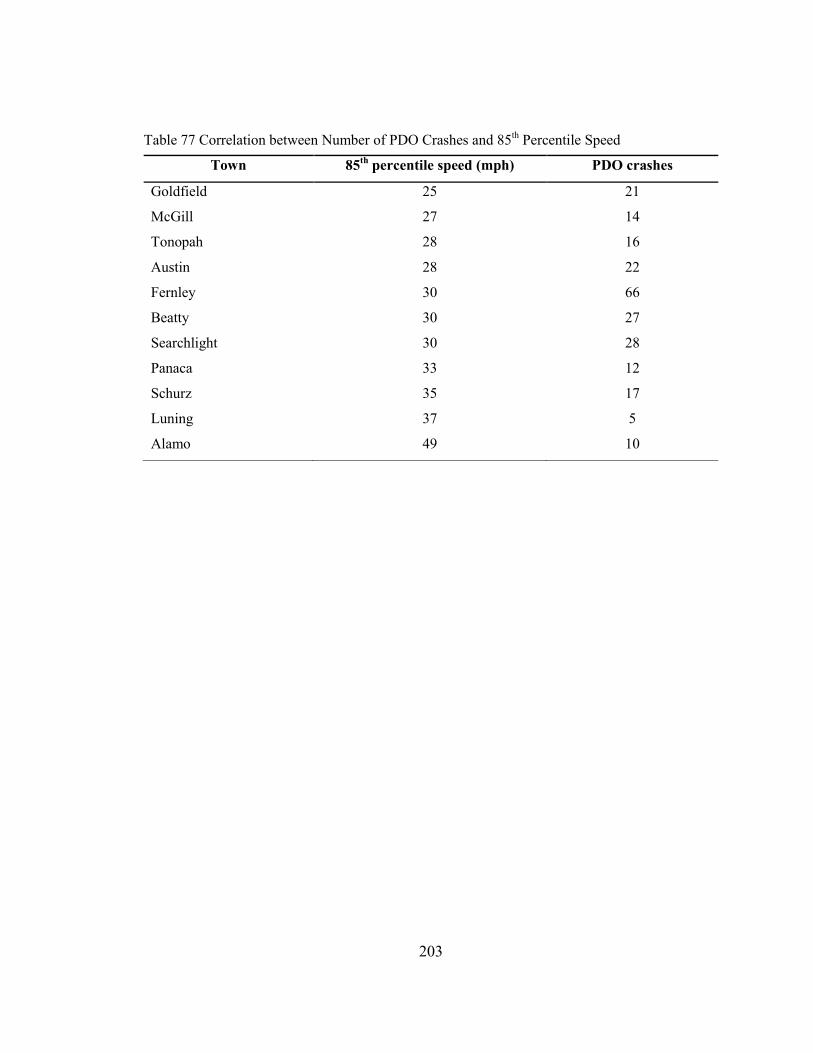
203
Table 77 Correlation between Number of PDO Crashes and 85th Percentile Speed
Town 85th
percentile speed (mph) PDO crashes
Goldfield 25 21
McGill 27 14
Tonopah 28 16
Austin 28 22
Fernley 30 66
Beatty 30 27
Searchlight 30 28
Panaca 33 12
Schurz 35 17
Luning 37 5
Alamo 49 10
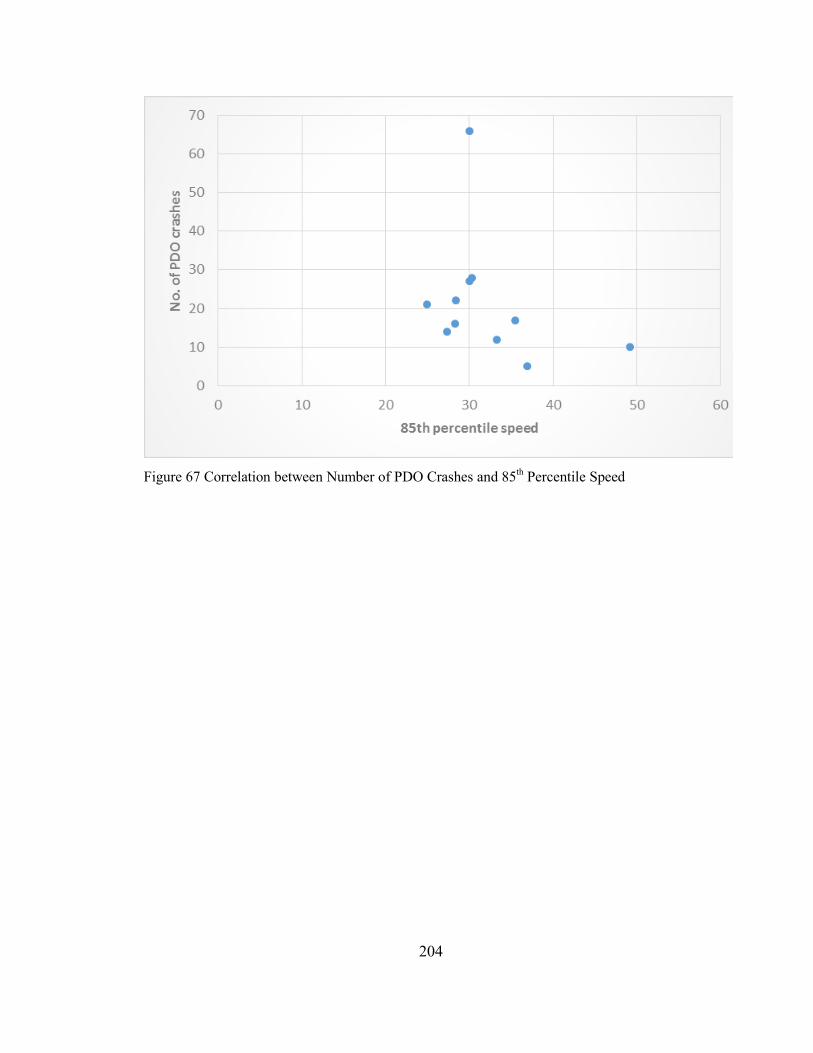
204
Figure 67 Correlation between Number of PDO Crashes and 85th Percentile Speed
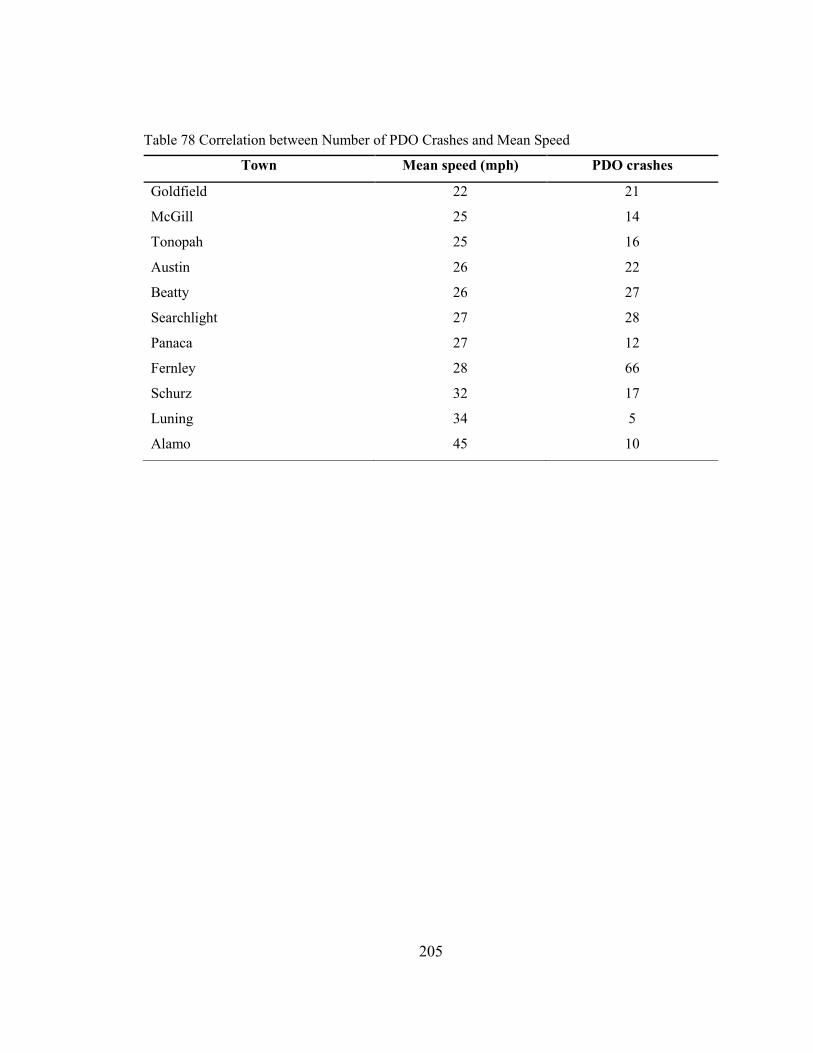
205
Table 78 Correlation between Number of PDO Crashes and Mean Speed
Town Mean speed (mph) PDO crashes
Goldfield 22 21
McGill 25 14
Tonopah 25 16
Austin 26 22
Beatty 26 27
Searchlight 27 28
Panaca 27 12
Fernley 28 66
Schurz 32 17
Luning 34 5
Alamo 45 10
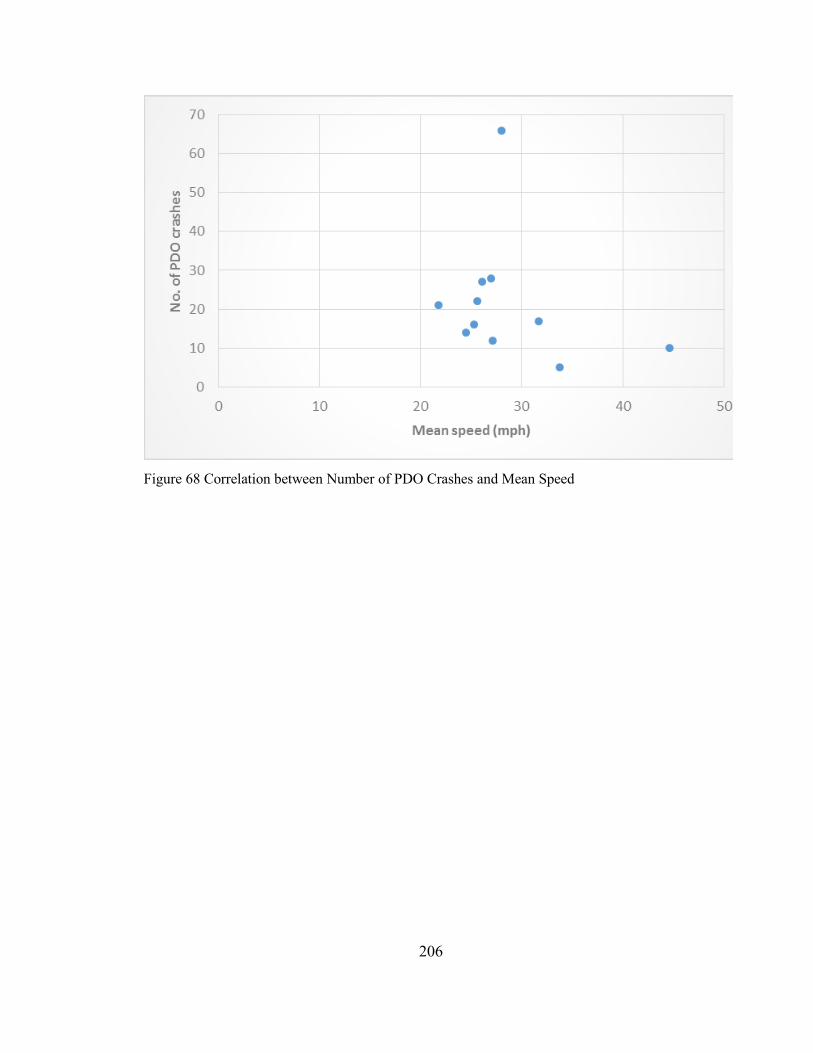
206
Figure 68 Correlation between Number of PDO Crashes and Mean Speed

207
Table 79 Correlation between Number of PDO Crashes and Median Speed
Town Median speed (mph) PDO crashes
Goldfield 22 21
McGill 24 14
Austin 25 22
Tonopah 25 16
Beatty 26 27
Panaca 26 12
Searchlight 27 28
Fernley 28 66
Schurz 31 17
Luning 34 5
Alamo 45 10
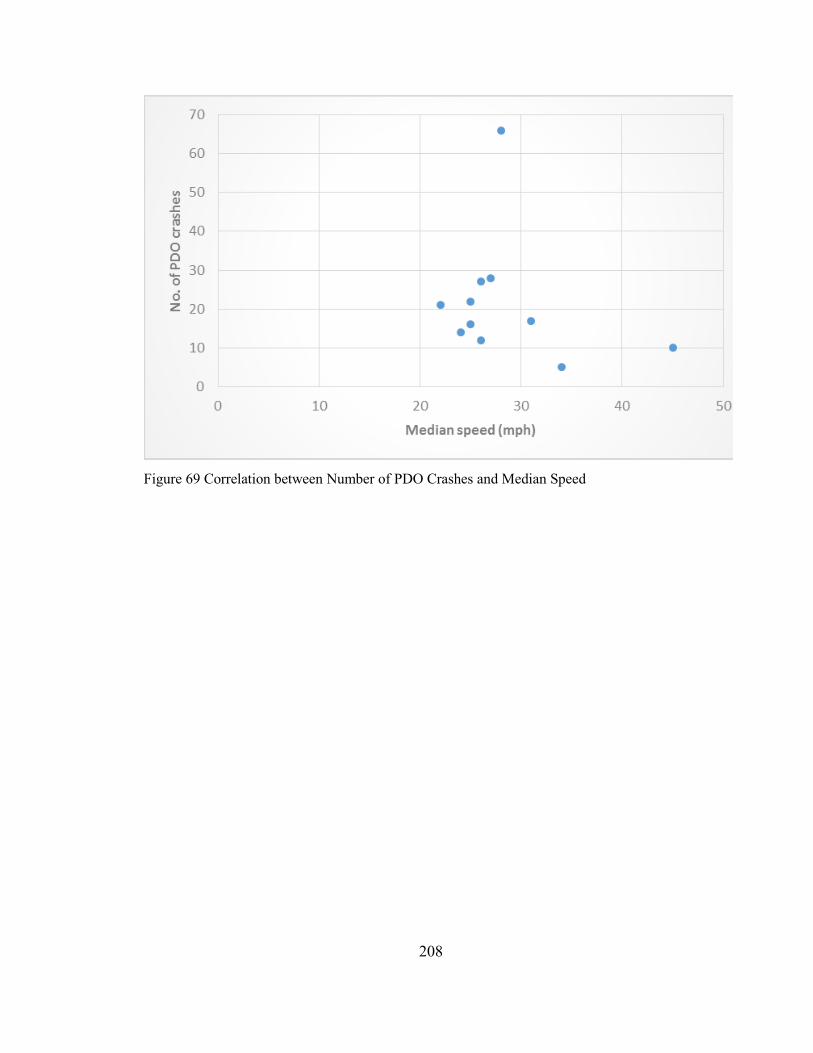
208
Figure 69 Correlation between Number of PDO Crashes and Median Speed

209
APPENDIX G QUESTIONNAIRE SURVEY FORM
210
Survey of Current Practices in Establishing Speed Limits in
Towns along Rural State Highways
We would like to thank you in advance for the time and effort involved in your
agency’s participation in this research.
This questionnaire is divided into six sections:
Project General Information
Rural State Highways and Crash Data
State Speed-Zone Legislature
Speed-Zone Guideline or Manual
Traffic Engineer’s Personal View
Issues of the Local Community.
If not enough space is provided for the brief questions, please feel free to attach extra
sheets to the document.
In the questions, we ask for detailed information about the current practices in speed
zones. Please do what you can to provide this information as fully as possible. Your
detailed responses will allow us to develop new guidelines for speed zone in towns along
rural state highways in Nevada.
The confidentiality of this questionnaire will be maintained. The questionnaire data
will not be placed in any permanent record, and will be destroyed when no longer needed
by the researchers. The identity of person who provided all this information will remain
anonymous. The data obtained during this interview will not be linked in any way to the
participants’ names.
211
The results of the current survey will be published in the form of “Guidelines for
Speed Limit in Towns along Rural State Highway” report that will be available on
Nevada Department of Transportation website for the public. We appreciate your
cooperation and hope that with your help we can improve the safety on rural highways in
Nevada. Please return this questionnaire by email, fax, or mail to the following address:
Dr. Pramen P. Shrestha
Assistant Professor
Department of Civil and Environmental Engineering and Construction
University of Nevada, Las Vegas
4505 S. Maryland Pkwy.
Las Vegas, NV 89154
Phone: 702-895-3841
Email: [email protected]
Fax Number: 702-895-4966
212
1. General Information
1.1. Name of the Department of Transportation (DOT):
1.2. State:
1.3. Name of the traffic engineer (respondent):
1.4. Contact person’s phone number:
1.5. Contact person’s E-mail address:
2. Rural State Highways and Crash Data
2.1. How many miles of rural state highways are under your state’s jurisdiction?
2.2. What is the average annual number of crashes that have occurred on highways in your
state in the last five years?
2.3. What is the average annual number of crashes that have occurred on the rural state
highways in your state?
2.4. What is the average annual number of fatalities that have occurred on highways of your
state in the last five years?
2.5. What is the average number of fatalities that have occurred on your rural state highways
from the last five years?
213
2.6. Estimate the amount of crashes that have occurred in towns along rural state
highways (the percentage of total crashes occurring in rural state highways).
(% of total crashes)
2.7. Please list top five major reasons of the crashes occurring in the towns of rural
state highways. List according to its importance. The most important reason
should be listed in the first
2.7.1.
2.7.2.
2.7.3.
2.7.4.
2.7.5.
3. State Speed-Zone Legislature
3.1. Does the state have statutes that mandate the speed zone in the towns of rural
state highways?
Yes No
3.2. If yes, would you provide the link to the statute?
3.3. Is it required that an engineering and traffic investigation be conducted for any
alteration of speed zones, mandated by your state statutes?
Yes No
214
3.4. If yes, what basic investigations will be carried out before deciding the speed
zone for particular towns along the rural state highway?
4. Speed-Zone Guideline or Manual
4.1. Do you have speed-zone guideline or manual in your state?
Yes (Go to Q. No. 4.2) No (Go to Q. No. 4.4)
4.2. If yes, is there any difference between speed-zone legislature and speed-zone
guideline or manual?
Yes (Go to Q. No. 4.3) No (Go to Q. No. 4.4)
If yes,
4.3. How frequently does the traffic engineer use the guidelines or manual to
determine the speed zone of towns in rural highways?
Always
Most frequently
Frequently
Seldom
Never
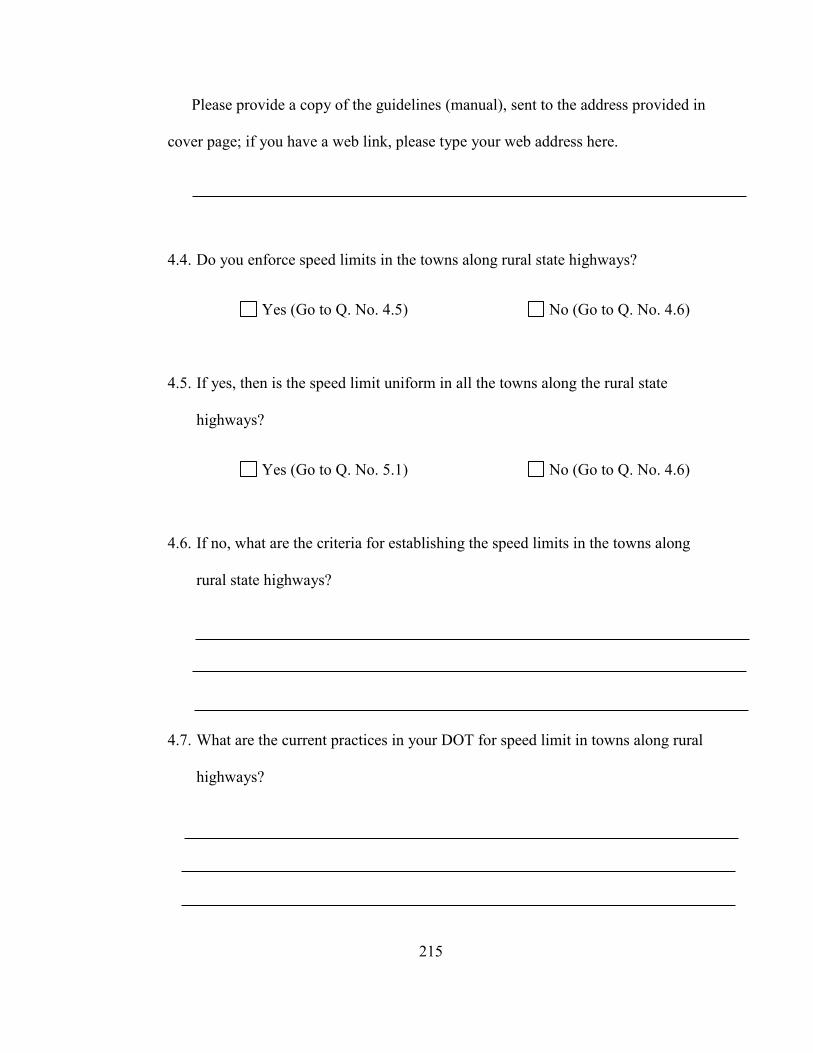
215
Please provide a copy of the guidelines (manual), sent to the address provided in
cover page; if you have a web link, please type your web address here.
4.4. Do you enforce speed limits in the towns along rural state highways?
Yes (Go to Q. No. 4.5) No (Go to Q. No. 4.6)
4.5. If yes, then is the speed limit uniform in all the towns along the rural state
highways?
Yes (Go to Q. No. 5.1) No (Go to Q. No. 4.6)
4.6. If no, what are the criteria for establishing the speed limits in the towns along
rural state highways?
4.7. What are the current practices in your DOT for speed limit in towns along rural
highways?
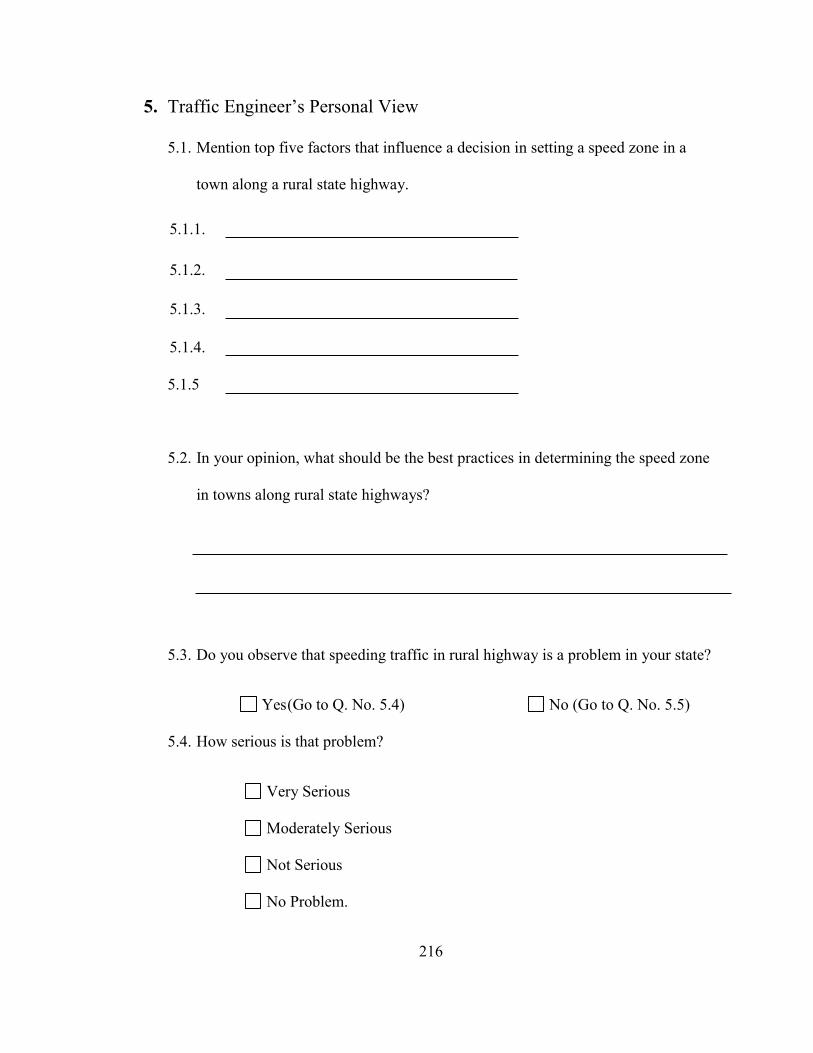
216
5. Traffic Engineer’s Personal View
5.1. Mention top five factors that influence a decision in setting a speed zone in a
town along a rural state highway.
5.1.1.
5.1.2.
5.1.3.
5.1.4.
5.1.5
5.2. In your opinion, what should be the best practices in determining the speed zone
in towns along rural state highways?
5.3. Do you observe that speeding traffic in rural highway is a problem in your state?
Yes (Go to Q. No. 5.4) No (Go to Q. No. 5.5)
5.4. How serious is that problem?
Very Serious
Moderately Serious
Not Serious
No Problem.
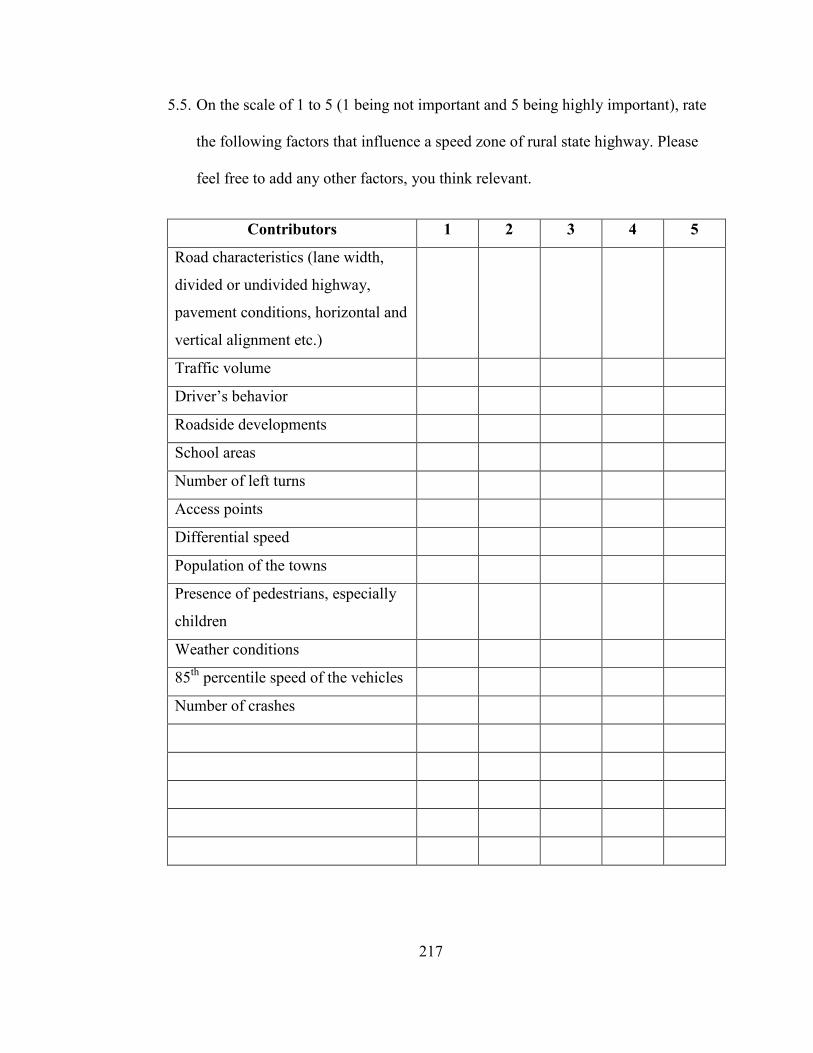
217
5.5. On the scale of 1 to 5 (1 being not important and 5 being highly important), rate
the following factors that influence a speed zone of rural state highway. Please
feel free to add any other factors, you think relevant.
Contributors 1 2 3 4 5
Road characteristics (lane width,
divided or undivided highway,
pavement conditions, horizontal and
vertical alignment etc.)
Traffic volume
Driver’s behavior
Roadside developments
School areas
Number of left turns
Access points
Differential speed
Population of the towns
Presence of pedestrians, especially
children
Weather conditions
85th
percentile speed of the vehicles
Number of crashes
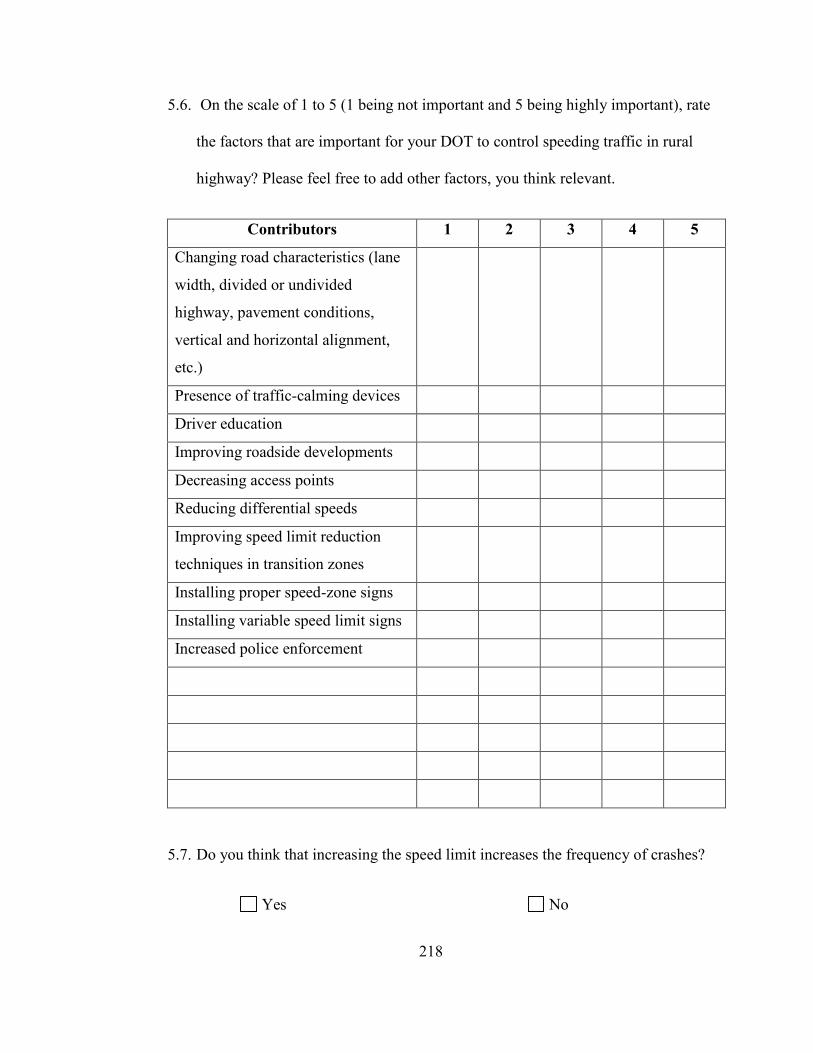
218
5.6. On the scale of 1 to 5 (1 being not important and 5 being highly important), rate
the factors that are important for your DOT to control speeding traffic in rural
highway? Please feel free to add other factors, you think relevant.
Contributors 1 2 3 4 5
Changing road characteristics (lane
width, divided or undivided
highway, pavement conditions,
vertical and horizontal alignment,
etc.)
Presence of traffic-calming devices
Driver education
Improving roadside developments
Decreasing access points
Reducing differential speeds
Improving speed limit reduction
techniques in transition zones
Installing proper speed-zone signs
Installing variable speed limit signs
Increased police enforcement
5.7. Do you think that increasing the speed limit increases the frequency of crashes?
Yes No
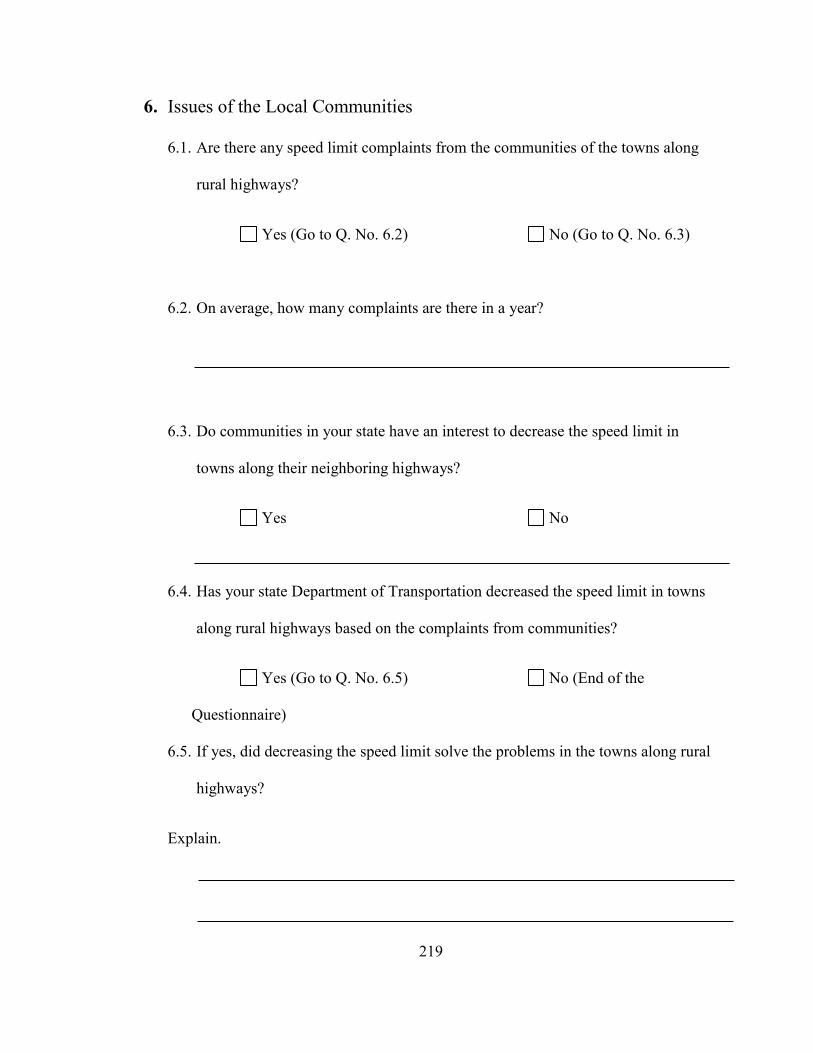
219
6. Issues of the Local Communities
6.1. Are there any speed limit complaints from the communities of the towns along
rural highways?
Yes (Go to Q. No. 6.2) No (Go to Q. No. 6.3)
6.2. On average, how many complaints are there in a year?
6.3. Do communities in your state have an interest to decrease the speed limit in
towns along their neighboring highways?
Yes No
6.4. Has your state Department of Transportation decreased the speed limit in towns
along rural highways based on the complaints from communities?
Yes (Go to Q. No. 6.5) No (End of the
Questionnaire)
6.5. If yes, did decreasing the speed limit solve the problems in the towns along rural
highways?
Explain.

220
6.6. Please describe the current practices to reduce the speed limit in those towns.
221
REFERENCES
Agent, K. R., Pigman, J. G., & Weber, J. M. (1998). Evaluation of speed limits in
Kentucky. Transportation Research Record: Journal of the Transportation Research
Board, 1640, 57-64.
Aguero-Valverde, J., & Jovanis, P. P. (2009). Bayesian multivariate Poisson lognormal
models for crash severity modeling and site ranking. Transportation Research
Record: Journal of the Transportation Research Board, 2136, 82-91.
American Association of State Highway and Transportation Officials. (1994). A policy on
geometric design of highways and streets. Washington, DC.
Arizona Department of Transportation. (2000). Traffic studies: ADOT traffic engineering
policies, guidelines, and procedures.
Armour, M. (1986). The effect of police presence on urban driving speeds. Institute of
Transportation Engineers Journal, 56 (HS-039 925), 40-45.
Arnold, E., & Lantz, K. (2007). Evaluation of best practices in traffic operations and
safety: Phase I: Flashing LED stop sign and optical speed bars. (No. VTRC 07-
R34). Charlottesville, VA: Virginia Transportation Research Council.
Benekohal, R. F., Resende, P. T. V., & Orloski, R. L. (1992). Effects of police presence
on speed in a highway work zone: Circulating marked police car experiment. (No.
FHWA/IL/UI-240). Federal Highway Administration. Washington, DC.

222
Blackburn, R. R., Moran, R., & Glauz, W. D. (1989). Update of enforcement technology
and speed measurement devices. (No. DOT HS 807 584). National Highway Traffic
Safety Administration. Washington, DC, USA.
Bloch, S. A. (1998). Comparative study of speed reduction effects of photo-radar and
speed display boards. Transportation Research Record: Journal of the
Transportation Research Board, 1640, 27-36.
California Department of Transportation. (2012). California manual on uniform traffic
control devices
Chang, L., & Wang, H. (2006). Analysis of traffic injury severity: An application of non-
parametric classification tree techniques. Accident Analysis & Prevention, 38(5),
1019-1027.
Chen, H., Cao, L., & Logan, D. B. (2012). Analysis of risk factors affecting the severity
of intersection crashes by logistic regression. Traffic Injury Prevention, 13(3), 300-
307.
CloudMade. (2013). CloudMade - the location platform serving OEMs, enterprises &
developers. Retrieved 3/013, 2013, from http://cloudmade.com/
Cooper, D. R. C., Jordan, P. G., & Young, J. C. (1980). The effect on traffic speeds of
resurfacing a road.SR 571 Monograph, 22.
223
Cruzado, I., & Donnell, E. T. (2009). Evaluating effectiveness of dynamic speed display
signs in transition zones of two-lane, rural highways in Pennsylvania. Transportation
Research Record: Journal of the Transportation Research Board, 2122, 1-8.
Cruzado, I., & Donnell, E. T. (2010). Factors affecting driver speed choice along two-
lane rural highway transition zones. Journal of Transportation Engineering, 136(8),
755-764.
Dudek, C. L., & Ullman, G. L. (1987). Speed zoning and control. (No. 334-2F). College
Station, Texas: Texas State Department of Highways and Public Transportation.
Elvik, R. (1997). Effects on accidents of automatic speed enforcement in Norway.
Transportation Research Record: Journal of the Transportation Research Board,
1595, 14-19.
Elvik, R. (2002). Optimal speed limits: Limits of optimality models. Transportation
Research Record: Journal of the Transportation Research Board, 1818, 32-38.
Elvik, R. (2012). Speed limits, enforcement, and health consequences. Annual Review of
Public Health, 33, 225-238. doi: 10.1146/annurev-publhealth-031811-124634
Esposito, T., Mauro, R., Russo, F., & Dell'Acqua, G. (2011). Operating speed prediction
models for sustainable road safety management. The International Conference on
Sustainable Design and Construction 2011: ICSDC 2011: Integrating Sustainability
Practices in the Construction Industry, Kansas City, Missouri, 426(41204) 712-721.
224
European Transport Safety Council. (1995). Reducing traffic injuries resulting from
excess and inappropriate speed. Brussels, Belgium.
Evans, L., & Wasielewski, P. (1983). Risky driving related to driver and vehicle
characteristics. Accident Analysis & Prevention, 15(2), 121-136.
Federal Highway Administration. (2012). Manual on uniform traffic control devices for
streets and highways (2009th ed.). USA.
Federal Highway Administration. (2011). Highway statistics 2009 (2011). USA.
Federal Highway Safety Administration. (2000). Speeding in rural areas. USA.
Fildes, B. N., Rumbold, G., & Leening, A. (1991). Speed behaviour and drivers’ attitude
to speeding. (No. 16).Monash University Accident Research Centre.
Fitzpatrick, K., Carlson, P., Brewer, M., & Wooldridge, M. (2001). Design factors that
affect driver speed on suburban streets. Transportation Research Record: Journal of
the Transportation Research Board, 1751, 18-25.
Florida Department of Transportation. (2010). Speed zoning for highways, roads &
streets. Tallahassee, FL.
Forbes, G. J. (2011). Speed reduction techniques for rural high-to-low speed transitions.
(No. 412). Washington, DC: Transportation Research Board.
225
Garber, N. J., Miller, J. S., Yuan, B., & Sun, X. (2003). Safety effects of differential
speed limits on rural interstate highways. Transportation Research Record: Journal
of the Transportation Research Board, 1830, 56-62.
Georgia Department of Transportation. (2012). Traffic control - speed limits:
Establishment of speed zones.
Hajbabaie, A., Benekohal, R. F., Chitturi, M., Wang, M., & Medina, J. C. (2009).
Comparison of effects of automated speed enforcement and police presence on
speeding in work zones. Transportation Research Board 2009 Annual Meeting.
Haselton, C. B., Gibby, A. R., & Ferrara, T. C. (2002). Methodologies used to analyze
collision experience associated with speed limit changes on selected California
highways. Transportation Research Record: Journal of the Transportation Research
Board, 1784, 65-72.
Hassan, H. M., & Abdel-Aty, M. A. (2012). Exploring the safety implications of young
drivers’ behavior, attitudes and perceptions. Accident Analysis & Prevention, doi:
http://dx.doi.org/10.1016/j.aap.2012.05.003
Hauer, E., Ahlin, F. J., & Bowser, J. S. (1982). Speed enforcement and speed choice.
Accident Analysis & Prevention, 14(4), 267-278.
Herrstedt, L., Kjemtrup, K., Borges, P., & Andersen, P. (1993). An improved traffic
environment-a catalogue of ideas. (No. 106).Road Data Laboratory, Road Standards
Divison, Road Directorate, Denmark Ministry of Transport.
226
Highway safety program guideline no. 19: Speed management. (2006). Uniform
guidelines for state highway safety programs. National Highway Traffic Safety
Administration, USA.
Idaho Transportation Department. (1997). Speed limit and speed zones: A guide to
establishing speed zones in idaho.
Institute of Transportation Engineers. (1993). Technical council report summary: A
proposed recommended practice: Speed zone guidelines by ITE technical council
committee 4M - 25. Institute of Transportation Engineers Journal, , 45.
Institute of Transportation Engineers. (1993). A proposed recommended practice:
Guidelines for determining where the 55-MPH speed limit could be raised. Institute
of Transportation Engineers Journal, 1987, 21-25.
Jarvis, J. R., & Hoban, C. J. (1989). The development of a speed zoning knowledge-
based system. Civil Engineering Systems, 6(1-2), 71-79. doi:
http://dx.doi.org/10.1080/02630258908970546
Jonah, B. A. (1986). Accident risk and risk-taking behaviour among young drivers.
Accident Analysis & Prevention, 18(4), 255-271.
Jordan, G. (1998). Child pedestrian-car crashes near schools are a small percentage of
total child pedestrian crashes in philadelphia. Transportation Research Record:
Journal of the Transportation Research Board, 1636(1), 132-137.
227
Kallberg, V., Allsop, R., Ward, H., van der Horst, R., & Varhelyi, A. (1999).
Recommendations for speed management on European roads. 78th Annual Meeting
of the Transportation Research Board, TRB, National Research Council,
Washington, DC. 1-12.
Kamyab, A., Andrle, S., Kroeger, D., & Heyer, D. S. (2003). Methods to reduce traffic
speed in high-pedestrian rural areas. Transportation Research Record: Journal of the
Transportation Research Board, 1828, 31-37.
Kockelman, K., Bottom, J., Kweon, Y., Ma, J., & Wang, X. (2006). Safety impacts and
other implications of raised speed limits on high-speed roads. Transportation
Research Board.
Lamberti, R., Abate, D., De Guglielmo, M. L., Dell'Acqua, G., Esposito, T., Galante, F,
Pernetti, M. (2009). Perceptual measures and physical devices for traffic calming
along a rural highway crossing a small urban community: Speed behavior evaluation
in a driving simulator. Transportation Research Board 88th Annual Meeting,
Washington, DC. (09-3233)
Lee, C., Hellinga, B., & Saccomanno, F. (2004). Assessing safety benefits of variable
speed limits. Transportation Research Record: Journal of the Transportation
Research Board, 1897, 183-190.
Lee, J., & Mannering, F. (2002). Impact of roadside features on the frequency and
severity of run-off-roadway accidents: An empirical analysis. Accident Analysis &
Prevention, 34(2), 149-161.
228
Li, Z., Liu, P., Wang, W., & Xu, C. (2012). Using support vector machine models for
crash injury severity analysis. Accident Analysis & Prevention, 45, 478-486.
Louisiana Department of Transportation and Development. (1981). Warrants for the
establishment of speed zones, engineering directives and standards manual.
Malyshkina, N. V., & Mannering, F. (2008). Effect of increases in speed limits on
severities of injuries in accidents. Transportation Research Record: Journal of the
Transportation Research Board, 2083, 122-127.
Massachusetts Highway Department. (2005). Procedures for speed zoning on state and
municipal roadways.
Milton, J. C., Shankar, V. N., & Mannering, F. L. (2008). Highway accident severities
and the mixed logit model: An exploratory empirical analysis. Accident Analysis &
Prevention, 40(1), 260-266.
Missouri Department of Transportation. (2010). Speed limit guidelines - engineering
policy guide. Retrieved 3/12, 2013, from
http://epg.modot.mo.gov/index.php?title=949.2_Speed_Limit_Guidelines
Montana Department of Transportation. (2007). Speed studies: Montana traffic
engineering manual.
Najjar, Y. M., Stokes, R. W., & Russell, E. R. (2000). Setting speed limits on Kansas
two-lane highways: Neuronet approach. Transportation Research Record: Journal
of the Transportation Research Board, 1708, 20-27.
229
National Highway Traffic Safety Administration. (1994). Research agenda for an
improved novice driver education program. (No. DOT-HS-808-161). Washington,
DC, USA.
National Highway Traffic Safety Administration. (2012). 2010 motor vehicle crashes:
Overview. (No. DOT HS 811 552). Washington, DC, USA.
Nevada Department of Transportation. (2012). Nevada traffic crashes 2010. Carson City,
Nevada.
North Carolina Department of Transportation. (1995). Guidelines for the establishment of
restrictive speed limits.
Oei, H. (1996). Automatic speed management in the Netherlands. Transportation
Research Record: Journal of the Transportation Research Board, 1560, 57-64.
Open Street Map. (2013). Open street map of Nevada. Retrieved 3/013, 2013, from
http://www.openstreetmap.org/
Oregon Department of Transportation. (2011). Speed zone manual.
Parham, A. H., & Fitzpatrick, K. (1998). (No. FHWA/TX-99/1770-2). College Station,
Texas: Texas Transportation Institute, The Texas A&M University System.
Pyne, H. C., Dougherty, M. S., Carsten, O. M. J., & Tight, M. R. (1995). A simulator
based evaluation of speed reduction measures for rural arterial roads.
230
Raju, S., Souleyrette, R., & Maze, T. H. (1998). Impact of 65-mph speed limit on Iowa's
rural interstate highways: Integrated Bayesian forecasting and dynamic modeling
approach. Transportation Research Record: Journal of the Transportation Research
Board, 1640, 47-56.
Rämä, P. (1999). Effects of weather-controlled variable speed limits and warning signs
on driver behavior. Transportation Research Record: Journal of the Transportation
Research Board, 1689, 53-59.
Raub, R. A. (1985). Removal of roof-mounted emergency lighting from police patrol
vehicles: An evaluation. Transportation Research Record, 1047, 83-88.
Renski, H., Khattak, A. J., & Council, F. M. (1999). Effect of speed limit increases on
crash injury severity: Analysis of single-vehicle crashes on North Carolina interstate
highways. Transportation Research Record: Journal of the Transportation Research
Board, 1665, 100-108.
Rogerson, P. A., Newstead, S. V., & Cameron, M. H. (1994). Evaluation of the speed
camera program in Victoria, 1990-1991: Phase 3, localised effects on casualty
crashes and crash severity, phase 4, general effects on speed. (No. 54). Melbourne:
Monash University, Accident Research Centre.
Rules of the road, NRS 484B (2013). Nevada Revised Statutes.
231
Russell, E. R., & Godavarthy, R. P. (2010). Mitigating crashes at high-risk rural
intersections with two-way stop control. (No. K-TRAN: KSU-06-4). Manhattan,
Kansas: Kansas Department of Transportation.
Sandberg, W., Schoenecker, T., Sebastian, K., & Soler, D. (2006). Long-term
effectiveness of dynamic speed monitoring displays (DSMD) for speed management
at speed limit transitions. Compendium of Technical Papers of the Institute of
Transportation Engineers Annual Meeting and Exhibit Compendium of Technical
Papers, Jackson, Mississippi.
Sarkar, S., Jan Nederveen, A. A., & Pols, A. (1997). Renewed commitment to traffic
calming for pedestrian safety. Transportation Research Record: Journal of the
Transportation Research Board, 1578, 11-19.
Shinar, D., & Stiebel, J. (1986). The effectiveness of stationary versus moving police
vehicles on compliance with speed limit. Human Factors: The Journal of the Human
Factors and Ergonomics Society, 28(3), 365-371.
Sperling. (2013). People in Luning (zip 89420), Nevada. Retrieved 3/24, 2013, from
http://www.bestplaces.net/people/zip-code/nevada/luning/89420
Srinivasan, R., Parker, M., Harkey, D., Tharpe, D., & Sumner, R. (2006). Expert system
for recommending speed limits in speed zones. U.S. National Cooperative Highway
Research Program.
232
Wisconsin Department of Transportation. (2009). Statewide speed management
guidelines. Madison, WI.
Streff, F. M., Kostyniuk, L. P., & Christoff, C. (1995). Effects of drone radar and police
enforcement on travel speeds: Test on a 65 mph freeway and 55 mph construction
zone. (No. UMTRI-95-22).University of Michigan, Transportation Research
Institute.
Stuster, J. W. (1995). Experimental evaluation of municipal speed enforcement
programs. (No. DOT HS 808 325). National Highway Traffic Safety Administration,
Washington, DC, USA.
Stuster, J., Coffman, Z., & Warren, D. (1998). Synthesis of safety research related to
speed and speed management. (No. FHWA-RD-98-154). McLean, VA: U.S. Federal
Highway Administraton.
Teed, N., & Lund, A. K. (1993). The effect of laser speed-measuring devices on speed
limit law enforcement in Charleston, South Carolina. Accident Analysis &
Prevention, 25(4), 459-463.
Texas Department of Transportation. (2011). Procedures for establishing speed zones.
Thornton, M., & Lyles, R. W. (1996). Freeway speed zones: Safety and compliance
issues. Transportation Research Record: Journal of the Transportation Research
Board, 1560, 65-72.
233
Tignor, S. C., & Warren, D. (1990). Driver speed behavior on U.S. streets and highways.
Compendium of Technical Papers, Institute of Transportation Engineers,
Washington, DC.
Torbic, D. J., Gilmore, D. K., Bauer, K. M., Bokenkroger, C. D., Harwood, D. W., Lucas,
L. M., . . . Forsberg, M. D. (2012). Design guidance for high-speed to low-speed
transition zones for rural highways. (No. 737).U.S. National Cooperative Highway
Research Program.
Toyota Motor Corporation. (2013). Avoid dangerous situations and prevent accidents
with Toyota's active safety technology. Retrieved 2/21, 2013, from
http://www.toyota-
global.com/innovation/safety_technology/safety_technology/active_safety/
Toyota Motor Sales, U.S.A., Inc. (2013). Toyota | Toyota's collaborative safety research
center announces four new safety research projects. Retrieved 03/22, 2013, from
http://pressroom.toyota.com/releases/toyota+collaborative+safety+research+center+f
our+new+partners+december+2011.htm
Traffic law generally, NRS 484A (2013). Nevada Revised Statutes.
Traffic laws, NRS 484 (2011). Nevada Revised Statutes.
Transportation Cabinet. (2012). Traffic operations guidance manual. Commonwealth of
Kentucky.
234
Transportation Research Board. (1998). Managing speed: Review of current practice for
setting and enforcing speed limits. (No. 254).
Transportation Research Board. (1984). A decade of experience. (No. 204). Washington,
DC.
UK Department of Transport. (2005). Traffic advisory leaflet 1/05: Rumblewave
surfacing. London, UK.
U.S. Census Bureau. (2012). Nevada: 2010: Population and housing unit counts: 2010
census of population and housing. (No. CPH-2-30).
USLIMITS2: A tool to aid practitioners in determining appropriate speed limit
recommendations. Retrieved 03/12, 2013, from http://safety.fhwa.dot.gov/uslimits/
Vaa, T. (1997). Increased police enforcement: Effects on speed. Accident Analysis &
Prevention, 29(3), 373-385.
van der Horst, R., & de Ridder, S. (2007). Influence of roadside infrastructure on driving
behavior: Driving simulator study. Transportation Research Record: Journal of the
Transportation Research Board, 2018, 36-44.
Van Houten, R., & Van Huten, F. (1987). The effects of a specific prompting sign on
speed reduction. Accident Analysis & Prevention, 19(2), 115-117.
235
Warren, D. L. (1982). Synthesis of safety research related to traffic control and roadway
elements vol.2. (No. FHWA-TS-82-233). Federal Highway Administration.
Washington, DC.
Winnett, M. A., & Wheeler, A. H. (2002). Vehicle-activated signs – a large scale
evaluation. (No. 548).Transport Research Laboratory.
Wisconsin Transportation Information Center. (1999). Setting speed limits on local
roads. ( No. 21). Madison, WI.
Wyoming Department of Transportation. (2011). WYDOT traffic studies manual.
Xie, Y., Zhao, K., & Huynh, N. (2012). Analysis of driver injury severity in rural single-
vehicle crashes. Accident Analysis & Prevention, 47, 36-44.
Zahabi, S. A. H., Strauss, J., Manaugh, K., & Miranda-Moreno, L. F. (2011). Estimating
potential effect of speed limits, built environment, and other factors on severity of
pedestrian and cyclist injuries in crashes. Transportation Research Record: Journal
of the Transportation Research Board, 2247, 81-90. doi: 10.3141/2247-10
236
VITA
Graduate College
University of Nevada, Las Vegas
Krishna Prasad Shrestha
Degrees:
Bachelor’s Degree in Civil Engineering, 2010
Pulchowk Campus, Institute of Engineering, Tribhuvan University, Nepal
Special Honors and Awards:
GPSA Book Scholarship – University of Nevada Las Vegas (Spring 2013)
UNLV Access Grant – University of Nevada Las Vegas (Fall 2012 – Spring 2013)
The College Fellowship Scholarship – Institute of Engineering, Tribhuvan University
Freeship – Institute of Engineering, Tribhuvan University
Publications:
Shrestha, P. P., Shrestha, K., & Shrestha, K. (2013). Carbon dioxide emissions by the
transportation sector in Kathmandu valley, Nepal. Paper presented at the
ICSDEC 2012: Developing the Frontier of Sustainable Design, Engineering,
and Construction, 90-97.
Thesis Title: Investigation of Crashes and Identifying the Best Practices for Setting up
Speed Zones in Towns Along Rural Highways in Nevada
237
Thesis Examination Committee:
Chairperson, Pramen P. Shrestha, Ph.D.
Committee Member, Aly Said, Ph.D.
Committee Member, Ying Tian, Ph.D.
Graduate College Representative, Ozkan Eren, Ph.D.