Embed Size (px)
Citation preview

Modeling and Analysis
Investigation of biochemical biorefinery sizing and environmental sustainability impacts for conventional bale system and advanced uniform biomass logistics designs Andrew M Argo Eric CD Tan Daniel Inman National Renewable Energy Laboratory Golden CO USA Matt H Langholtz Laurence M Eaton Oak Ridge National Laboratory Oak Ridge TN USA Jacob J Jacobson Christopher T Wright David J Muth Jr Idaho National Laboratory Idaho Falls ID USA May M Wu Yi-Wen Chiu Robin L Graham Argonne National Laboratory Argonne IL USA
Received October 24 2012 revised December 26 2012 accepted December 28 2012 View online April 4 2013 at Wiley Online Library (wileyonlinelibrarycom) DOI 101002bbb1391 Biofuels Bioprod Bioref 7282ndash302 (2013)
Abstract The 2011 US Billion-Ton Update1 estimates that there are enough agricultural and forest resources to sustainably provide enough biomass to displace approximately 30 of the countryrsquos current petroleum consumption A portion of these resources are inaccessible at current cost targets with conventional feedstock supply systems because of their remoteness or low yields Reliable analyshyses and projections of US biofuels production depend on assumptions about the supply system and biorefinery capacity which in turn depend on economics feedstock logistics and sustainability A cross-functional team has examined optimal combinations of advances in feedstock supply systems and biorefinery capacities with rigorous design information improved crop yield and agronomic pracshytices and improved estimates of sustainable biomass availability Biochemical-conversion-to-ethanol is analyzed for conventional bale-based system and advanced uniform-format feedstock supply sysshytem designs The latter involves lsquopre-processingrsquo biomass into a higher-density aerobically stable easily transportable format that can supply large-scale biorefineries Feedstock supply costs logistics and processing costs are analyzed and compared taking into account environmental sustainability metrics copy 2013 Society of Chemical Industry and John Wiley amp Sons Ltd
Keywords biochemical ethanol process biorefinery size advanced uniform format conventional bale system LCA water footprint
Correspondence to Jacob J Jacobson Idaho National Laboratory 2525 N Fremont Ave Idaho Falls ID 83415 USA
E-mail jacobjacobsoninlgov
282 copy 2013 Society of Chemical Industry and John Wiley amp Sons Ltd
Modeling and Analysis Biochemical biorefinery sizing and environmental sustainability impacts AM Argo et al
Introduction
The study began by examining issues between bioreshyfinery capacity reliable feedstock logistics sustain-ability and life cycle assessment This initial study
focused on the conversion of herbaceous feedstock to ethashynol via a biochemical conversion process
Biorefinery sizing assumptions used in previous design reports are evaluated by incorporating new data from feedstock supply studies and new information on biorefi nshyery costs At the same time selected sustainability metrics are examined to determine how different sizing assumpshytions affect process sustainability
In 1991 the National Renewable Energ y Laboratory (NREL) published a case study that compared a 2000 dry metric tons per day (DMTday) facility against a large 9000 DMTday facility based on assumed feedshystock production using conventional-bale systems2 Th ey determined that the 2000 DMTday was approximately optimal
In 2002 NREL and the Oak Ridge National Laboratory (ORNL) performed a more rigorous analysis to determine the most appropriate cellulosic ethanol plant size Based on this study they again determined that 2000 DMT day was appropriately optimal3 Their analysis took into account the increased feedstock transportation costs assoshyciated with a larger collection radius and the economy-ofshyscale advantages derived from increased plant capacity Again as in the previous study they assumed a convenshytional-bale supply system
Reasons to unconstrain biorefi nery capacity
Ongoing RampD has suggested that a biorefinery capacity of 2000 DMTday and feedstock collection radius of 50 miles may no longer be optimal The following factors support re-visiting the biorefi nery-sizing assumptions
bull Improved biorefinery cost estimates based on more rigorous process-design information4
bull Improved crop yields and agronomic practices have led to increased biomass availability and better tools have expanded the amount of biomass that may be sustain-ably harvested and supplied to biorefi neries
bull Enhanced data and modeling tools have increased the spatial resolution of potentially available biomass resources from agricultural systems
bull Limiting the feedstock collection radius to 50 miles may cause difficulty in meeting biofuels production goals because fragmented resources such as low-
density or small-acreage plots may not be economishycally viable within that radius5
bull Instead of a conventional-bale system (CBS) a 2009 Idaho National Laboratory (INL) study showed that there are a variety cost and supply advantages off ered by an advanced uniform design (AUD) which involves lsquopreshyprocessingrsquo the biomass into a higher-density aerobically stable easily transportable format Aft er pre-processshying the AUD biomass can be treated as a commodshyity ndash bought and sold in a market and transported like commodity-scale grains ndash greatly increasing feedstock availability and providing a continuous consistent and economic feedstock supply to large-scale biorefi neries6
Advanced uniform design
Local biorefineries generally only process a single or small number of feedstock types which means that in a local area around a biorefinery crop rotation is not always feasishyble As such co-locating the biorefinery with the feedstock supply does not nessessarily encourage sustainable agrishyculture practices
On the other hand AUD largely decouples biorefi nery location from feedstock location Because pre-processed feedstock is more easily and efficiently transported to the biorefinery (via rail) access to isolated and low yield areas is increased thereby increasing the volume of material that can cost effectively enter the system In addition AUD facilitates sustainable land practices and allows bioreshyfineries to be efficiently sited and optimized for market demand distribution infrastructure proximity to utilities and access to skilled workers
AUD also mitigates risk associated with feedstock outshyages such as those associated with local weather pests and diseases Since feedstocks are processed as commodishyties in an AUD system the biorefinery should be less vulnerable to price volatility and may not need to contract directly with feedstock producers
AUD pre-processed feedstock has consistent physical properties thus allowing it to use standardized high-effishyciency high-volume grain handling and transport systems and equipment Standardization of feedstocks also allows biorefineries to establish tight operating specifi cations and optimize the conversion process based on narrow feedshystock characteristics
The AUD puts active controls in the supply system to manage moisture Active moisture controls are a key element of current grain commodity systems AUD preshyprocessing stabilizes feedstock material and facilitates commodity scale distribution of the biomass materials The ability to manage moisture allows more biomass into
copy 2013 Society of Chemical Industry and John Wiley amp Sons Ltd | Biofuels Bioprod Bioref 7282ndash302 (2013) DOI 101002bbb 283
AM Argo et al Modeling and Analysis Biochemical biorefinery sizing and environmental sustainability impacts
the supply system and reduced risk for the biorefi nery in feedstock quality Furthermore AUD pre-processing reducing the storage footprint and environmental impacts such as the fire hazards rodent infestation and localized odors normally associated with large-scale storshyage of non-aerobically stable feedstock that are typical of using CBS
Finally the AUD provides additional market options for geographically stranded feedstock producers (ie fragshymented feedstock not within a 50-mile biorefi nery radius that can not be collected economically with CBS) letting them sell excess product in a commodity market
Illustrative cases
In order to highlight the advantages of the AUD three illustrative cases where biorefinery capacities ranged from 500 to 10 000 DMTday were examined in this study POLYSYS an agricultural land-use simulation model from the Agricultural Policy Analysis Center at the University of Tennessee was used to forecast the biomass-feedstock supply for all three cases in the 2017 time frame Both CBS and AUD logistics systems were analyzed using INLrsquos Biomass Logistics Model (BLM)7 All three cases used a biochemical-conversion biorefinery that is based on pubshylished designs4 A complete listing of the modeling tools used in this analysis is included in Table 1
bull Case 1 Iowa corn stover feedstock collected using CBS logistics and evaluated for biorefinery capacities rangshying from 500 to 2000 DMTday (Note 2000 DMTday was the maximum size analyzed due to constraints on delivery traffi c congestion)
bull Case 2 Iowa corn stover collected using AUD logistics and evaluated for biorefinery capacities ranging from 500 to 10 000 DMTday
bull Case 3 Georgia herbaceous feedstock mix collected using AUD logistics and evaluated for biorefi nery capacities ranging from 500 to 10 000 DMTday (Note Although POLYSYS modeled a mix of herbaceous feedstocks for simplicity of calculations we assumed 100-switchgrass (SWG) for all downstream-of-feedshystock-production calculations)
For all three cases the biomass supply included in this 8study is documented in detail in Langholtz et al
Feedstock supply
Feedstock supply analyses were performed using the POLYSYS model which operates as a mathematical displacement model and is tied to historical agricultural-production and land-use patterns National production forecasts are disaggregated to the county level using trailshying averages of production data from the US Department of Agriculture (USDA) National Agricultural Statistics Service (NASS)9 The conditions under which bioenergy crops or crop residues are supplied are a function of the maximum net expected returns of traditional and cellushylosic crops after the demands established for current uses in the USDA baseline are met10
Through an iterative process of model executions a biomass farm-gate price of $6063 per DMT (2007$) was determined to supply sufficient biomass to meet the RFS2 cellulosic ethanol targets and projected biopower demand levels81112 In this scenario contracts begin for corn stover collection in 2012 and estimates on tillage behavior tradishytional crop yields and adoption assumptions are consistent with the analysis supporting the Billion-ton Update report1
Farmgate price of a feedstock includes the total cost of production harvest and delivery to the roadside Farmgate
Table 1 Summary of modeling and analysis tools used for this study
Biofuel System Element Modeling Tool Description
Feedstock Production POLYSYS An agricultural land-use simulation model used to forecast biomass-feedstock supply9
Feedstock Logistics (INLrsquos BLM)
Powersim System Dynamics Framework
A systems dynamic model used to design and simulate biomass preprocessing and supply chain (logistics) infrastructure7
Ethanol Conversion Aspen Plus A chemical process modeling system used to design the biomass-to-ethanol convershysion plant4
Life Cycle Analysis SimaPro A life cycle assessment and carbon footprinting model used to analyze environmental performance36
Water Resources SWAT A river basin scale model developed to quantify the impact of land management pracshytices in large complex watersheds2829
Water Resources SPARROW A modeling tool for regional interpretation of water-quality monitoring data2627
284 copy 2013 Society of Chemical Industry and John Wiley amp Sons Ltd | Biofuels Bioprod Bioref 7282ndash302 (2013) DOI 101002bbb
Modeling and Analysis Biochemical biorefinery sizing and environmental sustainability impacts AM Argo et al
Table 2 Summary of overall Iowa (IA) and Georgia (GA) residue and energy crop biomass feedstock supply modeled by POLYSYS
Total ha Planted Total Production Growers Payment Re sidueEnergy Crop Yield (DMTha) Harvested (DMT) (2007$DMT)
IOWA
Corn stover 413 5726650 23620508 $4690
Wheat straw 013 6041 7985 $3736
Total 408 5778203 23628493 $4690
GEORGIA
Corn stover 151 111034 167307 $4496
Wheat straw 096 60318 57700 $3584
Total residues 131 171351 225007 $4262
Switchgrass 1122 135023 1514474 $3366
Total 1122
price also includes profit required to incentivize production of energy crops For dedicated feedstocks to be competishytive farmers must be paid above the expected returns ie the opportunity cost of an alternative crop For residues farmgate price also compensates producers for nutrients and organic matter embodied in the residues which must be replaced in the soil This paper identifies feedstock supshyply available when the offered farmgate price of biomass is $61 per DMT lsquoGrower paymentrsquo is the price required for rights to harvest material from the field Succinctly grower payment is farmgate price minus harvest cost for both dedshyicated feedstocks and residues Average grower payments of participating producers and a summary of the feedstock supply results are reported in Table 2
Switchgrass production budgets are estimated for a 10-year planning horizon with no-till establishment on cropland cropland pasture and permanent pasture For permanent pasture a one-time breaking fee is incurred in the establishment year Crop residues include corn stover and wheat straw Crop residue yields are estimated aft er requirements for soil carbon and wind and water erosion are met Both crop residue and switchgrass supplies are estimated using a cumulative harvest effi ciency of 081 from standing yield to farm-gate yield
Supply projections were limited to the feedstock price level determined in Langholtz et al 8 to meet EISA and projected state biopower mandates Because there is insufshyficient feedstock at a farmgate price of $6063 per DMT in the state of GA to support a biorefinery capacity of 7500 or 10 000 DMTday we assumed that herbaceous feedstock will be available in adjacent states at the same grower payshyment as Georgia and the feedstock will be transported further for Case 3 in these scenarios
135023 1514474 $3366
The current analysis does not explore whether or not feedstocks would be produced on different land types when comparing the AUD with the CBS Nor does it explore the opportunity to increase feedstock prices to procure more supplies within a given area
Logistics
Feedstock logistics analyses were performed utilizing the INL Biomass Logistics Model (BLM)7 The BLM is develshyoped on a system dynamics modeling platform (Powersim) and accounts for all capital and operational elements when evaluating a feedstock supply system design Th e BLM is not used to site depots terminals or biorefi neries in the logistics analysis scenarios in this paper instead it assumes a central location within the biomass supply in the CBS designs and a specified distance from the biomass in the AUD designs The BLM simulates the flow of bioshymass through the entire supply chain tracking changes in feedstock characteristics (ie moisture content dry matter ash content and dry bulk density) as infl uenced by the various operations (ie harvesting transportation storage hellip) in the supply chain
Case 1 analysis
Th e first scenario is based on using a CBS for cornstover in Iowa which is a high yield area The CBS uses currently available commercial equipment and processes (Fig 1) Multi-pass har vest systems first move the fi eld-dried feedshystock into a windrow and then bale the windrow into large square bales (3rsquo times 4rsquo times 8rsquo) Bales are collected and moved
copy 2013 Society of Chemical Industry and John Wiley amp Sons Ltd | Biofuels Bioprod Bioref 7282ndash302 (2013) DOI 101002bbb 285
AM Argo et al Modeling and Analysis Biochemical biorefinery sizing and environmental sustainability impacts
Figure 1 Engineering design schematic of the CBS
to field-side storage stacks where they are protected with tarps When needed at the biorefinery bales are delivered via flatbed semi-trucks to biorefinery short-term storage At the biorefinery the bales are queued as needed through a grinding process that reduces the feedstock to frac14-inch particle size bulk material This bulk material is then fed into the conversion reactor
Constraints
One of the major drawbacks of the CBS design is that it provides limited opportunity to stabilize material or alter material specifications which means that only material containing less than 15 moisture which meets the conversion process moisture specification should be baled This constraint limits the availability of feedstocks and impacts system performance across climate ranges different harvest seasons and diff erent crops
In the case of switchgrass moisture at harvest can be managed primarily by delaying cutting of the crop until the material has dried appropriately However a corn stover harvest presents a very different challenge as stover
F igure 2 Moisture content of bales entering storage was vastly different for each year according to an INL-conducted northwest Iowa storage study (internal INL data not included here)
is a secondary crop to the corn grain The harvest window and subsequently the material properties of the stover at harvest is driven by grain harvest decisions
286 copy 2013 Society of Chemical Industry and John Wiley amp Sons Ltd | Biofuels Bioprod Bioref 7282ndash302 (2013) DOI 101002bbb
Modeling and Analysis Biochemical biorefinery sizing and environmental sustainability impacts AM Argo et al
Climate conditions have a major impact on the fi eld drying of stover Figure 2 shows moisture distribution as measured in an INL storage study of bales that were collected in northwest Iowa in 2009 and 2010 In 2010 approximately 95 of the bales collected met the CBS criteria of 15 moisture or below whereasin 2009 more than 97 of the bales collected were at 25 moisture or above Moving and storing material with high-moisture content significantly impacts stability and logistics costs
Analysis parameters
The logistics assessments for the CBS in this analysis are limited to 2000 DMTday and smaller biorefi neries because the current system design cannot be scaled to larger biorefineries without significant design changes across multiple elements For example an entirely new infrastructure would be required to support and manage movement of 60 or more trucks per hour as required in the large biorefinery capacity scenarios Following is a breakshydown of model parameters used in the Case 1 logistics analyses
bull 10 -year average assessment Using 10 years of harvest progress data coupled with climate data and fi eld dr ying data an analysis was performed to develop a 10-year average assessment of the corn stover availshyable to bale in Iowa at 15 moisture Th e resultant algorithm was tested against Boone County in the center of Iowa and showed that on average approxishymately 36 of the corn stover acres could be baled at 15 moisture or below This percentage was used to set the 10-year average for Iowa that was used in the Case 1 logistics analysis Itrsquos important to note that calculating an impact of climate across years or for larger geographical areas can result in an average that does not necessarily represent individual years in the dataset
bull Harvesting system The analysis accounts for collecshytion limitations stemming from using a multi-pass harvest system to collect corn stover in CBS INL fi eld tests demonstrated that collection rate is capped at 672 DMTha by the practical limits for this type of equipshyment Harvest windows of 19 harvest days are also assumed for the conventional system
bull Field-side storage Collection system models assume field-side storage at a fi xed stack size The distance to the stack input into the collection model is determined by using the county yield and implementing a radial geometric mean formula to establish the transport distance from the field to the local stack Storage
system bale stacks are assumed to be 2000 DMT Th e moisture content of the bales when put into storage is assumed to be 15 Dr y matter losses in storage are modeled at 5
bull Transportation to biorefi nery Transportation disshytance to the biorefinery is solved through a series of spatial operations First the feedstock density for a given county is normalized with the density of all counshyties that have area within a 25-mile radius of the subject countyrsquos centroid This normalization is performed to simulate the potential movement of feedstock across county boundaries for delivery to the biorefi nery Th e density calculation accounting for yield and acres parshyticipating in stover collection provides a DMTmile2
density With the normalized feedstock density calcushylated for the county a radial geometric mean formula is employed to establish an average biorefi nery transport distance for the county
bull Biorefi ner y pre-processing Pre-processing operations in the CBS are exclusively performed within the bioreshyfinery gates A two-stage grinder is used in the model to size-reduce the stover bales to frac14-inch material which is then fed through an even-flow queuing system and fed to the biochemical conversion reactor
Case 1 results
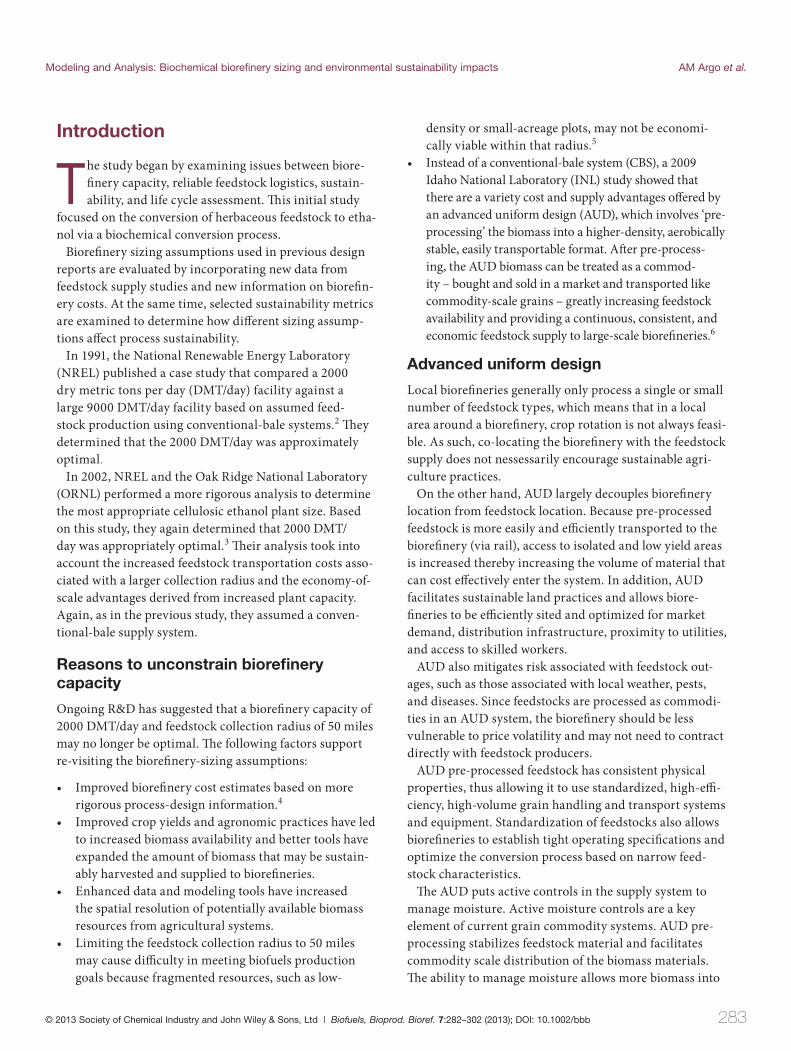
Using INLrsquos BLM the various supply system composhynents ndash harvest collection and transportation ndash were systematically run for the available biomass from each of the counties within Iowa The total supply costs were estimated by summing all of the system components Th e results of the statewide county-by-county analysis are shown in Fig 3
As can be seen in Fig 3 there is a wide range of logisshytics costs (approximately $45ndash$88DMT) using the CBS (Case 1) Cost variations are mainly due to low-yield areas which in turn have a high impact on the overall logistics costs
Case 2 and Case 3 AUD analyses
The AUD system utilizes equipment and processes that are in some cases commercially available now and in others at bench and pilot scales and will likely be comshymercially available in 2017 In the latter case production-sized equipment is scaled from current bench and pilot scale data
In an AUD process (Fig 4) a single-pass har vesting system collects the grain and corn stover at the same time and the corn stover is fed directly to a baler Th e corn
copy 2013 Society of Chemical Industry and John Wiley amp Sons Ltd | Biofuels Bioprod Bioref 7282ndash302 (2013) DOI 101002bbb 287
AM Argo et al Modeling and Analysis Biochemical biorefinery sizing and environmental sustainability impacts
Figure 3 Breakdown of total Case 1 and 2 logistics costs for each county in Iowa based on removable stover limits and total Case 3 logistics costs for each county in Georgia based on removable switchgrass limits
Figure 4 The AUD supply system uses distributed pre-processing depots to stabilize and densify feedstock providshying a lignocellulosic commodity material compatible with the infrastructure
288 copy 2013 Society of Chemical Industry and John Wiley amp Sons Ltd | Biofuels Bioprod Bioref 7282ndash302 (2013) DOI 101002bbb
Modeling and Analysis Biochemical biorefinery sizing and environmental sustainability impacts AM Argo et al
stover bales are collected and moved to fi eld-side stacks where they are protected with plastic wrap and stored Plastic wrap was chosen to protect the bales because of the concern that the high moisture content would lead to unacceptable dry matter losses if the bales were proshytected with tarps similar to that in Case 1 When needed stacks are delivered via flatbed semi-trucks to the depot for short-term storage and processing Again as needed the bales are sent through a drying grinding and denshysification process that dries the material to lt10 moisshyture reduces the feedstock to frac14-inch particle size bulk material and then densifies the material to a pellet with density gt30 lbft3 Th e densified material is then shipped to the terminal for blending and later transported to the biorefi nery
Analysis parameters
The key feature of AUD is the pre-processing of biomass at an early stage in the supply system (Fig 4) Pre-processing depots produce a final uniform material that is compatible with the grain storage and handling infrastructure
bull Field-side storage Collection system models assume field-side storage at a fixed stack size The distance to the stack input into the collection model is determined by using the county yield and implementing a radial geometric mean formula to establish the transport disshytance from the field to the local stack
bull Bale moisture content Storage system bale stacks are assumed to be 2000 DMT Moisture content of the bales when put into storage is assumed to be gt20 due to baling of the material directly from the combine without field drying Due to the high moisture content the bales are wrapped in plastic to reduce the dry matshyter losses Dry matter losses in storage are modeled at 78
bull Trucking feedstock from field-side to depot Depot size is based on the throughput capacity of the grinder which is the most capital-intensive piece of equipment at the depot The transportation distance is solved through a series of spatial operations much like the fi eld-side-to-biorefinery delivery in a CBS
bull Tr uck ing from depot to blend ing ter mina l This distance is again solved through a series of spatia l operations based on a terminal size of 3 600 000 DMTyear
bull Shipping by rail from blending terminal to biorefi nshyery This operation is based on a predetermined disshytance of 100 miles since by rail the majority of costs are fixed and the variable cost per mile is minimal
In Case 3 the logistics design in Georgia assumes that the feedstock is 100 switchgrass For the 7500 and 10 000 DMTday biorefi nery-capacity scenarios the terminal-toshybiorefinery distance was increased to 300 miles to accomshymodate the need for feedstock outside of Georgia
The AUD feedstock design incorporates a blending facilshyity (terminal) where different feedstocks can be blended to meet a conversion facilityrsquos feedstock design requirements
AUDrsquos impact is that the average supply system cost is higher but the spatial and temporal variability are much lower Where a CBS has low control over delivered bioshymass feedstock specifications AUD has high control Also AUD is able to access material from low-yield counties that would typically be stranded and not able to enter the supply system at aff ordable costs
Case 2 results
Case 2 uses the AUD for corn stover collection in Iowa The results of the county-by-county analysis of feedstock logistics costs are shown in Fig 3 Th e figure shows that while on average the total logistic cost is higher the range of variability ($66ndash$85 per DMT) is lower than that for the CBS ($45ndash$88 per DMT)
Case 3 results
Case 3 uses the AUD for switchgrass in Georgia Th e results of the county-by-county analysis of feedstock logisshytics costs are shown in Fig 3 Th e figure shows that while on the average the total logistics cost is higher the range of variability of the total cost is relatively low ($64ndash$117 per DMT) and much less for the AUD that for the CBS (intershynal INL data not included here)
Overall logistics results
The overall conclusions regarding the effects of feedstock logistics design on total cost are the following
bull The CBS demonstrates high spatial variability in costs even in highly productive regions such as Iowa Th e local ranges in feedstock cost were from $45 to $88 per DMT Additionally the CBS has very limited control on the feedstock specifications delivered to the biorefi nery
The AUD has higher average supply system costs but it does demonstrate reduced spatial and temporal varishyability The average costs were much more stable ranging from $66 to $85 per DMT for Iowa corn stover Th e AUD also allows material from areas with low yields to enter into the system whereas under the conventional supply
copy 2013 Society of Chemical Industry and John Wiley amp Sons Ltd | Biofuels Bioprod Bioref 7282ndash302 (2013) DOI 101002bbb 289
AM Argo et al Modeling and Analysis Biochemical biorefinery sizing and environmental sustainability impacts
Table 3 Breakdown of feedstock logistics costs by unit operations for CBS and AUD system designs in Boone County IA (a b) and AUD system design in Telfair County GA (c)
a) Conventional bale system costs in Boone County IA for 2000 DMTday biorefi nery
Harvest amp Storage Transportation Preprocessing Handling amp Total Collection (~45 km) Queuing Logistics
$1561 $595 $886 $1494 $083 $4620
b) Advanced uniform system costs in Boone County IA
Harvest amp Storage Depot Transport Depot Terminal Transport Terminal Biorefi nery Handling Total Collection (~17 km) Preprocessing (~80 km) Transport (~170 km) amp Queuing Logistics
$1615 $660 $601 $2479 $314 $154 $895 $083 $6801
c) Advanced uniform system costs in Telfair County GA
Harvest amp Storage Depot Transport Depot Terminal Transport Terminal Biorefi nery Handling Total Collection (~17 km) Preprocessing (~80 km) Transport (~170 km) amp Queuing Logistics
$1637 $554 $623 $2329 $496 $154 $895 $083 $6771
Table 4 Summary of feedstock and average logistics costs (weight averaged) used in biorefinery sizing and sustainability study
Distance to Biorefi nery Size Grower Payment Logistics Total Feedstock Case Location Feed Logistics Biorefi nery (mi) (DMTd) ($DMT) ($DMT) Cost ($DMT)
1 IA Corn stover CBS 15 500 $4689 $4481 $9170
21 1000 $4689 $4540 $9229
30 2000 $4689 $4620 $9309
2 IA Corn stover AUD 100 500 to 10000 $4690 $6801 $11491
3 GA SWG AUD 100 500 to 5000 $3393 $6771 $10164
300 7500 to 10000 $3393 $7377 $10770
system these resources would be stranded and inaccesshysible An example of the breakdown of total logistics cost for all cases are included in Table 3 AUD pre-processing costs are higher than those for CBS costs mainly because of higher pre-processing costs (drying pellitization) and additional transportation steps
Feedstock supply and logistics summary
A summary of the feedstock supply costs (grower payment + average logistic costs) for the work included in this study is displayed in Table 4 Using CBS logistics for Iowa corn stover (Case 1) the feedstock supply cost increases with increasing biorefinery size as a greater collection radius is required In contrast using AUD logistics for Iowa corn stover (Case 2) biorefinery capacities in excess of 10 000 DMTday are possible with a terminal located 100 miles from the biorefinery thus the feedstock supply cost is constant for Case 2 Similarly the feedstock supply cost
is constant for biorefinery capacities ranging from 500 to 5000 DMTday for Georgia switchgrass (Case 3) However at biorefinery capacities of 7500 and 10 000 DMTday for Georgia switchgrass a larger cropping area and thus a larger terminal-to-biorefinery distance (300 miles) is required
Conversion to ethanol
Conversion methods
Techno-economic analyses for the biochemical process of making ethanol from corn stover or switchgrass were pershyformed by scaling the biochemical process design model for corn stover that was developed at NREL4
For this study we assumed that the feedstock convertshyibility is the same for similar feedstock types (ie corn stover and switchgrass) as well as between the feedstock formats (ie CBS and AUD) All conversion data are based on those reported for corn stover (using CBS)4 using the feedstock composition data displayed in Table 5
290 copy 2013 Society of Chemical Industry and John Wiley amp Sons Ltd | Biofuels Bioprod Bioref 7282ndash302 (2013) DOI 101002bbb
Xylan 1953 2250
Moisture 12 15
Modeling and Analysis Biochemical biorefinery sizing and environmental sustainability impacts AM Argo et al
Table 5 Corn stover and switchgrass compositions used for this study
IA Corn Stover GA SwitchgrassComponent (dry wt ) (dry wt )
Glucan 3505 3500
Lignin 1576 2260
Ash 493 330
Acetate 181 180
Protein 310 120
Extractives 1465 970
Arabinan 238 310
Galactan 143 050
Mannan 060 030
Sucrose 077 000
Total structural carbohydrates 5899 6140
IA Corn Stover (bulk GA Switchgrass wt) (bulk wt)
The minimum ethanol selling prices (MESP) to give a 10 after-tax internal rate of return were calculated using a standard discounted cash flow rate of return analysis and the financial assumptions included in an earlier NREL report4
Results
Figure 5 shows the breakdown of the MESP (biorefi nery only) as a function of biorefinery plant size for each case
In all cases MESP decreases as biorefi nery size increased AUD logistics and processing costs are essenshytially constant for Iowa corn stover thus rising feedstock costs do not limit the economies-of-scale for biorefi neries in excess of 10 000 DMTday In the case of lower-yielding feedstock (county-yield) such as Georgia switchgrass increases in feedstock costs start to balance biorefi nery economies-of-scale at biorefinery capacities in excess of gt5000 DMTday
Due to the higher logistics costs the MESP for AUD corn stover (Case 2) is approximately $025gal higher than that for CBS (Case 1) at small biorefinery capacities (lt2000 DMT day) However this study suggests that increasing the bioreshyfinery size to 5000 DMTday will more than offset the MESP increase associated with more expensive AUD pre-processed feedstock Biorefinery capacities in excess of 10 000 DMT day are only possible with AUD and the resulting MESPs are substantially lower than that with CBS
As the biorefinery size increases from 500 to 10 000 DMTday with AUD logistics the MESP decreases from $372 to $225 per gallon for IA-corn stover and $337 to $204 per gallon for GA-switchgrass The lower MESP for switchgrass compared to that for corn stover is attributed to lower feedstock cost higher ethanol yield and higher byproduct electricity credit
Water
In this section the water resource use and the impact on water quality are analyzed Water resource analysis
Figure 5 M inimum ethanol selling price (MESP) as a function of plant size
copy 2013 Society of Chemical Industry and John Wiley amp Sons Ltd | Biofuels Bioprod Bioref 7282ndash302 (2013) DOI 101002bbb 291
AM Argo et al Modeling and Analysis Biochemical biorefinery sizing and environmental sustainability impacts
focuses on the consumptive use of rainfall (green water) and of surface and ground water (blue water) through irrigation and process water use Water quality analysis focuses on discharged water from fields containing fertishylizer and process water discharge (grey water) Th e water footprint for the three types of water is considered for the feedstock growing stage and conversion stage for the procshyess described earlier Detailed methodologies of the water footprint assessment for the green blue and grey water are described elsewhere13 30
Data sources and assumptions
We used public data sources for this work including govshyernment reports and open literature In the case that data were not available we relied on a combination of model simulation and statistical regression We assumed that soil moisture level is sufficient to meet the lowest water demand for switchgrass so that irrigation is not required in the state of Georgia
Climate irrigation crop and nutrient loading data
Water footprint calculation relies heavily on climate agricultural and hydrological data All of the climate data used in this study were derived from the National Climate Data Center of NOAA for the period from 1970 to 200014 Agricultural data for crop harvested acreshyage were from USDA NASS15 Irrigation application data were acquired from the 2002 and 2007 Census of Agriculture16 17 and the Farm and Ranch Irrigation Survey18 19 published by the USDA and USGS20 Th e crop coeffi cient Kc used in estimating evapotranspiration (ET the loss of water from the soil by evaporation and by transpiration from the crops) was compiled from the High Plains Regional Climate Center21 the Texas High Plains Evapotranspiration network22 and the previous studies of Kiniry et al2324 Climate in 2017 was assumed to remain the same as the historical average from 1970 to 2000 However the irrigation demand was further adjusted from historical values to reflect the increase of corn acreage and yield25 (Table 6) Nitrogen loading (data not included here) a key component of interest in grey water in IA and GA was estimated using results from SPARROW model26 27 Nitrogen fertilizer input rates for switchgrass were estimated by POLYSYS Regular corn field fertilizer input were simulated by a SWAT hydrologic model based on USDA state-level data28 29 while s upshyplemental fertilizer inputs were provided by POLYSYS A natural background nitrogen concentration CN was
compiled from USGS30 Nutrient loading for SWG was estimated from alfalfa27 Based on the historical monitorshying data sets for total nitrogen and nitrate (USGS30) CN is assumed to be 95 of the total nitrogen concentration in stream water Nitrogen fertilizer input data are included in Table 7 A comparison of the SWAT and SPARROW model in the studied areas showed good agreement for average values while SPARROW projected less veriabilishyties31 All of the watershed-scale calculations in this study were further converted into county-level data using the zonal statistics tool in ArcGIS
Water allocation
Corn plants produce grain and stover both of which can be used as biofuel feedstock During its growth corn grain and stover each appropriate a fraction of the total water requirement The same fraction was assumed in partionshying the water footprint associated with stover based biofuel production The blue water and green water of corn is partitioned between grain and stover by applying a crop harvest index32
Conversion process water use
Consumptive water use at the biorefinery is estimated from the process model described earlier Depending on the production scale and feedstock the normalized procshyess water use ranges from 53 to 56 LL ethanol produced The conversion process water is supplied from surface and ground water sources and therefore its use contributes only to the blue water footprint
In the conversion process more bio-electricity is proshyduced than that needed for the biorefinery and thus the excess power is sold to the grid A water use credit from the export electricity is considered using a system expanshysion approach Electricity generation water consumption factors from electricity generation mix in IA (05279 gal waterKwh) and GA (06403 gal waterKwh) were adopted from a Power-Water tool3334
Results
In general the blue water footprint of corn stover- and of switchgrass-derived ethanol ranged from 43 to 73 gal per gallon ethanol (Fig 6) similar to that of conventional oil sands production35 Switchgrass-derived ethanol (Case 3) requires less blue water than corn stover-derived ethanol (Case 1 or 2) because of savings from switchgrass irrigashytion Export bioelectricity contributes a 1 galgal water credit to the blue water footprint reducing total blue water use by 12ndash20
292 copy 2013 Society of Chemical Industry and John Wiley amp Sons Ltd | Biofuels Bioprod Bioref 7282ndash302 (2013) DOI 101002bbb
Modeling and Analysis Biochemical biorefinery sizing and environmental sustainability impacts AM Argo et al
Table 6 Projected corn irrigation volume by 2017
FIPS Case 1 Case 2 Case 1 Case 2 Irrigated Area
Fraction Case 1 Case 2
Corn Yield Harvested Acreage Irrigation Water Use Volume
DMTac 1000 Acre MGY
19017 212 217 29 81 06 282 777
19033 223 255 55 152 06 443 1220
19057 175 180 19 52 18 487 1339
19059 203 204 30 84 08 412 1135
19065 183 191 62 170 06 557 1533
19067 215 246 43 119 07 418 1150
19071 175 175 29 79 32 1663 4579
19077 178 178 37 102 14 852 2346
19081 231 257 50 139 07 520 1431
19085 184 184 65 179 121 13714 37756
19099 233 248 41 112 06 292 803
19103 157 157 45 123 13 695 1913
19109 219 220 48 131 06 401 1104
19111 137 137 14 38 14 264 726
19115 167 174 31 84 50 2504 6895
19119 228 237 61 169 07 927 2552
19125 169 169 25 70 07 328 902
19127 249 277 57 158 06 458 1260
19131 240 285 49 135 09 554 1525
19133 184 186 41 114 216 19403 53420
19139 173 185 31 85 26 1146 3156
19143 228 230 39 109 11 734 2020
19147 212 216 49 134 14 1060 2918
19149 207 211 89 245 10 1655 4557
19155 218 218 77 211 08 1198 3299
19161 241 281 54 148 07 562 1547
19163 202 216 31 85 09 351 966
19167 239 257 82 226 18 3080 8479
19193 272 272 64 176 27 3710 10214
19195 240 284 45 125 07 181 497
19197 244 289 64 175 05 444 1222
Counties might not require irrigation if not listed in the table
Green water contributes the most to the overall water footprint in both Case 1 and Case 2 and its relative conshytribution is significantly larger in Case 3 (Fig 7) due to the climate differences between GA and IA In particular GA has higher evapotransporation than IA28 Additionally green and blue water in Case 1 and Case 2 represent only the portion of water allocated to corn stover and the water use in the biorefinery whereas in Case 3 the results
represent all water associated with the entire above-ground switchgrass plant in addition to biorefi nery blue water use (Fig 7)
Grey water for the corn stover cases (Case 1 and Case 2) is attributable to the fraction of fertilizer required durshying the corn growth and supplemental fertilizer applicashytion to replace nutrients lost with stover removal Th e average grey water in Case 1 and Case 2 is estimated at
copy 2013 Society of Chemical Industry and John Wiley amp Sons Ltd | Biofuels Bioprod Bioref 7282ndash302 (2013) DOI 101002bbb 293
AM Argo et al Modeling and Analysis Biochemical biorefinery sizing and environmental sustainability impacts
Table 7 Nitrogen fertilizer application rate on stover (Cases 1 and 2) at Iowa and switchgrass at Georgia (Case 3) The unit is in kg N per stover or switchgrass harvested acreage
FIPS (IA) Case 1 Supplement Case 2 Supplement Corn FIPS (GA) Case 3 SWG FIPS (GA) Case 3 SWG Fertilizer Fertilizer Fertilizer Fertilizer Fertilizer
kgac kgac kgac kgac kgac
19001 1289 1289 5468 13001 6586 13201 ndash
19005 1052 1052 5521 13005 7048 13207 7800
19049 1232 1292 5509 13051 ndash 13251 7800
19003 1098 1098 2671 13003 7522 13205 ndash
19051 522 522 5692 13053 ndash 13253 ndash
19053 700 700 2671 13055 6745 13255 ndash
19055 1367 1406 5966 13057 ndash 13257 ndash
19007 608 608 5532 13007 ndash 13209 5834
19009 1821 1821 5485 13009 ndash 13211 7800
19011 1384 1440 5965 13011 3545 13213 7800
19013 1330 1392 5963 13013 ndash 13215 ndash
19015 1597 1620 5815 13015 7800 13217 5853
19017 1571 1609 5967 13017 7539 13219 7800
19019 956 982 5982 13019 7044 13221 7800
19021 1645 1725 5364 13021 6709 13223 ndash
19023 1616 1830 5875 13023 6921 13225 7800
19025 1605 1825 5388 13025 5840 13227 ndash
19027 1838 2116 5448 13027 6279 13229 6622
19029 1593 1593 2671 13029 6983 13231 6561
19031 1355 1407 5898 13031 6179 13233 7800
19033 1652 1889 5845 13033 7800 13235 6318
19035 1790 1928 2671 13035 ndash 13237 ndash
19037 1323 1336 5925 13037 ndash 13239 ndash
19039 436 436 5467 13039 ndash 13241 5845
19041 1636 1713 5644 13043 6090 13243 ndash
19043 1474 1474 5683 13045 4767 13245 ndash
19045 1156 1161 5976 13047 7800 13247 ndash
19047 1862 1862 2671 13049 ndash 13249 7800
19057 1296 1332 6044 13059 ndash 13259 7772
19059 1504 1512 5598 13061 7800 13261 7800
19061 1352 1352 5829 13063 ndash 13263 ndash
19063 1602 1641 5757 13065 5840 13265 ndash
19065 1355 1410 5845 13067 ndash 13267 5838
19067 1595 1824 5866 13069 5819 13269 7101
19069 1789 2142 5937 13071 ndash 13271 7239
19071 1292 1292 2671 13073 ndash 13273 7800
19073 1697 1998 5417 13075 ndash 13275 7080
19075 1742 1851 5973 13077 7800 13277 7456
19077 1314 1314 5481 13079 ndash 13279 6483
19079 1641 1672 6036 13081 7223 13281 5289
294 copy 2013 Society of Chemical Industry and John Wiley amp Sons Ltd | Biofuels Bioprod Bioref 7282ndash302 (2013) DOI 101002bbb
Modeling and Analysis Biochemical biorefinery sizing and environmental sustainability impacts AM Argo et al
Table 7 (Continued)
FIPS (IA) Case 1 Supplement Fertilizer
Case 2 Supplement Fertilizer
Corn Fertilizer
FIPS (GA) Case 3 SWG Fertilizer
FIPS (GA) Case 3 SWG Fertilizer
kgac kgac kgac kgac kgac
19081 1707 1904 6040 13083 ndash 13283 6959
19083 1603 1645 6081 13085 ndash 13285 ndash
19085 1363 1363 2671 13087 ndash 13287 6841
19087 1264 1264 5711 13089 ndash 13289 6691
19089 1375 1446 5828 13091 7367 13291 4111
19091 1804 2169 5880 13093 5814 13293 ndash
19093 1849 2033 2671 13095 ndash 13295 7800
19095 1287 1287 5943 13097 ndash 13297 5853
19097 1074 1074 6033 13099 ndash 13299 6652
19099 1724 1839 5901 13101 ndash 13301 6875
19101 1202 1202 5663 13103 7800 13303 6871
19103 1159 1159 5931 13105 7150 13305 5827
19105 1118 1135 5955 13107 5819 13307 7800
19107 1314 1314 5854 13109 7800 13309 ndash
19109 1618 1627 6018 13111 ndash 13311 6007
19111 1014 1014 5794 13113 ndash 13313 ndash
19113 1000 1008 5949 13115 ndash 13315 7610
19115 1239 1289 5961 13117 5289 13317 7800
19117 526 526 5408 13119 7800 13319 7800
19119 1690 1751 2671 13121 ndash 13321 7656
19121 1089 1089 5466 13123 ndash
19123 1295 1316 5713 13125 5835
19125 1251 1251 5476 13127 ndash
19127 1840 2052 5988 13129 7800
19129 1474 1474 2671 13131 ndash
19131 1775 2109 5944 13133 7800
19133 1364 1375 2671 13135 ndash
19135 751 751 5297 13137 5845
19137 1339 1339 2671 13139 5929
19139 1280 1369 5996 13141 ndash
19141 1697 1708 2671 13143 ndash
19143 1688 1705 2671 13145 ndash
19145 1178 1178 2671 13147 7800
19147 1570 1599 5642 13149 7800
19149 1535 1561 2671 13151 7800
19151 1683 1737 5619 13153 7424
19153 1308 1405 5641 13155 7480
19155 1616 1616 2671 13157 5853
19157 1548 1577 5930 13159 ndash
19159 540 540 2671 13161 6724
19161 1784 2078 5364 13163 7196
copy 2013 Society of Chemical Industry and John Wiley amp Sons Ltd | Biofuels Bioprod Bioref 7282ndash302 (2013) DOI 101002bbb 295
AM Argo et al Modeling and Analysis Biochemical biorefinery sizing and environmental sustainability impacts
Table 7 (Continued)
FIPS (IA) Case 1 Supplement Case 2 Supplement Corn FIPS (GA) Case 3 SWG FIPS (GA) Case 3 SWG Fertilizer Fertilizer Fertilizer Fertilizer Fertilizer
kgac kgac kgac kgac kgac
19163 1494 1596 6000 13165 7800
19165 1660 1660 2671 13167 6271
19167 1766 1899 2671 13169 ndash
19169 1561 1566 5996 13171 ndash
19171 1512 1514 5978 13173 6469
19173 629 629 2671 13175 7213
19175 737 737 5467 13177 7800
19177 646 646 5418 13179 ndash
19179 1099 1099 5455 13181 ndash
19181 1290 1290 5467 13183 5844
19183 1665 1708 5824 13185 5868
19185 552 552 2671 13187 4895
19187 1664 1668 5703 13189 ndash
19189 1599 1599 5909 13191 ndash
19191 1249 1253 5793 13193 7800
19193 2013 2013 2671 13195 5853
19195 1778 2102 5841 13197 7800
19197 1803 2136 6081 13199 7800
Figure 6 Blue water footprint of cellulosic ethanol produced from corn stover (Cases 1 and 2) and switchgrass (Case 3) by production stage at refinery scale of 2000 DMTday in 2017
850 and 820 gallons water per gallon ethanol respecshytively The average grey water in Case 3 which accounts for assimilating the total fertilizer applied during the entire growth period is only 210 gallons water per galshylon ethanol Results clearly indicate the unique ability of switchgrass to capture nutrient runoff in addition to lower fertilizer input requirements thereby reducing grey
Figure 7 Green and grey water footprint of cellulosic ethashynol produced from corn stover (Cases 1 and 2) and switch-grass (Case 3) by production stage at refinery scale of 2000 DMTday in 2017
water loadings Historically switchgrass has been used in conservation programs to contain the fertilizer loss to water body from crop land
At the same refinery capacity choice of feedstock and location could have significant impacts on types of water footprint of the cellulosic biofuel Since a majority of
296 copy 2013 Society of Chemical Industry and John Wiley amp Sons Ltd | Biofuels Bioprod Bioref 7282ndash302 (2013) DOI 101002bbb
Modeling and Analysis Biochemical biorefinery sizing and environmental sustainability impacts AM Argo et al
Figure 8 County-level distributions of blue green and grey water footprint for a 2000 DMTd biorefinery in 2017 to produced biofuel from (a) corn stover grown in Iowa via advanced logistic system (Case 2) and (b) switchgrass grown in Georgia via advanced logistic system (Case 3)
water requirements in the biofuel life cycle are from the feedstock growing stage the water footprint of a particushylar biofuel is largely determined by regional climate For example with the same advanced logistic system cellushylosic ethanol produced from switchgrass in biorefi neries located in Georgia (Case 3) requires 39 less blue water footprint than that for Iowa stover in Case 2 (Fig 6) Since the total water requirement for crop growth would be satshyisfied either from rainfall (green water) or irrigation (blue water) lower green water footprint often means increased blue water footprint for the same plant species (Fig 8)
Switchgrass is a high yield perennial which requires substantial evapotransporation to support its growth Switchgrass can be cultivated in many regions in the USA without irrigation and thus producing rain-fed switch-grass could have less impact on regional blue water use than other crops requiring irrigation
Biorefinery water supply is entirely blue water and biorefinery water demand is concentrated in a single local area Thus a biorefinery built in an area where the local feedstock is blue-water-intensive would likely lead to an increased burden on the local water resources as compare to a biorefinery built in an area with less blue-watershyintensive feedstocks Therefore it is environmentally benshyeficial to develop switchgrass or other perennial feedstock
plantations in regions with sufficient green water supply to ensure sustainable water use for the feedstock and the biorefi nery
From a whole biorefinery production perspective the resource needs for blue water becomes more pronounced as biorefinery scale increases Further CBS logistics systems dictate that the biorefinery be located near the biomass feedstock production whereas AUD logistics effectively decouple biorefinery location from feedstock production Therefore we expect that CBS logistics would stress a local water resource to a greater extent than AUD logistics Figure 8 further shows the extensive geographishycal variability of blue andf green water footprint even within a state which would affect the choice of feedstock thereby influence the refinery siting consideration
Sustainability metrics and life cycle assessment
SimaPro v73 life cycle assessment modeling soft ware was used to develop and link unit processes using estabshylished methods36 In the absence of primary publicly available data we used the Ecoinvent v20 and to a lesser extent the US Life Cycle Inventory (US LCI) processes We modified the Ecoinvent processes to be refl ective of
copy 2013 Society of Chemical Industry and John Wiley amp Sons Ltd | Biofuels Bioprod Bioref 7282ndash302 (2013) DOI 101002bbb 297
AM Argo et al Modeling and Analysis Biochemical biorefinery sizing and environmental sustainability impacts
Figure 9 GHG emi ssions LCA results for Case 1 Iowa corn stover CBS Case 2 Iowa corn stover AUD and Case 3 Georgia switchgrass AUD
US conditions and the US LCI processes to account for embodied emissions and energy fl ows
Modeling approach and assumptions
The modeling boundary for this study is from fi eld to refinery gate including embodied energy and material flows using the methods described elsewhere36 Th e funcshytional unit is 1 gallon of ethanol produced in the year 2017 Avoided impacts are accounted for using product displacement (also termed boundary system expansion)15
For products that share inputs (eg corn grain and corn stover) burdens are allocated between products based on a lsquoproduct-purposersquo approach Inputs to multi-year cropping systems (ie switchgrass) are likewise annualized by the length of the cropping rotation Impacts from direct and indirect land use change are not considered in this study Feedstock processing and transport are modeled accordshying to INLrsquos CBS and AUD
LCA modeling results
A breakdown of the GHG emission (in terms of CO2 equivalent) for each of the cases is displayed graphically in Fig 9 When comparing AUD to CBS moderate increases in GHG emissions observed in the Iowa corn stover
biochemical conversion-to-ethanol are associated with additional field-to-depot and depot-to-terminal transporshytation steps (lsquoPre-processing otherrsquo category in Fig 9) and increased transportation contribution to the biorefi nery (lsquoFeedstock transportationrsquo category) The small increases in normalized (per gallon of ethanol) electricity credit with increasing biorefinery scale are associated with increased electricity generation efficiency As expected we observe small feedstock differences in GHG emissions for Iowa corn stover and Georgia switchgrass
Conclusions
As expected we demonstrated that CBS has lower average logistics costs than AUD AUD logistic costs are higher than CBS costs primarly due to increased pre-processing costs and increased transportation costs (with multiple transportation step) Likewise and similar to earlier studshyies3 we also show that with CBS logistic costs increase as either biorefinery capacity or feedstock collection radius increase AUD mitigates many of the CBS feedstock-supshyply risks and while resulting in modestly higher logistics costs dramatically reduces both the temporal and spatial biomass-cost variability and allows access to substantially larger quantities of biomass
298 copy 2013 Society of Chemical Industry and John Wiley amp Sons Ltd | Biofuels Bioprod Bioref 7282ndash302 (2013) DOI 101002bbb
Modeling and Analysis Biochemical biorefinery sizing and environmental sustainability impacts AM Argo et al
1 AUD effectively disconnects the feedstock from the biorefinery in terms of both scale and location Single or multiple terminals can supply single or multiple biorefineries of varying scale Biorefi nery locations can be optimized for logistics distribution water resources or other project-specifi c constraints
2 AUD promotes more sustainable cropping practices whereas with CBS there is always pressure to produce the same crop
3 AUD providers have much tighter control on biomass production specifications than is possible with CBS
Iowa corn stover supply costs with CBS increase as biorefinery capacity increases from 500 to 2000 DMTday however the biorefinery economy-of-scale impact is larger in magnitude and the overall MESP decreases from $345 gal to $248gal going from 500 to 2000 DMTday bioreshyfinery scale It must be noted that CBS was not considered for biorefinery capacities of 5000 DMT or greater as the existing models do not capture the substantial additional infrastructure required to manage the high throughput of trucks through the biorefi nery
Iowa corn stover supply costs with the AUD are conshystant for biorefineries ranging from 500 to gt10 000 DMT day and as a result the MESP is reduced from $372gal to $225gal Similar to Iowa corn stover Georgia switch-grass feedstock supply costs are constant using the AUD for biorefineries ranging from 500 to 5000 DMTday however for biorefineries larger than ~5000 DMTday the terminal-to-biorefinery distance needs to be increased from 100 miles to 300 miles to supply the larger capacishyties As a result the MESP for Georgia decreases from $337gal to approximately $204gal as the biorefi nery capacity is increased from 500 DMTday to 10 000 DMT day Only small if any cost reductions are expected for capacities greater than 10 000 DMTday Results of this study show that biochemical ethanol production using a CBS results in the lowest MESP at small biorefi nery scales At larger biorefineries (gt5000 DMTday) these analyses suggest that AUD logistics result in producshytion costs lower than those possible with conventional systems
Our results show no detrimental effects on water sustainability metrics when comparing AUD to CBS Nevertheless feedstock location and feedstock type do affect water use and quality so if biorefineries use diff ershyent feedstocks or pull feedstocks from diff erent locations than those modeled here the results will change Th is study also did not consider the local impact on water resources when siting a large biorefinery We expect that
large biorefineries such as those enabled by the AUD will require a water footprint commensurate to their scale and hence may stress the water resources of a specifi c area where the biorefinery is located
Our results show that AUD logistics result in modestly higher GHG emissions (10ndash15) than CBS mainly due to additional field-to-depot and depot-to-terminal transporshytation (lsquoPre-processing otherrsquo category in Fig 9) steps and increased transportation contribution to the biorefi nery (lsquoFeedstock transportationrsquo category)
One potential issue not addressed in this work is that biomass resulting from AUD pre-processing are subshystantially changed physically and potentially chemically compared to materials collected using CBS (eg lignin is plasticized) This may aff ect biorefinery yield operability and production costs and thus future work will need to experimentally verify and quantify biochemical convershysion of these materials and adapt the modelsanalyses accordingly
Acknowledgement
We thank the US Department of Energy for funding and supporting this work
References 1 US DOE US Billion-Ton Update Biomass Supply for
a Bioenergy and Bioproducts Industry USDOE report no ORNLTM-2011224 lead by Perlack RD and Stokes BJ United States Department of Energy and Oak Ridge National Laboratory Oak Ridge TN pp 227 (2011)
2 Riley C and Schell D Technical and Economic Analysis of an Enzymatic Hydrolysis Based Ethanol Plant internal report Solar Energy Research Institute Golden CO (1991)
3 Aden A Ruth M Ibsen K Jechura J Neeves K Sheehan J et al Lignocellulosic Biomass to Ethanol Process Design and Economics Utilizing Co-Current Dilute Acid Prehydrolysis and Enzymatic Hydrolysis for Corn Stover report no NREL TP-510-32438 National Renewable Energy Laboratory Golden CO pp 154 (2002)
4 Humbird D Davis R Tao L Kinchin C Hsu D Aden A et al Process Design and Economics for the Conversion of Lignocellulosic Biomass to Ethanol Dilute-Acid Pretreatment and Enzymatic Hydrolysis of Corn Stover report no NREL TP-510-47764 National Renewable Energy Laboratory Golden CO pp 147 (2011)
5 Searcy E Wright C Muth D Hess JR and Jacobson J The Limits of a 50 Mile Collection Radius for Biomass Supply to a Biorefi nery draft report Idaho National Laboratory Idaho Falls ID (2010)
6 Hess JR Wright CT Kenney KL and Searcy EM Uniform-Format Solid Feedstock Supply System A Commodity-Scale Design to Produce and Infrastructure-Compaible Bulk Solid from Lignocellulosic Biomass ndash Executive Summary report no INLEXT-09-15423 Idaho National Laboratory Idaho Falls ID (2009)
copy 2013 Society of Chemical Industry and John Wiley amp Sons Ltd | Biofuels Bioprod Bioref 7282ndash302 (2013) DOI 101002bbb 299
AM Argo et al Modeling and Analysis Biochemical biorefinery sizing and environmental sustainability impacts
7 Jacobson JJ and Searcy EM Uniform-Format Feedstock Supply System Design for Woody Biomass Presented at the Spring Conference of the AICHe Orlando FL April (2010)
8 Langholtz M Graham RC Eaton L Perlack R Hellwinckel C and De la Torre Ugarte D Price projections of feedstocks for biofuels and biopower in the US Energy Policy41484ndash493 (2012)
9 USDA NASS Agricultural Prices Paid US [Online] Department of Agriculture National Agricultural Statistics Service Available at httpusdamannlibcornelledu MannUsdaviewDocumentInfododocumentID =1002 [September 19 2012]
10 USDA-OCEWAOB Agricultural Projects to 2018 Long-term Projections Report OCE-2010-1 US Department of Agriculture and Office of the Chief Economist World Agricultural Outlook Board Washington DC (2009)
11 US Congress Energy Independence and Security Act of 2007 110th Congress 1st Session HR 6 4 (2007)
12 US EIA Annual Energy Outlook 2010 Report No DOEEIAshy0383 US Energy Information Administration Washington DC (2010)
13 Wu M Chiu YW and Demissie Y Quantifying the regional water footprint of biofuel production by incorporatshying hydrologic modeling Water Resrouce Research DOI1010292011WR011809 (2012)
14 NOAA NCDC 1971-2000 US Climate Normals Products Clim 84 Daily Normals [Online] NOAA National Climate Data Center Available at httpwwwncdcnoaagov [September 19 2012]
15 Wang M Huo H and Arora S Methods of dealing with coshyproducts of biofuels in life-cycle analysis and consequent results within the US context Energy Policy 395726ndash5736 (2011)
16 USDA 2002 Census of Agriculture US Department of Agriculture Washington DC (2004)
17 USDA 2007 Census of Agriculture US Department of Agriculture Washington DC (2010)
18 USDA 2008 Farm and Ranch Irrigation Report No AC-02-SS-1 US Department of Agriculture Washington DC (2009)
19 USDA 2003 Farm and Ranch Irrigation Survey Report No AC-02-SS-1 US Department of Agriculture Washington DC (2004)
20 USGS Water Use in the United States 1985 1990 and 1995 [Online] US Geological Survey Available at httpwaterusgs govwatuse [September 19 2012]
21 High Plains Regional Climate Center Crop Coeffi cients for Corn [Online] Available at httpwwwhprccunleduawdn etcropcrop_corntxt [September 19 2012]
22 Marek T Colaizzi P Howell TA Dusek D and Porter D Estimating Seasonal Crop ET Using Calendar and Heat Unit Based Crop Coefficients in the Texas High Plains Evapotranspiration Network Presented at 2006 ASAE Annual Meeting American Society of Agricultural and Biological Engineers Portland OR pp 9ndash12 (2006)
23 Kiniry J Lynd L Greene N Johnson M Casler M and Laser MS Biofuels and water use Comparison of maize and switch-grass and general perspectives new research on biofuels ed by Wright JH and Evans DA Nova Science Publishing New York ( 2008 )
24 Kiniry JR Tischler CR and Van Esbroeck GA Radiation use efficiency and leaf CO2 exchange for diverse C4 grasses Biomass Bioenerg 17(2)95ndash112 (1999)
25 Grassini P Yang H and Cassman KG Limits to maize proshyductivity in western corn-belt A simulation analysis for fully irrigated and rainfed conditions Agr Forest Meteor 1491254ndash 1265 (2009 )
26 Hoos AB and McMahon G Spatial analysis of instream nitroshygen loads and factors controlling nitrogen delivery to streams in the Southeastern United States using spatially referenced regression on watershed attributes (SPARROW) and regional classifi cation frameworks Hydrol Process 232275ndash2294 (2009)
27 Hoos AB Terziotti S McMahon G Savvas K Tighe KC and Alkons-Wolinsky R Data to Support Statistical Modeling of Instream Nutrient Load Based on Watershed Attributes Southeastern United States 2002 US Geological Survey pp 50 (2008)
28 Demissie Y Yan E and Wu M Assessing regional hydrology and water quality implications of large-scale biofuel feedstock production in the Upper Mississippi river basin Environ Sci Technol 469174ndash9182 (2012)
29 Wu M Demissie Y and Yan E Simulated impact of future bioshyfuel production on water quality and water cycle dynamics in the Upper Mississippi river basin Biomass Bioenerg 4144ndash56 (2012)
30 Smith RA Alexander RB and Schwarz GE Natural backshyground concentrations of nutrients in streams and rivers of the conterminous United States Environ Sci Technol 373039ndash 3047 (2003)
31 Chiu YW and Wu M Assessing county-level water footprints of different cellulosic-biofuel feedstock pathways Environ Sci Technol 469155ndash9162 (2012)
32 White PJ CORN Chemistry and Technology 2nd edn ed byWhite PJ and Johnson LA American Association of Cereal Chemists Inc St Paul MN (2003)
33 Wu M and Peng MJ Developing a tool to estimate water withshydrawal and consumption in electricity generation in the United States Report No ANLESD11-2 update Argonne National Laboratory (2011)
34 ANL TTRDC GREET Model [Online] Argonne National Laboratory Transportation Technology RampD Center Chicago IL Available at httpgreetesanlgovindex phpcontent= power_water [August 21 2012]
35 Wu M Mintz M Wang M and Arora S Water consumption in the production of ethanol and petroleum gasoline Environ Manage 44981ndash997 (2009)
36 Hsu DD Inman D Heath GA Wolfrum EJ Mann MK and Aden A Life cycle environmental impacts of selected US ethanol production and use pathways in 2022 Environ Sci Technol 445289ndash5297 (2010)
300 copy 2013 Society of Chemical Industry and John Wiley amp Sons Ltd | Biofuels Bioprod Bioref 7282ndash302 (2013) DOI 101002bbb
Modeling and Analysis Biochemical biorefinery sizing and environmental sustainability impacts AM Argo et al
Andrew Argo
Dr Andrew Argo is senior engineer in the system integration group at the National Renewable Energy Laboratoshyry His work supports the Department of Energy Biomass Program in the areas of strategic systemlevel analysis and integrated biorefinery projects monitoring
Eric C D Tan
Dr Tan is a Senior Research Engineer in the Biorefinery Analysis Group of the National Bioenergy Center at the National Renewable National Laborashytory (NREL) His research interests include the process design economshyics and sustainability for conversion of lignocellulosic biomass to biofuels
with particular emphasis on the application of techno-economic analysis and life cycle assessment methods He also has broad experience in chemically reacting flow simulation and heterogeneous catalysis
Daniel Inman
Dr Daniel Inman is a research scienshytist at the National Renewable Energy Laboratory in Golden Colorado His primary research interests are centered on the sustainability biofuel producshytion and use He is currently involved in several modeling projects including lifecycle assessment of multiple biofushy
els and using system dynamics to examine the growth of the cellulosic biofuels industry
Matthew H Langholtz
Dr Matthew Langholtz is a Natural Resource Economist in the Bioenergy Group at Oak Ridge National Laborashytory He is principle investigator (PI) of the Resource Analysis Project of the Bioenergy Group at Oak Ridge Nationshyal Lab as well as the Short-Rotation Woody Crop Sustainability project His
research interests include biomass resource economics short-rotation woody crops and bioenergy from forest resources He has worked on valuation of non-market externalities and developed biomass supply curves for commercial projects the South and the United States
Laurence M Eaton
Laurence Eaton is a Research Scientist at the Oak Ridge National Laborashytory in the Bioenergy Resource and Engineering Systems Group of the Environmental Sciences Division An economist by training he conducts research to support bioenergy foreshycasting and analysis using economic
land use models and Geographic Information Science He participates in interdisciplinary Resource Assessment activities to support the efficient and sustainable supply of agricultural and forestry resources for commercial domestic bioenergy and bioproducts markets He has worked in the area of applied microeconomics as it reshylates to bioenergy firm input decisions and the valuation of environmental goods and ecological services
Jacob J Jacobson
Mr Jacobson is a researcher from the Idaho National Laboratory He has a diverse background in systems analysis system dynamics statistical consulting software development and project management His work has been in the development and analysis of decision support systems to evalushy
ate policy options and business risks of complex energy and environmental systems His recent work has been in the area of analysis of biomass feedstock logistics
Christopher T Wright
Dr Chris Wright is manager and a senior research engineer for the Idaho National Laboratoryrsquos Biofuels and Reshynewable Energy Department His work supports the Department of Energy Biomass Program in developing analyshysis tools and technology for feedstock supply logistics and conversion of bioshy
mass to valuable fuels chemicals materials and power His knowledge of DOErsquos Biomass Program includes an emphasis on lignocellulosic feedstock supply systems which includes feedstock characterization development preprocessing handling and transportation issues assoshyciated with refining biomass into fuels and chemicals
copy 2013 Society of Chemical Industry and John Wiley amp Sons Ltd | Biofuels Bioprod Bioref 7282ndash302 (2013) DOI 101002bbb 301
AM Argo et al Modeling and Analysis Biochemical biorefinery sizing and environmental sustainability impacts
David J Muth Jr
Dr Dave Muth is a Research Engishyneer at the Idaho National Laboratory in Biofuels and Renewable Energy Technologies He leads the Analysis and Sustainability Group with the Bioenergy Research Team developshying models and modeling techniques which facilitate the evaluation the
feedstock assembly system as it pertains to creating advanced biofuels He is currently working as a contracshytor to the US Department of Energy Office of Biomass Programs located at DOE Headquarters supporting the establishment of technical objectives and research tarshygets for next generation feedstock supply and logistics systems that deliver high quality biomass feedstocks for advanced hydrocarbon fuel production
May M Wu
Dr May Wu a principal energy systems analyst at Argonne National Laborashytory is the PI of biofuel sustainability research funded by the US Departshyment of Energy Her research interests are in the area of water quality and water quantity associated with large-scale development of biofuel convenshy
tional fuel electricity and emerging fuels and life cycle analysis Dr Wu is leading the effort to develop tools and largescale watershed models to assess spatially explicit water footprint of biofuel produced from conventional cellulosic and advanced feedstock and impact of proshyjected future production on regional nutrient sediment and hydrology Dr Wu served as an expert advisor to the Water Working Group of the Council on Sustainable Biomass Production (CSBP)
Yi-Wen Chiu
Dr Yi-Wen Chiu is a postdoctoral apshypointee in the Energy System Division at the Argonne National Laboratory As an interdisciplinary scientist her main research interests are to understand the coupling and interaction of human and natural systems by applying inteshygrated modeling tools She has been
involved in research related to water footprint and water-energy nexus with broad interests related to scenario analysis and environmental impact assessment She also participates in several studies aiming to advance biofuels by determining the feasible pathways of achieving water sustainability goals
Robin L Graham
Dr Robin L Graham is Deputy Associate Laboratory Director for the Computing Environment and Life Science Directorate at the Argonne National Laboratory Formerly at Oak Ridge National Laboratory she worked in the Bioenergy field for many years pioneering biomass feedstock
resource assessments that incorporated both economic and environmental factors She was an author of the original ldquoBillion Tonrdquo study and contributed to its 2011 follow-up An ecosystem ecologist by training she has long been interested in developing sustainable natural resources and began her career working for the RampD Division of Weyerhaeuser Co She currently is leading Argonnersquos Biological and Environmental Science Initiashytive which aims to accelerate our understanding of the fundamental design principles in biological and environshymental systems
302 copy 2013 Society of Chemical Industry and John Wiley amp Sons Ltd | Biofuels Bioprod Bioref 7282ndash302 (2013) DOI 101002bbb
Modeling and Analysis Biochemical biorefinery sizing and environmental sustainability impacts AM Argo et al
Introduction
The study began by examining issues between bioreshyfinery capacity reliable feedstock logistics sustain-ability and life cycle assessment This initial study
focused on the conversion of herbaceous feedstock to ethashynol via a biochemical conversion process
Biorefinery sizing assumptions used in previous design reports are evaluated by incorporating new data from feedstock supply studies and new information on biorefi nshyery costs At the same time selected sustainability metrics are examined to determine how different sizing assumpshytions affect process sustainability
In 1991 the National Renewable Energ y Laboratory (NREL) published a case study that compared a 2000 dry metric tons per day (DMTday) facility against a large 9000 DMTday facility based on assumed feedshystock production using conventional-bale systems2 Th ey determined that the 2000 DMTday was approximately optimal
In 2002 NREL and the Oak Ridge National Laboratory (ORNL) performed a more rigorous analysis to determine the most appropriate cellulosic ethanol plant size Based on this study they again determined that 2000 DMT day was appropriately optimal3 Their analysis took into account the increased feedstock transportation costs assoshyciated with a larger collection radius and the economy-ofshyscale advantages derived from increased plant capacity Again as in the previous study they assumed a convenshytional-bale supply system
Reasons to unconstrain biorefi nery capacity
Ongoing RampD has suggested that a biorefinery capacity of 2000 DMTday and feedstock collection radius of 50 miles may no longer be optimal The following factors support re-visiting the biorefi nery-sizing assumptions
bull Improved biorefinery cost estimates based on more rigorous process-design information4
bull Improved crop yields and agronomic practices have led to increased biomass availability and better tools have expanded the amount of biomass that may be sustain-ably harvested and supplied to biorefi neries
bull Enhanced data and modeling tools have increased the spatial resolution of potentially available biomass resources from agricultural systems
bull Limiting the feedstock collection radius to 50 miles may cause difficulty in meeting biofuels production goals because fragmented resources such as low-
density or small-acreage plots may not be economishycally viable within that radius5
bull Instead of a conventional-bale system (CBS) a 2009 Idaho National Laboratory (INL) study showed that there are a variety cost and supply advantages off ered by an advanced uniform design (AUD) which involves lsquopreshyprocessingrsquo the biomass into a higher-density aerobically stable easily transportable format Aft er pre-processshying the AUD biomass can be treated as a commodshyity ndash bought and sold in a market and transported like commodity-scale grains ndash greatly increasing feedstock availability and providing a continuous consistent and economic feedstock supply to large-scale biorefi neries6
Advanced uniform design
Local biorefineries generally only process a single or small number of feedstock types which means that in a local area around a biorefinery crop rotation is not always feasishyble As such co-locating the biorefinery with the feedstock supply does not nessessarily encourage sustainable agrishyculture practices
On the other hand AUD largely decouples biorefi nery location from feedstock location Because pre-processed feedstock is more easily and efficiently transported to the biorefinery (via rail) access to isolated and low yield areas is increased thereby increasing the volume of material that can cost effectively enter the system In addition AUD facilitates sustainable land practices and allows bioreshyfineries to be efficiently sited and optimized for market demand distribution infrastructure proximity to utilities and access to skilled workers
AUD also mitigates risk associated with feedstock outshyages such as those associated with local weather pests and diseases Since feedstocks are processed as commodishyties in an AUD system the biorefinery should be less vulnerable to price volatility and may not need to contract directly with feedstock producers
AUD pre-processed feedstock has consistent physical properties thus allowing it to use standardized high-effishyciency high-volume grain handling and transport systems and equipment Standardization of feedstocks also allows biorefineries to establish tight operating specifi cations and optimize the conversion process based on narrow feedshystock characteristics
The AUD puts active controls in the supply system to manage moisture Active moisture controls are a key element of current grain commodity systems AUD preshyprocessing stabilizes feedstock material and facilitates commodity scale distribution of the biomass materials The ability to manage moisture allows more biomass into
copy 2013 Society of Chemical Industry and John Wiley amp Sons Ltd | Biofuels Bioprod Bioref 7282ndash302 (2013) DOI 101002bbb 283
AM Argo et al Modeling and Analysis Biochemical biorefinery sizing and environmental sustainability impacts
the supply system and reduced risk for the biorefi nery in feedstock quality Furthermore AUD pre-processing reducing the storage footprint and environmental impacts such as the fire hazards rodent infestation and localized odors normally associated with large-scale storshyage of non-aerobically stable feedstock that are typical of using CBS
Finally the AUD provides additional market options for geographically stranded feedstock producers (ie fragshymented feedstock not within a 50-mile biorefi nery radius that can not be collected economically with CBS) letting them sell excess product in a commodity market
Illustrative cases
In order to highlight the advantages of the AUD three illustrative cases where biorefinery capacities ranged from 500 to 10 000 DMTday were examined in this study POLYSYS an agricultural land-use simulation model from the Agricultural Policy Analysis Center at the University of Tennessee was used to forecast the biomass-feedstock supply for all three cases in the 2017 time frame Both CBS and AUD logistics systems were analyzed using INLrsquos Biomass Logistics Model (BLM)7 All three cases used a biochemical-conversion biorefinery that is based on pubshylished designs4 A complete listing of the modeling tools used in this analysis is included in Table 1
bull Case 1 Iowa corn stover feedstock collected using CBS logistics and evaluated for biorefinery capacities rangshying from 500 to 2000 DMTday (Note 2000 DMTday was the maximum size analyzed due to constraints on delivery traffi c congestion)
bull Case 2 Iowa corn stover collected using AUD logistics and evaluated for biorefinery capacities ranging from 500 to 10 000 DMTday
bull Case 3 Georgia herbaceous feedstock mix collected using AUD logistics and evaluated for biorefi nery capacities ranging from 500 to 10 000 DMTday (Note Although POLYSYS modeled a mix of herbaceous feedstocks for simplicity of calculations we assumed 100-switchgrass (SWG) for all downstream-of-feedshystock-production calculations)
For all three cases the biomass supply included in this 8study is documented in detail in Langholtz et al
Feedstock supply
Feedstock supply analyses were performed using the POLYSYS model which operates as a mathematical displacement model and is tied to historical agricultural-production and land-use patterns National production forecasts are disaggregated to the county level using trailshying averages of production data from the US Department of Agriculture (USDA) National Agricultural Statistics Service (NASS)9 The conditions under which bioenergy crops or crop residues are supplied are a function of the maximum net expected returns of traditional and cellushylosic crops after the demands established for current uses in the USDA baseline are met10
Through an iterative process of model executions a biomass farm-gate price of $6063 per DMT (2007$) was determined to supply sufficient biomass to meet the RFS2 cellulosic ethanol targets and projected biopower demand levels81112 In this scenario contracts begin for corn stover collection in 2012 and estimates on tillage behavior tradishytional crop yields and adoption assumptions are consistent with the analysis supporting the Billion-ton Update report1
Farmgate price of a feedstock includes the total cost of production harvest and delivery to the roadside Farmgate
Table 1 Summary of modeling and analysis tools used for this study
Biofuel System Element Modeling Tool Description
Feedstock Production POLYSYS An agricultural land-use simulation model used to forecast biomass-feedstock supply9
Feedstock Logistics (INLrsquos BLM)
Powersim System Dynamics Framework
A systems dynamic model used to design and simulate biomass preprocessing and supply chain (logistics) infrastructure7
Ethanol Conversion Aspen Plus A chemical process modeling system used to design the biomass-to-ethanol convershysion plant4
Life Cycle Analysis SimaPro A life cycle assessment and carbon footprinting model used to analyze environmental performance36
Water Resources SWAT A river basin scale model developed to quantify the impact of land management pracshytices in large complex watersheds2829
Water Resources SPARROW A modeling tool for regional interpretation of water-quality monitoring data2627
284 copy 2013 Society of Chemical Industry and John Wiley amp Sons Ltd | Biofuels Bioprod Bioref 7282ndash302 (2013) DOI 101002bbb
Modeling and Analysis Biochemical biorefinery sizing and environmental sustainability impacts AM Argo et al
Table 2 Summary of overall Iowa (IA) and Georgia (GA) residue and energy crop biomass feedstock supply modeled by POLYSYS
Total ha Planted Total Production Growers Payment Re sidueEnergy Crop Yield (DMTha) Harvested (DMT) (2007$DMT)
IOWA
Corn stover 413 5726650 23620508 $4690
Wheat straw 013 6041 7985 $3736
Total 408 5778203 23628493 $4690
GEORGIA
Corn stover 151 111034 167307 $4496
Wheat straw 096 60318 57700 $3584
Total residues 131 171351 225007 $4262
Switchgrass 1122 135023 1514474 $3366
Total 1122
price also includes profit required to incentivize production of energy crops For dedicated feedstocks to be competishytive farmers must be paid above the expected returns ie the opportunity cost of an alternative crop For residues farmgate price also compensates producers for nutrients and organic matter embodied in the residues which must be replaced in the soil This paper identifies feedstock supshyply available when the offered farmgate price of biomass is $61 per DMT lsquoGrower paymentrsquo is the price required for rights to harvest material from the field Succinctly grower payment is farmgate price minus harvest cost for both dedshyicated feedstocks and residues Average grower payments of participating producers and a summary of the feedstock supply results are reported in Table 2
Switchgrass production budgets are estimated for a 10-year planning horizon with no-till establishment on cropland cropland pasture and permanent pasture For permanent pasture a one-time breaking fee is incurred in the establishment year Crop residues include corn stover and wheat straw Crop residue yields are estimated aft er requirements for soil carbon and wind and water erosion are met Both crop residue and switchgrass supplies are estimated using a cumulative harvest effi ciency of 081 from standing yield to farm-gate yield
Supply projections were limited to the feedstock price level determined in Langholtz et al 8 to meet EISA and projected state biopower mandates Because there is insufshyficient feedstock at a farmgate price of $6063 per DMT in the state of GA to support a biorefinery capacity of 7500 or 10 000 DMTday we assumed that herbaceous feedstock will be available in adjacent states at the same grower payshyment as Georgia and the feedstock will be transported further for Case 3 in these scenarios
135023 1514474 $3366
The current analysis does not explore whether or not feedstocks would be produced on different land types when comparing the AUD with the CBS Nor does it explore the opportunity to increase feedstock prices to procure more supplies within a given area
Logistics
Feedstock logistics analyses were performed utilizing the INL Biomass Logistics Model (BLM)7 The BLM is develshyoped on a system dynamics modeling platform (Powersim) and accounts for all capital and operational elements when evaluating a feedstock supply system design Th e BLM is not used to site depots terminals or biorefi neries in the logistics analysis scenarios in this paper instead it assumes a central location within the biomass supply in the CBS designs and a specified distance from the biomass in the AUD designs The BLM simulates the flow of bioshymass through the entire supply chain tracking changes in feedstock characteristics (ie moisture content dry matter ash content and dry bulk density) as infl uenced by the various operations (ie harvesting transportation storage hellip) in the supply chain
Case 1 analysis
Th e first scenario is based on using a CBS for cornstover in Iowa which is a high yield area The CBS uses currently available commercial equipment and processes (Fig 1) Multi-pass har vest systems first move the fi eld-dried feedshystock into a windrow and then bale the windrow into large square bales (3rsquo times 4rsquo times 8rsquo) Bales are collected and moved
copy 2013 Society of Chemical Industry and John Wiley amp Sons Ltd | Biofuels Bioprod Bioref 7282ndash302 (2013) DOI 101002bbb 285
AM Argo et al Modeling and Analysis Biochemical biorefinery sizing and environmental sustainability impacts
Figure 1 Engineering design schematic of the CBS
to field-side storage stacks where they are protected with tarps When needed at the biorefinery bales are delivered via flatbed semi-trucks to biorefinery short-term storage At the biorefinery the bales are queued as needed through a grinding process that reduces the feedstock to frac14-inch particle size bulk material This bulk material is then fed into the conversion reactor
Constraints
One of the major drawbacks of the CBS design is that it provides limited opportunity to stabilize material or alter material specifications which means that only material containing less than 15 moisture which meets the conversion process moisture specification should be baled This constraint limits the availability of feedstocks and impacts system performance across climate ranges different harvest seasons and diff erent crops
In the case of switchgrass moisture at harvest can be managed primarily by delaying cutting of the crop until the material has dried appropriately However a corn stover harvest presents a very different challenge as stover
F igure 2 Moisture content of bales entering storage was vastly different for each year according to an INL-conducted northwest Iowa storage study (internal INL data not included here)
is a secondary crop to the corn grain The harvest window and subsequently the material properties of the stover at harvest is driven by grain harvest decisions
286 copy 2013 Society of Chemical Industry and John Wiley amp Sons Ltd | Biofuels Bioprod Bioref 7282ndash302 (2013) DOI 101002bbb
Modeling and Analysis Biochemical biorefinery sizing and environmental sustainability impacts AM Argo et al
Climate conditions have a major impact on the fi eld drying of stover Figure 2 shows moisture distribution as measured in an INL storage study of bales that were collected in northwest Iowa in 2009 and 2010 In 2010 approximately 95 of the bales collected met the CBS criteria of 15 moisture or below whereasin 2009 more than 97 of the bales collected were at 25 moisture or above Moving and storing material with high-moisture content significantly impacts stability and logistics costs
Analysis parameters
The logistics assessments for the CBS in this analysis are limited to 2000 DMTday and smaller biorefi neries because the current system design cannot be scaled to larger biorefineries without significant design changes across multiple elements For example an entirely new infrastructure would be required to support and manage movement of 60 or more trucks per hour as required in the large biorefinery capacity scenarios Following is a breakshydown of model parameters used in the Case 1 logistics analyses
bull 10 -year average assessment Using 10 years of harvest progress data coupled with climate data and fi eld dr ying data an analysis was performed to develop a 10-year average assessment of the corn stover availshyable to bale in Iowa at 15 moisture Th e resultant algorithm was tested against Boone County in the center of Iowa and showed that on average approxishymately 36 of the corn stover acres could be baled at 15 moisture or below This percentage was used to set the 10-year average for Iowa that was used in the Case 1 logistics analysis Itrsquos important to note that calculating an impact of climate across years or for larger geographical areas can result in an average that does not necessarily represent individual years in the dataset
bull Harvesting system The analysis accounts for collecshytion limitations stemming from using a multi-pass harvest system to collect corn stover in CBS INL fi eld tests demonstrated that collection rate is capped at 672 DMTha by the practical limits for this type of equipshyment Harvest windows of 19 harvest days are also assumed for the conventional system
bull Field-side storage Collection system models assume field-side storage at a fi xed stack size The distance to the stack input into the collection model is determined by using the county yield and implementing a radial geometric mean formula to establish the transport distance from the field to the local stack Storage
system bale stacks are assumed to be 2000 DMT Th e moisture content of the bales when put into storage is assumed to be 15 Dr y matter losses in storage are modeled at 5
bull Transportation to biorefi nery Transportation disshytance to the biorefinery is solved through a series of spatial operations First the feedstock density for a given county is normalized with the density of all counshyties that have area within a 25-mile radius of the subject countyrsquos centroid This normalization is performed to simulate the potential movement of feedstock across county boundaries for delivery to the biorefi nery Th e density calculation accounting for yield and acres parshyticipating in stover collection provides a DMTmile2
density With the normalized feedstock density calcushylated for the county a radial geometric mean formula is employed to establish an average biorefi nery transport distance for the county
bull Biorefi ner y pre-processing Pre-processing operations in the CBS are exclusively performed within the bioreshyfinery gates A two-stage grinder is used in the model to size-reduce the stover bales to frac14-inch material which is then fed through an even-flow queuing system and fed to the biochemical conversion reactor
Case 1 results
Using INLrsquos BLM the various supply system composhynents ndash harvest collection and transportation ndash were systematically run for the available biomass from each of the counties within Iowa The total supply costs were estimated by summing all of the system components Th e results of the statewide county-by-county analysis are shown in Fig 3
As can be seen in Fig 3 there is a wide range of logisshytics costs (approximately $45ndash$88DMT) using the CBS (Case 1) Cost variations are mainly due to low-yield areas which in turn have a high impact on the overall logistics costs
Case 2 and Case 3 AUD analyses
The AUD system utilizes equipment and processes that are in some cases commercially available now and in others at bench and pilot scales and will likely be comshymercially available in 2017 In the latter case production-sized equipment is scaled from current bench and pilot scale data
In an AUD process (Fig 4) a single-pass har vesting system collects the grain and corn stover at the same time and the corn stover is fed directly to a baler Th e corn
copy 2013 Society of Chemical Industry and John Wiley amp Sons Ltd | Biofuels Bioprod Bioref 7282ndash302 (2013) DOI 101002bbb 287
AM Argo et al Modeling and Analysis Biochemical biorefinery sizing and environmental sustainability impacts
Figure 3 Breakdown of total Case 1 and 2 logistics costs for each county in Iowa based on removable stover limits and total Case 3 logistics costs for each county in Georgia based on removable switchgrass limits
Figure 4 The AUD supply system uses distributed pre-processing depots to stabilize and densify feedstock providshying a lignocellulosic commodity material compatible with the infrastructure
288 copy 2013 Society of Chemical Industry and John Wiley amp Sons Ltd | Biofuels Bioprod Bioref 7282ndash302 (2013) DOI 101002bbb
Modeling and Analysis Biochemical biorefinery sizing and environmental sustainability impacts AM Argo et al
stover bales are collected and moved to fi eld-side stacks where they are protected with plastic wrap and stored Plastic wrap was chosen to protect the bales because of the concern that the high moisture content would lead to unacceptable dry matter losses if the bales were proshytected with tarps similar to that in Case 1 When needed stacks are delivered via flatbed semi-trucks to the depot for short-term storage and processing Again as needed the bales are sent through a drying grinding and denshysification process that dries the material to lt10 moisshyture reduces the feedstock to frac14-inch particle size bulk material and then densifies the material to a pellet with density gt30 lbft3 Th e densified material is then shipped to the terminal for blending and later transported to the biorefi nery
Analysis parameters
The key feature of AUD is the pre-processing of biomass at an early stage in the supply system (Fig 4) Pre-processing depots produce a final uniform material that is compatible with the grain storage and handling infrastructure
bull Field-side storage Collection system models assume field-side storage at a fixed stack size The distance to the stack input into the collection model is determined by using the county yield and implementing a radial geometric mean formula to establish the transport disshytance from the field to the local stack
bull Bale moisture content Storage system bale stacks are assumed to be 2000 DMT Moisture content of the bales when put into storage is assumed to be gt20 due to baling of the material directly from the combine without field drying Due to the high moisture content the bales are wrapped in plastic to reduce the dry matshyter losses Dry matter losses in storage are modeled at 78
bull Trucking feedstock from field-side to depot Depot size is based on the throughput capacity of the grinder which is the most capital-intensive piece of equipment at the depot The transportation distance is solved through a series of spatial operations much like the fi eld-side-to-biorefinery delivery in a CBS
bull Tr uck ing from depot to blend ing ter mina l This distance is again solved through a series of spatia l operations based on a terminal size of 3 600 000 DMTyear
bull Shipping by rail from blending terminal to biorefi nshyery This operation is based on a predetermined disshytance of 100 miles since by rail the majority of costs are fixed and the variable cost per mile is minimal
In Case 3 the logistics design in Georgia assumes that the feedstock is 100 switchgrass For the 7500 and 10 000 DMTday biorefi nery-capacity scenarios the terminal-toshybiorefinery distance was increased to 300 miles to accomshymodate the need for feedstock outside of Georgia
The AUD feedstock design incorporates a blending facilshyity (terminal) where different feedstocks can be blended to meet a conversion facilityrsquos feedstock design requirements
AUDrsquos impact is that the average supply system cost is higher but the spatial and temporal variability are much lower Where a CBS has low control over delivered bioshymass feedstock specifications AUD has high control Also AUD is able to access material from low-yield counties that would typically be stranded and not able to enter the supply system at aff ordable costs
Case 2 results
Case 2 uses the AUD for corn stover collection in Iowa The results of the county-by-county analysis of feedstock logistics costs are shown in Fig 3 Th e figure shows that while on average the total logistic cost is higher the range of variability ($66ndash$85 per DMT) is lower than that for the CBS ($45ndash$88 per DMT)
Case 3 results
Case 3 uses the AUD for switchgrass in Georgia Th e results of the county-by-county analysis of feedstock logisshytics costs are shown in Fig 3 Th e figure shows that while on the average the total logistics cost is higher the range of variability of the total cost is relatively low ($64ndash$117 per DMT) and much less for the AUD that for the CBS (intershynal INL data not included here)
Overall logistics results
The overall conclusions regarding the effects of feedstock logistics design on total cost are the following
bull The CBS demonstrates high spatial variability in costs even in highly productive regions such as Iowa Th e local ranges in feedstock cost were from $45 to $88 per DMT Additionally the CBS has very limited control on the feedstock specifications delivered to the biorefi nery
The AUD has higher average supply system costs but it does demonstrate reduced spatial and temporal varishyability The average costs were much more stable ranging from $66 to $85 per DMT for Iowa corn stover Th e AUD also allows material from areas with low yields to enter into the system whereas under the conventional supply
copy 2013 Society of Chemical Industry and John Wiley amp Sons Ltd | Biofuels Bioprod Bioref 7282ndash302 (2013) DOI 101002bbb 289
AM Argo et al Modeling and Analysis Biochemical biorefinery sizing and environmental sustainability impacts
Table 3 Breakdown of feedstock logistics costs by unit operations for CBS and AUD system designs in Boone County IA (a b) and AUD system design in Telfair County GA (c)
a) Conventional bale system costs in Boone County IA for 2000 DMTday biorefi nery
Harvest amp Storage Transportation Preprocessing Handling amp Total Collection (~45 km) Queuing Logistics
$1561 $595 $886 $1494 $083 $4620
b) Advanced uniform system costs in Boone County IA
Harvest amp Storage Depot Transport Depot Terminal Transport Terminal Biorefi nery Handling Total Collection (~17 km) Preprocessing (~80 km) Transport (~170 km) amp Queuing Logistics
$1615 $660 $601 $2479 $314 $154 $895 $083 $6801
c) Advanced uniform system costs in Telfair County GA
Harvest amp Storage Depot Transport Depot Terminal Transport Terminal Biorefi nery Handling Total Collection (~17 km) Preprocessing (~80 km) Transport (~170 km) amp Queuing Logistics
$1637 $554 $623 $2329 $496 $154 $895 $083 $6771
Table 4 Summary of feedstock and average logistics costs (weight averaged) used in biorefinery sizing and sustainability study
Distance to Biorefi nery Size Grower Payment Logistics Total Feedstock Case Location Feed Logistics Biorefi nery (mi) (DMTd) ($DMT) ($DMT) Cost ($DMT)
1 IA Corn stover CBS 15 500 $4689 $4481 $9170
21 1000 $4689 $4540 $9229
30 2000 $4689 $4620 $9309
2 IA Corn stover AUD 100 500 to 10000 $4690 $6801 $11491
3 GA SWG AUD 100 500 to 5000 $3393 $6771 $10164
300 7500 to 10000 $3393 $7377 $10770
system these resources would be stranded and inaccesshysible An example of the breakdown of total logistics cost for all cases are included in Table 3 AUD pre-processing costs are higher than those for CBS costs mainly because of higher pre-processing costs (drying pellitization) and additional transportation steps
Feedstock supply and logistics summary
A summary of the feedstock supply costs (grower payment + average logistic costs) for the work included in this study is displayed in Table 4 Using CBS logistics for Iowa corn stover (Case 1) the feedstock supply cost increases with increasing biorefinery size as a greater collection radius is required In contrast using AUD logistics for Iowa corn stover (Case 2) biorefinery capacities in excess of 10 000 DMTday are possible with a terminal located 100 miles from the biorefinery thus the feedstock supply cost is constant for Case 2 Similarly the feedstock supply cost
is constant for biorefinery capacities ranging from 500 to 5000 DMTday for Georgia switchgrass (Case 3) However at biorefinery capacities of 7500 and 10 000 DMTday for Georgia switchgrass a larger cropping area and thus a larger terminal-to-biorefinery distance (300 miles) is required
Conversion to ethanol
Conversion methods
Techno-economic analyses for the biochemical process of making ethanol from corn stover or switchgrass were pershyformed by scaling the biochemical process design model for corn stover that was developed at NREL4
For this study we assumed that the feedstock convertshyibility is the same for similar feedstock types (ie corn stover and switchgrass) as well as between the feedstock formats (ie CBS and AUD) All conversion data are based on those reported for corn stover (using CBS)4 using the feedstock composition data displayed in Table 5
290 copy 2013 Society of Chemical Industry and John Wiley amp Sons Ltd | Biofuels Bioprod Bioref 7282ndash302 (2013) DOI 101002bbb
Xylan 1953 2250
Moisture 12 15
Modeling and Analysis Biochemical biorefinery sizing and environmental sustainability impacts AM Argo et al
Table 5 Corn stover and switchgrass compositions used for this study
IA Corn Stover GA SwitchgrassComponent (dry wt ) (dry wt )
Glucan 3505 3500
Lignin 1576 2260
Ash 493 330
Acetate 181 180
Protein 310 120
Extractives 1465 970
Arabinan 238 310
Galactan 143 050
Mannan 060 030
Sucrose 077 000
Total structural carbohydrates 5899 6140
IA Corn Stover (bulk GA Switchgrass wt) (bulk wt)
The minimum ethanol selling prices (MESP) to give a 10 after-tax internal rate of return were calculated using a standard discounted cash flow rate of return analysis and the financial assumptions included in an earlier NREL report4
Results
Figure 5 shows the breakdown of the MESP (biorefi nery only) as a function of biorefinery plant size for each case
In all cases MESP decreases as biorefi nery size increased AUD logistics and processing costs are essenshytially constant for Iowa corn stover thus rising feedstock costs do not limit the economies-of-scale for biorefi neries in excess of 10 000 DMTday In the case of lower-yielding feedstock (county-yield) such as Georgia switchgrass increases in feedstock costs start to balance biorefi nery economies-of-scale at biorefinery capacities in excess of gt5000 DMTday
Due to the higher logistics costs the MESP for AUD corn stover (Case 2) is approximately $025gal higher than that for CBS (Case 1) at small biorefinery capacities (lt2000 DMT day) However this study suggests that increasing the bioreshyfinery size to 5000 DMTday will more than offset the MESP increase associated with more expensive AUD pre-processed feedstock Biorefinery capacities in excess of 10 000 DMT day are only possible with AUD and the resulting MESPs are substantially lower than that with CBS
As the biorefinery size increases from 500 to 10 000 DMTday with AUD logistics the MESP decreases from $372 to $225 per gallon for IA-corn stover and $337 to $204 per gallon for GA-switchgrass The lower MESP for switchgrass compared to that for corn stover is attributed to lower feedstock cost higher ethanol yield and higher byproduct electricity credit
Water
In this section the water resource use and the impact on water quality are analyzed Water resource analysis
Figure 5 M inimum ethanol selling price (MESP) as a function of plant size
copy 2013 Society of Chemical Industry and John Wiley amp Sons Ltd | Biofuels Bioprod Bioref 7282ndash302 (2013) DOI 101002bbb 291
AM Argo et al Modeling and Analysis Biochemical biorefinery sizing and environmental sustainability impacts
focuses on the consumptive use of rainfall (green water) and of surface and ground water (blue water) through irrigation and process water use Water quality analysis focuses on discharged water from fields containing fertishylizer and process water discharge (grey water) Th e water footprint for the three types of water is considered for the feedstock growing stage and conversion stage for the procshyess described earlier Detailed methodologies of the water footprint assessment for the green blue and grey water are described elsewhere13 30
Data sources and assumptions
We used public data sources for this work including govshyernment reports and open literature In the case that data were not available we relied on a combination of model simulation and statistical regression We assumed that soil moisture level is sufficient to meet the lowest water demand for switchgrass so that irrigation is not required in the state of Georgia
Climate irrigation crop and nutrient loading data
Water footprint calculation relies heavily on climate agricultural and hydrological data All of the climate data used in this study were derived from the National Climate Data Center of NOAA for the period from 1970 to 200014 Agricultural data for crop harvested acreshyage were from USDA NASS15 Irrigation application data were acquired from the 2002 and 2007 Census of Agriculture16 17 and the Farm and Ranch Irrigation Survey18 19 published by the USDA and USGS20 Th e crop coeffi cient Kc used in estimating evapotranspiration (ET the loss of water from the soil by evaporation and by transpiration from the crops) was compiled from the High Plains Regional Climate Center21 the Texas High Plains Evapotranspiration network22 and the previous studies of Kiniry et al2324 Climate in 2017 was assumed to remain the same as the historical average from 1970 to 2000 However the irrigation demand was further adjusted from historical values to reflect the increase of corn acreage and yield25 (Table 6) Nitrogen loading (data not included here) a key component of interest in grey water in IA and GA was estimated using results from SPARROW model26 27 Nitrogen fertilizer input rates for switchgrass were estimated by POLYSYS Regular corn field fertilizer input were simulated by a SWAT hydrologic model based on USDA state-level data28 29 while s upshyplemental fertilizer inputs were provided by POLYSYS A natural background nitrogen concentration CN was
compiled from USGS30 Nutrient loading for SWG was estimated from alfalfa27 Based on the historical monitorshying data sets for total nitrogen and nitrate (USGS30) CN is assumed to be 95 of the total nitrogen concentration in stream water Nitrogen fertilizer input data are included in Table 7 A comparison of the SWAT and SPARROW model in the studied areas showed good agreement for average values while SPARROW projected less veriabilishyties31 All of the watershed-scale calculations in this study were further converted into county-level data using the zonal statistics tool in ArcGIS
Water allocation
Corn plants produce grain and stover both of which can be used as biofuel feedstock During its growth corn grain and stover each appropriate a fraction of the total water requirement The same fraction was assumed in partionshying the water footprint associated with stover based biofuel production The blue water and green water of corn is partitioned between grain and stover by applying a crop harvest index32
Conversion process water use
Consumptive water use at the biorefinery is estimated from the process model described earlier Depending on the production scale and feedstock the normalized procshyess water use ranges from 53 to 56 LL ethanol produced The conversion process water is supplied from surface and ground water sources and therefore its use contributes only to the blue water footprint
In the conversion process more bio-electricity is proshyduced than that needed for the biorefinery and thus the excess power is sold to the grid A water use credit from the export electricity is considered using a system expanshysion approach Electricity generation water consumption factors from electricity generation mix in IA (05279 gal waterKwh) and GA (06403 gal waterKwh) were adopted from a Power-Water tool3334
Results
In general the blue water footprint of corn stover- and of switchgrass-derived ethanol ranged from 43 to 73 gal per gallon ethanol (Fig 6) similar to that of conventional oil sands production35 Switchgrass-derived ethanol (Case 3) requires less blue water than corn stover-derived ethanol (Case 1 or 2) because of savings from switchgrass irrigashytion Export bioelectricity contributes a 1 galgal water credit to the blue water footprint reducing total blue water use by 12ndash20
292 copy 2013 Society of Chemical Industry and John Wiley amp Sons Ltd | Biofuels Bioprod Bioref 7282ndash302 (2013) DOI 101002bbb
Modeling and Analysis Biochemical biorefinery sizing and environmental sustainability impacts AM Argo et al
Table 6 Projected corn irrigation volume by 2017
FIPS Case 1 Case 2 Case 1 Case 2 Irrigated Area
Fraction Case 1 Case 2
Corn Yield Harvested Acreage Irrigation Water Use Volume
DMTac 1000 Acre MGY
19017 212 217 29 81 06 282 777
19033 223 255 55 152 06 443 1220
19057 175 180 19 52 18 487 1339
19059 203 204 30 84 08 412 1135
19065 183 191 62 170 06 557 1533
19067 215 246 43 119 07 418 1150
19071 175 175 29 79 32 1663 4579
19077 178 178 37 102 14 852 2346
19081 231 257 50 139 07 520 1431
19085 184 184 65 179 121 13714 37756
19099 233 248 41 112 06 292 803
19103 157 157 45 123 13 695 1913
19109 219 220 48 131 06 401 1104
19111 137 137 14 38 14 264 726
19115 167 174 31 84 50 2504 6895
19119 228 237 61 169 07 927 2552
19125 169 169 25 70 07 328 902
19127 249 277 57 158 06 458 1260
19131 240 285 49 135 09 554 1525
19133 184 186 41 114 216 19403 53420
19139 173 185 31 85 26 1146 3156
19143 228 230 39 109 11 734 2020
19147 212 216 49 134 14 1060 2918
19149 207 211 89 245 10 1655 4557
19155 218 218 77 211 08 1198 3299
19161 241 281 54 148 07 562 1547
19163 202 216 31 85 09 351 966
19167 239 257 82 226 18 3080 8479
19193 272 272 64 176 27 3710 10214
19195 240 284 45 125 07 181 497
19197 244 289 64 175 05 444 1222
Counties might not require irrigation if not listed in the table
Green water contributes the most to the overall water footprint in both Case 1 and Case 2 and its relative conshytribution is significantly larger in Case 3 (Fig 7) due to the climate differences between GA and IA In particular GA has higher evapotransporation than IA28 Additionally green and blue water in Case 1 and Case 2 represent only the portion of water allocated to corn stover and the water use in the biorefinery whereas in Case 3 the results
represent all water associated with the entire above-ground switchgrass plant in addition to biorefi nery blue water use (Fig 7)
Grey water for the corn stover cases (Case 1 and Case 2) is attributable to the fraction of fertilizer required durshying the corn growth and supplemental fertilizer applicashytion to replace nutrients lost with stover removal Th e average grey water in Case 1 and Case 2 is estimated at
copy 2013 Society of Chemical Industry and John Wiley amp Sons Ltd | Biofuels Bioprod Bioref 7282ndash302 (2013) DOI 101002bbb 293
AM Argo et al Modeling and Analysis Biochemical biorefinery sizing and environmental sustainability impacts
Table 7 Nitrogen fertilizer application rate on stover (Cases 1 and 2) at Iowa and switchgrass at Georgia (Case 3) The unit is in kg N per stover or switchgrass harvested acreage
FIPS (IA) Case 1 Supplement Case 2 Supplement Corn FIPS (GA) Case 3 SWG FIPS (GA) Case 3 SWG Fertilizer Fertilizer Fertilizer Fertilizer Fertilizer
kgac kgac kgac kgac kgac
19001 1289 1289 5468 13001 6586 13201 ndash
19005 1052 1052 5521 13005 7048 13207 7800
19049 1232 1292 5509 13051 ndash 13251 7800
19003 1098 1098 2671 13003 7522 13205 ndash
19051 522 522 5692 13053 ndash 13253 ndash
19053 700 700 2671 13055 6745 13255 ndash
19055 1367 1406 5966 13057 ndash 13257 ndash
19007 608 608 5532 13007 ndash 13209 5834
19009 1821 1821 5485 13009 ndash 13211 7800
19011 1384 1440 5965 13011 3545 13213 7800
19013 1330 1392 5963 13013 ndash 13215 ndash
19015 1597 1620 5815 13015 7800 13217 5853
19017 1571 1609 5967 13017 7539 13219 7800
19019 956 982 5982 13019 7044 13221 7800
19021 1645 1725 5364 13021 6709 13223 ndash
19023 1616 1830 5875 13023 6921 13225 7800
19025 1605 1825 5388 13025 5840 13227 ndash
19027 1838 2116 5448 13027 6279 13229 6622
19029 1593 1593 2671 13029 6983 13231 6561
19031 1355 1407 5898 13031 6179 13233 7800
19033 1652 1889 5845 13033 7800 13235 6318
19035 1790 1928 2671 13035 ndash 13237 ndash
19037 1323 1336 5925 13037 ndash 13239 ndash
19039 436 436 5467 13039 ndash 13241 5845
19041 1636 1713 5644 13043 6090 13243 ndash
19043 1474 1474 5683 13045 4767 13245 ndash
19045 1156 1161 5976 13047 7800 13247 ndash
19047 1862 1862 2671 13049 ndash 13249 7800
19057 1296 1332 6044 13059 ndash 13259 7772
19059 1504 1512 5598 13061 7800 13261 7800
19061 1352 1352 5829 13063 ndash 13263 ndash
19063 1602 1641 5757 13065 5840 13265 ndash
19065 1355 1410 5845 13067 ndash 13267 5838
19067 1595 1824 5866 13069 5819 13269 7101
19069 1789 2142 5937 13071 ndash 13271 7239
19071 1292 1292 2671 13073 ndash 13273 7800
19073 1697 1998 5417 13075 ndash 13275 7080
19075 1742 1851 5973 13077 7800 13277 7456
19077 1314 1314 5481 13079 ndash 13279 6483
19079 1641 1672 6036 13081 7223 13281 5289
294 copy 2013 Society of Chemical Industry and John Wiley amp Sons Ltd | Biofuels Bioprod Bioref 7282ndash302 (2013) DOI 101002bbb
Modeling and Analysis Biochemical biorefinery sizing and environmental sustainability impacts AM Argo et al
Table 7 (Continued)
FIPS (IA) Case 1 Supplement Fertilizer
Case 2 Supplement Fertilizer
Corn Fertilizer
FIPS (GA) Case 3 SWG Fertilizer
FIPS (GA) Case 3 SWG Fertilizer
kgac kgac kgac kgac kgac
19081 1707 1904 6040 13083 ndash 13283 6959
19083 1603 1645 6081 13085 ndash 13285 ndash
19085 1363 1363 2671 13087 ndash 13287 6841
19087 1264 1264 5711 13089 ndash 13289 6691
19089 1375 1446 5828 13091 7367 13291 4111
19091 1804 2169 5880 13093 5814 13293 ndash
19093 1849 2033 2671 13095 ndash 13295 7800
19095 1287 1287 5943 13097 ndash 13297 5853
19097 1074 1074 6033 13099 ndash 13299 6652
19099 1724 1839 5901 13101 ndash 13301 6875
19101 1202 1202 5663 13103 7800 13303 6871
19103 1159 1159 5931 13105 7150 13305 5827
19105 1118 1135 5955 13107 5819 13307 7800
19107 1314 1314 5854 13109 7800 13309 ndash
19109 1618 1627 6018 13111 ndash 13311 6007
19111 1014 1014 5794 13113 ndash 13313 ndash
19113 1000 1008 5949 13115 ndash 13315 7610
19115 1239 1289 5961 13117 5289 13317 7800
19117 526 526 5408 13119 7800 13319 7800
19119 1690 1751 2671 13121 ndash 13321 7656
19121 1089 1089 5466 13123 ndash
19123 1295 1316 5713 13125 5835
19125 1251 1251 5476 13127 ndash
19127 1840 2052 5988 13129 7800
19129 1474 1474 2671 13131 ndash
19131 1775 2109 5944 13133 7800
19133 1364 1375 2671 13135 ndash
19135 751 751 5297 13137 5845
19137 1339 1339 2671 13139 5929
19139 1280 1369 5996 13141 ndash
19141 1697 1708 2671 13143 ndash
19143 1688 1705 2671 13145 ndash
19145 1178 1178 2671 13147 7800
19147 1570 1599 5642 13149 7800
19149 1535 1561 2671 13151 7800
19151 1683 1737 5619 13153 7424
19153 1308 1405 5641 13155 7480
19155 1616 1616 2671 13157 5853
19157 1548 1577 5930 13159 ndash
19159 540 540 2671 13161 6724
19161 1784 2078 5364 13163 7196
copy 2013 Society of Chemical Industry and John Wiley amp Sons Ltd | Biofuels Bioprod Bioref 7282ndash302 (2013) DOI 101002bbb 295
AM Argo et al Modeling and Analysis Biochemical biorefinery sizing and environmental sustainability impacts
Table 7 (Continued)
FIPS (IA) Case 1 Supplement Case 2 Supplement Corn FIPS (GA) Case 3 SWG FIPS (GA) Case 3 SWG Fertilizer Fertilizer Fertilizer Fertilizer Fertilizer
kgac kgac kgac kgac kgac
19163 1494 1596 6000 13165 7800
19165 1660 1660 2671 13167 6271
19167 1766 1899 2671 13169 ndash
19169 1561 1566 5996 13171 ndash
19171 1512 1514 5978 13173 6469
19173 629 629 2671 13175 7213
19175 737 737 5467 13177 7800
19177 646 646 5418 13179 ndash
19179 1099 1099 5455 13181 ndash
19181 1290 1290 5467 13183 5844
19183 1665 1708 5824 13185 5868
19185 552 552 2671 13187 4895
19187 1664 1668 5703 13189 ndash
19189 1599 1599 5909 13191 ndash
19191 1249 1253 5793 13193 7800
19193 2013 2013 2671 13195 5853
19195 1778 2102 5841 13197 7800
19197 1803 2136 6081 13199 7800
Figure 6 Blue water footprint of cellulosic ethanol produced from corn stover (Cases 1 and 2) and switchgrass (Case 3) by production stage at refinery scale of 2000 DMTday in 2017
850 and 820 gallons water per gallon ethanol respecshytively The average grey water in Case 3 which accounts for assimilating the total fertilizer applied during the entire growth period is only 210 gallons water per galshylon ethanol Results clearly indicate the unique ability of switchgrass to capture nutrient runoff in addition to lower fertilizer input requirements thereby reducing grey
Figure 7 Green and grey water footprint of cellulosic ethashynol produced from corn stover (Cases 1 and 2) and switch-grass (Case 3) by production stage at refinery scale of 2000 DMTday in 2017
water loadings Historically switchgrass has been used in conservation programs to contain the fertilizer loss to water body from crop land
At the same refinery capacity choice of feedstock and location could have significant impacts on types of water footprint of the cellulosic biofuel Since a majority of
296 copy 2013 Society of Chemical Industry and John Wiley amp Sons Ltd | Biofuels Bioprod Bioref 7282ndash302 (2013) DOI 101002bbb
Modeling and Analysis Biochemical biorefinery sizing and environmental sustainability impacts AM Argo et al
Figure 8 County-level distributions of blue green and grey water footprint for a 2000 DMTd biorefinery in 2017 to produced biofuel from (a) corn stover grown in Iowa via advanced logistic system (Case 2) and (b) switchgrass grown in Georgia via advanced logistic system (Case 3)
water requirements in the biofuel life cycle are from the feedstock growing stage the water footprint of a particushylar biofuel is largely determined by regional climate For example with the same advanced logistic system cellushylosic ethanol produced from switchgrass in biorefi neries located in Georgia (Case 3) requires 39 less blue water footprint than that for Iowa stover in Case 2 (Fig 6) Since the total water requirement for crop growth would be satshyisfied either from rainfall (green water) or irrigation (blue water) lower green water footprint often means increased blue water footprint for the same plant species (Fig 8)
Switchgrass is a high yield perennial which requires substantial evapotransporation to support its growth Switchgrass can be cultivated in many regions in the USA without irrigation and thus producing rain-fed switch-grass could have less impact on regional blue water use than other crops requiring irrigation
Biorefinery water supply is entirely blue water and biorefinery water demand is concentrated in a single local area Thus a biorefinery built in an area where the local feedstock is blue-water-intensive would likely lead to an increased burden on the local water resources as compare to a biorefinery built in an area with less blue-watershyintensive feedstocks Therefore it is environmentally benshyeficial to develop switchgrass or other perennial feedstock
plantations in regions with sufficient green water supply to ensure sustainable water use for the feedstock and the biorefi nery
From a whole biorefinery production perspective the resource needs for blue water becomes more pronounced as biorefinery scale increases Further CBS logistics systems dictate that the biorefinery be located near the biomass feedstock production whereas AUD logistics effectively decouple biorefinery location from feedstock production Therefore we expect that CBS logistics would stress a local water resource to a greater extent than AUD logistics Figure 8 further shows the extensive geographishycal variability of blue andf green water footprint even within a state which would affect the choice of feedstock thereby influence the refinery siting consideration
Sustainability metrics and life cycle assessment
SimaPro v73 life cycle assessment modeling soft ware was used to develop and link unit processes using estabshylished methods36 In the absence of primary publicly available data we used the Ecoinvent v20 and to a lesser extent the US Life Cycle Inventory (US LCI) processes We modified the Ecoinvent processes to be refl ective of
copy 2013 Society of Chemical Industry and John Wiley amp Sons Ltd | Biofuels Bioprod Bioref 7282ndash302 (2013) DOI 101002bbb 297
AM Argo et al Modeling and Analysis Biochemical biorefinery sizing and environmental sustainability impacts
Figure 9 GHG emi ssions LCA results for Case 1 Iowa corn stover CBS Case 2 Iowa corn stover AUD and Case 3 Georgia switchgrass AUD
US conditions and the US LCI processes to account for embodied emissions and energy fl ows
Modeling approach and assumptions
The modeling boundary for this study is from fi eld to refinery gate including embodied energy and material flows using the methods described elsewhere36 Th e funcshytional unit is 1 gallon of ethanol produced in the year 2017 Avoided impacts are accounted for using product displacement (also termed boundary system expansion)15
For products that share inputs (eg corn grain and corn stover) burdens are allocated between products based on a lsquoproduct-purposersquo approach Inputs to multi-year cropping systems (ie switchgrass) are likewise annualized by the length of the cropping rotation Impacts from direct and indirect land use change are not considered in this study Feedstock processing and transport are modeled accordshying to INLrsquos CBS and AUD
LCA modeling results
A breakdown of the GHG emission (in terms of CO2 equivalent) for each of the cases is displayed graphically in Fig 9 When comparing AUD to CBS moderate increases in GHG emissions observed in the Iowa corn stover
biochemical conversion-to-ethanol are associated with additional field-to-depot and depot-to-terminal transporshytation steps (lsquoPre-processing otherrsquo category in Fig 9) and increased transportation contribution to the biorefi nery (lsquoFeedstock transportationrsquo category) The small increases in normalized (per gallon of ethanol) electricity credit with increasing biorefinery scale are associated with increased electricity generation efficiency As expected we observe small feedstock differences in GHG emissions for Iowa corn stover and Georgia switchgrass
Conclusions
As expected we demonstrated that CBS has lower average logistics costs than AUD AUD logistic costs are higher than CBS costs primarly due to increased pre-processing costs and increased transportation costs (with multiple transportation step) Likewise and similar to earlier studshyies3 we also show that with CBS logistic costs increase as either biorefinery capacity or feedstock collection radius increase AUD mitigates many of the CBS feedstock-supshyply risks and while resulting in modestly higher logistics costs dramatically reduces both the temporal and spatial biomass-cost variability and allows access to substantially larger quantities of biomass
298 copy 2013 Society of Chemical Industry and John Wiley amp Sons Ltd | Biofuels Bioprod Bioref 7282ndash302 (2013) DOI 101002bbb
Modeling and Analysis Biochemical biorefinery sizing and environmental sustainability impacts AM Argo et al
1 AUD effectively disconnects the feedstock from the biorefinery in terms of both scale and location Single or multiple terminals can supply single or multiple biorefineries of varying scale Biorefi nery locations can be optimized for logistics distribution water resources or other project-specifi c constraints
2 AUD promotes more sustainable cropping practices whereas with CBS there is always pressure to produce the same crop
3 AUD providers have much tighter control on biomass production specifications than is possible with CBS
Iowa corn stover supply costs with CBS increase as biorefinery capacity increases from 500 to 2000 DMTday however the biorefinery economy-of-scale impact is larger in magnitude and the overall MESP decreases from $345 gal to $248gal going from 500 to 2000 DMTday bioreshyfinery scale It must be noted that CBS was not considered for biorefinery capacities of 5000 DMT or greater as the existing models do not capture the substantial additional infrastructure required to manage the high throughput of trucks through the biorefi nery
Iowa corn stover supply costs with the AUD are conshystant for biorefineries ranging from 500 to gt10 000 DMT day and as a result the MESP is reduced from $372gal to $225gal Similar to Iowa corn stover Georgia switch-grass feedstock supply costs are constant using the AUD for biorefineries ranging from 500 to 5000 DMTday however for biorefineries larger than ~5000 DMTday the terminal-to-biorefinery distance needs to be increased from 100 miles to 300 miles to supply the larger capacishyties As a result the MESP for Georgia decreases from $337gal to approximately $204gal as the biorefi nery capacity is increased from 500 DMTday to 10 000 DMT day Only small if any cost reductions are expected for capacities greater than 10 000 DMTday Results of this study show that biochemical ethanol production using a CBS results in the lowest MESP at small biorefi nery scales At larger biorefineries (gt5000 DMTday) these analyses suggest that AUD logistics result in producshytion costs lower than those possible with conventional systems
Our results show no detrimental effects on water sustainability metrics when comparing AUD to CBS Nevertheless feedstock location and feedstock type do affect water use and quality so if biorefineries use diff ershyent feedstocks or pull feedstocks from diff erent locations than those modeled here the results will change Th is study also did not consider the local impact on water resources when siting a large biorefinery We expect that
large biorefineries such as those enabled by the AUD will require a water footprint commensurate to their scale and hence may stress the water resources of a specifi c area where the biorefinery is located
Our results show that AUD logistics result in modestly higher GHG emissions (10ndash15) than CBS mainly due to additional field-to-depot and depot-to-terminal transporshytation (lsquoPre-processing otherrsquo category in Fig 9) steps and increased transportation contribution to the biorefi nery (lsquoFeedstock transportationrsquo category)
One potential issue not addressed in this work is that biomass resulting from AUD pre-processing are subshystantially changed physically and potentially chemically compared to materials collected using CBS (eg lignin is plasticized) This may aff ect biorefinery yield operability and production costs and thus future work will need to experimentally verify and quantify biochemical convershysion of these materials and adapt the modelsanalyses accordingly
Acknowledgement
We thank the US Department of Energy for funding and supporting this work
References 1 US DOE US Billion-Ton Update Biomass Supply for
a Bioenergy and Bioproducts Industry USDOE report no ORNLTM-2011224 lead by Perlack RD and Stokes BJ United States Department of Energy and Oak Ridge National Laboratory Oak Ridge TN pp 227 (2011)
2 Riley C and Schell D Technical and Economic Analysis of an Enzymatic Hydrolysis Based Ethanol Plant internal report Solar Energy Research Institute Golden CO (1991)
3 Aden A Ruth M Ibsen K Jechura J Neeves K Sheehan J et al Lignocellulosic Biomass to Ethanol Process Design and Economics Utilizing Co-Current Dilute Acid Prehydrolysis and Enzymatic Hydrolysis for Corn Stover report no NREL TP-510-32438 National Renewable Energy Laboratory Golden CO pp 154 (2002)
4 Humbird D Davis R Tao L Kinchin C Hsu D Aden A et al Process Design and Economics for the Conversion of Lignocellulosic Biomass to Ethanol Dilute-Acid Pretreatment and Enzymatic Hydrolysis of Corn Stover report no NREL TP-510-47764 National Renewable Energy Laboratory Golden CO pp 147 (2011)
5 Searcy E Wright C Muth D Hess JR and Jacobson J The Limits of a 50 Mile Collection Radius for Biomass Supply to a Biorefi nery draft report Idaho National Laboratory Idaho Falls ID (2010)
6 Hess JR Wright CT Kenney KL and Searcy EM Uniform-Format Solid Feedstock Supply System A Commodity-Scale Design to Produce and Infrastructure-Compaible Bulk Solid from Lignocellulosic Biomass ndash Executive Summary report no INLEXT-09-15423 Idaho National Laboratory Idaho Falls ID (2009)
copy 2013 Society of Chemical Industry and John Wiley amp Sons Ltd | Biofuels Bioprod Bioref 7282ndash302 (2013) DOI 101002bbb 299
AM Argo et al Modeling and Analysis Biochemical biorefinery sizing and environmental sustainability impacts
7 Jacobson JJ and Searcy EM Uniform-Format Feedstock Supply System Design for Woody Biomass Presented at the Spring Conference of the AICHe Orlando FL April (2010)
8 Langholtz M Graham RC Eaton L Perlack R Hellwinckel C and De la Torre Ugarte D Price projections of feedstocks for biofuels and biopower in the US Energy Policy41484ndash493 (2012)
9 USDA NASS Agricultural Prices Paid US [Online] Department of Agriculture National Agricultural Statistics Service Available at httpusdamannlibcornelledu MannUsdaviewDocumentInfododocumentID =1002 [September 19 2012]
10 USDA-OCEWAOB Agricultural Projects to 2018 Long-term Projections Report OCE-2010-1 US Department of Agriculture and Office of the Chief Economist World Agricultural Outlook Board Washington DC (2009)
11 US Congress Energy Independence and Security Act of 2007 110th Congress 1st Session HR 6 4 (2007)
12 US EIA Annual Energy Outlook 2010 Report No DOEEIAshy0383 US Energy Information Administration Washington DC (2010)
13 Wu M Chiu YW and Demissie Y Quantifying the regional water footprint of biofuel production by incorporatshying hydrologic modeling Water Resrouce Research DOI1010292011WR011809 (2012)
14 NOAA NCDC 1971-2000 US Climate Normals Products Clim 84 Daily Normals [Online] NOAA National Climate Data Center Available at httpwwwncdcnoaagov [September 19 2012]
15 Wang M Huo H and Arora S Methods of dealing with coshyproducts of biofuels in life-cycle analysis and consequent results within the US context Energy Policy 395726ndash5736 (2011)
16 USDA 2002 Census of Agriculture US Department of Agriculture Washington DC (2004)
17 USDA 2007 Census of Agriculture US Department of Agriculture Washington DC (2010)
18 USDA 2008 Farm and Ranch Irrigation Report No AC-02-SS-1 US Department of Agriculture Washington DC (2009)
19 USDA 2003 Farm and Ranch Irrigation Survey Report No AC-02-SS-1 US Department of Agriculture Washington DC (2004)
20 USGS Water Use in the United States 1985 1990 and 1995 [Online] US Geological Survey Available at httpwaterusgs govwatuse [September 19 2012]
21 High Plains Regional Climate Center Crop Coeffi cients for Corn [Online] Available at httpwwwhprccunleduawdn etcropcrop_corntxt [September 19 2012]
22 Marek T Colaizzi P Howell TA Dusek D and Porter D Estimating Seasonal Crop ET Using Calendar and Heat Unit Based Crop Coefficients in the Texas High Plains Evapotranspiration Network Presented at 2006 ASAE Annual Meeting American Society of Agricultural and Biological Engineers Portland OR pp 9ndash12 (2006)
23 Kiniry J Lynd L Greene N Johnson M Casler M and Laser MS Biofuels and water use Comparison of maize and switch-grass and general perspectives new research on biofuels ed by Wright JH and Evans DA Nova Science Publishing New York ( 2008 )
24 Kiniry JR Tischler CR and Van Esbroeck GA Radiation use efficiency and leaf CO2 exchange for diverse C4 grasses Biomass Bioenerg 17(2)95ndash112 (1999)
25 Grassini P Yang H and Cassman KG Limits to maize proshyductivity in western corn-belt A simulation analysis for fully irrigated and rainfed conditions Agr Forest Meteor 1491254ndash 1265 (2009 )
26 Hoos AB and McMahon G Spatial analysis of instream nitroshygen loads and factors controlling nitrogen delivery to streams in the Southeastern United States using spatially referenced regression on watershed attributes (SPARROW) and regional classifi cation frameworks Hydrol Process 232275ndash2294 (2009)
27 Hoos AB Terziotti S McMahon G Savvas K Tighe KC and Alkons-Wolinsky R Data to Support Statistical Modeling of Instream Nutrient Load Based on Watershed Attributes Southeastern United States 2002 US Geological Survey pp 50 (2008)
28 Demissie Y Yan E and Wu M Assessing regional hydrology and water quality implications of large-scale biofuel feedstock production in the Upper Mississippi river basin Environ Sci Technol 469174ndash9182 (2012)
29 Wu M Demissie Y and Yan E Simulated impact of future bioshyfuel production on water quality and water cycle dynamics in the Upper Mississippi river basin Biomass Bioenerg 4144ndash56 (2012)
30 Smith RA Alexander RB and Schwarz GE Natural backshyground concentrations of nutrients in streams and rivers of the conterminous United States Environ Sci Technol 373039ndash 3047 (2003)
31 Chiu YW and Wu M Assessing county-level water footprints of different cellulosic-biofuel feedstock pathways Environ Sci Technol 469155ndash9162 (2012)
32 White PJ CORN Chemistry and Technology 2nd edn ed byWhite PJ and Johnson LA American Association of Cereal Chemists Inc St Paul MN (2003)
33 Wu M and Peng MJ Developing a tool to estimate water withshydrawal and consumption in electricity generation in the United States Report No ANLESD11-2 update Argonne National Laboratory (2011)
34 ANL TTRDC GREET Model [Online] Argonne National Laboratory Transportation Technology RampD Center Chicago IL Available at httpgreetesanlgovindex phpcontent= power_water [August 21 2012]
35 Wu M Mintz M Wang M and Arora S Water consumption in the production of ethanol and petroleum gasoline Environ Manage 44981ndash997 (2009)
36 Hsu DD Inman D Heath GA Wolfrum EJ Mann MK and Aden A Life cycle environmental impacts of selected US ethanol production and use pathways in 2022 Environ Sci Technol 445289ndash5297 (2010)
300 copy 2013 Society of Chemical Industry and John Wiley amp Sons Ltd | Biofuels Bioprod Bioref 7282ndash302 (2013) DOI 101002bbb
Modeling and Analysis Biochemical biorefinery sizing and environmental sustainability impacts AM Argo et al
Andrew Argo
Dr Andrew Argo is senior engineer in the system integration group at the National Renewable Energy Laboratoshyry His work supports the Department of Energy Biomass Program in the areas of strategic systemlevel analysis and integrated biorefinery projects monitoring
Eric C D Tan
Dr Tan is a Senior Research Engineer in the Biorefinery Analysis Group of the National Bioenergy Center at the National Renewable National Laborashytory (NREL) His research interests include the process design economshyics and sustainability for conversion of lignocellulosic biomass to biofuels
with particular emphasis on the application of techno-economic analysis and life cycle assessment methods He also has broad experience in chemically reacting flow simulation and heterogeneous catalysis
Daniel Inman
Dr Daniel Inman is a research scienshytist at the National Renewable Energy Laboratory in Golden Colorado His primary research interests are centered on the sustainability biofuel producshytion and use He is currently involved in several modeling projects including lifecycle assessment of multiple biofushy
els and using system dynamics to examine the growth of the cellulosic biofuels industry
Matthew H Langholtz
Dr Matthew Langholtz is a Natural Resource Economist in the Bioenergy Group at Oak Ridge National Laborashytory He is principle investigator (PI) of the Resource Analysis Project of the Bioenergy Group at Oak Ridge Nationshyal Lab as well as the Short-Rotation Woody Crop Sustainability project His
research interests include biomass resource economics short-rotation woody crops and bioenergy from forest resources He has worked on valuation of non-market externalities and developed biomass supply curves for commercial projects the South and the United States
Laurence M Eaton
Laurence Eaton is a Research Scientist at the Oak Ridge National Laborashytory in the Bioenergy Resource and Engineering Systems Group of the Environmental Sciences Division An economist by training he conducts research to support bioenergy foreshycasting and analysis using economic
land use models and Geographic Information Science He participates in interdisciplinary Resource Assessment activities to support the efficient and sustainable supply of agricultural and forestry resources for commercial domestic bioenergy and bioproducts markets He has worked in the area of applied microeconomics as it reshylates to bioenergy firm input decisions and the valuation of environmental goods and ecological services
Jacob J Jacobson
Mr Jacobson is a researcher from the Idaho National Laboratory He has a diverse background in systems analysis system dynamics statistical consulting software development and project management His work has been in the development and analysis of decision support systems to evalushy
ate policy options and business risks of complex energy and environmental systems His recent work has been in the area of analysis of biomass feedstock logistics
Christopher T Wright
Dr Chris Wright is manager and a senior research engineer for the Idaho National Laboratoryrsquos Biofuels and Reshynewable Energy Department His work supports the Department of Energy Biomass Program in developing analyshysis tools and technology for feedstock supply logistics and conversion of bioshy
mass to valuable fuels chemicals materials and power His knowledge of DOErsquos Biomass Program includes an emphasis on lignocellulosic feedstock supply systems which includes feedstock characterization development preprocessing handling and transportation issues assoshyciated with refining biomass into fuels and chemicals
copy 2013 Society of Chemical Industry and John Wiley amp Sons Ltd | Biofuels Bioprod Bioref 7282ndash302 (2013) DOI 101002bbb 301
AM Argo et al Modeling and Analysis Biochemical biorefinery sizing and environmental sustainability impacts
David J Muth Jr
Dr Dave Muth is a Research Engishyneer at the Idaho National Laboratory in Biofuels and Renewable Energy Technologies He leads the Analysis and Sustainability Group with the Bioenergy Research Team developshying models and modeling techniques which facilitate the evaluation the
feedstock assembly system as it pertains to creating advanced biofuels He is currently working as a contracshytor to the US Department of Energy Office of Biomass Programs located at DOE Headquarters supporting the establishment of technical objectives and research tarshygets for next generation feedstock supply and logistics systems that deliver high quality biomass feedstocks for advanced hydrocarbon fuel production
May M Wu
Dr May Wu a principal energy systems analyst at Argonne National Laborashytory is the PI of biofuel sustainability research funded by the US Departshyment of Energy Her research interests are in the area of water quality and water quantity associated with large-scale development of biofuel convenshy
tional fuel electricity and emerging fuels and life cycle analysis Dr Wu is leading the effort to develop tools and largescale watershed models to assess spatially explicit water footprint of biofuel produced from conventional cellulosic and advanced feedstock and impact of proshyjected future production on regional nutrient sediment and hydrology Dr Wu served as an expert advisor to the Water Working Group of the Council on Sustainable Biomass Production (CSBP)
Yi-Wen Chiu
Dr Yi-Wen Chiu is a postdoctoral apshypointee in the Energy System Division at the Argonne National Laboratory As an interdisciplinary scientist her main research interests are to understand the coupling and interaction of human and natural systems by applying inteshygrated modeling tools She has been
involved in research related to water footprint and water-energy nexus with broad interests related to scenario analysis and environmental impact assessment She also participates in several studies aiming to advance biofuels by determining the feasible pathways of achieving water sustainability goals
Robin L Graham
Dr Robin L Graham is Deputy Associate Laboratory Director for the Computing Environment and Life Science Directorate at the Argonne National Laboratory Formerly at Oak Ridge National Laboratory she worked in the Bioenergy field for many years pioneering biomass feedstock
resource assessments that incorporated both economic and environmental factors She was an author of the original ldquoBillion Tonrdquo study and contributed to its 2011 follow-up An ecosystem ecologist by training she has long been interested in developing sustainable natural resources and began her career working for the RampD Division of Weyerhaeuser Co She currently is leading Argonnersquos Biological and Environmental Science Initiashytive which aims to accelerate our understanding of the fundamental design principles in biological and environshymental systems
302 copy 2013 Society of Chemical Industry and John Wiley amp Sons Ltd | Biofuels Bioprod Bioref 7282ndash302 (2013) DOI 101002bbb

AM Argo et al Modeling and Analysis Biochemical biorefinery sizing and environmental sustainability impacts
the supply system and reduced risk for the biorefi nery in feedstock quality Furthermore AUD pre-processing reducing the storage footprint and environmental impacts such as the fire hazards rodent infestation and localized odors normally associated with large-scale storshyage of non-aerobically stable feedstock that are typical of using CBS
Finally the AUD provides additional market options for geographically stranded feedstock producers (ie fragshymented feedstock not within a 50-mile biorefi nery radius that can not be collected economically with CBS) letting them sell excess product in a commodity market
Illustrative cases
In order to highlight the advantages of the AUD three illustrative cases where biorefinery capacities ranged from 500 to 10 000 DMTday were examined in this study POLYSYS an agricultural land-use simulation model from the Agricultural Policy Analysis Center at the University of Tennessee was used to forecast the biomass-feedstock supply for all three cases in the 2017 time frame Both CBS and AUD logistics systems were analyzed using INLrsquos Biomass Logistics Model (BLM)7 All three cases used a biochemical-conversion biorefinery that is based on pubshylished designs4 A complete listing of the modeling tools used in this analysis is included in Table 1
bull Case 1 Iowa corn stover feedstock collected using CBS logistics and evaluated for biorefinery capacities rangshying from 500 to 2000 DMTday (Note 2000 DMTday was the maximum size analyzed due to constraints on delivery traffi c congestion)
bull Case 2 Iowa corn stover collected using AUD logistics and evaluated for biorefinery capacities ranging from 500 to 10 000 DMTday
bull Case 3 Georgia herbaceous feedstock mix collected using AUD logistics and evaluated for biorefi nery capacities ranging from 500 to 10 000 DMTday (Note Although POLYSYS modeled a mix of herbaceous feedstocks for simplicity of calculations we assumed 100-switchgrass (SWG) for all downstream-of-feedshystock-production calculations)
For all three cases the biomass supply included in this 8study is documented in detail in Langholtz et al
Feedstock supply
Feedstock supply analyses were performed using the POLYSYS model which operates as a mathematical displacement model and is tied to historical agricultural-production and land-use patterns National production forecasts are disaggregated to the county level using trailshying averages of production data from the US Department of Agriculture (USDA) National Agricultural Statistics Service (NASS)9 The conditions under which bioenergy crops or crop residues are supplied are a function of the maximum net expected returns of traditional and cellushylosic crops after the demands established for current uses in the USDA baseline are met10
Through an iterative process of model executions a biomass farm-gate price of $6063 per DMT (2007$) was determined to supply sufficient biomass to meet the RFS2 cellulosic ethanol targets and projected biopower demand levels81112 In this scenario contracts begin for corn stover collection in 2012 and estimates on tillage behavior tradishytional crop yields and adoption assumptions are consistent with the analysis supporting the Billion-ton Update report1
Farmgate price of a feedstock includes the total cost of production harvest and delivery to the roadside Farmgate
Table 1 Summary of modeling and analysis tools used for this study
Biofuel System Element Modeling Tool Description
Feedstock Production POLYSYS An agricultural land-use simulation model used to forecast biomass-feedstock supply9
Feedstock Logistics (INLrsquos BLM)
Powersim System Dynamics Framework
A systems dynamic model used to design and simulate biomass preprocessing and supply chain (logistics) infrastructure7
Ethanol Conversion Aspen Plus A chemical process modeling system used to design the biomass-to-ethanol convershysion plant4
Life Cycle Analysis SimaPro A life cycle assessment and carbon footprinting model used to analyze environmental performance36
Water Resources SWAT A river basin scale model developed to quantify the impact of land management pracshytices in large complex watersheds2829
Water Resources SPARROW A modeling tool for regional interpretation of water-quality monitoring data2627
284 copy 2013 Society of Chemical Industry and John Wiley amp Sons Ltd | Biofuels Bioprod Bioref 7282ndash302 (2013) DOI 101002bbb
Modeling and Analysis Biochemical biorefinery sizing and environmental sustainability impacts AM Argo et al
Table 2 Summary of overall Iowa (IA) and Georgia (GA) residue and energy crop biomass feedstock supply modeled by POLYSYS
Total ha Planted Total Production Growers Payment Re sidueEnergy Crop Yield (DMTha) Harvested (DMT) (2007$DMT)
IOWA
Corn stover 413 5726650 23620508 $4690
Wheat straw 013 6041 7985 $3736
Total 408 5778203 23628493 $4690
GEORGIA
Corn stover 151 111034 167307 $4496
Wheat straw 096 60318 57700 $3584
Total residues 131 171351 225007 $4262
Switchgrass 1122 135023 1514474 $3366
Total 1122
price also includes profit required to incentivize production of energy crops For dedicated feedstocks to be competishytive farmers must be paid above the expected returns ie the opportunity cost of an alternative crop For residues farmgate price also compensates producers for nutrients and organic matter embodied in the residues which must be replaced in the soil This paper identifies feedstock supshyply available when the offered farmgate price of biomass is $61 per DMT lsquoGrower paymentrsquo is the price required for rights to harvest material from the field Succinctly grower payment is farmgate price minus harvest cost for both dedshyicated feedstocks and residues Average grower payments of participating producers and a summary of the feedstock supply results are reported in Table 2
Switchgrass production budgets are estimated for a 10-year planning horizon with no-till establishment on cropland cropland pasture and permanent pasture For permanent pasture a one-time breaking fee is incurred in the establishment year Crop residues include corn stover and wheat straw Crop residue yields are estimated aft er requirements for soil carbon and wind and water erosion are met Both crop residue and switchgrass supplies are estimated using a cumulative harvest effi ciency of 081 from standing yield to farm-gate yield
Supply projections were limited to the feedstock price level determined in Langholtz et al 8 to meet EISA and projected state biopower mandates Because there is insufshyficient feedstock at a farmgate price of $6063 per DMT in the state of GA to support a biorefinery capacity of 7500 or 10 000 DMTday we assumed that herbaceous feedstock will be available in adjacent states at the same grower payshyment as Georgia and the feedstock will be transported further for Case 3 in these scenarios
135023 1514474 $3366
The current analysis does not explore whether or not feedstocks would be produced on different land types when comparing the AUD with the CBS Nor does it explore the opportunity to increase feedstock prices to procure more supplies within a given area
Logistics
Feedstock logistics analyses were performed utilizing the INL Biomass Logistics Model (BLM)7 The BLM is develshyoped on a system dynamics modeling platform (Powersim) and accounts for all capital and operational elements when evaluating a feedstock supply system design Th e BLM is not used to site depots terminals or biorefi neries in the logistics analysis scenarios in this paper instead it assumes a central location within the biomass supply in the CBS designs and a specified distance from the biomass in the AUD designs The BLM simulates the flow of bioshymass through the entire supply chain tracking changes in feedstock characteristics (ie moisture content dry matter ash content and dry bulk density) as infl uenced by the various operations (ie harvesting transportation storage hellip) in the supply chain
Case 1 analysis
Th e first scenario is based on using a CBS for cornstover in Iowa which is a high yield area The CBS uses currently available commercial equipment and processes (Fig 1) Multi-pass har vest systems first move the fi eld-dried feedshystock into a windrow and then bale the windrow into large square bales (3rsquo times 4rsquo times 8rsquo) Bales are collected and moved
copy 2013 Society of Chemical Industry and John Wiley amp Sons Ltd | Biofuels Bioprod Bioref 7282ndash302 (2013) DOI 101002bbb 285
AM Argo et al Modeling and Analysis Biochemical biorefinery sizing and environmental sustainability impacts
Figure 1 Engineering design schematic of the CBS
to field-side storage stacks where they are protected with tarps When needed at the biorefinery bales are delivered via flatbed semi-trucks to biorefinery short-term storage At the biorefinery the bales are queued as needed through a grinding process that reduces the feedstock to frac14-inch particle size bulk material This bulk material is then fed into the conversion reactor
Constraints
One of the major drawbacks of the CBS design is that it provides limited opportunity to stabilize material or alter material specifications which means that only material containing less than 15 moisture which meets the conversion process moisture specification should be baled This constraint limits the availability of feedstocks and impacts system performance across climate ranges different harvest seasons and diff erent crops
In the case of switchgrass moisture at harvest can be managed primarily by delaying cutting of the crop until the material has dried appropriately However a corn stover harvest presents a very different challenge as stover
F igure 2 Moisture content of bales entering storage was vastly different for each year according to an INL-conducted northwest Iowa storage study (internal INL data not included here)
is a secondary crop to the corn grain The harvest window and subsequently the material properties of the stover at harvest is driven by grain harvest decisions
286 copy 2013 Society of Chemical Industry and John Wiley amp Sons Ltd | Biofuels Bioprod Bioref 7282ndash302 (2013) DOI 101002bbb
Modeling and Analysis Biochemical biorefinery sizing and environmental sustainability impacts AM Argo et al
Climate conditions have a major impact on the fi eld drying of stover Figure 2 shows moisture distribution as measured in an INL storage study of bales that were collected in northwest Iowa in 2009 and 2010 In 2010 approximately 95 of the bales collected met the CBS criteria of 15 moisture or below whereasin 2009 more than 97 of the bales collected were at 25 moisture or above Moving and storing material with high-moisture content significantly impacts stability and logistics costs
Analysis parameters
The logistics assessments for the CBS in this analysis are limited to 2000 DMTday and smaller biorefi neries because the current system design cannot be scaled to larger biorefineries without significant design changes across multiple elements For example an entirely new infrastructure would be required to support and manage movement of 60 or more trucks per hour as required in the large biorefinery capacity scenarios Following is a breakshydown of model parameters used in the Case 1 logistics analyses
bull 10 -year average assessment Using 10 years of harvest progress data coupled with climate data and fi eld dr ying data an analysis was performed to develop a 10-year average assessment of the corn stover availshyable to bale in Iowa at 15 moisture Th e resultant algorithm was tested against Boone County in the center of Iowa and showed that on average approxishymately 36 of the corn stover acres could be baled at 15 moisture or below This percentage was used to set the 10-year average for Iowa that was used in the Case 1 logistics analysis Itrsquos important to note that calculating an impact of climate across years or for larger geographical areas can result in an average that does not necessarily represent individual years in the dataset
bull Harvesting system The analysis accounts for collecshytion limitations stemming from using a multi-pass harvest system to collect corn stover in CBS INL fi eld tests demonstrated that collection rate is capped at 672 DMTha by the practical limits for this type of equipshyment Harvest windows of 19 harvest days are also assumed for the conventional system
bull Field-side storage Collection system models assume field-side storage at a fi xed stack size The distance to the stack input into the collection model is determined by using the county yield and implementing a radial geometric mean formula to establish the transport distance from the field to the local stack Storage
system bale stacks are assumed to be 2000 DMT Th e moisture content of the bales when put into storage is assumed to be 15 Dr y matter losses in storage are modeled at 5
bull Transportation to biorefi nery Transportation disshytance to the biorefinery is solved through a series of spatial operations First the feedstock density for a given county is normalized with the density of all counshyties that have area within a 25-mile radius of the subject countyrsquos centroid This normalization is performed to simulate the potential movement of feedstock across county boundaries for delivery to the biorefi nery Th e density calculation accounting for yield and acres parshyticipating in stover collection provides a DMTmile2
density With the normalized feedstock density calcushylated for the county a radial geometric mean formula is employed to establish an average biorefi nery transport distance for the county
bull Biorefi ner y pre-processing Pre-processing operations in the CBS are exclusively performed within the bioreshyfinery gates A two-stage grinder is used in the model to size-reduce the stover bales to frac14-inch material which is then fed through an even-flow queuing system and fed to the biochemical conversion reactor
Case 1 results
Using INLrsquos BLM the various supply system composhynents ndash harvest collection and transportation ndash were systematically run for the available biomass from each of the counties within Iowa The total supply costs were estimated by summing all of the system components Th e results of the statewide county-by-county analysis are shown in Fig 3
As can be seen in Fig 3 there is a wide range of logisshytics costs (approximately $45ndash$88DMT) using the CBS (Case 1) Cost variations are mainly due to low-yield areas which in turn have a high impact on the overall logistics costs
Case 2 and Case 3 AUD analyses
The AUD system utilizes equipment and processes that are in some cases commercially available now and in others at bench and pilot scales and will likely be comshymercially available in 2017 In the latter case production-sized equipment is scaled from current bench and pilot scale data
In an AUD process (Fig 4) a single-pass har vesting system collects the grain and corn stover at the same time and the corn stover is fed directly to a baler Th e corn
copy 2013 Society of Chemical Industry and John Wiley amp Sons Ltd | Biofuels Bioprod Bioref 7282ndash302 (2013) DOI 101002bbb 287
AM Argo et al Modeling and Analysis Biochemical biorefinery sizing and environmental sustainability impacts
Figure 3 Breakdown of total Case 1 and 2 logistics costs for each county in Iowa based on removable stover limits and total Case 3 logistics costs for each county in Georgia based on removable switchgrass limits
Figure 4 The AUD supply system uses distributed pre-processing depots to stabilize and densify feedstock providshying a lignocellulosic commodity material compatible with the infrastructure
288 copy 2013 Society of Chemical Industry and John Wiley amp Sons Ltd | Biofuels Bioprod Bioref 7282ndash302 (2013) DOI 101002bbb
Modeling and Analysis Biochemical biorefinery sizing and environmental sustainability impacts AM Argo et al
stover bales are collected and moved to fi eld-side stacks where they are protected with plastic wrap and stored Plastic wrap was chosen to protect the bales because of the concern that the high moisture content would lead to unacceptable dry matter losses if the bales were proshytected with tarps similar to that in Case 1 When needed stacks are delivered via flatbed semi-trucks to the depot for short-term storage and processing Again as needed the bales are sent through a drying grinding and denshysification process that dries the material to lt10 moisshyture reduces the feedstock to frac14-inch particle size bulk material and then densifies the material to a pellet with density gt30 lbft3 Th e densified material is then shipped to the terminal for blending and later transported to the biorefi nery
Analysis parameters
The key feature of AUD is the pre-processing of biomass at an early stage in the supply system (Fig 4) Pre-processing depots produce a final uniform material that is compatible with the grain storage and handling infrastructure
bull Field-side storage Collection system models assume field-side storage at a fixed stack size The distance to the stack input into the collection model is determined by using the county yield and implementing a radial geometric mean formula to establish the transport disshytance from the field to the local stack
bull Bale moisture content Storage system bale stacks are assumed to be 2000 DMT Moisture content of the bales when put into storage is assumed to be gt20 due to baling of the material directly from the combine without field drying Due to the high moisture content the bales are wrapped in plastic to reduce the dry matshyter losses Dry matter losses in storage are modeled at 78
bull Trucking feedstock from field-side to depot Depot size is based on the throughput capacity of the grinder which is the most capital-intensive piece of equipment at the depot The transportation distance is solved through a series of spatial operations much like the fi eld-side-to-biorefinery delivery in a CBS
bull Tr uck ing from depot to blend ing ter mina l This distance is again solved through a series of spatia l operations based on a terminal size of 3 600 000 DMTyear
bull Shipping by rail from blending terminal to biorefi nshyery This operation is based on a predetermined disshytance of 100 miles since by rail the majority of costs are fixed and the variable cost per mile is minimal
In Case 3 the logistics design in Georgia assumes that the feedstock is 100 switchgrass For the 7500 and 10 000 DMTday biorefi nery-capacity scenarios the terminal-toshybiorefinery distance was increased to 300 miles to accomshymodate the need for feedstock outside of Georgia
The AUD feedstock design incorporates a blending facilshyity (terminal) where different feedstocks can be blended to meet a conversion facilityrsquos feedstock design requirements
AUDrsquos impact is that the average supply system cost is higher but the spatial and temporal variability are much lower Where a CBS has low control over delivered bioshymass feedstock specifications AUD has high control Also AUD is able to access material from low-yield counties that would typically be stranded and not able to enter the supply system at aff ordable costs
Case 2 results
Case 2 uses the AUD for corn stover collection in Iowa The results of the county-by-county analysis of feedstock logistics costs are shown in Fig 3 Th e figure shows that while on average the total logistic cost is higher the range of variability ($66ndash$85 per DMT) is lower than that for the CBS ($45ndash$88 per DMT)
Case 3 results
Case 3 uses the AUD for switchgrass in Georgia Th e results of the county-by-county analysis of feedstock logisshytics costs are shown in Fig 3 Th e figure shows that while on the average the total logistics cost is higher the range of variability of the total cost is relatively low ($64ndash$117 per DMT) and much less for the AUD that for the CBS (intershynal INL data not included here)
Overall logistics results
The overall conclusions regarding the effects of feedstock logistics design on total cost are the following
bull The CBS demonstrates high spatial variability in costs even in highly productive regions such as Iowa Th e local ranges in feedstock cost were from $45 to $88 per DMT Additionally the CBS has very limited control on the feedstock specifications delivered to the biorefi nery
The AUD has higher average supply system costs but it does demonstrate reduced spatial and temporal varishyability The average costs were much more stable ranging from $66 to $85 per DMT for Iowa corn stover Th e AUD also allows material from areas with low yields to enter into the system whereas under the conventional supply
copy 2013 Society of Chemical Industry and John Wiley amp Sons Ltd | Biofuels Bioprod Bioref 7282ndash302 (2013) DOI 101002bbb 289
AM Argo et al Modeling and Analysis Biochemical biorefinery sizing and environmental sustainability impacts
Table 3 Breakdown of feedstock logistics costs by unit operations for CBS and AUD system designs in Boone County IA (a b) and AUD system design in Telfair County GA (c)
a) Conventional bale system costs in Boone County IA for 2000 DMTday biorefi nery
Harvest amp Storage Transportation Preprocessing Handling amp Total Collection (~45 km) Queuing Logistics
$1561 $595 $886 $1494 $083 $4620
b) Advanced uniform system costs in Boone County IA
Harvest amp Storage Depot Transport Depot Terminal Transport Terminal Biorefi nery Handling Total Collection (~17 km) Preprocessing (~80 km) Transport (~170 km) amp Queuing Logistics
$1615 $660 $601 $2479 $314 $154 $895 $083 $6801
c) Advanced uniform system costs in Telfair County GA
Harvest amp Storage Depot Transport Depot Terminal Transport Terminal Biorefi nery Handling Total Collection (~17 km) Preprocessing (~80 km) Transport (~170 km) amp Queuing Logistics
$1637 $554 $623 $2329 $496 $154 $895 $083 $6771
Table 4 Summary of feedstock and average logistics costs (weight averaged) used in biorefinery sizing and sustainability study
Distance to Biorefi nery Size Grower Payment Logistics Total Feedstock Case Location Feed Logistics Biorefi nery (mi) (DMTd) ($DMT) ($DMT) Cost ($DMT)
1 IA Corn stover CBS 15 500 $4689 $4481 $9170
21 1000 $4689 $4540 $9229
30 2000 $4689 $4620 $9309
2 IA Corn stover AUD 100 500 to 10000 $4690 $6801 $11491
3 GA SWG AUD 100 500 to 5000 $3393 $6771 $10164
300 7500 to 10000 $3393 $7377 $10770
system these resources would be stranded and inaccesshysible An example of the breakdown of total logistics cost for all cases are included in Table 3 AUD pre-processing costs are higher than those for CBS costs mainly because of higher pre-processing costs (drying pellitization) and additional transportation steps
Feedstock supply and logistics summary
A summary of the feedstock supply costs (grower payment + average logistic costs) for the work included in this study is displayed in Table 4 Using CBS logistics for Iowa corn stover (Case 1) the feedstock supply cost increases with increasing biorefinery size as a greater collection radius is required In contrast using AUD logistics for Iowa corn stover (Case 2) biorefinery capacities in excess of 10 000 DMTday are possible with a terminal located 100 miles from the biorefinery thus the feedstock supply cost is constant for Case 2 Similarly the feedstock supply cost
is constant for biorefinery capacities ranging from 500 to 5000 DMTday for Georgia switchgrass (Case 3) However at biorefinery capacities of 7500 and 10 000 DMTday for Georgia switchgrass a larger cropping area and thus a larger terminal-to-biorefinery distance (300 miles) is required
Conversion to ethanol
Conversion methods
Techno-economic analyses for the biochemical process of making ethanol from corn stover or switchgrass were pershyformed by scaling the biochemical process design model for corn stover that was developed at NREL4
For this study we assumed that the feedstock convertshyibility is the same for similar feedstock types (ie corn stover and switchgrass) as well as between the feedstock formats (ie CBS and AUD) All conversion data are based on those reported for corn stover (using CBS)4 using the feedstock composition data displayed in Table 5
290 copy 2013 Society of Chemical Industry and John Wiley amp Sons Ltd | Biofuels Bioprod Bioref 7282ndash302 (2013) DOI 101002bbb
Xylan 1953 2250
Moisture 12 15
Modeling and Analysis Biochemical biorefinery sizing and environmental sustainability impacts AM Argo et al
Table 5 Corn stover and switchgrass compositions used for this study
IA Corn Stover GA SwitchgrassComponent (dry wt ) (dry wt )
Glucan 3505 3500
Lignin 1576 2260
Ash 493 330
Acetate 181 180
Protein 310 120
Extractives 1465 970
Arabinan 238 310
Galactan 143 050
Mannan 060 030
Sucrose 077 000
Total structural carbohydrates 5899 6140
IA Corn Stover (bulk GA Switchgrass wt) (bulk wt)
The minimum ethanol selling prices (MESP) to give a 10 after-tax internal rate of return were calculated using a standard discounted cash flow rate of return analysis and the financial assumptions included in an earlier NREL report4
Results
Figure 5 shows the breakdown of the MESP (biorefi nery only) as a function of biorefinery plant size for each case
In all cases MESP decreases as biorefi nery size increased AUD logistics and processing costs are essenshytially constant for Iowa corn stover thus rising feedstock costs do not limit the economies-of-scale for biorefi neries in excess of 10 000 DMTday In the case of lower-yielding feedstock (county-yield) such as Georgia switchgrass increases in feedstock costs start to balance biorefi nery economies-of-scale at biorefinery capacities in excess of gt5000 DMTday
Due to the higher logistics costs the MESP for AUD corn stover (Case 2) is approximately $025gal higher than that for CBS (Case 1) at small biorefinery capacities (lt2000 DMT day) However this study suggests that increasing the bioreshyfinery size to 5000 DMTday will more than offset the MESP increase associated with more expensive AUD pre-processed feedstock Biorefinery capacities in excess of 10 000 DMT day are only possible with AUD and the resulting MESPs are substantially lower than that with CBS
As the biorefinery size increases from 500 to 10 000 DMTday with AUD logistics the MESP decreases from $372 to $225 per gallon for IA-corn stover and $337 to $204 per gallon for GA-switchgrass The lower MESP for switchgrass compared to that for corn stover is attributed to lower feedstock cost higher ethanol yield and higher byproduct electricity credit
Water
In this section the water resource use and the impact on water quality are analyzed Water resource analysis
Figure 5 M inimum ethanol selling price (MESP) as a function of plant size
copy 2013 Society of Chemical Industry and John Wiley amp Sons Ltd | Biofuels Bioprod Bioref 7282ndash302 (2013) DOI 101002bbb 291
AM Argo et al Modeling and Analysis Biochemical biorefinery sizing and environmental sustainability impacts
focuses on the consumptive use of rainfall (green water) and of surface and ground water (blue water) through irrigation and process water use Water quality analysis focuses on discharged water from fields containing fertishylizer and process water discharge (grey water) Th e water footprint for the three types of water is considered for the feedstock growing stage and conversion stage for the procshyess described earlier Detailed methodologies of the water footprint assessment for the green blue and grey water are described elsewhere13 30
Data sources and assumptions
We used public data sources for this work including govshyernment reports and open literature In the case that data were not available we relied on a combination of model simulation and statistical regression We assumed that soil moisture level is sufficient to meet the lowest water demand for switchgrass so that irrigation is not required in the state of Georgia
Climate irrigation crop and nutrient loading data
Water footprint calculation relies heavily on climate agricultural and hydrological data All of the climate data used in this study were derived from the National Climate Data Center of NOAA for the period from 1970 to 200014 Agricultural data for crop harvested acreshyage were from USDA NASS15 Irrigation application data were acquired from the 2002 and 2007 Census of Agriculture16 17 and the Farm and Ranch Irrigation Survey18 19 published by the USDA and USGS20 Th e crop coeffi cient Kc used in estimating evapotranspiration (ET the loss of water from the soil by evaporation and by transpiration from the crops) was compiled from the High Plains Regional Climate Center21 the Texas High Plains Evapotranspiration network22 and the previous studies of Kiniry et al2324 Climate in 2017 was assumed to remain the same as the historical average from 1970 to 2000 However the irrigation demand was further adjusted from historical values to reflect the increase of corn acreage and yield25 (Table 6) Nitrogen loading (data not included here) a key component of interest in grey water in IA and GA was estimated using results from SPARROW model26 27 Nitrogen fertilizer input rates for switchgrass were estimated by POLYSYS Regular corn field fertilizer input were simulated by a SWAT hydrologic model based on USDA state-level data28 29 while s upshyplemental fertilizer inputs were provided by POLYSYS A natural background nitrogen concentration CN was
compiled from USGS30 Nutrient loading for SWG was estimated from alfalfa27 Based on the historical monitorshying data sets for total nitrogen and nitrate (USGS30) CN is assumed to be 95 of the total nitrogen concentration in stream water Nitrogen fertilizer input data are included in Table 7 A comparison of the SWAT and SPARROW model in the studied areas showed good agreement for average values while SPARROW projected less veriabilishyties31 All of the watershed-scale calculations in this study were further converted into county-level data using the zonal statistics tool in ArcGIS
Water allocation
Corn plants produce grain and stover both of which can be used as biofuel feedstock During its growth corn grain and stover each appropriate a fraction of the total water requirement The same fraction was assumed in partionshying the water footprint associated with stover based biofuel production The blue water and green water of corn is partitioned between grain and stover by applying a crop harvest index32
Conversion process water use
Consumptive water use at the biorefinery is estimated from the process model described earlier Depending on the production scale and feedstock the normalized procshyess water use ranges from 53 to 56 LL ethanol produced The conversion process water is supplied from surface and ground water sources and therefore its use contributes only to the blue water footprint
In the conversion process more bio-electricity is proshyduced than that needed for the biorefinery and thus the excess power is sold to the grid A water use credit from the export electricity is considered using a system expanshysion approach Electricity generation water consumption factors from electricity generation mix in IA (05279 gal waterKwh) and GA (06403 gal waterKwh) were adopted from a Power-Water tool3334
Results
In general the blue water footprint of corn stover- and of switchgrass-derived ethanol ranged from 43 to 73 gal per gallon ethanol (Fig 6) similar to that of conventional oil sands production35 Switchgrass-derived ethanol (Case 3) requires less blue water than corn stover-derived ethanol (Case 1 or 2) because of savings from switchgrass irrigashytion Export bioelectricity contributes a 1 galgal water credit to the blue water footprint reducing total blue water use by 12ndash20
292 copy 2013 Society of Chemical Industry and John Wiley amp Sons Ltd | Biofuels Bioprod Bioref 7282ndash302 (2013) DOI 101002bbb
Modeling and Analysis Biochemical biorefinery sizing and environmental sustainability impacts AM Argo et al
Table 6 Projected corn irrigation volume by 2017
FIPS Case 1 Case 2 Case 1 Case 2 Irrigated Area
Fraction Case 1 Case 2
Corn Yield Harvested Acreage Irrigation Water Use Volume
DMTac 1000 Acre MGY
19017 212 217 29 81 06 282 777
19033 223 255 55 152 06 443 1220
19057 175 180 19 52 18 487 1339
19059 203 204 30 84 08 412 1135
19065 183 191 62 170 06 557 1533
19067 215 246 43 119 07 418 1150
19071 175 175 29 79 32 1663 4579
19077 178 178 37 102 14 852 2346
19081 231 257 50 139 07 520 1431
19085 184 184 65 179 121 13714 37756
19099 233 248 41 112 06 292 803
19103 157 157 45 123 13 695 1913
19109 219 220 48 131 06 401 1104
19111 137 137 14 38 14 264 726
19115 167 174 31 84 50 2504 6895
19119 228 237 61 169 07 927 2552
19125 169 169 25 70 07 328 902
19127 249 277 57 158 06 458 1260
19131 240 285 49 135 09 554 1525
19133 184 186 41 114 216 19403 53420
19139 173 185 31 85 26 1146 3156
19143 228 230 39 109 11 734 2020
19147 212 216 49 134 14 1060 2918
19149 207 211 89 245 10 1655 4557
19155 218 218 77 211 08 1198 3299
19161 241 281 54 148 07 562 1547
19163 202 216 31 85 09 351 966
19167 239 257 82 226 18 3080 8479
19193 272 272 64 176 27 3710 10214
19195 240 284 45 125 07 181 497
19197 244 289 64 175 05 444 1222
Counties might not require irrigation if not listed in the table
Green water contributes the most to the overall water footprint in both Case 1 and Case 2 and its relative conshytribution is significantly larger in Case 3 (Fig 7) due to the climate differences between GA and IA In particular GA has higher evapotransporation than IA28 Additionally green and blue water in Case 1 and Case 2 represent only the portion of water allocated to corn stover and the water use in the biorefinery whereas in Case 3 the results
represent all water associated with the entire above-ground switchgrass plant in addition to biorefi nery blue water use (Fig 7)
Grey water for the corn stover cases (Case 1 and Case 2) is attributable to the fraction of fertilizer required durshying the corn growth and supplemental fertilizer applicashytion to replace nutrients lost with stover removal Th e average grey water in Case 1 and Case 2 is estimated at
copy 2013 Society of Chemical Industry and John Wiley amp Sons Ltd | Biofuels Bioprod Bioref 7282ndash302 (2013) DOI 101002bbb 293
AM Argo et al Modeling and Analysis Biochemical biorefinery sizing and environmental sustainability impacts
Table 7 Nitrogen fertilizer application rate on stover (Cases 1 and 2) at Iowa and switchgrass at Georgia (Case 3) The unit is in kg N per stover or switchgrass harvested acreage
FIPS (IA) Case 1 Supplement Case 2 Supplement Corn FIPS (GA) Case 3 SWG FIPS (GA) Case 3 SWG Fertilizer Fertilizer Fertilizer Fertilizer Fertilizer
kgac kgac kgac kgac kgac
19001 1289 1289 5468 13001 6586 13201 ndash
19005 1052 1052 5521 13005 7048 13207 7800
19049 1232 1292 5509 13051 ndash 13251 7800
19003 1098 1098 2671 13003 7522 13205 ndash
19051 522 522 5692 13053 ndash 13253 ndash
19053 700 700 2671 13055 6745 13255 ndash
19055 1367 1406 5966 13057 ndash 13257 ndash
19007 608 608 5532 13007 ndash 13209 5834
19009 1821 1821 5485 13009 ndash 13211 7800
19011 1384 1440 5965 13011 3545 13213 7800
19013 1330 1392 5963 13013 ndash 13215 ndash
19015 1597 1620 5815 13015 7800 13217 5853
19017 1571 1609 5967 13017 7539 13219 7800
19019 956 982 5982 13019 7044 13221 7800
19021 1645 1725 5364 13021 6709 13223 ndash
19023 1616 1830 5875 13023 6921 13225 7800
19025 1605 1825 5388 13025 5840 13227 ndash
19027 1838 2116 5448 13027 6279 13229 6622
19029 1593 1593 2671 13029 6983 13231 6561
19031 1355 1407 5898 13031 6179 13233 7800
19033 1652 1889 5845 13033 7800 13235 6318
19035 1790 1928 2671 13035 ndash 13237 ndash
19037 1323 1336 5925 13037 ndash 13239 ndash
19039 436 436 5467 13039 ndash 13241 5845
19041 1636 1713 5644 13043 6090 13243 ndash
19043 1474 1474 5683 13045 4767 13245 ndash
19045 1156 1161 5976 13047 7800 13247 ndash
19047 1862 1862 2671 13049 ndash 13249 7800
19057 1296 1332 6044 13059 ndash 13259 7772
19059 1504 1512 5598 13061 7800 13261 7800
19061 1352 1352 5829 13063 ndash 13263 ndash
19063 1602 1641 5757 13065 5840 13265 ndash
19065 1355 1410 5845 13067 ndash 13267 5838
19067 1595 1824 5866 13069 5819 13269 7101
19069 1789 2142 5937 13071 ndash 13271 7239
19071 1292 1292 2671 13073 ndash 13273 7800
19073 1697 1998 5417 13075 ndash 13275 7080
19075 1742 1851 5973 13077 7800 13277 7456
19077 1314 1314 5481 13079 ndash 13279 6483
19079 1641 1672 6036 13081 7223 13281 5289
294 copy 2013 Society of Chemical Industry and John Wiley amp Sons Ltd | Biofuels Bioprod Bioref 7282ndash302 (2013) DOI 101002bbb
Modeling and Analysis Biochemical biorefinery sizing and environmental sustainability impacts AM Argo et al
Table 7 (Continued)
FIPS (IA) Case 1 Supplement Fertilizer
Case 2 Supplement Fertilizer
Corn Fertilizer
FIPS (GA) Case 3 SWG Fertilizer
FIPS (GA) Case 3 SWG Fertilizer
kgac kgac kgac kgac kgac
19081 1707 1904 6040 13083 ndash 13283 6959
19083 1603 1645 6081 13085 ndash 13285 ndash
19085 1363 1363 2671 13087 ndash 13287 6841
19087 1264 1264 5711 13089 ndash 13289 6691
19089 1375 1446 5828 13091 7367 13291 4111
19091 1804 2169 5880 13093 5814 13293 ndash
19093 1849 2033 2671 13095 ndash 13295 7800
19095 1287 1287 5943 13097 ndash 13297 5853
19097 1074 1074 6033 13099 ndash 13299 6652
19099 1724 1839 5901 13101 ndash 13301 6875
19101 1202 1202 5663 13103 7800 13303 6871
19103 1159 1159 5931 13105 7150 13305 5827
19105 1118 1135 5955 13107 5819 13307 7800
19107 1314 1314 5854 13109 7800 13309 ndash
19109 1618 1627 6018 13111 ndash 13311 6007
19111 1014 1014 5794 13113 ndash 13313 ndash
19113 1000 1008 5949 13115 ndash 13315 7610
19115 1239 1289 5961 13117 5289 13317 7800
19117 526 526 5408 13119 7800 13319 7800
19119 1690 1751 2671 13121 ndash 13321 7656
19121 1089 1089 5466 13123 ndash
19123 1295 1316 5713 13125 5835
19125 1251 1251 5476 13127 ndash
19127 1840 2052 5988 13129 7800
19129 1474 1474 2671 13131 ndash
19131 1775 2109 5944 13133 7800
19133 1364 1375 2671 13135 ndash
19135 751 751 5297 13137 5845
19137 1339 1339 2671 13139 5929
19139 1280 1369 5996 13141 ndash
19141 1697 1708 2671 13143 ndash
19143 1688 1705 2671 13145 ndash
19145 1178 1178 2671 13147 7800
19147 1570 1599 5642 13149 7800
19149 1535 1561 2671 13151 7800
19151 1683 1737 5619 13153 7424
19153 1308 1405 5641 13155 7480
19155 1616 1616 2671 13157 5853
19157 1548 1577 5930 13159 ndash
19159 540 540 2671 13161 6724
19161 1784 2078 5364 13163 7196
copy 2013 Society of Chemical Industry and John Wiley amp Sons Ltd | Biofuels Bioprod Bioref 7282ndash302 (2013) DOI 101002bbb 295
AM Argo et al Modeling and Analysis Biochemical biorefinery sizing and environmental sustainability impacts
Table 7 (Continued)
FIPS (IA) Case 1 Supplement Case 2 Supplement Corn FIPS (GA) Case 3 SWG FIPS (GA) Case 3 SWG Fertilizer Fertilizer Fertilizer Fertilizer Fertilizer
kgac kgac kgac kgac kgac
19163 1494 1596 6000 13165 7800
19165 1660 1660 2671 13167 6271
19167 1766 1899 2671 13169 ndash
19169 1561 1566 5996 13171 ndash
19171 1512 1514 5978 13173 6469
19173 629 629 2671 13175 7213
19175 737 737 5467 13177 7800
19177 646 646 5418 13179 ndash
19179 1099 1099 5455 13181 ndash
19181 1290 1290 5467 13183 5844
19183 1665 1708 5824 13185 5868
19185 552 552 2671 13187 4895
19187 1664 1668 5703 13189 ndash
19189 1599 1599 5909 13191 ndash
19191 1249 1253 5793 13193 7800
19193 2013 2013 2671 13195 5853
19195 1778 2102 5841 13197 7800
19197 1803 2136 6081 13199 7800
Figure 6 Blue water footprint of cellulosic ethanol produced from corn stover (Cases 1 and 2) and switchgrass (Case 3) by production stage at refinery scale of 2000 DMTday in 2017
850 and 820 gallons water per gallon ethanol respecshytively The average grey water in Case 3 which accounts for assimilating the total fertilizer applied during the entire growth period is only 210 gallons water per galshylon ethanol Results clearly indicate the unique ability of switchgrass to capture nutrient runoff in addition to lower fertilizer input requirements thereby reducing grey
Figure 7 Green and grey water footprint of cellulosic ethashynol produced from corn stover (Cases 1 and 2) and switch-grass (Case 3) by production stage at refinery scale of 2000 DMTday in 2017
water loadings Historically switchgrass has been used in conservation programs to contain the fertilizer loss to water body from crop land
At the same refinery capacity choice of feedstock and location could have significant impacts on types of water footprint of the cellulosic biofuel Since a majority of
296 copy 2013 Society of Chemical Industry and John Wiley amp Sons Ltd | Biofuels Bioprod Bioref 7282ndash302 (2013) DOI 101002bbb
Modeling and Analysis Biochemical biorefinery sizing and environmental sustainability impacts AM Argo et al
Figure 8 County-level distributions of blue green and grey water footprint for a 2000 DMTd biorefinery in 2017 to produced biofuel from (a) corn stover grown in Iowa via advanced logistic system (Case 2) and (b) switchgrass grown in Georgia via advanced logistic system (Case 3)
water requirements in the biofuel life cycle are from the feedstock growing stage the water footprint of a particushylar biofuel is largely determined by regional climate For example with the same advanced logistic system cellushylosic ethanol produced from switchgrass in biorefi neries located in Georgia (Case 3) requires 39 less blue water footprint than that for Iowa stover in Case 2 (Fig 6) Since the total water requirement for crop growth would be satshyisfied either from rainfall (green water) or irrigation (blue water) lower green water footprint often means increased blue water footprint for the same plant species (Fig 8)
Switchgrass is a high yield perennial which requires substantial evapotransporation to support its growth Switchgrass can be cultivated in many regions in the USA without irrigation and thus producing rain-fed switch-grass could have less impact on regional blue water use than other crops requiring irrigation
Biorefinery water supply is entirely blue water and biorefinery water demand is concentrated in a single local area Thus a biorefinery built in an area where the local feedstock is blue-water-intensive would likely lead to an increased burden on the local water resources as compare to a biorefinery built in an area with less blue-watershyintensive feedstocks Therefore it is environmentally benshyeficial to develop switchgrass or other perennial feedstock
plantations in regions with sufficient green water supply to ensure sustainable water use for the feedstock and the biorefi nery
From a whole biorefinery production perspective the resource needs for blue water becomes more pronounced as biorefinery scale increases Further CBS logistics systems dictate that the biorefinery be located near the biomass feedstock production whereas AUD logistics effectively decouple biorefinery location from feedstock production Therefore we expect that CBS logistics would stress a local water resource to a greater extent than AUD logistics Figure 8 further shows the extensive geographishycal variability of blue andf green water footprint even within a state which would affect the choice of feedstock thereby influence the refinery siting consideration
Sustainability metrics and life cycle assessment
SimaPro v73 life cycle assessment modeling soft ware was used to develop and link unit processes using estabshylished methods36 In the absence of primary publicly available data we used the Ecoinvent v20 and to a lesser extent the US Life Cycle Inventory (US LCI) processes We modified the Ecoinvent processes to be refl ective of
copy 2013 Society of Chemical Industry and John Wiley amp Sons Ltd | Biofuels Bioprod Bioref 7282ndash302 (2013) DOI 101002bbb 297
AM Argo et al Modeling and Analysis Biochemical biorefinery sizing and environmental sustainability impacts
Figure 9 GHG emi ssions LCA results for Case 1 Iowa corn stover CBS Case 2 Iowa corn stover AUD and Case 3 Georgia switchgrass AUD
US conditions and the US LCI processes to account for embodied emissions and energy fl ows
Modeling approach and assumptions
The modeling boundary for this study is from fi eld to refinery gate including embodied energy and material flows using the methods described elsewhere36 Th e funcshytional unit is 1 gallon of ethanol produced in the year 2017 Avoided impacts are accounted for using product displacement (also termed boundary system expansion)15
For products that share inputs (eg corn grain and corn stover) burdens are allocated between products based on a lsquoproduct-purposersquo approach Inputs to multi-year cropping systems (ie switchgrass) are likewise annualized by the length of the cropping rotation Impacts from direct and indirect land use change are not considered in this study Feedstock processing and transport are modeled accordshying to INLrsquos CBS and AUD
LCA modeling results
A breakdown of the GHG emission (in terms of CO2 equivalent) for each of the cases is displayed graphically in Fig 9 When comparing AUD to CBS moderate increases in GHG emissions observed in the Iowa corn stover
biochemical conversion-to-ethanol are associated with additional field-to-depot and depot-to-terminal transporshytation steps (lsquoPre-processing otherrsquo category in Fig 9) and increased transportation contribution to the biorefi nery (lsquoFeedstock transportationrsquo category) The small increases in normalized (per gallon of ethanol) electricity credit with increasing biorefinery scale are associated with increased electricity generation efficiency As expected we observe small feedstock differences in GHG emissions for Iowa corn stover and Georgia switchgrass
Conclusions
As expected we demonstrated that CBS has lower average logistics costs than AUD AUD logistic costs are higher than CBS costs primarly due to increased pre-processing costs and increased transportation costs (with multiple transportation step) Likewise and similar to earlier studshyies3 we also show that with CBS logistic costs increase as either biorefinery capacity or feedstock collection radius increase AUD mitigates many of the CBS feedstock-supshyply risks and while resulting in modestly higher logistics costs dramatically reduces both the temporal and spatial biomass-cost variability and allows access to substantially larger quantities of biomass
298 copy 2013 Society of Chemical Industry and John Wiley amp Sons Ltd | Biofuels Bioprod Bioref 7282ndash302 (2013) DOI 101002bbb
Modeling and Analysis Biochemical biorefinery sizing and environmental sustainability impacts AM Argo et al
1 AUD effectively disconnects the feedstock from the biorefinery in terms of both scale and location Single or multiple terminals can supply single or multiple biorefineries of varying scale Biorefi nery locations can be optimized for logistics distribution water resources or other project-specifi c constraints
2 AUD promotes more sustainable cropping practices whereas with CBS there is always pressure to produce the same crop
3 AUD providers have much tighter control on biomass production specifications than is possible with CBS
Iowa corn stover supply costs with CBS increase as biorefinery capacity increases from 500 to 2000 DMTday however the biorefinery economy-of-scale impact is larger in magnitude and the overall MESP decreases from $345 gal to $248gal going from 500 to 2000 DMTday bioreshyfinery scale It must be noted that CBS was not considered for biorefinery capacities of 5000 DMT or greater as the existing models do not capture the substantial additional infrastructure required to manage the high throughput of trucks through the biorefi nery
Iowa corn stover supply costs with the AUD are conshystant for biorefineries ranging from 500 to gt10 000 DMT day and as a result the MESP is reduced from $372gal to $225gal Similar to Iowa corn stover Georgia switch-grass feedstock supply costs are constant using the AUD for biorefineries ranging from 500 to 5000 DMTday however for biorefineries larger than ~5000 DMTday the terminal-to-biorefinery distance needs to be increased from 100 miles to 300 miles to supply the larger capacishyties As a result the MESP for Georgia decreases from $337gal to approximately $204gal as the biorefi nery capacity is increased from 500 DMTday to 10 000 DMT day Only small if any cost reductions are expected for capacities greater than 10 000 DMTday Results of this study show that biochemical ethanol production using a CBS results in the lowest MESP at small biorefi nery scales At larger biorefineries (gt5000 DMTday) these analyses suggest that AUD logistics result in producshytion costs lower than those possible with conventional systems
Our results show no detrimental effects on water sustainability metrics when comparing AUD to CBS Nevertheless feedstock location and feedstock type do affect water use and quality so if biorefineries use diff ershyent feedstocks or pull feedstocks from diff erent locations than those modeled here the results will change Th is study also did not consider the local impact on water resources when siting a large biorefinery We expect that
large biorefineries such as those enabled by the AUD will require a water footprint commensurate to their scale and hence may stress the water resources of a specifi c area where the biorefinery is located
Our results show that AUD logistics result in modestly higher GHG emissions (10ndash15) than CBS mainly due to additional field-to-depot and depot-to-terminal transporshytation (lsquoPre-processing otherrsquo category in Fig 9) steps and increased transportation contribution to the biorefi nery (lsquoFeedstock transportationrsquo category)
One potential issue not addressed in this work is that biomass resulting from AUD pre-processing are subshystantially changed physically and potentially chemically compared to materials collected using CBS (eg lignin is plasticized) This may aff ect biorefinery yield operability and production costs and thus future work will need to experimentally verify and quantify biochemical convershysion of these materials and adapt the modelsanalyses accordingly
Acknowledgement
We thank the US Department of Energy for funding and supporting this work
References 1 US DOE US Billion-Ton Update Biomass Supply for
a Bioenergy and Bioproducts Industry USDOE report no ORNLTM-2011224 lead by Perlack RD and Stokes BJ United States Department of Energy and Oak Ridge National Laboratory Oak Ridge TN pp 227 (2011)
2 Riley C and Schell D Technical and Economic Analysis of an Enzymatic Hydrolysis Based Ethanol Plant internal report Solar Energy Research Institute Golden CO (1991)
3 Aden A Ruth M Ibsen K Jechura J Neeves K Sheehan J et al Lignocellulosic Biomass to Ethanol Process Design and Economics Utilizing Co-Current Dilute Acid Prehydrolysis and Enzymatic Hydrolysis for Corn Stover report no NREL TP-510-32438 National Renewable Energy Laboratory Golden CO pp 154 (2002)
4 Humbird D Davis R Tao L Kinchin C Hsu D Aden A et al Process Design and Economics for the Conversion of Lignocellulosic Biomass to Ethanol Dilute-Acid Pretreatment and Enzymatic Hydrolysis of Corn Stover report no NREL TP-510-47764 National Renewable Energy Laboratory Golden CO pp 147 (2011)
5 Searcy E Wright C Muth D Hess JR and Jacobson J The Limits of a 50 Mile Collection Radius for Biomass Supply to a Biorefi nery draft report Idaho National Laboratory Idaho Falls ID (2010)
6 Hess JR Wright CT Kenney KL and Searcy EM Uniform-Format Solid Feedstock Supply System A Commodity-Scale Design to Produce and Infrastructure-Compaible Bulk Solid from Lignocellulosic Biomass ndash Executive Summary report no INLEXT-09-15423 Idaho National Laboratory Idaho Falls ID (2009)
copy 2013 Society of Chemical Industry and John Wiley amp Sons Ltd | Biofuels Bioprod Bioref 7282ndash302 (2013) DOI 101002bbb 299
AM Argo et al Modeling and Analysis Biochemical biorefinery sizing and environmental sustainability impacts
7 Jacobson JJ and Searcy EM Uniform-Format Feedstock Supply System Design for Woody Biomass Presented at the Spring Conference of the AICHe Orlando FL April (2010)
8 Langholtz M Graham RC Eaton L Perlack R Hellwinckel C and De la Torre Ugarte D Price projections of feedstocks for biofuels and biopower in the US Energy Policy41484ndash493 (2012)
9 USDA NASS Agricultural Prices Paid US [Online] Department of Agriculture National Agricultural Statistics Service Available at httpusdamannlibcornelledu MannUsdaviewDocumentInfododocumentID =1002 [September 19 2012]
10 USDA-OCEWAOB Agricultural Projects to 2018 Long-term Projections Report OCE-2010-1 US Department of Agriculture and Office of the Chief Economist World Agricultural Outlook Board Washington DC (2009)
11 US Congress Energy Independence and Security Act of 2007 110th Congress 1st Session HR 6 4 (2007)
12 US EIA Annual Energy Outlook 2010 Report No DOEEIAshy0383 US Energy Information Administration Washington DC (2010)
13 Wu M Chiu YW and Demissie Y Quantifying the regional water footprint of biofuel production by incorporatshying hydrologic modeling Water Resrouce Research DOI1010292011WR011809 (2012)
14 NOAA NCDC 1971-2000 US Climate Normals Products Clim 84 Daily Normals [Online] NOAA National Climate Data Center Available at httpwwwncdcnoaagov [September 19 2012]
15 Wang M Huo H and Arora S Methods of dealing with coshyproducts of biofuels in life-cycle analysis and consequent results within the US context Energy Policy 395726ndash5736 (2011)
16 USDA 2002 Census of Agriculture US Department of Agriculture Washington DC (2004)
17 USDA 2007 Census of Agriculture US Department of Agriculture Washington DC (2010)
18 USDA 2008 Farm and Ranch Irrigation Report No AC-02-SS-1 US Department of Agriculture Washington DC (2009)
19 USDA 2003 Farm and Ranch Irrigation Survey Report No AC-02-SS-1 US Department of Agriculture Washington DC (2004)
20 USGS Water Use in the United States 1985 1990 and 1995 [Online] US Geological Survey Available at httpwaterusgs govwatuse [September 19 2012]
21 High Plains Regional Climate Center Crop Coeffi cients for Corn [Online] Available at httpwwwhprccunleduawdn etcropcrop_corntxt [September 19 2012]
22 Marek T Colaizzi P Howell TA Dusek D and Porter D Estimating Seasonal Crop ET Using Calendar and Heat Unit Based Crop Coefficients in the Texas High Plains Evapotranspiration Network Presented at 2006 ASAE Annual Meeting American Society of Agricultural and Biological Engineers Portland OR pp 9ndash12 (2006)
23 Kiniry J Lynd L Greene N Johnson M Casler M and Laser MS Biofuels and water use Comparison of maize and switch-grass and general perspectives new research on biofuels ed by Wright JH and Evans DA Nova Science Publishing New York ( 2008 )
24 Kiniry JR Tischler CR and Van Esbroeck GA Radiation use efficiency and leaf CO2 exchange for diverse C4 grasses Biomass Bioenerg 17(2)95ndash112 (1999)
25 Grassini P Yang H and Cassman KG Limits to maize proshyductivity in western corn-belt A simulation analysis for fully irrigated and rainfed conditions Agr Forest Meteor 1491254ndash 1265 (2009 )
26 Hoos AB and McMahon G Spatial analysis of instream nitroshygen loads and factors controlling nitrogen delivery to streams in the Southeastern United States using spatially referenced regression on watershed attributes (SPARROW) and regional classifi cation frameworks Hydrol Process 232275ndash2294 (2009)
27 Hoos AB Terziotti S McMahon G Savvas K Tighe KC and Alkons-Wolinsky R Data to Support Statistical Modeling of Instream Nutrient Load Based on Watershed Attributes Southeastern United States 2002 US Geological Survey pp 50 (2008)
28 Demissie Y Yan E and Wu M Assessing regional hydrology and water quality implications of large-scale biofuel feedstock production in the Upper Mississippi river basin Environ Sci Technol 469174ndash9182 (2012)
29 Wu M Demissie Y and Yan E Simulated impact of future bioshyfuel production on water quality and water cycle dynamics in the Upper Mississippi river basin Biomass Bioenerg 4144ndash56 (2012)
30 Smith RA Alexander RB and Schwarz GE Natural backshyground concentrations of nutrients in streams and rivers of the conterminous United States Environ Sci Technol 373039ndash 3047 (2003)
31 Chiu YW and Wu M Assessing county-level water footprints of different cellulosic-biofuel feedstock pathways Environ Sci Technol 469155ndash9162 (2012)
32 White PJ CORN Chemistry and Technology 2nd edn ed byWhite PJ and Johnson LA American Association of Cereal Chemists Inc St Paul MN (2003)
33 Wu M and Peng MJ Developing a tool to estimate water withshydrawal and consumption in electricity generation in the United States Report No ANLESD11-2 update Argonne National Laboratory (2011)
34 ANL TTRDC GREET Model [Online] Argonne National Laboratory Transportation Technology RampD Center Chicago IL Available at httpgreetesanlgovindex phpcontent= power_water [August 21 2012]
35 Wu M Mintz M Wang M and Arora S Water consumption in the production of ethanol and petroleum gasoline Environ Manage 44981ndash997 (2009)
36 Hsu DD Inman D Heath GA Wolfrum EJ Mann MK and Aden A Life cycle environmental impacts of selected US ethanol production and use pathways in 2022 Environ Sci Technol 445289ndash5297 (2010)
300 copy 2013 Society of Chemical Industry and John Wiley amp Sons Ltd | Biofuels Bioprod Bioref 7282ndash302 (2013) DOI 101002bbb
Modeling and Analysis Biochemical biorefinery sizing and environmental sustainability impacts AM Argo et al
Andrew Argo
Dr Andrew Argo is senior engineer in the system integration group at the National Renewable Energy Laboratoshyry His work supports the Department of Energy Biomass Program in the areas of strategic systemlevel analysis and integrated biorefinery projects monitoring
Eric C D Tan
Dr Tan is a Senior Research Engineer in the Biorefinery Analysis Group of the National Bioenergy Center at the National Renewable National Laborashytory (NREL) His research interests include the process design economshyics and sustainability for conversion of lignocellulosic biomass to biofuels
with particular emphasis on the application of techno-economic analysis and life cycle assessment methods He also has broad experience in chemically reacting flow simulation and heterogeneous catalysis
Daniel Inman
Dr Daniel Inman is a research scienshytist at the National Renewable Energy Laboratory in Golden Colorado His primary research interests are centered on the sustainability biofuel producshytion and use He is currently involved in several modeling projects including lifecycle assessment of multiple biofushy
els and using system dynamics to examine the growth of the cellulosic biofuels industry
Matthew H Langholtz
Dr Matthew Langholtz is a Natural Resource Economist in the Bioenergy Group at Oak Ridge National Laborashytory He is principle investigator (PI) of the Resource Analysis Project of the Bioenergy Group at Oak Ridge Nationshyal Lab as well as the Short-Rotation Woody Crop Sustainability project His
research interests include biomass resource economics short-rotation woody crops and bioenergy from forest resources He has worked on valuation of non-market externalities and developed biomass supply curves for commercial projects the South and the United States
Laurence M Eaton
Laurence Eaton is a Research Scientist at the Oak Ridge National Laborashytory in the Bioenergy Resource and Engineering Systems Group of the Environmental Sciences Division An economist by training he conducts research to support bioenergy foreshycasting and analysis using economic
land use models and Geographic Information Science He participates in interdisciplinary Resource Assessment activities to support the efficient and sustainable supply of agricultural and forestry resources for commercial domestic bioenergy and bioproducts markets He has worked in the area of applied microeconomics as it reshylates to bioenergy firm input decisions and the valuation of environmental goods and ecological services
Jacob J Jacobson
Mr Jacobson is a researcher from the Idaho National Laboratory He has a diverse background in systems analysis system dynamics statistical consulting software development and project management His work has been in the development and analysis of decision support systems to evalushy
ate policy options and business risks of complex energy and environmental systems His recent work has been in the area of analysis of biomass feedstock logistics
Christopher T Wright
Dr Chris Wright is manager and a senior research engineer for the Idaho National Laboratoryrsquos Biofuels and Reshynewable Energy Department His work supports the Department of Energy Biomass Program in developing analyshysis tools and technology for feedstock supply logistics and conversion of bioshy
mass to valuable fuels chemicals materials and power His knowledge of DOErsquos Biomass Program includes an emphasis on lignocellulosic feedstock supply systems which includes feedstock characterization development preprocessing handling and transportation issues assoshyciated with refining biomass into fuels and chemicals
copy 2013 Society of Chemical Industry and John Wiley amp Sons Ltd | Biofuels Bioprod Bioref 7282ndash302 (2013) DOI 101002bbb 301
AM Argo et al Modeling and Analysis Biochemical biorefinery sizing and environmental sustainability impacts
David J Muth Jr
Dr Dave Muth is a Research Engishyneer at the Idaho National Laboratory in Biofuels and Renewable Energy Technologies He leads the Analysis and Sustainability Group with the Bioenergy Research Team developshying models and modeling techniques which facilitate the evaluation the
feedstock assembly system as it pertains to creating advanced biofuels He is currently working as a contracshytor to the US Department of Energy Office of Biomass Programs located at DOE Headquarters supporting the establishment of technical objectives and research tarshygets for next generation feedstock supply and logistics systems that deliver high quality biomass feedstocks for advanced hydrocarbon fuel production
May M Wu
Dr May Wu a principal energy systems analyst at Argonne National Laborashytory is the PI of biofuel sustainability research funded by the US Departshyment of Energy Her research interests are in the area of water quality and water quantity associated with large-scale development of biofuel convenshy
tional fuel electricity and emerging fuels and life cycle analysis Dr Wu is leading the effort to develop tools and largescale watershed models to assess spatially explicit water footprint of biofuel produced from conventional cellulosic and advanced feedstock and impact of proshyjected future production on regional nutrient sediment and hydrology Dr Wu served as an expert advisor to the Water Working Group of the Council on Sustainable Biomass Production (CSBP)
Yi-Wen Chiu
Dr Yi-Wen Chiu is a postdoctoral apshypointee in the Energy System Division at the Argonne National Laboratory As an interdisciplinary scientist her main research interests are to understand the coupling and interaction of human and natural systems by applying inteshygrated modeling tools She has been
involved in research related to water footprint and water-energy nexus with broad interests related to scenario analysis and environmental impact assessment She also participates in several studies aiming to advance biofuels by determining the feasible pathways of achieving water sustainability goals
Robin L Graham
Dr Robin L Graham is Deputy Associate Laboratory Director for the Computing Environment and Life Science Directorate at the Argonne National Laboratory Formerly at Oak Ridge National Laboratory she worked in the Bioenergy field for many years pioneering biomass feedstock
resource assessments that incorporated both economic and environmental factors She was an author of the original ldquoBillion Tonrdquo study and contributed to its 2011 follow-up An ecosystem ecologist by training she has long been interested in developing sustainable natural resources and began her career working for the RampD Division of Weyerhaeuser Co She currently is leading Argonnersquos Biological and Environmental Science Initiashytive which aims to accelerate our understanding of the fundamental design principles in biological and environshymental systems
302 copy 2013 Society of Chemical Industry and John Wiley amp Sons Ltd | Biofuels Bioprod Bioref 7282ndash302 (2013) DOI 101002bbb

Modeling and Analysis Biochemical biorefinery sizing and environmental sustainability impacts AM Argo et al
Table 2 Summary of overall Iowa (IA) and Georgia (GA) residue and energy crop biomass feedstock supply modeled by POLYSYS
Total ha Planted Total Production Growers Payment Re sidueEnergy Crop Yield (DMTha) Harvested (DMT) (2007$DMT)
IOWA
Corn stover 413 5726650 23620508 $4690
Wheat straw 013 6041 7985 $3736
Total 408 5778203 23628493 $4690
GEORGIA
Corn stover 151 111034 167307 $4496
Wheat straw 096 60318 57700 $3584
Total residues 131 171351 225007 $4262
Switchgrass 1122 135023 1514474 $3366
Total 1122
price also includes profit required to incentivize production of energy crops For dedicated feedstocks to be competishytive farmers must be paid above the expected returns ie the opportunity cost of an alternative crop For residues farmgate price also compensates producers for nutrients and organic matter embodied in the residues which must be replaced in the soil This paper identifies feedstock supshyply available when the offered farmgate price of biomass is $61 per DMT lsquoGrower paymentrsquo is the price required for rights to harvest material from the field Succinctly grower payment is farmgate price minus harvest cost for both dedshyicated feedstocks and residues Average grower payments of participating producers and a summary of the feedstock supply results are reported in Table 2
Switchgrass production budgets are estimated for a 10-year planning horizon with no-till establishment on cropland cropland pasture and permanent pasture For permanent pasture a one-time breaking fee is incurred in the establishment year Crop residues include corn stover and wheat straw Crop residue yields are estimated aft er requirements for soil carbon and wind and water erosion are met Both crop residue and switchgrass supplies are estimated using a cumulative harvest effi ciency of 081 from standing yield to farm-gate yield
Supply projections were limited to the feedstock price level determined in Langholtz et al 8 to meet EISA and projected state biopower mandates Because there is insufshyficient feedstock at a farmgate price of $6063 per DMT in the state of GA to support a biorefinery capacity of 7500 or 10 000 DMTday we assumed that herbaceous feedstock will be available in adjacent states at the same grower payshyment as Georgia and the feedstock will be transported further for Case 3 in these scenarios
135023 1514474 $3366
The current analysis does not explore whether or not feedstocks would be produced on different land types when comparing the AUD with the CBS Nor does it explore the opportunity to increase feedstock prices to procure more supplies within a given area
Logistics
Feedstock logistics analyses were performed utilizing the INL Biomass Logistics Model (BLM)7 The BLM is develshyoped on a system dynamics modeling platform (Powersim) and accounts for all capital and operational elements when evaluating a feedstock supply system design Th e BLM is not used to site depots terminals or biorefi neries in the logistics analysis scenarios in this paper instead it assumes a central location within the biomass supply in the CBS designs and a specified distance from the biomass in the AUD designs The BLM simulates the flow of bioshymass through the entire supply chain tracking changes in feedstock characteristics (ie moisture content dry matter ash content and dry bulk density) as infl uenced by the various operations (ie harvesting transportation storage hellip) in the supply chain
Case 1 analysis
Th e first scenario is based on using a CBS for cornstover in Iowa which is a high yield area The CBS uses currently available commercial equipment and processes (Fig 1) Multi-pass har vest systems first move the fi eld-dried feedshystock into a windrow and then bale the windrow into large square bales (3rsquo times 4rsquo times 8rsquo) Bales are collected and moved
copy 2013 Society of Chemical Industry and John Wiley amp Sons Ltd | Biofuels Bioprod Bioref 7282ndash302 (2013) DOI 101002bbb 285
AM Argo et al Modeling and Analysis Biochemical biorefinery sizing and environmental sustainability impacts
Figure 1 Engineering design schematic of the CBS
to field-side storage stacks where they are protected with tarps When needed at the biorefinery bales are delivered via flatbed semi-trucks to biorefinery short-term storage At the biorefinery the bales are queued as needed through a grinding process that reduces the feedstock to frac14-inch particle size bulk material This bulk material is then fed into the conversion reactor
Constraints
One of the major drawbacks of the CBS design is that it provides limited opportunity to stabilize material or alter material specifications which means that only material containing less than 15 moisture which meets the conversion process moisture specification should be baled This constraint limits the availability of feedstocks and impacts system performance across climate ranges different harvest seasons and diff erent crops
In the case of switchgrass moisture at harvest can be managed primarily by delaying cutting of the crop until the material has dried appropriately However a corn stover harvest presents a very different challenge as stover
F igure 2 Moisture content of bales entering storage was vastly different for each year according to an INL-conducted northwest Iowa storage study (internal INL data not included here)
is a secondary crop to the corn grain The harvest window and subsequently the material properties of the stover at harvest is driven by grain harvest decisions
286 copy 2013 Society of Chemical Industry and John Wiley amp Sons Ltd | Biofuels Bioprod Bioref 7282ndash302 (2013) DOI 101002bbb
Modeling and Analysis Biochemical biorefinery sizing and environmental sustainability impacts AM Argo et al
Climate conditions have a major impact on the fi eld drying of stover Figure 2 shows moisture distribution as measured in an INL storage study of bales that were collected in northwest Iowa in 2009 and 2010 In 2010 approximately 95 of the bales collected met the CBS criteria of 15 moisture or below whereasin 2009 more than 97 of the bales collected were at 25 moisture or above Moving and storing material with high-moisture content significantly impacts stability and logistics costs
Analysis parameters
The logistics assessments for the CBS in this analysis are limited to 2000 DMTday and smaller biorefi neries because the current system design cannot be scaled to larger biorefineries without significant design changes across multiple elements For example an entirely new infrastructure would be required to support and manage movement of 60 or more trucks per hour as required in the large biorefinery capacity scenarios Following is a breakshydown of model parameters used in the Case 1 logistics analyses
bull 10 -year average assessment Using 10 years of harvest progress data coupled with climate data and fi eld dr ying data an analysis was performed to develop a 10-year average assessment of the corn stover availshyable to bale in Iowa at 15 moisture Th e resultant algorithm was tested against Boone County in the center of Iowa and showed that on average approxishymately 36 of the corn stover acres could be baled at 15 moisture or below This percentage was used to set the 10-year average for Iowa that was used in the Case 1 logistics analysis Itrsquos important to note that calculating an impact of climate across years or for larger geographical areas can result in an average that does not necessarily represent individual years in the dataset
bull Harvesting system The analysis accounts for collecshytion limitations stemming from using a multi-pass harvest system to collect corn stover in CBS INL fi eld tests demonstrated that collection rate is capped at 672 DMTha by the practical limits for this type of equipshyment Harvest windows of 19 harvest days are also assumed for the conventional system
bull Field-side storage Collection system models assume field-side storage at a fi xed stack size The distance to the stack input into the collection model is determined by using the county yield and implementing a radial geometric mean formula to establish the transport distance from the field to the local stack Storage
system bale stacks are assumed to be 2000 DMT Th e moisture content of the bales when put into storage is assumed to be 15 Dr y matter losses in storage are modeled at 5
bull Transportation to biorefi nery Transportation disshytance to the biorefinery is solved through a series of spatial operations First the feedstock density for a given county is normalized with the density of all counshyties that have area within a 25-mile radius of the subject countyrsquos centroid This normalization is performed to simulate the potential movement of feedstock across county boundaries for delivery to the biorefi nery Th e density calculation accounting for yield and acres parshyticipating in stover collection provides a DMTmile2
density With the normalized feedstock density calcushylated for the county a radial geometric mean formula is employed to establish an average biorefi nery transport distance for the county
bull Biorefi ner y pre-processing Pre-processing operations in the CBS are exclusively performed within the bioreshyfinery gates A two-stage grinder is used in the model to size-reduce the stover bales to frac14-inch material which is then fed through an even-flow queuing system and fed to the biochemical conversion reactor
Case 1 results
Using INLrsquos BLM the various supply system composhynents ndash harvest collection and transportation ndash were systematically run for the available biomass from each of the counties within Iowa The total supply costs were estimated by summing all of the system components Th e results of the statewide county-by-county analysis are shown in Fig 3
As can be seen in Fig 3 there is a wide range of logisshytics costs (approximately $45ndash$88DMT) using the CBS (Case 1) Cost variations are mainly due to low-yield areas which in turn have a high impact on the overall logistics costs
Case 2 and Case 3 AUD analyses
The AUD system utilizes equipment and processes that are in some cases commercially available now and in others at bench and pilot scales and will likely be comshymercially available in 2017 In the latter case production-sized equipment is scaled from current bench and pilot scale data
In an AUD process (Fig 4) a single-pass har vesting system collects the grain and corn stover at the same time and the corn stover is fed directly to a baler Th e corn
copy 2013 Society of Chemical Industry and John Wiley amp Sons Ltd | Biofuels Bioprod Bioref 7282ndash302 (2013) DOI 101002bbb 287
AM Argo et al Modeling and Analysis Biochemical biorefinery sizing and environmental sustainability impacts
Figure 3 Breakdown of total Case 1 and 2 logistics costs for each county in Iowa based on removable stover limits and total Case 3 logistics costs for each county in Georgia based on removable switchgrass limits
Figure 4 The AUD supply system uses distributed pre-processing depots to stabilize and densify feedstock providshying a lignocellulosic commodity material compatible with the infrastructure
288 copy 2013 Society of Chemical Industry and John Wiley amp Sons Ltd | Biofuels Bioprod Bioref 7282ndash302 (2013) DOI 101002bbb
Modeling and Analysis Biochemical biorefinery sizing and environmental sustainability impacts AM Argo et al
stover bales are collected and moved to fi eld-side stacks where they are protected with plastic wrap and stored Plastic wrap was chosen to protect the bales because of the concern that the high moisture content would lead to unacceptable dry matter losses if the bales were proshytected with tarps similar to that in Case 1 When needed stacks are delivered via flatbed semi-trucks to the depot for short-term storage and processing Again as needed the bales are sent through a drying grinding and denshysification process that dries the material to lt10 moisshyture reduces the feedstock to frac14-inch particle size bulk material and then densifies the material to a pellet with density gt30 lbft3 Th e densified material is then shipped to the terminal for blending and later transported to the biorefi nery
Analysis parameters
The key feature of AUD is the pre-processing of biomass at an early stage in the supply system (Fig 4) Pre-processing depots produce a final uniform material that is compatible with the grain storage and handling infrastructure
bull Field-side storage Collection system models assume field-side storage at a fixed stack size The distance to the stack input into the collection model is determined by using the county yield and implementing a radial geometric mean formula to establish the transport disshytance from the field to the local stack
bull Bale moisture content Storage system bale stacks are assumed to be 2000 DMT Moisture content of the bales when put into storage is assumed to be gt20 due to baling of the material directly from the combine without field drying Due to the high moisture content the bales are wrapped in plastic to reduce the dry matshyter losses Dry matter losses in storage are modeled at 78
bull Trucking feedstock from field-side to depot Depot size is based on the throughput capacity of the grinder which is the most capital-intensive piece of equipment at the depot The transportation distance is solved through a series of spatial operations much like the fi eld-side-to-biorefinery delivery in a CBS
bull Tr uck ing from depot to blend ing ter mina l This distance is again solved through a series of spatia l operations based on a terminal size of 3 600 000 DMTyear
bull Shipping by rail from blending terminal to biorefi nshyery This operation is based on a predetermined disshytance of 100 miles since by rail the majority of costs are fixed and the variable cost per mile is minimal
In Case 3 the logistics design in Georgia assumes that the feedstock is 100 switchgrass For the 7500 and 10 000 DMTday biorefi nery-capacity scenarios the terminal-toshybiorefinery distance was increased to 300 miles to accomshymodate the need for feedstock outside of Georgia
The AUD feedstock design incorporates a blending facilshyity (terminal) where different feedstocks can be blended to meet a conversion facilityrsquos feedstock design requirements
AUDrsquos impact is that the average supply system cost is higher but the spatial and temporal variability are much lower Where a CBS has low control over delivered bioshymass feedstock specifications AUD has high control Also AUD is able to access material from low-yield counties that would typically be stranded and not able to enter the supply system at aff ordable costs
Case 2 results
Case 2 uses the AUD for corn stover collection in Iowa The results of the county-by-county analysis of feedstock logistics costs are shown in Fig 3 Th e figure shows that while on average the total logistic cost is higher the range of variability ($66ndash$85 per DMT) is lower than that for the CBS ($45ndash$88 per DMT)
Case 3 results
Case 3 uses the AUD for switchgrass in Georgia Th e results of the county-by-county analysis of feedstock logisshytics costs are shown in Fig 3 Th e figure shows that while on the average the total logistics cost is higher the range of variability of the total cost is relatively low ($64ndash$117 per DMT) and much less for the AUD that for the CBS (intershynal INL data not included here)
Overall logistics results
The overall conclusions regarding the effects of feedstock logistics design on total cost are the following
bull The CBS demonstrates high spatial variability in costs even in highly productive regions such as Iowa Th e local ranges in feedstock cost were from $45 to $88 per DMT Additionally the CBS has very limited control on the feedstock specifications delivered to the biorefi nery
The AUD has higher average supply system costs but it does demonstrate reduced spatial and temporal varishyability The average costs were much more stable ranging from $66 to $85 per DMT for Iowa corn stover Th e AUD also allows material from areas with low yields to enter into the system whereas under the conventional supply
copy 2013 Society of Chemical Industry and John Wiley amp Sons Ltd | Biofuels Bioprod Bioref 7282ndash302 (2013) DOI 101002bbb 289
AM Argo et al Modeling and Analysis Biochemical biorefinery sizing and environmental sustainability impacts
Table 3 Breakdown of feedstock logistics costs by unit operations for CBS and AUD system designs in Boone County IA (a b) and AUD system design in Telfair County GA (c)
a) Conventional bale system costs in Boone County IA for 2000 DMTday biorefi nery
Harvest amp Storage Transportation Preprocessing Handling amp Total Collection (~45 km) Queuing Logistics
$1561 $595 $886 $1494 $083 $4620
b) Advanced uniform system costs in Boone County IA
Harvest amp Storage Depot Transport Depot Terminal Transport Terminal Biorefi nery Handling Total Collection (~17 km) Preprocessing (~80 km) Transport (~170 km) amp Queuing Logistics
$1615 $660 $601 $2479 $314 $154 $895 $083 $6801
c) Advanced uniform system costs in Telfair County GA
Harvest amp Storage Depot Transport Depot Terminal Transport Terminal Biorefi nery Handling Total Collection (~17 km) Preprocessing (~80 km) Transport (~170 km) amp Queuing Logistics
$1637 $554 $623 $2329 $496 $154 $895 $083 $6771
Table 4 Summary of feedstock and average logistics costs (weight averaged) used in biorefinery sizing and sustainability study
Distance to Biorefi nery Size Grower Payment Logistics Total Feedstock Case Location Feed Logistics Biorefi nery (mi) (DMTd) ($DMT) ($DMT) Cost ($DMT)
1 IA Corn stover CBS 15 500 $4689 $4481 $9170
21 1000 $4689 $4540 $9229
30 2000 $4689 $4620 $9309
2 IA Corn stover AUD 100 500 to 10000 $4690 $6801 $11491
3 GA SWG AUD 100 500 to 5000 $3393 $6771 $10164
300 7500 to 10000 $3393 $7377 $10770
system these resources would be stranded and inaccesshysible An example of the breakdown of total logistics cost for all cases are included in Table 3 AUD pre-processing costs are higher than those for CBS costs mainly because of higher pre-processing costs (drying pellitization) and additional transportation steps
Feedstock supply and logistics summary
A summary of the feedstock supply costs (grower payment + average logistic costs) for the work included in this study is displayed in Table 4 Using CBS logistics for Iowa corn stover (Case 1) the feedstock supply cost increases with increasing biorefinery size as a greater collection radius is required In contrast using AUD logistics for Iowa corn stover (Case 2) biorefinery capacities in excess of 10 000 DMTday are possible with a terminal located 100 miles from the biorefinery thus the feedstock supply cost is constant for Case 2 Similarly the feedstock supply cost
is constant for biorefinery capacities ranging from 500 to 5000 DMTday for Georgia switchgrass (Case 3) However at biorefinery capacities of 7500 and 10 000 DMTday for Georgia switchgrass a larger cropping area and thus a larger terminal-to-biorefinery distance (300 miles) is required
Conversion to ethanol
Conversion methods
Techno-economic analyses for the biochemical process of making ethanol from corn stover or switchgrass were pershyformed by scaling the biochemical process design model for corn stover that was developed at NREL4
For this study we assumed that the feedstock convertshyibility is the same for similar feedstock types (ie corn stover and switchgrass) as well as between the feedstock formats (ie CBS and AUD) All conversion data are based on those reported for corn stover (using CBS)4 using the feedstock composition data displayed in Table 5
290 copy 2013 Society of Chemical Industry and John Wiley amp Sons Ltd | Biofuels Bioprod Bioref 7282ndash302 (2013) DOI 101002bbb
Xylan 1953 2250
Moisture 12 15
Modeling and Analysis Biochemical biorefinery sizing and environmental sustainability impacts AM Argo et al
Table 5 Corn stover and switchgrass compositions used for this study
IA Corn Stover GA SwitchgrassComponent (dry wt ) (dry wt )
Glucan 3505 3500
Lignin 1576 2260
Ash 493 330
Acetate 181 180
Protein 310 120
Extractives 1465 970
Arabinan 238 310
Galactan 143 050
Mannan 060 030
Sucrose 077 000
Total structural carbohydrates 5899 6140
IA Corn Stover (bulk GA Switchgrass wt) (bulk wt)
The minimum ethanol selling prices (MESP) to give a 10 after-tax internal rate of return were calculated using a standard discounted cash flow rate of return analysis and the financial assumptions included in an earlier NREL report4
Results
Figure 5 shows the breakdown of the MESP (biorefi nery only) as a function of biorefinery plant size for each case
In all cases MESP decreases as biorefi nery size increased AUD logistics and processing costs are essenshytially constant for Iowa corn stover thus rising feedstock costs do not limit the economies-of-scale for biorefi neries in excess of 10 000 DMTday In the case of lower-yielding feedstock (county-yield) such as Georgia switchgrass increases in feedstock costs start to balance biorefi nery economies-of-scale at biorefinery capacities in excess of gt5000 DMTday
Due to the higher logistics costs the MESP for AUD corn stover (Case 2) is approximately $025gal higher than that for CBS (Case 1) at small biorefinery capacities (lt2000 DMT day) However this study suggests that increasing the bioreshyfinery size to 5000 DMTday will more than offset the MESP increase associated with more expensive AUD pre-processed feedstock Biorefinery capacities in excess of 10 000 DMT day are only possible with AUD and the resulting MESPs are substantially lower than that with CBS
As the biorefinery size increases from 500 to 10 000 DMTday with AUD logistics the MESP decreases from $372 to $225 per gallon for IA-corn stover and $337 to $204 per gallon for GA-switchgrass The lower MESP for switchgrass compared to that for corn stover is attributed to lower feedstock cost higher ethanol yield and higher byproduct electricity credit
Water
In this section the water resource use and the impact on water quality are analyzed Water resource analysis
Figure 5 M inimum ethanol selling price (MESP) as a function of plant size
copy 2013 Society of Chemical Industry and John Wiley amp Sons Ltd | Biofuels Bioprod Bioref 7282ndash302 (2013) DOI 101002bbb 291
AM Argo et al Modeling and Analysis Biochemical biorefinery sizing and environmental sustainability impacts
focuses on the consumptive use of rainfall (green water) and of surface and ground water (blue water) through irrigation and process water use Water quality analysis focuses on discharged water from fields containing fertishylizer and process water discharge (grey water) Th e water footprint for the three types of water is considered for the feedstock growing stage and conversion stage for the procshyess described earlier Detailed methodologies of the water footprint assessment for the green blue and grey water are described elsewhere13 30
Data sources and assumptions
We used public data sources for this work including govshyernment reports and open literature In the case that data were not available we relied on a combination of model simulation and statistical regression We assumed that soil moisture level is sufficient to meet the lowest water demand for switchgrass so that irrigation is not required in the state of Georgia
Climate irrigation crop and nutrient loading data
Water footprint calculation relies heavily on climate agricultural and hydrological data All of the climate data used in this study were derived from the National Climate Data Center of NOAA for the period from 1970 to 200014 Agricultural data for crop harvested acreshyage were from USDA NASS15 Irrigation application data were acquired from the 2002 and 2007 Census of Agriculture16 17 and the Farm and Ranch Irrigation Survey18 19 published by the USDA and USGS20 Th e crop coeffi cient Kc used in estimating evapotranspiration (ET the loss of water from the soil by evaporation and by transpiration from the crops) was compiled from the High Plains Regional Climate Center21 the Texas High Plains Evapotranspiration network22 and the previous studies of Kiniry et al2324 Climate in 2017 was assumed to remain the same as the historical average from 1970 to 2000 However the irrigation demand was further adjusted from historical values to reflect the increase of corn acreage and yield25 (Table 6) Nitrogen loading (data not included here) a key component of interest in grey water in IA and GA was estimated using results from SPARROW model26 27 Nitrogen fertilizer input rates for switchgrass were estimated by POLYSYS Regular corn field fertilizer input were simulated by a SWAT hydrologic model based on USDA state-level data28 29 while s upshyplemental fertilizer inputs were provided by POLYSYS A natural background nitrogen concentration CN was
compiled from USGS30 Nutrient loading for SWG was estimated from alfalfa27 Based on the historical monitorshying data sets for total nitrogen and nitrate (USGS30) CN is assumed to be 95 of the total nitrogen concentration in stream water Nitrogen fertilizer input data are included in Table 7 A comparison of the SWAT and SPARROW model in the studied areas showed good agreement for average values while SPARROW projected less veriabilishyties31 All of the watershed-scale calculations in this study were further converted into county-level data using the zonal statistics tool in ArcGIS
Water allocation
Corn plants produce grain and stover both of which can be used as biofuel feedstock During its growth corn grain and stover each appropriate a fraction of the total water requirement The same fraction was assumed in partionshying the water footprint associated with stover based biofuel production The blue water and green water of corn is partitioned between grain and stover by applying a crop harvest index32
Conversion process water use
Consumptive water use at the biorefinery is estimated from the process model described earlier Depending on the production scale and feedstock the normalized procshyess water use ranges from 53 to 56 LL ethanol produced The conversion process water is supplied from surface and ground water sources and therefore its use contributes only to the blue water footprint
In the conversion process more bio-electricity is proshyduced than that needed for the biorefinery and thus the excess power is sold to the grid A water use credit from the export electricity is considered using a system expanshysion approach Electricity generation water consumption factors from electricity generation mix in IA (05279 gal waterKwh) and GA (06403 gal waterKwh) were adopted from a Power-Water tool3334
Results
In general the blue water footprint of corn stover- and of switchgrass-derived ethanol ranged from 43 to 73 gal per gallon ethanol (Fig 6) similar to that of conventional oil sands production35 Switchgrass-derived ethanol (Case 3) requires less blue water than corn stover-derived ethanol (Case 1 or 2) because of savings from switchgrass irrigashytion Export bioelectricity contributes a 1 galgal water credit to the blue water footprint reducing total blue water use by 12ndash20
292 copy 2013 Society of Chemical Industry and John Wiley amp Sons Ltd | Biofuels Bioprod Bioref 7282ndash302 (2013) DOI 101002bbb
Modeling and Analysis Biochemical biorefinery sizing and environmental sustainability impacts AM Argo et al
Table 6 Projected corn irrigation volume by 2017
FIPS Case 1 Case 2 Case 1 Case 2 Irrigated Area
Fraction Case 1 Case 2
Corn Yield Harvested Acreage Irrigation Water Use Volume
DMTac 1000 Acre MGY
19017 212 217 29 81 06 282 777
19033 223 255 55 152 06 443 1220
19057 175 180 19 52 18 487 1339
19059 203 204 30 84 08 412 1135
19065 183 191 62 170 06 557 1533
19067 215 246 43 119 07 418 1150
19071 175 175 29 79 32 1663 4579
19077 178 178 37 102 14 852 2346
19081 231 257 50 139 07 520 1431
19085 184 184 65 179 121 13714 37756
19099 233 248 41 112 06 292 803
19103 157 157 45 123 13 695 1913
19109 219 220 48 131 06 401 1104
19111 137 137 14 38 14 264 726
19115 167 174 31 84 50 2504 6895
19119 228 237 61 169 07 927 2552
19125 169 169 25 70 07 328 902
19127 249 277 57 158 06 458 1260
19131 240 285 49 135 09 554 1525
19133 184 186 41 114 216 19403 53420
19139 173 185 31 85 26 1146 3156
19143 228 230 39 109 11 734 2020
19147 212 216 49 134 14 1060 2918
19149 207 211 89 245 10 1655 4557
19155 218 218 77 211 08 1198 3299
19161 241 281 54 148 07 562 1547
19163 202 216 31 85 09 351 966
19167 239 257 82 226 18 3080 8479
19193 272 272 64 176 27 3710 10214
19195 240 284 45 125 07 181 497
19197 244 289 64 175 05 444 1222
Counties might not require irrigation if not listed in the table
Green water contributes the most to the overall water footprint in both Case 1 and Case 2 and its relative conshytribution is significantly larger in Case 3 (Fig 7) due to the climate differences between GA and IA In particular GA has higher evapotransporation than IA28 Additionally green and blue water in Case 1 and Case 2 represent only the portion of water allocated to corn stover and the water use in the biorefinery whereas in Case 3 the results
represent all water associated with the entire above-ground switchgrass plant in addition to biorefi nery blue water use (Fig 7)
Grey water for the corn stover cases (Case 1 and Case 2) is attributable to the fraction of fertilizer required durshying the corn growth and supplemental fertilizer applicashytion to replace nutrients lost with stover removal Th e average grey water in Case 1 and Case 2 is estimated at
copy 2013 Society of Chemical Industry and John Wiley amp Sons Ltd | Biofuels Bioprod Bioref 7282ndash302 (2013) DOI 101002bbb 293
AM Argo et al Modeling and Analysis Biochemical biorefinery sizing and environmental sustainability impacts
Table 7 Nitrogen fertilizer application rate on stover (Cases 1 and 2) at Iowa and switchgrass at Georgia (Case 3) The unit is in kg N per stover or switchgrass harvested acreage
FIPS (IA) Case 1 Supplement Case 2 Supplement Corn FIPS (GA) Case 3 SWG FIPS (GA) Case 3 SWG Fertilizer Fertilizer Fertilizer Fertilizer Fertilizer
kgac kgac kgac kgac kgac
19001 1289 1289 5468 13001 6586 13201 ndash
19005 1052 1052 5521 13005 7048 13207 7800
19049 1232 1292 5509 13051 ndash 13251 7800
19003 1098 1098 2671 13003 7522 13205 ndash
19051 522 522 5692 13053 ndash 13253 ndash
19053 700 700 2671 13055 6745 13255 ndash
19055 1367 1406 5966 13057 ndash 13257 ndash
19007 608 608 5532 13007 ndash 13209 5834
19009 1821 1821 5485 13009 ndash 13211 7800
19011 1384 1440 5965 13011 3545 13213 7800
19013 1330 1392 5963 13013 ndash 13215 ndash
19015 1597 1620 5815 13015 7800 13217 5853
19017 1571 1609 5967 13017 7539 13219 7800
19019 956 982 5982 13019 7044 13221 7800
19021 1645 1725 5364 13021 6709 13223 ndash
19023 1616 1830 5875 13023 6921 13225 7800
19025 1605 1825 5388 13025 5840 13227 ndash
19027 1838 2116 5448 13027 6279 13229 6622
19029 1593 1593 2671 13029 6983 13231 6561
19031 1355 1407 5898 13031 6179 13233 7800
19033 1652 1889 5845 13033 7800 13235 6318
19035 1790 1928 2671 13035 ndash 13237 ndash
19037 1323 1336 5925 13037 ndash 13239 ndash
19039 436 436 5467 13039 ndash 13241 5845
19041 1636 1713 5644 13043 6090 13243 ndash
19043 1474 1474 5683 13045 4767 13245 ndash
19045 1156 1161 5976 13047 7800 13247 ndash
19047 1862 1862 2671 13049 ndash 13249 7800
19057 1296 1332 6044 13059 ndash 13259 7772
19059 1504 1512 5598 13061 7800 13261 7800
19061 1352 1352 5829 13063 ndash 13263 ndash
19063 1602 1641 5757 13065 5840 13265 ndash
19065 1355 1410 5845 13067 ndash 13267 5838
19067 1595 1824 5866 13069 5819 13269 7101
19069 1789 2142 5937 13071 ndash 13271 7239
19071 1292 1292 2671 13073 ndash 13273 7800
19073 1697 1998 5417 13075 ndash 13275 7080
19075 1742 1851 5973 13077 7800 13277 7456
19077 1314 1314 5481 13079 ndash 13279 6483
19079 1641 1672 6036 13081 7223 13281 5289
294 copy 2013 Society of Chemical Industry and John Wiley amp Sons Ltd | Biofuels Bioprod Bioref 7282ndash302 (2013) DOI 101002bbb
Modeling and Analysis Biochemical biorefinery sizing and environmental sustainability impacts AM Argo et al
Table 7 (Continued)
FIPS (IA) Case 1 Supplement Fertilizer
Case 2 Supplement Fertilizer
Corn Fertilizer
FIPS (GA) Case 3 SWG Fertilizer
FIPS (GA) Case 3 SWG Fertilizer
kgac kgac kgac kgac kgac
19081 1707 1904 6040 13083 ndash 13283 6959
19083 1603 1645 6081 13085 ndash 13285 ndash
19085 1363 1363 2671 13087 ndash 13287 6841
19087 1264 1264 5711 13089 ndash 13289 6691
19089 1375 1446 5828 13091 7367 13291 4111
19091 1804 2169 5880 13093 5814 13293 ndash
19093 1849 2033 2671 13095 ndash 13295 7800
19095 1287 1287 5943 13097 ndash 13297 5853
19097 1074 1074 6033 13099 ndash 13299 6652
19099 1724 1839 5901 13101 ndash 13301 6875
19101 1202 1202 5663 13103 7800 13303 6871
19103 1159 1159 5931 13105 7150 13305 5827
19105 1118 1135 5955 13107 5819 13307 7800
19107 1314 1314 5854 13109 7800 13309 ndash
19109 1618 1627 6018 13111 ndash 13311 6007
19111 1014 1014 5794 13113 ndash 13313 ndash
19113 1000 1008 5949 13115 ndash 13315 7610
19115 1239 1289 5961 13117 5289 13317 7800
19117 526 526 5408 13119 7800 13319 7800
19119 1690 1751 2671 13121 ndash 13321 7656
19121 1089 1089 5466 13123 ndash
19123 1295 1316 5713 13125 5835
19125 1251 1251 5476 13127 ndash
19127 1840 2052 5988 13129 7800
19129 1474 1474 2671 13131 ndash
19131 1775 2109 5944 13133 7800
19133 1364 1375 2671 13135 ndash
19135 751 751 5297 13137 5845
19137 1339 1339 2671 13139 5929
19139 1280 1369 5996 13141 ndash
19141 1697 1708 2671 13143 ndash
19143 1688 1705 2671 13145 ndash
19145 1178 1178 2671 13147 7800
19147 1570 1599 5642 13149 7800
19149 1535 1561 2671 13151 7800
19151 1683 1737 5619 13153 7424
19153 1308 1405 5641 13155 7480
19155 1616 1616 2671 13157 5853
19157 1548 1577 5930 13159 ndash
19159 540 540 2671 13161 6724
19161 1784 2078 5364 13163 7196
copy 2013 Society of Chemical Industry and John Wiley amp Sons Ltd | Biofuels Bioprod Bioref 7282ndash302 (2013) DOI 101002bbb 295
AM Argo et al Modeling and Analysis Biochemical biorefinery sizing and environmental sustainability impacts
Table 7 (Continued)
FIPS (IA) Case 1 Supplement Case 2 Supplement Corn FIPS (GA) Case 3 SWG FIPS (GA) Case 3 SWG Fertilizer Fertilizer Fertilizer Fertilizer Fertilizer
kgac kgac kgac kgac kgac
19163 1494 1596 6000 13165 7800
19165 1660 1660 2671 13167 6271
19167 1766 1899 2671 13169 ndash
19169 1561 1566 5996 13171 ndash
19171 1512 1514 5978 13173 6469
19173 629 629 2671 13175 7213
19175 737 737 5467 13177 7800
19177 646 646 5418 13179 ndash
19179 1099 1099 5455 13181 ndash
19181 1290 1290 5467 13183 5844
19183 1665 1708 5824 13185 5868
19185 552 552 2671 13187 4895
19187 1664 1668 5703 13189 ndash
19189 1599 1599 5909 13191 ndash
19191 1249 1253 5793 13193 7800
19193 2013 2013 2671 13195 5853
19195 1778 2102 5841 13197 7800
19197 1803 2136 6081 13199 7800
Figure 6 Blue water footprint of cellulosic ethanol produced from corn stover (Cases 1 and 2) and switchgrass (Case 3) by production stage at refinery scale of 2000 DMTday in 2017
850 and 820 gallons water per gallon ethanol respecshytively The average grey water in Case 3 which accounts for assimilating the total fertilizer applied during the entire growth period is only 210 gallons water per galshylon ethanol Results clearly indicate the unique ability of switchgrass to capture nutrient runoff in addition to lower fertilizer input requirements thereby reducing grey
Figure 7 Green and grey water footprint of cellulosic ethashynol produced from corn stover (Cases 1 and 2) and switch-grass (Case 3) by production stage at refinery scale of 2000 DMTday in 2017
water loadings Historically switchgrass has been used in conservation programs to contain the fertilizer loss to water body from crop land
At the same refinery capacity choice of feedstock and location could have significant impacts on types of water footprint of the cellulosic biofuel Since a majority of
296 copy 2013 Society of Chemical Industry and John Wiley amp Sons Ltd | Biofuels Bioprod Bioref 7282ndash302 (2013) DOI 101002bbb
Modeling and Analysis Biochemical biorefinery sizing and environmental sustainability impacts AM Argo et al
Figure 8 County-level distributions of blue green and grey water footprint for a 2000 DMTd biorefinery in 2017 to produced biofuel from (a) corn stover grown in Iowa via advanced logistic system (Case 2) and (b) switchgrass grown in Georgia via advanced logistic system (Case 3)
water requirements in the biofuel life cycle are from the feedstock growing stage the water footprint of a particushylar biofuel is largely determined by regional climate For example with the same advanced logistic system cellushylosic ethanol produced from switchgrass in biorefi neries located in Georgia (Case 3) requires 39 less blue water footprint than that for Iowa stover in Case 2 (Fig 6) Since the total water requirement for crop growth would be satshyisfied either from rainfall (green water) or irrigation (blue water) lower green water footprint often means increased blue water footprint for the same plant species (Fig 8)
Switchgrass is a high yield perennial which requires substantial evapotransporation to support its growth Switchgrass can be cultivated in many regions in the USA without irrigation and thus producing rain-fed switch-grass could have less impact on regional blue water use than other crops requiring irrigation
Biorefinery water supply is entirely blue water and biorefinery water demand is concentrated in a single local area Thus a biorefinery built in an area where the local feedstock is blue-water-intensive would likely lead to an increased burden on the local water resources as compare to a biorefinery built in an area with less blue-watershyintensive feedstocks Therefore it is environmentally benshyeficial to develop switchgrass or other perennial feedstock
plantations in regions with sufficient green water supply to ensure sustainable water use for the feedstock and the biorefi nery
From a whole biorefinery production perspective the resource needs for blue water becomes more pronounced as biorefinery scale increases Further CBS logistics systems dictate that the biorefinery be located near the biomass feedstock production whereas AUD logistics effectively decouple biorefinery location from feedstock production Therefore we expect that CBS logistics would stress a local water resource to a greater extent than AUD logistics Figure 8 further shows the extensive geographishycal variability of blue andf green water footprint even within a state which would affect the choice of feedstock thereby influence the refinery siting consideration
Sustainability metrics and life cycle assessment
SimaPro v73 life cycle assessment modeling soft ware was used to develop and link unit processes using estabshylished methods36 In the absence of primary publicly available data we used the Ecoinvent v20 and to a lesser extent the US Life Cycle Inventory (US LCI) processes We modified the Ecoinvent processes to be refl ective of
copy 2013 Society of Chemical Industry and John Wiley amp Sons Ltd | Biofuels Bioprod Bioref 7282ndash302 (2013) DOI 101002bbb 297
AM Argo et al Modeling and Analysis Biochemical biorefinery sizing and environmental sustainability impacts
Figure 9 GHG emi ssions LCA results for Case 1 Iowa corn stover CBS Case 2 Iowa corn stover AUD and Case 3 Georgia switchgrass AUD
US conditions and the US LCI processes to account for embodied emissions and energy fl ows
Modeling approach and assumptions
The modeling boundary for this study is from fi eld to refinery gate including embodied energy and material flows using the methods described elsewhere36 Th e funcshytional unit is 1 gallon of ethanol produced in the year 2017 Avoided impacts are accounted for using product displacement (also termed boundary system expansion)15
For products that share inputs (eg corn grain and corn stover) burdens are allocated between products based on a lsquoproduct-purposersquo approach Inputs to multi-year cropping systems (ie switchgrass) are likewise annualized by the length of the cropping rotation Impacts from direct and indirect land use change are not considered in this study Feedstock processing and transport are modeled accordshying to INLrsquos CBS and AUD
LCA modeling results
A breakdown of the GHG emission (in terms of CO2 equivalent) for each of the cases is displayed graphically in Fig 9 When comparing AUD to CBS moderate increases in GHG emissions observed in the Iowa corn stover
biochemical conversion-to-ethanol are associated with additional field-to-depot and depot-to-terminal transporshytation steps (lsquoPre-processing otherrsquo category in Fig 9) and increased transportation contribution to the biorefi nery (lsquoFeedstock transportationrsquo category) The small increases in normalized (per gallon of ethanol) electricity credit with increasing biorefinery scale are associated with increased electricity generation efficiency As expected we observe small feedstock differences in GHG emissions for Iowa corn stover and Georgia switchgrass
Conclusions
As expected we demonstrated that CBS has lower average logistics costs than AUD AUD logistic costs are higher than CBS costs primarly due to increased pre-processing costs and increased transportation costs (with multiple transportation step) Likewise and similar to earlier studshyies3 we also show that with CBS logistic costs increase as either biorefinery capacity or feedstock collection radius increase AUD mitigates many of the CBS feedstock-supshyply risks and while resulting in modestly higher logistics costs dramatically reduces both the temporal and spatial biomass-cost variability and allows access to substantially larger quantities of biomass
298 copy 2013 Society of Chemical Industry and John Wiley amp Sons Ltd | Biofuels Bioprod Bioref 7282ndash302 (2013) DOI 101002bbb
Modeling and Analysis Biochemical biorefinery sizing and environmental sustainability impacts AM Argo et al
1 AUD effectively disconnects the feedstock from the biorefinery in terms of both scale and location Single or multiple terminals can supply single or multiple biorefineries of varying scale Biorefi nery locations can be optimized for logistics distribution water resources or other project-specifi c constraints
2 AUD promotes more sustainable cropping practices whereas with CBS there is always pressure to produce the same crop
3 AUD providers have much tighter control on biomass production specifications than is possible with CBS
Iowa corn stover supply costs with CBS increase as biorefinery capacity increases from 500 to 2000 DMTday however the biorefinery economy-of-scale impact is larger in magnitude and the overall MESP decreases from $345 gal to $248gal going from 500 to 2000 DMTday bioreshyfinery scale It must be noted that CBS was not considered for biorefinery capacities of 5000 DMT or greater as the existing models do not capture the substantial additional infrastructure required to manage the high throughput of trucks through the biorefi nery
Iowa corn stover supply costs with the AUD are conshystant for biorefineries ranging from 500 to gt10 000 DMT day and as a result the MESP is reduced from $372gal to $225gal Similar to Iowa corn stover Georgia switch-grass feedstock supply costs are constant using the AUD for biorefineries ranging from 500 to 5000 DMTday however for biorefineries larger than ~5000 DMTday the terminal-to-biorefinery distance needs to be increased from 100 miles to 300 miles to supply the larger capacishyties As a result the MESP for Georgia decreases from $337gal to approximately $204gal as the biorefi nery capacity is increased from 500 DMTday to 10 000 DMT day Only small if any cost reductions are expected for capacities greater than 10 000 DMTday Results of this study show that biochemical ethanol production using a CBS results in the lowest MESP at small biorefi nery scales At larger biorefineries (gt5000 DMTday) these analyses suggest that AUD logistics result in producshytion costs lower than those possible with conventional systems
Our results show no detrimental effects on water sustainability metrics when comparing AUD to CBS Nevertheless feedstock location and feedstock type do affect water use and quality so if biorefineries use diff ershyent feedstocks or pull feedstocks from diff erent locations than those modeled here the results will change Th is study also did not consider the local impact on water resources when siting a large biorefinery We expect that
large biorefineries such as those enabled by the AUD will require a water footprint commensurate to their scale and hence may stress the water resources of a specifi c area where the biorefinery is located
Our results show that AUD logistics result in modestly higher GHG emissions (10ndash15) than CBS mainly due to additional field-to-depot and depot-to-terminal transporshytation (lsquoPre-processing otherrsquo category in Fig 9) steps and increased transportation contribution to the biorefi nery (lsquoFeedstock transportationrsquo category)
One potential issue not addressed in this work is that biomass resulting from AUD pre-processing are subshystantially changed physically and potentially chemically compared to materials collected using CBS (eg lignin is plasticized) This may aff ect biorefinery yield operability and production costs and thus future work will need to experimentally verify and quantify biochemical convershysion of these materials and adapt the modelsanalyses accordingly
Acknowledgement
We thank the US Department of Energy for funding and supporting this work
References 1 US DOE US Billion-Ton Update Biomass Supply for
a Bioenergy and Bioproducts Industry USDOE report no ORNLTM-2011224 lead by Perlack RD and Stokes BJ United States Department of Energy and Oak Ridge National Laboratory Oak Ridge TN pp 227 (2011)
2 Riley C and Schell D Technical and Economic Analysis of an Enzymatic Hydrolysis Based Ethanol Plant internal report Solar Energy Research Institute Golden CO (1991)
3 Aden A Ruth M Ibsen K Jechura J Neeves K Sheehan J et al Lignocellulosic Biomass to Ethanol Process Design and Economics Utilizing Co-Current Dilute Acid Prehydrolysis and Enzymatic Hydrolysis for Corn Stover report no NREL TP-510-32438 National Renewable Energy Laboratory Golden CO pp 154 (2002)
4 Humbird D Davis R Tao L Kinchin C Hsu D Aden A et al Process Design and Economics for the Conversion of Lignocellulosic Biomass to Ethanol Dilute-Acid Pretreatment and Enzymatic Hydrolysis of Corn Stover report no NREL TP-510-47764 National Renewable Energy Laboratory Golden CO pp 147 (2011)
5 Searcy E Wright C Muth D Hess JR and Jacobson J The Limits of a 50 Mile Collection Radius for Biomass Supply to a Biorefi nery draft report Idaho National Laboratory Idaho Falls ID (2010)
6 Hess JR Wright CT Kenney KL and Searcy EM Uniform-Format Solid Feedstock Supply System A Commodity-Scale Design to Produce and Infrastructure-Compaible Bulk Solid from Lignocellulosic Biomass ndash Executive Summary report no INLEXT-09-15423 Idaho National Laboratory Idaho Falls ID (2009)
copy 2013 Society of Chemical Industry and John Wiley amp Sons Ltd | Biofuels Bioprod Bioref 7282ndash302 (2013) DOI 101002bbb 299
AM Argo et al Modeling and Analysis Biochemical biorefinery sizing and environmental sustainability impacts
7 Jacobson JJ and Searcy EM Uniform-Format Feedstock Supply System Design for Woody Biomass Presented at the Spring Conference of the AICHe Orlando FL April (2010)
8 Langholtz M Graham RC Eaton L Perlack R Hellwinckel C and De la Torre Ugarte D Price projections of feedstocks for biofuels and biopower in the US Energy Policy41484ndash493 (2012)
9 USDA NASS Agricultural Prices Paid US [Online] Department of Agriculture National Agricultural Statistics Service Available at httpusdamannlibcornelledu MannUsdaviewDocumentInfododocumentID =1002 [September 19 2012]
10 USDA-OCEWAOB Agricultural Projects to 2018 Long-term Projections Report OCE-2010-1 US Department of Agriculture and Office of the Chief Economist World Agricultural Outlook Board Washington DC (2009)
11 US Congress Energy Independence and Security Act of 2007 110th Congress 1st Session HR 6 4 (2007)
12 US EIA Annual Energy Outlook 2010 Report No DOEEIAshy0383 US Energy Information Administration Washington DC (2010)
13 Wu M Chiu YW and Demissie Y Quantifying the regional water footprint of biofuel production by incorporatshying hydrologic modeling Water Resrouce Research DOI1010292011WR011809 (2012)
14 NOAA NCDC 1971-2000 US Climate Normals Products Clim 84 Daily Normals [Online] NOAA National Climate Data Center Available at httpwwwncdcnoaagov [September 19 2012]
15 Wang M Huo H and Arora S Methods of dealing with coshyproducts of biofuels in life-cycle analysis and consequent results within the US context Energy Policy 395726ndash5736 (2011)
16 USDA 2002 Census of Agriculture US Department of Agriculture Washington DC (2004)
17 USDA 2007 Census of Agriculture US Department of Agriculture Washington DC (2010)
18 USDA 2008 Farm and Ranch Irrigation Report No AC-02-SS-1 US Department of Agriculture Washington DC (2009)
19 USDA 2003 Farm and Ranch Irrigation Survey Report No AC-02-SS-1 US Department of Agriculture Washington DC (2004)
20 USGS Water Use in the United States 1985 1990 and 1995 [Online] US Geological Survey Available at httpwaterusgs govwatuse [September 19 2012]
21 High Plains Regional Climate Center Crop Coeffi cients for Corn [Online] Available at httpwwwhprccunleduawdn etcropcrop_corntxt [September 19 2012]
22 Marek T Colaizzi P Howell TA Dusek D and Porter D Estimating Seasonal Crop ET Using Calendar and Heat Unit Based Crop Coefficients in the Texas High Plains Evapotranspiration Network Presented at 2006 ASAE Annual Meeting American Society of Agricultural and Biological Engineers Portland OR pp 9ndash12 (2006)
23 Kiniry J Lynd L Greene N Johnson M Casler M and Laser MS Biofuels and water use Comparison of maize and switch-grass and general perspectives new research on biofuels ed by Wright JH and Evans DA Nova Science Publishing New York ( 2008 )
24 Kiniry JR Tischler CR and Van Esbroeck GA Radiation use efficiency and leaf CO2 exchange for diverse C4 grasses Biomass Bioenerg 17(2)95ndash112 (1999)
25 Grassini P Yang H and Cassman KG Limits to maize proshyductivity in western corn-belt A simulation analysis for fully irrigated and rainfed conditions Agr Forest Meteor 1491254ndash 1265 (2009 )
26 Hoos AB and McMahon G Spatial analysis of instream nitroshygen loads and factors controlling nitrogen delivery to streams in the Southeastern United States using spatially referenced regression on watershed attributes (SPARROW) and regional classifi cation frameworks Hydrol Process 232275ndash2294 (2009)
27 Hoos AB Terziotti S McMahon G Savvas K Tighe KC and Alkons-Wolinsky R Data to Support Statistical Modeling of Instream Nutrient Load Based on Watershed Attributes Southeastern United States 2002 US Geological Survey pp 50 (2008)
28 Demissie Y Yan E and Wu M Assessing regional hydrology and water quality implications of large-scale biofuel feedstock production in the Upper Mississippi river basin Environ Sci Technol 469174ndash9182 (2012)
29 Wu M Demissie Y and Yan E Simulated impact of future bioshyfuel production on water quality and water cycle dynamics in the Upper Mississippi river basin Biomass Bioenerg 4144ndash56 (2012)
30 Smith RA Alexander RB and Schwarz GE Natural backshyground concentrations of nutrients in streams and rivers of the conterminous United States Environ Sci Technol 373039ndash 3047 (2003)
31 Chiu YW and Wu M Assessing county-level water footprints of different cellulosic-biofuel feedstock pathways Environ Sci Technol 469155ndash9162 (2012)
32 White PJ CORN Chemistry and Technology 2nd edn ed byWhite PJ and Johnson LA American Association of Cereal Chemists Inc St Paul MN (2003)
33 Wu M and Peng MJ Developing a tool to estimate water withshydrawal and consumption in electricity generation in the United States Report No ANLESD11-2 update Argonne National Laboratory (2011)
34 ANL TTRDC GREET Model [Online] Argonne National Laboratory Transportation Technology RampD Center Chicago IL Available at httpgreetesanlgovindex phpcontent= power_water [August 21 2012]
35 Wu M Mintz M Wang M and Arora S Water consumption in the production of ethanol and petroleum gasoline Environ Manage 44981ndash997 (2009)
36 Hsu DD Inman D Heath GA Wolfrum EJ Mann MK and Aden A Life cycle environmental impacts of selected US ethanol production and use pathways in 2022 Environ Sci Technol 445289ndash5297 (2010)
300 copy 2013 Society of Chemical Industry and John Wiley amp Sons Ltd | Biofuels Bioprod Bioref 7282ndash302 (2013) DOI 101002bbb
Modeling and Analysis Biochemical biorefinery sizing and environmental sustainability impacts AM Argo et al
Andrew Argo
Dr Andrew Argo is senior engineer in the system integration group at the National Renewable Energy Laboratoshyry His work supports the Department of Energy Biomass Program in the areas of strategic systemlevel analysis and integrated biorefinery projects monitoring
Eric C D Tan
Dr Tan is a Senior Research Engineer in the Biorefinery Analysis Group of the National Bioenergy Center at the National Renewable National Laborashytory (NREL) His research interests include the process design economshyics and sustainability for conversion of lignocellulosic biomass to biofuels
with particular emphasis on the application of techno-economic analysis and life cycle assessment methods He also has broad experience in chemically reacting flow simulation and heterogeneous catalysis
Daniel Inman
Dr Daniel Inman is a research scienshytist at the National Renewable Energy Laboratory in Golden Colorado His primary research interests are centered on the sustainability biofuel producshytion and use He is currently involved in several modeling projects including lifecycle assessment of multiple biofushy
els and using system dynamics to examine the growth of the cellulosic biofuels industry
Matthew H Langholtz
Dr Matthew Langholtz is a Natural Resource Economist in the Bioenergy Group at Oak Ridge National Laborashytory He is principle investigator (PI) of the Resource Analysis Project of the Bioenergy Group at Oak Ridge Nationshyal Lab as well as the Short-Rotation Woody Crop Sustainability project His
research interests include biomass resource economics short-rotation woody crops and bioenergy from forest resources He has worked on valuation of non-market externalities and developed biomass supply curves for commercial projects the South and the United States
Laurence M Eaton
Laurence Eaton is a Research Scientist at the Oak Ridge National Laborashytory in the Bioenergy Resource and Engineering Systems Group of the Environmental Sciences Division An economist by training he conducts research to support bioenergy foreshycasting and analysis using economic
land use models and Geographic Information Science He participates in interdisciplinary Resource Assessment activities to support the efficient and sustainable supply of agricultural and forestry resources for commercial domestic bioenergy and bioproducts markets He has worked in the area of applied microeconomics as it reshylates to bioenergy firm input decisions and the valuation of environmental goods and ecological services
Jacob J Jacobson
Mr Jacobson is a researcher from the Idaho National Laboratory He has a diverse background in systems analysis system dynamics statistical consulting software development and project management His work has been in the development and analysis of decision support systems to evalushy
ate policy options and business risks of complex energy and environmental systems His recent work has been in the area of analysis of biomass feedstock logistics
Christopher T Wright
Dr Chris Wright is manager and a senior research engineer for the Idaho National Laboratoryrsquos Biofuels and Reshynewable Energy Department His work supports the Department of Energy Biomass Program in developing analyshysis tools and technology for feedstock supply logistics and conversion of bioshy
mass to valuable fuels chemicals materials and power His knowledge of DOErsquos Biomass Program includes an emphasis on lignocellulosic feedstock supply systems which includes feedstock characterization development preprocessing handling and transportation issues assoshyciated with refining biomass into fuels and chemicals
copy 2013 Society of Chemical Industry and John Wiley amp Sons Ltd | Biofuels Bioprod Bioref 7282ndash302 (2013) DOI 101002bbb 301
AM Argo et al Modeling and Analysis Biochemical biorefinery sizing and environmental sustainability impacts
David J Muth Jr
Dr Dave Muth is a Research Engishyneer at the Idaho National Laboratory in Biofuels and Renewable Energy Technologies He leads the Analysis and Sustainability Group with the Bioenergy Research Team developshying models and modeling techniques which facilitate the evaluation the
feedstock assembly system as it pertains to creating advanced biofuels He is currently working as a contracshytor to the US Department of Energy Office of Biomass Programs located at DOE Headquarters supporting the establishment of technical objectives and research tarshygets for next generation feedstock supply and logistics systems that deliver high quality biomass feedstocks for advanced hydrocarbon fuel production
May M Wu
Dr May Wu a principal energy systems analyst at Argonne National Laborashytory is the PI of biofuel sustainability research funded by the US Departshyment of Energy Her research interests are in the area of water quality and water quantity associated with large-scale development of biofuel convenshy
tional fuel electricity and emerging fuels and life cycle analysis Dr Wu is leading the effort to develop tools and largescale watershed models to assess spatially explicit water footprint of biofuel produced from conventional cellulosic and advanced feedstock and impact of proshyjected future production on regional nutrient sediment and hydrology Dr Wu served as an expert advisor to the Water Working Group of the Council on Sustainable Biomass Production (CSBP)
Yi-Wen Chiu
Dr Yi-Wen Chiu is a postdoctoral apshypointee in the Energy System Division at the Argonne National Laboratory As an interdisciplinary scientist her main research interests are to understand the coupling and interaction of human and natural systems by applying inteshygrated modeling tools She has been
involved in research related to water footprint and water-energy nexus with broad interests related to scenario analysis and environmental impact assessment She also participates in several studies aiming to advance biofuels by determining the feasible pathways of achieving water sustainability goals
Robin L Graham
Dr Robin L Graham is Deputy Associate Laboratory Director for the Computing Environment and Life Science Directorate at the Argonne National Laboratory Formerly at Oak Ridge National Laboratory she worked in the Bioenergy field for many years pioneering biomass feedstock
resource assessments that incorporated both economic and environmental factors She was an author of the original ldquoBillion Tonrdquo study and contributed to its 2011 follow-up An ecosystem ecologist by training she has long been interested in developing sustainable natural resources and began her career working for the RampD Division of Weyerhaeuser Co She currently is leading Argonnersquos Biological and Environmental Science Initiashytive which aims to accelerate our understanding of the fundamental design principles in biological and environshymental systems
302 copy 2013 Society of Chemical Industry and John Wiley amp Sons Ltd | Biofuels Bioprod Bioref 7282ndash302 (2013) DOI 101002bbb

AM Argo et al Modeling and Analysis Biochemical biorefinery sizing and environmental sustainability impacts
Figure 1 Engineering design schematic of the CBS
to field-side storage stacks where they are protected with tarps When needed at the biorefinery bales are delivered via flatbed semi-trucks to biorefinery short-term storage At the biorefinery the bales are queued as needed through a grinding process that reduces the feedstock to frac14-inch particle size bulk material This bulk material is then fed into the conversion reactor
Constraints
One of the major drawbacks of the CBS design is that it provides limited opportunity to stabilize material or alter material specifications which means that only material containing less than 15 moisture which meets the conversion process moisture specification should be baled This constraint limits the availability of feedstocks and impacts system performance across climate ranges different harvest seasons and diff erent crops
In the case of switchgrass moisture at harvest can be managed primarily by delaying cutting of the crop until the material has dried appropriately However a corn stover harvest presents a very different challenge as stover
F igure 2 Moisture content of bales entering storage was vastly different for each year according to an INL-conducted northwest Iowa storage study (internal INL data not included here)
is a secondary crop to the corn grain The harvest window and subsequently the material properties of the stover at harvest is driven by grain harvest decisions
286 copy 2013 Society of Chemical Industry and John Wiley amp Sons Ltd | Biofuels Bioprod Bioref 7282ndash302 (2013) DOI 101002bbb
Modeling and Analysis Biochemical biorefinery sizing and environmental sustainability impacts AM Argo et al
Climate conditions have a major impact on the fi eld drying of stover Figure 2 shows moisture distribution as measured in an INL storage study of bales that were collected in northwest Iowa in 2009 and 2010 In 2010 approximately 95 of the bales collected met the CBS criteria of 15 moisture or below whereasin 2009 more than 97 of the bales collected were at 25 moisture or above Moving and storing material with high-moisture content significantly impacts stability and logistics costs
Analysis parameters
The logistics assessments for the CBS in this analysis are limited to 2000 DMTday and smaller biorefi neries because the current system design cannot be scaled to larger biorefineries without significant design changes across multiple elements For example an entirely new infrastructure would be required to support and manage movement of 60 or more trucks per hour as required in the large biorefinery capacity scenarios Following is a breakshydown of model parameters used in the Case 1 logistics analyses
bull 10 -year average assessment Using 10 years of harvest progress data coupled with climate data and fi eld dr ying data an analysis was performed to develop a 10-year average assessment of the corn stover availshyable to bale in Iowa at 15 moisture Th e resultant algorithm was tested against Boone County in the center of Iowa and showed that on average approxishymately 36 of the corn stover acres could be baled at 15 moisture or below This percentage was used to set the 10-year average for Iowa that was used in the Case 1 logistics analysis Itrsquos important to note that calculating an impact of climate across years or for larger geographical areas can result in an average that does not necessarily represent individual years in the dataset
bull Harvesting system The analysis accounts for collecshytion limitations stemming from using a multi-pass harvest system to collect corn stover in CBS INL fi eld tests demonstrated that collection rate is capped at 672 DMTha by the practical limits for this type of equipshyment Harvest windows of 19 harvest days are also assumed for the conventional system
bull Field-side storage Collection system models assume field-side storage at a fi xed stack size The distance to the stack input into the collection model is determined by using the county yield and implementing a radial geometric mean formula to establish the transport distance from the field to the local stack Storage
system bale stacks are assumed to be 2000 DMT Th e moisture content of the bales when put into storage is assumed to be 15 Dr y matter losses in storage are modeled at 5
bull Transportation to biorefi nery Transportation disshytance to the biorefinery is solved through a series of spatial operations First the feedstock density for a given county is normalized with the density of all counshyties that have area within a 25-mile radius of the subject countyrsquos centroid This normalization is performed to simulate the potential movement of feedstock across county boundaries for delivery to the biorefi nery Th e density calculation accounting for yield and acres parshyticipating in stover collection provides a DMTmile2
density With the normalized feedstock density calcushylated for the county a radial geometric mean formula is employed to establish an average biorefi nery transport distance for the county
bull Biorefi ner y pre-processing Pre-processing operations in the CBS are exclusively performed within the bioreshyfinery gates A two-stage grinder is used in the model to size-reduce the stover bales to frac14-inch material which is then fed through an even-flow queuing system and fed to the biochemical conversion reactor
Case 1 results
Using INLrsquos BLM the various supply system composhynents ndash harvest collection and transportation ndash were systematically run for the available biomass from each of the counties within Iowa The total supply costs were estimated by summing all of the system components Th e results of the statewide county-by-county analysis are shown in Fig 3
As can be seen in Fig 3 there is a wide range of logisshytics costs (approximately $45ndash$88DMT) using the CBS (Case 1) Cost variations are mainly due to low-yield areas which in turn have a high impact on the overall logistics costs
Case 2 and Case 3 AUD analyses
The AUD system utilizes equipment and processes that are in some cases commercially available now and in others at bench and pilot scales and will likely be comshymercially available in 2017 In the latter case production-sized equipment is scaled from current bench and pilot scale data
In an AUD process (Fig 4) a single-pass har vesting system collects the grain and corn stover at the same time and the corn stover is fed directly to a baler Th e corn
copy 2013 Society of Chemical Industry and John Wiley amp Sons Ltd | Biofuels Bioprod Bioref 7282ndash302 (2013) DOI 101002bbb 287
AM Argo et al Modeling and Analysis Biochemical biorefinery sizing and environmental sustainability impacts
Figure 3 Breakdown of total Case 1 and 2 logistics costs for each county in Iowa based on removable stover limits and total Case 3 logistics costs for each county in Georgia based on removable switchgrass limits
Figure 4 The AUD supply system uses distributed pre-processing depots to stabilize and densify feedstock providshying a lignocellulosic commodity material compatible with the infrastructure
288 copy 2013 Society of Chemical Industry and John Wiley amp Sons Ltd | Biofuels Bioprod Bioref 7282ndash302 (2013) DOI 101002bbb
Modeling and Analysis Biochemical biorefinery sizing and environmental sustainability impacts AM Argo et al
stover bales are collected and moved to fi eld-side stacks where they are protected with plastic wrap and stored Plastic wrap was chosen to protect the bales because of the concern that the high moisture content would lead to unacceptable dry matter losses if the bales were proshytected with tarps similar to that in Case 1 When needed stacks are delivered via flatbed semi-trucks to the depot for short-term storage and processing Again as needed the bales are sent through a drying grinding and denshysification process that dries the material to lt10 moisshyture reduces the feedstock to frac14-inch particle size bulk material and then densifies the material to a pellet with density gt30 lbft3 Th e densified material is then shipped to the terminal for blending and later transported to the biorefi nery
Analysis parameters
The key feature of AUD is the pre-processing of biomass at an early stage in the supply system (Fig 4) Pre-processing depots produce a final uniform material that is compatible with the grain storage and handling infrastructure
bull Field-side storage Collection system models assume field-side storage at a fixed stack size The distance to the stack input into the collection model is determined by using the county yield and implementing a radial geometric mean formula to establish the transport disshytance from the field to the local stack
bull Bale moisture content Storage system bale stacks are assumed to be 2000 DMT Moisture content of the bales when put into storage is assumed to be gt20 due to baling of the material directly from the combine without field drying Due to the high moisture content the bales are wrapped in plastic to reduce the dry matshyter losses Dry matter losses in storage are modeled at 78
bull Trucking feedstock from field-side to depot Depot size is based on the throughput capacity of the grinder which is the most capital-intensive piece of equipment at the depot The transportation distance is solved through a series of spatial operations much like the fi eld-side-to-biorefinery delivery in a CBS
bull Tr uck ing from depot to blend ing ter mina l This distance is again solved through a series of spatia l operations based on a terminal size of 3 600 000 DMTyear
bull Shipping by rail from blending terminal to biorefi nshyery This operation is based on a predetermined disshytance of 100 miles since by rail the majority of costs are fixed and the variable cost per mile is minimal
In Case 3 the logistics design in Georgia assumes that the feedstock is 100 switchgrass For the 7500 and 10 000 DMTday biorefi nery-capacity scenarios the terminal-toshybiorefinery distance was increased to 300 miles to accomshymodate the need for feedstock outside of Georgia
The AUD feedstock design incorporates a blending facilshyity (terminal) where different feedstocks can be blended to meet a conversion facilityrsquos feedstock design requirements
AUDrsquos impact is that the average supply system cost is higher but the spatial and temporal variability are much lower Where a CBS has low control over delivered bioshymass feedstock specifications AUD has high control Also AUD is able to access material from low-yield counties that would typically be stranded and not able to enter the supply system at aff ordable costs
Case 2 results
Case 2 uses the AUD for corn stover collection in Iowa The results of the county-by-county analysis of feedstock logistics costs are shown in Fig 3 Th e figure shows that while on average the total logistic cost is higher the range of variability ($66ndash$85 per DMT) is lower than that for the CBS ($45ndash$88 per DMT)
Case 3 results
Case 3 uses the AUD for switchgrass in Georgia Th e results of the county-by-county analysis of feedstock logisshytics costs are shown in Fig 3 Th e figure shows that while on the average the total logistics cost is higher the range of variability of the total cost is relatively low ($64ndash$117 per DMT) and much less for the AUD that for the CBS (intershynal INL data not included here)
Overall logistics results
The overall conclusions regarding the effects of feedstock logistics design on total cost are the following
bull The CBS demonstrates high spatial variability in costs even in highly productive regions such as Iowa Th e local ranges in feedstock cost were from $45 to $88 per DMT Additionally the CBS has very limited control on the feedstock specifications delivered to the biorefi nery
The AUD has higher average supply system costs but it does demonstrate reduced spatial and temporal varishyability The average costs were much more stable ranging from $66 to $85 per DMT for Iowa corn stover Th e AUD also allows material from areas with low yields to enter into the system whereas under the conventional supply
copy 2013 Society of Chemical Industry and John Wiley amp Sons Ltd | Biofuels Bioprod Bioref 7282ndash302 (2013) DOI 101002bbb 289
AM Argo et al Modeling and Analysis Biochemical biorefinery sizing and environmental sustainability impacts
Table 3 Breakdown of feedstock logistics costs by unit operations for CBS and AUD system designs in Boone County IA (a b) and AUD system design in Telfair County GA (c)
a) Conventional bale system costs in Boone County IA for 2000 DMTday biorefi nery
Harvest amp Storage Transportation Preprocessing Handling amp Total Collection (~45 km) Queuing Logistics
$1561 $595 $886 $1494 $083 $4620
b) Advanced uniform system costs in Boone County IA
Harvest amp Storage Depot Transport Depot Terminal Transport Terminal Biorefi nery Handling Total Collection (~17 km) Preprocessing (~80 km) Transport (~170 km) amp Queuing Logistics
$1615 $660 $601 $2479 $314 $154 $895 $083 $6801
c) Advanced uniform system costs in Telfair County GA
Harvest amp Storage Depot Transport Depot Terminal Transport Terminal Biorefi nery Handling Total Collection (~17 km) Preprocessing (~80 km) Transport (~170 km) amp Queuing Logistics
$1637 $554 $623 $2329 $496 $154 $895 $083 $6771
Table 4 Summary of feedstock and average logistics costs (weight averaged) used in biorefinery sizing and sustainability study
Distance to Biorefi nery Size Grower Payment Logistics Total Feedstock Case Location Feed Logistics Biorefi nery (mi) (DMTd) ($DMT) ($DMT) Cost ($DMT)
1 IA Corn stover CBS 15 500 $4689 $4481 $9170
21 1000 $4689 $4540 $9229
30 2000 $4689 $4620 $9309
2 IA Corn stover AUD 100 500 to 10000 $4690 $6801 $11491
3 GA SWG AUD 100 500 to 5000 $3393 $6771 $10164
300 7500 to 10000 $3393 $7377 $10770
system these resources would be stranded and inaccesshysible An example of the breakdown of total logistics cost for all cases are included in Table 3 AUD pre-processing costs are higher than those for CBS costs mainly because of higher pre-processing costs (drying pellitization) and additional transportation steps
Feedstock supply and logistics summary
A summary of the feedstock supply costs (grower payment + average logistic costs) for the work included in this study is displayed in Table 4 Using CBS logistics for Iowa corn stover (Case 1) the feedstock supply cost increases with increasing biorefinery size as a greater collection radius is required In contrast using AUD logistics for Iowa corn stover (Case 2) biorefinery capacities in excess of 10 000 DMTday are possible with a terminal located 100 miles from the biorefinery thus the feedstock supply cost is constant for Case 2 Similarly the feedstock supply cost
is constant for biorefinery capacities ranging from 500 to 5000 DMTday for Georgia switchgrass (Case 3) However at biorefinery capacities of 7500 and 10 000 DMTday for Georgia switchgrass a larger cropping area and thus a larger terminal-to-biorefinery distance (300 miles) is required
Conversion to ethanol
Conversion methods
Techno-economic analyses for the biochemical process of making ethanol from corn stover or switchgrass were pershyformed by scaling the biochemical process design model for corn stover that was developed at NREL4
For this study we assumed that the feedstock convertshyibility is the same for similar feedstock types (ie corn stover and switchgrass) as well as between the feedstock formats (ie CBS and AUD) All conversion data are based on those reported for corn stover (using CBS)4 using the feedstock composition data displayed in Table 5
290 copy 2013 Society of Chemical Industry and John Wiley amp Sons Ltd | Biofuels Bioprod Bioref 7282ndash302 (2013) DOI 101002bbb
Xylan 1953 2250
Moisture 12 15
Modeling and Analysis Biochemical biorefinery sizing and environmental sustainability impacts AM Argo et al
Table 5 Corn stover and switchgrass compositions used for this study
IA Corn Stover GA SwitchgrassComponent (dry wt ) (dry wt )
Glucan 3505 3500
Lignin 1576 2260
Ash 493 330
Acetate 181 180
Protein 310 120
Extractives 1465 970
Arabinan 238 310
Galactan 143 050
Mannan 060 030
Sucrose 077 000
Total structural carbohydrates 5899 6140
IA Corn Stover (bulk GA Switchgrass wt) (bulk wt)
The minimum ethanol selling prices (MESP) to give a 10 after-tax internal rate of return were calculated using a standard discounted cash flow rate of return analysis and the financial assumptions included in an earlier NREL report4
Results
Figure 5 shows the breakdown of the MESP (biorefi nery only) as a function of biorefinery plant size for each case
In all cases MESP decreases as biorefi nery size increased AUD logistics and processing costs are essenshytially constant for Iowa corn stover thus rising feedstock costs do not limit the economies-of-scale for biorefi neries in excess of 10 000 DMTday In the case of lower-yielding feedstock (county-yield) such as Georgia switchgrass increases in feedstock costs start to balance biorefi nery economies-of-scale at biorefinery capacities in excess of gt5000 DMTday
Due to the higher logistics costs the MESP for AUD corn stover (Case 2) is approximately $025gal higher than that for CBS (Case 1) at small biorefinery capacities (lt2000 DMT day) However this study suggests that increasing the bioreshyfinery size to 5000 DMTday will more than offset the MESP increase associated with more expensive AUD pre-processed feedstock Biorefinery capacities in excess of 10 000 DMT day are only possible with AUD and the resulting MESPs are substantially lower than that with CBS
As the biorefinery size increases from 500 to 10 000 DMTday with AUD logistics the MESP decreases from $372 to $225 per gallon for IA-corn stover and $337 to $204 per gallon for GA-switchgrass The lower MESP for switchgrass compared to that for corn stover is attributed to lower feedstock cost higher ethanol yield and higher byproduct electricity credit
Water
In this section the water resource use and the impact on water quality are analyzed Water resource analysis
Figure 5 M inimum ethanol selling price (MESP) as a function of plant size
copy 2013 Society of Chemical Industry and John Wiley amp Sons Ltd | Biofuels Bioprod Bioref 7282ndash302 (2013) DOI 101002bbb 291
AM Argo et al Modeling and Analysis Biochemical biorefinery sizing and environmental sustainability impacts
focuses on the consumptive use of rainfall (green water) and of surface and ground water (blue water) through irrigation and process water use Water quality analysis focuses on discharged water from fields containing fertishylizer and process water discharge (grey water) Th e water footprint for the three types of water is considered for the feedstock growing stage and conversion stage for the procshyess described earlier Detailed methodologies of the water footprint assessment for the green blue and grey water are described elsewhere13 30
Data sources and assumptions
We used public data sources for this work including govshyernment reports and open literature In the case that data were not available we relied on a combination of model simulation and statistical regression We assumed that soil moisture level is sufficient to meet the lowest water demand for switchgrass so that irrigation is not required in the state of Georgia
Climate irrigation crop and nutrient loading data
Water footprint calculation relies heavily on climate agricultural and hydrological data All of the climate data used in this study were derived from the National Climate Data Center of NOAA for the period from 1970 to 200014 Agricultural data for crop harvested acreshyage were from USDA NASS15 Irrigation application data were acquired from the 2002 and 2007 Census of Agriculture16 17 and the Farm and Ranch Irrigation Survey18 19 published by the USDA and USGS20 Th e crop coeffi cient Kc used in estimating evapotranspiration (ET the loss of water from the soil by evaporation and by transpiration from the crops) was compiled from the High Plains Regional Climate Center21 the Texas High Plains Evapotranspiration network22 and the previous studies of Kiniry et al2324 Climate in 2017 was assumed to remain the same as the historical average from 1970 to 2000 However the irrigation demand was further adjusted from historical values to reflect the increase of corn acreage and yield25 (Table 6) Nitrogen loading (data not included here) a key component of interest in grey water in IA and GA was estimated using results from SPARROW model26 27 Nitrogen fertilizer input rates for switchgrass were estimated by POLYSYS Regular corn field fertilizer input were simulated by a SWAT hydrologic model based on USDA state-level data28 29 while s upshyplemental fertilizer inputs were provided by POLYSYS A natural background nitrogen concentration CN was
compiled from USGS30 Nutrient loading for SWG was estimated from alfalfa27 Based on the historical monitorshying data sets for total nitrogen and nitrate (USGS30) CN is assumed to be 95 of the total nitrogen concentration in stream water Nitrogen fertilizer input data are included in Table 7 A comparison of the SWAT and SPARROW model in the studied areas showed good agreement for average values while SPARROW projected less veriabilishyties31 All of the watershed-scale calculations in this study were further converted into county-level data using the zonal statistics tool in ArcGIS
Water allocation
Corn plants produce grain and stover both of which can be used as biofuel feedstock During its growth corn grain and stover each appropriate a fraction of the total water requirement The same fraction was assumed in partionshying the water footprint associated with stover based biofuel production The blue water and green water of corn is partitioned between grain and stover by applying a crop harvest index32
Conversion process water use
Consumptive water use at the biorefinery is estimated from the process model described earlier Depending on the production scale and feedstock the normalized procshyess water use ranges from 53 to 56 LL ethanol produced The conversion process water is supplied from surface and ground water sources and therefore its use contributes only to the blue water footprint
In the conversion process more bio-electricity is proshyduced than that needed for the biorefinery and thus the excess power is sold to the grid A water use credit from the export electricity is considered using a system expanshysion approach Electricity generation water consumption factors from electricity generation mix in IA (05279 gal waterKwh) and GA (06403 gal waterKwh) were adopted from a Power-Water tool3334
Results
In general the blue water footprint of corn stover- and of switchgrass-derived ethanol ranged from 43 to 73 gal per gallon ethanol (Fig 6) similar to that of conventional oil sands production35 Switchgrass-derived ethanol (Case 3) requires less blue water than corn stover-derived ethanol (Case 1 or 2) because of savings from switchgrass irrigashytion Export bioelectricity contributes a 1 galgal water credit to the blue water footprint reducing total blue water use by 12ndash20
292 copy 2013 Society of Chemical Industry and John Wiley amp Sons Ltd | Biofuels Bioprod Bioref 7282ndash302 (2013) DOI 101002bbb
Modeling and Analysis Biochemical biorefinery sizing and environmental sustainability impacts AM Argo et al
Table 6 Projected corn irrigation volume by 2017
FIPS Case 1 Case 2 Case 1 Case 2 Irrigated Area
Fraction Case 1 Case 2
Corn Yield Harvested Acreage Irrigation Water Use Volume
DMTac 1000 Acre MGY
19017 212 217 29 81 06 282 777
19033 223 255 55 152 06 443 1220
19057 175 180 19 52 18 487 1339
19059 203 204 30 84 08 412 1135
19065 183 191 62 170 06 557 1533
19067 215 246 43 119 07 418 1150
19071 175 175 29 79 32 1663 4579
19077 178 178 37 102 14 852 2346
19081 231 257 50 139 07 520 1431
19085 184 184 65 179 121 13714 37756
19099 233 248 41 112 06 292 803
19103 157 157 45 123 13 695 1913
19109 219 220 48 131 06 401 1104
19111 137 137 14 38 14 264 726
19115 167 174 31 84 50 2504 6895
19119 228 237 61 169 07 927 2552
19125 169 169 25 70 07 328 902
19127 249 277 57 158 06 458 1260
19131 240 285 49 135 09 554 1525
19133 184 186 41 114 216 19403 53420
19139 173 185 31 85 26 1146 3156
19143 228 230 39 109 11 734 2020
19147 212 216 49 134 14 1060 2918
19149 207 211 89 245 10 1655 4557
19155 218 218 77 211 08 1198 3299
19161 241 281 54 148 07 562 1547
19163 202 216 31 85 09 351 966
19167 239 257 82 226 18 3080 8479
19193 272 272 64 176 27 3710 10214
19195 240 284 45 125 07 181 497
19197 244 289 64 175 05 444 1222
Counties might not require irrigation if not listed in the table
Green water contributes the most to the overall water footprint in both Case 1 and Case 2 and its relative conshytribution is significantly larger in Case 3 (Fig 7) due to the climate differences between GA and IA In particular GA has higher evapotransporation than IA28 Additionally green and blue water in Case 1 and Case 2 represent only the portion of water allocated to corn stover and the water use in the biorefinery whereas in Case 3 the results
represent all water associated with the entire above-ground switchgrass plant in addition to biorefi nery blue water use (Fig 7)
Grey water for the corn stover cases (Case 1 and Case 2) is attributable to the fraction of fertilizer required durshying the corn growth and supplemental fertilizer applicashytion to replace nutrients lost with stover removal Th e average grey water in Case 1 and Case 2 is estimated at
copy 2013 Society of Chemical Industry and John Wiley amp Sons Ltd | Biofuels Bioprod Bioref 7282ndash302 (2013) DOI 101002bbb 293
AM Argo et al Modeling and Analysis Biochemical biorefinery sizing and environmental sustainability impacts
Table 7 Nitrogen fertilizer application rate on stover (Cases 1 and 2) at Iowa and switchgrass at Georgia (Case 3) The unit is in kg N per stover or switchgrass harvested acreage
FIPS (IA) Case 1 Supplement Case 2 Supplement Corn FIPS (GA) Case 3 SWG FIPS (GA) Case 3 SWG Fertilizer Fertilizer Fertilizer Fertilizer Fertilizer
kgac kgac kgac kgac kgac
19001 1289 1289 5468 13001 6586 13201 ndash
19005 1052 1052 5521 13005 7048 13207 7800
19049 1232 1292 5509 13051 ndash 13251 7800
19003 1098 1098 2671 13003 7522 13205 ndash
19051 522 522 5692 13053 ndash 13253 ndash
19053 700 700 2671 13055 6745 13255 ndash
19055 1367 1406 5966 13057 ndash 13257 ndash
19007 608 608 5532 13007 ndash 13209 5834
19009 1821 1821 5485 13009 ndash 13211 7800
19011 1384 1440 5965 13011 3545 13213 7800
19013 1330 1392 5963 13013 ndash 13215 ndash
19015 1597 1620 5815 13015 7800 13217 5853
19017 1571 1609 5967 13017 7539 13219 7800
19019 956 982 5982 13019 7044 13221 7800
19021 1645 1725 5364 13021 6709 13223 ndash
19023 1616 1830 5875 13023 6921 13225 7800
19025 1605 1825 5388 13025 5840 13227 ndash
19027 1838 2116 5448 13027 6279 13229 6622
19029 1593 1593 2671 13029 6983 13231 6561
19031 1355 1407 5898 13031 6179 13233 7800
19033 1652 1889 5845 13033 7800 13235 6318
19035 1790 1928 2671 13035 ndash 13237 ndash
19037 1323 1336 5925 13037 ndash 13239 ndash
19039 436 436 5467 13039 ndash 13241 5845
19041 1636 1713 5644 13043 6090 13243 ndash
19043 1474 1474 5683 13045 4767 13245 ndash
19045 1156 1161 5976 13047 7800 13247 ndash
19047 1862 1862 2671 13049 ndash 13249 7800
19057 1296 1332 6044 13059 ndash 13259 7772
19059 1504 1512 5598 13061 7800 13261 7800
19061 1352 1352 5829 13063 ndash 13263 ndash
19063 1602 1641 5757 13065 5840 13265 ndash
19065 1355 1410 5845 13067 ndash 13267 5838
19067 1595 1824 5866 13069 5819 13269 7101
19069 1789 2142 5937 13071 ndash 13271 7239
19071 1292 1292 2671 13073 ndash 13273 7800
19073 1697 1998 5417 13075 ndash 13275 7080
19075 1742 1851 5973 13077 7800 13277 7456
19077 1314 1314 5481 13079 ndash 13279 6483
19079 1641 1672 6036 13081 7223 13281 5289
294 copy 2013 Society of Chemical Industry and John Wiley amp Sons Ltd | Biofuels Bioprod Bioref 7282ndash302 (2013) DOI 101002bbb
Modeling and Analysis Biochemical biorefinery sizing and environmental sustainability impacts AM Argo et al
Table 7 (Continued)
FIPS (IA) Case 1 Supplement Fertilizer
Case 2 Supplement Fertilizer
Corn Fertilizer
FIPS (GA) Case 3 SWG Fertilizer
FIPS (GA) Case 3 SWG Fertilizer
kgac kgac kgac kgac kgac
19081 1707 1904 6040 13083 ndash 13283 6959
19083 1603 1645 6081 13085 ndash 13285 ndash
19085 1363 1363 2671 13087 ndash 13287 6841
19087 1264 1264 5711 13089 ndash 13289 6691
19089 1375 1446 5828 13091 7367 13291 4111
19091 1804 2169 5880 13093 5814 13293 ndash
19093 1849 2033 2671 13095 ndash 13295 7800
19095 1287 1287 5943 13097 ndash 13297 5853
19097 1074 1074 6033 13099 ndash 13299 6652
19099 1724 1839 5901 13101 ndash 13301 6875
19101 1202 1202 5663 13103 7800 13303 6871
19103 1159 1159 5931 13105 7150 13305 5827
19105 1118 1135 5955 13107 5819 13307 7800
19107 1314 1314 5854 13109 7800 13309 ndash
19109 1618 1627 6018 13111 ndash 13311 6007
19111 1014 1014 5794 13113 ndash 13313 ndash
19113 1000 1008 5949 13115 ndash 13315 7610
19115 1239 1289 5961 13117 5289 13317 7800
19117 526 526 5408 13119 7800 13319 7800
19119 1690 1751 2671 13121 ndash 13321 7656
19121 1089 1089 5466 13123 ndash
19123 1295 1316 5713 13125 5835
19125 1251 1251 5476 13127 ndash
19127 1840 2052 5988 13129 7800
19129 1474 1474 2671 13131 ndash
19131 1775 2109 5944 13133 7800
19133 1364 1375 2671 13135 ndash
19135 751 751 5297 13137 5845
19137 1339 1339 2671 13139 5929
19139 1280 1369 5996 13141 ndash
19141 1697 1708 2671 13143 ndash
19143 1688 1705 2671 13145 ndash
19145 1178 1178 2671 13147 7800
19147 1570 1599 5642 13149 7800
19149 1535 1561 2671 13151 7800
19151 1683 1737 5619 13153 7424
19153 1308 1405 5641 13155 7480
19155 1616 1616 2671 13157 5853
19157 1548 1577 5930 13159 ndash
19159 540 540 2671 13161 6724
19161 1784 2078 5364 13163 7196
copy 2013 Society of Chemical Industry and John Wiley amp Sons Ltd | Biofuels Bioprod Bioref 7282ndash302 (2013) DOI 101002bbb 295
AM Argo et al Modeling and Analysis Biochemical biorefinery sizing and environmental sustainability impacts
Table 7 (Continued)
FIPS (IA) Case 1 Supplement Case 2 Supplement Corn FIPS (GA) Case 3 SWG FIPS (GA) Case 3 SWG Fertilizer Fertilizer Fertilizer Fertilizer Fertilizer
kgac kgac kgac kgac kgac
19163 1494 1596 6000 13165 7800
19165 1660 1660 2671 13167 6271
19167 1766 1899 2671 13169 ndash
19169 1561 1566 5996 13171 ndash
19171 1512 1514 5978 13173 6469
19173 629 629 2671 13175 7213
19175 737 737 5467 13177 7800
19177 646 646 5418 13179 ndash
19179 1099 1099 5455 13181 ndash
19181 1290 1290 5467 13183 5844
19183 1665 1708 5824 13185 5868
19185 552 552 2671 13187 4895
19187 1664 1668 5703 13189 ndash
19189 1599 1599 5909 13191 ndash
19191 1249 1253 5793 13193 7800
19193 2013 2013 2671 13195 5853
19195 1778 2102 5841 13197 7800
19197 1803 2136 6081 13199 7800
Figure 6 Blue water footprint of cellulosic ethanol produced from corn stover (Cases 1 and 2) and switchgrass (Case 3) by production stage at refinery scale of 2000 DMTday in 2017
850 and 820 gallons water per gallon ethanol respecshytively The average grey water in Case 3 which accounts for assimilating the total fertilizer applied during the entire growth period is only 210 gallons water per galshylon ethanol Results clearly indicate the unique ability of switchgrass to capture nutrient runoff in addition to lower fertilizer input requirements thereby reducing grey
Figure 7 Green and grey water footprint of cellulosic ethashynol produced from corn stover (Cases 1 and 2) and switch-grass (Case 3) by production stage at refinery scale of 2000 DMTday in 2017
water loadings Historically switchgrass has been used in conservation programs to contain the fertilizer loss to water body from crop land
At the same refinery capacity choice of feedstock and location could have significant impacts on types of water footprint of the cellulosic biofuel Since a majority of
296 copy 2013 Society of Chemical Industry and John Wiley amp Sons Ltd | Biofuels Bioprod Bioref 7282ndash302 (2013) DOI 101002bbb
Modeling and Analysis Biochemical biorefinery sizing and environmental sustainability impacts AM Argo et al
Figure 8 County-level distributions of blue green and grey water footprint for a 2000 DMTd biorefinery in 2017 to produced biofuel from (a) corn stover grown in Iowa via advanced logistic system (Case 2) and (b) switchgrass grown in Georgia via advanced logistic system (Case 3)
water requirements in the biofuel life cycle are from the feedstock growing stage the water footprint of a particushylar biofuel is largely determined by regional climate For example with the same advanced logistic system cellushylosic ethanol produced from switchgrass in biorefi neries located in Georgia (Case 3) requires 39 less blue water footprint than that for Iowa stover in Case 2 (Fig 6) Since the total water requirement for crop growth would be satshyisfied either from rainfall (green water) or irrigation (blue water) lower green water footprint often means increased blue water footprint for the same plant species (Fig 8)
Switchgrass is a high yield perennial which requires substantial evapotransporation to support its growth Switchgrass can be cultivated in many regions in the USA without irrigation and thus producing rain-fed switch-grass could have less impact on regional blue water use than other crops requiring irrigation
Biorefinery water supply is entirely blue water and biorefinery water demand is concentrated in a single local area Thus a biorefinery built in an area where the local feedstock is blue-water-intensive would likely lead to an increased burden on the local water resources as compare to a biorefinery built in an area with less blue-watershyintensive feedstocks Therefore it is environmentally benshyeficial to develop switchgrass or other perennial feedstock
plantations in regions with sufficient green water supply to ensure sustainable water use for the feedstock and the biorefi nery
From a whole biorefinery production perspective the resource needs for blue water becomes more pronounced as biorefinery scale increases Further CBS logistics systems dictate that the biorefinery be located near the biomass feedstock production whereas AUD logistics effectively decouple biorefinery location from feedstock production Therefore we expect that CBS logistics would stress a local water resource to a greater extent than AUD logistics Figure 8 further shows the extensive geographishycal variability of blue andf green water footprint even within a state which would affect the choice of feedstock thereby influence the refinery siting consideration
Sustainability metrics and life cycle assessment
SimaPro v73 life cycle assessment modeling soft ware was used to develop and link unit processes using estabshylished methods36 In the absence of primary publicly available data we used the Ecoinvent v20 and to a lesser extent the US Life Cycle Inventory (US LCI) processes We modified the Ecoinvent processes to be refl ective of
copy 2013 Society of Chemical Industry and John Wiley amp Sons Ltd | Biofuels Bioprod Bioref 7282ndash302 (2013) DOI 101002bbb 297
AM Argo et al Modeling and Analysis Biochemical biorefinery sizing and environmental sustainability impacts
Figure 9 GHG emi ssions LCA results for Case 1 Iowa corn stover CBS Case 2 Iowa corn stover AUD and Case 3 Georgia switchgrass AUD
US conditions and the US LCI processes to account for embodied emissions and energy fl ows
Modeling approach and assumptions
The modeling boundary for this study is from fi eld to refinery gate including embodied energy and material flows using the methods described elsewhere36 Th e funcshytional unit is 1 gallon of ethanol produced in the year 2017 Avoided impacts are accounted for using product displacement (also termed boundary system expansion)15
For products that share inputs (eg corn grain and corn stover) burdens are allocated between products based on a lsquoproduct-purposersquo approach Inputs to multi-year cropping systems (ie switchgrass) are likewise annualized by the length of the cropping rotation Impacts from direct and indirect land use change are not considered in this study Feedstock processing and transport are modeled accordshying to INLrsquos CBS and AUD
LCA modeling results
A breakdown of the GHG emission (in terms of CO2 equivalent) for each of the cases is displayed graphically in Fig 9 When comparing AUD to CBS moderate increases in GHG emissions observed in the Iowa corn stover
biochemical conversion-to-ethanol are associated with additional field-to-depot and depot-to-terminal transporshytation steps (lsquoPre-processing otherrsquo category in Fig 9) and increased transportation contribution to the biorefi nery (lsquoFeedstock transportationrsquo category) The small increases in normalized (per gallon of ethanol) electricity credit with increasing biorefinery scale are associated with increased electricity generation efficiency As expected we observe small feedstock differences in GHG emissions for Iowa corn stover and Georgia switchgrass
Conclusions
As expected we demonstrated that CBS has lower average logistics costs than AUD AUD logistic costs are higher than CBS costs primarly due to increased pre-processing costs and increased transportation costs (with multiple transportation step) Likewise and similar to earlier studshyies3 we also show that with CBS logistic costs increase as either biorefinery capacity or feedstock collection radius increase AUD mitigates many of the CBS feedstock-supshyply risks and while resulting in modestly higher logistics costs dramatically reduces both the temporal and spatial biomass-cost variability and allows access to substantially larger quantities of biomass
298 copy 2013 Society of Chemical Industry and John Wiley amp Sons Ltd | Biofuels Bioprod Bioref 7282ndash302 (2013) DOI 101002bbb
Modeling and Analysis Biochemical biorefinery sizing and environmental sustainability impacts AM Argo et al
1 AUD effectively disconnects the feedstock from the biorefinery in terms of both scale and location Single or multiple terminals can supply single or multiple biorefineries of varying scale Biorefi nery locations can be optimized for logistics distribution water resources or other project-specifi c constraints
2 AUD promotes more sustainable cropping practices whereas with CBS there is always pressure to produce the same crop
3 AUD providers have much tighter control on biomass production specifications than is possible with CBS
Iowa corn stover supply costs with CBS increase as biorefinery capacity increases from 500 to 2000 DMTday however the biorefinery economy-of-scale impact is larger in magnitude and the overall MESP decreases from $345 gal to $248gal going from 500 to 2000 DMTday bioreshyfinery scale It must be noted that CBS was not considered for biorefinery capacities of 5000 DMT or greater as the existing models do not capture the substantial additional infrastructure required to manage the high throughput of trucks through the biorefi nery
Iowa corn stover supply costs with the AUD are conshystant for biorefineries ranging from 500 to gt10 000 DMT day and as a result the MESP is reduced from $372gal to $225gal Similar to Iowa corn stover Georgia switch-grass feedstock supply costs are constant using the AUD for biorefineries ranging from 500 to 5000 DMTday however for biorefineries larger than ~5000 DMTday the terminal-to-biorefinery distance needs to be increased from 100 miles to 300 miles to supply the larger capacishyties As a result the MESP for Georgia decreases from $337gal to approximately $204gal as the biorefi nery capacity is increased from 500 DMTday to 10 000 DMT day Only small if any cost reductions are expected for capacities greater than 10 000 DMTday Results of this study show that biochemical ethanol production using a CBS results in the lowest MESP at small biorefi nery scales At larger biorefineries (gt5000 DMTday) these analyses suggest that AUD logistics result in producshytion costs lower than those possible with conventional systems
Our results show no detrimental effects on water sustainability metrics when comparing AUD to CBS Nevertheless feedstock location and feedstock type do affect water use and quality so if biorefineries use diff ershyent feedstocks or pull feedstocks from diff erent locations than those modeled here the results will change Th is study also did not consider the local impact on water resources when siting a large biorefinery We expect that
large biorefineries such as those enabled by the AUD will require a water footprint commensurate to their scale and hence may stress the water resources of a specifi c area where the biorefinery is located
Our results show that AUD logistics result in modestly higher GHG emissions (10ndash15) than CBS mainly due to additional field-to-depot and depot-to-terminal transporshytation (lsquoPre-processing otherrsquo category in Fig 9) steps and increased transportation contribution to the biorefi nery (lsquoFeedstock transportationrsquo category)
One potential issue not addressed in this work is that biomass resulting from AUD pre-processing are subshystantially changed physically and potentially chemically compared to materials collected using CBS (eg lignin is plasticized) This may aff ect biorefinery yield operability and production costs and thus future work will need to experimentally verify and quantify biochemical convershysion of these materials and adapt the modelsanalyses accordingly
Acknowledgement
We thank the US Department of Energy for funding and supporting this work
References 1 US DOE US Billion-Ton Update Biomass Supply for
a Bioenergy and Bioproducts Industry USDOE report no ORNLTM-2011224 lead by Perlack RD and Stokes BJ United States Department of Energy and Oak Ridge National Laboratory Oak Ridge TN pp 227 (2011)
2 Riley C and Schell D Technical and Economic Analysis of an Enzymatic Hydrolysis Based Ethanol Plant internal report Solar Energy Research Institute Golden CO (1991)
3 Aden A Ruth M Ibsen K Jechura J Neeves K Sheehan J et al Lignocellulosic Biomass to Ethanol Process Design and Economics Utilizing Co-Current Dilute Acid Prehydrolysis and Enzymatic Hydrolysis for Corn Stover report no NREL TP-510-32438 National Renewable Energy Laboratory Golden CO pp 154 (2002)
4 Humbird D Davis R Tao L Kinchin C Hsu D Aden A et al Process Design and Economics for the Conversion of Lignocellulosic Biomass to Ethanol Dilute-Acid Pretreatment and Enzymatic Hydrolysis of Corn Stover report no NREL TP-510-47764 National Renewable Energy Laboratory Golden CO pp 147 (2011)
5 Searcy E Wright C Muth D Hess JR and Jacobson J The Limits of a 50 Mile Collection Radius for Biomass Supply to a Biorefi nery draft report Idaho National Laboratory Idaho Falls ID (2010)
6 Hess JR Wright CT Kenney KL and Searcy EM Uniform-Format Solid Feedstock Supply System A Commodity-Scale Design to Produce and Infrastructure-Compaible Bulk Solid from Lignocellulosic Biomass ndash Executive Summary report no INLEXT-09-15423 Idaho National Laboratory Idaho Falls ID (2009)
copy 2013 Society of Chemical Industry and John Wiley amp Sons Ltd | Biofuels Bioprod Bioref 7282ndash302 (2013) DOI 101002bbb 299
AM Argo et al Modeling and Analysis Biochemical biorefinery sizing and environmental sustainability impacts
7 Jacobson JJ and Searcy EM Uniform-Format Feedstock Supply System Design for Woody Biomass Presented at the Spring Conference of the AICHe Orlando FL April (2010)
8 Langholtz M Graham RC Eaton L Perlack R Hellwinckel C and De la Torre Ugarte D Price projections of feedstocks for biofuels and biopower in the US Energy Policy41484ndash493 (2012)
9 USDA NASS Agricultural Prices Paid US [Online] Department of Agriculture National Agricultural Statistics Service Available at httpusdamannlibcornelledu MannUsdaviewDocumentInfododocumentID =1002 [September 19 2012]
10 USDA-OCEWAOB Agricultural Projects to 2018 Long-term Projections Report OCE-2010-1 US Department of Agriculture and Office of the Chief Economist World Agricultural Outlook Board Washington DC (2009)
11 US Congress Energy Independence and Security Act of 2007 110th Congress 1st Session HR 6 4 (2007)
12 US EIA Annual Energy Outlook 2010 Report No DOEEIAshy0383 US Energy Information Administration Washington DC (2010)
13 Wu M Chiu YW and Demissie Y Quantifying the regional water footprint of biofuel production by incorporatshying hydrologic modeling Water Resrouce Research DOI1010292011WR011809 (2012)
14 NOAA NCDC 1971-2000 US Climate Normals Products Clim 84 Daily Normals [Online] NOAA National Climate Data Center Available at httpwwwncdcnoaagov [September 19 2012]
15 Wang M Huo H and Arora S Methods of dealing with coshyproducts of biofuels in life-cycle analysis and consequent results within the US context Energy Policy 395726ndash5736 (2011)
16 USDA 2002 Census of Agriculture US Department of Agriculture Washington DC (2004)
17 USDA 2007 Census of Agriculture US Department of Agriculture Washington DC (2010)
18 USDA 2008 Farm and Ranch Irrigation Report No AC-02-SS-1 US Department of Agriculture Washington DC (2009)
19 USDA 2003 Farm and Ranch Irrigation Survey Report No AC-02-SS-1 US Department of Agriculture Washington DC (2004)
20 USGS Water Use in the United States 1985 1990 and 1995 [Online] US Geological Survey Available at httpwaterusgs govwatuse [September 19 2012]
21 High Plains Regional Climate Center Crop Coeffi cients for Corn [Online] Available at httpwwwhprccunleduawdn etcropcrop_corntxt [September 19 2012]
22 Marek T Colaizzi P Howell TA Dusek D and Porter D Estimating Seasonal Crop ET Using Calendar and Heat Unit Based Crop Coefficients in the Texas High Plains Evapotranspiration Network Presented at 2006 ASAE Annual Meeting American Society of Agricultural and Biological Engineers Portland OR pp 9ndash12 (2006)
23 Kiniry J Lynd L Greene N Johnson M Casler M and Laser MS Biofuels and water use Comparison of maize and switch-grass and general perspectives new research on biofuels ed by Wright JH and Evans DA Nova Science Publishing New York ( 2008 )
24 Kiniry JR Tischler CR and Van Esbroeck GA Radiation use efficiency and leaf CO2 exchange for diverse C4 grasses Biomass Bioenerg 17(2)95ndash112 (1999)
25 Grassini P Yang H and Cassman KG Limits to maize proshyductivity in western corn-belt A simulation analysis for fully irrigated and rainfed conditions Agr Forest Meteor 1491254ndash 1265 (2009 )
26 Hoos AB and McMahon G Spatial analysis of instream nitroshygen loads and factors controlling nitrogen delivery to streams in the Southeastern United States using spatially referenced regression on watershed attributes (SPARROW) and regional classifi cation frameworks Hydrol Process 232275ndash2294 (2009)
27 Hoos AB Terziotti S McMahon G Savvas K Tighe KC and Alkons-Wolinsky R Data to Support Statistical Modeling of Instream Nutrient Load Based on Watershed Attributes Southeastern United States 2002 US Geological Survey pp 50 (2008)
28 Demissie Y Yan E and Wu M Assessing regional hydrology and water quality implications of large-scale biofuel feedstock production in the Upper Mississippi river basin Environ Sci Technol 469174ndash9182 (2012)
29 Wu M Demissie Y and Yan E Simulated impact of future bioshyfuel production on water quality and water cycle dynamics in the Upper Mississippi river basin Biomass Bioenerg 4144ndash56 (2012)
30 Smith RA Alexander RB and Schwarz GE Natural backshyground concentrations of nutrients in streams and rivers of the conterminous United States Environ Sci Technol 373039ndash 3047 (2003)
31 Chiu YW and Wu M Assessing county-level water footprints of different cellulosic-biofuel feedstock pathways Environ Sci Technol 469155ndash9162 (2012)
32 White PJ CORN Chemistry and Technology 2nd edn ed byWhite PJ and Johnson LA American Association of Cereal Chemists Inc St Paul MN (2003)
33 Wu M and Peng MJ Developing a tool to estimate water withshydrawal and consumption in electricity generation in the United States Report No ANLESD11-2 update Argonne National Laboratory (2011)
34 ANL TTRDC GREET Model [Online] Argonne National Laboratory Transportation Technology RampD Center Chicago IL Available at httpgreetesanlgovindex phpcontent= power_water [August 21 2012]
35 Wu M Mintz M Wang M and Arora S Water consumption in the production of ethanol and petroleum gasoline Environ Manage 44981ndash997 (2009)
36 Hsu DD Inman D Heath GA Wolfrum EJ Mann MK and Aden A Life cycle environmental impacts of selected US ethanol production and use pathways in 2022 Environ Sci Technol 445289ndash5297 (2010)
300 copy 2013 Society of Chemical Industry and John Wiley amp Sons Ltd | Biofuels Bioprod Bioref 7282ndash302 (2013) DOI 101002bbb
Modeling and Analysis Biochemical biorefinery sizing and environmental sustainability impacts AM Argo et al
Andrew Argo
Dr Andrew Argo is senior engineer in the system integration group at the National Renewable Energy Laboratoshyry His work supports the Department of Energy Biomass Program in the areas of strategic systemlevel analysis and integrated biorefinery projects monitoring
Eric C D Tan
Dr Tan is a Senior Research Engineer in the Biorefinery Analysis Group of the National Bioenergy Center at the National Renewable National Laborashytory (NREL) His research interests include the process design economshyics and sustainability for conversion of lignocellulosic biomass to biofuels
with particular emphasis on the application of techno-economic analysis and life cycle assessment methods He also has broad experience in chemically reacting flow simulation and heterogeneous catalysis
Daniel Inman
Dr Daniel Inman is a research scienshytist at the National Renewable Energy Laboratory in Golden Colorado His primary research interests are centered on the sustainability biofuel producshytion and use He is currently involved in several modeling projects including lifecycle assessment of multiple biofushy
els and using system dynamics to examine the growth of the cellulosic biofuels industry
Matthew H Langholtz
Dr Matthew Langholtz is a Natural Resource Economist in the Bioenergy Group at Oak Ridge National Laborashytory He is principle investigator (PI) of the Resource Analysis Project of the Bioenergy Group at Oak Ridge Nationshyal Lab as well as the Short-Rotation Woody Crop Sustainability project His
research interests include biomass resource economics short-rotation woody crops and bioenergy from forest resources He has worked on valuation of non-market externalities and developed biomass supply curves for commercial projects the South and the United States
Laurence M Eaton
Laurence Eaton is a Research Scientist at the Oak Ridge National Laborashytory in the Bioenergy Resource and Engineering Systems Group of the Environmental Sciences Division An economist by training he conducts research to support bioenergy foreshycasting and analysis using economic
land use models and Geographic Information Science He participates in interdisciplinary Resource Assessment activities to support the efficient and sustainable supply of agricultural and forestry resources for commercial domestic bioenergy and bioproducts markets He has worked in the area of applied microeconomics as it reshylates to bioenergy firm input decisions and the valuation of environmental goods and ecological services
Jacob J Jacobson
Mr Jacobson is a researcher from the Idaho National Laboratory He has a diverse background in systems analysis system dynamics statistical consulting software development and project management His work has been in the development and analysis of decision support systems to evalushy
ate policy options and business risks of complex energy and environmental systems His recent work has been in the area of analysis of biomass feedstock logistics
Christopher T Wright
Dr Chris Wright is manager and a senior research engineer for the Idaho National Laboratoryrsquos Biofuels and Reshynewable Energy Department His work supports the Department of Energy Biomass Program in developing analyshysis tools and technology for feedstock supply logistics and conversion of bioshy
mass to valuable fuels chemicals materials and power His knowledge of DOErsquos Biomass Program includes an emphasis on lignocellulosic feedstock supply systems which includes feedstock characterization development preprocessing handling and transportation issues assoshyciated with refining biomass into fuels and chemicals
copy 2013 Society of Chemical Industry and John Wiley amp Sons Ltd | Biofuels Bioprod Bioref 7282ndash302 (2013) DOI 101002bbb 301
AM Argo et al Modeling and Analysis Biochemical biorefinery sizing and environmental sustainability impacts
David J Muth Jr
Dr Dave Muth is a Research Engishyneer at the Idaho National Laboratory in Biofuels and Renewable Energy Technologies He leads the Analysis and Sustainability Group with the Bioenergy Research Team developshying models and modeling techniques which facilitate the evaluation the
feedstock assembly system as it pertains to creating advanced biofuels He is currently working as a contracshytor to the US Department of Energy Office of Biomass Programs located at DOE Headquarters supporting the establishment of technical objectives and research tarshygets for next generation feedstock supply and logistics systems that deliver high quality biomass feedstocks for advanced hydrocarbon fuel production
May M Wu
Dr May Wu a principal energy systems analyst at Argonne National Laborashytory is the PI of biofuel sustainability research funded by the US Departshyment of Energy Her research interests are in the area of water quality and water quantity associated with large-scale development of biofuel convenshy
tional fuel electricity and emerging fuels and life cycle analysis Dr Wu is leading the effort to develop tools and largescale watershed models to assess spatially explicit water footprint of biofuel produced from conventional cellulosic and advanced feedstock and impact of proshyjected future production on regional nutrient sediment and hydrology Dr Wu served as an expert advisor to the Water Working Group of the Council on Sustainable Biomass Production (CSBP)
Yi-Wen Chiu
Dr Yi-Wen Chiu is a postdoctoral apshypointee in the Energy System Division at the Argonne National Laboratory As an interdisciplinary scientist her main research interests are to understand the coupling and interaction of human and natural systems by applying inteshygrated modeling tools She has been
involved in research related to water footprint and water-energy nexus with broad interests related to scenario analysis and environmental impact assessment She also participates in several studies aiming to advance biofuels by determining the feasible pathways of achieving water sustainability goals
Robin L Graham
Dr Robin L Graham is Deputy Associate Laboratory Director for the Computing Environment and Life Science Directorate at the Argonne National Laboratory Formerly at Oak Ridge National Laboratory she worked in the Bioenergy field for many years pioneering biomass feedstock
resource assessments that incorporated both economic and environmental factors She was an author of the original ldquoBillion Tonrdquo study and contributed to its 2011 follow-up An ecosystem ecologist by training she has long been interested in developing sustainable natural resources and began her career working for the RampD Division of Weyerhaeuser Co She currently is leading Argonnersquos Biological and Environmental Science Initiashytive which aims to accelerate our understanding of the fundamental design principles in biological and environshymental systems
302 copy 2013 Society of Chemical Industry and John Wiley amp Sons Ltd | Biofuels Bioprod Bioref 7282ndash302 (2013) DOI 101002bbb

Modeling and Analysis Biochemical biorefinery sizing and environmental sustainability impacts AM Argo et al
Climate conditions have a major impact on the fi eld drying of stover Figure 2 shows moisture distribution as measured in an INL storage study of bales that were collected in northwest Iowa in 2009 and 2010 In 2010 approximately 95 of the bales collected met the CBS criteria of 15 moisture or below whereasin 2009 more than 97 of the bales collected were at 25 moisture or above Moving and storing material with high-moisture content significantly impacts stability and logistics costs
Analysis parameters
The logistics assessments for the CBS in this analysis are limited to 2000 DMTday and smaller biorefi neries because the current system design cannot be scaled to larger biorefineries without significant design changes across multiple elements For example an entirely new infrastructure would be required to support and manage movement of 60 or more trucks per hour as required in the large biorefinery capacity scenarios Following is a breakshydown of model parameters used in the Case 1 logistics analyses
bull 10 -year average assessment Using 10 years of harvest progress data coupled with climate data and fi eld dr ying data an analysis was performed to develop a 10-year average assessment of the corn stover availshyable to bale in Iowa at 15 moisture Th e resultant algorithm was tested against Boone County in the center of Iowa and showed that on average approxishymately 36 of the corn stover acres could be baled at 15 moisture or below This percentage was used to set the 10-year average for Iowa that was used in the Case 1 logistics analysis Itrsquos important to note that calculating an impact of climate across years or for larger geographical areas can result in an average that does not necessarily represent individual years in the dataset
bull Harvesting system The analysis accounts for collecshytion limitations stemming from using a multi-pass harvest system to collect corn stover in CBS INL fi eld tests demonstrated that collection rate is capped at 672 DMTha by the practical limits for this type of equipshyment Harvest windows of 19 harvest days are also assumed for the conventional system
bull Field-side storage Collection system models assume field-side storage at a fi xed stack size The distance to the stack input into the collection model is determined by using the county yield and implementing a radial geometric mean formula to establish the transport distance from the field to the local stack Storage
system bale stacks are assumed to be 2000 DMT Th e moisture content of the bales when put into storage is assumed to be 15 Dr y matter losses in storage are modeled at 5
bull Transportation to biorefi nery Transportation disshytance to the biorefinery is solved through a series of spatial operations First the feedstock density for a given county is normalized with the density of all counshyties that have area within a 25-mile radius of the subject countyrsquos centroid This normalization is performed to simulate the potential movement of feedstock across county boundaries for delivery to the biorefi nery Th e density calculation accounting for yield and acres parshyticipating in stover collection provides a DMTmile2
density With the normalized feedstock density calcushylated for the county a radial geometric mean formula is employed to establish an average biorefi nery transport distance for the county
bull Biorefi ner y pre-processing Pre-processing operations in the CBS are exclusively performed within the bioreshyfinery gates A two-stage grinder is used in the model to size-reduce the stover bales to frac14-inch material which is then fed through an even-flow queuing system and fed to the biochemical conversion reactor
Case 1 results
Using INLrsquos BLM the various supply system composhynents ndash harvest collection and transportation ndash were systematically run for the available biomass from each of the counties within Iowa The total supply costs were estimated by summing all of the system components Th e results of the statewide county-by-county analysis are shown in Fig 3
As can be seen in Fig 3 there is a wide range of logisshytics costs (approximately $45ndash$88DMT) using the CBS (Case 1) Cost variations are mainly due to low-yield areas which in turn have a high impact on the overall logistics costs
Case 2 and Case 3 AUD analyses
The AUD system utilizes equipment and processes that are in some cases commercially available now and in others at bench and pilot scales and will likely be comshymercially available in 2017 In the latter case production-sized equipment is scaled from current bench and pilot scale data
In an AUD process (Fig 4) a single-pass har vesting system collects the grain and corn stover at the same time and the corn stover is fed directly to a baler Th e corn
copy 2013 Society of Chemical Industry and John Wiley amp Sons Ltd | Biofuels Bioprod Bioref 7282ndash302 (2013) DOI 101002bbb 287
AM Argo et al Modeling and Analysis Biochemical biorefinery sizing and environmental sustainability impacts
Figure 3 Breakdown of total Case 1 and 2 logistics costs for each county in Iowa based on removable stover limits and total Case 3 logistics costs for each county in Georgia based on removable switchgrass limits
Figure 4 The AUD supply system uses distributed pre-processing depots to stabilize and densify feedstock providshying a lignocellulosic commodity material compatible with the infrastructure
288 copy 2013 Society of Chemical Industry and John Wiley amp Sons Ltd | Biofuels Bioprod Bioref 7282ndash302 (2013) DOI 101002bbb
Modeling and Analysis Biochemical biorefinery sizing and environmental sustainability impacts AM Argo et al
stover bales are collected and moved to fi eld-side stacks where they are protected with plastic wrap and stored Plastic wrap was chosen to protect the bales because of the concern that the high moisture content would lead to unacceptable dry matter losses if the bales were proshytected with tarps similar to that in Case 1 When needed stacks are delivered via flatbed semi-trucks to the depot for short-term storage and processing Again as needed the bales are sent through a drying grinding and denshysification process that dries the material to lt10 moisshyture reduces the feedstock to frac14-inch particle size bulk material and then densifies the material to a pellet with density gt30 lbft3 Th e densified material is then shipped to the terminal for blending and later transported to the biorefi nery
Analysis parameters
The key feature of AUD is the pre-processing of biomass at an early stage in the supply system (Fig 4) Pre-processing depots produce a final uniform material that is compatible with the grain storage and handling infrastructure
bull Field-side storage Collection system models assume field-side storage at a fixed stack size The distance to the stack input into the collection model is determined by using the county yield and implementing a radial geometric mean formula to establish the transport disshytance from the field to the local stack
bull Bale moisture content Storage system bale stacks are assumed to be 2000 DMT Moisture content of the bales when put into storage is assumed to be gt20 due to baling of the material directly from the combine without field drying Due to the high moisture content the bales are wrapped in plastic to reduce the dry matshyter losses Dry matter losses in storage are modeled at 78
bull Trucking feedstock from field-side to depot Depot size is based on the throughput capacity of the grinder which is the most capital-intensive piece of equipment at the depot The transportation distance is solved through a series of spatial operations much like the fi eld-side-to-biorefinery delivery in a CBS
bull Tr uck ing from depot to blend ing ter mina l This distance is again solved through a series of spatia l operations based on a terminal size of 3 600 000 DMTyear
bull Shipping by rail from blending terminal to biorefi nshyery This operation is based on a predetermined disshytance of 100 miles since by rail the majority of costs are fixed and the variable cost per mile is minimal
In Case 3 the logistics design in Georgia assumes that the feedstock is 100 switchgrass For the 7500 and 10 000 DMTday biorefi nery-capacity scenarios the terminal-toshybiorefinery distance was increased to 300 miles to accomshymodate the need for feedstock outside of Georgia
The AUD feedstock design incorporates a blending facilshyity (terminal) where different feedstocks can be blended to meet a conversion facilityrsquos feedstock design requirements
AUDrsquos impact is that the average supply system cost is higher but the spatial and temporal variability are much lower Where a CBS has low control over delivered bioshymass feedstock specifications AUD has high control Also AUD is able to access material from low-yield counties that would typically be stranded and not able to enter the supply system at aff ordable costs
Case 2 results
Case 2 uses the AUD for corn stover collection in Iowa The results of the county-by-county analysis of feedstock logistics costs are shown in Fig 3 Th e figure shows that while on average the total logistic cost is higher the range of variability ($66ndash$85 per DMT) is lower than that for the CBS ($45ndash$88 per DMT)
Case 3 results
Case 3 uses the AUD for switchgrass in Georgia Th e results of the county-by-county analysis of feedstock logisshytics costs are shown in Fig 3 Th e figure shows that while on the average the total logistics cost is higher the range of variability of the total cost is relatively low ($64ndash$117 per DMT) and much less for the AUD that for the CBS (intershynal INL data not included here)
Overall logistics results
The overall conclusions regarding the effects of feedstock logistics design on total cost are the following
bull The CBS demonstrates high spatial variability in costs even in highly productive regions such as Iowa Th e local ranges in feedstock cost were from $45 to $88 per DMT Additionally the CBS has very limited control on the feedstock specifications delivered to the biorefi nery
The AUD has higher average supply system costs but it does demonstrate reduced spatial and temporal varishyability The average costs were much more stable ranging from $66 to $85 per DMT for Iowa corn stover Th e AUD also allows material from areas with low yields to enter into the system whereas under the conventional supply
copy 2013 Society of Chemical Industry and John Wiley amp Sons Ltd | Biofuels Bioprod Bioref 7282ndash302 (2013) DOI 101002bbb 289
AM Argo et al Modeling and Analysis Biochemical biorefinery sizing and environmental sustainability impacts
Table 3 Breakdown of feedstock logistics costs by unit operations for CBS and AUD system designs in Boone County IA (a b) and AUD system design in Telfair County GA (c)
a) Conventional bale system costs in Boone County IA for 2000 DMTday biorefi nery
Harvest amp Storage Transportation Preprocessing Handling amp Total Collection (~45 km) Queuing Logistics
$1561 $595 $886 $1494 $083 $4620
b) Advanced uniform system costs in Boone County IA
Harvest amp Storage Depot Transport Depot Terminal Transport Terminal Biorefi nery Handling Total Collection (~17 km) Preprocessing (~80 km) Transport (~170 km) amp Queuing Logistics
$1615 $660 $601 $2479 $314 $154 $895 $083 $6801
c) Advanced uniform system costs in Telfair County GA
Harvest amp Storage Depot Transport Depot Terminal Transport Terminal Biorefi nery Handling Total Collection (~17 km) Preprocessing (~80 km) Transport (~170 km) amp Queuing Logistics
$1637 $554 $623 $2329 $496 $154 $895 $083 $6771
Table 4 Summary of feedstock and average logistics costs (weight averaged) used in biorefinery sizing and sustainability study
Distance to Biorefi nery Size Grower Payment Logistics Total Feedstock Case Location Feed Logistics Biorefi nery (mi) (DMTd) ($DMT) ($DMT) Cost ($DMT)
1 IA Corn stover CBS 15 500 $4689 $4481 $9170
21 1000 $4689 $4540 $9229
30 2000 $4689 $4620 $9309
2 IA Corn stover AUD 100 500 to 10000 $4690 $6801 $11491
3 GA SWG AUD 100 500 to 5000 $3393 $6771 $10164
300 7500 to 10000 $3393 $7377 $10770
system these resources would be stranded and inaccesshysible An example of the breakdown of total logistics cost for all cases are included in Table 3 AUD pre-processing costs are higher than those for CBS costs mainly because of higher pre-processing costs (drying pellitization) and additional transportation steps
Feedstock supply and logistics summary
A summary of the feedstock supply costs (grower payment + average logistic costs) for the work included in this study is displayed in Table 4 Using CBS logistics for Iowa corn stover (Case 1) the feedstock supply cost increases with increasing biorefinery size as a greater collection radius is required In contrast using AUD logistics for Iowa corn stover (Case 2) biorefinery capacities in excess of 10 000 DMTday are possible with a terminal located 100 miles from the biorefinery thus the feedstock supply cost is constant for Case 2 Similarly the feedstock supply cost
is constant for biorefinery capacities ranging from 500 to 5000 DMTday for Georgia switchgrass (Case 3) However at biorefinery capacities of 7500 and 10 000 DMTday for Georgia switchgrass a larger cropping area and thus a larger terminal-to-biorefinery distance (300 miles) is required
Conversion to ethanol
Conversion methods
Techno-economic analyses for the biochemical process of making ethanol from corn stover or switchgrass were pershyformed by scaling the biochemical process design model for corn stover that was developed at NREL4
For this study we assumed that the feedstock convertshyibility is the same for similar feedstock types (ie corn stover and switchgrass) as well as between the feedstock formats (ie CBS and AUD) All conversion data are based on those reported for corn stover (using CBS)4 using the feedstock composition data displayed in Table 5
290 copy 2013 Society of Chemical Industry and John Wiley amp Sons Ltd | Biofuels Bioprod Bioref 7282ndash302 (2013) DOI 101002bbb
Xylan 1953 2250
Moisture 12 15
Modeling and Analysis Biochemical biorefinery sizing and environmental sustainability impacts AM Argo et al
Table 5 Corn stover and switchgrass compositions used for this study
IA Corn Stover GA SwitchgrassComponent (dry wt ) (dry wt )
Glucan 3505 3500
Lignin 1576 2260
Ash 493 330
Acetate 181 180
Protein 310 120
Extractives 1465 970
Arabinan 238 310
Galactan 143 050
Mannan 060 030
Sucrose 077 000
Total structural carbohydrates 5899 6140
IA Corn Stover (bulk GA Switchgrass wt) (bulk wt)
The minimum ethanol selling prices (MESP) to give a 10 after-tax internal rate of return were calculated using a standard discounted cash flow rate of return analysis and the financial assumptions included in an earlier NREL report4
Results
Figure 5 shows the breakdown of the MESP (biorefi nery only) as a function of biorefinery plant size for each case
In all cases MESP decreases as biorefi nery size increased AUD logistics and processing costs are essenshytially constant for Iowa corn stover thus rising feedstock costs do not limit the economies-of-scale for biorefi neries in excess of 10 000 DMTday In the case of lower-yielding feedstock (county-yield) such as Georgia switchgrass increases in feedstock costs start to balance biorefi nery economies-of-scale at biorefinery capacities in excess of gt5000 DMTday
Due to the higher logistics costs the MESP for AUD corn stover (Case 2) is approximately $025gal higher than that for CBS (Case 1) at small biorefinery capacities (lt2000 DMT day) However this study suggests that increasing the bioreshyfinery size to 5000 DMTday will more than offset the MESP increase associated with more expensive AUD pre-processed feedstock Biorefinery capacities in excess of 10 000 DMT day are only possible with AUD and the resulting MESPs are substantially lower than that with CBS
As the biorefinery size increases from 500 to 10 000 DMTday with AUD logistics the MESP decreases from $372 to $225 per gallon for IA-corn stover and $337 to $204 per gallon for GA-switchgrass The lower MESP for switchgrass compared to that for corn stover is attributed to lower feedstock cost higher ethanol yield and higher byproduct electricity credit
Water
In this section the water resource use and the impact on water quality are analyzed Water resource analysis
Figure 5 M inimum ethanol selling price (MESP) as a function of plant size
copy 2013 Society of Chemical Industry and John Wiley amp Sons Ltd | Biofuels Bioprod Bioref 7282ndash302 (2013) DOI 101002bbb 291
AM Argo et al Modeling and Analysis Biochemical biorefinery sizing and environmental sustainability impacts
focuses on the consumptive use of rainfall (green water) and of surface and ground water (blue water) through irrigation and process water use Water quality analysis focuses on discharged water from fields containing fertishylizer and process water discharge (grey water) Th e water footprint for the three types of water is considered for the feedstock growing stage and conversion stage for the procshyess described earlier Detailed methodologies of the water footprint assessment for the green blue and grey water are described elsewhere13 30
Data sources and assumptions
We used public data sources for this work including govshyernment reports and open literature In the case that data were not available we relied on a combination of model simulation and statistical regression We assumed that soil moisture level is sufficient to meet the lowest water demand for switchgrass so that irrigation is not required in the state of Georgia
Climate irrigation crop and nutrient loading data
Water footprint calculation relies heavily on climate agricultural and hydrological data All of the climate data used in this study were derived from the National Climate Data Center of NOAA for the period from 1970 to 200014 Agricultural data for crop harvested acreshyage were from USDA NASS15 Irrigation application data were acquired from the 2002 and 2007 Census of Agriculture16 17 and the Farm and Ranch Irrigation Survey18 19 published by the USDA and USGS20 Th e crop coeffi cient Kc used in estimating evapotranspiration (ET the loss of water from the soil by evaporation and by transpiration from the crops) was compiled from the High Plains Regional Climate Center21 the Texas High Plains Evapotranspiration network22 and the previous studies of Kiniry et al2324 Climate in 2017 was assumed to remain the same as the historical average from 1970 to 2000 However the irrigation demand was further adjusted from historical values to reflect the increase of corn acreage and yield25 (Table 6) Nitrogen loading (data not included here) a key component of interest in grey water in IA and GA was estimated using results from SPARROW model26 27 Nitrogen fertilizer input rates for switchgrass were estimated by POLYSYS Regular corn field fertilizer input were simulated by a SWAT hydrologic model based on USDA state-level data28 29 while s upshyplemental fertilizer inputs were provided by POLYSYS A natural background nitrogen concentration CN was
compiled from USGS30 Nutrient loading for SWG was estimated from alfalfa27 Based on the historical monitorshying data sets for total nitrogen and nitrate (USGS30) CN is assumed to be 95 of the total nitrogen concentration in stream water Nitrogen fertilizer input data are included in Table 7 A comparison of the SWAT and SPARROW model in the studied areas showed good agreement for average values while SPARROW projected less veriabilishyties31 All of the watershed-scale calculations in this study were further converted into county-level data using the zonal statistics tool in ArcGIS
Water allocation
Corn plants produce grain and stover both of which can be used as biofuel feedstock During its growth corn grain and stover each appropriate a fraction of the total water requirement The same fraction was assumed in partionshying the water footprint associated with stover based biofuel production The blue water and green water of corn is partitioned between grain and stover by applying a crop harvest index32
Conversion process water use
Consumptive water use at the biorefinery is estimated from the process model described earlier Depending on the production scale and feedstock the normalized procshyess water use ranges from 53 to 56 LL ethanol produced The conversion process water is supplied from surface and ground water sources and therefore its use contributes only to the blue water footprint
In the conversion process more bio-electricity is proshyduced than that needed for the biorefinery and thus the excess power is sold to the grid A water use credit from the export electricity is considered using a system expanshysion approach Electricity generation water consumption factors from electricity generation mix in IA (05279 gal waterKwh) and GA (06403 gal waterKwh) were adopted from a Power-Water tool3334
Results
In general the blue water footprint of corn stover- and of switchgrass-derived ethanol ranged from 43 to 73 gal per gallon ethanol (Fig 6) similar to that of conventional oil sands production35 Switchgrass-derived ethanol (Case 3) requires less blue water than corn stover-derived ethanol (Case 1 or 2) because of savings from switchgrass irrigashytion Export bioelectricity contributes a 1 galgal water credit to the blue water footprint reducing total blue water use by 12ndash20
292 copy 2013 Society of Chemical Industry and John Wiley amp Sons Ltd | Biofuels Bioprod Bioref 7282ndash302 (2013) DOI 101002bbb
Modeling and Analysis Biochemical biorefinery sizing and environmental sustainability impacts AM Argo et al
Table 6 Projected corn irrigation volume by 2017
FIPS Case 1 Case 2 Case 1 Case 2 Irrigated Area
Fraction Case 1 Case 2
Corn Yield Harvested Acreage Irrigation Water Use Volume
DMTac 1000 Acre MGY
19017 212 217 29 81 06 282 777
19033 223 255 55 152 06 443 1220
19057 175 180 19 52 18 487 1339
19059 203 204 30 84 08 412 1135
19065 183 191 62 170 06 557 1533
19067 215 246 43 119 07 418 1150
19071 175 175 29 79 32 1663 4579
19077 178 178 37 102 14 852 2346
19081 231 257 50 139 07 520 1431
19085 184 184 65 179 121 13714 37756
19099 233 248 41 112 06 292 803
19103 157 157 45 123 13 695 1913
19109 219 220 48 131 06 401 1104
19111 137 137 14 38 14 264 726
19115 167 174 31 84 50 2504 6895
19119 228 237 61 169 07 927 2552
19125 169 169 25 70 07 328 902
19127 249 277 57 158 06 458 1260
19131 240 285 49 135 09 554 1525
19133 184 186 41 114 216 19403 53420
19139 173 185 31 85 26 1146 3156
19143 228 230 39 109 11 734 2020
19147 212 216 49 134 14 1060 2918
19149 207 211 89 245 10 1655 4557
19155 218 218 77 211 08 1198 3299
19161 241 281 54 148 07 562 1547
19163 202 216 31 85 09 351 966
19167 239 257 82 226 18 3080 8479
19193 272 272 64 176 27 3710 10214
19195 240 284 45 125 07 181 497
19197 244 289 64 175 05 444 1222
Counties might not require irrigation if not listed in the table
Green water contributes the most to the overall water footprint in both Case 1 and Case 2 and its relative conshytribution is significantly larger in Case 3 (Fig 7) due to the climate differences between GA and IA In particular GA has higher evapotransporation than IA28 Additionally green and blue water in Case 1 and Case 2 represent only the portion of water allocated to corn stover and the water use in the biorefinery whereas in Case 3 the results
represent all water associated with the entire above-ground switchgrass plant in addition to biorefi nery blue water use (Fig 7)
Grey water for the corn stover cases (Case 1 and Case 2) is attributable to the fraction of fertilizer required durshying the corn growth and supplemental fertilizer applicashytion to replace nutrients lost with stover removal Th e average grey water in Case 1 and Case 2 is estimated at
copy 2013 Society of Chemical Industry and John Wiley amp Sons Ltd | Biofuels Bioprod Bioref 7282ndash302 (2013) DOI 101002bbb 293
AM Argo et al Modeling and Analysis Biochemical biorefinery sizing and environmental sustainability impacts
Table 7 Nitrogen fertilizer application rate on stover (Cases 1 and 2) at Iowa and switchgrass at Georgia (Case 3) The unit is in kg N per stover or switchgrass harvested acreage
FIPS (IA) Case 1 Supplement Case 2 Supplement Corn FIPS (GA) Case 3 SWG FIPS (GA) Case 3 SWG Fertilizer Fertilizer Fertilizer Fertilizer Fertilizer
kgac kgac kgac kgac kgac
19001 1289 1289 5468 13001 6586 13201 ndash
19005 1052 1052 5521 13005 7048 13207 7800
19049 1232 1292 5509 13051 ndash 13251 7800
19003 1098 1098 2671 13003 7522 13205 ndash
19051 522 522 5692 13053 ndash 13253 ndash
19053 700 700 2671 13055 6745 13255 ndash
19055 1367 1406 5966 13057 ndash 13257 ndash
19007 608 608 5532 13007 ndash 13209 5834
19009 1821 1821 5485 13009 ndash 13211 7800
19011 1384 1440 5965 13011 3545 13213 7800
19013 1330 1392 5963 13013 ndash 13215 ndash
19015 1597 1620 5815 13015 7800 13217 5853
19017 1571 1609 5967 13017 7539 13219 7800
19019 956 982 5982 13019 7044 13221 7800
19021 1645 1725 5364 13021 6709 13223 ndash
19023 1616 1830 5875 13023 6921 13225 7800
19025 1605 1825 5388 13025 5840 13227 ndash
19027 1838 2116 5448 13027 6279 13229 6622
19029 1593 1593 2671 13029 6983 13231 6561
19031 1355 1407 5898 13031 6179 13233 7800
19033 1652 1889 5845 13033 7800 13235 6318
19035 1790 1928 2671 13035 ndash 13237 ndash
19037 1323 1336 5925 13037 ndash 13239 ndash
19039 436 436 5467 13039 ndash 13241 5845
19041 1636 1713 5644 13043 6090 13243 ndash
19043 1474 1474 5683 13045 4767 13245 ndash
19045 1156 1161 5976 13047 7800 13247 ndash
19047 1862 1862 2671 13049 ndash 13249 7800
19057 1296 1332 6044 13059 ndash 13259 7772
19059 1504 1512 5598 13061 7800 13261 7800
19061 1352 1352 5829 13063 ndash 13263 ndash
19063 1602 1641 5757 13065 5840 13265 ndash
19065 1355 1410 5845 13067 ndash 13267 5838
19067 1595 1824 5866 13069 5819 13269 7101
19069 1789 2142 5937 13071 ndash 13271 7239
19071 1292 1292 2671 13073 ndash 13273 7800
19073 1697 1998 5417 13075 ndash 13275 7080
19075 1742 1851 5973 13077 7800 13277 7456
19077 1314 1314 5481 13079 ndash 13279 6483
19079 1641 1672 6036 13081 7223 13281 5289
294 copy 2013 Society of Chemical Industry and John Wiley amp Sons Ltd | Biofuels Bioprod Bioref 7282ndash302 (2013) DOI 101002bbb
Modeling and Analysis Biochemical biorefinery sizing and environmental sustainability impacts AM Argo et al
Table 7 (Continued)
FIPS (IA) Case 1 Supplement Fertilizer
Case 2 Supplement Fertilizer
Corn Fertilizer
FIPS (GA) Case 3 SWG Fertilizer
FIPS (GA) Case 3 SWG Fertilizer
kgac kgac kgac kgac kgac
19081 1707 1904 6040 13083 ndash 13283 6959
19083 1603 1645 6081 13085 ndash 13285 ndash
19085 1363 1363 2671 13087 ndash 13287 6841
19087 1264 1264 5711 13089 ndash 13289 6691
19089 1375 1446 5828 13091 7367 13291 4111
19091 1804 2169 5880 13093 5814 13293 ndash
19093 1849 2033 2671 13095 ndash 13295 7800
19095 1287 1287 5943 13097 ndash 13297 5853
19097 1074 1074 6033 13099 ndash 13299 6652
19099 1724 1839 5901 13101 ndash 13301 6875
19101 1202 1202 5663 13103 7800 13303 6871
19103 1159 1159 5931 13105 7150 13305 5827
19105 1118 1135 5955 13107 5819 13307 7800
19107 1314 1314 5854 13109 7800 13309 ndash
19109 1618 1627 6018 13111 ndash 13311 6007
19111 1014 1014 5794 13113 ndash 13313 ndash
19113 1000 1008 5949 13115 ndash 13315 7610
19115 1239 1289 5961 13117 5289 13317 7800
19117 526 526 5408 13119 7800 13319 7800
19119 1690 1751 2671 13121 ndash 13321 7656
19121 1089 1089 5466 13123 ndash
19123 1295 1316 5713 13125 5835
19125 1251 1251 5476 13127 ndash
19127 1840 2052 5988 13129 7800
19129 1474 1474 2671 13131 ndash
19131 1775 2109 5944 13133 7800
19133 1364 1375 2671 13135 ndash
19135 751 751 5297 13137 5845
19137 1339 1339 2671 13139 5929
19139 1280 1369 5996 13141 ndash
19141 1697 1708 2671 13143 ndash
19143 1688 1705 2671 13145 ndash
19145 1178 1178 2671 13147 7800
19147 1570 1599 5642 13149 7800
19149 1535 1561 2671 13151 7800
19151 1683 1737 5619 13153 7424
19153 1308 1405 5641 13155 7480
19155 1616 1616 2671 13157 5853
19157 1548 1577 5930 13159 ndash
19159 540 540 2671 13161 6724
19161 1784 2078 5364 13163 7196
copy 2013 Society of Chemical Industry and John Wiley amp Sons Ltd | Biofuels Bioprod Bioref 7282ndash302 (2013) DOI 101002bbb 295
AM Argo et al Modeling and Analysis Biochemical biorefinery sizing and environmental sustainability impacts
Table 7 (Continued)
FIPS (IA) Case 1 Supplement Case 2 Supplement Corn FIPS (GA) Case 3 SWG FIPS (GA) Case 3 SWG Fertilizer Fertilizer Fertilizer Fertilizer Fertilizer
kgac kgac kgac kgac kgac
19163 1494 1596 6000 13165 7800
19165 1660 1660 2671 13167 6271
19167 1766 1899 2671 13169 ndash
19169 1561 1566 5996 13171 ndash
19171 1512 1514 5978 13173 6469
19173 629 629 2671 13175 7213
19175 737 737 5467 13177 7800
19177 646 646 5418 13179 ndash
19179 1099 1099 5455 13181 ndash
19181 1290 1290 5467 13183 5844
19183 1665 1708 5824 13185 5868
19185 552 552 2671 13187 4895
19187 1664 1668 5703 13189 ndash
19189 1599 1599 5909 13191 ndash
19191 1249 1253 5793 13193 7800
19193 2013 2013 2671 13195 5853
19195 1778 2102 5841 13197 7800
19197 1803 2136 6081 13199 7800
Figure 6 Blue water footprint of cellulosic ethanol produced from corn stover (Cases 1 and 2) and switchgrass (Case 3) by production stage at refinery scale of 2000 DMTday in 2017
850 and 820 gallons water per gallon ethanol respecshytively The average grey water in Case 3 which accounts for assimilating the total fertilizer applied during the entire growth period is only 210 gallons water per galshylon ethanol Results clearly indicate the unique ability of switchgrass to capture nutrient runoff in addition to lower fertilizer input requirements thereby reducing grey
Figure 7 Green and grey water footprint of cellulosic ethashynol produced from corn stover (Cases 1 and 2) and switch-grass (Case 3) by production stage at refinery scale of 2000 DMTday in 2017
water loadings Historically switchgrass has been used in conservation programs to contain the fertilizer loss to water body from crop land
At the same refinery capacity choice of feedstock and location could have significant impacts on types of water footprint of the cellulosic biofuel Since a majority of
296 copy 2013 Society of Chemical Industry and John Wiley amp Sons Ltd | Biofuels Bioprod Bioref 7282ndash302 (2013) DOI 101002bbb
Modeling and Analysis Biochemical biorefinery sizing and environmental sustainability impacts AM Argo et al
Figure 8 County-level distributions of blue green and grey water footprint for a 2000 DMTd biorefinery in 2017 to produced biofuel from (a) corn stover grown in Iowa via advanced logistic system (Case 2) and (b) switchgrass grown in Georgia via advanced logistic system (Case 3)
water requirements in the biofuel life cycle are from the feedstock growing stage the water footprint of a particushylar biofuel is largely determined by regional climate For example with the same advanced logistic system cellushylosic ethanol produced from switchgrass in biorefi neries located in Georgia (Case 3) requires 39 less blue water footprint than that for Iowa stover in Case 2 (Fig 6) Since the total water requirement for crop growth would be satshyisfied either from rainfall (green water) or irrigation (blue water) lower green water footprint often means increased blue water footprint for the same plant species (Fig 8)
Switchgrass is a high yield perennial which requires substantial evapotransporation to support its growth Switchgrass can be cultivated in many regions in the USA without irrigation and thus producing rain-fed switch-grass could have less impact on regional blue water use than other crops requiring irrigation
Biorefinery water supply is entirely blue water and biorefinery water demand is concentrated in a single local area Thus a biorefinery built in an area where the local feedstock is blue-water-intensive would likely lead to an increased burden on the local water resources as compare to a biorefinery built in an area with less blue-watershyintensive feedstocks Therefore it is environmentally benshyeficial to develop switchgrass or other perennial feedstock
plantations in regions with sufficient green water supply to ensure sustainable water use for the feedstock and the biorefi nery
From a whole biorefinery production perspective the resource needs for blue water becomes more pronounced as biorefinery scale increases Further CBS logistics systems dictate that the biorefinery be located near the biomass feedstock production whereas AUD logistics effectively decouple biorefinery location from feedstock production Therefore we expect that CBS logistics would stress a local water resource to a greater extent than AUD logistics Figure 8 further shows the extensive geographishycal variability of blue andf green water footprint even within a state which would affect the choice of feedstock thereby influence the refinery siting consideration
Sustainability metrics and life cycle assessment
SimaPro v73 life cycle assessment modeling soft ware was used to develop and link unit processes using estabshylished methods36 In the absence of primary publicly available data we used the Ecoinvent v20 and to a lesser extent the US Life Cycle Inventory (US LCI) processes We modified the Ecoinvent processes to be refl ective of
copy 2013 Society of Chemical Industry and John Wiley amp Sons Ltd | Biofuels Bioprod Bioref 7282ndash302 (2013) DOI 101002bbb 297
AM Argo et al Modeling and Analysis Biochemical biorefinery sizing and environmental sustainability impacts
Figure 9 GHG emi ssions LCA results for Case 1 Iowa corn stover CBS Case 2 Iowa corn stover AUD and Case 3 Georgia switchgrass AUD
US conditions and the US LCI processes to account for embodied emissions and energy fl ows
Modeling approach and assumptions
The modeling boundary for this study is from fi eld to refinery gate including embodied energy and material flows using the methods described elsewhere36 Th e funcshytional unit is 1 gallon of ethanol produced in the year 2017 Avoided impacts are accounted for using product displacement (also termed boundary system expansion)15
For products that share inputs (eg corn grain and corn stover) burdens are allocated between products based on a lsquoproduct-purposersquo approach Inputs to multi-year cropping systems (ie switchgrass) are likewise annualized by the length of the cropping rotation Impacts from direct and indirect land use change are not considered in this study Feedstock processing and transport are modeled accordshying to INLrsquos CBS and AUD
LCA modeling results
A breakdown of the GHG emission (in terms of CO2 equivalent) for each of the cases is displayed graphically in Fig 9 When comparing AUD to CBS moderate increases in GHG emissions observed in the Iowa corn stover
biochemical conversion-to-ethanol are associated with additional field-to-depot and depot-to-terminal transporshytation steps (lsquoPre-processing otherrsquo category in Fig 9) and increased transportation contribution to the biorefi nery (lsquoFeedstock transportationrsquo category) The small increases in normalized (per gallon of ethanol) electricity credit with increasing biorefinery scale are associated with increased electricity generation efficiency As expected we observe small feedstock differences in GHG emissions for Iowa corn stover and Georgia switchgrass
Conclusions
As expected we demonstrated that CBS has lower average logistics costs than AUD AUD logistic costs are higher than CBS costs primarly due to increased pre-processing costs and increased transportation costs (with multiple transportation step) Likewise and similar to earlier studshyies3 we also show that with CBS logistic costs increase as either biorefinery capacity or feedstock collection radius increase AUD mitigates many of the CBS feedstock-supshyply risks and while resulting in modestly higher logistics costs dramatically reduces both the temporal and spatial biomass-cost variability and allows access to substantially larger quantities of biomass
298 copy 2013 Society of Chemical Industry and John Wiley amp Sons Ltd | Biofuels Bioprod Bioref 7282ndash302 (2013) DOI 101002bbb
Modeling and Analysis Biochemical biorefinery sizing and environmental sustainability impacts AM Argo et al
1 AUD effectively disconnects the feedstock from the biorefinery in terms of both scale and location Single or multiple terminals can supply single or multiple biorefineries of varying scale Biorefi nery locations can be optimized for logistics distribution water resources or other project-specifi c constraints
2 AUD promotes more sustainable cropping practices whereas with CBS there is always pressure to produce the same crop
3 AUD providers have much tighter control on biomass production specifications than is possible with CBS
Iowa corn stover supply costs with CBS increase as biorefinery capacity increases from 500 to 2000 DMTday however the biorefinery economy-of-scale impact is larger in magnitude and the overall MESP decreases from $345 gal to $248gal going from 500 to 2000 DMTday bioreshyfinery scale It must be noted that CBS was not considered for biorefinery capacities of 5000 DMT or greater as the existing models do not capture the substantial additional infrastructure required to manage the high throughput of trucks through the biorefi nery
Iowa corn stover supply costs with the AUD are conshystant for biorefineries ranging from 500 to gt10 000 DMT day and as a result the MESP is reduced from $372gal to $225gal Similar to Iowa corn stover Georgia switch-grass feedstock supply costs are constant using the AUD for biorefineries ranging from 500 to 5000 DMTday however for biorefineries larger than ~5000 DMTday the terminal-to-biorefinery distance needs to be increased from 100 miles to 300 miles to supply the larger capacishyties As a result the MESP for Georgia decreases from $337gal to approximately $204gal as the biorefi nery capacity is increased from 500 DMTday to 10 000 DMT day Only small if any cost reductions are expected for capacities greater than 10 000 DMTday Results of this study show that biochemical ethanol production using a CBS results in the lowest MESP at small biorefi nery scales At larger biorefineries (gt5000 DMTday) these analyses suggest that AUD logistics result in producshytion costs lower than those possible with conventional systems
Our results show no detrimental effects on water sustainability metrics when comparing AUD to CBS Nevertheless feedstock location and feedstock type do affect water use and quality so if biorefineries use diff ershyent feedstocks or pull feedstocks from diff erent locations than those modeled here the results will change Th is study also did not consider the local impact on water resources when siting a large biorefinery We expect that
large biorefineries such as those enabled by the AUD will require a water footprint commensurate to their scale and hence may stress the water resources of a specifi c area where the biorefinery is located
Our results show that AUD logistics result in modestly higher GHG emissions (10ndash15) than CBS mainly due to additional field-to-depot and depot-to-terminal transporshytation (lsquoPre-processing otherrsquo category in Fig 9) steps and increased transportation contribution to the biorefi nery (lsquoFeedstock transportationrsquo category)
One potential issue not addressed in this work is that biomass resulting from AUD pre-processing are subshystantially changed physically and potentially chemically compared to materials collected using CBS (eg lignin is plasticized) This may aff ect biorefinery yield operability and production costs and thus future work will need to experimentally verify and quantify biochemical convershysion of these materials and adapt the modelsanalyses accordingly
Acknowledgement
We thank the US Department of Energy for funding and supporting this work
References 1 US DOE US Billion-Ton Update Biomass Supply for
a Bioenergy and Bioproducts Industry USDOE report no ORNLTM-2011224 lead by Perlack RD and Stokes BJ United States Department of Energy and Oak Ridge National Laboratory Oak Ridge TN pp 227 (2011)
2 Riley C and Schell D Technical and Economic Analysis of an Enzymatic Hydrolysis Based Ethanol Plant internal report Solar Energy Research Institute Golden CO (1991)
3 Aden A Ruth M Ibsen K Jechura J Neeves K Sheehan J et al Lignocellulosic Biomass to Ethanol Process Design and Economics Utilizing Co-Current Dilute Acid Prehydrolysis and Enzymatic Hydrolysis for Corn Stover report no NREL TP-510-32438 National Renewable Energy Laboratory Golden CO pp 154 (2002)
4 Humbird D Davis R Tao L Kinchin C Hsu D Aden A et al Process Design and Economics for the Conversion of Lignocellulosic Biomass to Ethanol Dilute-Acid Pretreatment and Enzymatic Hydrolysis of Corn Stover report no NREL TP-510-47764 National Renewable Energy Laboratory Golden CO pp 147 (2011)
5 Searcy E Wright C Muth D Hess JR and Jacobson J The Limits of a 50 Mile Collection Radius for Biomass Supply to a Biorefi nery draft report Idaho National Laboratory Idaho Falls ID (2010)
6 Hess JR Wright CT Kenney KL and Searcy EM Uniform-Format Solid Feedstock Supply System A Commodity-Scale Design to Produce and Infrastructure-Compaible Bulk Solid from Lignocellulosic Biomass ndash Executive Summary report no INLEXT-09-15423 Idaho National Laboratory Idaho Falls ID (2009)
copy 2013 Society of Chemical Industry and John Wiley amp Sons Ltd | Biofuels Bioprod Bioref 7282ndash302 (2013) DOI 101002bbb 299
AM Argo et al Modeling and Analysis Biochemical biorefinery sizing and environmental sustainability impacts
7 Jacobson JJ and Searcy EM Uniform-Format Feedstock Supply System Design for Woody Biomass Presented at the Spring Conference of the AICHe Orlando FL April (2010)
8 Langholtz M Graham RC Eaton L Perlack R Hellwinckel C and De la Torre Ugarte D Price projections of feedstocks for biofuels and biopower in the US Energy Policy41484ndash493 (2012)
9 USDA NASS Agricultural Prices Paid US [Online] Department of Agriculture National Agricultural Statistics Service Available at httpusdamannlibcornelledu MannUsdaviewDocumentInfododocumentID =1002 [September 19 2012]
10 USDA-OCEWAOB Agricultural Projects to 2018 Long-term Projections Report OCE-2010-1 US Department of Agriculture and Office of the Chief Economist World Agricultural Outlook Board Washington DC (2009)
11 US Congress Energy Independence and Security Act of 2007 110th Congress 1st Session HR 6 4 (2007)
12 US EIA Annual Energy Outlook 2010 Report No DOEEIAshy0383 US Energy Information Administration Washington DC (2010)
13 Wu M Chiu YW and Demissie Y Quantifying the regional water footprint of biofuel production by incorporatshying hydrologic modeling Water Resrouce Research DOI1010292011WR011809 (2012)
14 NOAA NCDC 1971-2000 US Climate Normals Products Clim 84 Daily Normals [Online] NOAA National Climate Data Center Available at httpwwwncdcnoaagov [September 19 2012]
15 Wang M Huo H and Arora S Methods of dealing with coshyproducts of biofuels in life-cycle analysis and consequent results within the US context Energy Policy 395726ndash5736 (2011)
16 USDA 2002 Census of Agriculture US Department of Agriculture Washington DC (2004)
17 USDA 2007 Census of Agriculture US Department of Agriculture Washington DC (2010)
18 USDA 2008 Farm and Ranch Irrigation Report No AC-02-SS-1 US Department of Agriculture Washington DC (2009)
19 USDA 2003 Farm and Ranch Irrigation Survey Report No AC-02-SS-1 US Department of Agriculture Washington DC (2004)
20 USGS Water Use in the United States 1985 1990 and 1995 [Online] US Geological Survey Available at httpwaterusgs govwatuse [September 19 2012]
21 High Plains Regional Climate Center Crop Coeffi cients for Corn [Online] Available at httpwwwhprccunleduawdn etcropcrop_corntxt [September 19 2012]
22 Marek T Colaizzi P Howell TA Dusek D and Porter D Estimating Seasonal Crop ET Using Calendar and Heat Unit Based Crop Coefficients in the Texas High Plains Evapotranspiration Network Presented at 2006 ASAE Annual Meeting American Society of Agricultural and Biological Engineers Portland OR pp 9ndash12 (2006)
23 Kiniry J Lynd L Greene N Johnson M Casler M and Laser MS Biofuels and water use Comparison of maize and switch-grass and general perspectives new research on biofuels ed by Wright JH and Evans DA Nova Science Publishing New York ( 2008 )
24 Kiniry JR Tischler CR and Van Esbroeck GA Radiation use efficiency and leaf CO2 exchange for diverse C4 grasses Biomass Bioenerg 17(2)95ndash112 (1999)
25 Grassini P Yang H and Cassman KG Limits to maize proshyductivity in western corn-belt A simulation analysis for fully irrigated and rainfed conditions Agr Forest Meteor 1491254ndash 1265 (2009 )
26 Hoos AB and McMahon G Spatial analysis of instream nitroshygen loads and factors controlling nitrogen delivery to streams in the Southeastern United States using spatially referenced regression on watershed attributes (SPARROW) and regional classifi cation frameworks Hydrol Process 232275ndash2294 (2009)
27 Hoos AB Terziotti S McMahon G Savvas K Tighe KC and Alkons-Wolinsky R Data to Support Statistical Modeling of Instream Nutrient Load Based on Watershed Attributes Southeastern United States 2002 US Geological Survey pp 50 (2008)
28 Demissie Y Yan E and Wu M Assessing regional hydrology and water quality implications of large-scale biofuel feedstock production in the Upper Mississippi river basin Environ Sci Technol 469174ndash9182 (2012)
29 Wu M Demissie Y and Yan E Simulated impact of future bioshyfuel production on water quality and water cycle dynamics in the Upper Mississippi river basin Biomass Bioenerg 4144ndash56 (2012)
30 Smith RA Alexander RB and Schwarz GE Natural backshyground concentrations of nutrients in streams and rivers of the conterminous United States Environ Sci Technol 373039ndash 3047 (2003)
31 Chiu YW and Wu M Assessing county-level water footprints of different cellulosic-biofuel feedstock pathways Environ Sci Technol 469155ndash9162 (2012)
32 White PJ CORN Chemistry and Technology 2nd edn ed byWhite PJ and Johnson LA American Association of Cereal Chemists Inc St Paul MN (2003)
33 Wu M and Peng MJ Developing a tool to estimate water withshydrawal and consumption in electricity generation in the United States Report No ANLESD11-2 update Argonne National Laboratory (2011)
34 ANL TTRDC GREET Model [Online] Argonne National Laboratory Transportation Technology RampD Center Chicago IL Available at httpgreetesanlgovindex phpcontent= power_water [August 21 2012]
35 Wu M Mintz M Wang M and Arora S Water consumption in the production of ethanol and petroleum gasoline Environ Manage 44981ndash997 (2009)
36 Hsu DD Inman D Heath GA Wolfrum EJ Mann MK and Aden A Life cycle environmental impacts of selected US ethanol production and use pathways in 2022 Environ Sci Technol 445289ndash5297 (2010)
300 copy 2013 Society of Chemical Industry and John Wiley amp Sons Ltd | Biofuels Bioprod Bioref 7282ndash302 (2013) DOI 101002bbb
Modeling and Analysis Biochemical biorefinery sizing and environmental sustainability impacts AM Argo et al
Andrew Argo
Dr Andrew Argo is senior engineer in the system integration group at the National Renewable Energy Laboratoshyry His work supports the Department of Energy Biomass Program in the areas of strategic systemlevel analysis and integrated biorefinery projects monitoring
Eric C D Tan
Dr Tan is a Senior Research Engineer in the Biorefinery Analysis Group of the National Bioenergy Center at the National Renewable National Laborashytory (NREL) His research interests include the process design economshyics and sustainability for conversion of lignocellulosic biomass to biofuels
with particular emphasis on the application of techno-economic analysis and life cycle assessment methods He also has broad experience in chemically reacting flow simulation and heterogeneous catalysis
Daniel Inman
Dr Daniel Inman is a research scienshytist at the National Renewable Energy Laboratory in Golden Colorado His primary research interests are centered on the sustainability biofuel producshytion and use He is currently involved in several modeling projects including lifecycle assessment of multiple biofushy
els and using system dynamics to examine the growth of the cellulosic biofuels industry
Matthew H Langholtz
Dr Matthew Langholtz is a Natural Resource Economist in the Bioenergy Group at Oak Ridge National Laborashytory He is principle investigator (PI) of the Resource Analysis Project of the Bioenergy Group at Oak Ridge Nationshyal Lab as well as the Short-Rotation Woody Crop Sustainability project His
research interests include biomass resource economics short-rotation woody crops and bioenergy from forest resources He has worked on valuation of non-market externalities and developed biomass supply curves for commercial projects the South and the United States
Laurence M Eaton
Laurence Eaton is a Research Scientist at the Oak Ridge National Laborashytory in the Bioenergy Resource and Engineering Systems Group of the Environmental Sciences Division An economist by training he conducts research to support bioenergy foreshycasting and analysis using economic
land use models and Geographic Information Science He participates in interdisciplinary Resource Assessment activities to support the efficient and sustainable supply of agricultural and forestry resources for commercial domestic bioenergy and bioproducts markets He has worked in the area of applied microeconomics as it reshylates to bioenergy firm input decisions and the valuation of environmental goods and ecological services
Jacob J Jacobson
Mr Jacobson is a researcher from the Idaho National Laboratory He has a diverse background in systems analysis system dynamics statistical consulting software development and project management His work has been in the development and analysis of decision support systems to evalushy
ate policy options and business risks of complex energy and environmental systems His recent work has been in the area of analysis of biomass feedstock logistics
Christopher T Wright
Dr Chris Wright is manager and a senior research engineer for the Idaho National Laboratoryrsquos Biofuels and Reshynewable Energy Department His work supports the Department of Energy Biomass Program in developing analyshysis tools and technology for feedstock supply logistics and conversion of bioshy
mass to valuable fuels chemicals materials and power His knowledge of DOErsquos Biomass Program includes an emphasis on lignocellulosic feedstock supply systems which includes feedstock characterization development preprocessing handling and transportation issues assoshyciated with refining biomass into fuels and chemicals
copy 2013 Society of Chemical Industry and John Wiley amp Sons Ltd | Biofuels Bioprod Bioref 7282ndash302 (2013) DOI 101002bbb 301
AM Argo et al Modeling and Analysis Biochemical biorefinery sizing and environmental sustainability impacts
David J Muth Jr
Dr Dave Muth is a Research Engishyneer at the Idaho National Laboratory in Biofuels and Renewable Energy Technologies He leads the Analysis and Sustainability Group with the Bioenergy Research Team developshying models and modeling techniques which facilitate the evaluation the
feedstock assembly system as it pertains to creating advanced biofuels He is currently working as a contracshytor to the US Department of Energy Office of Biomass Programs located at DOE Headquarters supporting the establishment of technical objectives and research tarshygets for next generation feedstock supply and logistics systems that deliver high quality biomass feedstocks for advanced hydrocarbon fuel production
May M Wu
Dr May Wu a principal energy systems analyst at Argonne National Laborashytory is the PI of biofuel sustainability research funded by the US Departshyment of Energy Her research interests are in the area of water quality and water quantity associated with large-scale development of biofuel convenshy
tional fuel electricity and emerging fuels and life cycle analysis Dr Wu is leading the effort to develop tools and largescale watershed models to assess spatially explicit water footprint of biofuel produced from conventional cellulosic and advanced feedstock and impact of proshyjected future production on regional nutrient sediment and hydrology Dr Wu served as an expert advisor to the Water Working Group of the Council on Sustainable Biomass Production (CSBP)
Yi-Wen Chiu
Dr Yi-Wen Chiu is a postdoctoral apshypointee in the Energy System Division at the Argonne National Laboratory As an interdisciplinary scientist her main research interests are to understand the coupling and interaction of human and natural systems by applying inteshygrated modeling tools She has been
involved in research related to water footprint and water-energy nexus with broad interests related to scenario analysis and environmental impact assessment She also participates in several studies aiming to advance biofuels by determining the feasible pathways of achieving water sustainability goals
Robin L Graham
Dr Robin L Graham is Deputy Associate Laboratory Director for the Computing Environment and Life Science Directorate at the Argonne National Laboratory Formerly at Oak Ridge National Laboratory she worked in the Bioenergy field for many years pioneering biomass feedstock
resource assessments that incorporated both economic and environmental factors She was an author of the original ldquoBillion Tonrdquo study and contributed to its 2011 follow-up An ecosystem ecologist by training she has long been interested in developing sustainable natural resources and began her career working for the RampD Division of Weyerhaeuser Co She currently is leading Argonnersquos Biological and Environmental Science Initiashytive which aims to accelerate our understanding of the fundamental design principles in biological and environshymental systems
302 copy 2013 Society of Chemical Industry and John Wiley amp Sons Ltd | Biofuels Bioprod Bioref 7282ndash302 (2013) DOI 101002bbb
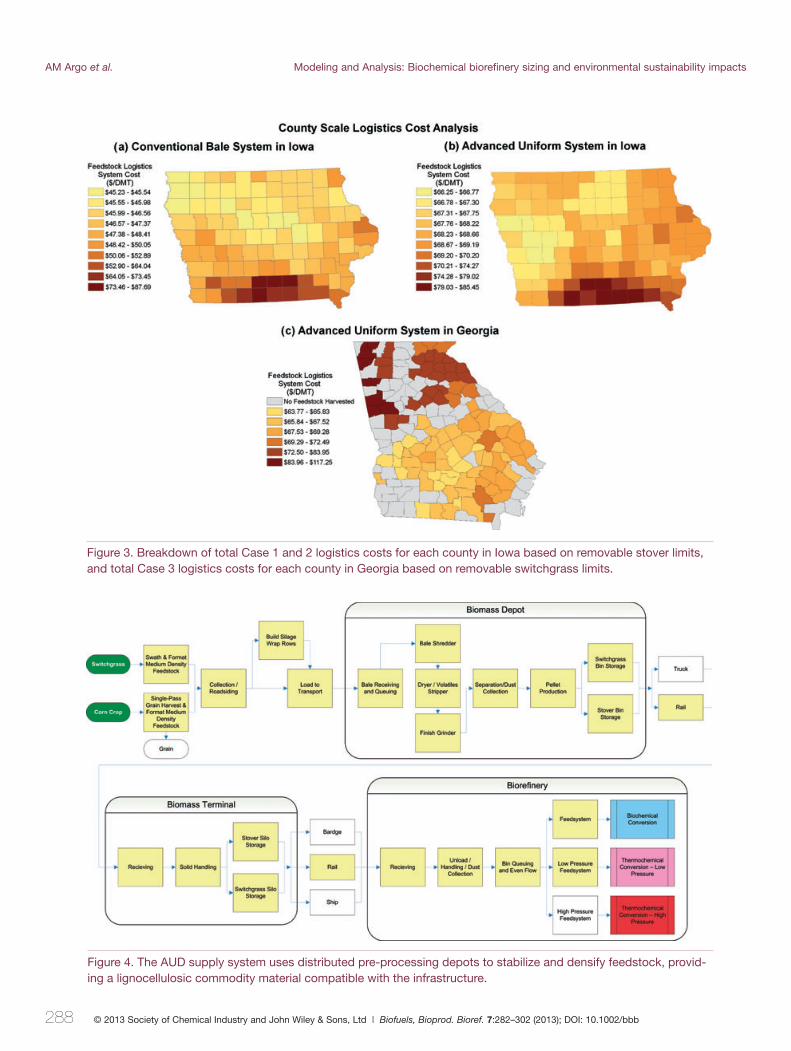
AM Argo et al Modeling and Analysis Biochemical biorefinery sizing and environmental sustainability impacts
Figure 3 Breakdown of total Case 1 and 2 logistics costs for each county in Iowa based on removable stover limits and total Case 3 logistics costs for each county in Georgia based on removable switchgrass limits
Figure 4 The AUD supply system uses distributed pre-processing depots to stabilize and densify feedstock providshying a lignocellulosic commodity material compatible with the infrastructure
288 copy 2013 Society of Chemical Industry and John Wiley amp Sons Ltd | Biofuels Bioprod Bioref 7282ndash302 (2013) DOI 101002bbb
Modeling and Analysis Biochemical biorefinery sizing and environmental sustainability impacts AM Argo et al
stover bales are collected and moved to fi eld-side stacks where they are protected with plastic wrap and stored Plastic wrap was chosen to protect the bales because of the concern that the high moisture content would lead to unacceptable dry matter losses if the bales were proshytected with tarps similar to that in Case 1 When needed stacks are delivered via flatbed semi-trucks to the depot for short-term storage and processing Again as needed the bales are sent through a drying grinding and denshysification process that dries the material to lt10 moisshyture reduces the feedstock to frac14-inch particle size bulk material and then densifies the material to a pellet with density gt30 lbft3 Th e densified material is then shipped to the terminal for blending and later transported to the biorefi nery
Analysis parameters
The key feature of AUD is the pre-processing of biomass at an early stage in the supply system (Fig 4) Pre-processing depots produce a final uniform material that is compatible with the grain storage and handling infrastructure
bull Field-side storage Collection system models assume field-side storage at a fixed stack size The distance to the stack input into the collection model is determined by using the county yield and implementing a radial geometric mean formula to establish the transport disshytance from the field to the local stack
bull Bale moisture content Storage system bale stacks are assumed to be 2000 DMT Moisture content of the bales when put into storage is assumed to be gt20 due to baling of the material directly from the combine without field drying Due to the high moisture content the bales are wrapped in plastic to reduce the dry matshyter losses Dry matter losses in storage are modeled at 78
bull Trucking feedstock from field-side to depot Depot size is based on the throughput capacity of the grinder which is the most capital-intensive piece of equipment at the depot The transportation distance is solved through a series of spatial operations much like the fi eld-side-to-biorefinery delivery in a CBS
bull Tr uck ing from depot to blend ing ter mina l This distance is again solved through a series of spatia l operations based on a terminal size of 3 600 000 DMTyear
bull Shipping by rail from blending terminal to biorefi nshyery This operation is based on a predetermined disshytance of 100 miles since by rail the majority of costs are fixed and the variable cost per mile is minimal
In Case 3 the logistics design in Georgia assumes that the feedstock is 100 switchgrass For the 7500 and 10 000 DMTday biorefi nery-capacity scenarios the terminal-toshybiorefinery distance was increased to 300 miles to accomshymodate the need for feedstock outside of Georgia
The AUD feedstock design incorporates a blending facilshyity (terminal) where different feedstocks can be blended to meet a conversion facilityrsquos feedstock design requirements
AUDrsquos impact is that the average supply system cost is higher but the spatial and temporal variability are much lower Where a CBS has low control over delivered bioshymass feedstock specifications AUD has high control Also AUD is able to access material from low-yield counties that would typically be stranded and not able to enter the supply system at aff ordable costs
Case 2 results
Case 2 uses the AUD for corn stover collection in Iowa The results of the county-by-county analysis of feedstock logistics costs are shown in Fig 3 Th e figure shows that while on average the total logistic cost is higher the range of variability ($66ndash$85 per DMT) is lower than that for the CBS ($45ndash$88 per DMT)
Case 3 results
Case 3 uses the AUD for switchgrass in Georgia Th e results of the county-by-county analysis of feedstock logisshytics costs are shown in Fig 3 Th e figure shows that while on the average the total logistics cost is higher the range of variability of the total cost is relatively low ($64ndash$117 per DMT) and much less for the AUD that for the CBS (intershynal INL data not included here)
Overall logistics results
The overall conclusions regarding the effects of feedstock logistics design on total cost are the following
bull The CBS demonstrates high spatial variability in costs even in highly productive regions such as Iowa Th e local ranges in feedstock cost were from $45 to $88 per DMT Additionally the CBS has very limited control on the feedstock specifications delivered to the biorefi nery
The AUD has higher average supply system costs but it does demonstrate reduced spatial and temporal varishyability The average costs were much more stable ranging from $66 to $85 per DMT for Iowa corn stover Th e AUD also allows material from areas with low yields to enter into the system whereas under the conventional supply
copy 2013 Society of Chemical Industry and John Wiley amp Sons Ltd | Biofuels Bioprod Bioref 7282ndash302 (2013) DOI 101002bbb 289
AM Argo et al Modeling and Analysis Biochemical biorefinery sizing and environmental sustainability impacts
Table 3 Breakdown of feedstock logistics costs by unit operations for CBS and AUD system designs in Boone County IA (a b) and AUD system design in Telfair County GA (c)
a) Conventional bale system costs in Boone County IA for 2000 DMTday biorefi nery
Harvest amp Storage Transportation Preprocessing Handling amp Total Collection (~45 km) Queuing Logistics
$1561 $595 $886 $1494 $083 $4620
b) Advanced uniform system costs in Boone County IA
Harvest amp Storage Depot Transport Depot Terminal Transport Terminal Biorefi nery Handling Total Collection (~17 km) Preprocessing (~80 km) Transport (~170 km) amp Queuing Logistics
$1615 $660 $601 $2479 $314 $154 $895 $083 $6801
c) Advanced uniform system costs in Telfair County GA
Harvest amp Storage Depot Transport Depot Terminal Transport Terminal Biorefi nery Handling Total Collection (~17 km) Preprocessing (~80 km) Transport (~170 km) amp Queuing Logistics
$1637 $554 $623 $2329 $496 $154 $895 $083 $6771
Table 4 Summary of feedstock and average logistics costs (weight averaged) used in biorefinery sizing and sustainability study
Distance to Biorefi nery Size Grower Payment Logistics Total Feedstock Case Location Feed Logistics Biorefi nery (mi) (DMTd) ($DMT) ($DMT) Cost ($DMT)
1 IA Corn stover CBS 15 500 $4689 $4481 $9170
21 1000 $4689 $4540 $9229
30 2000 $4689 $4620 $9309
2 IA Corn stover AUD 100 500 to 10000 $4690 $6801 $11491
3 GA SWG AUD 100 500 to 5000 $3393 $6771 $10164
300 7500 to 10000 $3393 $7377 $10770
system these resources would be stranded and inaccesshysible An example of the breakdown of total logistics cost for all cases are included in Table 3 AUD pre-processing costs are higher than those for CBS costs mainly because of higher pre-processing costs (drying pellitization) and additional transportation steps
Feedstock supply and logistics summary
A summary of the feedstock supply costs (grower payment + average logistic costs) for the work included in this study is displayed in Table 4 Using CBS logistics for Iowa corn stover (Case 1) the feedstock supply cost increases with increasing biorefinery size as a greater collection radius is required In contrast using AUD logistics for Iowa corn stover (Case 2) biorefinery capacities in excess of 10 000 DMTday are possible with a terminal located 100 miles from the biorefinery thus the feedstock supply cost is constant for Case 2 Similarly the feedstock supply cost
is constant for biorefinery capacities ranging from 500 to 5000 DMTday for Georgia switchgrass (Case 3) However at biorefinery capacities of 7500 and 10 000 DMTday for Georgia switchgrass a larger cropping area and thus a larger terminal-to-biorefinery distance (300 miles) is required
Conversion to ethanol
Conversion methods
Techno-economic analyses for the biochemical process of making ethanol from corn stover or switchgrass were pershyformed by scaling the biochemical process design model for corn stover that was developed at NREL4
For this study we assumed that the feedstock convertshyibility is the same for similar feedstock types (ie corn stover and switchgrass) as well as between the feedstock formats (ie CBS and AUD) All conversion data are based on those reported for corn stover (using CBS)4 using the feedstock composition data displayed in Table 5
290 copy 2013 Society of Chemical Industry and John Wiley amp Sons Ltd | Biofuels Bioprod Bioref 7282ndash302 (2013) DOI 101002bbb
Xylan 1953 2250
Moisture 12 15
Modeling and Analysis Biochemical biorefinery sizing and environmental sustainability impacts AM Argo et al
Table 5 Corn stover and switchgrass compositions used for this study
IA Corn Stover GA SwitchgrassComponent (dry wt ) (dry wt )
Glucan 3505 3500
Lignin 1576 2260
Ash 493 330
Acetate 181 180
Protein 310 120
Extractives 1465 970
Arabinan 238 310
Galactan 143 050
Mannan 060 030
Sucrose 077 000
Total structural carbohydrates 5899 6140
IA Corn Stover (bulk GA Switchgrass wt) (bulk wt)
The minimum ethanol selling prices (MESP) to give a 10 after-tax internal rate of return were calculated using a standard discounted cash flow rate of return analysis and the financial assumptions included in an earlier NREL report4
Results
Figure 5 shows the breakdown of the MESP (biorefi nery only) as a function of biorefinery plant size for each case
In all cases MESP decreases as biorefi nery size increased AUD logistics and processing costs are essenshytially constant for Iowa corn stover thus rising feedstock costs do not limit the economies-of-scale for biorefi neries in excess of 10 000 DMTday In the case of lower-yielding feedstock (county-yield) such as Georgia switchgrass increases in feedstock costs start to balance biorefi nery economies-of-scale at biorefinery capacities in excess of gt5000 DMTday
Due to the higher logistics costs the MESP for AUD corn stover (Case 2) is approximately $025gal higher than that for CBS (Case 1) at small biorefinery capacities (lt2000 DMT day) However this study suggests that increasing the bioreshyfinery size to 5000 DMTday will more than offset the MESP increase associated with more expensive AUD pre-processed feedstock Biorefinery capacities in excess of 10 000 DMT day are only possible with AUD and the resulting MESPs are substantially lower than that with CBS
As the biorefinery size increases from 500 to 10 000 DMTday with AUD logistics the MESP decreases from $372 to $225 per gallon for IA-corn stover and $337 to $204 per gallon for GA-switchgrass The lower MESP for switchgrass compared to that for corn stover is attributed to lower feedstock cost higher ethanol yield and higher byproduct electricity credit
Water
In this section the water resource use and the impact on water quality are analyzed Water resource analysis
Figure 5 M inimum ethanol selling price (MESP) as a function of plant size
copy 2013 Society of Chemical Industry and John Wiley amp Sons Ltd | Biofuels Bioprod Bioref 7282ndash302 (2013) DOI 101002bbb 291
AM Argo et al Modeling and Analysis Biochemical biorefinery sizing and environmental sustainability impacts
focuses on the consumptive use of rainfall (green water) and of surface and ground water (blue water) through irrigation and process water use Water quality analysis focuses on discharged water from fields containing fertishylizer and process water discharge (grey water) Th e water footprint for the three types of water is considered for the feedstock growing stage and conversion stage for the procshyess described earlier Detailed methodologies of the water footprint assessment for the green blue and grey water are described elsewhere13 30
Data sources and assumptions
We used public data sources for this work including govshyernment reports and open literature In the case that data were not available we relied on a combination of model simulation and statistical regression We assumed that soil moisture level is sufficient to meet the lowest water demand for switchgrass so that irrigation is not required in the state of Georgia
Climate irrigation crop and nutrient loading data
Water footprint calculation relies heavily on climate agricultural and hydrological data All of the climate data used in this study were derived from the National Climate Data Center of NOAA for the period from 1970 to 200014 Agricultural data for crop harvested acreshyage were from USDA NASS15 Irrigation application data were acquired from the 2002 and 2007 Census of Agriculture16 17 and the Farm and Ranch Irrigation Survey18 19 published by the USDA and USGS20 Th e crop coeffi cient Kc used in estimating evapotranspiration (ET the loss of water from the soil by evaporation and by transpiration from the crops) was compiled from the High Plains Regional Climate Center21 the Texas High Plains Evapotranspiration network22 and the previous studies of Kiniry et al2324 Climate in 2017 was assumed to remain the same as the historical average from 1970 to 2000 However the irrigation demand was further adjusted from historical values to reflect the increase of corn acreage and yield25 (Table 6) Nitrogen loading (data not included here) a key component of interest in grey water in IA and GA was estimated using results from SPARROW model26 27 Nitrogen fertilizer input rates for switchgrass were estimated by POLYSYS Regular corn field fertilizer input were simulated by a SWAT hydrologic model based on USDA state-level data28 29 while s upshyplemental fertilizer inputs were provided by POLYSYS A natural background nitrogen concentration CN was
compiled from USGS30 Nutrient loading for SWG was estimated from alfalfa27 Based on the historical monitorshying data sets for total nitrogen and nitrate (USGS30) CN is assumed to be 95 of the total nitrogen concentration in stream water Nitrogen fertilizer input data are included in Table 7 A comparison of the SWAT and SPARROW model in the studied areas showed good agreement for average values while SPARROW projected less veriabilishyties31 All of the watershed-scale calculations in this study were further converted into county-level data using the zonal statistics tool in ArcGIS
Water allocation
Corn plants produce grain and stover both of which can be used as biofuel feedstock During its growth corn grain and stover each appropriate a fraction of the total water requirement The same fraction was assumed in partionshying the water footprint associated with stover based biofuel production The blue water and green water of corn is partitioned between grain and stover by applying a crop harvest index32
Conversion process water use
Consumptive water use at the biorefinery is estimated from the process model described earlier Depending on the production scale and feedstock the normalized procshyess water use ranges from 53 to 56 LL ethanol produced The conversion process water is supplied from surface and ground water sources and therefore its use contributes only to the blue water footprint
In the conversion process more bio-electricity is proshyduced than that needed for the biorefinery and thus the excess power is sold to the grid A water use credit from the export electricity is considered using a system expanshysion approach Electricity generation water consumption factors from electricity generation mix in IA (05279 gal waterKwh) and GA (06403 gal waterKwh) were adopted from a Power-Water tool3334
Results
In general the blue water footprint of corn stover- and of switchgrass-derived ethanol ranged from 43 to 73 gal per gallon ethanol (Fig 6) similar to that of conventional oil sands production35 Switchgrass-derived ethanol (Case 3) requires less blue water than corn stover-derived ethanol (Case 1 or 2) because of savings from switchgrass irrigashytion Export bioelectricity contributes a 1 galgal water credit to the blue water footprint reducing total blue water use by 12ndash20
292 copy 2013 Society of Chemical Industry and John Wiley amp Sons Ltd | Biofuels Bioprod Bioref 7282ndash302 (2013) DOI 101002bbb
Modeling and Analysis Biochemical biorefinery sizing and environmental sustainability impacts AM Argo et al
Table 6 Projected corn irrigation volume by 2017
FIPS Case 1 Case 2 Case 1 Case 2 Irrigated Area
Fraction Case 1 Case 2
Corn Yield Harvested Acreage Irrigation Water Use Volume
DMTac 1000 Acre MGY
19017 212 217 29 81 06 282 777
19033 223 255 55 152 06 443 1220
19057 175 180 19 52 18 487 1339
19059 203 204 30 84 08 412 1135
19065 183 191 62 170 06 557 1533
19067 215 246 43 119 07 418 1150
19071 175 175 29 79 32 1663 4579
19077 178 178 37 102 14 852 2346
19081 231 257 50 139 07 520 1431
19085 184 184 65 179 121 13714 37756
19099 233 248 41 112 06 292 803
19103 157 157 45 123 13 695 1913
19109 219 220 48 131 06 401 1104
19111 137 137 14 38 14 264 726
19115 167 174 31 84 50 2504 6895
19119 228 237 61 169 07 927 2552
19125 169 169 25 70 07 328 902
19127 249 277 57 158 06 458 1260
19131 240 285 49 135 09 554 1525
19133 184 186 41 114 216 19403 53420
19139 173 185 31 85 26 1146 3156
19143 228 230 39 109 11 734 2020
19147 212 216 49 134 14 1060 2918
19149 207 211 89 245 10 1655 4557
19155 218 218 77 211 08 1198 3299
19161 241 281 54 148 07 562 1547
19163 202 216 31 85 09 351 966
19167 239 257 82 226 18 3080 8479
19193 272 272 64 176 27 3710 10214
19195 240 284 45 125 07 181 497
19197 244 289 64 175 05 444 1222
Counties might not require irrigation if not listed in the table
Green water contributes the most to the overall water footprint in both Case 1 and Case 2 and its relative conshytribution is significantly larger in Case 3 (Fig 7) due to the climate differences between GA and IA In particular GA has higher evapotransporation than IA28 Additionally green and blue water in Case 1 and Case 2 represent only the portion of water allocated to corn stover and the water use in the biorefinery whereas in Case 3 the results
represent all water associated with the entire above-ground switchgrass plant in addition to biorefi nery blue water use (Fig 7)
Grey water for the corn stover cases (Case 1 and Case 2) is attributable to the fraction of fertilizer required durshying the corn growth and supplemental fertilizer applicashytion to replace nutrients lost with stover removal Th e average grey water in Case 1 and Case 2 is estimated at
copy 2013 Society of Chemical Industry and John Wiley amp Sons Ltd | Biofuels Bioprod Bioref 7282ndash302 (2013) DOI 101002bbb 293
AM Argo et al Modeling and Analysis Biochemical biorefinery sizing and environmental sustainability impacts
Table 7 Nitrogen fertilizer application rate on stover (Cases 1 and 2) at Iowa and switchgrass at Georgia (Case 3) The unit is in kg N per stover or switchgrass harvested acreage
FIPS (IA) Case 1 Supplement Case 2 Supplement Corn FIPS (GA) Case 3 SWG FIPS (GA) Case 3 SWG Fertilizer Fertilizer Fertilizer Fertilizer Fertilizer
kgac kgac kgac kgac kgac
19001 1289 1289 5468 13001 6586 13201 ndash
19005 1052 1052 5521 13005 7048 13207 7800
19049 1232 1292 5509 13051 ndash 13251 7800
19003 1098 1098 2671 13003 7522 13205 ndash
19051 522 522 5692 13053 ndash 13253 ndash
19053 700 700 2671 13055 6745 13255 ndash
19055 1367 1406 5966 13057 ndash 13257 ndash
19007 608 608 5532 13007 ndash 13209 5834
19009 1821 1821 5485 13009 ndash 13211 7800
19011 1384 1440 5965 13011 3545 13213 7800
19013 1330 1392 5963 13013 ndash 13215 ndash
19015 1597 1620 5815 13015 7800 13217 5853
19017 1571 1609 5967 13017 7539 13219 7800
19019 956 982 5982 13019 7044 13221 7800
19021 1645 1725 5364 13021 6709 13223 ndash
19023 1616 1830 5875 13023 6921 13225 7800
19025 1605 1825 5388 13025 5840 13227 ndash
19027 1838 2116 5448 13027 6279 13229 6622
19029 1593 1593 2671 13029 6983 13231 6561
19031 1355 1407 5898 13031 6179 13233 7800
19033 1652 1889 5845 13033 7800 13235 6318
19035 1790 1928 2671 13035 ndash 13237 ndash
19037 1323 1336 5925 13037 ndash 13239 ndash
19039 436 436 5467 13039 ndash 13241 5845
19041 1636 1713 5644 13043 6090 13243 ndash
19043 1474 1474 5683 13045 4767 13245 ndash
19045 1156 1161 5976 13047 7800 13247 ndash
19047 1862 1862 2671 13049 ndash 13249 7800
19057 1296 1332 6044 13059 ndash 13259 7772
19059 1504 1512 5598 13061 7800 13261 7800
19061 1352 1352 5829 13063 ndash 13263 ndash
19063 1602 1641 5757 13065 5840 13265 ndash
19065 1355 1410 5845 13067 ndash 13267 5838
19067 1595 1824 5866 13069 5819 13269 7101
19069 1789 2142 5937 13071 ndash 13271 7239
19071 1292 1292 2671 13073 ndash 13273 7800
19073 1697 1998 5417 13075 ndash 13275 7080
19075 1742 1851 5973 13077 7800 13277 7456
19077 1314 1314 5481 13079 ndash 13279 6483
19079 1641 1672 6036 13081 7223 13281 5289
294 copy 2013 Society of Chemical Industry and John Wiley amp Sons Ltd | Biofuels Bioprod Bioref 7282ndash302 (2013) DOI 101002bbb
Modeling and Analysis Biochemical biorefinery sizing and environmental sustainability impacts AM Argo et al
Table 7 (Continued)
FIPS (IA) Case 1 Supplement Fertilizer
Case 2 Supplement Fertilizer
Corn Fertilizer
FIPS (GA) Case 3 SWG Fertilizer
FIPS (GA) Case 3 SWG Fertilizer
kgac kgac kgac kgac kgac
19081 1707 1904 6040 13083 ndash 13283 6959
19083 1603 1645 6081 13085 ndash 13285 ndash
19085 1363 1363 2671 13087 ndash 13287 6841
19087 1264 1264 5711 13089 ndash 13289 6691
19089 1375 1446 5828 13091 7367 13291 4111
19091 1804 2169 5880 13093 5814 13293 ndash
19093 1849 2033 2671 13095 ndash 13295 7800
19095 1287 1287 5943 13097 ndash 13297 5853
19097 1074 1074 6033 13099 ndash 13299 6652
19099 1724 1839 5901 13101 ndash 13301 6875
19101 1202 1202 5663 13103 7800 13303 6871
19103 1159 1159 5931 13105 7150 13305 5827
19105 1118 1135 5955 13107 5819 13307 7800
19107 1314 1314 5854 13109 7800 13309 ndash
19109 1618 1627 6018 13111 ndash 13311 6007
19111 1014 1014 5794 13113 ndash 13313 ndash
19113 1000 1008 5949 13115 ndash 13315 7610
19115 1239 1289 5961 13117 5289 13317 7800
19117 526 526 5408 13119 7800 13319 7800
19119 1690 1751 2671 13121 ndash 13321 7656
19121 1089 1089 5466 13123 ndash
19123 1295 1316 5713 13125 5835
19125 1251 1251 5476 13127 ndash
19127 1840 2052 5988 13129 7800
19129 1474 1474 2671 13131 ndash
19131 1775 2109 5944 13133 7800
19133 1364 1375 2671 13135 ndash
19135 751 751 5297 13137 5845
19137 1339 1339 2671 13139 5929
19139 1280 1369 5996 13141 ndash
19141 1697 1708 2671 13143 ndash
19143 1688 1705 2671 13145 ndash
19145 1178 1178 2671 13147 7800
19147 1570 1599 5642 13149 7800
19149 1535 1561 2671 13151 7800
19151 1683 1737 5619 13153 7424
19153 1308 1405 5641 13155 7480
19155 1616 1616 2671 13157 5853
19157 1548 1577 5930 13159 ndash
19159 540 540 2671 13161 6724
19161 1784 2078 5364 13163 7196
copy 2013 Society of Chemical Industry and John Wiley amp Sons Ltd | Biofuels Bioprod Bioref 7282ndash302 (2013) DOI 101002bbb 295
AM Argo et al Modeling and Analysis Biochemical biorefinery sizing and environmental sustainability impacts
Table 7 (Continued)
FIPS (IA) Case 1 Supplement Case 2 Supplement Corn FIPS (GA) Case 3 SWG FIPS (GA) Case 3 SWG Fertilizer Fertilizer Fertilizer Fertilizer Fertilizer
kgac kgac kgac kgac kgac
19163 1494 1596 6000 13165 7800
19165 1660 1660 2671 13167 6271
19167 1766 1899 2671 13169 ndash
19169 1561 1566 5996 13171 ndash
19171 1512 1514 5978 13173 6469
19173 629 629 2671 13175 7213
19175 737 737 5467 13177 7800
19177 646 646 5418 13179 ndash
19179 1099 1099 5455 13181 ndash
19181 1290 1290 5467 13183 5844
19183 1665 1708 5824 13185 5868
19185 552 552 2671 13187 4895
19187 1664 1668 5703 13189 ndash
19189 1599 1599 5909 13191 ndash
19191 1249 1253 5793 13193 7800
19193 2013 2013 2671 13195 5853
19195 1778 2102 5841 13197 7800
19197 1803 2136 6081 13199 7800
Figure 6 Blue water footprint of cellulosic ethanol produced from corn stover (Cases 1 and 2) and switchgrass (Case 3) by production stage at refinery scale of 2000 DMTday in 2017
850 and 820 gallons water per gallon ethanol respecshytively The average grey water in Case 3 which accounts for assimilating the total fertilizer applied during the entire growth period is only 210 gallons water per galshylon ethanol Results clearly indicate the unique ability of switchgrass to capture nutrient runoff in addition to lower fertilizer input requirements thereby reducing grey
Figure 7 Green and grey water footprint of cellulosic ethashynol produced from corn stover (Cases 1 and 2) and switch-grass (Case 3) by production stage at refinery scale of 2000 DMTday in 2017
water loadings Historically switchgrass has been used in conservation programs to contain the fertilizer loss to water body from crop land
At the same refinery capacity choice of feedstock and location could have significant impacts on types of water footprint of the cellulosic biofuel Since a majority of
296 copy 2013 Society of Chemical Industry and John Wiley amp Sons Ltd | Biofuels Bioprod Bioref 7282ndash302 (2013) DOI 101002bbb
Modeling and Analysis Biochemical biorefinery sizing and environmental sustainability impacts AM Argo et al
Figure 8 County-level distributions of blue green and grey water footprint for a 2000 DMTd biorefinery in 2017 to produced biofuel from (a) corn stover grown in Iowa via advanced logistic system (Case 2) and (b) switchgrass grown in Georgia via advanced logistic system (Case 3)
water requirements in the biofuel life cycle are from the feedstock growing stage the water footprint of a particushylar biofuel is largely determined by regional climate For example with the same advanced logistic system cellushylosic ethanol produced from switchgrass in biorefi neries located in Georgia (Case 3) requires 39 less blue water footprint than that for Iowa stover in Case 2 (Fig 6) Since the total water requirement for crop growth would be satshyisfied either from rainfall (green water) or irrigation (blue water) lower green water footprint often means increased blue water footprint for the same plant species (Fig 8)
Switchgrass is a high yield perennial which requires substantial evapotransporation to support its growth Switchgrass can be cultivated in many regions in the USA without irrigation and thus producing rain-fed switch-grass could have less impact on regional blue water use than other crops requiring irrigation
Biorefinery water supply is entirely blue water and biorefinery water demand is concentrated in a single local area Thus a biorefinery built in an area where the local feedstock is blue-water-intensive would likely lead to an increased burden on the local water resources as compare to a biorefinery built in an area with less blue-watershyintensive feedstocks Therefore it is environmentally benshyeficial to develop switchgrass or other perennial feedstock
plantations in regions with sufficient green water supply to ensure sustainable water use for the feedstock and the biorefi nery
From a whole biorefinery production perspective the resource needs for blue water becomes more pronounced as biorefinery scale increases Further CBS logistics systems dictate that the biorefinery be located near the biomass feedstock production whereas AUD logistics effectively decouple biorefinery location from feedstock production Therefore we expect that CBS logistics would stress a local water resource to a greater extent than AUD logistics Figure 8 further shows the extensive geographishycal variability of blue andf green water footprint even within a state which would affect the choice of feedstock thereby influence the refinery siting consideration
Sustainability metrics and life cycle assessment
SimaPro v73 life cycle assessment modeling soft ware was used to develop and link unit processes using estabshylished methods36 In the absence of primary publicly available data we used the Ecoinvent v20 and to a lesser extent the US Life Cycle Inventory (US LCI) processes We modified the Ecoinvent processes to be refl ective of
copy 2013 Society of Chemical Industry and John Wiley amp Sons Ltd | Biofuels Bioprod Bioref 7282ndash302 (2013) DOI 101002bbb 297
AM Argo et al Modeling and Analysis Biochemical biorefinery sizing and environmental sustainability impacts
Figure 9 GHG emi ssions LCA results for Case 1 Iowa corn stover CBS Case 2 Iowa corn stover AUD and Case 3 Georgia switchgrass AUD
US conditions and the US LCI processes to account for embodied emissions and energy fl ows
Modeling approach and assumptions
The modeling boundary for this study is from fi eld to refinery gate including embodied energy and material flows using the methods described elsewhere36 Th e funcshytional unit is 1 gallon of ethanol produced in the year 2017 Avoided impacts are accounted for using product displacement (also termed boundary system expansion)15
For products that share inputs (eg corn grain and corn stover) burdens are allocated between products based on a lsquoproduct-purposersquo approach Inputs to multi-year cropping systems (ie switchgrass) are likewise annualized by the length of the cropping rotation Impacts from direct and indirect land use change are not considered in this study Feedstock processing and transport are modeled accordshying to INLrsquos CBS and AUD
LCA modeling results
A breakdown of the GHG emission (in terms of CO2 equivalent) for each of the cases is displayed graphically in Fig 9 When comparing AUD to CBS moderate increases in GHG emissions observed in the Iowa corn stover
biochemical conversion-to-ethanol are associated with additional field-to-depot and depot-to-terminal transporshytation steps (lsquoPre-processing otherrsquo category in Fig 9) and increased transportation contribution to the biorefi nery (lsquoFeedstock transportationrsquo category) The small increases in normalized (per gallon of ethanol) electricity credit with increasing biorefinery scale are associated with increased electricity generation efficiency As expected we observe small feedstock differences in GHG emissions for Iowa corn stover and Georgia switchgrass
Conclusions
As expected we demonstrated that CBS has lower average logistics costs than AUD AUD logistic costs are higher than CBS costs primarly due to increased pre-processing costs and increased transportation costs (with multiple transportation step) Likewise and similar to earlier studshyies3 we also show that with CBS logistic costs increase as either biorefinery capacity or feedstock collection radius increase AUD mitigates many of the CBS feedstock-supshyply risks and while resulting in modestly higher logistics costs dramatically reduces both the temporal and spatial biomass-cost variability and allows access to substantially larger quantities of biomass
298 copy 2013 Society of Chemical Industry and John Wiley amp Sons Ltd | Biofuels Bioprod Bioref 7282ndash302 (2013) DOI 101002bbb
Modeling and Analysis Biochemical biorefinery sizing and environmental sustainability impacts AM Argo et al
1 AUD effectively disconnects the feedstock from the biorefinery in terms of both scale and location Single or multiple terminals can supply single or multiple biorefineries of varying scale Biorefi nery locations can be optimized for logistics distribution water resources or other project-specifi c constraints
2 AUD promotes more sustainable cropping practices whereas with CBS there is always pressure to produce the same crop
3 AUD providers have much tighter control on biomass production specifications than is possible with CBS
Iowa corn stover supply costs with CBS increase as biorefinery capacity increases from 500 to 2000 DMTday however the biorefinery economy-of-scale impact is larger in magnitude and the overall MESP decreases from $345 gal to $248gal going from 500 to 2000 DMTday bioreshyfinery scale It must be noted that CBS was not considered for biorefinery capacities of 5000 DMT or greater as the existing models do not capture the substantial additional infrastructure required to manage the high throughput of trucks through the biorefi nery
Iowa corn stover supply costs with the AUD are conshystant for biorefineries ranging from 500 to gt10 000 DMT day and as a result the MESP is reduced from $372gal to $225gal Similar to Iowa corn stover Georgia switch-grass feedstock supply costs are constant using the AUD for biorefineries ranging from 500 to 5000 DMTday however for biorefineries larger than ~5000 DMTday the terminal-to-biorefinery distance needs to be increased from 100 miles to 300 miles to supply the larger capacishyties As a result the MESP for Georgia decreases from $337gal to approximately $204gal as the biorefi nery capacity is increased from 500 DMTday to 10 000 DMT day Only small if any cost reductions are expected for capacities greater than 10 000 DMTday Results of this study show that biochemical ethanol production using a CBS results in the lowest MESP at small biorefi nery scales At larger biorefineries (gt5000 DMTday) these analyses suggest that AUD logistics result in producshytion costs lower than those possible with conventional systems
Our results show no detrimental effects on water sustainability metrics when comparing AUD to CBS Nevertheless feedstock location and feedstock type do affect water use and quality so if biorefineries use diff ershyent feedstocks or pull feedstocks from diff erent locations than those modeled here the results will change Th is study also did not consider the local impact on water resources when siting a large biorefinery We expect that
large biorefineries such as those enabled by the AUD will require a water footprint commensurate to their scale and hence may stress the water resources of a specifi c area where the biorefinery is located
Our results show that AUD logistics result in modestly higher GHG emissions (10ndash15) than CBS mainly due to additional field-to-depot and depot-to-terminal transporshytation (lsquoPre-processing otherrsquo category in Fig 9) steps and increased transportation contribution to the biorefi nery (lsquoFeedstock transportationrsquo category)
One potential issue not addressed in this work is that biomass resulting from AUD pre-processing are subshystantially changed physically and potentially chemically compared to materials collected using CBS (eg lignin is plasticized) This may aff ect biorefinery yield operability and production costs and thus future work will need to experimentally verify and quantify biochemical convershysion of these materials and adapt the modelsanalyses accordingly
Acknowledgement
We thank the US Department of Energy for funding and supporting this work
References 1 US DOE US Billion-Ton Update Biomass Supply for
a Bioenergy and Bioproducts Industry USDOE report no ORNLTM-2011224 lead by Perlack RD and Stokes BJ United States Department of Energy and Oak Ridge National Laboratory Oak Ridge TN pp 227 (2011)
2 Riley C and Schell D Technical and Economic Analysis of an Enzymatic Hydrolysis Based Ethanol Plant internal report Solar Energy Research Institute Golden CO (1991)
3 Aden A Ruth M Ibsen K Jechura J Neeves K Sheehan J et al Lignocellulosic Biomass to Ethanol Process Design and Economics Utilizing Co-Current Dilute Acid Prehydrolysis and Enzymatic Hydrolysis for Corn Stover report no NREL TP-510-32438 National Renewable Energy Laboratory Golden CO pp 154 (2002)
4 Humbird D Davis R Tao L Kinchin C Hsu D Aden A et al Process Design and Economics for the Conversion of Lignocellulosic Biomass to Ethanol Dilute-Acid Pretreatment and Enzymatic Hydrolysis of Corn Stover report no NREL TP-510-47764 National Renewable Energy Laboratory Golden CO pp 147 (2011)
5 Searcy E Wright C Muth D Hess JR and Jacobson J The Limits of a 50 Mile Collection Radius for Biomass Supply to a Biorefi nery draft report Idaho National Laboratory Idaho Falls ID (2010)
6 Hess JR Wright CT Kenney KL and Searcy EM Uniform-Format Solid Feedstock Supply System A Commodity-Scale Design to Produce and Infrastructure-Compaible Bulk Solid from Lignocellulosic Biomass ndash Executive Summary report no INLEXT-09-15423 Idaho National Laboratory Idaho Falls ID (2009)
copy 2013 Society of Chemical Industry and John Wiley amp Sons Ltd | Biofuels Bioprod Bioref 7282ndash302 (2013) DOI 101002bbb 299
AM Argo et al Modeling and Analysis Biochemical biorefinery sizing and environmental sustainability impacts
7 Jacobson JJ and Searcy EM Uniform-Format Feedstock Supply System Design for Woody Biomass Presented at the Spring Conference of the AICHe Orlando FL April (2010)
8 Langholtz M Graham RC Eaton L Perlack R Hellwinckel C and De la Torre Ugarte D Price projections of feedstocks for biofuels and biopower in the US Energy Policy41484ndash493 (2012)
9 USDA NASS Agricultural Prices Paid US [Online] Department of Agriculture National Agricultural Statistics Service Available at httpusdamannlibcornelledu MannUsdaviewDocumentInfododocumentID =1002 [September 19 2012]
10 USDA-OCEWAOB Agricultural Projects to 2018 Long-term Projections Report OCE-2010-1 US Department of Agriculture and Office of the Chief Economist World Agricultural Outlook Board Washington DC (2009)
11 US Congress Energy Independence and Security Act of 2007 110th Congress 1st Session HR 6 4 (2007)
12 US EIA Annual Energy Outlook 2010 Report No DOEEIAshy0383 US Energy Information Administration Washington DC (2010)
13 Wu M Chiu YW and Demissie Y Quantifying the regional water footprint of biofuel production by incorporatshying hydrologic modeling Water Resrouce Research DOI1010292011WR011809 (2012)
14 NOAA NCDC 1971-2000 US Climate Normals Products Clim 84 Daily Normals [Online] NOAA National Climate Data Center Available at httpwwwncdcnoaagov [September 19 2012]
15 Wang M Huo H and Arora S Methods of dealing with coshyproducts of biofuels in life-cycle analysis and consequent results within the US context Energy Policy 395726ndash5736 (2011)
16 USDA 2002 Census of Agriculture US Department of Agriculture Washington DC (2004)
17 USDA 2007 Census of Agriculture US Department of Agriculture Washington DC (2010)
18 USDA 2008 Farm and Ranch Irrigation Report No AC-02-SS-1 US Department of Agriculture Washington DC (2009)
19 USDA 2003 Farm and Ranch Irrigation Survey Report No AC-02-SS-1 US Department of Agriculture Washington DC (2004)
20 USGS Water Use in the United States 1985 1990 and 1995 [Online] US Geological Survey Available at httpwaterusgs govwatuse [September 19 2012]
21 High Plains Regional Climate Center Crop Coeffi cients for Corn [Online] Available at httpwwwhprccunleduawdn etcropcrop_corntxt [September 19 2012]
22 Marek T Colaizzi P Howell TA Dusek D and Porter D Estimating Seasonal Crop ET Using Calendar and Heat Unit Based Crop Coefficients in the Texas High Plains Evapotranspiration Network Presented at 2006 ASAE Annual Meeting American Society of Agricultural and Biological Engineers Portland OR pp 9ndash12 (2006)
23 Kiniry J Lynd L Greene N Johnson M Casler M and Laser MS Biofuels and water use Comparison of maize and switch-grass and general perspectives new research on biofuels ed by Wright JH and Evans DA Nova Science Publishing New York ( 2008 )
24 Kiniry JR Tischler CR and Van Esbroeck GA Radiation use efficiency and leaf CO2 exchange for diverse C4 grasses Biomass Bioenerg 17(2)95ndash112 (1999)
25 Grassini P Yang H and Cassman KG Limits to maize proshyductivity in western corn-belt A simulation analysis for fully irrigated and rainfed conditions Agr Forest Meteor 1491254ndash 1265 (2009 )
26 Hoos AB and McMahon G Spatial analysis of instream nitroshygen loads and factors controlling nitrogen delivery to streams in the Southeastern United States using spatially referenced regression on watershed attributes (SPARROW) and regional classifi cation frameworks Hydrol Process 232275ndash2294 (2009)
27 Hoos AB Terziotti S McMahon G Savvas K Tighe KC and Alkons-Wolinsky R Data to Support Statistical Modeling of Instream Nutrient Load Based on Watershed Attributes Southeastern United States 2002 US Geological Survey pp 50 (2008)
28 Demissie Y Yan E and Wu M Assessing regional hydrology and water quality implications of large-scale biofuel feedstock production in the Upper Mississippi river basin Environ Sci Technol 469174ndash9182 (2012)
29 Wu M Demissie Y and Yan E Simulated impact of future bioshyfuel production on water quality and water cycle dynamics in the Upper Mississippi river basin Biomass Bioenerg 4144ndash56 (2012)
30 Smith RA Alexander RB and Schwarz GE Natural backshyground concentrations of nutrients in streams and rivers of the conterminous United States Environ Sci Technol 373039ndash 3047 (2003)
31 Chiu YW and Wu M Assessing county-level water footprints of different cellulosic-biofuel feedstock pathways Environ Sci Technol 469155ndash9162 (2012)
32 White PJ CORN Chemistry and Technology 2nd edn ed byWhite PJ and Johnson LA American Association of Cereal Chemists Inc St Paul MN (2003)
33 Wu M and Peng MJ Developing a tool to estimate water withshydrawal and consumption in electricity generation in the United States Report No ANLESD11-2 update Argonne National Laboratory (2011)
34 ANL TTRDC GREET Model [Online] Argonne National Laboratory Transportation Technology RampD Center Chicago IL Available at httpgreetesanlgovindex phpcontent= power_water [August 21 2012]
35 Wu M Mintz M Wang M and Arora S Water consumption in the production of ethanol and petroleum gasoline Environ Manage 44981ndash997 (2009)
36 Hsu DD Inman D Heath GA Wolfrum EJ Mann MK and Aden A Life cycle environmental impacts of selected US ethanol production and use pathways in 2022 Environ Sci Technol 445289ndash5297 (2010)
300 copy 2013 Society of Chemical Industry and John Wiley amp Sons Ltd | Biofuels Bioprod Bioref 7282ndash302 (2013) DOI 101002bbb
Modeling and Analysis Biochemical biorefinery sizing and environmental sustainability impacts AM Argo et al
Andrew Argo
Dr Andrew Argo is senior engineer in the system integration group at the National Renewable Energy Laboratoshyry His work supports the Department of Energy Biomass Program in the areas of strategic systemlevel analysis and integrated biorefinery projects monitoring
Eric C D Tan
Dr Tan is a Senior Research Engineer in the Biorefinery Analysis Group of the National Bioenergy Center at the National Renewable National Laborashytory (NREL) His research interests include the process design economshyics and sustainability for conversion of lignocellulosic biomass to biofuels
with particular emphasis on the application of techno-economic analysis and life cycle assessment methods He also has broad experience in chemically reacting flow simulation and heterogeneous catalysis
Daniel Inman
Dr Daniel Inman is a research scienshytist at the National Renewable Energy Laboratory in Golden Colorado His primary research interests are centered on the sustainability biofuel producshytion and use He is currently involved in several modeling projects including lifecycle assessment of multiple biofushy
els and using system dynamics to examine the growth of the cellulosic biofuels industry
Matthew H Langholtz
Dr Matthew Langholtz is a Natural Resource Economist in the Bioenergy Group at Oak Ridge National Laborashytory He is principle investigator (PI) of the Resource Analysis Project of the Bioenergy Group at Oak Ridge Nationshyal Lab as well as the Short-Rotation Woody Crop Sustainability project His
research interests include biomass resource economics short-rotation woody crops and bioenergy from forest resources He has worked on valuation of non-market externalities and developed biomass supply curves for commercial projects the South and the United States
Laurence M Eaton
Laurence Eaton is a Research Scientist at the Oak Ridge National Laborashytory in the Bioenergy Resource and Engineering Systems Group of the Environmental Sciences Division An economist by training he conducts research to support bioenergy foreshycasting and analysis using economic
land use models and Geographic Information Science He participates in interdisciplinary Resource Assessment activities to support the efficient and sustainable supply of agricultural and forestry resources for commercial domestic bioenergy and bioproducts markets He has worked in the area of applied microeconomics as it reshylates to bioenergy firm input decisions and the valuation of environmental goods and ecological services
Jacob J Jacobson
Mr Jacobson is a researcher from the Idaho National Laboratory He has a diverse background in systems analysis system dynamics statistical consulting software development and project management His work has been in the development and analysis of decision support systems to evalushy
ate policy options and business risks of complex energy and environmental systems His recent work has been in the area of analysis of biomass feedstock logistics
Christopher T Wright
Dr Chris Wright is manager and a senior research engineer for the Idaho National Laboratoryrsquos Biofuels and Reshynewable Energy Department His work supports the Department of Energy Biomass Program in developing analyshysis tools and technology for feedstock supply logistics and conversion of bioshy
mass to valuable fuels chemicals materials and power His knowledge of DOErsquos Biomass Program includes an emphasis on lignocellulosic feedstock supply systems which includes feedstock characterization development preprocessing handling and transportation issues assoshyciated with refining biomass into fuels and chemicals
copy 2013 Society of Chemical Industry and John Wiley amp Sons Ltd | Biofuels Bioprod Bioref 7282ndash302 (2013) DOI 101002bbb 301
AM Argo et al Modeling and Analysis Biochemical biorefinery sizing and environmental sustainability impacts
David J Muth Jr
Dr Dave Muth is a Research Engishyneer at the Idaho National Laboratory in Biofuels and Renewable Energy Technologies He leads the Analysis and Sustainability Group with the Bioenergy Research Team developshying models and modeling techniques which facilitate the evaluation the
feedstock assembly system as it pertains to creating advanced biofuels He is currently working as a contracshytor to the US Department of Energy Office of Biomass Programs located at DOE Headquarters supporting the establishment of technical objectives and research tarshygets for next generation feedstock supply and logistics systems that deliver high quality biomass feedstocks for advanced hydrocarbon fuel production
May M Wu
Dr May Wu a principal energy systems analyst at Argonne National Laborashytory is the PI of biofuel sustainability research funded by the US Departshyment of Energy Her research interests are in the area of water quality and water quantity associated with large-scale development of biofuel convenshy
tional fuel electricity and emerging fuels and life cycle analysis Dr Wu is leading the effort to develop tools and largescale watershed models to assess spatially explicit water footprint of biofuel produced from conventional cellulosic and advanced feedstock and impact of proshyjected future production on regional nutrient sediment and hydrology Dr Wu served as an expert advisor to the Water Working Group of the Council on Sustainable Biomass Production (CSBP)
Yi-Wen Chiu
Dr Yi-Wen Chiu is a postdoctoral apshypointee in the Energy System Division at the Argonne National Laboratory As an interdisciplinary scientist her main research interests are to understand the coupling and interaction of human and natural systems by applying inteshygrated modeling tools She has been
involved in research related to water footprint and water-energy nexus with broad interests related to scenario analysis and environmental impact assessment She also participates in several studies aiming to advance biofuels by determining the feasible pathways of achieving water sustainability goals
Robin L Graham
Dr Robin L Graham is Deputy Associate Laboratory Director for the Computing Environment and Life Science Directorate at the Argonne National Laboratory Formerly at Oak Ridge National Laboratory she worked in the Bioenergy field for many years pioneering biomass feedstock
resource assessments that incorporated both economic and environmental factors She was an author of the original ldquoBillion Tonrdquo study and contributed to its 2011 follow-up An ecosystem ecologist by training she has long been interested in developing sustainable natural resources and began her career working for the RampD Division of Weyerhaeuser Co She currently is leading Argonnersquos Biological and Environmental Science Initiashytive which aims to accelerate our understanding of the fundamental design principles in biological and environshymental systems
302 copy 2013 Society of Chemical Industry and John Wiley amp Sons Ltd | Biofuels Bioprod Bioref 7282ndash302 (2013) DOI 101002bbb

Modeling and Analysis Biochemical biorefinery sizing and environmental sustainability impacts AM Argo et al
stover bales are collected and moved to fi eld-side stacks where they are protected with plastic wrap and stored Plastic wrap was chosen to protect the bales because of the concern that the high moisture content would lead to unacceptable dry matter losses if the bales were proshytected with tarps similar to that in Case 1 When needed stacks are delivered via flatbed semi-trucks to the depot for short-term storage and processing Again as needed the bales are sent through a drying grinding and denshysification process that dries the material to lt10 moisshyture reduces the feedstock to frac14-inch particle size bulk material and then densifies the material to a pellet with density gt30 lbft3 Th e densified material is then shipped to the terminal for blending and later transported to the biorefi nery
Analysis parameters
The key feature of AUD is the pre-processing of biomass at an early stage in the supply system (Fig 4) Pre-processing depots produce a final uniform material that is compatible with the grain storage and handling infrastructure
bull Field-side storage Collection system models assume field-side storage at a fixed stack size The distance to the stack input into the collection model is determined by using the county yield and implementing a radial geometric mean formula to establish the transport disshytance from the field to the local stack
bull Bale moisture content Storage system bale stacks are assumed to be 2000 DMT Moisture content of the bales when put into storage is assumed to be gt20 due to baling of the material directly from the combine without field drying Due to the high moisture content the bales are wrapped in plastic to reduce the dry matshyter losses Dry matter losses in storage are modeled at 78
bull Trucking feedstock from field-side to depot Depot size is based on the throughput capacity of the grinder which is the most capital-intensive piece of equipment at the depot The transportation distance is solved through a series of spatial operations much like the fi eld-side-to-biorefinery delivery in a CBS
bull Tr uck ing from depot to blend ing ter mina l This distance is again solved through a series of spatia l operations based on a terminal size of 3 600 000 DMTyear
bull Shipping by rail from blending terminal to biorefi nshyery This operation is based on a predetermined disshytance of 100 miles since by rail the majority of costs are fixed and the variable cost per mile is minimal
In Case 3 the logistics design in Georgia assumes that the feedstock is 100 switchgrass For the 7500 and 10 000 DMTday biorefi nery-capacity scenarios the terminal-toshybiorefinery distance was increased to 300 miles to accomshymodate the need for feedstock outside of Georgia
The AUD feedstock design incorporates a blending facilshyity (terminal) where different feedstocks can be blended to meet a conversion facilityrsquos feedstock design requirements
AUDrsquos impact is that the average supply system cost is higher but the spatial and temporal variability are much lower Where a CBS has low control over delivered bioshymass feedstock specifications AUD has high control Also AUD is able to access material from low-yield counties that would typically be stranded and not able to enter the supply system at aff ordable costs
Case 2 results
Case 2 uses the AUD for corn stover collection in Iowa The results of the county-by-county analysis of feedstock logistics costs are shown in Fig 3 Th e figure shows that while on average the total logistic cost is higher the range of variability ($66ndash$85 per DMT) is lower than that for the CBS ($45ndash$88 per DMT)
Case 3 results
Case 3 uses the AUD for switchgrass in Georgia Th e results of the county-by-county analysis of feedstock logisshytics costs are shown in Fig 3 Th e figure shows that while on the average the total logistics cost is higher the range of variability of the total cost is relatively low ($64ndash$117 per DMT) and much less for the AUD that for the CBS (intershynal INL data not included here)
Overall logistics results
The overall conclusions regarding the effects of feedstock logistics design on total cost are the following
bull The CBS demonstrates high spatial variability in costs even in highly productive regions such as Iowa Th e local ranges in feedstock cost were from $45 to $88 per DMT Additionally the CBS has very limited control on the feedstock specifications delivered to the biorefi nery
The AUD has higher average supply system costs but it does demonstrate reduced spatial and temporal varishyability The average costs were much more stable ranging from $66 to $85 per DMT for Iowa corn stover Th e AUD also allows material from areas with low yields to enter into the system whereas under the conventional supply
copy 2013 Society of Chemical Industry and John Wiley amp Sons Ltd | Biofuels Bioprod Bioref 7282ndash302 (2013) DOI 101002bbb 289
AM Argo et al Modeling and Analysis Biochemical biorefinery sizing and environmental sustainability impacts
Table 3 Breakdown of feedstock logistics costs by unit operations for CBS and AUD system designs in Boone County IA (a b) and AUD system design in Telfair County GA (c)
a) Conventional bale system costs in Boone County IA for 2000 DMTday biorefi nery
Harvest amp Storage Transportation Preprocessing Handling amp Total Collection (~45 km) Queuing Logistics
$1561 $595 $886 $1494 $083 $4620
b) Advanced uniform system costs in Boone County IA
Harvest amp Storage Depot Transport Depot Terminal Transport Terminal Biorefi nery Handling Total Collection (~17 km) Preprocessing (~80 km) Transport (~170 km) amp Queuing Logistics
$1615 $660 $601 $2479 $314 $154 $895 $083 $6801
c) Advanced uniform system costs in Telfair County GA
Harvest amp Storage Depot Transport Depot Terminal Transport Terminal Biorefi nery Handling Total Collection (~17 km) Preprocessing (~80 km) Transport (~170 km) amp Queuing Logistics
$1637 $554 $623 $2329 $496 $154 $895 $083 $6771
Table 4 Summary of feedstock and average logistics costs (weight averaged) used in biorefinery sizing and sustainability study
Distance to Biorefi nery Size Grower Payment Logistics Total Feedstock Case Location Feed Logistics Biorefi nery (mi) (DMTd) ($DMT) ($DMT) Cost ($DMT)
1 IA Corn stover CBS 15 500 $4689 $4481 $9170
21 1000 $4689 $4540 $9229
30 2000 $4689 $4620 $9309
2 IA Corn stover AUD 100 500 to 10000 $4690 $6801 $11491
3 GA SWG AUD 100 500 to 5000 $3393 $6771 $10164
300 7500 to 10000 $3393 $7377 $10770
system these resources would be stranded and inaccesshysible An example of the breakdown of total logistics cost for all cases are included in Table 3 AUD pre-processing costs are higher than those for CBS costs mainly because of higher pre-processing costs (drying pellitization) and additional transportation steps
Feedstock supply and logistics summary
A summary of the feedstock supply costs (grower payment + average logistic costs) for the work included in this study is displayed in Table 4 Using CBS logistics for Iowa corn stover (Case 1) the feedstock supply cost increases with increasing biorefinery size as a greater collection radius is required In contrast using AUD logistics for Iowa corn stover (Case 2) biorefinery capacities in excess of 10 000 DMTday are possible with a terminal located 100 miles from the biorefinery thus the feedstock supply cost is constant for Case 2 Similarly the feedstock supply cost
is constant for biorefinery capacities ranging from 500 to 5000 DMTday for Georgia switchgrass (Case 3) However at biorefinery capacities of 7500 and 10 000 DMTday for Georgia switchgrass a larger cropping area and thus a larger terminal-to-biorefinery distance (300 miles) is required
Conversion to ethanol
Conversion methods
Techno-economic analyses for the biochemical process of making ethanol from corn stover or switchgrass were pershyformed by scaling the biochemical process design model for corn stover that was developed at NREL4
For this study we assumed that the feedstock convertshyibility is the same for similar feedstock types (ie corn stover and switchgrass) as well as between the feedstock formats (ie CBS and AUD) All conversion data are based on those reported for corn stover (using CBS)4 using the feedstock composition data displayed in Table 5
290 copy 2013 Society of Chemical Industry and John Wiley amp Sons Ltd | Biofuels Bioprod Bioref 7282ndash302 (2013) DOI 101002bbb
Xylan 1953 2250
Moisture 12 15
Modeling and Analysis Biochemical biorefinery sizing and environmental sustainability impacts AM Argo et al
Table 5 Corn stover and switchgrass compositions used for this study
IA Corn Stover GA SwitchgrassComponent (dry wt ) (dry wt )
Glucan 3505 3500
Lignin 1576 2260
Ash 493 330
Acetate 181 180
Protein 310 120
Extractives 1465 970
Arabinan 238 310
Galactan 143 050
Mannan 060 030
Sucrose 077 000
Total structural carbohydrates 5899 6140
IA Corn Stover (bulk GA Switchgrass wt) (bulk wt)
The minimum ethanol selling prices (MESP) to give a 10 after-tax internal rate of return were calculated using a standard discounted cash flow rate of return analysis and the financial assumptions included in an earlier NREL report4
Results
Figure 5 shows the breakdown of the MESP (biorefi nery only) as a function of biorefinery plant size for each case
In all cases MESP decreases as biorefi nery size increased AUD logistics and processing costs are essenshytially constant for Iowa corn stover thus rising feedstock costs do not limit the economies-of-scale for biorefi neries in excess of 10 000 DMTday In the case of lower-yielding feedstock (county-yield) such as Georgia switchgrass increases in feedstock costs start to balance biorefi nery economies-of-scale at biorefinery capacities in excess of gt5000 DMTday
Due to the higher logistics costs the MESP for AUD corn stover (Case 2) is approximately $025gal higher than that for CBS (Case 1) at small biorefinery capacities (lt2000 DMT day) However this study suggests that increasing the bioreshyfinery size to 5000 DMTday will more than offset the MESP increase associated with more expensive AUD pre-processed feedstock Biorefinery capacities in excess of 10 000 DMT day are only possible with AUD and the resulting MESPs are substantially lower than that with CBS
As the biorefinery size increases from 500 to 10 000 DMTday with AUD logistics the MESP decreases from $372 to $225 per gallon for IA-corn stover and $337 to $204 per gallon for GA-switchgrass The lower MESP for switchgrass compared to that for corn stover is attributed to lower feedstock cost higher ethanol yield and higher byproduct electricity credit
Water
In this section the water resource use and the impact on water quality are analyzed Water resource analysis
Figure 5 M inimum ethanol selling price (MESP) as a function of plant size
copy 2013 Society of Chemical Industry and John Wiley amp Sons Ltd | Biofuels Bioprod Bioref 7282ndash302 (2013) DOI 101002bbb 291
AM Argo et al Modeling and Analysis Biochemical biorefinery sizing and environmental sustainability impacts
focuses on the consumptive use of rainfall (green water) and of surface and ground water (blue water) through irrigation and process water use Water quality analysis focuses on discharged water from fields containing fertishylizer and process water discharge (grey water) Th e water footprint for the three types of water is considered for the feedstock growing stage and conversion stage for the procshyess described earlier Detailed methodologies of the water footprint assessment for the green blue and grey water are described elsewhere13 30
Data sources and assumptions
We used public data sources for this work including govshyernment reports and open literature In the case that data were not available we relied on a combination of model simulation and statistical regression We assumed that soil moisture level is sufficient to meet the lowest water demand for switchgrass so that irrigation is not required in the state of Georgia
Climate irrigation crop and nutrient loading data
Water footprint calculation relies heavily on climate agricultural and hydrological data All of the climate data used in this study were derived from the National Climate Data Center of NOAA for the period from 1970 to 200014 Agricultural data for crop harvested acreshyage were from USDA NASS15 Irrigation application data were acquired from the 2002 and 2007 Census of Agriculture16 17 and the Farm and Ranch Irrigation Survey18 19 published by the USDA and USGS20 Th e crop coeffi cient Kc used in estimating evapotranspiration (ET the loss of water from the soil by evaporation and by transpiration from the crops) was compiled from the High Plains Regional Climate Center21 the Texas High Plains Evapotranspiration network22 and the previous studies of Kiniry et al2324 Climate in 2017 was assumed to remain the same as the historical average from 1970 to 2000 However the irrigation demand was further adjusted from historical values to reflect the increase of corn acreage and yield25 (Table 6) Nitrogen loading (data not included here) a key component of interest in grey water in IA and GA was estimated using results from SPARROW model26 27 Nitrogen fertilizer input rates for switchgrass were estimated by POLYSYS Regular corn field fertilizer input were simulated by a SWAT hydrologic model based on USDA state-level data28 29 while s upshyplemental fertilizer inputs were provided by POLYSYS A natural background nitrogen concentration CN was
compiled from USGS30 Nutrient loading for SWG was estimated from alfalfa27 Based on the historical monitorshying data sets for total nitrogen and nitrate (USGS30) CN is assumed to be 95 of the total nitrogen concentration in stream water Nitrogen fertilizer input data are included in Table 7 A comparison of the SWAT and SPARROW model in the studied areas showed good agreement for average values while SPARROW projected less veriabilishyties31 All of the watershed-scale calculations in this study were further converted into county-level data using the zonal statistics tool in ArcGIS
Water allocation
Corn plants produce grain and stover both of which can be used as biofuel feedstock During its growth corn grain and stover each appropriate a fraction of the total water requirement The same fraction was assumed in partionshying the water footprint associated with stover based biofuel production The blue water and green water of corn is partitioned between grain and stover by applying a crop harvest index32
Conversion process water use
Consumptive water use at the biorefinery is estimated from the process model described earlier Depending on the production scale and feedstock the normalized procshyess water use ranges from 53 to 56 LL ethanol produced The conversion process water is supplied from surface and ground water sources and therefore its use contributes only to the blue water footprint
In the conversion process more bio-electricity is proshyduced than that needed for the biorefinery and thus the excess power is sold to the grid A water use credit from the export electricity is considered using a system expanshysion approach Electricity generation water consumption factors from electricity generation mix in IA (05279 gal waterKwh) and GA (06403 gal waterKwh) were adopted from a Power-Water tool3334
Results
In general the blue water footprint of corn stover- and of switchgrass-derived ethanol ranged from 43 to 73 gal per gallon ethanol (Fig 6) similar to that of conventional oil sands production35 Switchgrass-derived ethanol (Case 3) requires less blue water than corn stover-derived ethanol (Case 1 or 2) because of savings from switchgrass irrigashytion Export bioelectricity contributes a 1 galgal water credit to the blue water footprint reducing total blue water use by 12ndash20
292 copy 2013 Society of Chemical Industry and John Wiley amp Sons Ltd | Biofuels Bioprod Bioref 7282ndash302 (2013) DOI 101002bbb
Modeling and Analysis Biochemical biorefinery sizing and environmental sustainability impacts AM Argo et al
Table 6 Projected corn irrigation volume by 2017
FIPS Case 1 Case 2 Case 1 Case 2 Irrigated Area
Fraction Case 1 Case 2
Corn Yield Harvested Acreage Irrigation Water Use Volume
DMTac 1000 Acre MGY
19017 212 217 29 81 06 282 777
19033 223 255 55 152 06 443 1220
19057 175 180 19 52 18 487 1339
19059 203 204 30 84 08 412 1135
19065 183 191 62 170 06 557 1533
19067 215 246 43 119 07 418 1150
19071 175 175 29 79 32 1663 4579
19077 178 178 37 102 14 852 2346
19081 231 257 50 139 07 520 1431
19085 184 184 65 179 121 13714 37756
19099 233 248 41 112 06 292 803
19103 157 157 45 123 13 695 1913
19109 219 220 48 131 06 401 1104
19111 137 137 14 38 14 264 726
19115 167 174 31 84 50 2504 6895
19119 228 237 61 169 07 927 2552
19125 169 169 25 70 07 328 902
19127 249 277 57 158 06 458 1260
19131 240 285 49 135 09 554 1525
19133 184 186 41 114 216 19403 53420
19139 173 185 31 85 26 1146 3156
19143 228 230 39 109 11 734 2020
19147 212 216 49 134 14 1060 2918
19149 207 211 89 245 10 1655 4557
19155 218 218 77 211 08 1198 3299
19161 241 281 54 148 07 562 1547
19163 202 216 31 85 09 351 966
19167 239 257 82 226 18 3080 8479
19193 272 272 64 176 27 3710 10214
19195 240 284 45 125 07 181 497
19197 244 289 64 175 05 444 1222
Counties might not require irrigation if not listed in the table
Green water contributes the most to the overall water footprint in both Case 1 and Case 2 and its relative conshytribution is significantly larger in Case 3 (Fig 7) due to the climate differences between GA and IA In particular GA has higher evapotransporation than IA28 Additionally green and blue water in Case 1 and Case 2 represent only the portion of water allocated to corn stover and the water use in the biorefinery whereas in Case 3 the results
represent all water associated with the entire above-ground switchgrass plant in addition to biorefi nery blue water use (Fig 7)
Grey water for the corn stover cases (Case 1 and Case 2) is attributable to the fraction of fertilizer required durshying the corn growth and supplemental fertilizer applicashytion to replace nutrients lost with stover removal Th e average grey water in Case 1 and Case 2 is estimated at
copy 2013 Society of Chemical Industry and John Wiley amp Sons Ltd | Biofuels Bioprod Bioref 7282ndash302 (2013) DOI 101002bbb 293
AM Argo et al Modeling and Analysis Biochemical biorefinery sizing and environmental sustainability impacts
Table 7 Nitrogen fertilizer application rate on stover (Cases 1 and 2) at Iowa and switchgrass at Georgia (Case 3) The unit is in kg N per stover or switchgrass harvested acreage
FIPS (IA) Case 1 Supplement Case 2 Supplement Corn FIPS (GA) Case 3 SWG FIPS (GA) Case 3 SWG Fertilizer Fertilizer Fertilizer Fertilizer Fertilizer
kgac kgac kgac kgac kgac
19001 1289 1289 5468 13001 6586 13201 ndash
19005 1052 1052 5521 13005 7048 13207 7800
19049 1232 1292 5509 13051 ndash 13251 7800
19003 1098 1098 2671 13003 7522 13205 ndash
19051 522 522 5692 13053 ndash 13253 ndash
19053 700 700 2671 13055 6745 13255 ndash
19055 1367 1406 5966 13057 ndash 13257 ndash
19007 608 608 5532 13007 ndash 13209 5834
19009 1821 1821 5485 13009 ndash 13211 7800
19011 1384 1440 5965 13011 3545 13213 7800
19013 1330 1392 5963 13013 ndash 13215 ndash
19015 1597 1620 5815 13015 7800 13217 5853
19017 1571 1609 5967 13017 7539 13219 7800
19019 956 982 5982 13019 7044 13221 7800
19021 1645 1725 5364 13021 6709 13223 ndash
19023 1616 1830 5875 13023 6921 13225 7800
19025 1605 1825 5388 13025 5840 13227 ndash
19027 1838 2116 5448 13027 6279 13229 6622
19029 1593 1593 2671 13029 6983 13231 6561
19031 1355 1407 5898 13031 6179 13233 7800
19033 1652 1889 5845 13033 7800 13235 6318
19035 1790 1928 2671 13035 ndash 13237 ndash
19037 1323 1336 5925 13037 ndash 13239 ndash
19039 436 436 5467 13039 ndash 13241 5845
19041 1636 1713 5644 13043 6090 13243 ndash
19043 1474 1474 5683 13045 4767 13245 ndash
19045 1156 1161 5976 13047 7800 13247 ndash
19047 1862 1862 2671 13049 ndash 13249 7800
19057 1296 1332 6044 13059 ndash 13259 7772
19059 1504 1512 5598 13061 7800 13261 7800
19061 1352 1352 5829 13063 ndash 13263 ndash
19063 1602 1641 5757 13065 5840 13265 ndash
19065 1355 1410 5845 13067 ndash 13267 5838
19067 1595 1824 5866 13069 5819 13269 7101
19069 1789 2142 5937 13071 ndash 13271 7239
19071 1292 1292 2671 13073 ndash 13273 7800
19073 1697 1998 5417 13075 ndash 13275 7080
19075 1742 1851 5973 13077 7800 13277 7456
19077 1314 1314 5481 13079 ndash 13279 6483
19079 1641 1672 6036 13081 7223 13281 5289
294 copy 2013 Society of Chemical Industry and John Wiley amp Sons Ltd | Biofuels Bioprod Bioref 7282ndash302 (2013) DOI 101002bbb
Modeling and Analysis Biochemical biorefinery sizing and environmental sustainability impacts AM Argo et al
Table 7 (Continued)
FIPS (IA) Case 1 Supplement Fertilizer
Case 2 Supplement Fertilizer
Corn Fertilizer
FIPS (GA) Case 3 SWG Fertilizer
FIPS (GA) Case 3 SWG Fertilizer
kgac kgac kgac kgac kgac
19081 1707 1904 6040 13083 ndash 13283 6959
19083 1603 1645 6081 13085 ndash 13285 ndash
19085 1363 1363 2671 13087 ndash 13287 6841
19087 1264 1264 5711 13089 ndash 13289 6691
19089 1375 1446 5828 13091 7367 13291 4111
19091 1804 2169 5880 13093 5814 13293 ndash
19093 1849 2033 2671 13095 ndash 13295 7800
19095 1287 1287 5943 13097 ndash 13297 5853
19097 1074 1074 6033 13099 ndash 13299 6652
19099 1724 1839 5901 13101 ndash 13301 6875
19101 1202 1202 5663 13103 7800 13303 6871
19103 1159 1159 5931 13105 7150 13305 5827
19105 1118 1135 5955 13107 5819 13307 7800
19107 1314 1314 5854 13109 7800 13309 ndash
19109 1618 1627 6018 13111 ndash 13311 6007
19111 1014 1014 5794 13113 ndash 13313 ndash
19113 1000 1008 5949 13115 ndash 13315 7610
19115 1239 1289 5961 13117 5289 13317 7800
19117 526 526 5408 13119 7800 13319 7800
19119 1690 1751 2671 13121 ndash 13321 7656
19121 1089 1089 5466 13123 ndash
19123 1295 1316 5713 13125 5835
19125 1251 1251 5476 13127 ndash
19127 1840 2052 5988 13129 7800
19129 1474 1474 2671 13131 ndash
19131 1775 2109 5944 13133 7800
19133 1364 1375 2671 13135 ndash
19135 751 751 5297 13137 5845
19137 1339 1339 2671 13139 5929
19139 1280 1369 5996 13141 ndash
19141 1697 1708 2671 13143 ndash
19143 1688 1705 2671 13145 ndash
19145 1178 1178 2671 13147 7800
19147 1570 1599 5642 13149 7800
19149 1535 1561 2671 13151 7800
19151 1683 1737 5619 13153 7424
19153 1308 1405 5641 13155 7480
19155 1616 1616 2671 13157 5853
19157 1548 1577 5930 13159 ndash
19159 540 540 2671 13161 6724
19161 1784 2078 5364 13163 7196
copy 2013 Society of Chemical Industry and John Wiley amp Sons Ltd | Biofuels Bioprod Bioref 7282ndash302 (2013) DOI 101002bbb 295
AM Argo et al Modeling and Analysis Biochemical biorefinery sizing and environmental sustainability impacts
Table 7 (Continued)
FIPS (IA) Case 1 Supplement Case 2 Supplement Corn FIPS (GA) Case 3 SWG FIPS (GA) Case 3 SWG Fertilizer Fertilizer Fertilizer Fertilizer Fertilizer
kgac kgac kgac kgac kgac
19163 1494 1596 6000 13165 7800
19165 1660 1660 2671 13167 6271
19167 1766 1899 2671 13169 ndash
19169 1561 1566 5996 13171 ndash
19171 1512 1514 5978 13173 6469
19173 629 629 2671 13175 7213
19175 737 737 5467 13177 7800
19177 646 646 5418 13179 ndash
19179 1099 1099 5455 13181 ndash
19181 1290 1290 5467 13183 5844
19183 1665 1708 5824 13185 5868
19185 552 552 2671 13187 4895
19187 1664 1668 5703 13189 ndash
19189 1599 1599 5909 13191 ndash
19191 1249 1253 5793 13193 7800
19193 2013 2013 2671 13195 5853
19195 1778 2102 5841 13197 7800
19197 1803 2136 6081 13199 7800
Figure 6 Blue water footprint of cellulosic ethanol produced from corn stover (Cases 1 and 2) and switchgrass (Case 3) by production stage at refinery scale of 2000 DMTday in 2017
850 and 820 gallons water per gallon ethanol respecshytively The average grey water in Case 3 which accounts for assimilating the total fertilizer applied during the entire growth period is only 210 gallons water per galshylon ethanol Results clearly indicate the unique ability of switchgrass to capture nutrient runoff in addition to lower fertilizer input requirements thereby reducing grey
Figure 7 Green and grey water footprint of cellulosic ethashynol produced from corn stover (Cases 1 and 2) and switch-grass (Case 3) by production stage at refinery scale of 2000 DMTday in 2017
water loadings Historically switchgrass has been used in conservation programs to contain the fertilizer loss to water body from crop land
At the same refinery capacity choice of feedstock and location could have significant impacts on types of water footprint of the cellulosic biofuel Since a majority of
296 copy 2013 Society of Chemical Industry and John Wiley amp Sons Ltd | Biofuels Bioprod Bioref 7282ndash302 (2013) DOI 101002bbb
Modeling and Analysis Biochemical biorefinery sizing and environmental sustainability impacts AM Argo et al
Figure 8 County-level distributions of blue green and grey water footprint for a 2000 DMTd biorefinery in 2017 to produced biofuel from (a) corn stover grown in Iowa via advanced logistic system (Case 2) and (b) switchgrass grown in Georgia via advanced logistic system (Case 3)
water requirements in the biofuel life cycle are from the feedstock growing stage the water footprint of a particushylar biofuel is largely determined by regional climate For example with the same advanced logistic system cellushylosic ethanol produced from switchgrass in biorefi neries located in Georgia (Case 3) requires 39 less blue water footprint than that for Iowa stover in Case 2 (Fig 6) Since the total water requirement for crop growth would be satshyisfied either from rainfall (green water) or irrigation (blue water) lower green water footprint often means increased blue water footprint for the same plant species (Fig 8)
Switchgrass is a high yield perennial which requires substantial evapotransporation to support its growth Switchgrass can be cultivated in many regions in the USA without irrigation and thus producing rain-fed switch-grass could have less impact on regional blue water use than other crops requiring irrigation
Biorefinery water supply is entirely blue water and biorefinery water demand is concentrated in a single local area Thus a biorefinery built in an area where the local feedstock is blue-water-intensive would likely lead to an increased burden on the local water resources as compare to a biorefinery built in an area with less blue-watershyintensive feedstocks Therefore it is environmentally benshyeficial to develop switchgrass or other perennial feedstock
plantations in regions with sufficient green water supply to ensure sustainable water use for the feedstock and the biorefi nery
From a whole biorefinery production perspective the resource needs for blue water becomes more pronounced as biorefinery scale increases Further CBS logistics systems dictate that the biorefinery be located near the biomass feedstock production whereas AUD logistics effectively decouple biorefinery location from feedstock production Therefore we expect that CBS logistics would stress a local water resource to a greater extent than AUD logistics Figure 8 further shows the extensive geographishycal variability of blue andf green water footprint even within a state which would affect the choice of feedstock thereby influence the refinery siting consideration
Sustainability metrics and life cycle assessment
SimaPro v73 life cycle assessment modeling soft ware was used to develop and link unit processes using estabshylished methods36 In the absence of primary publicly available data we used the Ecoinvent v20 and to a lesser extent the US Life Cycle Inventory (US LCI) processes We modified the Ecoinvent processes to be refl ective of
copy 2013 Society of Chemical Industry and John Wiley amp Sons Ltd | Biofuels Bioprod Bioref 7282ndash302 (2013) DOI 101002bbb 297
AM Argo et al Modeling and Analysis Biochemical biorefinery sizing and environmental sustainability impacts
Figure 9 GHG emi ssions LCA results for Case 1 Iowa corn stover CBS Case 2 Iowa corn stover AUD and Case 3 Georgia switchgrass AUD
US conditions and the US LCI processes to account for embodied emissions and energy fl ows
Modeling approach and assumptions
The modeling boundary for this study is from fi eld to refinery gate including embodied energy and material flows using the methods described elsewhere36 Th e funcshytional unit is 1 gallon of ethanol produced in the year 2017 Avoided impacts are accounted for using product displacement (also termed boundary system expansion)15
For products that share inputs (eg corn grain and corn stover) burdens are allocated between products based on a lsquoproduct-purposersquo approach Inputs to multi-year cropping systems (ie switchgrass) are likewise annualized by the length of the cropping rotation Impacts from direct and indirect land use change are not considered in this study Feedstock processing and transport are modeled accordshying to INLrsquos CBS and AUD
LCA modeling results
A breakdown of the GHG emission (in terms of CO2 equivalent) for each of the cases is displayed graphically in Fig 9 When comparing AUD to CBS moderate increases in GHG emissions observed in the Iowa corn stover
biochemical conversion-to-ethanol are associated with additional field-to-depot and depot-to-terminal transporshytation steps (lsquoPre-processing otherrsquo category in Fig 9) and increased transportation contribution to the biorefi nery (lsquoFeedstock transportationrsquo category) The small increases in normalized (per gallon of ethanol) electricity credit with increasing biorefinery scale are associated with increased electricity generation efficiency As expected we observe small feedstock differences in GHG emissions for Iowa corn stover and Georgia switchgrass
Conclusions
As expected we demonstrated that CBS has lower average logistics costs than AUD AUD logistic costs are higher than CBS costs primarly due to increased pre-processing costs and increased transportation costs (with multiple transportation step) Likewise and similar to earlier studshyies3 we also show that with CBS logistic costs increase as either biorefinery capacity or feedstock collection radius increase AUD mitigates many of the CBS feedstock-supshyply risks and while resulting in modestly higher logistics costs dramatically reduces both the temporal and spatial biomass-cost variability and allows access to substantially larger quantities of biomass
298 copy 2013 Society of Chemical Industry and John Wiley amp Sons Ltd | Biofuels Bioprod Bioref 7282ndash302 (2013) DOI 101002bbb
Modeling and Analysis Biochemical biorefinery sizing and environmental sustainability impacts AM Argo et al
1 AUD effectively disconnects the feedstock from the biorefinery in terms of both scale and location Single or multiple terminals can supply single or multiple biorefineries of varying scale Biorefi nery locations can be optimized for logistics distribution water resources or other project-specifi c constraints
2 AUD promotes more sustainable cropping practices whereas with CBS there is always pressure to produce the same crop
3 AUD providers have much tighter control on biomass production specifications than is possible with CBS
Iowa corn stover supply costs with CBS increase as biorefinery capacity increases from 500 to 2000 DMTday however the biorefinery economy-of-scale impact is larger in magnitude and the overall MESP decreases from $345 gal to $248gal going from 500 to 2000 DMTday bioreshyfinery scale It must be noted that CBS was not considered for biorefinery capacities of 5000 DMT or greater as the existing models do not capture the substantial additional infrastructure required to manage the high throughput of trucks through the biorefi nery
Iowa corn stover supply costs with the AUD are conshystant for biorefineries ranging from 500 to gt10 000 DMT day and as a result the MESP is reduced from $372gal to $225gal Similar to Iowa corn stover Georgia switch-grass feedstock supply costs are constant using the AUD for biorefineries ranging from 500 to 5000 DMTday however for biorefineries larger than ~5000 DMTday the terminal-to-biorefinery distance needs to be increased from 100 miles to 300 miles to supply the larger capacishyties As a result the MESP for Georgia decreases from $337gal to approximately $204gal as the biorefi nery capacity is increased from 500 DMTday to 10 000 DMT day Only small if any cost reductions are expected for capacities greater than 10 000 DMTday Results of this study show that biochemical ethanol production using a CBS results in the lowest MESP at small biorefi nery scales At larger biorefineries (gt5000 DMTday) these analyses suggest that AUD logistics result in producshytion costs lower than those possible with conventional systems
Our results show no detrimental effects on water sustainability metrics when comparing AUD to CBS Nevertheless feedstock location and feedstock type do affect water use and quality so if biorefineries use diff ershyent feedstocks or pull feedstocks from diff erent locations than those modeled here the results will change Th is study also did not consider the local impact on water resources when siting a large biorefinery We expect that
large biorefineries such as those enabled by the AUD will require a water footprint commensurate to their scale and hence may stress the water resources of a specifi c area where the biorefinery is located
Our results show that AUD logistics result in modestly higher GHG emissions (10ndash15) than CBS mainly due to additional field-to-depot and depot-to-terminal transporshytation (lsquoPre-processing otherrsquo category in Fig 9) steps and increased transportation contribution to the biorefi nery (lsquoFeedstock transportationrsquo category)
One potential issue not addressed in this work is that biomass resulting from AUD pre-processing are subshystantially changed physically and potentially chemically compared to materials collected using CBS (eg lignin is plasticized) This may aff ect biorefinery yield operability and production costs and thus future work will need to experimentally verify and quantify biochemical convershysion of these materials and adapt the modelsanalyses accordingly
Acknowledgement
We thank the US Department of Energy for funding and supporting this work
References 1 US DOE US Billion-Ton Update Biomass Supply for
a Bioenergy and Bioproducts Industry USDOE report no ORNLTM-2011224 lead by Perlack RD and Stokes BJ United States Department of Energy and Oak Ridge National Laboratory Oak Ridge TN pp 227 (2011)
2 Riley C and Schell D Technical and Economic Analysis of an Enzymatic Hydrolysis Based Ethanol Plant internal report Solar Energy Research Institute Golden CO (1991)
3 Aden A Ruth M Ibsen K Jechura J Neeves K Sheehan J et al Lignocellulosic Biomass to Ethanol Process Design and Economics Utilizing Co-Current Dilute Acid Prehydrolysis and Enzymatic Hydrolysis for Corn Stover report no NREL TP-510-32438 National Renewable Energy Laboratory Golden CO pp 154 (2002)
4 Humbird D Davis R Tao L Kinchin C Hsu D Aden A et al Process Design and Economics for the Conversion of Lignocellulosic Biomass to Ethanol Dilute-Acid Pretreatment and Enzymatic Hydrolysis of Corn Stover report no NREL TP-510-47764 National Renewable Energy Laboratory Golden CO pp 147 (2011)
5 Searcy E Wright C Muth D Hess JR and Jacobson J The Limits of a 50 Mile Collection Radius for Biomass Supply to a Biorefi nery draft report Idaho National Laboratory Idaho Falls ID (2010)
6 Hess JR Wright CT Kenney KL and Searcy EM Uniform-Format Solid Feedstock Supply System A Commodity-Scale Design to Produce and Infrastructure-Compaible Bulk Solid from Lignocellulosic Biomass ndash Executive Summary report no INLEXT-09-15423 Idaho National Laboratory Idaho Falls ID (2009)
copy 2013 Society of Chemical Industry and John Wiley amp Sons Ltd | Biofuels Bioprod Bioref 7282ndash302 (2013) DOI 101002bbb 299
AM Argo et al Modeling and Analysis Biochemical biorefinery sizing and environmental sustainability impacts
7 Jacobson JJ and Searcy EM Uniform-Format Feedstock Supply System Design for Woody Biomass Presented at the Spring Conference of the AICHe Orlando FL April (2010)
8 Langholtz M Graham RC Eaton L Perlack R Hellwinckel C and De la Torre Ugarte D Price projections of feedstocks for biofuels and biopower in the US Energy Policy41484ndash493 (2012)
9 USDA NASS Agricultural Prices Paid US [Online] Department of Agriculture National Agricultural Statistics Service Available at httpusdamannlibcornelledu MannUsdaviewDocumentInfododocumentID =1002 [September 19 2012]
10 USDA-OCEWAOB Agricultural Projects to 2018 Long-term Projections Report OCE-2010-1 US Department of Agriculture and Office of the Chief Economist World Agricultural Outlook Board Washington DC (2009)
11 US Congress Energy Independence and Security Act of 2007 110th Congress 1st Session HR 6 4 (2007)
12 US EIA Annual Energy Outlook 2010 Report No DOEEIAshy0383 US Energy Information Administration Washington DC (2010)
13 Wu M Chiu YW and Demissie Y Quantifying the regional water footprint of biofuel production by incorporatshying hydrologic modeling Water Resrouce Research DOI1010292011WR011809 (2012)
14 NOAA NCDC 1971-2000 US Climate Normals Products Clim 84 Daily Normals [Online] NOAA National Climate Data Center Available at httpwwwncdcnoaagov [September 19 2012]
15 Wang M Huo H and Arora S Methods of dealing with coshyproducts of biofuels in life-cycle analysis and consequent results within the US context Energy Policy 395726ndash5736 (2011)
16 USDA 2002 Census of Agriculture US Department of Agriculture Washington DC (2004)
17 USDA 2007 Census of Agriculture US Department of Agriculture Washington DC (2010)
18 USDA 2008 Farm and Ranch Irrigation Report No AC-02-SS-1 US Department of Agriculture Washington DC (2009)
19 USDA 2003 Farm and Ranch Irrigation Survey Report No AC-02-SS-1 US Department of Agriculture Washington DC (2004)
20 USGS Water Use in the United States 1985 1990 and 1995 [Online] US Geological Survey Available at httpwaterusgs govwatuse [September 19 2012]
21 High Plains Regional Climate Center Crop Coeffi cients for Corn [Online] Available at httpwwwhprccunleduawdn etcropcrop_corntxt [September 19 2012]
22 Marek T Colaizzi P Howell TA Dusek D and Porter D Estimating Seasonal Crop ET Using Calendar and Heat Unit Based Crop Coefficients in the Texas High Plains Evapotranspiration Network Presented at 2006 ASAE Annual Meeting American Society of Agricultural and Biological Engineers Portland OR pp 9ndash12 (2006)
23 Kiniry J Lynd L Greene N Johnson M Casler M and Laser MS Biofuels and water use Comparison of maize and switch-grass and general perspectives new research on biofuels ed by Wright JH and Evans DA Nova Science Publishing New York ( 2008 )
24 Kiniry JR Tischler CR and Van Esbroeck GA Radiation use efficiency and leaf CO2 exchange for diverse C4 grasses Biomass Bioenerg 17(2)95ndash112 (1999)
25 Grassini P Yang H and Cassman KG Limits to maize proshyductivity in western corn-belt A simulation analysis for fully irrigated and rainfed conditions Agr Forest Meteor 1491254ndash 1265 (2009 )
26 Hoos AB and McMahon G Spatial analysis of instream nitroshygen loads and factors controlling nitrogen delivery to streams in the Southeastern United States using spatially referenced regression on watershed attributes (SPARROW) and regional classifi cation frameworks Hydrol Process 232275ndash2294 (2009)
27 Hoos AB Terziotti S McMahon G Savvas K Tighe KC and Alkons-Wolinsky R Data to Support Statistical Modeling of Instream Nutrient Load Based on Watershed Attributes Southeastern United States 2002 US Geological Survey pp 50 (2008)
28 Demissie Y Yan E and Wu M Assessing regional hydrology and water quality implications of large-scale biofuel feedstock production in the Upper Mississippi river basin Environ Sci Technol 469174ndash9182 (2012)
29 Wu M Demissie Y and Yan E Simulated impact of future bioshyfuel production on water quality and water cycle dynamics in the Upper Mississippi river basin Biomass Bioenerg 4144ndash56 (2012)
30 Smith RA Alexander RB and Schwarz GE Natural backshyground concentrations of nutrients in streams and rivers of the conterminous United States Environ Sci Technol 373039ndash 3047 (2003)
31 Chiu YW and Wu M Assessing county-level water footprints of different cellulosic-biofuel feedstock pathways Environ Sci Technol 469155ndash9162 (2012)
32 White PJ CORN Chemistry and Technology 2nd edn ed byWhite PJ and Johnson LA American Association of Cereal Chemists Inc St Paul MN (2003)
33 Wu M and Peng MJ Developing a tool to estimate water withshydrawal and consumption in electricity generation in the United States Report No ANLESD11-2 update Argonne National Laboratory (2011)
34 ANL TTRDC GREET Model [Online] Argonne National Laboratory Transportation Technology RampD Center Chicago IL Available at httpgreetesanlgovindex phpcontent= power_water [August 21 2012]
35 Wu M Mintz M Wang M and Arora S Water consumption in the production of ethanol and petroleum gasoline Environ Manage 44981ndash997 (2009)
36 Hsu DD Inman D Heath GA Wolfrum EJ Mann MK and Aden A Life cycle environmental impacts of selected US ethanol production and use pathways in 2022 Environ Sci Technol 445289ndash5297 (2010)
300 copy 2013 Society of Chemical Industry and John Wiley amp Sons Ltd | Biofuels Bioprod Bioref 7282ndash302 (2013) DOI 101002bbb
Modeling and Analysis Biochemical biorefinery sizing and environmental sustainability impacts AM Argo et al
Andrew Argo
Dr Andrew Argo is senior engineer in the system integration group at the National Renewable Energy Laboratoshyry His work supports the Department of Energy Biomass Program in the areas of strategic systemlevel analysis and integrated biorefinery projects monitoring
Eric C D Tan
Dr Tan is a Senior Research Engineer in the Biorefinery Analysis Group of the National Bioenergy Center at the National Renewable National Laborashytory (NREL) His research interests include the process design economshyics and sustainability for conversion of lignocellulosic biomass to biofuels
with particular emphasis on the application of techno-economic analysis and life cycle assessment methods He also has broad experience in chemically reacting flow simulation and heterogeneous catalysis
Daniel Inman
Dr Daniel Inman is a research scienshytist at the National Renewable Energy Laboratory in Golden Colorado His primary research interests are centered on the sustainability biofuel producshytion and use He is currently involved in several modeling projects including lifecycle assessment of multiple biofushy
els and using system dynamics to examine the growth of the cellulosic biofuels industry
Matthew H Langholtz
Dr Matthew Langholtz is a Natural Resource Economist in the Bioenergy Group at Oak Ridge National Laborashytory He is principle investigator (PI) of the Resource Analysis Project of the Bioenergy Group at Oak Ridge Nationshyal Lab as well as the Short-Rotation Woody Crop Sustainability project His
research interests include biomass resource economics short-rotation woody crops and bioenergy from forest resources He has worked on valuation of non-market externalities and developed biomass supply curves for commercial projects the South and the United States
Laurence M Eaton
Laurence Eaton is a Research Scientist at the Oak Ridge National Laborashytory in the Bioenergy Resource and Engineering Systems Group of the Environmental Sciences Division An economist by training he conducts research to support bioenergy foreshycasting and analysis using economic
land use models and Geographic Information Science He participates in interdisciplinary Resource Assessment activities to support the efficient and sustainable supply of agricultural and forestry resources for commercial domestic bioenergy and bioproducts markets He has worked in the area of applied microeconomics as it reshylates to bioenergy firm input decisions and the valuation of environmental goods and ecological services
Jacob J Jacobson
Mr Jacobson is a researcher from the Idaho National Laboratory He has a diverse background in systems analysis system dynamics statistical consulting software development and project management His work has been in the development and analysis of decision support systems to evalushy
ate policy options and business risks of complex energy and environmental systems His recent work has been in the area of analysis of biomass feedstock logistics
Christopher T Wright
Dr Chris Wright is manager and a senior research engineer for the Idaho National Laboratoryrsquos Biofuels and Reshynewable Energy Department His work supports the Department of Energy Biomass Program in developing analyshysis tools and technology for feedstock supply logistics and conversion of bioshy
mass to valuable fuels chemicals materials and power His knowledge of DOErsquos Biomass Program includes an emphasis on lignocellulosic feedstock supply systems which includes feedstock characterization development preprocessing handling and transportation issues assoshyciated with refining biomass into fuels and chemicals
copy 2013 Society of Chemical Industry and John Wiley amp Sons Ltd | Biofuels Bioprod Bioref 7282ndash302 (2013) DOI 101002bbb 301
AM Argo et al Modeling and Analysis Biochemical biorefinery sizing and environmental sustainability impacts
David J Muth Jr
Dr Dave Muth is a Research Engishyneer at the Idaho National Laboratory in Biofuels and Renewable Energy Technologies He leads the Analysis and Sustainability Group with the Bioenergy Research Team developshying models and modeling techniques which facilitate the evaluation the
feedstock assembly system as it pertains to creating advanced biofuels He is currently working as a contracshytor to the US Department of Energy Office of Biomass Programs located at DOE Headquarters supporting the establishment of technical objectives and research tarshygets for next generation feedstock supply and logistics systems that deliver high quality biomass feedstocks for advanced hydrocarbon fuel production
May M Wu
Dr May Wu a principal energy systems analyst at Argonne National Laborashytory is the PI of biofuel sustainability research funded by the US Departshyment of Energy Her research interests are in the area of water quality and water quantity associated with large-scale development of biofuel convenshy
tional fuel electricity and emerging fuels and life cycle analysis Dr Wu is leading the effort to develop tools and largescale watershed models to assess spatially explicit water footprint of biofuel produced from conventional cellulosic and advanced feedstock and impact of proshyjected future production on regional nutrient sediment and hydrology Dr Wu served as an expert advisor to the Water Working Group of the Council on Sustainable Biomass Production (CSBP)
Yi-Wen Chiu
Dr Yi-Wen Chiu is a postdoctoral apshypointee in the Energy System Division at the Argonne National Laboratory As an interdisciplinary scientist her main research interests are to understand the coupling and interaction of human and natural systems by applying inteshygrated modeling tools She has been
involved in research related to water footprint and water-energy nexus with broad interests related to scenario analysis and environmental impact assessment She also participates in several studies aiming to advance biofuels by determining the feasible pathways of achieving water sustainability goals
Robin L Graham
Dr Robin L Graham is Deputy Associate Laboratory Director for the Computing Environment and Life Science Directorate at the Argonne National Laboratory Formerly at Oak Ridge National Laboratory she worked in the Bioenergy field for many years pioneering biomass feedstock
resource assessments that incorporated both economic and environmental factors She was an author of the original ldquoBillion Tonrdquo study and contributed to its 2011 follow-up An ecosystem ecologist by training she has long been interested in developing sustainable natural resources and began her career working for the RampD Division of Weyerhaeuser Co She currently is leading Argonnersquos Biological and Environmental Science Initiashytive which aims to accelerate our understanding of the fundamental design principles in biological and environshymental systems
302 copy 2013 Society of Chemical Industry and John Wiley amp Sons Ltd | Biofuels Bioprod Bioref 7282ndash302 (2013) DOI 101002bbb

AM Argo et al Modeling and Analysis Biochemical biorefinery sizing and environmental sustainability impacts
Table 3 Breakdown of feedstock logistics costs by unit operations for CBS and AUD system designs in Boone County IA (a b) and AUD system design in Telfair County GA (c)
a) Conventional bale system costs in Boone County IA for 2000 DMTday biorefi nery
Harvest amp Storage Transportation Preprocessing Handling amp Total Collection (~45 km) Queuing Logistics
$1561 $595 $886 $1494 $083 $4620
b) Advanced uniform system costs in Boone County IA
Harvest amp Storage Depot Transport Depot Terminal Transport Terminal Biorefi nery Handling Total Collection (~17 km) Preprocessing (~80 km) Transport (~170 km) amp Queuing Logistics
$1615 $660 $601 $2479 $314 $154 $895 $083 $6801
c) Advanced uniform system costs in Telfair County GA
Harvest amp Storage Depot Transport Depot Terminal Transport Terminal Biorefi nery Handling Total Collection (~17 km) Preprocessing (~80 km) Transport (~170 km) amp Queuing Logistics
$1637 $554 $623 $2329 $496 $154 $895 $083 $6771
Table 4 Summary of feedstock and average logistics costs (weight averaged) used in biorefinery sizing and sustainability study
Distance to Biorefi nery Size Grower Payment Logistics Total Feedstock Case Location Feed Logistics Biorefi nery (mi) (DMTd) ($DMT) ($DMT) Cost ($DMT)
1 IA Corn stover CBS 15 500 $4689 $4481 $9170
21 1000 $4689 $4540 $9229
30 2000 $4689 $4620 $9309
2 IA Corn stover AUD 100 500 to 10000 $4690 $6801 $11491
3 GA SWG AUD 100 500 to 5000 $3393 $6771 $10164
300 7500 to 10000 $3393 $7377 $10770
system these resources would be stranded and inaccesshysible An example of the breakdown of total logistics cost for all cases are included in Table 3 AUD pre-processing costs are higher than those for CBS costs mainly because of higher pre-processing costs (drying pellitization) and additional transportation steps
Feedstock supply and logistics summary
A summary of the feedstock supply costs (grower payment + average logistic costs) for the work included in this study is displayed in Table 4 Using CBS logistics for Iowa corn stover (Case 1) the feedstock supply cost increases with increasing biorefinery size as a greater collection radius is required In contrast using AUD logistics for Iowa corn stover (Case 2) biorefinery capacities in excess of 10 000 DMTday are possible with a terminal located 100 miles from the biorefinery thus the feedstock supply cost is constant for Case 2 Similarly the feedstock supply cost
is constant for biorefinery capacities ranging from 500 to 5000 DMTday for Georgia switchgrass (Case 3) However at biorefinery capacities of 7500 and 10 000 DMTday for Georgia switchgrass a larger cropping area and thus a larger terminal-to-biorefinery distance (300 miles) is required
Conversion to ethanol
Conversion methods
Techno-economic analyses for the biochemical process of making ethanol from corn stover or switchgrass were pershyformed by scaling the biochemical process design model for corn stover that was developed at NREL4
For this study we assumed that the feedstock convertshyibility is the same for similar feedstock types (ie corn stover and switchgrass) as well as between the feedstock formats (ie CBS and AUD) All conversion data are based on those reported for corn stover (using CBS)4 using the feedstock composition data displayed in Table 5
290 copy 2013 Society of Chemical Industry and John Wiley amp Sons Ltd | Biofuels Bioprod Bioref 7282ndash302 (2013) DOI 101002bbb
Xylan 1953 2250
Moisture 12 15
Modeling and Analysis Biochemical biorefinery sizing and environmental sustainability impacts AM Argo et al
Table 5 Corn stover and switchgrass compositions used for this study
IA Corn Stover GA SwitchgrassComponent (dry wt ) (dry wt )
Glucan 3505 3500
Lignin 1576 2260
Ash 493 330
Acetate 181 180
Protein 310 120
Extractives 1465 970
Arabinan 238 310
Galactan 143 050
Mannan 060 030
Sucrose 077 000
Total structural carbohydrates 5899 6140
IA Corn Stover (bulk GA Switchgrass wt) (bulk wt)
The minimum ethanol selling prices (MESP) to give a 10 after-tax internal rate of return were calculated using a standard discounted cash flow rate of return analysis and the financial assumptions included in an earlier NREL report4
Results
Figure 5 shows the breakdown of the MESP (biorefi nery only) as a function of biorefinery plant size for each case
In all cases MESP decreases as biorefi nery size increased AUD logistics and processing costs are essenshytially constant for Iowa corn stover thus rising feedstock costs do not limit the economies-of-scale for biorefi neries in excess of 10 000 DMTday In the case of lower-yielding feedstock (county-yield) such as Georgia switchgrass increases in feedstock costs start to balance biorefi nery economies-of-scale at biorefinery capacities in excess of gt5000 DMTday
Due to the higher logistics costs the MESP for AUD corn stover (Case 2) is approximately $025gal higher than that for CBS (Case 1) at small biorefinery capacities (lt2000 DMT day) However this study suggests that increasing the bioreshyfinery size to 5000 DMTday will more than offset the MESP increase associated with more expensive AUD pre-processed feedstock Biorefinery capacities in excess of 10 000 DMT day are only possible with AUD and the resulting MESPs are substantially lower than that with CBS
As the biorefinery size increases from 500 to 10 000 DMTday with AUD logistics the MESP decreases from $372 to $225 per gallon for IA-corn stover and $337 to $204 per gallon for GA-switchgrass The lower MESP for switchgrass compared to that for corn stover is attributed to lower feedstock cost higher ethanol yield and higher byproduct electricity credit
Water
In this section the water resource use and the impact on water quality are analyzed Water resource analysis
Figure 5 M inimum ethanol selling price (MESP) as a function of plant size
copy 2013 Society of Chemical Industry and John Wiley amp Sons Ltd | Biofuels Bioprod Bioref 7282ndash302 (2013) DOI 101002bbb 291
AM Argo et al Modeling and Analysis Biochemical biorefinery sizing and environmental sustainability impacts
focuses on the consumptive use of rainfall (green water) and of surface and ground water (blue water) through irrigation and process water use Water quality analysis focuses on discharged water from fields containing fertishylizer and process water discharge (grey water) Th e water footprint for the three types of water is considered for the feedstock growing stage and conversion stage for the procshyess described earlier Detailed methodologies of the water footprint assessment for the green blue and grey water are described elsewhere13 30
Data sources and assumptions
We used public data sources for this work including govshyernment reports and open literature In the case that data were not available we relied on a combination of model simulation and statistical regression We assumed that soil moisture level is sufficient to meet the lowest water demand for switchgrass so that irrigation is not required in the state of Georgia
Climate irrigation crop and nutrient loading data
Water footprint calculation relies heavily on climate agricultural and hydrological data All of the climate data used in this study were derived from the National Climate Data Center of NOAA for the period from 1970 to 200014 Agricultural data for crop harvested acreshyage were from USDA NASS15 Irrigation application data were acquired from the 2002 and 2007 Census of Agriculture16 17 and the Farm and Ranch Irrigation Survey18 19 published by the USDA and USGS20 Th e crop coeffi cient Kc used in estimating evapotranspiration (ET the loss of water from the soil by evaporation and by transpiration from the crops) was compiled from the High Plains Regional Climate Center21 the Texas High Plains Evapotranspiration network22 and the previous studies of Kiniry et al2324 Climate in 2017 was assumed to remain the same as the historical average from 1970 to 2000 However the irrigation demand was further adjusted from historical values to reflect the increase of corn acreage and yield25 (Table 6) Nitrogen loading (data not included here) a key component of interest in grey water in IA and GA was estimated using results from SPARROW model26 27 Nitrogen fertilizer input rates for switchgrass were estimated by POLYSYS Regular corn field fertilizer input were simulated by a SWAT hydrologic model based on USDA state-level data28 29 while s upshyplemental fertilizer inputs were provided by POLYSYS A natural background nitrogen concentration CN was
compiled from USGS30 Nutrient loading for SWG was estimated from alfalfa27 Based on the historical monitorshying data sets for total nitrogen and nitrate (USGS30) CN is assumed to be 95 of the total nitrogen concentration in stream water Nitrogen fertilizer input data are included in Table 7 A comparison of the SWAT and SPARROW model in the studied areas showed good agreement for average values while SPARROW projected less veriabilishyties31 All of the watershed-scale calculations in this study were further converted into county-level data using the zonal statistics tool in ArcGIS
Water allocation
Corn plants produce grain and stover both of which can be used as biofuel feedstock During its growth corn grain and stover each appropriate a fraction of the total water requirement The same fraction was assumed in partionshying the water footprint associated with stover based biofuel production The blue water and green water of corn is partitioned between grain and stover by applying a crop harvest index32
Conversion process water use
Consumptive water use at the biorefinery is estimated from the process model described earlier Depending on the production scale and feedstock the normalized procshyess water use ranges from 53 to 56 LL ethanol produced The conversion process water is supplied from surface and ground water sources and therefore its use contributes only to the blue water footprint
In the conversion process more bio-electricity is proshyduced than that needed for the biorefinery and thus the excess power is sold to the grid A water use credit from the export electricity is considered using a system expanshysion approach Electricity generation water consumption factors from electricity generation mix in IA (05279 gal waterKwh) and GA (06403 gal waterKwh) were adopted from a Power-Water tool3334
Results
In general the blue water footprint of corn stover- and of switchgrass-derived ethanol ranged from 43 to 73 gal per gallon ethanol (Fig 6) similar to that of conventional oil sands production35 Switchgrass-derived ethanol (Case 3) requires less blue water than corn stover-derived ethanol (Case 1 or 2) because of savings from switchgrass irrigashytion Export bioelectricity contributes a 1 galgal water credit to the blue water footprint reducing total blue water use by 12ndash20
292 copy 2013 Society of Chemical Industry and John Wiley amp Sons Ltd | Biofuels Bioprod Bioref 7282ndash302 (2013) DOI 101002bbb
Modeling and Analysis Biochemical biorefinery sizing and environmental sustainability impacts AM Argo et al
Table 6 Projected corn irrigation volume by 2017
FIPS Case 1 Case 2 Case 1 Case 2 Irrigated Area
Fraction Case 1 Case 2
Corn Yield Harvested Acreage Irrigation Water Use Volume
DMTac 1000 Acre MGY
19017 212 217 29 81 06 282 777
19033 223 255 55 152 06 443 1220
19057 175 180 19 52 18 487 1339
19059 203 204 30 84 08 412 1135
19065 183 191 62 170 06 557 1533
19067 215 246 43 119 07 418 1150
19071 175 175 29 79 32 1663 4579
19077 178 178 37 102 14 852 2346
19081 231 257 50 139 07 520 1431
19085 184 184 65 179 121 13714 37756
19099 233 248 41 112 06 292 803
19103 157 157 45 123 13 695 1913
19109 219 220 48 131 06 401 1104
19111 137 137 14 38 14 264 726
19115 167 174 31 84 50 2504 6895
19119 228 237 61 169 07 927 2552
19125 169 169 25 70 07 328 902
19127 249 277 57 158 06 458 1260
19131 240 285 49 135 09 554 1525
19133 184 186 41 114 216 19403 53420
19139 173 185 31 85 26 1146 3156
19143 228 230 39 109 11 734 2020
19147 212 216 49 134 14 1060 2918
19149 207 211 89 245 10 1655 4557
19155 218 218 77 211 08 1198 3299
19161 241 281 54 148 07 562 1547
19163 202 216 31 85 09 351 966
19167 239 257 82 226 18 3080 8479
19193 272 272 64 176 27 3710 10214
19195 240 284 45 125 07 181 497
19197 244 289 64 175 05 444 1222
Counties might not require irrigation if not listed in the table
Green water contributes the most to the overall water footprint in both Case 1 and Case 2 and its relative conshytribution is significantly larger in Case 3 (Fig 7) due to the climate differences between GA and IA In particular GA has higher evapotransporation than IA28 Additionally green and blue water in Case 1 and Case 2 represent only the portion of water allocated to corn stover and the water use in the biorefinery whereas in Case 3 the results
represent all water associated with the entire above-ground switchgrass plant in addition to biorefi nery blue water use (Fig 7)
Grey water for the corn stover cases (Case 1 and Case 2) is attributable to the fraction of fertilizer required durshying the corn growth and supplemental fertilizer applicashytion to replace nutrients lost with stover removal Th e average grey water in Case 1 and Case 2 is estimated at
copy 2013 Society of Chemical Industry and John Wiley amp Sons Ltd | Biofuels Bioprod Bioref 7282ndash302 (2013) DOI 101002bbb 293
AM Argo et al Modeling and Analysis Biochemical biorefinery sizing and environmental sustainability impacts
Table 7 Nitrogen fertilizer application rate on stover (Cases 1 and 2) at Iowa and switchgrass at Georgia (Case 3) The unit is in kg N per stover or switchgrass harvested acreage
FIPS (IA) Case 1 Supplement Case 2 Supplement Corn FIPS (GA) Case 3 SWG FIPS (GA) Case 3 SWG Fertilizer Fertilizer Fertilizer Fertilizer Fertilizer
kgac kgac kgac kgac kgac
19001 1289 1289 5468 13001 6586 13201 ndash
19005 1052 1052 5521 13005 7048 13207 7800
19049 1232 1292 5509 13051 ndash 13251 7800
19003 1098 1098 2671 13003 7522 13205 ndash
19051 522 522 5692 13053 ndash 13253 ndash
19053 700 700 2671 13055 6745 13255 ndash
19055 1367 1406 5966 13057 ndash 13257 ndash
19007 608 608 5532 13007 ndash 13209 5834
19009 1821 1821 5485 13009 ndash 13211 7800
19011 1384 1440 5965 13011 3545 13213 7800
19013 1330 1392 5963 13013 ndash 13215 ndash
19015 1597 1620 5815 13015 7800 13217 5853
19017 1571 1609 5967 13017 7539 13219 7800
19019 956 982 5982 13019 7044 13221 7800
19021 1645 1725 5364 13021 6709 13223 ndash
19023 1616 1830 5875 13023 6921 13225 7800
19025 1605 1825 5388 13025 5840 13227 ndash
19027 1838 2116 5448 13027 6279 13229 6622
19029 1593 1593 2671 13029 6983 13231 6561
19031 1355 1407 5898 13031 6179 13233 7800
19033 1652 1889 5845 13033 7800 13235 6318
19035 1790 1928 2671 13035 ndash 13237 ndash
19037 1323 1336 5925 13037 ndash 13239 ndash
19039 436 436 5467 13039 ndash 13241 5845
19041 1636 1713 5644 13043 6090 13243 ndash
19043 1474 1474 5683 13045 4767 13245 ndash
19045 1156 1161 5976 13047 7800 13247 ndash
19047 1862 1862 2671 13049 ndash 13249 7800
19057 1296 1332 6044 13059 ndash 13259 7772
19059 1504 1512 5598 13061 7800 13261 7800
19061 1352 1352 5829 13063 ndash 13263 ndash
19063 1602 1641 5757 13065 5840 13265 ndash
19065 1355 1410 5845 13067 ndash 13267 5838
19067 1595 1824 5866 13069 5819 13269 7101
19069 1789 2142 5937 13071 ndash 13271 7239
19071 1292 1292 2671 13073 ndash 13273 7800
19073 1697 1998 5417 13075 ndash 13275 7080
19075 1742 1851 5973 13077 7800 13277 7456
19077 1314 1314 5481 13079 ndash 13279 6483
19079 1641 1672 6036 13081 7223 13281 5289
294 copy 2013 Society of Chemical Industry and John Wiley amp Sons Ltd | Biofuels Bioprod Bioref 7282ndash302 (2013) DOI 101002bbb
Modeling and Analysis Biochemical biorefinery sizing and environmental sustainability impacts AM Argo et al
Table 7 (Continued)
FIPS (IA) Case 1 Supplement Fertilizer
Case 2 Supplement Fertilizer
Corn Fertilizer
FIPS (GA) Case 3 SWG Fertilizer
FIPS (GA) Case 3 SWG Fertilizer
kgac kgac kgac kgac kgac
19081 1707 1904 6040 13083 ndash 13283 6959
19083 1603 1645 6081 13085 ndash 13285 ndash
19085 1363 1363 2671 13087 ndash 13287 6841
19087 1264 1264 5711 13089 ndash 13289 6691
19089 1375 1446 5828 13091 7367 13291 4111
19091 1804 2169 5880 13093 5814 13293 ndash
19093 1849 2033 2671 13095 ndash 13295 7800
19095 1287 1287 5943 13097 ndash 13297 5853
19097 1074 1074 6033 13099 ndash 13299 6652
19099 1724 1839 5901 13101 ndash 13301 6875
19101 1202 1202 5663 13103 7800 13303 6871
19103 1159 1159 5931 13105 7150 13305 5827
19105 1118 1135 5955 13107 5819 13307 7800
19107 1314 1314 5854 13109 7800 13309 ndash
19109 1618 1627 6018 13111 ndash 13311 6007
19111 1014 1014 5794 13113 ndash 13313 ndash
19113 1000 1008 5949 13115 ndash 13315 7610
19115 1239 1289 5961 13117 5289 13317 7800
19117 526 526 5408 13119 7800 13319 7800
19119 1690 1751 2671 13121 ndash 13321 7656
19121 1089 1089 5466 13123 ndash
19123 1295 1316 5713 13125 5835
19125 1251 1251 5476 13127 ndash
19127 1840 2052 5988 13129 7800
19129 1474 1474 2671 13131 ndash
19131 1775 2109 5944 13133 7800
19133 1364 1375 2671 13135 ndash
19135 751 751 5297 13137 5845
19137 1339 1339 2671 13139 5929
19139 1280 1369 5996 13141 ndash
19141 1697 1708 2671 13143 ndash
19143 1688 1705 2671 13145 ndash
19145 1178 1178 2671 13147 7800
19147 1570 1599 5642 13149 7800
19149 1535 1561 2671 13151 7800
19151 1683 1737 5619 13153 7424
19153 1308 1405 5641 13155 7480
19155 1616 1616 2671 13157 5853
19157 1548 1577 5930 13159 ndash
19159 540 540 2671 13161 6724
19161 1784 2078 5364 13163 7196
copy 2013 Society of Chemical Industry and John Wiley amp Sons Ltd | Biofuels Bioprod Bioref 7282ndash302 (2013) DOI 101002bbb 295
AM Argo et al Modeling and Analysis Biochemical biorefinery sizing and environmental sustainability impacts
Table 7 (Continued)
FIPS (IA) Case 1 Supplement Case 2 Supplement Corn FIPS (GA) Case 3 SWG FIPS (GA) Case 3 SWG Fertilizer Fertilizer Fertilizer Fertilizer Fertilizer
kgac kgac kgac kgac kgac
19163 1494 1596 6000 13165 7800
19165 1660 1660 2671 13167 6271
19167 1766 1899 2671 13169 ndash
19169 1561 1566 5996 13171 ndash
19171 1512 1514 5978 13173 6469
19173 629 629 2671 13175 7213
19175 737 737 5467 13177 7800
19177 646 646 5418 13179 ndash
19179 1099 1099 5455 13181 ndash
19181 1290 1290 5467 13183 5844
19183 1665 1708 5824 13185 5868
19185 552 552 2671 13187 4895
19187 1664 1668 5703 13189 ndash
19189 1599 1599 5909 13191 ndash
19191 1249 1253 5793 13193 7800
19193 2013 2013 2671 13195 5853
19195 1778 2102 5841 13197 7800
19197 1803 2136 6081 13199 7800
Figure 6 Blue water footprint of cellulosic ethanol produced from corn stover (Cases 1 and 2) and switchgrass (Case 3) by production stage at refinery scale of 2000 DMTday in 2017
850 and 820 gallons water per gallon ethanol respecshytively The average grey water in Case 3 which accounts for assimilating the total fertilizer applied during the entire growth period is only 210 gallons water per galshylon ethanol Results clearly indicate the unique ability of switchgrass to capture nutrient runoff in addition to lower fertilizer input requirements thereby reducing grey
Figure 7 Green and grey water footprint of cellulosic ethashynol produced from corn stover (Cases 1 and 2) and switch-grass (Case 3) by production stage at refinery scale of 2000 DMTday in 2017
water loadings Historically switchgrass has been used in conservation programs to contain the fertilizer loss to water body from crop land
At the same refinery capacity choice of feedstock and location could have significant impacts on types of water footprint of the cellulosic biofuel Since a majority of
296 copy 2013 Society of Chemical Industry and John Wiley amp Sons Ltd | Biofuels Bioprod Bioref 7282ndash302 (2013) DOI 101002bbb
Modeling and Analysis Biochemical biorefinery sizing and environmental sustainability impacts AM Argo et al
Figure 8 County-level distributions of blue green and grey water footprint for a 2000 DMTd biorefinery in 2017 to produced biofuel from (a) corn stover grown in Iowa via advanced logistic system (Case 2) and (b) switchgrass grown in Georgia via advanced logistic system (Case 3)
water requirements in the biofuel life cycle are from the feedstock growing stage the water footprint of a particushylar biofuel is largely determined by regional climate For example with the same advanced logistic system cellushylosic ethanol produced from switchgrass in biorefi neries located in Georgia (Case 3) requires 39 less blue water footprint than that for Iowa stover in Case 2 (Fig 6) Since the total water requirement for crop growth would be satshyisfied either from rainfall (green water) or irrigation (blue water) lower green water footprint often means increased blue water footprint for the same plant species (Fig 8)
Switchgrass is a high yield perennial which requires substantial evapotransporation to support its growth Switchgrass can be cultivated in many regions in the USA without irrigation and thus producing rain-fed switch-grass could have less impact on regional blue water use than other crops requiring irrigation
Biorefinery water supply is entirely blue water and biorefinery water demand is concentrated in a single local area Thus a biorefinery built in an area where the local feedstock is blue-water-intensive would likely lead to an increased burden on the local water resources as compare to a biorefinery built in an area with less blue-watershyintensive feedstocks Therefore it is environmentally benshyeficial to develop switchgrass or other perennial feedstock
plantations in regions with sufficient green water supply to ensure sustainable water use for the feedstock and the biorefi nery
From a whole biorefinery production perspective the resource needs for blue water becomes more pronounced as biorefinery scale increases Further CBS logistics systems dictate that the biorefinery be located near the biomass feedstock production whereas AUD logistics effectively decouple biorefinery location from feedstock production Therefore we expect that CBS logistics would stress a local water resource to a greater extent than AUD logistics Figure 8 further shows the extensive geographishycal variability of blue andf green water footprint even within a state which would affect the choice of feedstock thereby influence the refinery siting consideration
Sustainability metrics and life cycle assessment
SimaPro v73 life cycle assessment modeling soft ware was used to develop and link unit processes using estabshylished methods36 In the absence of primary publicly available data we used the Ecoinvent v20 and to a lesser extent the US Life Cycle Inventory (US LCI) processes We modified the Ecoinvent processes to be refl ective of
copy 2013 Society of Chemical Industry and John Wiley amp Sons Ltd | Biofuels Bioprod Bioref 7282ndash302 (2013) DOI 101002bbb 297
AM Argo et al Modeling and Analysis Biochemical biorefinery sizing and environmental sustainability impacts
Figure 9 GHG emi ssions LCA results for Case 1 Iowa corn stover CBS Case 2 Iowa corn stover AUD and Case 3 Georgia switchgrass AUD
US conditions and the US LCI processes to account for embodied emissions and energy fl ows
Modeling approach and assumptions
The modeling boundary for this study is from fi eld to refinery gate including embodied energy and material flows using the methods described elsewhere36 Th e funcshytional unit is 1 gallon of ethanol produced in the year 2017 Avoided impacts are accounted for using product displacement (also termed boundary system expansion)15
For products that share inputs (eg corn grain and corn stover) burdens are allocated between products based on a lsquoproduct-purposersquo approach Inputs to multi-year cropping systems (ie switchgrass) are likewise annualized by the length of the cropping rotation Impacts from direct and indirect land use change are not considered in this study Feedstock processing and transport are modeled accordshying to INLrsquos CBS and AUD
LCA modeling results
A breakdown of the GHG emission (in terms of CO2 equivalent) for each of the cases is displayed graphically in Fig 9 When comparing AUD to CBS moderate increases in GHG emissions observed in the Iowa corn stover
biochemical conversion-to-ethanol are associated with additional field-to-depot and depot-to-terminal transporshytation steps (lsquoPre-processing otherrsquo category in Fig 9) and increased transportation contribution to the biorefi nery (lsquoFeedstock transportationrsquo category) The small increases in normalized (per gallon of ethanol) electricity credit with increasing biorefinery scale are associated with increased electricity generation efficiency As expected we observe small feedstock differences in GHG emissions for Iowa corn stover and Georgia switchgrass
Conclusions
As expected we demonstrated that CBS has lower average logistics costs than AUD AUD logistic costs are higher than CBS costs primarly due to increased pre-processing costs and increased transportation costs (with multiple transportation step) Likewise and similar to earlier studshyies3 we also show that with CBS logistic costs increase as either biorefinery capacity or feedstock collection radius increase AUD mitigates many of the CBS feedstock-supshyply risks and while resulting in modestly higher logistics costs dramatically reduces both the temporal and spatial biomass-cost variability and allows access to substantially larger quantities of biomass
298 copy 2013 Society of Chemical Industry and John Wiley amp Sons Ltd | Biofuels Bioprod Bioref 7282ndash302 (2013) DOI 101002bbb
Modeling and Analysis Biochemical biorefinery sizing and environmental sustainability impacts AM Argo et al
1 AUD effectively disconnects the feedstock from the biorefinery in terms of both scale and location Single or multiple terminals can supply single or multiple biorefineries of varying scale Biorefi nery locations can be optimized for logistics distribution water resources or other project-specifi c constraints
2 AUD promotes more sustainable cropping practices whereas with CBS there is always pressure to produce the same crop
3 AUD providers have much tighter control on biomass production specifications than is possible with CBS
Iowa corn stover supply costs with CBS increase as biorefinery capacity increases from 500 to 2000 DMTday however the biorefinery economy-of-scale impact is larger in magnitude and the overall MESP decreases from $345 gal to $248gal going from 500 to 2000 DMTday bioreshyfinery scale It must be noted that CBS was not considered for biorefinery capacities of 5000 DMT or greater as the existing models do not capture the substantial additional infrastructure required to manage the high throughput of trucks through the biorefi nery
Iowa corn stover supply costs with the AUD are conshystant for biorefineries ranging from 500 to gt10 000 DMT day and as a result the MESP is reduced from $372gal to $225gal Similar to Iowa corn stover Georgia switch-grass feedstock supply costs are constant using the AUD for biorefineries ranging from 500 to 5000 DMTday however for biorefineries larger than ~5000 DMTday the terminal-to-biorefinery distance needs to be increased from 100 miles to 300 miles to supply the larger capacishyties As a result the MESP for Georgia decreases from $337gal to approximately $204gal as the biorefi nery capacity is increased from 500 DMTday to 10 000 DMT day Only small if any cost reductions are expected for capacities greater than 10 000 DMTday Results of this study show that biochemical ethanol production using a CBS results in the lowest MESP at small biorefi nery scales At larger biorefineries (gt5000 DMTday) these analyses suggest that AUD logistics result in producshytion costs lower than those possible with conventional systems
Our results show no detrimental effects on water sustainability metrics when comparing AUD to CBS Nevertheless feedstock location and feedstock type do affect water use and quality so if biorefineries use diff ershyent feedstocks or pull feedstocks from diff erent locations than those modeled here the results will change Th is study also did not consider the local impact on water resources when siting a large biorefinery We expect that
large biorefineries such as those enabled by the AUD will require a water footprint commensurate to their scale and hence may stress the water resources of a specifi c area where the biorefinery is located
Our results show that AUD logistics result in modestly higher GHG emissions (10ndash15) than CBS mainly due to additional field-to-depot and depot-to-terminal transporshytation (lsquoPre-processing otherrsquo category in Fig 9) steps and increased transportation contribution to the biorefi nery (lsquoFeedstock transportationrsquo category)
One potential issue not addressed in this work is that biomass resulting from AUD pre-processing are subshystantially changed physically and potentially chemically compared to materials collected using CBS (eg lignin is plasticized) This may aff ect biorefinery yield operability and production costs and thus future work will need to experimentally verify and quantify biochemical convershysion of these materials and adapt the modelsanalyses accordingly
Acknowledgement
We thank the US Department of Energy for funding and supporting this work
References 1 US DOE US Billion-Ton Update Biomass Supply for
a Bioenergy and Bioproducts Industry USDOE report no ORNLTM-2011224 lead by Perlack RD and Stokes BJ United States Department of Energy and Oak Ridge National Laboratory Oak Ridge TN pp 227 (2011)
2 Riley C and Schell D Technical and Economic Analysis of an Enzymatic Hydrolysis Based Ethanol Plant internal report Solar Energy Research Institute Golden CO (1991)
3 Aden A Ruth M Ibsen K Jechura J Neeves K Sheehan J et al Lignocellulosic Biomass to Ethanol Process Design and Economics Utilizing Co-Current Dilute Acid Prehydrolysis and Enzymatic Hydrolysis for Corn Stover report no NREL TP-510-32438 National Renewable Energy Laboratory Golden CO pp 154 (2002)
4 Humbird D Davis R Tao L Kinchin C Hsu D Aden A et al Process Design and Economics for the Conversion of Lignocellulosic Biomass to Ethanol Dilute-Acid Pretreatment and Enzymatic Hydrolysis of Corn Stover report no NREL TP-510-47764 National Renewable Energy Laboratory Golden CO pp 147 (2011)
5 Searcy E Wright C Muth D Hess JR and Jacobson J The Limits of a 50 Mile Collection Radius for Biomass Supply to a Biorefi nery draft report Idaho National Laboratory Idaho Falls ID (2010)
6 Hess JR Wright CT Kenney KL and Searcy EM Uniform-Format Solid Feedstock Supply System A Commodity-Scale Design to Produce and Infrastructure-Compaible Bulk Solid from Lignocellulosic Biomass ndash Executive Summary report no INLEXT-09-15423 Idaho National Laboratory Idaho Falls ID (2009)
copy 2013 Society of Chemical Industry and John Wiley amp Sons Ltd | Biofuels Bioprod Bioref 7282ndash302 (2013) DOI 101002bbb 299
AM Argo et al Modeling and Analysis Biochemical biorefinery sizing and environmental sustainability impacts
7 Jacobson JJ and Searcy EM Uniform-Format Feedstock Supply System Design for Woody Biomass Presented at the Spring Conference of the AICHe Orlando FL April (2010)
8 Langholtz M Graham RC Eaton L Perlack R Hellwinckel C and De la Torre Ugarte D Price projections of feedstocks for biofuels and biopower in the US Energy Policy41484ndash493 (2012)
9 USDA NASS Agricultural Prices Paid US [Online] Department of Agriculture National Agricultural Statistics Service Available at httpusdamannlibcornelledu MannUsdaviewDocumentInfododocumentID =1002 [September 19 2012]
10 USDA-OCEWAOB Agricultural Projects to 2018 Long-term Projections Report OCE-2010-1 US Department of Agriculture and Office of the Chief Economist World Agricultural Outlook Board Washington DC (2009)
11 US Congress Energy Independence and Security Act of 2007 110th Congress 1st Session HR 6 4 (2007)
12 US EIA Annual Energy Outlook 2010 Report No DOEEIAshy0383 US Energy Information Administration Washington DC (2010)
13 Wu M Chiu YW and Demissie Y Quantifying the regional water footprint of biofuel production by incorporatshying hydrologic modeling Water Resrouce Research DOI1010292011WR011809 (2012)
14 NOAA NCDC 1971-2000 US Climate Normals Products Clim 84 Daily Normals [Online] NOAA National Climate Data Center Available at httpwwwncdcnoaagov [September 19 2012]
15 Wang M Huo H and Arora S Methods of dealing with coshyproducts of biofuels in life-cycle analysis and consequent results within the US context Energy Policy 395726ndash5736 (2011)
16 USDA 2002 Census of Agriculture US Department of Agriculture Washington DC (2004)
17 USDA 2007 Census of Agriculture US Department of Agriculture Washington DC (2010)
18 USDA 2008 Farm and Ranch Irrigation Report No AC-02-SS-1 US Department of Agriculture Washington DC (2009)
19 USDA 2003 Farm and Ranch Irrigation Survey Report No AC-02-SS-1 US Department of Agriculture Washington DC (2004)
20 USGS Water Use in the United States 1985 1990 and 1995 [Online] US Geological Survey Available at httpwaterusgs govwatuse [September 19 2012]
21 High Plains Regional Climate Center Crop Coeffi cients for Corn [Online] Available at httpwwwhprccunleduawdn etcropcrop_corntxt [September 19 2012]
22 Marek T Colaizzi P Howell TA Dusek D and Porter D Estimating Seasonal Crop ET Using Calendar and Heat Unit Based Crop Coefficients in the Texas High Plains Evapotranspiration Network Presented at 2006 ASAE Annual Meeting American Society of Agricultural and Biological Engineers Portland OR pp 9ndash12 (2006)
23 Kiniry J Lynd L Greene N Johnson M Casler M and Laser MS Biofuels and water use Comparison of maize and switch-grass and general perspectives new research on biofuels ed by Wright JH and Evans DA Nova Science Publishing New York ( 2008 )
24 Kiniry JR Tischler CR and Van Esbroeck GA Radiation use efficiency and leaf CO2 exchange for diverse C4 grasses Biomass Bioenerg 17(2)95ndash112 (1999)
25 Grassini P Yang H and Cassman KG Limits to maize proshyductivity in western corn-belt A simulation analysis for fully irrigated and rainfed conditions Agr Forest Meteor 1491254ndash 1265 (2009 )
26 Hoos AB and McMahon G Spatial analysis of instream nitroshygen loads and factors controlling nitrogen delivery to streams in the Southeastern United States using spatially referenced regression on watershed attributes (SPARROW) and regional classifi cation frameworks Hydrol Process 232275ndash2294 (2009)
27 Hoos AB Terziotti S McMahon G Savvas K Tighe KC and Alkons-Wolinsky R Data to Support Statistical Modeling of Instream Nutrient Load Based on Watershed Attributes Southeastern United States 2002 US Geological Survey pp 50 (2008)
28 Demissie Y Yan E and Wu M Assessing regional hydrology and water quality implications of large-scale biofuel feedstock production in the Upper Mississippi river basin Environ Sci Technol 469174ndash9182 (2012)
29 Wu M Demissie Y and Yan E Simulated impact of future bioshyfuel production on water quality and water cycle dynamics in the Upper Mississippi river basin Biomass Bioenerg 4144ndash56 (2012)
30 Smith RA Alexander RB and Schwarz GE Natural backshyground concentrations of nutrients in streams and rivers of the conterminous United States Environ Sci Technol 373039ndash 3047 (2003)
31 Chiu YW and Wu M Assessing county-level water footprints of different cellulosic-biofuel feedstock pathways Environ Sci Technol 469155ndash9162 (2012)
32 White PJ CORN Chemistry and Technology 2nd edn ed byWhite PJ and Johnson LA American Association of Cereal Chemists Inc St Paul MN (2003)
33 Wu M and Peng MJ Developing a tool to estimate water withshydrawal and consumption in electricity generation in the United States Report No ANLESD11-2 update Argonne National Laboratory (2011)
34 ANL TTRDC GREET Model [Online] Argonne National Laboratory Transportation Technology RampD Center Chicago IL Available at httpgreetesanlgovindex phpcontent= power_water [August 21 2012]
35 Wu M Mintz M Wang M and Arora S Water consumption in the production of ethanol and petroleum gasoline Environ Manage 44981ndash997 (2009)
36 Hsu DD Inman D Heath GA Wolfrum EJ Mann MK and Aden A Life cycle environmental impacts of selected US ethanol production and use pathways in 2022 Environ Sci Technol 445289ndash5297 (2010)
300 copy 2013 Society of Chemical Industry and John Wiley amp Sons Ltd | Biofuels Bioprod Bioref 7282ndash302 (2013) DOI 101002bbb
Modeling and Analysis Biochemical biorefinery sizing and environmental sustainability impacts AM Argo et al
Andrew Argo
Dr Andrew Argo is senior engineer in the system integration group at the National Renewable Energy Laboratoshyry His work supports the Department of Energy Biomass Program in the areas of strategic systemlevel analysis and integrated biorefinery projects monitoring
Eric C D Tan
Dr Tan is a Senior Research Engineer in the Biorefinery Analysis Group of the National Bioenergy Center at the National Renewable National Laborashytory (NREL) His research interests include the process design economshyics and sustainability for conversion of lignocellulosic biomass to biofuels
with particular emphasis on the application of techno-economic analysis and life cycle assessment methods He also has broad experience in chemically reacting flow simulation and heterogeneous catalysis
Daniel Inman
Dr Daniel Inman is a research scienshytist at the National Renewable Energy Laboratory in Golden Colorado His primary research interests are centered on the sustainability biofuel producshytion and use He is currently involved in several modeling projects including lifecycle assessment of multiple biofushy
els and using system dynamics to examine the growth of the cellulosic biofuels industry
Matthew H Langholtz
Dr Matthew Langholtz is a Natural Resource Economist in the Bioenergy Group at Oak Ridge National Laborashytory He is principle investigator (PI) of the Resource Analysis Project of the Bioenergy Group at Oak Ridge Nationshyal Lab as well as the Short-Rotation Woody Crop Sustainability project His
research interests include biomass resource economics short-rotation woody crops and bioenergy from forest resources He has worked on valuation of non-market externalities and developed biomass supply curves for commercial projects the South and the United States
Laurence M Eaton
Laurence Eaton is a Research Scientist at the Oak Ridge National Laborashytory in the Bioenergy Resource and Engineering Systems Group of the Environmental Sciences Division An economist by training he conducts research to support bioenergy foreshycasting and analysis using economic
land use models and Geographic Information Science He participates in interdisciplinary Resource Assessment activities to support the efficient and sustainable supply of agricultural and forestry resources for commercial domestic bioenergy and bioproducts markets He has worked in the area of applied microeconomics as it reshylates to bioenergy firm input decisions and the valuation of environmental goods and ecological services
Jacob J Jacobson
Mr Jacobson is a researcher from the Idaho National Laboratory He has a diverse background in systems analysis system dynamics statistical consulting software development and project management His work has been in the development and analysis of decision support systems to evalushy
ate policy options and business risks of complex energy and environmental systems His recent work has been in the area of analysis of biomass feedstock logistics
Christopher T Wright
Dr Chris Wright is manager and a senior research engineer for the Idaho National Laboratoryrsquos Biofuels and Reshynewable Energy Department His work supports the Department of Energy Biomass Program in developing analyshysis tools and technology for feedstock supply logistics and conversion of bioshy
mass to valuable fuels chemicals materials and power His knowledge of DOErsquos Biomass Program includes an emphasis on lignocellulosic feedstock supply systems which includes feedstock characterization development preprocessing handling and transportation issues assoshyciated with refining biomass into fuels and chemicals
copy 2013 Society of Chemical Industry and John Wiley amp Sons Ltd | Biofuels Bioprod Bioref 7282ndash302 (2013) DOI 101002bbb 301
AM Argo et al Modeling and Analysis Biochemical biorefinery sizing and environmental sustainability impacts
David J Muth Jr
Dr Dave Muth is a Research Engishyneer at the Idaho National Laboratory in Biofuels and Renewable Energy Technologies He leads the Analysis and Sustainability Group with the Bioenergy Research Team developshying models and modeling techniques which facilitate the evaluation the
feedstock assembly system as it pertains to creating advanced biofuels He is currently working as a contracshytor to the US Department of Energy Office of Biomass Programs located at DOE Headquarters supporting the establishment of technical objectives and research tarshygets for next generation feedstock supply and logistics systems that deliver high quality biomass feedstocks for advanced hydrocarbon fuel production
May M Wu
Dr May Wu a principal energy systems analyst at Argonne National Laborashytory is the PI of biofuel sustainability research funded by the US Departshyment of Energy Her research interests are in the area of water quality and water quantity associated with large-scale development of biofuel convenshy
tional fuel electricity and emerging fuels and life cycle analysis Dr Wu is leading the effort to develop tools and largescale watershed models to assess spatially explicit water footprint of biofuel produced from conventional cellulosic and advanced feedstock and impact of proshyjected future production on regional nutrient sediment and hydrology Dr Wu served as an expert advisor to the Water Working Group of the Council on Sustainable Biomass Production (CSBP)
Yi-Wen Chiu
Dr Yi-Wen Chiu is a postdoctoral apshypointee in the Energy System Division at the Argonne National Laboratory As an interdisciplinary scientist her main research interests are to understand the coupling and interaction of human and natural systems by applying inteshygrated modeling tools She has been
involved in research related to water footprint and water-energy nexus with broad interests related to scenario analysis and environmental impact assessment She also participates in several studies aiming to advance biofuels by determining the feasible pathways of achieving water sustainability goals
Robin L Graham
Dr Robin L Graham is Deputy Associate Laboratory Director for the Computing Environment and Life Science Directorate at the Argonne National Laboratory Formerly at Oak Ridge National Laboratory she worked in the Bioenergy field for many years pioneering biomass feedstock
resource assessments that incorporated both economic and environmental factors She was an author of the original ldquoBillion Tonrdquo study and contributed to its 2011 follow-up An ecosystem ecologist by training she has long been interested in developing sustainable natural resources and began her career working for the RampD Division of Weyerhaeuser Co She currently is leading Argonnersquos Biological and Environmental Science Initiashytive which aims to accelerate our understanding of the fundamental design principles in biological and environshymental systems
302 copy 2013 Society of Chemical Industry and John Wiley amp Sons Ltd | Biofuels Bioprod Bioref 7282ndash302 (2013) DOI 101002bbb
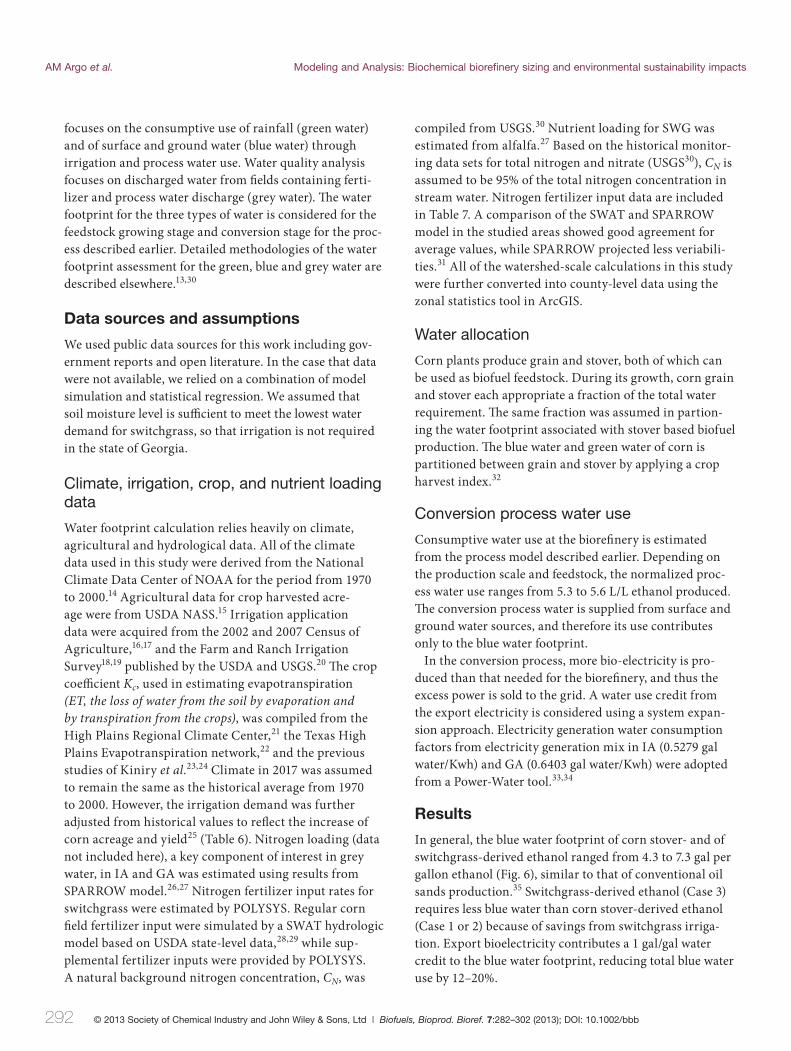
AM Argo et al Modeling and Analysis Biochemical biorefinery sizing and environmental sustainability impacts
focuses on the consumptive use of rainfall (green water) and of surface and ground water (blue water) through irrigation and process water use Water quality analysis focuses on discharged water from fields containing fertishylizer and process water discharge (grey water) Th e water footprint for the three types of water is considered for the feedstock growing stage and conversion stage for the procshyess described earlier Detailed methodologies of the water footprint assessment for the green blue and grey water are described elsewhere13 30
Data sources and assumptions
We used public data sources for this work including govshyernment reports and open literature In the case that data were not available we relied on a combination of model simulation and statistical regression We assumed that soil moisture level is sufficient to meet the lowest water demand for switchgrass so that irrigation is not required in the state of Georgia
Climate irrigation crop and nutrient loading data
Water footprint calculation relies heavily on climate agricultural and hydrological data All of the climate data used in this study were derived from the National Climate Data Center of NOAA for the period from 1970 to 200014 Agricultural data for crop harvested acreshyage were from USDA NASS15 Irrigation application data were acquired from the 2002 and 2007 Census of Agriculture16 17 and the Farm and Ranch Irrigation Survey18 19 published by the USDA and USGS20 Th e crop coeffi cient Kc used in estimating evapotranspiration (ET the loss of water from the soil by evaporation and by transpiration from the crops) was compiled from the High Plains Regional Climate Center21 the Texas High Plains Evapotranspiration network22 and the previous studies of Kiniry et al2324 Climate in 2017 was assumed to remain the same as the historical average from 1970 to 2000 However the irrigation demand was further adjusted from historical values to reflect the increase of corn acreage and yield25 (Table 6) Nitrogen loading (data not included here) a key component of interest in grey water in IA and GA was estimated using results from SPARROW model26 27 Nitrogen fertilizer input rates for switchgrass were estimated by POLYSYS Regular corn field fertilizer input were simulated by a SWAT hydrologic model based on USDA state-level data28 29 while s upshyplemental fertilizer inputs were provided by POLYSYS A natural background nitrogen concentration CN was
compiled from USGS30 Nutrient loading for SWG was estimated from alfalfa27 Based on the historical monitorshying data sets for total nitrogen and nitrate (USGS30) CN is assumed to be 95 of the total nitrogen concentration in stream water Nitrogen fertilizer input data are included in Table 7 A comparison of the SWAT and SPARROW model in the studied areas showed good agreement for average values while SPARROW projected less veriabilishyties31 All of the watershed-scale calculations in this study were further converted into county-level data using the zonal statistics tool in ArcGIS
Water allocation
Corn plants produce grain and stover both of which can be used as biofuel feedstock During its growth corn grain and stover each appropriate a fraction of the total water requirement The same fraction was assumed in partionshying the water footprint associated with stover based biofuel production The blue water and green water of corn is partitioned between grain and stover by applying a crop harvest index32
Conversion process water use
Consumptive water use at the biorefinery is estimated from the process model described earlier Depending on the production scale and feedstock the normalized procshyess water use ranges from 53 to 56 LL ethanol produced The conversion process water is supplied from surface and ground water sources and therefore its use contributes only to the blue water footprint
In the conversion process more bio-electricity is proshyduced than that needed for the biorefinery and thus the excess power is sold to the grid A water use credit from the export electricity is considered using a system expanshysion approach Electricity generation water consumption factors from electricity generation mix in IA (05279 gal waterKwh) and GA (06403 gal waterKwh) were adopted from a Power-Water tool3334
Results
In general the blue water footprint of corn stover- and of switchgrass-derived ethanol ranged from 43 to 73 gal per gallon ethanol (Fig 6) similar to that of conventional oil sands production35 Switchgrass-derived ethanol (Case 3) requires less blue water than corn stover-derived ethanol (Case 1 or 2) because of savings from switchgrass irrigashytion Export bioelectricity contributes a 1 galgal water credit to the blue water footprint reducing total blue water use by 12ndash20
292 copy 2013 Society of Chemical Industry and John Wiley amp Sons Ltd | Biofuels Bioprod Bioref 7282ndash302 (2013) DOI 101002bbb
Modeling and Analysis Biochemical biorefinery sizing and environmental sustainability impacts AM Argo et al
Table 6 Projected corn irrigation volume by 2017
FIPS Case 1 Case 2 Case 1 Case 2 Irrigated Area
Fraction Case 1 Case 2
Corn Yield Harvested Acreage Irrigation Water Use Volume
DMTac 1000 Acre MGY
19017 212 217 29 81 06 282 777
19033 223 255 55 152 06 443 1220
19057 175 180 19 52 18 487 1339
19059 203 204 30 84 08 412 1135
19065 183 191 62 170 06 557 1533
19067 215 246 43 119 07 418 1150
19071 175 175 29 79 32 1663 4579
19077 178 178 37 102 14 852 2346
19081 231 257 50 139 07 520 1431
19085 184 184 65 179 121 13714 37756
19099 233 248 41 112 06 292 803
19103 157 157 45 123 13 695 1913
19109 219 220 48 131 06 401 1104
19111 137 137 14 38 14 264 726
19115 167 174 31 84 50 2504 6895
19119 228 237 61 169 07 927 2552
19125 169 169 25 70 07 328 902
19127 249 277 57 158 06 458 1260
19131 240 285 49 135 09 554 1525
19133 184 186 41 114 216 19403 53420
19139 173 185 31 85 26 1146 3156
19143 228 230 39 109 11 734 2020
19147 212 216 49 134 14 1060 2918
19149 207 211 89 245 10 1655 4557
19155 218 218 77 211 08 1198 3299
19161 241 281 54 148 07 562 1547
19163 202 216 31 85 09 351 966
19167 239 257 82 226 18 3080 8479
19193 272 272 64 176 27 3710 10214
19195 240 284 45 125 07 181 497
19197 244 289 64 175 05 444 1222
Counties might not require irrigation if not listed in the table
Green water contributes the most to the overall water footprint in both Case 1 and Case 2 and its relative conshytribution is significantly larger in Case 3 (Fig 7) due to the climate differences between GA and IA In particular GA has higher evapotransporation than IA28 Additionally green and blue water in Case 1 and Case 2 represent only the portion of water allocated to corn stover and the water use in the biorefinery whereas in Case 3 the results
represent all water associated with the entire above-ground switchgrass plant in addition to biorefi nery blue water use (Fig 7)
Grey water for the corn stover cases (Case 1 and Case 2) is attributable to the fraction of fertilizer required durshying the corn growth and supplemental fertilizer applicashytion to replace nutrients lost with stover removal Th e average grey water in Case 1 and Case 2 is estimated at
copy 2013 Society of Chemical Industry and John Wiley amp Sons Ltd | Biofuels Bioprod Bioref 7282ndash302 (2013) DOI 101002bbb 293
AM Argo et al Modeling and Analysis Biochemical biorefinery sizing and environmental sustainability impacts
Table 7 Nitrogen fertilizer application rate on stover (Cases 1 and 2) at Iowa and switchgrass at Georgia (Case 3) The unit is in kg N per stover or switchgrass harvested acreage
FIPS (IA) Case 1 Supplement Case 2 Supplement Corn FIPS (GA) Case 3 SWG FIPS (GA) Case 3 SWG Fertilizer Fertilizer Fertilizer Fertilizer Fertilizer
kgac kgac kgac kgac kgac
19001 1289 1289 5468 13001 6586 13201 ndash
19005 1052 1052 5521 13005 7048 13207 7800
19049 1232 1292 5509 13051 ndash 13251 7800
19003 1098 1098 2671 13003 7522 13205 ndash
19051 522 522 5692 13053 ndash 13253 ndash
19053 700 700 2671 13055 6745 13255 ndash
19055 1367 1406 5966 13057 ndash 13257 ndash
19007 608 608 5532 13007 ndash 13209 5834
19009 1821 1821 5485 13009 ndash 13211 7800
19011 1384 1440 5965 13011 3545 13213 7800
19013 1330 1392 5963 13013 ndash 13215 ndash
19015 1597 1620 5815 13015 7800 13217 5853
19017 1571 1609 5967 13017 7539 13219 7800
19019 956 982 5982 13019 7044 13221 7800
19021 1645 1725 5364 13021 6709 13223 ndash
19023 1616 1830 5875 13023 6921 13225 7800
19025 1605 1825 5388 13025 5840 13227 ndash
19027 1838 2116 5448 13027 6279 13229 6622
19029 1593 1593 2671 13029 6983 13231 6561
19031 1355 1407 5898 13031 6179 13233 7800
19033 1652 1889 5845 13033 7800 13235 6318
19035 1790 1928 2671 13035 ndash 13237 ndash
19037 1323 1336 5925 13037 ndash 13239 ndash
19039 436 436 5467 13039 ndash 13241 5845
19041 1636 1713 5644 13043 6090 13243 ndash
19043 1474 1474 5683 13045 4767 13245 ndash
19045 1156 1161 5976 13047 7800 13247 ndash
19047 1862 1862 2671 13049 ndash 13249 7800
19057 1296 1332 6044 13059 ndash 13259 7772
19059 1504 1512 5598 13061 7800 13261 7800
19061 1352 1352 5829 13063 ndash 13263 ndash
19063 1602 1641 5757 13065 5840 13265 ndash
19065 1355 1410 5845 13067 ndash 13267 5838
19067 1595 1824 5866 13069 5819 13269 7101
19069 1789 2142 5937 13071 ndash 13271 7239
19071 1292 1292 2671 13073 ndash 13273 7800
19073 1697 1998 5417 13075 ndash 13275 7080
19075 1742 1851 5973 13077 7800 13277 7456
19077 1314 1314 5481 13079 ndash 13279 6483
19079 1641 1672 6036 13081 7223 13281 5289
294 copy 2013 Society of Chemical Industry and John Wiley amp Sons Ltd | Biofuels Bioprod Bioref 7282ndash302 (2013) DOI 101002bbb
Modeling and Analysis Biochemical biorefinery sizing and environmental sustainability impacts AM Argo et al
Table 7 (Continued)
FIPS (IA) Case 1 Supplement Fertilizer
Case 2 Supplement Fertilizer
Corn Fertilizer
FIPS (GA) Case 3 SWG Fertilizer
FIPS (GA) Case 3 SWG Fertilizer
kgac kgac kgac kgac kgac
19081 1707 1904 6040 13083 ndash 13283 6959
19083 1603 1645 6081 13085 ndash 13285 ndash
19085 1363 1363 2671 13087 ndash 13287 6841
19087 1264 1264 5711 13089 ndash 13289 6691
19089 1375 1446 5828 13091 7367 13291 4111
19091 1804 2169 5880 13093 5814 13293 ndash
19093 1849 2033 2671 13095 ndash 13295 7800
19095 1287 1287 5943 13097 ndash 13297 5853
19097 1074 1074 6033 13099 ndash 13299 6652
19099 1724 1839 5901 13101 ndash 13301 6875
19101 1202 1202 5663 13103 7800 13303 6871
19103 1159 1159 5931 13105 7150 13305 5827
19105 1118 1135 5955 13107 5819 13307 7800
19107 1314 1314 5854 13109 7800 13309 ndash
19109 1618 1627 6018 13111 ndash 13311 6007
19111 1014 1014 5794 13113 ndash 13313 ndash
19113 1000 1008 5949 13115 ndash 13315 7610
19115 1239 1289 5961 13117 5289 13317 7800
19117 526 526 5408 13119 7800 13319 7800
19119 1690 1751 2671 13121 ndash 13321 7656
19121 1089 1089 5466 13123 ndash
19123 1295 1316 5713 13125 5835
19125 1251 1251 5476 13127 ndash
19127 1840 2052 5988 13129 7800
19129 1474 1474 2671 13131 ndash
19131 1775 2109 5944 13133 7800
19133 1364 1375 2671 13135 ndash
19135 751 751 5297 13137 5845
19137 1339 1339 2671 13139 5929
19139 1280 1369 5996 13141 ndash
19141 1697 1708 2671 13143 ndash
19143 1688 1705 2671 13145 ndash
19145 1178 1178 2671 13147 7800
19147 1570 1599 5642 13149 7800
19149 1535 1561 2671 13151 7800
19151 1683 1737 5619 13153 7424
19153 1308 1405 5641 13155 7480
19155 1616 1616 2671 13157 5853
19157 1548 1577 5930 13159 ndash
19159 540 540 2671 13161 6724
19161 1784 2078 5364 13163 7196
copy 2013 Society of Chemical Industry and John Wiley amp Sons Ltd | Biofuels Bioprod Bioref 7282ndash302 (2013) DOI 101002bbb 295
AM Argo et al Modeling and Analysis Biochemical biorefinery sizing and environmental sustainability impacts
Table 7 (Continued)
FIPS (IA) Case 1 Supplement Case 2 Supplement Corn FIPS (GA) Case 3 SWG FIPS (GA) Case 3 SWG Fertilizer Fertilizer Fertilizer Fertilizer Fertilizer
kgac kgac kgac kgac kgac
19163 1494 1596 6000 13165 7800
19165 1660 1660 2671 13167 6271
19167 1766 1899 2671 13169 ndash
19169 1561 1566 5996 13171 ndash
19171 1512 1514 5978 13173 6469
19173 629 629 2671 13175 7213
19175 737 737 5467 13177 7800
19177 646 646 5418 13179 ndash
19179 1099 1099 5455 13181 ndash
19181 1290 1290 5467 13183 5844
19183 1665 1708 5824 13185 5868
19185 552 552 2671 13187 4895
19187 1664 1668 5703 13189 ndash
19189 1599 1599 5909 13191 ndash
19191 1249 1253 5793 13193 7800
19193 2013 2013 2671 13195 5853
19195 1778 2102 5841 13197 7800
19197 1803 2136 6081 13199 7800
Figure 6 Blue water footprint of cellulosic ethanol produced from corn stover (Cases 1 and 2) and switchgrass (Case 3) by production stage at refinery scale of 2000 DMTday in 2017
850 and 820 gallons water per gallon ethanol respecshytively The average grey water in Case 3 which accounts for assimilating the total fertilizer applied during the entire growth period is only 210 gallons water per galshylon ethanol Results clearly indicate the unique ability of switchgrass to capture nutrient runoff in addition to lower fertilizer input requirements thereby reducing grey
Figure 7 Green and grey water footprint of cellulosic ethashynol produced from corn stover (Cases 1 and 2) and switch-grass (Case 3) by production stage at refinery scale of 2000 DMTday in 2017
water loadings Historically switchgrass has been used in conservation programs to contain the fertilizer loss to water body from crop land
At the same refinery capacity choice of feedstock and location could have significant impacts on types of water footprint of the cellulosic biofuel Since a majority of
296 copy 2013 Society of Chemical Industry and John Wiley amp Sons Ltd | Biofuels Bioprod Bioref 7282ndash302 (2013) DOI 101002bbb
Modeling and Analysis Biochemical biorefinery sizing and environmental sustainability impacts AM Argo et al
Figure 8 County-level distributions of blue green and grey water footprint for a 2000 DMTd biorefinery in 2017 to produced biofuel from (a) corn stover grown in Iowa via advanced logistic system (Case 2) and (b) switchgrass grown in Georgia via advanced logistic system (Case 3)
water requirements in the biofuel life cycle are from the feedstock growing stage the water footprint of a particushylar biofuel is largely determined by regional climate For example with the same advanced logistic system cellushylosic ethanol produced from switchgrass in biorefi neries located in Georgia (Case 3) requires 39 less blue water footprint than that for Iowa stover in Case 2 (Fig 6) Since the total water requirement for crop growth would be satshyisfied either from rainfall (green water) or irrigation (blue water) lower green water footprint often means increased blue water footprint for the same plant species (Fig 8)
Switchgrass is a high yield perennial which requires substantial evapotransporation to support its growth Switchgrass can be cultivated in many regions in the USA without irrigation and thus producing rain-fed switch-grass could have less impact on regional blue water use than other crops requiring irrigation
Biorefinery water supply is entirely blue water and biorefinery water demand is concentrated in a single local area Thus a biorefinery built in an area where the local feedstock is blue-water-intensive would likely lead to an increased burden on the local water resources as compare to a biorefinery built in an area with less blue-watershyintensive feedstocks Therefore it is environmentally benshyeficial to develop switchgrass or other perennial feedstock
plantations in regions with sufficient green water supply to ensure sustainable water use for the feedstock and the biorefi nery
From a whole biorefinery production perspective the resource needs for blue water becomes more pronounced as biorefinery scale increases Further CBS logistics systems dictate that the biorefinery be located near the biomass feedstock production whereas AUD logistics effectively decouple biorefinery location from feedstock production Therefore we expect that CBS logistics would stress a local water resource to a greater extent than AUD logistics Figure 8 further shows the extensive geographishycal variability of blue andf green water footprint even within a state which would affect the choice of feedstock thereby influence the refinery siting consideration
Sustainability metrics and life cycle assessment
SimaPro v73 life cycle assessment modeling soft ware was used to develop and link unit processes using estabshylished methods36 In the absence of primary publicly available data we used the Ecoinvent v20 and to a lesser extent the US Life Cycle Inventory (US LCI) processes We modified the Ecoinvent processes to be refl ective of
copy 2013 Society of Chemical Industry and John Wiley amp Sons Ltd | Biofuels Bioprod Bioref 7282ndash302 (2013) DOI 101002bbb 297
AM Argo et al Modeling and Analysis Biochemical biorefinery sizing and environmental sustainability impacts
Figure 9 GHG emi ssions LCA results for Case 1 Iowa corn stover CBS Case 2 Iowa corn stover AUD and Case 3 Georgia switchgrass AUD
US conditions and the US LCI processes to account for embodied emissions and energy fl ows
Modeling approach and assumptions
The modeling boundary for this study is from fi eld to refinery gate including embodied energy and material flows using the methods described elsewhere36 Th e funcshytional unit is 1 gallon of ethanol produced in the year 2017 Avoided impacts are accounted for using product displacement (also termed boundary system expansion)15
For products that share inputs (eg corn grain and corn stover) burdens are allocated between products based on a lsquoproduct-purposersquo approach Inputs to multi-year cropping systems (ie switchgrass) are likewise annualized by the length of the cropping rotation Impacts from direct and indirect land use change are not considered in this study Feedstock processing and transport are modeled accordshying to INLrsquos CBS and AUD
LCA modeling results
A breakdown of the GHG emission (in terms of CO2 equivalent) for each of the cases is displayed graphically in Fig 9 When comparing AUD to CBS moderate increases in GHG emissions observed in the Iowa corn stover
biochemical conversion-to-ethanol are associated with additional field-to-depot and depot-to-terminal transporshytation steps (lsquoPre-processing otherrsquo category in Fig 9) and increased transportation contribution to the biorefi nery (lsquoFeedstock transportationrsquo category) The small increases in normalized (per gallon of ethanol) electricity credit with increasing biorefinery scale are associated with increased electricity generation efficiency As expected we observe small feedstock differences in GHG emissions for Iowa corn stover and Georgia switchgrass
Conclusions
As expected we demonstrated that CBS has lower average logistics costs than AUD AUD logistic costs are higher than CBS costs primarly due to increased pre-processing costs and increased transportation costs (with multiple transportation step) Likewise and similar to earlier studshyies3 we also show that with CBS logistic costs increase as either biorefinery capacity or feedstock collection radius increase AUD mitigates many of the CBS feedstock-supshyply risks and while resulting in modestly higher logistics costs dramatically reduces both the temporal and spatial biomass-cost variability and allows access to substantially larger quantities of biomass
298 copy 2013 Society of Chemical Industry and John Wiley amp Sons Ltd | Biofuels Bioprod Bioref 7282ndash302 (2013) DOI 101002bbb
Modeling and Analysis Biochemical biorefinery sizing and environmental sustainability impacts AM Argo et al
1 AUD effectively disconnects the feedstock from the biorefinery in terms of both scale and location Single or multiple terminals can supply single or multiple biorefineries of varying scale Biorefi nery locations can be optimized for logistics distribution water resources or other project-specifi c constraints
2 AUD promotes more sustainable cropping practices whereas with CBS there is always pressure to produce the same crop
3 AUD providers have much tighter control on biomass production specifications than is possible with CBS
Iowa corn stover supply costs with CBS increase as biorefinery capacity increases from 500 to 2000 DMTday however the biorefinery economy-of-scale impact is larger in magnitude and the overall MESP decreases from $345 gal to $248gal going from 500 to 2000 DMTday bioreshyfinery scale It must be noted that CBS was not considered for biorefinery capacities of 5000 DMT or greater as the existing models do not capture the substantial additional infrastructure required to manage the high throughput of trucks through the biorefi nery
Iowa corn stover supply costs with the AUD are conshystant for biorefineries ranging from 500 to gt10 000 DMT day and as a result the MESP is reduced from $372gal to $225gal Similar to Iowa corn stover Georgia switch-grass feedstock supply costs are constant using the AUD for biorefineries ranging from 500 to 5000 DMTday however for biorefineries larger than ~5000 DMTday the terminal-to-biorefinery distance needs to be increased from 100 miles to 300 miles to supply the larger capacishyties As a result the MESP for Georgia decreases from $337gal to approximately $204gal as the biorefi nery capacity is increased from 500 DMTday to 10 000 DMT day Only small if any cost reductions are expected for capacities greater than 10 000 DMTday Results of this study show that biochemical ethanol production using a CBS results in the lowest MESP at small biorefi nery scales At larger biorefineries (gt5000 DMTday) these analyses suggest that AUD logistics result in producshytion costs lower than those possible with conventional systems
Our results show no detrimental effects on water sustainability metrics when comparing AUD to CBS Nevertheless feedstock location and feedstock type do affect water use and quality so if biorefineries use diff ershyent feedstocks or pull feedstocks from diff erent locations than those modeled here the results will change Th is study also did not consider the local impact on water resources when siting a large biorefinery We expect that
large biorefineries such as those enabled by the AUD will require a water footprint commensurate to their scale and hence may stress the water resources of a specifi c area where the biorefinery is located
Our results show that AUD logistics result in modestly higher GHG emissions (10ndash15) than CBS mainly due to additional field-to-depot and depot-to-terminal transporshytation (lsquoPre-processing otherrsquo category in Fig 9) steps and increased transportation contribution to the biorefi nery (lsquoFeedstock transportationrsquo category)
One potential issue not addressed in this work is that biomass resulting from AUD pre-processing are subshystantially changed physically and potentially chemically compared to materials collected using CBS (eg lignin is plasticized) This may aff ect biorefinery yield operability and production costs and thus future work will need to experimentally verify and quantify biochemical convershysion of these materials and adapt the modelsanalyses accordingly
Acknowledgement
We thank the US Department of Energy for funding and supporting this work
References 1 US DOE US Billion-Ton Update Biomass Supply for
a Bioenergy and Bioproducts Industry USDOE report no ORNLTM-2011224 lead by Perlack RD and Stokes BJ United States Department of Energy and Oak Ridge National Laboratory Oak Ridge TN pp 227 (2011)
2 Riley C and Schell D Technical and Economic Analysis of an Enzymatic Hydrolysis Based Ethanol Plant internal report Solar Energy Research Institute Golden CO (1991)
3 Aden A Ruth M Ibsen K Jechura J Neeves K Sheehan J et al Lignocellulosic Biomass to Ethanol Process Design and Economics Utilizing Co-Current Dilute Acid Prehydrolysis and Enzymatic Hydrolysis for Corn Stover report no NREL TP-510-32438 National Renewable Energy Laboratory Golden CO pp 154 (2002)
4 Humbird D Davis R Tao L Kinchin C Hsu D Aden A et al Process Design and Economics for the Conversion of Lignocellulosic Biomass to Ethanol Dilute-Acid Pretreatment and Enzymatic Hydrolysis of Corn Stover report no NREL TP-510-47764 National Renewable Energy Laboratory Golden CO pp 147 (2011)
5 Searcy E Wright C Muth D Hess JR and Jacobson J The Limits of a 50 Mile Collection Radius for Biomass Supply to a Biorefi nery draft report Idaho National Laboratory Idaho Falls ID (2010)
6 Hess JR Wright CT Kenney KL and Searcy EM Uniform-Format Solid Feedstock Supply System A Commodity-Scale Design to Produce and Infrastructure-Compaible Bulk Solid from Lignocellulosic Biomass ndash Executive Summary report no INLEXT-09-15423 Idaho National Laboratory Idaho Falls ID (2009)
copy 2013 Society of Chemical Industry and John Wiley amp Sons Ltd | Biofuels Bioprod Bioref 7282ndash302 (2013) DOI 101002bbb 299
AM Argo et al Modeling and Analysis Biochemical biorefinery sizing and environmental sustainability impacts
7 Jacobson JJ and Searcy EM Uniform-Format Feedstock Supply System Design for Woody Biomass Presented at the Spring Conference of the AICHe Orlando FL April (2010)
8 Langholtz M Graham RC Eaton L Perlack R Hellwinckel C and De la Torre Ugarte D Price projections of feedstocks for biofuels and biopower in the US Energy Policy41484ndash493 (2012)
9 USDA NASS Agricultural Prices Paid US [Online] Department of Agriculture National Agricultural Statistics Service Available at httpusdamannlibcornelledu MannUsdaviewDocumentInfododocumentID =1002 [September 19 2012]
10 USDA-OCEWAOB Agricultural Projects to 2018 Long-term Projections Report OCE-2010-1 US Department of Agriculture and Office of the Chief Economist World Agricultural Outlook Board Washington DC (2009)
11 US Congress Energy Independence and Security Act of 2007 110th Congress 1st Session HR 6 4 (2007)
12 US EIA Annual Energy Outlook 2010 Report No DOEEIAshy0383 US Energy Information Administration Washington DC (2010)
13 Wu M Chiu YW and Demissie Y Quantifying the regional water footprint of biofuel production by incorporatshying hydrologic modeling Water Resrouce Research DOI1010292011WR011809 (2012)
14 NOAA NCDC 1971-2000 US Climate Normals Products Clim 84 Daily Normals [Online] NOAA National Climate Data Center Available at httpwwwncdcnoaagov [September 19 2012]
15 Wang M Huo H and Arora S Methods of dealing with coshyproducts of biofuels in life-cycle analysis and consequent results within the US context Energy Policy 395726ndash5736 (2011)
16 USDA 2002 Census of Agriculture US Department of Agriculture Washington DC (2004)
17 USDA 2007 Census of Agriculture US Department of Agriculture Washington DC (2010)
18 USDA 2008 Farm and Ranch Irrigation Report No AC-02-SS-1 US Department of Agriculture Washington DC (2009)
19 USDA 2003 Farm and Ranch Irrigation Survey Report No AC-02-SS-1 US Department of Agriculture Washington DC (2004)
20 USGS Water Use in the United States 1985 1990 and 1995 [Online] US Geological Survey Available at httpwaterusgs govwatuse [September 19 2012]
21 High Plains Regional Climate Center Crop Coeffi cients for Corn [Online] Available at httpwwwhprccunleduawdn etcropcrop_corntxt [September 19 2012]
22 Marek T Colaizzi P Howell TA Dusek D and Porter D Estimating Seasonal Crop ET Using Calendar and Heat Unit Based Crop Coefficients in the Texas High Plains Evapotranspiration Network Presented at 2006 ASAE Annual Meeting American Society of Agricultural and Biological Engineers Portland OR pp 9ndash12 (2006)
23 Kiniry J Lynd L Greene N Johnson M Casler M and Laser MS Biofuels and water use Comparison of maize and switch-grass and general perspectives new research on biofuels ed by Wright JH and Evans DA Nova Science Publishing New York ( 2008 )
24 Kiniry JR Tischler CR and Van Esbroeck GA Radiation use efficiency and leaf CO2 exchange for diverse C4 grasses Biomass Bioenerg 17(2)95ndash112 (1999)
25 Grassini P Yang H and Cassman KG Limits to maize proshyductivity in western corn-belt A simulation analysis for fully irrigated and rainfed conditions Agr Forest Meteor 1491254ndash 1265 (2009 )
26 Hoos AB and McMahon G Spatial analysis of instream nitroshygen loads and factors controlling nitrogen delivery to streams in the Southeastern United States using spatially referenced regression on watershed attributes (SPARROW) and regional classifi cation frameworks Hydrol Process 232275ndash2294 (2009)
27 Hoos AB Terziotti S McMahon G Savvas K Tighe KC and Alkons-Wolinsky R Data to Support Statistical Modeling of Instream Nutrient Load Based on Watershed Attributes Southeastern United States 2002 US Geological Survey pp 50 (2008)
28 Demissie Y Yan E and Wu M Assessing regional hydrology and water quality implications of large-scale biofuel feedstock production in the Upper Mississippi river basin Environ Sci Technol 469174ndash9182 (2012)
29 Wu M Demissie Y and Yan E Simulated impact of future bioshyfuel production on water quality and water cycle dynamics in the Upper Mississippi river basin Biomass Bioenerg 4144ndash56 (2012)
30 Smith RA Alexander RB and Schwarz GE Natural backshyground concentrations of nutrients in streams and rivers of the conterminous United States Environ Sci Technol 373039ndash 3047 (2003)
31 Chiu YW and Wu M Assessing county-level water footprints of different cellulosic-biofuel feedstock pathways Environ Sci Technol 469155ndash9162 (2012)
32 White PJ CORN Chemistry and Technology 2nd edn ed byWhite PJ and Johnson LA American Association of Cereal Chemists Inc St Paul MN (2003)
33 Wu M and Peng MJ Developing a tool to estimate water withshydrawal and consumption in electricity generation in the United States Report No ANLESD11-2 update Argonne National Laboratory (2011)
34 ANL TTRDC GREET Model [Online] Argonne National Laboratory Transportation Technology RampD Center Chicago IL Available at httpgreetesanlgovindex phpcontent= power_water [August 21 2012]
35 Wu M Mintz M Wang M and Arora S Water consumption in the production of ethanol and petroleum gasoline Environ Manage 44981ndash997 (2009)
36 Hsu DD Inman D Heath GA Wolfrum EJ Mann MK and Aden A Life cycle environmental impacts of selected US ethanol production and use pathways in 2022 Environ Sci Technol 445289ndash5297 (2010)
300 copy 2013 Society of Chemical Industry and John Wiley amp Sons Ltd | Biofuels Bioprod Bioref 7282ndash302 (2013) DOI 101002bbb
Modeling and Analysis Biochemical biorefinery sizing and environmental sustainability impacts AM Argo et al
Andrew Argo
Dr Andrew Argo is senior engineer in the system integration group at the National Renewable Energy Laboratoshyry His work supports the Department of Energy Biomass Program in the areas of strategic systemlevel analysis and integrated biorefinery projects monitoring
Eric C D Tan
Dr Tan is a Senior Research Engineer in the Biorefinery Analysis Group of the National Bioenergy Center at the National Renewable National Laborashytory (NREL) His research interests include the process design economshyics and sustainability for conversion of lignocellulosic biomass to biofuels
with particular emphasis on the application of techno-economic analysis and life cycle assessment methods He also has broad experience in chemically reacting flow simulation and heterogeneous catalysis
Daniel Inman
Dr Daniel Inman is a research scienshytist at the National Renewable Energy Laboratory in Golden Colorado His primary research interests are centered on the sustainability biofuel producshytion and use He is currently involved in several modeling projects including lifecycle assessment of multiple biofushy
els and using system dynamics to examine the growth of the cellulosic biofuels industry
Matthew H Langholtz
Dr Matthew Langholtz is a Natural Resource Economist in the Bioenergy Group at Oak Ridge National Laborashytory He is principle investigator (PI) of the Resource Analysis Project of the Bioenergy Group at Oak Ridge Nationshyal Lab as well as the Short-Rotation Woody Crop Sustainability project His
research interests include biomass resource economics short-rotation woody crops and bioenergy from forest resources He has worked on valuation of non-market externalities and developed biomass supply curves for commercial projects the South and the United States
Laurence M Eaton
Laurence Eaton is a Research Scientist at the Oak Ridge National Laborashytory in the Bioenergy Resource and Engineering Systems Group of the Environmental Sciences Division An economist by training he conducts research to support bioenergy foreshycasting and analysis using economic
land use models and Geographic Information Science He participates in interdisciplinary Resource Assessment activities to support the efficient and sustainable supply of agricultural and forestry resources for commercial domestic bioenergy and bioproducts markets He has worked in the area of applied microeconomics as it reshylates to bioenergy firm input decisions and the valuation of environmental goods and ecological services
Jacob J Jacobson
Mr Jacobson is a researcher from the Idaho National Laboratory He has a diverse background in systems analysis system dynamics statistical consulting software development and project management His work has been in the development and analysis of decision support systems to evalushy
ate policy options and business risks of complex energy and environmental systems His recent work has been in the area of analysis of biomass feedstock logistics
Christopher T Wright
Dr Chris Wright is manager and a senior research engineer for the Idaho National Laboratoryrsquos Biofuels and Reshynewable Energy Department His work supports the Department of Energy Biomass Program in developing analyshysis tools and technology for feedstock supply logistics and conversion of bioshy
mass to valuable fuels chemicals materials and power His knowledge of DOErsquos Biomass Program includes an emphasis on lignocellulosic feedstock supply systems which includes feedstock characterization development preprocessing handling and transportation issues assoshyciated with refining biomass into fuels and chemicals
copy 2013 Society of Chemical Industry and John Wiley amp Sons Ltd | Biofuels Bioprod Bioref 7282ndash302 (2013) DOI 101002bbb 301
AM Argo et al Modeling and Analysis Biochemical biorefinery sizing and environmental sustainability impacts
David J Muth Jr
Dr Dave Muth is a Research Engishyneer at the Idaho National Laboratory in Biofuels and Renewable Energy Technologies He leads the Analysis and Sustainability Group with the Bioenergy Research Team developshying models and modeling techniques which facilitate the evaluation the
feedstock assembly system as it pertains to creating advanced biofuels He is currently working as a contracshytor to the US Department of Energy Office of Biomass Programs located at DOE Headquarters supporting the establishment of technical objectives and research tarshygets for next generation feedstock supply and logistics systems that deliver high quality biomass feedstocks for advanced hydrocarbon fuel production
May M Wu
Dr May Wu a principal energy systems analyst at Argonne National Laborashytory is the PI of biofuel sustainability research funded by the US Departshyment of Energy Her research interests are in the area of water quality and water quantity associated with large-scale development of biofuel convenshy
tional fuel electricity and emerging fuels and life cycle analysis Dr Wu is leading the effort to develop tools and largescale watershed models to assess spatially explicit water footprint of biofuel produced from conventional cellulosic and advanced feedstock and impact of proshyjected future production on regional nutrient sediment and hydrology Dr Wu served as an expert advisor to the Water Working Group of the Council on Sustainable Biomass Production (CSBP)
Yi-Wen Chiu
Dr Yi-Wen Chiu is a postdoctoral apshypointee in the Energy System Division at the Argonne National Laboratory As an interdisciplinary scientist her main research interests are to understand the coupling and interaction of human and natural systems by applying inteshygrated modeling tools She has been
involved in research related to water footprint and water-energy nexus with broad interests related to scenario analysis and environmental impact assessment She also participates in several studies aiming to advance biofuels by determining the feasible pathways of achieving water sustainability goals
Robin L Graham
Dr Robin L Graham is Deputy Associate Laboratory Director for the Computing Environment and Life Science Directorate at the Argonne National Laboratory Formerly at Oak Ridge National Laboratory she worked in the Bioenergy field for many years pioneering biomass feedstock
resource assessments that incorporated both economic and environmental factors She was an author of the original ldquoBillion Tonrdquo study and contributed to its 2011 follow-up An ecosystem ecologist by training she has long been interested in developing sustainable natural resources and began her career working for the RampD Division of Weyerhaeuser Co She currently is leading Argonnersquos Biological and Environmental Science Initiashytive which aims to accelerate our understanding of the fundamental design principles in biological and environshymental systems
302 copy 2013 Society of Chemical Industry and John Wiley amp Sons Ltd | Biofuels Bioprod Bioref 7282ndash302 (2013) DOI 101002bbb

Modeling and Analysis Biochemical biorefinery sizing and environmental sustainability impacts AM Argo et al
Table 6 Projected corn irrigation volume by 2017
FIPS Case 1 Case 2 Case 1 Case 2 Irrigated Area
Fraction Case 1 Case 2
Corn Yield Harvested Acreage Irrigation Water Use Volume
DMTac 1000 Acre MGY
19017 212 217 29 81 06 282 777
19033 223 255 55 152 06 443 1220
19057 175 180 19 52 18 487 1339
19059 203 204 30 84 08 412 1135
19065 183 191 62 170 06 557 1533
19067 215 246 43 119 07 418 1150
19071 175 175 29 79 32 1663 4579
19077 178 178 37 102 14 852 2346
19081 231 257 50 139 07 520 1431
19085 184 184 65 179 121 13714 37756
19099 233 248 41 112 06 292 803
19103 157 157 45 123 13 695 1913
19109 219 220 48 131 06 401 1104
19111 137 137 14 38 14 264 726
19115 167 174 31 84 50 2504 6895
19119 228 237 61 169 07 927 2552
19125 169 169 25 70 07 328 902
19127 249 277 57 158 06 458 1260
19131 240 285 49 135 09 554 1525
19133 184 186 41 114 216 19403 53420
19139 173 185 31 85 26 1146 3156
19143 228 230 39 109 11 734 2020
19147 212 216 49 134 14 1060 2918
19149 207 211 89 245 10 1655 4557
19155 218 218 77 211 08 1198 3299
19161 241 281 54 148 07 562 1547
19163 202 216 31 85 09 351 966
19167 239 257 82 226 18 3080 8479
19193 272 272 64 176 27 3710 10214
19195 240 284 45 125 07 181 497
19197 244 289 64 175 05 444 1222
Counties might not require irrigation if not listed in the table
Green water contributes the most to the overall water footprint in both Case 1 and Case 2 and its relative conshytribution is significantly larger in Case 3 (Fig 7) due to the climate differences between GA and IA In particular GA has higher evapotransporation than IA28 Additionally green and blue water in Case 1 and Case 2 represent only the portion of water allocated to corn stover and the water use in the biorefinery whereas in Case 3 the results
represent all water associated with the entire above-ground switchgrass plant in addition to biorefi nery blue water use (Fig 7)
Grey water for the corn stover cases (Case 1 and Case 2) is attributable to the fraction of fertilizer required durshying the corn growth and supplemental fertilizer applicashytion to replace nutrients lost with stover removal Th e average grey water in Case 1 and Case 2 is estimated at
copy 2013 Society of Chemical Industry and John Wiley amp Sons Ltd | Biofuels Bioprod Bioref 7282ndash302 (2013) DOI 101002bbb 293
AM Argo et al Modeling and Analysis Biochemical biorefinery sizing and environmental sustainability impacts
Table 7 Nitrogen fertilizer application rate on stover (Cases 1 and 2) at Iowa and switchgrass at Georgia (Case 3) The unit is in kg N per stover or switchgrass harvested acreage
FIPS (IA) Case 1 Supplement Case 2 Supplement Corn FIPS (GA) Case 3 SWG FIPS (GA) Case 3 SWG Fertilizer Fertilizer Fertilizer Fertilizer Fertilizer
kgac kgac kgac kgac kgac
19001 1289 1289 5468 13001 6586 13201 ndash
19005 1052 1052 5521 13005 7048 13207 7800
19049 1232 1292 5509 13051 ndash 13251 7800
19003 1098 1098 2671 13003 7522 13205 ndash
19051 522 522 5692 13053 ndash 13253 ndash
19053 700 700 2671 13055 6745 13255 ndash
19055 1367 1406 5966 13057 ndash 13257 ndash
19007 608 608 5532 13007 ndash 13209 5834
19009 1821 1821 5485 13009 ndash 13211 7800
19011 1384 1440 5965 13011 3545 13213 7800
19013 1330 1392 5963 13013 ndash 13215 ndash
19015 1597 1620 5815 13015 7800 13217 5853
19017 1571 1609 5967 13017 7539 13219 7800
19019 956 982 5982 13019 7044 13221 7800
19021 1645 1725 5364 13021 6709 13223 ndash
19023 1616 1830 5875 13023 6921 13225 7800
19025 1605 1825 5388 13025 5840 13227 ndash
19027 1838 2116 5448 13027 6279 13229 6622
19029 1593 1593 2671 13029 6983 13231 6561
19031 1355 1407 5898 13031 6179 13233 7800
19033 1652 1889 5845 13033 7800 13235 6318
19035 1790 1928 2671 13035 ndash 13237 ndash
19037 1323 1336 5925 13037 ndash 13239 ndash
19039 436 436 5467 13039 ndash 13241 5845
19041 1636 1713 5644 13043 6090 13243 ndash
19043 1474 1474 5683 13045 4767 13245 ndash
19045 1156 1161 5976 13047 7800 13247 ndash
19047 1862 1862 2671 13049 ndash 13249 7800
19057 1296 1332 6044 13059 ndash 13259 7772
19059 1504 1512 5598 13061 7800 13261 7800
19061 1352 1352 5829 13063 ndash 13263 ndash
19063 1602 1641 5757 13065 5840 13265 ndash
19065 1355 1410 5845 13067 ndash 13267 5838
19067 1595 1824 5866 13069 5819 13269 7101
19069 1789 2142 5937 13071 ndash 13271 7239
19071 1292 1292 2671 13073 ndash 13273 7800
19073 1697 1998 5417 13075 ndash 13275 7080
19075 1742 1851 5973 13077 7800 13277 7456
19077 1314 1314 5481 13079 ndash 13279 6483
19079 1641 1672 6036 13081 7223 13281 5289
294 copy 2013 Society of Chemical Industry and John Wiley amp Sons Ltd | Biofuels Bioprod Bioref 7282ndash302 (2013) DOI 101002bbb
Modeling and Analysis Biochemical biorefinery sizing and environmental sustainability impacts AM Argo et al
Table 7 (Continued)
FIPS (IA) Case 1 Supplement Fertilizer
Case 2 Supplement Fertilizer
Corn Fertilizer
FIPS (GA) Case 3 SWG Fertilizer
FIPS (GA) Case 3 SWG Fertilizer
kgac kgac kgac kgac kgac
19081 1707 1904 6040 13083 ndash 13283 6959
19083 1603 1645 6081 13085 ndash 13285 ndash
19085 1363 1363 2671 13087 ndash 13287 6841
19087 1264 1264 5711 13089 ndash 13289 6691
19089 1375 1446 5828 13091 7367 13291 4111
19091 1804 2169 5880 13093 5814 13293 ndash
19093 1849 2033 2671 13095 ndash 13295 7800
19095 1287 1287 5943 13097 ndash 13297 5853
19097 1074 1074 6033 13099 ndash 13299 6652
19099 1724 1839 5901 13101 ndash 13301 6875
19101 1202 1202 5663 13103 7800 13303 6871
19103 1159 1159 5931 13105 7150 13305 5827
19105 1118 1135 5955 13107 5819 13307 7800
19107 1314 1314 5854 13109 7800 13309 ndash
19109 1618 1627 6018 13111 ndash 13311 6007
19111 1014 1014 5794 13113 ndash 13313 ndash
19113 1000 1008 5949 13115 ndash 13315 7610
19115 1239 1289 5961 13117 5289 13317 7800
19117 526 526 5408 13119 7800 13319 7800
19119 1690 1751 2671 13121 ndash 13321 7656
19121 1089 1089 5466 13123 ndash
19123 1295 1316 5713 13125 5835
19125 1251 1251 5476 13127 ndash
19127 1840 2052 5988 13129 7800
19129 1474 1474 2671 13131 ndash
19131 1775 2109 5944 13133 7800
19133 1364 1375 2671 13135 ndash
19135 751 751 5297 13137 5845
19137 1339 1339 2671 13139 5929
19139 1280 1369 5996 13141 ndash
19141 1697 1708 2671 13143 ndash
19143 1688 1705 2671 13145 ndash
19145 1178 1178 2671 13147 7800
19147 1570 1599 5642 13149 7800
19149 1535 1561 2671 13151 7800
19151 1683 1737 5619 13153 7424
19153 1308 1405 5641 13155 7480
19155 1616 1616 2671 13157 5853
19157 1548 1577 5930 13159 ndash
19159 540 540 2671 13161 6724
19161 1784 2078 5364 13163 7196
copy 2013 Society of Chemical Industry and John Wiley amp Sons Ltd | Biofuels Bioprod Bioref 7282ndash302 (2013) DOI 101002bbb 295
AM Argo et al Modeling and Analysis Biochemical biorefinery sizing and environmental sustainability impacts
Table 7 (Continued)
FIPS (IA) Case 1 Supplement Case 2 Supplement Corn FIPS (GA) Case 3 SWG FIPS (GA) Case 3 SWG Fertilizer Fertilizer Fertilizer Fertilizer Fertilizer
kgac kgac kgac kgac kgac
19163 1494 1596 6000 13165 7800
19165 1660 1660 2671 13167 6271
19167 1766 1899 2671 13169 ndash
19169 1561 1566 5996 13171 ndash
19171 1512 1514 5978 13173 6469
19173 629 629 2671 13175 7213
19175 737 737 5467 13177 7800
19177 646 646 5418 13179 ndash
19179 1099 1099 5455 13181 ndash
19181 1290 1290 5467 13183 5844
19183 1665 1708 5824 13185 5868
19185 552 552 2671 13187 4895
19187 1664 1668 5703 13189 ndash
19189 1599 1599 5909 13191 ndash
19191 1249 1253 5793 13193 7800
19193 2013 2013 2671 13195 5853
19195 1778 2102 5841 13197 7800
19197 1803 2136 6081 13199 7800
Figure 6 Blue water footprint of cellulosic ethanol produced from corn stover (Cases 1 and 2) and switchgrass (Case 3) by production stage at refinery scale of 2000 DMTday in 2017
850 and 820 gallons water per gallon ethanol respecshytively The average grey water in Case 3 which accounts for assimilating the total fertilizer applied during the entire growth period is only 210 gallons water per galshylon ethanol Results clearly indicate the unique ability of switchgrass to capture nutrient runoff in addition to lower fertilizer input requirements thereby reducing grey
Figure 7 Green and grey water footprint of cellulosic ethashynol produced from corn stover (Cases 1 and 2) and switch-grass (Case 3) by production stage at refinery scale of 2000 DMTday in 2017
water loadings Historically switchgrass has been used in conservation programs to contain the fertilizer loss to water body from crop land
At the same refinery capacity choice of feedstock and location could have significant impacts on types of water footprint of the cellulosic biofuel Since a majority of
296 copy 2013 Society of Chemical Industry and John Wiley amp Sons Ltd | Biofuels Bioprod Bioref 7282ndash302 (2013) DOI 101002bbb
Modeling and Analysis Biochemical biorefinery sizing and environmental sustainability impacts AM Argo et al
Figure 8 County-level distributions of blue green and grey water footprint for a 2000 DMTd biorefinery in 2017 to produced biofuel from (a) corn stover grown in Iowa via advanced logistic system (Case 2) and (b) switchgrass grown in Georgia via advanced logistic system (Case 3)
water requirements in the biofuel life cycle are from the feedstock growing stage the water footprint of a particushylar biofuel is largely determined by regional climate For example with the same advanced logistic system cellushylosic ethanol produced from switchgrass in biorefi neries located in Georgia (Case 3) requires 39 less blue water footprint than that for Iowa stover in Case 2 (Fig 6) Since the total water requirement for crop growth would be satshyisfied either from rainfall (green water) or irrigation (blue water) lower green water footprint often means increased blue water footprint for the same plant species (Fig 8)
Switchgrass is a high yield perennial which requires substantial evapotransporation to support its growth Switchgrass can be cultivated in many regions in the USA without irrigation and thus producing rain-fed switch-grass could have less impact on regional blue water use than other crops requiring irrigation
Biorefinery water supply is entirely blue water and biorefinery water demand is concentrated in a single local area Thus a biorefinery built in an area where the local feedstock is blue-water-intensive would likely lead to an increased burden on the local water resources as compare to a biorefinery built in an area with less blue-watershyintensive feedstocks Therefore it is environmentally benshyeficial to develop switchgrass or other perennial feedstock
plantations in regions with sufficient green water supply to ensure sustainable water use for the feedstock and the biorefi nery
From a whole biorefinery production perspective the resource needs for blue water becomes more pronounced as biorefinery scale increases Further CBS logistics systems dictate that the biorefinery be located near the biomass feedstock production whereas AUD logistics effectively decouple biorefinery location from feedstock production Therefore we expect that CBS logistics would stress a local water resource to a greater extent than AUD logistics Figure 8 further shows the extensive geographishycal variability of blue andf green water footprint even within a state which would affect the choice of feedstock thereby influence the refinery siting consideration
Sustainability metrics and life cycle assessment
SimaPro v73 life cycle assessment modeling soft ware was used to develop and link unit processes using estabshylished methods36 In the absence of primary publicly available data we used the Ecoinvent v20 and to a lesser extent the US Life Cycle Inventory (US LCI) processes We modified the Ecoinvent processes to be refl ective of
copy 2013 Society of Chemical Industry and John Wiley amp Sons Ltd | Biofuels Bioprod Bioref 7282ndash302 (2013) DOI 101002bbb 297
AM Argo et al Modeling and Analysis Biochemical biorefinery sizing and environmental sustainability impacts
Figure 9 GHG emi ssions LCA results for Case 1 Iowa corn stover CBS Case 2 Iowa corn stover AUD and Case 3 Georgia switchgrass AUD
US conditions and the US LCI processes to account for embodied emissions and energy fl ows
Modeling approach and assumptions
The modeling boundary for this study is from fi eld to refinery gate including embodied energy and material flows using the methods described elsewhere36 Th e funcshytional unit is 1 gallon of ethanol produced in the year 2017 Avoided impacts are accounted for using product displacement (also termed boundary system expansion)15
For products that share inputs (eg corn grain and corn stover) burdens are allocated between products based on a lsquoproduct-purposersquo approach Inputs to multi-year cropping systems (ie switchgrass) are likewise annualized by the length of the cropping rotation Impacts from direct and indirect land use change are not considered in this study Feedstock processing and transport are modeled accordshying to INLrsquos CBS and AUD
LCA modeling results
A breakdown of the GHG emission (in terms of CO2 equivalent) for each of the cases is displayed graphically in Fig 9 When comparing AUD to CBS moderate increases in GHG emissions observed in the Iowa corn stover
biochemical conversion-to-ethanol are associated with additional field-to-depot and depot-to-terminal transporshytation steps (lsquoPre-processing otherrsquo category in Fig 9) and increased transportation contribution to the biorefi nery (lsquoFeedstock transportationrsquo category) The small increases in normalized (per gallon of ethanol) electricity credit with increasing biorefinery scale are associated with increased electricity generation efficiency As expected we observe small feedstock differences in GHG emissions for Iowa corn stover and Georgia switchgrass
Conclusions
As expected we demonstrated that CBS has lower average logistics costs than AUD AUD logistic costs are higher than CBS costs primarly due to increased pre-processing costs and increased transportation costs (with multiple transportation step) Likewise and similar to earlier studshyies3 we also show that with CBS logistic costs increase as either biorefinery capacity or feedstock collection radius increase AUD mitigates many of the CBS feedstock-supshyply risks and while resulting in modestly higher logistics costs dramatically reduces both the temporal and spatial biomass-cost variability and allows access to substantially larger quantities of biomass
298 copy 2013 Society of Chemical Industry and John Wiley amp Sons Ltd | Biofuels Bioprod Bioref 7282ndash302 (2013) DOI 101002bbb
Modeling and Analysis Biochemical biorefinery sizing and environmental sustainability impacts AM Argo et al
1 AUD effectively disconnects the feedstock from the biorefinery in terms of both scale and location Single or multiple terminals can supply single or multiple biorefineries of varying scale Biorefi nery locations can be optimized for logistics distribution water resources or other project-specifi c constraints
2 AUD promotes more sustainable cropping practices whereas with CBS there is always pressure to produce the same crop
3 AUD providers have much tighter control on biomass production specifications than is possible with CBS
Iowa corn stover supply costs with CBS increase as biorefinery capacity increases from 500 to 2000 DMTday however the biorefinery economy-of-scale impact is larger in magnitude and the overall MESP decreases from $345 gal to $248gal going from 500 to 2000 DMTday bioreshyfinery scale It must be noted that CBS was not considered for biorefinery capacities of 5000 DMT or greater as the existing models do not capture the substantial additional infrastructure required to manage the high throughput of trucks through the biorefi nery
Iowa corn stover supply costs with the AUD are conshystant for biorefineries ranging from 500 to gt10 000 DMT day and as a result the MESP is reduced from $372gal to $225gal Similar to Iowa corn stover Georgia switch-grass feedstock supply costs are constant using the AUD for biorefineries ranging from 500 to 5000 DMTday however for biorefineries larger than ~5000 DMTday the terminal-to-biorefinery distance needs to be increased from 100 miles to 300 miles to supply the larger capacishyties As a result the MESP for Georgia decreases from $337gal to approximately $204gal as the biorefi nery capacity is increased from 500 DMTday to 10 000 DMT day Only small if any cost reductions are expected for capacities greater than 10 000 DMTday Results of this study show that biochemical ethanol production using a CBS results in the lowest MESP at small biorefi nery scales At larger biorefineries (gt5000 DMTday) these analyses suggest that AUD logistics result in producshytion costs lower than those possible with conventional systems
Our results show no detrimental effects on water sustainability metrics when comparing AUD to CBS Nevertheless feedstock location and feedstock type do affect water use and quality so if biorefineries use diff ershyent feedstocks or pull feedstocks from diff erent locations than those modeled here the results will change Th is study also did not consider the local impact on water resources when siting a large biorefinery We expect that
large biorefineries such as those enabled by the AUD will require a water footprint commensurate to their scale and hence may stress the water resources of a specifi c area where the biorefinery is located
Our results show that AUD logistics result in modestly higher GHG emissions (10ndash15) than CBS mainly due to additional field-to-depot and depot-to-terminal transporshytation (lsquoPre-processing otherrsquo category in Fig 9) steps and increased transportation contribution to the biorefi nery (lsquoFeedstock transportationrsquo category)
One potential issue not addressed in this work is that biomass resulting from AUD pre-processing are subshystantially changed physically and potentially chemically compared to materials collected using CBS (eg lignin is plasticized) This may aff ect biorefinery yield operability and production costs and thus future work will need to experimentally verify and quantify biochemical convershysion of these materials and adapt the modelsanalyses accordingly
Acknowledgement
We thank the US Department of Energy for funding and supporting this work
References 1 US DOE US Billion-Ton Update Biomass Supply for
a Bioenergy and Bioproducts Industry USDOE report no ORNLTM-2011224 lead by Perlack RD and Stokes BJ United States Department of Energy and Oak Ridge National Laboratory Oak Ridge TN pp 227 (2011)
2 Riley C and Schell D Technical and Economic Analysis of an Enzymatic Hydrolysis Based Ethanol Plant internal report Solar Energy Research Institute Golden CO (1991)
3 Aden A Ruth M Ibsen K Jechura J Neeves K Sheehan J et al Lignocellulosic Biomass to Ethanol Process Design and Economics Utilizing Co-Current Dilute Acid Prehydrolysis and Enzymatic Hydrolysis for Corn Stover report no NREL TP-510-32438 National Renewable Energy Laboratory Golden CO pp 154 (2002)
4 Humbird D Davis R Tao L Kinchin C Hsu D Aden A et al Process Design and Economics for the Conversion of Lignocellulosic Biomass to Ethanol Dilute-Acid Pretreatment and Enzymatic Hydrolysis of Corn Stover report no NREL TP-510-47764 National Renewable Energy Laboratory Golden CO pp 147 (2011)
5 Searcy E Wright C Muth D Hess JR and Jacobson J The Limits of a 50 Mile Collection Radius for Biomass Supply to a Biorefi nery draft report Idaho National Laboratory Idaho Falls ID (2010)
6 Hess JR Wright CT Kenney KL and Searcy EM Uniform-Format Solid Feedstock Supply System A Commodity-Scale Design to Produce and Infrastructure-Compaible Bulk Solid from Lignocellulosic Biomass ndash Executive Summary report no INLEXT-09-15423 Idaho National Laboratory Idaho Falls ID (2009)
copy 2013 Society of Chemical Industry and John Wiley amp Sons Ltd | Biofuels Bioprod Bioref 7282ndash302 (2013) DOI 101002bbb 299
AM Argo et al Modeling and Analysis Biochemical biorefinery sizing and environmental sustainability impacts
7 Jacobson JJ and Searcy EM Uniform-Format Feedstock Supply System Design for Woody Biomass Presented at the Spring Conference of the AICHe Orlando FL April (2010)
8 Langholtz M Graham RC Eaton L Perlack R Hellwinckel C and De la Torre Ugarte D Price projections of feedstocks for biofuels and biopower in the US Energy Policy41484ndash493 (2012)
9 USDA NASS Agricultural Prices Paid US [Online] Department of Agriculture National Agricultural Statistics Service Available at httpusdamannlibcornelledu MannUsdaviewDocumentInfododocumentID =1002 [September 19 2012]
10 USDA-OCEWAOB Agricultural Projects to 2018 Long-term Projections Report OCE-2010-1 US Department of Agriculture and Office of the Chief Economist World Agricultural Outlook Board Washington DC (2009)
11 US Congress Energy Independence and Security Act of 2007 110th Congress 1st Session HR 6 4 (2007)
12 US EIA Annual Energy Outlook 2010 Report No DOEEIAshy0383 US Energy Information Administration Washington DC (2010)
13 Wu M Chiu YW and Demissie Y Quantifying the regional water footprint of biofuel production by incorporatshying hydrologic modeling Water Resrouce Research DOI1010292011WR011809 (2012)
14 NOAA NCDC 1971-2000 US Climate Normals Products Clim 84 Daily Normals [Online] NOAA National Climate Data Center Available at httpwwwncdcnoaagov [September 19 2012]
15 Wang M Huo H and Arora S Methods of dealing with coshyproducts of biofuels in life-cycle analysis and consequent results within the US context Energy Policy 395726ndash5736 (2011)
16 USDA 2002 Census of Agriculture US Department of Agriculture Washington DC (2004)
17 USDA 2007 Census of Agriculture US Department of Agriculture Washington DC (2010)
18 USDA 2008 Farm and Ranch Irrigation Report No AC-02-SS-1 US Department of Agriculture Washington DC (2009)
19 USDA 2003 Farm and Ranch Irrigation Survey Report No AC-02-SS-1 US Department of Agriculture Washington DC (2004)
20 USGS Water Use in the United States 1985 1990 and 1995 [Online] US Geological Survey Available at httpwaterusgs govwatuse [September 19 2012]
21 High Plains Regional Climate Center Crop Coeffi cients for Corn [Online] Available at httpwwwhprccunleduawdn etcropcrop_corntxt [September 19 2012]
22 Marek T Colaizzi P Howell TA Dusek D and Porter D Estimating Seasonal Crop ET Using Calendar and Heat Unit Based Crop Coefficients in the Texas High Plains Evapotranspiration Network Presented at 2006 ASAE Annual Meeting American Society of Agricultural and Biological Engineers Portland OR pp 9ndash12 (2006)
23 Kiniry J Lynd L Greene N Johnson M Casler M and Laser MS Biofuels and water use Comparison of maize and switch-grass and general perspectives new research on biofuels ed by Wright JH and Evans DA Nova Science Publishing New York ( 2008 )
24 Kiniry JR Tischler CR and Van Esbroeck GA Radiation use efficiency and leaf CO2 exchange for diverse C4 grasses Biomass Bioenerg 17(2)95ndash112 (1999)
25 Grassini P Yang H and Cassman KG Limits to maize proshyductivity in western corn-belt A simulation analysis for fully irrigated and rainfed conditions Agr Forest Meteor 1491254ndash 1265 (2009 )
26 Hoos AB and McMahon G Spatial analysis of instream nitroshygen loads and factors controlling nitrogen delivery to streams in the Southeastern United States using spatially referenced regression on watershed attributes (SPARROW) and regional classifi cation frameworks Hydrol Process 232275ndash2294 (2009)
27 Hoos AB Terziotti S McMahon G Savvas K Tighe KC and Alkons-Wolinsky R Data to Support Statistical Modeling of Instream Nutrient Load Based on Watershed Attributes Southeastern United States 2002 US Geological Survey pp 50 (2008)
28 Demissie Y Yan E and Wu M Assessing regional hydrology and water quality implications of large-scale biofuel feedstock production in the Upper Mississippi river basin Environ Sci Technol 469174ndash9182 (2012)
29 Wu M Demissie Y and Yan E Simulated impact of future bioshyfuel production on water quality and water cycle dynamics in the Upper Mississippi river basin Biomass Bioenerg 4144ndash56 (2012)
30 Smith RA Alexander RB and Schwarz GE Natural backshyground concentrations of nutrients in streams and rivers of the conterminous United States Environ Sci Technol 373039ndash 3047 (2003)
31 Chiu YW and Wu M Assessing county-level water footprints of different cellulosic-biofuel feedstock pathways Environ Sci Technol 469155ndash9162 (2012)
32 White PJ CORN Chemistry and Technology 2nd edn ed byWhite PJ and Johnson LA American Association of Cereal Chemists Inc St Paul MN (2003)
33 Wu M and Peng MJ Developing a tool to estimate water withshydrawal and consumption in electricity generation in the United States Report No ANLESD11-2 update Argonne National Laboratory (2011)
34 ANL TTRDC GREET Model [Online] Argonne National Laboratory Transportation Technology RampD Center Chicago IL Available at httpgreetesanlgovindex phpcontent= power_water [August 21 2012]
35 Wu M Mintz M Wang M and Arora S Water consumption in the production of ethanol and petroleum gasoline Environ Manage 44981ndash997 (2009)
36 Hsu DD Inman D Heath GA Wolfrum EJ Mann MK and Aden A Life cycle environmental impacts of selected US ethanol production and use pathways in 2022 Environ Sci Technol 445289ndash5297 (2010)
300 copy 2013 Society of Chemical Industry and John Wiley amp Sons Ltd | Biofuels Bioprod Bioref 7282ndash302 (2013) DOI 101002bbb
Modeling and Analysis Biochemical biorefinery sizing and environmental sustainability impacts AM Argo et al
Andrew Argo
Dr Andrew Argo is senior engineer in the system integration group at the National Renewable Energy Laboratoshyry His work supports the Department of Energy Biomass Program in the areas of strategic systemlevel analysis and integrated biorefinery projects monitoring
Eric C D Tan
Dr Tan is a Senior Research Engineer in the Biorefinery Analysis Group of the National Bioenergy Center at the National Renewable National Laborashytory (NREL) His research interests include the process design economshyics and sustainability for conversion of lignocellulosic biomass to biofuels
with particular emphasis on the application of techno-economic analysis and life cycle assessment methods He also has broad experience in chemically reacting flow simulation and heterogeneous catalysis
Daniel Inman
Dr Daniel Inman is a research scienshytist at the National Renewable Energy Laboratory in Golden Colorado His primary research interests are centered on the sustainability biofuel producshytion and use He is currently involved in several modeling projects including lifecycle assessment of multiple biofushy
els and using system dynamics to examine the growth of the cellulosic biofuels industry
Matthew H Langholtz
Dr Matthew Langholtz is a Natural Resource Economist in the Bioenergy Group at Oak Ridge National Laborashytory He is principle investigator (PI) of the Resource Analysis Project of the Bioenergy Group at Oak Ridge Nationshyal Lab as well as the Short-Rotation Woody Crop Sustainability project His
research interests include biomass resource economics short-rotation woody crops and bioenergy from forest resources He has worked on valuation of non-market externalities and developed biomass supply curves for commercial projects the South and the United States
Laurence M Eaton
Laurence Eaton is a Research Scientist at the Oak Ridge National Laborashytory in the Bioenergy Resource and Engineering Systems Group of the Environmental Sciences Division An economist by training he conducts research to support bioenergy foreshycasting and analysis using economic
land use models and Geographic Information Science He participates in interdisciplinary Resource Assessment activities to support the efficient and sustainable supply of agricultural and forestry resources for commercial domestic bioenergy and bioproducts markets He has worked in the area of applied microeconomics as it reshylates to bioenergy firm input decisions and the valuation of environmental goods and ecological services
Jacob J Jacobson
Mr Jacobson is a researcher from the Idaho National Laboratory He has a diverse background in systems analysis system dynamics statistical consulting software development and project management His work has been in the development and analysis of decision support systems to evalushy
ate policy options and business risks of complex energy and environmental systems His recent work has been in the area of analysis of biomass feedstock logistics
Christopher T Wright
Dr Chris Wright is manager and a senior research engineer for the Idaho National Laboratoryrsquos Biofuels and Reshynewable Energy Department His work supports the Department of Energy Biomass Program in developing analyshysis tools and technology for feedstock supply logistics and conversion of bioshy
mass to valuable fuels chemicals materials and power His knowledge of DOErsquos Biomass Program includes an emphasis on lignocellulosic feedstock supply systems which includes feedstock characterization development preprocessing handling and transportation issues assoshyciated with refining biomass into fuels and chemicals
copy 2013 Society of Chemical Industry and John Wiley amp Sons Ltd | Biofuels Bioprod Bioref 7282ndash302 (2013) DOI 101002bbb 301
AM Argo et al Modeling and Analysis Biochemical biorefinery sizing and environmental sustainability impacts
David J Muth Jr
Dr Dave Muth is a Research Engishyneer at the Idaho National Laboratory in Biofuels and Renewable Energy Technologies He leads the Analysis and Sustainability Group with the Bioenergy Research Team developshying models and modeling techniques which facilitate the evaluation the
feedstock assembly system as it pertains to creating advanced biofuels He is currently working as a contracshytor to the US Department of Energy Office of Biomass Programs located at DOE Headquarters supporting the establishment of technical objectives and research tarshygets for next generation feedstock supply and logistics systems that deliver high quality biomass feedstocks for advanced hydrocarbon fuel production
May M Wu
Dr May Wu a principal energy systems analyst at Argonne National Laborashytory is the PI of biofuel sustainability research funded by the US Departshyment of Energy Her research interests are in the area of water quality and water quantity associated with large-scale development of biofuel convenshy
tional fuel electricity and emerging fuels and life cycle analysis Dr Wu is leading the effort to develop tools and largescale watershed models to assess spatially explicit water footprint of biofuel produced from conventional cellulosic and advanced feedstock and impact of proshyjected future production on regional nutrient sediment and hydrology Dr Wu served as an expert advisor to the Water Working Group of the Council on Sustainable Biomass Production (CSBP)
Yi-Wen Chiu
Dr Yi-Wen Chiu is a postdoctoral apshypointee in the Energy System Division at the Argonne National Laboratory As an interdisciplinary scientist her main research interests are to understand the coupling and interaction of human and natural systems by applying inteshygrated modeling tools She has been
involved in research related to water footprint and water-energy nexus with broad interests related to scenario analysis and environmental impact assessment She also participates in several studies aiming to advance biofuels by determining the feasible pathways of achieving water sustainability goals
Robin L Graham
Dr Robin L Graham is Deputy Associate Laboratory Director for the Computing Environment and Life Science Directorate at the Argonne National Laboratory Formerly at Oak Ridge National Laboratory she worked in the Bioenergy field for many years pioneering biomass feedstock
resource assessments that incorporated both economic and environmental factors She was an author of the original ldquoBillion Tonrdquo study and contributed to its 2011 follow-up An ecosystem ecologist by training she has long been interested in developing sustainable natural resources and began her career working for the RampD Division of Weyerhaeuser Co She currently is leading Argonnersquos Biological and Environmental Science Initiashytive which aims to accelerate our understanding of the fundamental design principles in biological and environshymental systems
302 copy 2013 Society of Chemical Industry and John Wiley amp Sons Ltd | Biofuels Bioprod Bioref 7282ndash302 (2013) DOI 101002bbb
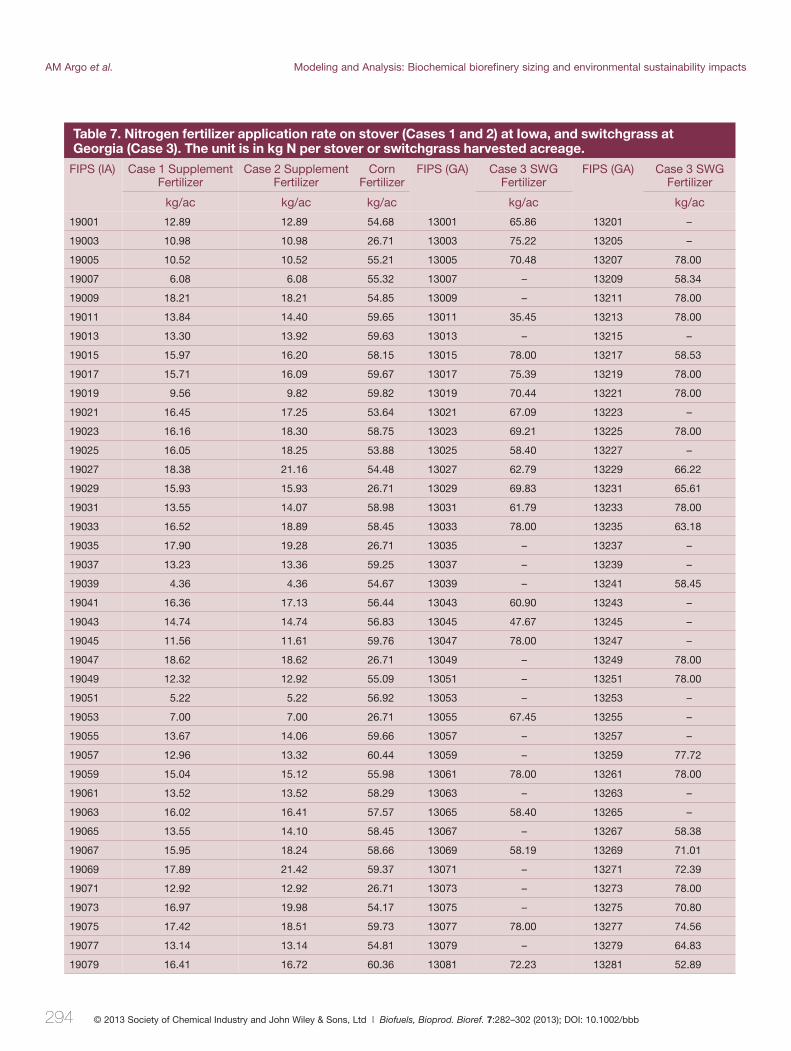
AM Argo et al Modeling and Analysis Biochemical biorefinery sizing and environmental sustainability impacts
Table 7 Nitrogen fertilizer application rate on stover (Cases 1 and 2) at Iowa and switchgrass at Georgia (Case 3) The unit is in kg N per stover or switchgrass harvested acreage
FIPS (IA) Case 1 Supplement Case 2 Supplement Corn FIPS (GA) Case 3 SWG FIPS (GA) Case 3 SWG Fertilizer Fertilizer Fertilizer Fertilizer Fertilizer
kgac kgac kgac kgac kgac
19001 1289 1289 5468 13001 6586 13201 ndash
19005 1052 1052 5521 13005 7048 13207 7800
19049 1232 1292 5509 13051 ndash 13251 7800
19003 1098 1098 2671 13003 7522 13205 ndash
19051 522 522 5692 13053 ndash 13253 ndash
19053 700 700 2671 13055 6745 13255 ndash
19055 1367 1406 5966 13057 ndash 13257 ndash
19007 608 608 5532 13007 ndash 13209 5834
19009 1821 1821 5485 13009 ndash 13211 7800
19011 1384 1440 5965 13011 3545 13213 7800
19013 1330 1392 5963 13013 ndash 13215 ndash
19015 1597 1620 5815 13015 7800 13217 5853
19017 1571 1609 5967 13017 7539 13219 7800
19019 956 982 5982 13019 7044 13221 7800
19021 1645 1725 5364 13021 6709 13223 ndash
19023 1616 1830 5875 13023 6921 13225 7800
19025 1605 1825 5388 13025 5840 13227 ndash
19027 1838 2116 5448 13027 6279 13229 6622
19029 1593 1593 2671 13029 6983 13231 6561
19031 1355 1407 5898 13031 6179 13233 7800
19033 1652 1889 5845 13033 7800 13235 6318
19035 1790 1928 2671 13035 ndash 13237 ndash
19037 1323 1336 5925 13037 ndash 13239 ndash
19039 436 436 5467 13039 ndash 13241 5845
19041 1636 1713 5644 13043 6090 13243 ndash
19043 1474 1474 5683 13045 4767 13245 ndash
19045 1156 1161 5976 13047 7800 13247 ndash
19047 1862 1862 2671 13049 ndash 13249 7800
19057 1296 1332 6044 13059 ndash 13259 7772
19059 1504 1512 5598 13061 7800 13261 7800
19061 1352 1352 5829 13063 ndash 13263 ndash
19063 1602 1641 5757 13065 5840 13265 ndash
19065 1355 1410 5845 13067 ndash 13267 5838
19067 1595 1824 5866 13069 5819 13269 7101
19069 1789 2142 5937 13071 ndash 13271 7239
19071 1292 1292 2671 13073 ndash 13273 7800
19073 1697 1998 5417 13075 ndash 13275 7080
19075 1742 1851 5973 13077 7800 13277 7456
19077 1314 1314 5481 13079 ndash 13279 6483
19079 1641 1672 6036 13081 7223 13281 5289
294 copy 2013 Society of Chemical Industry and John Wiley amp Sons Ltd | Biofuels Bioprod Bioref 7282ndash302 (2013) DOI 101002bbb
Modeling and Analysis Biochemical biorefinery sizing and environmental sustainability impacts AM Argo et al
Table 7 (Continued)
FIPS (IA) Case 1 Supplement Fertilizer
Case 2 Supplement Fertilizer
Corn Fertilizer
FIPS (GA) Case 3 SWG Fertilizer
FIPS (GA) Case 3 SWG Fertilizer
kgac kgac kgac kgac kgac
19081 1707 1904 6040 13083 ndash 13283 6959
19083 1603 1645 6081 13085 ndash 13285 ndash
19085 1363 1363 2671 13087 ndash 13287 6841
19087 1264 1264 5711 13089 ndash 13289 6691
19089 1375 1446 5828 13091 7367 13291 4111
19091 1804 2169 5880 13093 5814 13293 ndash
19093 1849 2033 2671 13095 ndash 13295 7800
19095 1287 1287 5943 13097 ndash 13297 5853
19097 1074 1074 6033 13099 ndash 13299 6652
19099 1724 1839 5901 13101 ndash 13301 6875
19101 1202 1202 5663 13103 7800 13303 6871
19103 1159 1159 5931 13105 7150 13305 5827
19105 1118 1135 5955 13107 5819 13307 7800
19107 1314 1314 5854 13109 7800 13309 ndash
19109 1618 1627 6018 13111 ndash 13311 6007
19111 1014 1014 5794 13113 ndash 13313 ndash
19113 1000 1008 5949 13115 ndash 13315 7610
19115 1239 1289 5961 13117 5289 13317 7800
19117 526 526 5408 13119 7800 13319 7800
19119 1690 1751 2671 13121 ndash 13321 7656
19121 1089 1089 5466 13123 ndash
19123 1295 1316 5713 13125 5835
19125 1251 1251 5476 13127 ndash
19127 1840 2052 5988 13129 7800
19129 1474 1474 2671 13131 ndash
19131 1775 2109 5944 13133 7800
19133 1364 1375 2671 13135 ndash
19135 751 751 5297 13137 5845
19137 1339 1339 2671 13139 5929
19139 1280 1369 5996 13141 ndash
19141 1697 1708 2671 13143 ndash
19143 1688 1705 2671 13145 ndash
19145 1178 1178 2671 13147 7800
19147 1570 1599 5642 13149 7800
19149 1535 1561 2671 13151 7800
19151 1683 1737 5619 13153 7424
19153 1308 1405 5641 13155 7480
19155 1616 1616 2671 13157 5853
19157 1548 1577 5930 13159 ndash
19159 540 540 2671 13161 6724
19161 1784 2078 5364 13163 7196
copy 2013 Society of Chemical Industry and John Wiley amp Sons Ltd | Biofuels Bioprod Bioref 7282ndash302 (2013) DOI 101002bbb 295
AM Argo et al Modeling and Analysis Biochemical biorefinery sizing and environmental sustainability impacts
Table 7 (Continued)
FIPS (IA) Case 1 Supplement Case 2 Supplement Corn FIPS (GA) Case 3 SWG FIPS (GA) Case 3 SWG Fertilizer Fertilizer Fertilizer Fertilizer Fertilizer
kgac kgac kgac kgac kgac
19163 1494 1596 6000 13165 7800
19165 1660 1660 2671 13167 6271
19167 1766 1899 2671 13169 ndash
19169 1561 1566 5996 13171 ndash
19171 1512 1514 5978 13173 6469
19173 629 629 2671 13175 7213
19175 737 737 5467 13177 7800
19177 646 646 5418 13179 ndash
19179 1099 1099 5455 13181 ndash
19181 1290 1290 5467 13183 5844
19183 1665 1708 5824 13185 5868
19185 552 552 2671 13187 4895
19187 1664 1668 5703 13189 ndash
19189 1599 1599 5909 13191 ndash
19191 1249 1253 5793 13193 7800
19193 2013 2013 2671 13195 5853
19195 1778 2102 5841 13197 7800
19197 1803 2136 6081 13199 7800
Figure 6 Blue water footprint of cellulosic ethanol produced from corn stover (Cases 1 and 2) and switchgrass (Case 3) by production stage at refinery scale of 2000 DMTday in 2017
850 and 820 gallons water per gallon ethanol respecshytively The average grey water in Case 3 which accounts for assimilating the total fertilizer applied during the entire growth period is only 210 gallons water per galshylon ethanol Results clearly indicate the unique ability of switchgrass to capture nutrient runoff in addition to lower fertilizer input requirements thereby reducing grey
Figure 7 Green and grey water footprint of cellulosic ethashynol produced from corn stover (Cases 1 and 2) and switch-grass (Case 3) by production stage at refinery scale of 2000 DMTday in 2017
water loadings Historically switchgrass has been used in conservation programs to contain the fertilizer loss to water body from crop land
At the same refinery capacity choice of feedstock and location could have significant impacts on types of water footprint of the cellulosic biofuel Since a majority of
296 copy 2013 Society of Chemical Industry and John Wiley amp Sons Ltd | Biofuels Bioprod Bioref 7282ndash302 (2013) DOI 101002bbb
Modeling and Analysis Biochemical biorefinery sizing and environmental sustainability impacts AM Argo et al
Figure 8 County-level distributions of blue green and grey water footprint for a 2000 DMTd biorefinery in 2017 to produced biofuel from (a) corn stover grown in Iowa via advanced logistic system (Case 2) and (b) switchgrass grown in Georgia via advanced logistic system (Case 3)
water requirements in the biofuel life cycle are from the feedstock growing stage the water footprint of a particushylar biofuel is largely determined by regional climate For example with the same advanced logistic system cellushylosic ethanol produced from switchgrass in biorefi neries located in Georgia (Case 3) requires 39 less blue water footprint than that for Iowa stover in Case 2 (Fig 6) Since the total water requirement for crop growth would be satshyisfied either from rainfall (green water) or irrigation (blue water) lower green water footprint often means increased blue water footprint for the same plant species (Fig 8)
Switchgrass is a high yield perennial which requires substantial evapotransporation to support its growth Switchgrass can be cultivated in many regions in the USA without irrigation and thus producing rain-fed switch-grass could have less impact on regional blue water use than other crops requiring irrigation
Biorefinery water supply is entirely blue water and biorefinery water demand is concentrated in a single local area Thus a biorefinery built in an area where the local feedstock is blue-water-intensive would likely lead to an increased burden on the local water resources as compare to a biorefinery built in an area with less blue-watershyintensive feedstocks Therefore it is environmentally benshyeficial to develop switchgrass or other perennial feedstock
plantations in regions with sufficient green water supply to ensure sustainable water use for the feedstock and the biorefi nery
From a whole biorefinery production perspective the resource needs for blue water becomes more pronounced as biorefinery scale increases Further CBS logistics systems dictate that the biorefinery be located near the biomass feedstock production whereas AUD logistics effectively decouple biorefinery location from feedstock production Therefore we expect that CBS logistics would stress a local water resource to a greater extent than AUD logistics Figure 8 further shows the extensive geographishycal variability of blue andf green water footprint even within a state which would affect the choice of feedstock thereby influence the refinery siting consideration
Sustainability metrics and life cycle assessment
SimaPro v73 life cycle assessment modeling soft ware was used to develop and link unit processes using estabshylished methods36 In the absence of primary publicly available data we used the Ecoinvent v20 and to a lesser extent the US Life Cycle Inventory (US LCI) processes We modified the Ecoinvent processes to be refl ective of
copy 2013 Society of Chemical Industry and John Wiley amp Sons Ltd | Biofuels Bioprod Bioref 7282ndash302 (2013) DOI 101002bbb 297
AM Argo et al Modeling and Analysis Biochemical biorefinery sizing and environmental sustainability impacts
Figure 9 GHG emi ssions LCA results for Case 1 Iowa corn stover CBS Case 2 Iowa corn stover AUD and Case 3 Georgia switchgrass AUD
US conditions and the US LCI processes to account for embodied emissions and energy fl ows
Modeling approach and assumptions
The modeling boundary for this study is from fi eld to refinery gate including embodied energy and material flows using the methods described elsewhere36 Th e funcshytional unit is 1 gallon of ethanol produced in the year 2017 Avoided impacts are accounted for using product displacement (also termed boundary system expansion)15
For products that share inputs (eg corn grain and corn stover) burdens are allocated between products based on a lsquoproduct-purposersquo approach Inputs to multi-year cropping systems (ie switchgrass) are likewise annualized by the length of the cropping rotation Impacts from direct and indirect land use change are not considered in this study Feedstock processing and transport are modeled accordshying to INLrsquos CBS and AUD
LCA modeling results
A breakdown of the GHG emission (in terms of CO2 equivalent) for each of the cases is displayed graphically in Fig 9 When comparing AUD to CBS moderate increases in GHG emissions observed in the Iowa corn stover
biochemical conversion-to-ethanol are associated with additional field-to-depot and depot-to-terminal transporshytation steps (lsquoPre-processing otherrsquo category in Fig 9) and increased transportation contribution to the biorefi nery (lsquoFeedstock transportationrsquo category) The small increases in normalized (per gallon of ethanol) electricity credit with increasing biorefinery scale are associated with increased electricity generation efficiency As expected we observe small feedstock differences in GHG emissions for Iowa corn stover and Georgia switchgrass
Conclusions
As expected we demonstrated that CBS has lower average logistics costs than AUD AUD logistic costs are higher than CBS costs primarly due to increased pre-processing costs and increased transportation costs (with multiple transportation step) Likewise and similar to earlier studshyies3 we also show that with CBS logistic costs increase as either biorefinery capacity or feedstock collection radius increase AUD mitigates many of the CBS feedstock-supshyply risks and while resulting in modestly higher logistics costs dramatically reduces both the temporal and spatial biomass-cost variability and allows access to substantially larger quantities of biomass
298 copy 2013 Society of Chemical Industry and John Wiley amp Sons Ltd | Biofuels Bioprod Bioref 7282ndash302 (2013) DOI 101002bbb
Modeling and Analysis Biochemical biorefinery sizing and environmental sustainability impacts AM Argo et al
1 AUD effectively disconnects the feedstock from the biorefinery in terms of both scale and location Single or multiple terminals can supply single or multiple biorefineries of varying scale Biorefi nery locations can be optimized for logistics distribution water resources or other project-specifi c constraints
2 AUD promotes more sustainable cropping practices whereas with CBS there is always pressure to produce the same crop
3 AUD providers have much tighter control on biomass production specifications than is possible with CBS
Iowa corn stover supply costs with CBS increase as biorefinery capacity increases from 500 to 2000 DMTday however the biorefinery economy-of-scale impact is larger in magnitude and the overall MESP decreases from $345 gal to $248gal going from 500 to 2000 DMTday bioreshyfinery scale It must be noted that CBS was not considered for biorefinery capacities of 5000 DMT or greater as the existing models do not capture the substantial additional infrastructure required to manage the high throughput of trucks through the biorefi nery
Iowa corn stover supply costs with the AUD are conshystant for biorefineries ranging from 500 to gt10 000 DMT day and as a result the MESP is reduced from $372gal to $225gal Similar to Iowa corn stover Georgia switch-grass feedstock supply costs are constant using the AUD for biorefineries ranging from 500 to 5000 DMTday however for biorefineries larger than ~5000 DMTday the terminal-to-biorefinery distance needs to be increased from 100 miles to 300 miles to supply the larger capacishyties As a result the MESP for Georgia decreases from $337gal to approximately $204gal as the biorefi nery capacity is increased from 500 DMTday to 10 000 DMT day Only small if any cost reductions are expected for capacities greater than 10 000 DMTday Results of this study show that biochemical ethanol production using a CBS results in the lowest MESP at small biorefi nery scales At larger biorefineries (gt5000 DMTday) these analyses suggest that AUD logistics result in producshytion costs lower than those possible with conventional systems
Our results show no detrimental effects on water sustainability metrics when comparing AUD to CBS Nevertheless feedstock location and feedstock type do affect water use and quality so if biorefineries use diff ershyent feedstocks or pull feedstocks from diff erent locations than those modeled here the results will change Th is study also did not consider the local impact on water resources when siting a large biorefinery We expect that
large biorefineries such as those enabled by the AUD will require a water footprint commensurate to their scale and hence may stress the water resources of a specifi c area where the biorefinery is located
Our results show that AUD logistics result in modestly higher GHG emissions (10ndash15) than CBS mainly due to additional field-to-depot and depot-to-terminal transporshytation (lsquoPre-processing otherrsquo category in Fig 9) steps and increased transportation contribution to the biorefi nery (lsquoFeedstock transportationrsquo category)
One potential issue not addressed in this work is that biomass resulting from AUD pre-processing are subshystantially changed physically and potentially chemically compared to materials collected using CBS (eg lignin is plasticized) This may aff ect biorefinery yield operability and production costs and thus future work will need to experimentally verify and quantify biochemical convershysion of these materials and adapt the modelsanalyses accordingly
Acknowledgement
We thank the US Department of Energy for funding and supporting this work
References 1 US DOE US Billion-Ton Update Biomass Supply for
a Bioenergy and Bioproducts Industry USDOE report no ORNLTM-2011224 lead by Perlack RD and Stokes BJ United States Department of Energy and Oak Ridge National Laboratory Oak Ridge TN pp 227 (2011)
2 Riley C and Schell D Technical and Economic Analysis of an Enzymatic Hydrolysis Based Ethanol Plant internal report Solar Energy Research Institute Golden CO (1991)
3 Aden A Ruth M Ibsen K Jechura J Neeves K Sheehan J et al Lignocellulosic Biomass to Ethanol Process Design and Economics Utilizing Co-Current Dilute Acid Prehydrolysis and Enzymatic Hydrolysis for Corn Stover report no NREL TP-510-32438 National Renewable Energy Laboratory Golden CO pp 154 (2002)
4 Humbird D Davis R Tao L Kinchin C Hsu D Aden A et al Process Design and Economics for the Conversion of Lignocellulosic Biomass to Ethanol Dilute-Acid Pretreatment and Enzymatic Hydrolysis of Corn Stover report no NREL TP-510-47764 National Renewable Energy Laboratory Golden CO pp 147 (2011)
5 Searcy E Wright C Muth D Hess JR and Jacobson J The Limits of a 50 Mile Collection Radius for Biomass Supply to a Biorefi nery draft report Idaho National Laboratory Idaho Falls ID (2010)
6 Hess JR Wright CT Kenney KL and Searcy EM Uniform-Format Solid Feedstock Supply System A Commodity-Scale Design to Produce and Infrastructure-Compaible Bulk Solid from Lignocellulosic Biomass ndash Executive Summary report no INLEXT-09-15423 Idaho National Laboratory Idaho Falls ID (2009)
copy 2013 Society of Chemical Industry and John Wiley amp Sons Ltd | Biofuels Bioprod Bioref 7282ndash302 (2013) DOI 101002bbb 299
AM Argo et al Modeling and Analysis Biochemical biorefinery sizing and environmental sustainability impacts
7 Jacobson JJ and Searcy EM Uniform-Format Feedstock Supply System Design for Woody Biomass Presented at the Spring Conference of the AICHe Orlando FL April (2010)
8 Langholtz M Graham RC Eaton L Perlack R Hellwinckel C and De la Torre Ugarte D Price projections of feedstocks for biofuels and biopower in the US Energy Policy41484ndash493 (2012)
9 USDA NASS Agricultural Prices Paid US [Online] Department of Agriculture National Agricultural Statistics Service Available at httpusdamannlibcornelledu MannUsdaviewDocumentInfododocumentID =1002 [September 19 2012]
10 USDA-OCEWAOB Agricultural Projects to 2018 Long-term Projections Report OCE-2010-1 US Department of Agriculture and Office of the Chief Economist World Agricultural Outlook Board Washington DC (2009)
11 US Congress Energy Independence and Security Act of 2007 110th Congress 1st Session HR 6 4 (2007)
12 US EIA Annual Energy Outlook 2010 Report No DOEEIAshy0383 US Energy Information Administration Washington DC (2010)
13 Wu M Chiu YW and Demissie Y Quantifying the regional water footprint of biofuel production by incorporatshying hydrologic modeling Water Resrouce Research DOI1010292011WR011809 (2012)
14 NOAA NCDC 1971-2000 US Climate Normals Products Clim 84 Daily Normals [Online] NOAA National Climate Data Center Available at httpwwwncdcnoaagov [September 19 2012]
15 Wang M Huo H and Arora S Methods of dealing with coshyproducts of biofuels in life-cycle analysis and consequent results within the US context Energy Policy 395726ndash5736 (2011)
16 USDA 2002 Census of Agriculture US Department of Agriculture Washington DC (2004)
17 USDA 2007 Census of Agriculture US Department of Agriculture Washington DC (2010)
18 USDA 2008 Farm and Ranch Irrigation Report No AC-02-SS-1 US Department of Agriculture Washington DC (2009)
19 USDA 2003 Farm and Ranch Irrigation Survey Report No AC-02-SS-1 US Department of Agriculture Washington DC (2004)
20 USGS Water Use in the United States 1985 1990 and 1995 [Online] US Geological Survey Available at httpwaterusgs govwatuse [September 19 2012]
21 High Plains Regional Climate Center Crop Coeffi cients for Corn [Online] Available at httpwwwhprccunleduawdn etcropcrop_corntxt [September 19 2012]
22 Marek T Colaizzi P Howell TA Dusek D and Porter D Estimating Seasonal Crop ET Using Calendar and Heat Unit Based Crop Coefficients in the Texas High Plains Evapotranspiration Network Presented at 2006 ASAE Annual Meeting American Society of Agricultural and Biological Engineers Portland OR pp 9ndash12 (2006)
23 Kiniry J Lynd L Greene N Johnson M Casler M and Laser MS Biofuels and water use Comparison of maize and switch-grass and general perspectives new research on biofuels ed by Wright JH and Evans DA Nova Science Publishing New York ( 2008 )
24 Kiniry JR Tischler CR and Van Esbroeck GA Radiation use efficiency and leaf CO2 exchange for diverse C4 grasses Biomass Bioenerg 17(2)95ndash112 (1999)
25 Grassini P Yang H and Cassman KG Limits to maize proshyductivity in western corn-belt A simulation analysis for fully irrigated and rainfed conditions Agr Forest Meteor 1491254ndash 1265 (2009 )
26 Hoos AB and McMahon G Spatial analysis of instream nitroshygen loads and factors controlling nitrogen delivery to streams in the Southeastern United States using spatially referenced regression on watershed attributes (SPARROW) and regional classifi cation frameworks Hydrol Process 232275ndash2294 (2009)
27 Hoos AB Terziotti S McMahon G Savvas K Tighe KC and Alkons-Wolinsky R Data to Support Statistical Modeling of Instream Nutrient Load Based on Watershed Attributes Southeastern United States 2002 US Geological Survey pp 50 (2008)
28 Demissie Y Yan E and Wu M Assessing regional hydrology and water quality implications of large-scale biofuel feedstock production in the Upper Mississippi river basin Environ Sci Technol 469174ndash9182 (2012)
29 Wu M Demissie Y and Yan E Simulated impact of future bioshyfuel production on water quality and water cycle dynamics in the Upper Mississippi river basin Biomass Bioenerg 4144ndash56 (2012)
30 Smith RA Alexander RB and Schwarz GE Natural backshyground concentrations of nutrients in streams and rivers of the conterminous United States Environ Sci Technol 373039ndash 3047 (2003)
31 Chiu YW and Wu M Assessing county-level water footprints of different cellulosic-biofuel feedstock pathways Environ Sci Technol 469155ndash9162 (2012)
32 White PJ CORN Chemistry and Technology 2nd edn ed byWhite PJ and Johnson LA American Association of Cereal Chemists Inc St Paul MN (2003)
33 Wu M and Peng MJ Developing a tool to estimate water withshydrawal and consumption in electricity generation in the United States Report No ANLESD11-2 update Argonne National Laboratory (2011)
34 ANL TTRDC GREET Model [Online] Argonne National Laboratory Transportation Technology RampD Center Chicago IL Available at httpgreetesanlgovindex phpcontent= power_water [August 21 2012]
35 Wu M Mintz M Wang M and Arora S Water consumption in the production of ethanol and petroleum gasoline Environ Manage 44981ndash997 (2009)
36 Hsu DD Inman D Heath GA Wolfrum EJ Mann MK and Aden A Life cycle environmental impacts of selected US ethanol production and use pathways in 2022 Environ Sci Technol 445289ndash5297 (2010)
300 copy 2013 Society of Chemical Industry and John Wiley amp Sons Ltd | Biofuels Bioprod Bioref 7282ndash302 (2013) DOI 101002bbb
Modeling and Analysis Biochemical biorefinery sizing and environmental sustainability impacts AM Argo et al
Andrew Argo
Dr Andrew Argo is senior engineer in the system integration group at the National Renewable Energy Laboratoshyry His work supports the Department of Energy Biomass Program in the areas of strategic systemlevel analysis and integrated biorefinery projects monitoring
Eric C D Tan
Dr Tan is a Senior Research Engineer in the Biorefinery Analysis Group of the National Bioenergy Center at the National Renewable National Laborashytory (NREL) His research interests include the process design economshyics and sustainability for conversion of lignocellulosic biomass to biofuels
with particular emphasis on the application of techno-economic analysis and life cycle assessment methods He also has broad experience in chemically reacting flow simulation and heterogeneous catalysis
Daniel Inman
Dr Daniel Inman is a research scienshytist at the National Renewable Energy Laboratory in Golden Colorado His primary research interests are centered on the sustainability biofuel producshytion and use He is currently involved in several modeling projects including lifecycle assessment of multiple biofushy
els and using system dynamics to examine the growth of the cellulosic biofuels industry
Matthew H Langholtz
Dr Matthew Langholtz is a Natural Resource Economist in the Bioenergy Group at Oak Ridge National Laborashytory He is principle investigator (PI) of the Resource Analysis Project of the Bioenergy Group at Oak Ridge Nationshyal Lab as well as the Short-Rotation Woody Crop Sustainability project His
research interests include biomass resource economics short-rotation woody crops and bioenergy from forest resources He has worked on valuation of non-market externalities and developed biomass supply curves for commercial projects the South and the United States
Laurence M Eaton
Laurence Eaton is a Research Scientist at the Oak Ridge National Laborashytory in the Bioenergy Resource and Engineering Systems Group of the Environmental Sciences Division An economist by training he conducts research to support bioenergy foreshycasting and analysis using economic
land use models and Geographic Information Science He participates in interdisciplinary Resource Assessment activities to support the efficient and sustainable supply of agricultural and forestry resources for commercial domestic bioenergy and bioproducts markets He has worked in the area of applied microeconomics as it reshylates to bioenergy firm input decisions and the valuation of environmental goods and ecological services
Jacob J Jacobson
Mr Jacobson is a researcher from the Idaho National Laboratory He has a diverse background in systems analysis system dynamics statistical consulting software development and project management His work has been in the development and analysis of decision support systems to evalushy
ate policy options and business risks of complex energy and environmental systems His recent work has been in the area of analysis of biomass feedstock logistics
Christopher T Wright
Dr Chris Wright is manager and a senior research engineer for the Idaho National Laboratoryrsquos Biofuels and Reshynewable Energy Department His work supports the Department of Energy Biomass Program in developing analyshysis tools and technology for feedstock supply logistics and conversion of bioshy
mass to valuable fuels chemicals materials and power His knowledge of DOErsquos Biomass Program includes an emphasis on lignocellulosic feedstock supply systems which includes feedstock characterization development preprocessing handling and transportation issues assoshyciated with refining biomass into fuels and chemicals
copy 2013 Society of Chemical Industry and John Wiley amp Sons Ltd | Biofuels Bioprod Bioref 7282ndash302 (2013) DOI 101002bbb 301
AM Argo et al Modeling and Analysis Biochemical biorefinery sizing and environmental sustainability impacts
David J Muth Jr
Dr Dave Muth is a Research Engishyneer at the Idaho National Laboratory in Biofuels and Renewable Energy Technologies He leads the Analysis and Sustainability Group with the Bioenergy Research Team developshying models and modeling techniques which facilitate the evaluation the
feedstock assembly system as it pertains to creating advanced biofuels He is currently working as a contracshytor to the US Department of Energy Office of Biomass Programs located at DOE Headquarters supporting the establishment of technical objectives and research tarshygets for next generation feedstock supply and logistics systems that deliver high quality biomass feedstocks for advanced hydrocarbon fuel production
May M Wu
Dr May Wu a principal energy systems analyst at Argonne National Laborashytory is the PI of biofuel sustainability research funded by the US Departshyment of Energy Her research interests are in the area of water quality and water quantity associated with large-scale development of biofuel convenshy
tional fuel electricity and emerging fuels and life cycle analysis Dr Wu is leading the effort to develop tools and largescale watershed models to assess spatially explicit water footprint of biofuel produced from conventional cellulosic and advanced feedstock and impact of proshyjected future production on regional nutrient sediment and hydrology Dr Wu served as an expert advisor to the Water Working Group of the Council on Sustainable Biomass Production (CSBP)
Yi-Wen Chiu
Dr Yi-Wen Chiu is a postdoctoral apshypointee in the Energy System Division at the Argonne National Laboratory As an interdisciplinary scientist her main research interests are to understand the coupling and interaction of human and natural systems by applying inteshygrated modeling tools She has been
involved in research related to water footprint and water-energy nexus with broad interests related to scenario analysis and environmental impact assessment She also participates in several studies aiming to advance biofuels by determining the feasible pathways of achieving water sustainability goals
Robin L Graham
Dr Robin L Graham is Deputy Associate Laboratory Director for the Computing Environment and Life Science Directorate at the Argonne National Laboratory Formerly at Oak Ridge National Laboratory she worked in the Bioenergy field for many years pioneering biomass feedstock
resource assessments that incorporated both economic and environmental factors She was an author of the original ldquoBillion Tonrdquo study and contributed to its 2011 follow-up An ecosystem ecologist by training she has long been interested in developing sustainable natural resources and began her career working for the RampD Division of Weyerhaeuser Co She currently is leading Argonnersquos Biological and Environmental Science Initiashytive which aims to accelerate our understanding of the fundamental design principles in biological and environshymental systems
302 copy 2013 Society of Chemical Industry and John Wiley amp Sons Ltd | Biofuels Bioprod Bioref 7282ndash302 (2013) DOI 101002bbb

Modeling and Analysis Biochemical biorefinery sizing and environmental sustainability impacts AM Argo et al
Table 7 (Continued)
FIPS (IA) Case 1 Supplement Fertilizer
Case 2 Supplement Fertilizer
Corn Fertilizer
FIPS (GA) Case 3 SWG Fertilizer
FIPS (GA) Case 3 SWG Fertilizer
kgac kgac kgac kgac kgac
19081 1707 1904 6040 13083 ndash 13283 6959
19083 1603 1645 6081 13085 ndash 13285 ndash
19085 1363 1363 2671 13087 ndash 13287 6841
19087 1264 1264 5711 13089 ndash 13289 6691
19089 1375 1446 5828 13091 7367 13291 4111
19091 1804 2169 5880 13093 5814 13293 ndash
19093 1849 2033 2671 13095 ndash 13295 7800
19095 1287 1287 5943 13097 ndash 13297 5853
19097 1074 1074 6033 13099 ndash 13299 6652
19099 1724 1839 5901 13101 ndash 13301 6875
19101 1202 1202 5663 13103 7800 13303 6871
19103 1159 1159 5931 13105 7150 13305 5827
19105 1118 1135 5955 13107 5819 13307 7800
19107 1314 1314 5854 13109 7800 13309 ndash
19109 1618 1627 6018 13111 ndash 13311 6007
19111 1014 1014 5794 13113 ndash 13313 ndash
19113 1000 1008 5949 13115 ndash 13315 7610
19115 1239 1289 5961 13117 5289 13317 7800
19117 526 526 5408 13119 7800 13319 7800
19119 1690 1751 2671 13121 ndash 13321 7656
19121 1089 1089 5466 13123 ndash
19123 1295 1316 5713 13125 5835
19125 1251 1251 5476 13127 ndash
19127 1840 2052 5988 13129 7800
19129 1474 1474 2671 13131 ndash
19131 1775 2109 5944 13133 7800
19133 1364 1375 2671 13135 ndash
19135 751 751 5297 13137 5845
19137 1339 1339 2671 13139 5929
19139 1280 1369 5996 13141 ndash
19141 1697 1708 2671 13143 ndash
19143 1688 1705 2671 13145 ndash
19145 1178 1178 2671 13147 7800
19147 1570 1599 5642 13149 7800
19149 1535 1561 2671 13151 7800
19151 1683 1737 5619 13153 7424
19153 1308 1405 5641 13155 7480
19155 1616 1616 2671 13157 5853
19157 1548 1577 5930 13159 ndash
19159 540 540 2671 13161 6724
19161 1784 2078 5364 13163 7196
copy 2013 Society of Chemical Industry and John Wiley amp Sons Ltd | Biofuels Bioprod Bioref 7282ndash302 (2013) DOI 101002bbb 295
AM Argo et al Modeling and Analysis Biochemical biorefinery sizing and environmental sustainability impacts
Table 7 (Continued)
FIPS (IA) Case 1 Supplement Case 2 Supplement Corn FIPS (GA) Case 3 SWG FIPS (GA) Case 3 SWG Fertilizer Fertilizer Fertilizer Fertilizer Fertilizer
kgac kgac kgac kgac kgac
19163 1494 1596 6000 13165 7800
19165 1660 1660 2671 13167 6271
19167 1766 1899 2671 13169 ndash
19169 1561 1566 5996 13171 ndash
19171 1512 1514 5978 13173 6469
19173 629 629 2671 13175 7213
19175 737 737 5467 13177 7800
19177 646 646 5418 13179 ndash
19179 1099 1099 5455 13181 ndash
19181 1290 1290 5467 13183 5844
19183 1665 1708 5824 13185 5868
19185 552 552 2671 13187 4895
19187 1664 1668 5703 13189 ndash
19189 1599 1599 5909 13191 ndash
19191 1249 1253 5793 13193 7800
19193 2013 2013 2671 13195 5853
19195 1778 2102 5841 13197 7800
19197 1803 2136 6081 13199 7800
Figure 6 Blue water footprint of cellulosic ethanol produced from corn stover (Cases 1 and 2) and switchgrass (Case 3) by production stage at refinery scale of 2000 DMTday in 2017
850 and 820 gallons water per gallon ethanol respecshytively The average grey water in Case 3 which accounts for assimilating the total fertilizer applied during the entire growth period is only 210 gallons water per galshylon ethanol Results clearly indicate the unique ability of switchgrass to capture nutrient runoff in addition to lower fertilizer input requirements thereby reducing grey
Figure 7 Green and grey water footprint of cellulosic ethashynol produced from corn stover (Cases 1 and 2) and switch-grass (Case 3) by production stage at refinery scale of 2000 DMTday in 2017
water loadings Historically switchgrass has been used in conservation programs to contain the fertilizer loss to water body from crop land
At the same refinery capacity choice of feedstock and location could have significant impacts on types of water footprint of the cellulosic biofuel Since a majority of
296 copy 2013 Society of Chemical Industry and John Wiley amp Sons Ltd | Biofuels Bioprod Bioref 7282ndash302 (2013) DOI 101002bbb
Modeling and Analysis Biochemical biorefinery sizing and environmental sustainability impacts AM Argo et al
Figure 8 County-level distributions of blue green and grey water footprint for a 2000 DMTd biorefinery in 2017 to produced biofuel from (a) corn stover grown in Iowa via advanced logistic system (Case 2) and (b) switchgrass grown in Georgia via advanced logistic system (Case 3)
water requirements in the biofuel life cycle are from the feedstock growing stage the water footprint of a particushylar biofuel is largely determined by regional climate For example with the same advanced logistic system cellushylosic ethanol produced from switchgrass in biorefi neries located in Georgia (Case 3) requires 39 less blue water footprint than that for Iowa stover in Case 2 (Fig 6) Since the total water requirement for crop growth would be satshyisfied either from rainfall (green water) or irrigation (blue water) lower green water footprint often means increased blue water footprint for the same plant species (Fig 8)
Switchgrass is a high yield perennial which requires substantial evapotransporation to support its growth Switchgrass can be cultivated in many regions in the USA without irrigation and thus producing rain-fed switch-grass could have less impact on regional blue water use than other crops requiring irrigation
Biorefinery water supply is entirely blue water and biorefinery water demand is concentrated in a single local area Thus a biorefinery built in an area where the local feedstock is blue-water-intensive would likely lead to an increased burden on the local water resources as compare to a biorefinery built in an area with less blue-watershyintensive feedstocks Therefore it is environmentally benshyeficial to develop switchgrass or other perennial feedstock
plantations in regions with sufficient green water supply to ensure sustainable water use for the feedstock and the biorefi nery
From a whole biorefinery production perspective the resource needs for blue water becomes more pronounced as biorefinery scale increases Further CBS logistics systems dictate that the biorefinery be located near the biomass feedstock production whereas AUD logistics effectively decouple biorefinery location from feedstock production Therefore we expect that CBS logistics would stress a local water resource to a greater extent than AUD logistics Figure 8 further shows the extensive geographishycal variability of blue andf green water footprint even within a state which would affect the choice of feedstock thereby influence the refinery siting consideration
Sustainability metrics and life cycle assessment
SimaPro v73 life cycle assessment modeling soft ware was used to develop and link unit processes using estabshylished methods36 In the absence of primary publicly available data we used the Ecoinvent v20 and to a lesser extent the US Life Cycle Inventory (US LCI) processes We modified the Ecoinvent processes to be refl ective of
copy 2013 Society of Chemical Industry and John Wiley amp Sons Ltd | Biofuels Bioprod Bioref 7282ndash302 (2013) DOI 101002bbb 297
AM Argo et al Modeling and Analysis Biochemical biorefinery sizing and environmental sustainability impacts
Figure 9 GHG emi ssions LCA results for Case 1 Iowa corn stover CBS Case 2 Iowa corn stover AUD and Case 3 Georgia switchgrass AUD
US conditions and the US LCI processes to account for embodied emissions and energy fl ows
Modeling approach and assumptions
The modeling boundary for this study is from fi eld to refinery gate including embodied energy and material flows using the methods described elsewhere36 Th e funcshytional unit is 1 gallon of ethanol produced in the year 2017 Avoided impacts are accounted for using product displacement (also termed boundary system expansion)15
For products that share inputs (eg corn grain and corn stover) burdens are allocated between products based on a lsquoproduct-purposersquo approach Inputs to multi-year cropping systems (ie switchgrass) are likewise annualized by the length of the cropping rotation Impacts from direct and indirect land use change are not considered in this study Feedstock processing and transport are modeled accordshying to INLrsquos CBS and AUD
LCA modeling results
A breakdown of the GHG emission (in terms of CO2 equivalent) for each of the cases is displayed graphically in Fig 9 When comparing AUD to CBS moderate increases in GHG emissions observed in the Iowa corn stover
biochemical conversion-to-ethanol are associated with additional field-to-depot and depot-to-terminal transporshytation steps (lsquoPre-processing otherrsquo category in Fig 9) and increased transportation contribution to the biorefi nery (lsquoFeedstock transportationrsquo category) The small increases in normalized (per gallon of ethanol) electricity credit with increasing biorefinery scale are associated with increased electricity generation efficiency As expected we observe small feedstock differences in GHG emissions for Iowa corn stover and Georgia switchgrass
Conclusions
As expected we demonstrated that CBS has lower average logistics costs than AUD AUD logistic costs are higher than CBS costs primarly due to increased pre-processing costs and increased transportation costs (with multiple transportation step) Likewise and similar to earlier studshyies3 we also show that with CBS logistic costs increase as either biorefinery capacity or feedstock collection radius increase AUD mitigates many of the CBS feedstock-supshyply risks and while resulting in modestly higher logistics costs dramatically reduces both the temporal and spatial biomass-cost variability and allows access to substantially larger quantities of biomass
298 copy 2013 Society of Chemical Industry and John Wiley amp Sons Ltd | Biofuels Bioprod Bioref 7282ndash302 (2013) DOI 101002bbb
Modeling and Analysis Biochemical biorefinery sizing and environmental sustainability impacts AM Argo et al
1 AUD effectively disconnects the feedstock from the biorefinery in terms of both scale and location Single or multiple terminals can supply single or multiple biorefineries of varying scale Biorefi nery locations can be optimized for logistics distribution water resources or other project-specifi c constraints
2 AUD promotes more sustainable cropping practices whereas with CBS there is always pressure to produce the same crop
3 AUD providers have much tighter control on biomass production specifications than is possible with CBS
Iowa corn stover supply costs with CBS increase as biorefinery capacity increases from 500 to 2000 DMTday however the biorefinery economy-of-scale impact is larger in magnitude and the overall MESP decreases from $345 gal to $248gal going from 500 to 2000 DMTday bioreshyfinery scale It must be noted that CBS was not considered for biorefinery capacities of 5000 DMT or greater as the existing models do not capture the substantial additional infrastructure required to manage the high throughput of trucks through the biorefi nery
Iowa corn stover supply costs with the AUD are conshystant for biorefineries ranging from 500 to gt10 000 DMT day and as a result the MESP is reduced from $372gal to $225gal Similar to Iowa corn stover Georgia switch-grass feedstock supply costs are constant using the AUD for biorefineries ranging from 500 to 5000 DMTday however for biorefineries larger than ~5000 DMTday the terminal-to-biorefinery distance needs to be increased from 100 miles to 300 miles to supply the larger capacishyties As a result the MESP for Georgia decreases from $337gal to approximately $204gal as the biorefi nery capacity is increased from 500 DMTday to 10 000 DMT day Only small if any cost reductions are expected for capacities greater than 10 000 DMTday Results of this study show that biochemical ethanol production using a CBS results in the lowest MESP at small biorefi nery scales At larger biorefineries (gt5000 DMTday) these analyses suggest that AUD logistics result in producshytion costs lower than those possible with conventional systems
Our results show no detrimental effects on water sustainability metrics when comparing AUD to CBS Nevertheless feedstock location and feedstock type do affect water use and quality so if biorefineries use diff ershyent feedstocks or pull feedstocks from diff erent locations than those modeled here the results will change Th is study also did not consider the local impact on water resources when siting a large biorefinery We expect that
large biorefineries such as those enabled by the AUD will require a water footprint commensurate to their scale and hence may stress the water resources of a specifi c area where the biorefinery is located
Our results show that AUD logistics result in modestly higher GHG emissions (10ndash15) than CBS mainly due to additional field-to-depot and depot-to-terminal transporshytation (lsquoPre-processing otherrsquo category in Fig 9) steps and increased transportation contribution to the biorefi nery (lsquoFeedstock transportationrsquo category)
One potential issue not addressed in this work is that biomass resulting from AUD pre-processing are subshystantially changed physically and potentially chemically compared to materials collected using CBS (eg lignin is plasticized) This may aff ect biorefinery yield operability and production costs and thus future work will need to experimentally verify and quantify biochemical convershysion of these materials and adapt the modelsanalyses accordingly
Acknowledgement
We thank the US Department of Energy for funding and supporting this work
References 1 US DOE US Billion-Ton Update Biomass Supply for
a Bioenergy and Bioproducts Industry USDOE report no ORNLTM-2011224 lead by Perlack RD and Stokes BJ United States Department of Energy and Oak Ridge National Laboratory Oak Ridge TN pp 227 (2011)
2 Riley C and Schell D Technical and Economic Analysis of an Enzymatic Hydrolysis Based Ethanol Plant internal report Solar Energy Research Institute Golden CO (1991)
3 Aden A Ruth M Ibsen K Jechura J Neeves K Sheehan J et al Lignocellulosic Biomass to Ethanol Process Design and Economics Utilizing Co-Current Dilute Acid Prehydrolysis and Enzymatic Hydrolysis for Corn Stover report no NREL TP-510-32438 National Renewable Energy Laboratory Golden CO pp 154 (2002)
4 Humbird D Davis R Tao L Kinchin C Hsu D Aden A et al Process Design and Economics for the Conversion of Lignocellulosic Biomass to Ethanol Dilute-Acid Pretreatment and Enzymatic Hydrolysis of Corn Stover report no NREL TP-510-47764 National Renewable Energy Laboratory Golden CO pp 147 (2011)
5 Searcy E Wright C Muth D Hess JR and Jacobson J The Limits of a 50 Mile Collection Radius for Biomass Supply to a Biorefi nery draft report Idaho National Laboratory Idaho Falls ID (2010)
6 Hess JR Wright CT Kenney KL and Searcy EM Uniform-Format Solid Feedstock Supply System A Commodity-Scale Design to Produce and Infrastructure-Compaible Bulk Solid from Lignocellulosic Biomass ndash Executive Summary report no INLEXT-09-15423 Idaho National Laboratory Idaho Falls ID (2009)
copy 2013 Society of Chemical Industry and John Wiley amp Sons Ltd | Biofuels Bioprod Bioref 7282ndash302 (2013) DOI 101002bbb 299
AM Argo et al Modeling and Analysis Biochemical biorefinery sizing and environmental sustainability impacts
7 Jacobson JJ and Searcy EM Uniform-Format Feedstock Supply System Design for Woody Biomass Presented at the Spring Conference of the AICHe Orlando FL April (2010)
8 Langholtz M Graham RC Eaton L Perlack R Hellwinckel C and De la Torre Ugarte D Price projections of feedstocks for biofuels and biopower in the US Energy Policy41484ndash493 (2012)
9 USDA NASS Agricultural Prices Paid US [Online] Department of Agriculture National Agricultural Statistics Service Available at httpusdamannlibcornelledu MannUsdaviewDocumentInfododocumentID =1002 [September 19 2012]
10 USDA-OCEWAOB Agricultural Projects to 2018 Long-term Projections Report OCE-2010-1 US Department of Agriculture and Office of the Chief Economist World Agricultural Outlook Board Washington DC (2009)
11 US Congress Energy Independence and Security Act of 2007 110th Congress 1st Session HR 6 4 (2007)
12 US EIA Annual Energy Outlook 2010 Report No DOEEIAshy0383 US Energy Information Administration Washington DC (2010)
13 Wu M Chiu YW and Demissie Y Quantifying the regional water footprint of biofuel production by incorporatshying hydrologic modeling Water Resrouce Research DOI1010292011WR011809 (2012)
14 NOAA NCDC 1971-2000 US Climate Normals Products Clim 84 Daily Normals [Online] NOAA National Climate Data Center Available at httpwwwncdcnoaagov [September 19 2012]
15 Wang M Huo H and Arora S Methods of dealing with coshyproducts of biofuels in life-cycle analysis and consequent results within the US context Energy Policy 395726ndash5736 (2011)
16 USDA 2002 Census of Agriculture US Department of Agriculture Washington DC (2004)
17 USDA 2007 Census of Agriculture US Department of Agriculture Washington DC (2010)
18 USDA 2008 Farm and Ranch Irrigation Report No AC-02-SS-1 US Department of Agriculture Washington DC (2009)
19 USDA 2003 Farm and Ranch Irrigation Survey Report No AC-02-SS-1 US Department of Agriculture Washington DC (2004)
20 USGS Water Use in the United States 1985 1990 and 1995 [Online] US Geological Survey Available at httpwaterusgs govwatuse [September 19 2012]
21 High Plains Regional Climate Center Crop Coeffi cients for Corn [Online] Available at httpwwwhprccunleduawdn etcropcrop_corntxt [September 19 2012]
22 Marek T Colaizzi P Howell TA Dusek D and Porter D Estimating Seasonal Crop ET Using Calendar and Heat Unit Based Crop Coefficients in the Texas High Plains Evapotranspiration Network Presented at 2006 ASAE Annual Meeting American Society of Agricultural and Biological Engineers Portland OR pp 9ndash12 (2006)
23 Kiniry J Lynd L Greene N Johnson M Casler M and Laser MS Biofuels and water use Comparison of maize and switch-grass and general perspectives new research on biofuels ed by Wright JH and Evans DA Nova Science Publishing New York ( 2008 )
24 Kiniry JR Tischler CR and Van Esbroeck GA Radiation use efficiency and leaf CO2 exchange for diverse C4 grasses Biomass Bioenerg 17(2)95ndash112 (1999)
25 Grassini P Yang H and Cassman KG Limits to maize proshyductivity in western corn-belt A simulation analysis for fully irrigated and rainfed conditions Agr Forest Meteor 1491254ndash 1265 (2009 )
26 Hoos AB and McMahon G Spatial analysis of instream nitroshygen loads and factors controlling nitrogen delivery to streams in the Southeastern United States using spatially referenced regression on watershed attributes (SPARROW) and regional classifi cation frameworks Hydrol Process 232275ndash2294 (2009)
27 Hoos AB Terziotti S McMahon G Savvas K Tighe KC and Alkons-Wolinsky R Data to Support Statistical Modeling of Instream Nutrient Load Based on Watershed Attributes Southeastern United States 2002 US Geological Survey pp 50 (2008)
28 Demissie Y Yan E and Wu M Assessing regional hydrology and water quality implications of large-scale biofuel feedstock production in the Upper Mississippi river basin Environ Sci Technol 469174ndash9182 (2012)
29 Wu M Demissie Y and Yan E Simulated impact of future bioshyfuel production on water quality and water cycle dynamics in the Upper Mississippi river basin Biomass Bioenerg 4144ndash56 (2012)
30 Smith RA Alexander RB and Schwarz GE Natural backshyground concentrations of nutrients in streams and rivers of the conterminous United States Environ Sci Technol 373039ndash 3047 (2003)
31 Chiu YW and Wu M Assessing county-level water footprints of different cellulosic-biofuel feedstock pathways Environ Sci Technol 469155ndash9162 (2012)
32 White PJ CORN Chemistry and Technology 2nd edn ed byWhite PJ and Johnson LA American Association of Cereal Chemists Inc St Paul MN (2003)
33 Wu M and Peng MJ Developing a tool to estimate water withshydrawal and consumption in electricity generation in the United States Report No ANLESD11-2 update Argonne National Laboratory (2011)
34 ANL TTRDC GREET Model [Online] Argonne National Laboratory Transportation Technology RampD Center Chicago IL Available at httpgreetesanlgovindex phpcontent= power_water [August 21 2012]
35 Wu M Mintz M Wang M and Arora S Water consumption in the production of ethanol and petroleum gasoline Environ Manage 44981ndash997 (2009)
36 Hsu DD Inman D Heath GA Wolfrum EJ Mann MK and Aden A Life cycle environmental impacts of selected US ethanol production and use pathways in 2022 Environ Sci Technol 445289ndash5297 (2010)
300 copy 2013 Society of Chemical Industry and John Wiley amp Sons Ltd | Biofuels Bioprod Bioref 7282ndash302 (2013) DOI 101002bbb
Modeling and Analysis Biochemical biorefinery sizing and environmental sustainability impacts AM Argo et al
Andrew Argo
Dr Andrew Argo is senior engineer in the system integration group at the National Renewable Energy Laboratoshyry His work supports the Department of Energy Biomass Program in the areas of strategic systemlevel analysis and integrated biorefinery projects monitoring
Eric C D Tan
Dr Tan is a Senior Research Engineer in the Biorefinery Analysis Group of the National Bioenergy Center at the National Renewable National Laborashytory (NREL) His research interests include the process design economshyics and sustainability for conversion of lignocellulosic biomass to biofuels
with particular emphasis on the application of techno-economic analysis and life cycle assessment methods He also has broad experience in chemically reacting flow simulation and heterogeneous catalysis
Daniel Inman
Dr Daniel Inman is a research scienshytist at the National Renewable Energy Laboratory in Golden Colorado His primary research interests are centered on the sustainability biofuel producshytion and use He is currently involved in several modeling projects including lifecycle assessment of multiple biofushy
els and using system dynamics to examine the growth of the cellulosic biofuels industry
Matthew H Langholtz
Dr Matthew Langholtz is a Natural Resource Economist in the Bioenergy Group at Oak Ridge National Laborashytory He is principle investigator (PI) of the Resource Analysis Project of the Bioenergy Group at Oak Ridge Nationshyal Lab as well as the Short-Rotation Woody Crop Sustainability project His
research interests include biomass resource economics short-rotation woody crops and bioenergy from forest resources He has worked on valuation of non-market externalities and developed biomass supply curves for commercial projects the South and the United States
Laurence M Eaton
Laurence Eaton is a Research Scientist at the Oak Ridge National Laborashytory in the Bioenergy Resource and Engineering Systems Group of the Environmental Sciences Division An economist by training he conducts research to support bioenergy foreshycasting and analysis using economic
land use models and Geographic Information Science He participates in interdisciplinary Resource Assessment activities to support the efficient and sustainable supply of agricultural and forestry resources for commercial domestic bioenergy and bioproducts markets He has worked in the area of applied microeconomics as it reshylates to bioenergy firm input decisions and the valuation of environmental goods and ecological services
Jacob J Jacobson
Mr Jacobson is a researcher from the Idaho National Laboratory He has a diverse background in systems analysis system dynamics statistical consulting software development and project management His work has been in the development and analysis of decision support systems to evalushy
ate policy options and business risks of complex energy and environmental systems His recent work has been in the area of analysis of biomass feedstock logistics
Christopher T Wright
Dr Chris Wright is manager and a senior research engineer for the Idaho National Laboratoryrsquos Biofuels and Reshynewable Energy Department His work supports the Department of Energy Biomass Program in developing analyshysis tools and technology for feedstock supply logistics and conversion of bioshy
mass to valuable fuels chemicals materials and power His knowledge of DOErsquos Biomass Program includes an emphasis on lignocellulosic feedstock supply systems which includes feedstock characterization development preprocessing handling and transportation issues assoshyciated with refining biomass into fuels and chemicals
copy 2013 Society of Chemical Industry and John Wiley amp Sons Ltd | Biofuels Bioprod Bioref 7282ndash302 (2013) DOI 101002bbb 301
AM Argo et al Modeling and Analysis Biochemical biorefinery sizing and environmental sustainability impacts
David J Muth Jr
Dr Dave Muth is a Research Engishyneer at the Idaho National Laboratory in Biofuels and Renewable Energy Technologies He leads the Analysis and Sustainability Group with the Bioenergy Research Team developshying models and modeling techniques which facilitate the evaluation the
feedstock assembly system as it pertains to creating advanced biofuels He is currently working as a contracshytor to the US Department of Energy Office of Biomass Programs located at DOE Headquarters supporting the establishment of technical objectives and research tarshygets for next generation feedstock supply and logistics systems that deliver high quality biomass feedstocks for advanced hydrocarbon fuel production
May M Wu
Dr May Wu a principal energy systems analyst at Argonne National Laborashytory is the PI of biofuel sustainability research funded by the US Departshyment of Energy Her research interests are in the area of water quality and water quantity associated with large-scale development of biofuel convenshy
tional fuel electricity and emerging fuels and life cycle analysis Dr Wu is leading the effort to develop tools and largescale watershed models to assess spatially explicit water footprint of biofuel produced from conventional cellulosic and advanced feedstock and impact of proshyjected future production on regional nutrient sediment and hydrology Dr Wu served as an expert advisor to the Water Working Group of the Council on Sustainable Biomass Production (CSBP)
Yi-Wen Chiu
Dr Yi-Wen Chiu is a postdoctoral apshypointee in the Energy System Division at the Argonne National Laboratory As an interdisciplinary scientist her main research interests are to understand the coupling and interaction of human and natural systems by applying inteshygrated modeling tools She has been
involved in research related to water footprint and water-energy nexus with broad interests related to scenario analysis and environmental impact assessment She also participates in several studies aiming to advance biofuels by determining the feasible pathways of achieving water sustainability goals
Robin L Graham
Dr Robin L Graham is Deputy Associate Laboratory Director for the Computing Environment and Life Science Directorate at the Argonne National Laboratory Formerly at Oak Ridge National Laboratory she worked in the Bioenergy field for many years pioneering biomass feedstock
resource assessments that incorporated both economic and environmental factors She was an author of the original ldquoBillion Tonrdquo study and contributed to its 2011 follow-up An ecosystem ecologist by training she has long been interested in developing sustainable natural resources and began her career working for the RampD Division of Weyerhaeuser Co She currently is leading Argonnersquos Biological and Environmental Science Initiashytive which aims to accelerate our understanding of the fundamental design principles in biological and environshymental systems
302 copy 2013 Society of Chemical Industry and John Wiley amp Sons Ltd | Biofuels Bioprod Bioref 7282ndash302 (2013) DOI 101002bbb

AM Argo et al Modeling and Analysis Biochemical biorefinery sizing and environmental sustainability impacts
Table 7 (Continued)
FIPS (IA) Case 1 Supplement Case 2 Supplement Corn FIPS (GA) Case 3 SWG FIPS (GA) Case 3 SWG Fertilizer Fertilizer Fertilizer Fertilizer Fertilizer
kgac kgac kgac kgac kgac
19163 1494 1596 6000 13165 7800
19165 1660 1660 2671 13167 6271
19167 1766 1899 2671 13169 ndash
19169 1561 1566 5996 13171 ndash
19171 1512 1514 5978 13173 6469
19173 629 629 2671 13175 7213
19175 737 737 5467 13177 7800
19177 646 646 5418 13179 ndash
19179 1099 1099 5455 13181 ndash
19181 1290 1290 5467 13183 5844
19183 1665 1708 5824 13185 5868
19185 552 552 2671 13187 4895
19187 1664 1668 5703 13189 ndash
19189 1599 1599 5909 13191 ndash
19191 1249 1253 5793 13193 7800
19193 2013 2013 2671 13195 5853
19195 1778 2102 5841 13197 7800
19197 1803 2136 6081 13199 7800
Figure 6 Blue water footprint of cellulosic ethanol produced from corn stover (Cases 1 and 2) and switchgrass (Case 3) by production stage at refinery scale of 2000 DMTday in 2017
850 and 820 gallons water per gallon ethanol respecshytively The average grey water in Case 3 which accounts for assimilating the total fertilizer applied during the entire growth period is only 210 gallons water per galshylon ethanol Results clearly indicate the unique ability of switchgrass to capture nutrient runoff in addition to lower fertilizer input requirements thereby reducing grey
Figure 7 Green and grey water footprint of cellulosic ethashynol produced from corn stover (Cases 1 and 2) and switch-grass (Case 3) by production stage at refinery scale of 2000 DMTday in 2017
water loadings Historically switchgrass has been used in conservation programs to contain the fertilizer loss to water body from crop land
At the same refinery capacity choice of feedstock and location could have significant impacts on types of water footprint of the cellulosic biofuel Since a majority of
296 copy 2013 Society of Chemical Industry and John Wiley amp Sons Ltd | Biofuels Bioprod Bioref 7282ndash302 (2013) DOI 101002bbb
Modeling and Analysis Biochemical biorefinery sizing and environmental sustainability impacts AM Argo et al
Figure 8 County-level distributions of blue green and grey water footprint for a 2000 DMTd biorefinery in 2017 to produced biofuel from (a) corn stover grown in Iowa via advanced logistic system (Case 2) and (b) switchgrass grown in Georgia via advanced logistic system (Case 3)
water requirements in the biofuel life cycle are from the feedstock growing stage the water footprint of a particushylar biofuel is largely determined by regional climate For example with the same advanced logistic system cellushylosic ethanol produced from switchgrass in biorefi neries located in Georgia (Case 3) requires 39 less blue water footprint than that for Iowa stover in Case 2 (Fig 6) Since the total water requirement for crop growth would be satshyisfied either from rainfall (green water) or irrigation (blue water) lower green water footprint often means increased blue water footprint for the same plant species (Fig 8)
Switchgrass is a high yield perennial which requires substantial evapotransporation to support its growth Switchgrass can be cultivated in many regions in the USA without irrigation and thus producing rain-fed switch-grass could have less impact on regional blue water use than other crops requiring irrigation
Biorefinery water supply is entirely blue water and biorefinery water demand is concentrated in a single local area Thus a biorefinery built in an area where the local feedstock is blue-water-intensive would likely lead to an increased burden on the local water resources as compare to a biorefinery built in an area with less blue-watershyintensive feedstocks Therefore it is environmentally benshyeficial to develop switchgrass or other perennial feedstock
plantations in regions with sufficient green water supply to ensure sustainable water use for the feedstock and the biorefi nery
From a whole biorefinery production perspective the resource needs for blue water becomes more pronounced as biorefinery scale increases Further CBS logistics systems dictate that the biorefinery be located near the biomass feedstock production whereas AUD logistics effectively decouple biorefinery location from feedstock production Therefore we expect that CBS logistics would stress a local water resource to a greater extent than AUD logistics Figure 8 further shows the extensive geographishycal variability of blue andf green water footprint even within a state which would affect the choice of feedstock thereby influence the refinery siting consideration
Sustainability metrics and life cycle assessment
SimaPro v73 life cycle assessment modeling soft ware was used to develop and link unit processes using estabshylished methods36 In the absence of primary publicly available data we used the Ecoinvent v20 and to a lesser extent the US Life Cycle Inventory (US LCI) processes We modified the Ecoinvent processes to be refl ective of
copy 2013 Society of Chemical Industry and John Wiley amp Sons Ltd | Biofuels Bioprod Bioref 7282ndash302 (2013) DOI 101002bbb 297
AM Argo et al Modeling and Analysis Biochemical biorefinery sizing and environmental sustainability impacts
Figure 9 GHG emi ssions LCA results for Case 1 Iowa corn stover CBS Case 2 Iowa corn stover AUD and Case 3 Georgia switchgrass AUD
US conditions and the US LCI processes to account for embodied emissions and energy fl ows
Modeling approach and assumptions
The modeling boundary for this study is from fi eld to refinery gate including embodied energy and material flows using the methods described elsewhere36 Th e funcshytional unit is 1 gallon of ethanol produced in the year 2017 Avoided impacts are accounted for using product displacement (also termed boundary system expansion)15
For products that share inputs (eg corn grain and corn stover) burdens are allocated between products based on a lsquoproduct-purposersquo approach Inputs to multi-year cropping systems (ie switchgrass) are likewise annualized by the length of the cropping rotation Impacts from direct and indirect land use change are not considered in this study Feedstock processing and transport are modeled accordshying to INLrsquos CBS and AUD
LCA modeling results
A breakdown of the GHG emission (in terms of CO2 equivalent) for each of the cases is displayed graphically in Fig 9 When comparing AUD to CBS moderate increases in GHG emissions observed in the Iowa corn stover
biochemical conversion-to-ethanol are associated with additional field-to-depot and depot-to-terminal transporshytation steps (lsquoPre-processing otherrsquo category in Fig 9) and increased transportation contribution to the biorefi nery (lsquoFeedstock transportationrsquo category) The small increases in normalized (per gallon of ethanol) electricity credit with increasing biorefinery scale are associated with increased electricity generation efficiency As expected we observe small feedstock differences in GHG emissions for Iowa corn stover and Georgia switchgrass
Conclusions
As expected we demonstrated that CBS has lower average logistics costs than AUD AUD logistic costs are higher than CBS costs primarly due to increased pre-processing costs and increased transportation costs (with multiple transportation step) Likewise and similar to earlier studshyies3 we also show that with CBS logistic costs increase as either biorefinery capacity or feedstock collection radius increase AUD mitigates many of the CBS feedstock-supshyply risks and while resulting in modestly higher logistics costs dramatically reduces both the temporal and spatial biomass-cost variability and allows access to substantially larger quantities of biomass
298 copy 2013 Society of Chemical Industry and John Wiley amp Sons Ltd | Biofuels Bioprod Bioref 7282ndash302 (2013) DOI 101002bbb
Modeling and Analysis Biochemical biorefinery sizing and environmental sustainability impacts AM Argo et al
1 AUD effectively disconnects the feedstock from the biorefinery in terms of both scale and location Single or multiple terminals can supply single or multiple biorefineries of varying scale Biorefi nery locations can be optimized for logistics distribution water resources or other project-specifi c constraints
2 AUD promotes more sustainable cropping practices whereas with CBS there is always pressure to produce the same crop
3 AUD providers have much tighter control on biomass production specifications than is possible with CBS
Iowa corn stover supply costs with CBS increase as biorefinery capacity increases from 500 to 2000 DMTday however the biorefinery economy-of-scale impact is larger in magnitude and the overall MESP decreases from $345 gal to $248gal going from 500 to 2000 DMTday bioreshyfinery scale It must be noted that CBS was not considered for biorefinery capacities of 5000 DMT or greater as the existing models do not capture the substantial additional infrastructure required to manage the high throughput of trucks through the biorefi nery
Iowa corn stover supply costs with the AUD are conshystant for biorefineries ranging from 500 to gt10 000 DMT day and as a result the MESP is reduced from $372gal to $225gal Similar to Iowa corn stover Georgia switch-grass feedstock supply costs are constant using the AUD for biorefineries ranging from 500 to 5000 DMTday however for biorefineries larger than ~5000 DMTday the terminal-to-biorefinery distance needs to be increased from 100 miles to 300 miles to supply the larger capacishyties As a result the MESP for Georgia decreases from $337gal to approximately $204gal as the biorefi nery capacity is increased from 500 DMTday to 10 000 DMT day Only small if any cost reductions are expected for capacities greater than 10 000 DMTday Results of this study show that biochemical ethanol production using a CBS results in the lowest MESP at small biorefi nery scales At larger biorefineries (gt5000 DMTday) these analyses suggest that AUD logistics result in producshytion costs lower than those possible with conventional systems
Our results show no detrimental effects on water sustainability metrics when comparing AUD to CBS Nevertheless feedstock location and feedstock type do affect water use and quality so if biorefineries use diff ershyent feedstocks or pull feedstocks from diff erent locations than those modeled here the results will change Th is study also did not consider the local impact on water resources when siting a large biorefinery We expect that
large biorefineries such as those enabled by the AUD will require a water footprint commensurate to their scale and hence may stress the water resources of a specifi c area where the biorefinery is located
Our results show that AUD logistics result in modestly higher GHG emissions (10ndash15) than CBS mainly due to additional field-to-depot and depot-to-terminal transporshytation (lsquoPre-processing otherrsquo category in Fig 9) steps and increased transportation contribution to the biorefi nery (lsquoFeedstock transportationrsquo category)
One potential issue not addressed in this work is that biomass resulting from AUD pre-processing are subshystantially changed physically and potentially chemically compared to materials collected using CBS (eg lignin is plasticized) This may aff ect biorefinery yield operability and production costs and thus future work will need to experimentally verify and quantify biochemical convershysion of these materials and adapt the modelsanalyses accordingly
Acknowledgement
We thank the US Department of Energy for funding and supporting this work
References 1 US DOE US Billion-Ton Update Biomass Supply for
a Bioenergy and Bioproducts Industry USDOE report no ORNLTM-2011224 lead by Perlack RD and Stokes BJ United States Department of Energy and Oak Ridge National Laboratory Oak Ridge TN pp 227 (2011)
2 Riley C and Schell D Technical and Economic Analysis of an Enzymatic Hydrolysis Based Ethanol Plant internal report Solar Energy Research Institute Golden CO (1991)
3 Aden A Ruth M Ibsen K Jechura J Neeves K Sheehan J et al Lignocellulosic Biomass to Ethanol Process Design and Economics Utilizing Co-Current Dilute Acid Prehydrolysis and Enzymatic Hydrolysis for Corn Stover report no NREL TP-510-32438 National Renewable Energy Laboratory Golden CO pp 154 (2002)
4 Humbird D Davis R Tao L Kinchin C Hsu D Aden A et al Process Design and Economics for the Conversion of Lignocellulosic Biomass to Ethanol Dilute-Acid Pretreatment and Enzymatic Hydrolysis of Corn Stover report no NREL TP-510-47764 National Renewable Energy Laboratory Golden CO pp 147 (2011)
5 Searcy E Wright C Muth D Hess JR and Jacobson J The Limits of a 50 Mile Collection Radius for Biomass Supply to a Biorefi nery draft report Idaho National Laboratory Idaho Falls ID (2010)
6 Hess JR Wright CT Kenney KL and Searcy EM Uniform-Format Solid Feedstock Supply System A Commodity-Scale Design to Produce and Infrastructure-Compaible Bulk Solid from Lignocellulosic Biomass ndash Executive Summary report no INLEXT-09-15423 Idaho National Laboratory Idaho Falls ID (2009)
copy 2013 Society of Chemical Industry and John Wiley amp Sons Ltd | Biofuels Bioprod Bioref 7282ndash302 (2013) DOI 101002bbb 299
AM Argo et al Modeling and Analysis Biochemical biorefinery sizing and environmental sustainability impacts
7 Jacobson JJ and Searcy EM Uniform-Format Feedstock Supply System Design for Woody Biomass Presented at the Spring Conference of the AICHe Orlando FL April (2010)
8 Langholtz M Graham RC Eaton L Perlack R Hellwinckel C and De la Torre Ugarte D Price projections of feedstocks for biofuels and biopower in the US Energy Policy41484ndash493 (2012)
9 USDA NASS Agricultural Prices Paid US [Online] Department of Agriculture National Agricultural Statistics Service Available at httpusdamannlibcornelledu MannUsdaviewDocumentInfododocumentID =1002 [September 19 2012]
10 USDA-OCEWAOB Agricultural Projects to 2018 Long-term Projections Report OCE-2010-1 US Department of Agriculture and Office of the Chief Economist World Agricultural Outlook Board Washington DC (2009)
11 US Congress Energy Independence and Security Act of 2007 110th Congress 1st Session HR 6 4 (2007)
12 US EIA Annual Energy Outlook 2010 Report No DOEEIAshy0383 US Energy Information Administration Washington DC (2010)
13 Wu M Chiu YW and Demissie Y Quantifying the regional water footprint of biofuel production by incorporatshying hydrologic modeling Water Resrouce Research DOI1010292011WR011809 (2012)
14 NOAA NCDC 1971-2000 US Climate Normals Products Clim 84 Daily Normals [Online] NOAA National Climate Data Center Available at httpwwwncdcnoaagov [September 19 2012]
15 Wang M Huo H and Arora S Methods of dealing with coshyproducts of biofuels in life-cycle analysis and consequent results within the US context Energy Policy 395726ndash5736 (2011)
16 USDA 2002 Census of Agriculture US Department of Agriculture Washington DC (2004)
17 USDA 2007 Census of Agriculture US Department of Agriculture Washington DC (2010)
18 USDA 2008 Farm and Ranch Irrigation Report No AC-02-SS-1 US Department of Agriculture Washington DC (2009)
19 USDA 2003 Farm and Ranch Irrigation Survey Report No AC-02-SS-1 US Department of Agriculture Washington DC (2004)
20 USGS Water Use in the United States 1985 1990 and 1995 [Online] US Geological Survey Available at httpwaterusgs govwatuse [September 19 2012]
21 High Plains Regional Climate Center Crop Coeffi cients for Corn [Online] Available at httpwwwhprccunleduawdn etcropcrop_corntxt [September 19 2012]
22 Marek T Colaizzi P Howell TA Dusek D and Porter D Estimating Seasonal Crop ET Using Calendar and Heat Unit Based Crop Coefficients in the Texas High Plains Evapotranspiration Network Presented at 2006 ASAE Annual Meeting American Society of Agricultural and Biological Engineers Portland OR pp 9ndash12 (2006)
23 Kiniry J Lynd L Greene N Johnson M Casler M and Laser MS Biofuels and water use Comparison of maize and switch-grass and general perspectives new research on biofuels ed by Wright JH and Evans DA Nova Science Publishing New York ( 2008 )
24 Kiniry JR Tischler CR and Van Esbroeck GA Radiation use efficiency and leaf CO2 exchange for diverse C4 grasses Biomass Bioenerg 17(2)95ndash112 (1999)
25 Grassini P Yang H and Cassman KG Limits to maize proshyductivity in western corn-belt A simulation analysis for fully irrigated and rainfed conditions Agr Forest Meteor 1491254ndash 1265 (2009 )
26 Hoos AB and McMahon G Spatial analysis of instream nitroshygen loads and factors controlling nitrogen delivery to streams in the Southeastern United States using spatially referenced regression on watershed attributes (SPARROW) and regional classifi cation frameworks Hydrol Process 232275ndash2294 (2009)
27 Hoos AB Terziotti S McMahon G Savvas K Tighe KC and Alkons-Wolinsky R Data to Support Statistical Modeling of Instream Nutrient Load Based on Watershed Attributes Southeastern United States 2002 US Geological Survey pp 50 (2008)
28 Demissie Y Yan E and Wu M Assessing regional hydrology and water quality implications of large-scale biofuel feedstock production in the Upper Mississippi river basin Environ Sci Technol 469174ndash9182 (2012)
29 Wu M Demissie Y and Yan E Simulated impact of future bioshyfuel production on water quality and water cycle dynamics in the Upper Mississippi river basin Biomass Bioenerg 4144ndash56 (2012)
30 Smith RA Alexander RB and Schwarz GE Natural backshyground concentrations of nutrients in streams and rivers of the conterminous United States Environ Sci Technol 373039ndash 3047 (2003)
31 Chiu YW and Wu M Assessing county-level water footprints of different cellulosic-biofuel feedstock pathways Environ Sci Technol 469155ndash9162 (2012)
32 White PJ CORN Chemistry and Technology 2nd edn ed byWhite PJ and Johnson LA American Association of Cereal Chemists Inc St Paul MN (2003)
33 Wu M and Peng MJ Developing a tool to estimate water withshydrawal and consumption in electricity generation in the United States Report No ANLESD11-2 update Argonne National Laboratory (2011)
34 ANL TTRDC GREET Model [Online] Argonne National Laboratory Transportation Technology RampD Center Chicago IL Available at httpgreetesanlgovindex phpcontent= power_water [August 21 2012]
35 Wu M Mintz M Wang M and Arora S Water consumption in the production of ethanol and petroleum gasoline Environ Manage 44981ndash997 (2009)
36 Hsu DD Inman D Heath GA Wolfrum EJ Mann MK and Aden A Life cycle environmental impacts of selected US ethanol production and use pathways in 2022 Environ Sci Technol 445289ndash5297 (2010)
300 copy 2013 Society of Chemical Industry and John Wiley amp Sons Ltd | Biofuels Bioprod Bioref 7282ndash302 (2013) DOI 101002bbb
Modeling and Analysis Biochemical biorefinery sizing and environmental sustainability impacts AM Argo et al
Andrew Argo
Dr Andrew Argo is senior engineer in the system integration group at the National Renewable Energy Laboratoshyry His work supports the Department of Energy Biomass Program in the areas of strategic systemlevel analysis and integrated biorefinery projects monitoring
Eric C D Tan
Dr Tan is a Senior Research Engineer in the Biorefinery Analysis Group of the National Bioenergy Center at the National Renewable National Laborashytory (NREL) His research interests include the process design economshyics and sustainability for conversion of lignocellulosic biomass to biofuels
with particular emphasis on the application of techno-economic analysis and life cycle assessment methods He also has broad experience in chemically reacting flow simulation and heterogeneous catalysis
Daniel Inman
Dr Daniel Inman is a research scienshytist at the National Renewable Energy Laboratory in Golden Colorado His primary research interests are centered on the sustainability biofuel producshytion and use He is currently involved in several modeling projects including lifecycle assessment of multiple biofushy
els and using system dynamics to examine the growth of the cellulosic biofuels industry
Matthew H Langholtz
Dr Matthew Langholtz is a Natural Resource Economist in the Bioenergy Group at Oak Ridge National Laborashytory He is principle investigator (PI) of the Resource Analysis Project of the Bioenergy Group at Oak Ridge Nationshyal Lab as well as the Short-Rotation Woody Crop Sustainability project His
research interests include biomass resource economics short-rotation woody crops and bioenergy from forest resources He has worked on valuation of non-market externalities and developed biomass supply curves for commercial projects the South and the United States
Laurence M Eaton
Laurence Eaton is a Research Scientist at the Oak Ridge National Laborashytory in the Bioenergy Resource and Engineering Systems Group of the Environmental Sciences Division An economist by training he conducts research to support bioenergy foreshycasting and analysis using economic
land use models and Geographic Information Science He participates in interdisciplinary Resource Assessment activities to support the efficient and sustainable supply of agricultural and forestry resources for commercial domestic bioenergy and bioproducts markets He has worked in the area of applied microeconomics as it reshylates to bioenergy firm input decisions and the valuation of environmental goods and ecological services
Jacob J Jacobson
Mr Jacobson is a researcher from the Idaho National Laboratory He has a diverse background in systems analysis system dynamics statistical consulting software development and project management His work has been in the development and analysis of decision support systems to evalushy
ate policy options and business risks of complex energy and environmental systems His recent work has been in the area of analysis of biomass feedstock logistics
Christopher T Wright
Dr Chris Wright is manager and a senior research engineer for the Idaho National Laboratoryrsquos Biofuels and Reshynewable Energy Department His work supports the Department of Energy Biomass Program in developing analyshysis tools and technology for feedstock supply logistics and conversion of bioshy
mass to valuable fuels chemicals materials and power His knowledge of DOErsquos Biomass Program includes an emphasis on lignocellulosic feedstock supply systems which includes feedstock characterization development preprocessing handling and transportation issues assoshyciated with refining biomass into fuels and chemicals
copy 2013 Society of Chemical Industry and John Wiley amp Sons Ltd | Biofuels Bioprod Bioref 7282ndash302 (2013) DOI 101002bbb 301
AM Argo et al Modeling and Analysis Biochemical biorefinery sizing and environmental sustainability impacts
David J Muth Jr
Dr Dave Muth is a Research Engishyneer at the Idaho National Laboratory in Biofuels and Renewable Energy Technologies He leads the Analysis and Sustainability Group with the Bioenergy Research Team developshying models and modeling techniques which facilitate the evaluation the
feedstock assembly system as it pertains to creating advanced biofuels He is currently working as a contracshytor to the US Department of Energy Office of Biomass Programs located at DOE Headquarters supporting the establishment of technical objectives and research tarshygets for next generation feedstock supply and logistics systems that deliver high quality biomass feedstocks for advanced hydrocarbon fuel production
May M Wu
Dr May Wu a principal energy systems analyst at Argonne National Laborashytory is the PI of biofuel sustainability research funded by the US Departshyment of Energy Her research interests are in the area of water quality and water quantity associated with large-scale development of biofuel convenshy
tional fuel electricity and emerging fuels and life cycle analysis Dr Wu is leading the effort to develop tools and largescale watershed models to assess spatially explicit water footprint of biofuel produced from conventional cellulosic and advanced feedstock and impact of proshyjected future production on regional nutrient sediment and hydrology Dr Wu served as an expert advisor to the Water Working Group of the Council on Sustainable Biomass Production (CSBP)
Yi-Wen Chiu
Dr Yi-Wen Chiu is a postdoctoral apshypointee in the Energy System Division at the Argonne National Laboratory As an interdisciplinary scientist her main research interests are to understand the coupling and interaction of human and natural systems by applying inteshygrated modeling tools She has been
involved in research related to water footprint and water-energy nexus with broad interests related to scenario analysis and environmental impact assessment She also participates in several studies aiming to advance biofuels by determining the feasible pathways of achieving water sustainability goals
Robin L Graham
Dr Robin L Graham is Deputy Associate Laboratory Director for the Computing Environment and Life Science Directorate at the Argonne National Laboratory Formerly at Oak Ridge National Laboratory she worked in the Bioenergy field for many years pioneering biomass feedstock
resource assessments that incorporated both economic and environmental factors She was an author of the original ldquoBillion Tonrdquo study and contributed to its 2011 follow-up An ecosystem ecologist by training she has long been interested in developing sustainable natural resources and began her career working for the RampD Division of Weyerhaeuser Co She currently is leading Argonnersquos Biological and Environmental Science Initiashytive which aims to accelerate our understanding of the fundamental design principles in biological and environshymental systems
302 copy 2013 Society of Chemical Industry and John Wiley amp Sons Ltd | Biofuels Bioprod Bioref 7282ndash302 (2013) DOI 101002bbb
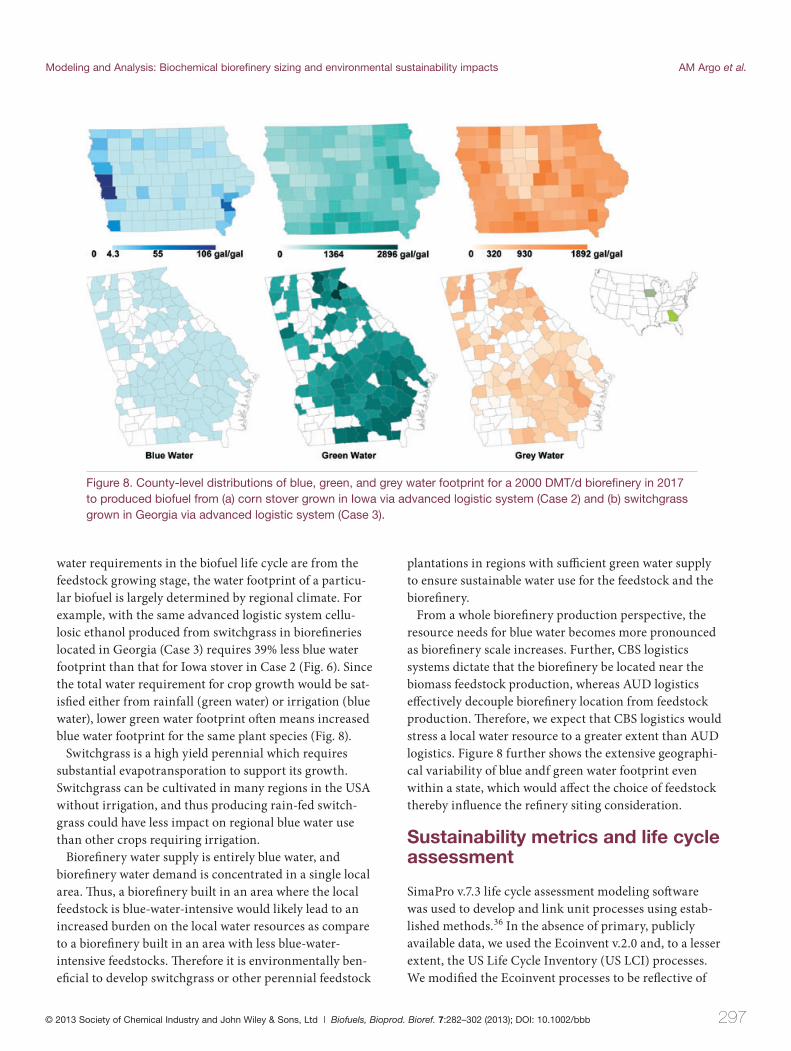
Modeling and Analysis Biochemical biorefinery sizing and environmental sustainability impacts AM Argo et al
Figure 8 County-level distributions of blue green and grey water footprint for a 2000 DMTd biorefinery in 2017 to produced biofuel from (a) corn stover grown in Iowa via advanced logistic system (Case 2) and (b) switchgrass grown in Georgia via advanced logistic system (Case 3)
water requirements in the biofuel life cycle are from the feedstock growing stage the water footprint of a particushylar biofuel is largely determined by regional climate For example with the same advanced logistic system cellushylosic ethanol produced from switchgrass in biorefi neries located in Georgia (Case 3) requires 39 less blue water footprint than that for Iowa stover in Case 2 (Fig 6) Since the total water requirement for crop growth would be satshyisfied either from rainfall (green water) or irrigation (blue water) lower green water footprint often means increased blue water footprint for the same plant species (Fig 8)
Switchgrass is a high yield perennial which requires substantial evapotransporation to support its growth Switchgrass can be cultivated in many regions in the USA without irrigation and thus producing rain-fed switch-grass could have less impact on regional blue water use than other crops requiring irrigation
Biorefinery water supply is entirely blue water and biorefinery water demand is concentrated in a single local area Thus a biorefinery built in an area where the local feedstock is blue-water-intensive would likely lead to an increased burden on the local water resources as compare to a biorefinery built in an area with less blue-watershyintensive feedstocks Therefore it is environmentally benshyeficial to develop switchgrass or other perennial feedstock
plantations in regions with sufficient green water supply to ensure sustainable water use for the feedstock and the biorefi nery
From a whole biorefinery production perspective the resource needs for blue water becomes more pronounced as biorefinery scale increases Further CBS logistics systems dictate that the biorefinery be located near the biomass feedstock production whereas AUD logistics effectively decouple biorefinery location from feedstock production Therefore we expect that CBS logistics would stress a local water resource to a greater extent than AUD logistics Figure 8 further shows the extensive geographishycal variability of blue andf green water footprint even within a state which would affect the choice of feedstock thereby influence the refinery siting consideration
Sustainability metrics and life cycle assessment
SimaPro v73 life cycle assessment modeling soft ware was used to develop and link unit processes using estabshylished methods36 In the absence of primary publicly available data we used the Ecoinvent v20 and to a lesser extent the US Life Cycle Inventory (US LCI) processes We modified the Ecoinvent processes to be refl ective of
copy 2013 Society of Chemical Industry and John Wiley amp Sons Ltd | Biofuels Bioprod Bioref 7282ndash302 (2013) DOI 101002bbb 297
AM Argo et al Modeling and Analysis Biochemical biorefinery sizing and environmental sustainability impacts
Figure 9 GHG emi ssions LCA results for Case 1 Iowa corn stover CBS Case 2 Iowa corn stover AUD and Case 3 Georgia switchgrass AUD
US conditions and the US LCI processes to account for embodied emissions and energy fl ows
Modeling approach and assumptions
The modeling boundary for this study is from fi eld to refinery gate including embodied energy and material flows using the methods described elsewhere36 Th e funcshytional unit is 1 gallon of ethanol produced in the year 2017 Avoided impacts are accounted for using product displacement (also termed boundary system expansion)15
For products that share inputs (eg corn grain and corn stover) burdens are allocated between products based on a lsquoproduct-purposersquo approach Inputs to multi-year cropping systems (ie switchgrass) are likewise annualized by the length of the cropping rotation Impacts from direct and indirect land use change are not considered in this study Feedstock processing and transport are modeled accordshying to INLrsquos CBS and AUD
LCA modeling results
A breakdown of the GHG emission (in terms of CO2 equivalent) for each of the cases is displayed graphically in Fig 9 When comparing AUD to CBS moderate increases in GHG emissions observed in the Iowa corn stover
biochemical conversion-to-ethanol are associated with additional field-to-depot and depot-to-terminal transporshytation steps (lsquoPre-processing otherrsquo category in Fig 9) and increased transportation contribution to the biorefi nery (lsquoFeedstock transportationrsquo category) The small increases in normalized (per gallon of ethanol) electricity credit with increasing biorefinery scale are associated with increased electricity generation efficiency As expected we observe small feedstock differences in GHG emissions for Iowa corn stover and Georgia switchgrass
Conclusions
As expected we demonstrated that CBS has lower average logistics costs than AUD AUD logistic costs are higher than CBS costs primarly due to increased pre-processing costs and increased transportation costs (with multiple transportation step) Likewise and similar to earlier studshyies3 we also show that with CBS logistic costs increase as either biorefinery capacity or feedstock collection radius increase AUD mitigates many of the CBS feedstock-supshyply risks and while resulting in modestly higher logistics costs dramatically reduces both the temporal and spatial biomass-cost variability and allows access to substantially larger quantities of biomass
298 copy 2013 Society of Chemical Industry and John Wiley amp Sons Ltd | Biofuels Bioprod Bioref 7282ndash302 (2013) DOI 101002bbb
Modeling and Analysis Biochemical biorefinery sizing and environmental sustainability impacts AM Argo et al
1 AUD effectively disconnects the feedstock from the biorefinery in terms of both scale and location Single or multiple terminals can supply single or multiple biorefineries of varying scale Biorefi nery locations can be optimized for logistics distribution water resources or other project-specifi c constraints
2 AUD promotes more sustainable cropping practices whereas with CBS there is always pressure to produce the same crop
3 AUD providers have much tighter control on biomass production specifications than is possible with CBS
Iowa corn stover supply costs with CBS increase as biorefinery capacity increases from 500 to 2000 DMTday however the biorefinery economy-of-scale impact is larger in magnitude and the overall MESP decreases from $345 gal to $248gal going from 500 to 2000 DMTday bioreshyfinery scale It must be noted that CBS was not considered for biorefinery capacities of 5000 DMT or greater as the existing models do not capture the substantial additional infrastructure required to manage the high throughput of trucks through the biorefi nery
Iowa corn stover supply costs with the AUD are conshystant for biorefineries ranging from 500 to gt10 000 DMT day and as a result the MESP is reduced from $372gal to $225gal Similar to Iowa corn stover Georgia switch-grass feedstock supply costs are constant using the AUD for biorefineries ranging from 500 to 5000 DMTday however for biorefineries larger than ~5000 DMTday the terminal-to-biorefinery distance needs to be increased from 100 miles to 300 miles to supply the larger capacishyties As a result the MESP for Georgia decreases from $337gal to approximately $204gal as the biorefi nery capacity is increased from 500 DMTday to 10 000 DMT day Only small if any cost reductions are expected for capacities greater than 10 000 DMTday Results of this study show that biochemical ethanol production using a CBS results in the lowest MESP at small biorefi nery scales At larger biorefineries (gt5000 DMTday) these analyses suggest that AUD logistics result in producshytion costs lower than those possible with conventional systems
Our results show no detrimental effects on water sustainability metrics when comparing AUD to CBS Nevertheless feedstock location and feedstock type do affect water use and quality so if biorefineries use diff ershyent feedstocks or pull feedstocks from diff erent locations than those modeled here the results will change Th is study also did not consider the local impact on water resources when siting a large biorefinery We expect that
large biorefineries such as those enabled by the AUD will require a water footprint commensurate to their scale and hence may stress the water resources of a specifi c area where the biorefinery is located
Our results show that AUD logistics result in modestly higher GHG emissions (10ndash15) than CBS mainly due to additional field-to-depot and depot-to-terminal transporshytation (lsquoPre-processing otherrsquo category in Fig 9) steps and increased transportation contribution to the biorefi nery (lsquoFeedstock transportationrsquo category)
One potential issue not addressed in this work is that biomass resulting from AUD pre-processing are subshystantially changed physically and potentially chemically compared to materials collected using CBS (eg lignin is plasticized) This may aff ect biorefinery yield operability and production costs and thus future work will need to experimentally verify and quantify biochemical convershysion of these materials and adapt the modelsanalyses accordingly
Acknowledgement
We thank the US Department of Energy for funding and supporting this work
References 1 US DOE US Billion-Ton Update Biomass Supply for
a Bioenergy and Bioproducts Industry USDOE report no ORNLTM-2011224 lead by Perlack RD and Stokes BJ United States Department of Energy and Oak Ridge National Laboratory Oak Ridge TN pp 227 (2011)
2 Riley C and Schell D Technical and Economic Analysis of an Enzymatic Hydrolysis Based Ethanol Plant internal report Solar Energy Research Institute Golden CO (1991)
3 Aden A Ruth M Ibsen K Jechura J Neeves K Sheehan J et al Lignocellulosic Biomass to Ethanol Process Design and Economics Utilizing Co-Current Dilute Acid Prehydrolysis and Enzymatic Hydrolysis for Corn Stover report no NREL TP-510-32438 National Renewable Energy Laboratory Golden CO pp 154 (2002)
4 Humbird D Davis R Tao L Kinchin C Hsu D Aden A et al Process Design and Economics for the Conversion of Lignocellulosic Biomass to Ethanol Dilute-Acid Pretreatment and Enzymatic Hydrolysis of Corn Stover report no NREL TP-510-47764 National Renewable Energy Laboratory Golden CO pp 147 (2011)
5 Searcy E Wright C Muth D Hess JR and Jacobson J The Limits of a 50 Mile Collection Radius for Biomass Supply to a Biorefi nery draft report Idaho National Laboratory Idaho Falls ID (2010)
6 Hess JR Wright CT Kenney KL and Searcy EM Uniform-Format Solid Feedstock Supply System A Commodity-Scale Design to Produce and Infrastructure-Compaible Bulk Solid from Lignocellulosic Biomass ndash Executive Summary report no INLEXT-09-15423 Idaho National Laboratory Idaho Falls ID (2009)
copy 2013 Society of Chemical Industry and John Wiley amp Sons Ltd | Biofuels Bioprod Bioref 7282ndash302 (2013) DOI 101002bbb 299
AM Argo et al Modeling and Analysis Biochemical biorefinery sizing and environmental sustainability impacts
7 Jacobson JJ and Searcy EM Uniform-Format Feedstock Supply System Design for Woody Biomass Presented at the Spring Conference of the AICHe Orlando FL April (2010)
8 Langholtz M Graham RC Eaton L Perlack R Hellwinckel C and De la Torre Ugarte D Price projections of feedstocks for biofuels and biopower in the US Energy Policy41484ndash493 (2012)
9 USDA NASS Agricultural Prices Paid US [Online] Department of Agriculture National Agricultural Statistics Service Available at httpusdamannlibcornelledu MannUsdaviewDocumentInfododocumentID =1002 [September 19 2012]
10 USDA-OCEWAOB Agricultural Projects to 2018 Long-term Projections Report OCE-2010-1 US Department of Agriculture and Office of the Chief Economist World Agricultural Outlook Board Washington DC (2009)
11 US Congress Energy Independence and Security Act of 2007 110th Congress 1st Session HR 6 4 (2007)
12 US EIA Annual Energy Outlook 2010 Report No DOEEIAshy0383 US Energy Information Administration Washington DC (2010)
13 Wu M Chiu YW and Demissie Y Quantifying the regional water footprint of biofuel production by incorporatshying hydrologic modeling Water Resrouce Research DOI1010292011WR011809 (2012)
14 NOAA NCDC 1971-2000 US Climate Normals Products Clim 84 Daily Normals [Online] NOAA National Climate Data Center Available at httpwwwncdcnoaagov [September 19 2012]
15 Wang M Huo H and Arora S Methods of dealing with coshyproducts of biofuels in life-cycle analysis and consequent results within the US context Energy Policy 395726ndash5736 (2011)
16 USDA 2002 Census of Agriculture US Department of Agriculture Washington DC (2004)
17 USDA 2007 Census of Agriculture US Department of Agriculture Washington DC (2010)
18 USDA 2008 Farm and Ranch Irrigation Report No AC-02-SS-1 US Department of Agriculture Washington DC (2009)
19 USDA 2003 Farm and Ranch Irrigation Survey Report No AC-02-SS-1 US Department of Agriculture Washington DC (2004)
20 USGS Water Use in the United States 1985 1990 and 1995 [Online] US Geological Survey Available at httpwaterusgs govwatuse [September 19 2012]
21 High Plains Regional Climate Center Crop Coeffi cients for Corn [Online] Available at httpwwwhprccunleduawdn etcropcrop_corntxt [September 19 2012]
22 Marek T Colaizzi P Howell TA Dusek D and Porter D Estimating Seasonal Crop ET Using Calendar and Heat Unit Based Crop Coefficients in the Texas High Plains Evapotranspiration Network Presented at 2006 ASAE Annual Meeting American Society of Agricultural and Biological Engineers Portland OR pp 9ndash12 (2006)
23 Kiniry J Lynd L Greene N Johnson M Casler M and Laser MS Biofuels and water use Comparison of maize and switch-grass and general perspectives new research on biofuels ed by Wright JH and Evans DA Nova Science Publishing New York ( 2008 )
24 Kiniry JR Tischler CR and Van Esbroeck GA Radiation use efficiency and leaf CO2 exchange for diverse C4 grasses Biomass Bioenerg 17(2)95ndash112 (1999)
25 Grassini P Yang H and Cassman KG Limits to maize proshyductivity in western corn-belt A simulation analysis for fully irrigated and rainfed conditions Agr Forest Meteor 1491254ndash 1265 (2009 )
26 Hoos AB and McMahon G Spatial analysis of instream nitroshygen loads and factors controlling nitrogen delivery to streams in the Southeastern United States using spatially referenced regression on watershed attributes (SPARROW) and regional classifi cation frameworks Hydrol Process 232275ndash2294 (2009)
27 Hoos AB Terziotti S McMahon G Savvas K Tighe KC and Alkons-Wolinsky R Data to Support Statistical Modeling of Instream Nutrient Load Based on Watershed Attributes Southeastern United States 2002 US Geological Survey pp 50 (2008)
28 Demissie Y Yan E and Wu M Assessing regional hydrology and water quality implications of large-scale biofuel feedstock production in the Upper Mississippi river basin Environ Sci Technol 469174ndash9182 (2012)
29 Wu M Demissie Y and Yan E Simulated impact of future bioshyfuel production on water quality and water cycle dynamics in the Upper Mississippi river basin Biomass Bioenerg 4144ndash56 (2012)
30 Smith RA Alexander RB and Schwarz GE Natural backshyground concentrations of nutrients in streams and rivers of the conterminous United States Environ Sci Technol 373039ndash 3047 (2003)
31 Chiu YW and Wu M Assessing county-level water footprints of different cellulosic-biofuel feedstock pathways Environ Sci Technol 469155ndash9162 (2012)
32 White PJ CORN Chemistry and Technology 2nd edn ed byWhite PJ and Johnson LA American Association of Cereal Chemists Inc St Paul MN (2003)
33 Wu M and Peng MJ Developing a tool to estimate water withshydrawal and consumption in electricity generation in the United States Report No ANLESD11-2 update Argonne National Laboratory (2011)
34 ANL TTRDC GREET Model [Online] Argonne National Laboratory Transportation Technology RampD Center Chicago IL Available at httpgreetesanlgovindex phpcontent= power_water [August 21 2012]
35 Wu M Mintz M Wang M and Arora S Water consumption in the production of ethanol and petroleum gasoline Environ Manage 44981ndash997 (2009)
36 Hsu DD Inman D Heath GA Wolfrum EJ Mann MK and Aden A Life cycle environmental impacts of selected US ethanol production and use pathways in 2022 Environ Sci Technol 445289ndash5297 (2010)
300 copy 2013 Society of Chemical Industry and John Wiley amp Sons Ltd | Biofuels Bioprod Bioref 7282ndash302 (2013) DOI 101002bbb
Modeling and Analysis Biochemical biorefinery sizing and environmental sustainability impacts AM Argo et al
Andrew Argo
Dr Andrew Argo is senior engineer in the system integration group at the National Renewable Energy Laboratoshyry His work supports the Department of Energy Biomass Program in the areas of strategic systemlevel analysis and integrated biorefinery projects monitoring
Eric C D Tan
Dr Tan is a Senior Research Engineer in the Biorefinery Analysis Group of the National Bioenergy Center at the National Renewable National Laborashytory (NREL) His research interests include the process design economshyics and sustainability for conversion of lignocellulosic biomass to biofuels
with particular emphasis on the application of techno-economic analysis and life cycle assessment methods He also has broad experience in chemically reacting flow simulation and heterogeneous catalysis
Daniel Inman
Dr Daniel Inman is a research scienshytist at the National Renewable Energy Laboratory in Golden Colorado His primary research interests are centered on the sustainability biofuel producshytion and use He is currently involved in several modeling projects including lifecycle assessment of multiple biofushy
els and using system dynamics to examine the growth of the cellulosic biofuels industry
Matthew H Langholtz
Dr Matthew Langholtz is a Natural Resource Economist in the Bioenergy Group at Oak Ridge National Laborashytory He is principle investigator (PI) of the Resource Analysis Project of the Bioenergy Group at Oak Ridge Nationshyal Lab as well as the Short-Rotation Woody Crop Sustainability project His
research interests include biomass resource economics short-rotation woody crops and bioenergy from forest resources He has worked on valuation of non-market externalities and developed biomass supply curves for commercial projects the South and the United States
Laurence M Eaton
Laurence Eaton is a Research Scientist at the Oak Ridge National Laborashytory in the Bioenergy Resource and Engineering Systems Group of the Environmental Sciences Division An economist by training he conducts research to support bioenergy foreshycasting and analysis using economic
land use models and Geographic Information Science He participates in interdisciplinary Resource Assessment activities to support the efficient and sustainable supply of agricultural and forestry resources for commercial domestic bioenergy and bioproducts markets He has worked in the area of applied microeconomics as it reshylates to bioenergy firm input decisions and the valuation of environmental goods and ecological services
Jacob J Jacobson
Mr Jacobson is a researcher from the Idaho National Laboratory He has a diverse background in systems analysis system dynamics statistical consulting software development and project management His work has been in the development and analysis of decision support systems to evalushy
ate policy options and business risks of complex energy and environmental systems His recent work has been in the area of analysis of biomass feedstock logistics
Christopher T Wright
Dr Chris Wright is manager and a senior research engineer for the Idaho National Laboratoryrsquos Biofuels and Reshynewable Energy Department His work supports the Department of Energy Biomass Program in developing analyshysis tools and technology for feedstock supply logistics and conversion of bioshy
mass to valuable fuels chemicals materials and power His knowledge of DOErsquos Biomass Program includes an emphasis on lignocellulosic feedstock supply systems which includes feedstock characterization development preprocessing handling and transportation issues assoshyciated with refining biomass into fuels and chemicals
copy 2013 Society of Chemical Industry and John Wiley amp Sons Ltd | Biofuels Bioprod Bioref 7282ndash302 (2013) DOI 101002bbb 301
AM Argo et al Modeling and Analysis Biochemical biorefinery sizing and environmental sustainability impacts
David J Muth Jr
Dr Dave Muth is a Research Engishyneer at the Idaho National Laboratory in Biofuels and Renewable Energy Technologies He leads the Analysis and Sustainability Group with the Bioenergy Research Team developshying models and modeling techniques which facilitate the evaluation the
feedstock assembly system as it pertains to creating advanced biofuels He is currently working as a contracshytor to the US Department of Energy Office of Biomass Programs located at DOE Headquarters supporting the establishment of technical objectives and research tarshygets for next generation feedstock supply and logistics systems that deliver high quality biomass feedstocks for advanced hydrocarbon fuel production
May M Wu
Dr May Wu a principal energy systems analyst at Argonne National Laborashytory is the PI of biofuel sustainability research funded by the US Departshyment of Energy Her research interests are in the area of water quality and water quantity associated with large-scale development of biofuel convenshy
tional fuel electricity and emerging fuels and life cycle analysis Dr Wu is leading the effort to develop tools and largescale watershed models to assess spatially explicit water footprint of biofuel produced from conventional cellulosic and advanced feedstock and impact of proshyjected future production on regional nutrient sediment and hydrology Dr Wu served as an expert advisor to the Water Working Group of the Council on Sustainable Biomass Production (CSBP)
Yi-Wen Chiu
Dr Yi-Wen Chiu is a postdoctoral apshypointee in the Energy System Division at the Argonne National Laboratory As an interdisciplinary scientist her main research interests are to understand the coupling and interaction of human and natural systems by applying inteshygrated modeling tools She has been
involved in research related to water footprint and water-energy nexus with broad interests related to scenario analysis and environmental impact assessment She also participates in several studies aiming to advance biofuels by determining the feasible pathways of achieving water sustainability goals
Robin L Graham
Dr Robin L Graham is Deputy Associate Laboratory Director for the Computing Environment and Life Science Directorate at the Argonne National Laboratory Formerly at Oak Ridge National Laboratory she worked in the Bioenergy field for many years pioneering biomass feedstock
resource assessments that incorporated both economic and environmental factors She was an author of the original ldquoBillion Tonrdquo study and contributed to its 2011 follow-up An ecosystem ecologist by training she has long been interested in developing sustainable natural resources and began her career working for the RampD Division of Weyerhaeuser Co She currently is leading Argonnersquos Biological and Environmental Science Initiashytive which aims to accelerate our understanding of the fundamental design principles in biological and environshymental systems
302 copy 2013 Society of Chemical Industry and John Wiley amp Sons Ltd | Biofuels Bioprod Bioref 7282ndash302 (2013) DOI 101002bbb
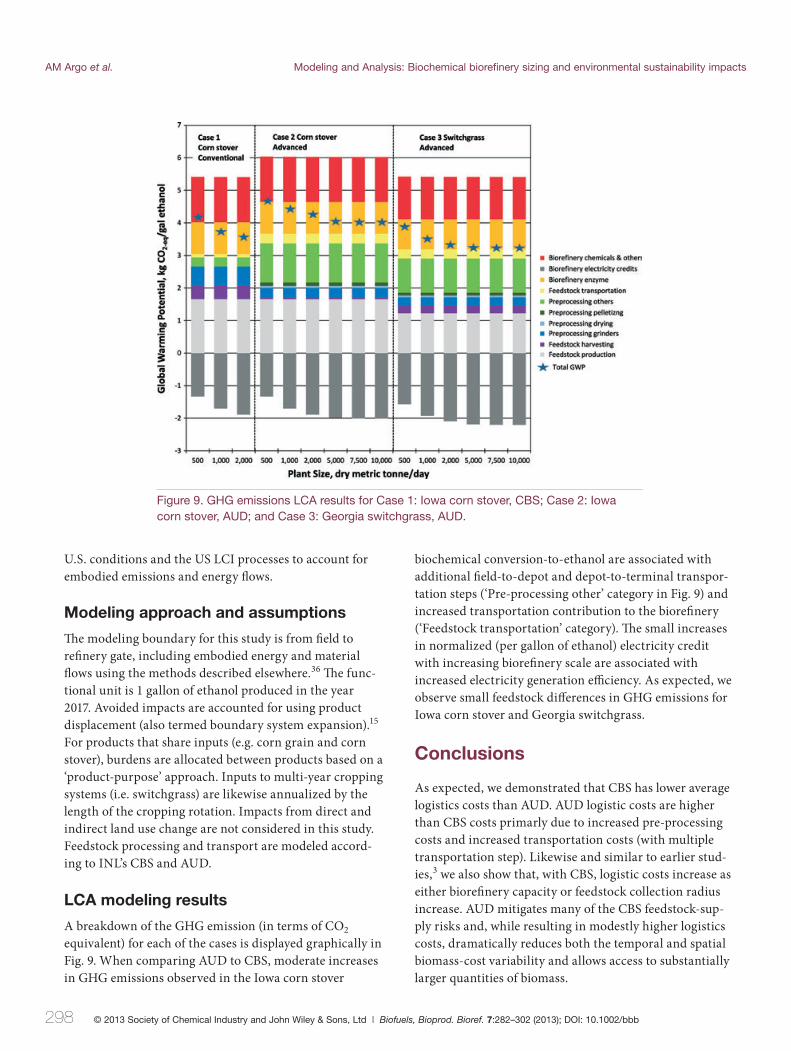
AM Argo et al Modeling and Analysis Biochemical biorefinery sizing and environmental sustainability impacts
Figure 9 GHG emi ssions LCA results for Case 1 Iowa corn stover CBS Case 2 Iowa corn stover AUD and Case 3 Georgia switchgrass AUD
US conditions and the US LCI processes to account for embodied emissions and energy fl ows
Modeling approach and assumptions
The modeling boundary for this study is from fi eld to refinery gate including embodied energy and material flows using the methods described elsewhere36 Th e funcshytional unit is 1 gallon of ethanol produced in the year 2017 Avoided impacts are accounted for using product displacement (also termed boundary system expansion)15
For products that share inputs (eg corn grain and corn stover) burdens are allocated between products based on a lsquoproduct-purposersquo approach Inputs to multi-year cropping systems (ie switchgrass) are likewise annualized by the length of the cropping rotation Impacts from direct and indirect land use change are not considered in this study Feedstock processing and transport are modeled accordshying to INLrsquos CBS and AUD
LCA modeling results
A breakdown of the GHG emission (in terms of CO2 equivalent) for each of the cases is displayed graphically in Fig 9 When comparing AUD to CBS moderate increases in GHG emissions observed in the Iowa corn stover
biochemical conversion-to-ethanol are associated with additional field-to-depot and depot-to-terminal transporshytation steps (lsquoPre-processing otherrsquo category in Fig 9) and increased transportation contribution to the biorefi nery (lsquoFeedstock transportationrsquo category) The small increases in normalized (per gallon of ethanol) electricity credit with increasing biorefinery scale are associated with increased electricity generation efficiency As expected we observe small feedstock differences in GHG emissions for Iowa corn stover and Georgia switchgrass
Conclusions
As expected we demonstrated that CBS has lower average logistics costs than AUD AUD logistic costs are higher than CBS costs primarly due to increased pre-processing costs and increased transportation costs (with multiple transportation step) Likewise and similar to earlier studshyies3 we also show that with CBS logistic costs increase as either biorefinery capacity or feedstock collection radius increase AUD mitigates many of the CBS feedstock-supshyply risks and while resulting in modestly higher logistics costs dramatically reduces both the temporal and spatial biomass-cost variability and allows access to substantially larger quantities of biomass
298 copy 2013 Society of Chemical Industry and John Wiley amp Sons Ltd | Biofuels Bioprod Bioref 7282ndash302 (2013) DOI 101002bbb
Modeling and Analysis Biochemical biorefinery sizing and environmental sustainability impacts AM Argo et al
1 AUD effectively disconnects the feedstock from the biorefinery in terms of both scale and location Single or multiple terminals can supply single or multiple biorefineries of varying scale Biorefi nery locations can be optimized for logistics distribution water resources or other project-specifi c constraints
2 AUD promotes more sustainable cropping practices whereas with CBS there is always pressure to produce the same crop
3 AUD providers have much tighter control on biomass production specifications than is possible with CBS
Iowa corn stover supply costs with CBS increase as biorefinery capacity increases from 500 to 2000 DMTday however the biorefinery economy-of-scale impact is larger in magnitude and the overall MESP decreases from $345 gal to $248gal going from 500 to 2000 DMTday bioreshyfinery scale It must be noted that CBS was not considered for biorefinery capacities of 5000 DMT or greater as the existing models do not capture the substantial additional infrastructure required to manage the high throughput of trucks through the biorefi nery
Iowa corn stover supply costs with the AUD are conshystant for biorefineries ranging from 500 to gt10 000 DMT day and as a result the MESP is reduced from $372gal to $225gal Similar to Iowa corn stover Georgia switch-grass feedstock supply costs are constant using the AUD for biorefineries ranging from 500 to 5000 DMTday however for biorefineries larger than ~5000 DMTday the terminal-to-biorefinery distance needs to be increased from 100 miles to 300 miles to supply the larger capacishyties As a result the MESP for Georgia decreases from $337gal to approximately $204gal as the biorefi nery capacity is increased from 500 DMTday to 10 000 DMT day Only small if any cost reductions are expected for capacities greater than 10 000 DMTday Results of this study show that biochemical ethanol production using a CBS results in the lowest MESP at small biorefi nery scales At larger biorefineries (gt5000 DMTday) these analyses suggest that AUD logistics result in producshytion costs lower than those possible with conventional systems
Our results show no detrimental effects on water sustainability metrics when comparing AUD to CBS Nevertheless feedstock location and feedstock type do affect water use and quality so if biorefineries use diff ershyent feedstocks or pull feedstocks from diff erent locations than those modeled here the results will change Th is study also did not consider the local impact on water resources when siting a large biorefinery We expect that
large biorefineries such as those enabled by the AUD will require a water footprint commensurate to their scale and hence may stress the water resources of a specifi c area where the biorefinery is located
Our results show that AUD logistics result in modestly higher GHG emissions (10ndash15) than CBS mainly due to additional field-to-depot and depot-to-terminal transporshytation (lsquoPre-processing otherrsquo category in Fig 9) steps and increased transportation contribution to the biorefi nery (lsquoFeedstock transportationrsquo category)
One potential issue not addressed in this work is that biomass resulting from AUD pre-processing are subshystantially changed physically and potentially chemically compared to materials collected using CBS (eg lignin is plasticized) This may aff ect biorefinery yield operability and production costs and thus future work will need to experimentally verify and quantify biochemical convershysion of these materials and adapt the modelsanalyses accordingly
Acknowledgement
We thank the US Department of Energy for funding and supporting this work
References 1 US DOE US Billion-Ton Update Biomass Supply for
a Bioenergy and Bioproducts Industry USDOE report no ORNLTM-2011224 lead by Perlack RD and Stokes BJ United States Department of Energy and Oak Ridge National Laboratory Oak Ridge TN pp 227 (2011)
2 Riley C and Schell D Technical and Economic Analysis of an Enzymatic Hydrolysis Based Ethanol Plant internal report Solar Energy Research Institute Golden CO (1991)
3 Aden A Ruth M Ibsen K Jechura J Neeves K Sheehan J et al Lignocellulosic Biomass to Ethanol Process Design and Economics Utilizing Co-Current Dilute Acid Prehydrolysis and Enzymatic Hydrolysis for Corn Stover report no NREL TP-510-32438 National Renewable Energy Laboratory Golden CO pp 154 (2002)
4 Humbird D Davis R Tao L Kinchin C Hsu D Aden A et al Process Design and Economics for the Conversion of Lignocellulosic Biomass to Ethanol Dilute-Acid Pretreatment and Enzymatic Hydrolysis of Corn Stover report no NREL TP-510-47764 National Renewable Energy Laboratory Golden CO pp 147 (2011)
5 Searcy E Wright C Muth D Hess JR and Jacobson J The Limits of a 50 Mile Collection Radius for Biomass Supply to a Biorefi nery draft report Idaho National Laboratory Idaho Falls ID (2010)
6 Hess JR Wright CT Kenney KL and Searcy EM Uniform-Format Solid Feedstock Supply System A Commodity-Scale Design to Produce and Infrastructure-Compaible Bulk Solid from Lignocellulosic Biomass ndash Executive Summary report no INLEXT-09-15423 Idaho National Laboratory Idaho Falls ID (2009)
copy 2013 Society of Chemical Industry and John Wiley amp Sons Ltd | Biofuels Bioprod Bioref 7282ndash302 (2013) DOI 101002bbb 299
AM Argo et al Modeling and Analysis Biochemical biorefinery sizing and environmental sustainability impacts
7 Jacobson JJ and Searcy EM Uniform-Format Feedstock Supply System Design for Woody Biomass Presented at the Spring Conference of the AICHe Orlando FL April (2010)
8 Langholtz M Graham RC Eaton L Perlack R Hellwinckel C and De la Torre Ugarte D Price projections of feedstocks for biofuels and biopower in the US Energy Policy41484ndash493 (2012)
9 USDA NASS Agricultural Prices Paid US [Online] Department of Agriculture National Agricultural Statistics Service Available at httpusdamannlibcornelledu MannUsdaviewDocumentInfododocumentID =1002 [September 19 2012]
10 USDA-OCEWAOB Agricultural Projects to 2018 Long-term Projections Report OCE-2010-1 US Department of Agriculture and Office of the Chief Economist World Agricultural Outlook Board Washington DC (2009)
11 US Congress Energy Independence and Security Act of 2007 110th Congress 1st Session HR 6 4 (2007)
12 US EIA Annual Energy Outlook 2010 Report No DOEEIAshy0383 US Energy Information Administration Washington DC (2010)
13 Wu M Chiu YW and Demissie Y Quantifying the regional water footprint of biofuel production by incorporatshying hydrologic modeling Water Resrouce Research DOI1010292011WR011809 (2012)
14 NOAA NCDC 1971-2000 US Climate Normals Products Clim 84 Daily Normals [Online] NOAA National Climate Data Center Available at httpwwwncdcnoaagov [September 19 2012]
15 Wang M Huo H and Arora S Methods of dealing with coshyproducts of biofuels in life-cycle analysis and consequent results within the US context Energy Policy 395726ndash5736 (2011)
16 USDA 2002 Census of Agriculture US Department of Agriculture Washington DC (2004)
17 USDA 2007 Census of Agriculture US Department of Agriculture Washington DC (2010)
18 USDA 2008 Farm and Ranch Irrigation Report No AC-02-SS-1 US Department of Agriculture Washington DC (2009)
19 USDA 2003 Farm and Ranch Irrigation Survey Report No AC-02-SS-1 US Department of Agriculture Washington DC (2004)
20 USGS Water Use in the United States 1985 1990 and 1995 [Online] US Geological Survey Available at httpwaterusgs govwatuse [September 19 2012]
21 High Plains Regional Climate Center Crop Coeffi cients for Corn [Online] Available at httpwwwhprccunleduawdn etcropcrop_corntxt [September 19 2012]
22 Marek T Colaizzi P Howell TA Dusek D and Porter D Estimating Seasonal Crop ET Using Calendar and Heat Unit Based Crop Coefficients in the Texas High Plains Evapotranspiration Network Presented at 2006 ASAE Annual Meeting American Society of Agricultural and Biological Engineers Portland OR pp 9ndash12 (2006)
23 Kiniry J Lynd L Greene N Johnson M Casler M and Laser MS Biofuels and water use Comparison of maize and switch-grass and general perspectives new research on biofuels ed by Wright JH and Evans DA Nova Science Publishing New York ( 2008 )
24 Kiniry JR Tischler CR and Van Esbroeck GA Radiation use efficiency and leaf CO2 exchange for diverse C4 grasses Biomass Bioenerg 17(2)95ndash112 (1999)
25 Grassini P Yang H and Cassman KG Limits to maize proshyductivity in western corn-belt A simulation analysis for fully irrigated and rainfed conditions Agr Forest Meteor 1491254ndash 1265 (2009 )
26 Hoos AB and McMahon G Spatial analysis of instream nitroshygen loads and factors controlling nitrogen delivery to streams in the Southeastern United States using spatially referenced regression on watershed attributes (SPARROW) and regional classifi cation frameworks Hydrol Process 232275ndash2294 (2009)
27 Hoos AB Terziotti S McMahon G Savvas K Tighe KC and Alkons-Wolinsky R Data to Support Statistical Modeling of Instream Nutrient Load Based on Watershed Attributes Southeastern United States 2002 US Geological Survey pp 50 (2008)
28 Demissie Y Yan E and Wu M Assessing regional hydrology and water quality implications of large-scale biofuel feedstock production in the Upper Mississippi river basin Environ Sci Technol 469174ndash9182 (2012)
29 Wu M Demissie Y and Yan E Simulated impact of future bioshyfuel production on water quality and water cycle dynamics in the Upper Mississippi river basin Biomass Bioenerg 4144ndash56 (2012)
30 Smith RA Alexander RB and Schwarz GE Natural backshyground concentrations of nutrients in streams and rivers of the conterminous United States Environ Sci Technol 373039ndash 3047 (2003)
31 Chiu YW and Wu M Assessing county-level water footprints of different cellulosic-biofuel feedstock pathways Environ Sci Technol 469155ndash9162 (2012)
32 White PJ CORN Chemistry and Technology 2nd edn ed byWhite PJ and Johnson LA American Association of Cereal Chemists Inc St Paul MN (2003)
33 Wu M and Peng MJ Developing a tool to estimate water withshydrawal and consumption in electricity generation in the United States Report No ANLESD11-2 update Argonne National Laboratory (2011)
34 ANL TTRDC GREET Model [Online] Argonne National Laboratory Transportation Technology RampD Center Chicago IL Available at httpgreetesanlgovindex phpcontent= power_water [August 21 2012]
35 Wu M Mintz M Wang M and Arora S Water consumption in the production of ethanol and petroleum gasoline Environ Manage 44981ndash997 (2009)
36 Hsu DD Inman D Heath GA Wolfrum EJ Mann MK and Aden A Life cycle environmental impacts of selected US ethanol production and use pathways in 2022 Environ Sci Technol 445289ndash5297 (2010)
300 copy 2013 Society of Chemical Industry and John Wiley amp Sons Ltd | Biofuels Bioprod Bioref 7282ndash302 (2013) DOI 101002bbb
Modeling and Analysis Biochemical biorefinery sizing and environmental sustainability impacts AM Argo et al
Andrew Argo
Dr Andrew Argo is senior engineer in the system integration group at the National Renewable Energy Laboratoshyry His work supports the Department of Energy Biomass Program in the areas of strategic systemlevel analysis and integrated biorefinery projects monitoring
Eric C D Tan
Dr Tan is a Senior Research Engineer in the Biorefinery Analysis Group of the National Bioenergy Center at the National Renewable National Laborashytory (NREL) His research interests include the process design economshyics and sustainability for conversion of lignocellulosic biomass to biofuels
with particular emphasis on the application of techno-economic analysis and life cycle assessment methods He also has broad experience in chemically reacting flow simulation and heterogeneous catalysis
Daniel Inman
Dr Daniel Inman is a research scienshytist at the National Renewable Energy Laboratory in Golden Colorado His primary research interests are centered on the sustainability biofuel producshytion and use He is currently involved in several modeling projects including lifecycle assessment of multiple biofushy
els and using system dynamics to examine the growth of the cellulosic biofuels industry
Matthew H Langholtz
Dr Matthew Langholtz is a Natural Resource Economist in the Bioenergy Group at Oak Ridge National Laborashytory He is principle investigator (PI) of the Resource Analysis Project of the Bioenergy Group at Oak Ridge Nationshyal Lab as well as the Short-Rotation Woody Crop Sustainability project His
research interests include biomass resource economics short-rotation woody crops and bioenergy from forest resources He has worked on valuation of non-market externalities and developed biomass supply curves for commercial projects the South and the United States
Laurence M Eaton
Laurence Eaton is a Research Scientist at the Oak Ridge National Laborashytory in the Bioenergy Resource and Engineering Systems Group of the Environmental Sciences Division An economist by training he conducts research to support bioenergy foreshycasting and analysis using economic
land use models and Geographic Information Science He participates in interdisciplinary Resource Assessment activities to support the efficient and sustainable supply of agricultural and forestry resources for commercial domestic bioenergy and bioproducts markets He has worked in the area of applied microeconomics as it reshylates to bioenergy firm input decisions and the valuation of environmental goods and ecological services
Jacob J Jacobson
Mr Jacobson is a researcher from the Idaho National Laboratory He has a diverse background in systems analysis system dynamics statistical consulting software development and project management His work has been in the development and analysis of decision support systems to evalushy
ate policy options and business risks of complex energy and environmental systems His recent work has been in the area of analysis of biomass feedstock logistics
Christopher T Wright
Dr Chris Wright is manager and a senior research engineer for the Idaho National Laboratoryrsquos Biofuels and Reshynewable Energy Department His work supports the Department of Energy Biomass Program in developing analyshysis tools and technology for feedstock supply logistics and conversion of bioshy
mass to valuable fuels chemicals materials and power His knowledge of DOErsquos Biomass Program includes an emphasis on lignocellulosic feedstock supply systems which includes feedstock characterization development preprocessing handling and transportation issues assoshyciated with refining biomass into fuels and chemicals
copy 2013 Society of Chemical Industry and John Wiley amp Sons Ltd | Biofuels Bioprod Bioref 7282ndash302 (2013) DOI 101002bbb 301
AM Argo et al Modeling and Analysis Biochemical biorefinery sizing and environmental sustainability impacts
David J Muth Jr
Dr Dave Muth is a Research Engishyneer at the Idaho National Laboratory in Biofuels and Renewable Energy Technologies He leads the Analysis and Sustainability Group with the Bioenergy Research Team developshying models and modeling techniques which facilitate the evaluation the
feedstock assembly system as it pertains to creating advanced biofuels He is currently working as a contracshytor to the US Department of Energy Office of Biomass Programs located at DOE Headquarters supporting the establishment of technical objectives and research tarshygets for next generation feedstock supply and logistics systems that deliver high quality biomass feedstocks for advanced hydrocarbon fuel production
May M Wu
Dr May Wu a principal energy systems analyst at Argonne National Laborashytory is the PI of biofuel sustainability research funded by the US Departshyment of Energy Her research interests are in the area of water quality and water quantity associated with large-scale development of biofuel convenshy
tional fuel electricity and emerging fuels and life cycle analysis Dr Wu is leading the effort to develop tools and largescale watershed models to assess spatially explicit water footprint of biofuel produced from conventional cellulosic and advanced feedstock and impact of proshyjected future production on regional nutrient sediment and hydrology Dr Wu served as an expert advisor to the Water Working Group of the Council on Sustainable Biomass Production (CSBP)
Yi-Wen Chiu
Dr Yi-Wen Chiu is a postdoctoral apshypointee in the Energy System Division at the Argonne National Laboratory As an interdisciplinary scientist her main research interests are to understand the coupling and interaction of human and natural systems by applying inteshygrated modeling tools She has been
involved in research related to water footprint and water-energy nexus with broad interests related to scenario analysis and environmental impact assessment She also participates in several studies aiming to advance biofuels by determining the feasible pathways of achieving water sustainability goals
Robin L Graham
Dr Robin L Graham is Deputy Associate Laboratory Director for the Computing Environment and Life Science Directorate at the Argonne National Laboratory Formerly at Oak Ridge National Laboratory she worked in the Bioenergy field for many years pioneering biomass feedstock
resource assessments that incorporated both economic and environmental factors She was an author of the original ldquoBillion Tonrdquo study and contributed to its 2011 follow-up An ecosystem ecologist by training she has long been interested in developing sustainable natural resources and began her career working for the RampD Division of Weyerhaeuser Co She currently is leading Argonnersquos Biological and Environmental Science Initiashytive which aims to accelerate our understanding of the fundamental design principles in biological and environshymental systems
302 copy 2013 Society of Chemical Industry and John Wiley amp Sons Ltd | Biofuels Bioprod Bioref 7282ndash302 (2013) DOI 101002bbb

Modeling and Analysis Biochemical biorefinery sizing and environmental sustainability impacts AM Argo et al
1 AUD effectively disconnects the feedstock from the biorefinery in terms of both scale and location Single or multiple terminals can supply single or multiple biorefineries of varying scale Biorefi nery locations can be optimized for logistics distribution water resources or other project-specifi c constraints
2 AUD promotes more sustainable cropping practices whereas with CBS there is always pressure to produce the same crop
3 AUD providers have much tighter control on biomass production specifications than is possible with CBS
Iowa corn stover supply costs with CBS increase as biorefinery capacity increases from 500 to 2000 DMTday however the biorefinery economy-of-scale impact is larger in magnitude and the overall MESP decreases from $345 gal to $248gal going from 500 to 2000 DMTday bioreshyfinery scale It must be noted that CBS was not considered for biorefinery capacities of 5000 DMT or greater as the existing models do not capture the substantial additional infrastructure required to manage the high throughput of trucks through the biorefi nery
Iowa corn stover supply costs with the AUD are conshystant for biorefineries ranging from 500 to gt10 000 DMT day and as a result the MESP is reduced from $372gal to $225gal Similar to Iowa corn stover Georgia switch-grass feedstock supply costs are constant using the AUD for biorefineries ranging from 500 to 5000 DMTday however for biorefineries larger than ~5000 DMTday the terminal-to-biorefinery distance needs to be increased from 100 miles to 300 miles to supply the larger capacishyties As a result the MESP for Georgia decreases from $337gal to approximately $204gal as the biorefi nery capacity is increased from 500 DMTday to 10 000 DMT day Only small if any cost reductions are expected for capacities greater than 10 000 DMTday Results of this study show that biochemical ethanol production using a CBS results in the lowest MESP at small biorefi nery scales At larger biorefineries (gt5000 DMTday) these analyses suggest that AUD logistics result in producshytion costs lower than those possible with conventional systems
Our results show no detrimental effects on water sustainability metrics when comparing AUD to CBS Nevertheless feedstock location and feedstock type do affect water use and quality so if biorefineries use diff ershyent feedstocks or pull feedstocks from diff erent locations than those modeled here the results will change Th is study also did not consider the local impact on water resources when siting a large biorefinery We expect that
large biorefineries such as those enabled by the AUD will require a water footprint commensurate to their scale and hence may stress the water resources of a specifi c area where the biorefinery is located
Our results show that AUD logistics result in modestly higher GHG emissions (10ndash15) than CBS mainly due to additional field-to-depot and depot-to-terminal transporshytation (lsquoPre-processing otherrsquo category in Fig 9) steps and increased transportation contribution to the biorefi nery (lsquoFeedstock transportationrsquo category)
One potential issue not addressed in this work is that biomass resulting from AUD pre-processing are subshystantially changed physically and potentially chemically compared to materials collected using CBS (eg lignin is plasticized) This may aff ect biorefinery yield operability and production costs and thus future work will need to experimentally verify and quantify biochemical convershysion of these materials and adapt the modelsanalyses accordingly
Acknowledgement
We thank the US Department of Energy for funding and supporting this work
References 1 US DOE US Billion-Ton Update Biomass Supply for
a Bioenergy and Bioproducts Industry USDOE report no ORNLTM-2011224 lead by Perlack RD and Stokes BJ United States Department of Energy and Oak Ridge National Laboratory Oak Ridge TN pp 227 (2011)
2 Riley C and Schell D Technical and Economic Analysis of an Enzymatic Hydrolysis Based Ethanol Plant internal report Solar Energy Research Institute Golden CO (1991)
3 Aden A Ruth M Ibsen K Jechura J Neeves K Sheehan J et al Lignocellulosic Biomass to Ethanol Process Design and Economics Utilizing Co-Current Dilute Acid Prehydrolysis and Enzymatic Hydrolysis for Corn Stover report no NREL TP-510-32438 National Renewable Energy Laboratory Golden CO pp 154 (2002)
4 Humbird D Davis R Tao L Kinchin C Hsu D Aden A et al Process Design and Economics for the Conversion of Lignocellulosic Biomass to Ethanol Dilute-Acid Pretreatment and Enzymatic Hydrolysis of Corn Stover report no NREL TP-510-47764 National Renewable Energy Laboratory Golden CO pp 147 (2011)
5 Searcy E Wright C Muth D Hess JR and Jacobson J The Limits of a 50 Mile Collection Radius for Biomass Supply to a Biorefi nery draft report Idaho National Laboratory Idaho Falls ID (2010)
6 Hess JR Wright CT Kenney KL and Searcy EM Uniform-Format Solid Feedstock Supply System A Commodity-Scale Design to Produce and Infrastructure-Compaible Bulk Solid from Lignocellulosic Biomass ndash Executive Summary report no INLEXT-09-15423 Idaho National Laboratory Idaho Falls ID (2009)
copy 2013 Society of Chemical Industry and John Wiley amp Sons Ltd | Biofuels Bioprod Bioref 7282ndash302 (2013) DOI 101002bbb 299
AM Argo et al Modeling and Analysis Biochemical biorefinery sizing and environmental sustainability impacts
7 Jacobson JJ and Searcy EM Uniform-Format Feedstock Supply System Design for Woody Biomass Presented at the Spring Conference of the AICHe Orlando FL April (2010)
8 Langholtz M Graham RC Eaton L Perlack R Hellwinckel C and De la Torre Ugarte D Price projections of feedstocks for biofuels and biopower in the US Energy Policy41484ndash493 (2012)
9 USDA NASS Agricultural Prices Paid US [Online] Department of Agriculture National Agricultural Statistics Service Available at httpusdamannlibcornelledu MannUsdaviewDocumentInfododocumentID =1002 [September 19 2012]
10 USDA-OCEWAOB Agricultural Projects to 2018 Long-term Projections Report OCE-2010-1 US Department of Agriculture and Office of the Chief Economist World Agricultural Outlook Board Washington DC (2009)
11 US Congress Energy Independence and Security Act of 2007 110th Congress 1st Session HR 6 4 (2007)
12 US EIA Annual Energy Outlook 2010 Report No DOEEIAshy0383 US Energy Information Administration Washington DC (2010)
13 Wu M Chiu YW and Demissie Y Quantifying the regional water footprint of biofuel production by incorporatshying hydrologic modeling Water Resrouce Research DOI1010292011WR011809 (2012)
14 NOAA NCDC 1971-2000 US Climate Normals Products Clim 84 Daily Normals [Online] NOAA National Climate Data Center Available at httpwwwncdcnoaagov [September 19 2012]
15 Wang M Huo H and Arora S Methods of dealing with coshyproducts of biofuels in life-cycle analysis and consequent results within the US context Energy Policy 395726ndash5736 (2011)
16 USDA 2002 Census of Agriculture US Department of Agriculture Washington DC (2004)
17 USDA 2007 Census of Agriculture US Department of Agriculture Washington DC (2010)
18 USDA 2008 Farm and Ranch Irrigation Report No AC-02-SS-1 US Department of Agriculture Washington DC (2009)
19 USDA 2003 Farm and Ranch Irrigation Survey Report No AC-02-SS-1 US Department of Agriculture Washington DC (2004)
20 USGS Water Use in the United States 1985 1990 and 1995 [Online] US Geological Survey Available at httpwaterusgs govwatuse [September 19 2012]
21 High Plains Regional Climate Center Crop Coeffi cients for Corn [Online] Available at httpwwwhprccunleduawdn etcropcrop_corntxt [September 19 2012]
22 Marek T Colaizzi P Howell TA Dusek D and Porter D Estimating Seasonal Crop ET Using Calendar and Heat Unit Based Crop Coefficients in the Texas High Plains Evapotranspiration Network Presented at 2006 ASAE Annual Meeting American Society of Agricultural and Biological Engineers Portland OR pp 9ndash12 (2006)
23 Kiniry J Lynd L Greene N Johnson M Casler M and Laser MS Biofuels and water use Comparison of maize and switch-grass and general perspectives new research on biofuels ed by Wright JH and Evans DA Nova Science Publishing New York ( 2008 )
24 Kiniry JR Tischler CR and Van Esbroeck GA Radiation use efficiency and leaf CO2 exchange for diverse C4 grasses Biomass Bioenerg 17(2)95ndash112 (1999)
25 Grassini P Yang H and Cassman KG Limits to maize proshyductivity in western corn-belt A simulation analysis for fully irrigated and rainfed conditions Agr Forest Meteor 1491254ndash 1265 (2009 )
26 Hoos AB and McMahon G Spatial analysis of instream nitroshygen loads and factors controlling nitrogen delivery to streams in the Southeastern United States using spatially referenced regression on watershed attributes (SPARROW) and regional classifi cation frameworks Hydrol Process 232275ndash2294 (2009)
27 Hoos AB Terziotti S McMahon G Savvas K Tighe KC and Alkons-Wolinsky R Data to Support Statistical Modeling of Instream Nutrient Load Based on Watershed Attributes Southeastern United States 2002 US Geological Survey pp 50 (2008)
28 Demissie Y Yan E and Wu M Assessing regional hydrology and water quality implications of large-scale biofuel feedstock production in the Upper Mississippi river basin Environ Sci Technol 469174ndash9182 (2012)
29 Wu M Demissie Y and Yan E Simulated impact of future bioshyfuel production on water quality and water cycle dynamics in the Upper Mississippi river basin Biomass Bioenerg 4144ndash56 (2012)
30 Smith RA Alexander RB and Schwarz GE Natural backshyground concentrations of nutrients in streams and rivers of the conterminous United States Environ Sci Technol 373039ndash 3047 (2003)
31 Chiu YW and Wu M Assessing county-level water footprints of different cellulosic-biofuel feedstock pathways Environ Sci Technol 469155ndash9162 (2012)
32 White PJ CORN Chemistry and Technology 2nd edn ed byWhite PJ and Johnson LA American Association of Cereal Chemists Inc St Paul MN (2003)
33 Wu M and Peng MJ Developing a tool to estimate water withshydrawal and consumption in electricity generation in the United States Report No ANLESD11-2 update Argonne National Laboratory (2011)
34 ANL TTRDC GREET Model [Online] Argonne National Laboratory Transportation Technology RampD Center Chicago IL Available at httpgreetesanlgovindex phpcontent= power_water [August 21 2012]
35 Wu M Mintz M Wang M and Arora S Water consumption in the production of ethanol and petroleum gasoline Environ Manage 44981ndash997 (2009)
36 Hsu DD Inman D Heath GA Wolfrum EJ Mann MK and Aden A Life cycle environmental impacts of selected US ethanol production and use pathways in 2022 Environ Sci Technol 445289ndash5297 (2010)
300 copy 2013 Society of Chemical Industry and John Wiley amp Sons Ltd | Biofuels Bioprod Bioref 7282ndash302 (2013) DOI 101002bbb
Modeling and Analysis Biochemical biorefinery sizing and environmental sustainability impacts AM Argo et al
Andrew Argo
Dr Andrew Argo is senior engineer in the system integration group at the National Renewable Energy Laboratoshyry His work supports the Department of Energy Biomass Program in the areas of strategic systemlevel analysis and integrated biorefinery projects monitoring
Eric C D Tan
Dr Tan is a Senior Research Engineer in the Biorefinery Analysis Group of the National Bioenergy Center at the National Renewable National Laborashytory (NREL) His research interests include the process design economshyics and sustainability for conversion of lignocellulosic biomass to biofuels
with particular emphasis on the application of techno-economic analysis and life cycle assessment methods He also has broad experience in chemically reacting flow simulation and heterogeneous catalysis
Daniel Inman
Dr Daniel Inman is a research scienshytist at the National Renewable Energy Laboratory in Golden Colorado His primary research interests are centered on the sustainability biofuel producshytion and use He is currently involved in several modeling projects including lifecycle assessment of multiple biofushy
els and using system dynamics to examine the growth of the cellulosic biofuels industry
Matthew H Langholtz
Dr Matthew Langholtz is a Natural Resource Economist in the Bioenergy Group at Oak Ridge National Laborashytory He is principle investigator (PI) of the Resource Analysis Project of the Bioenergy Group at Oak Ridge Nationshyal Lab as well as the Short-Rotation Woody Crop Sustainability project His
research interests include biomass resource economics short-rotation woody crops and bioenergy from forest resources He has worked on valuation of non-market externalities and developed biomass supply curves for commercial projects the South and the United States
Laurence M Eaton
Laurence Eaton is a Research Scientist at the Oak Ridge National Laborashytory in the Bioenergy Resource and Engineering Systems Group of the Environmental Sciences Division An economist by training he conducts research to support bioenergy foreshycasting and analysis using economic
land use models and Geographic Information Science He participates in interdisciplinary Resource Assessment activities to support the efficient and sustainable supply of agricultural and forestry resources for commercial domestic bioenergy and bioproducts markets He has worked in the area of applied microeconomics as it reshylates to bioenergy firm input decisions and the valuation of environmental goods and ecological services
Jacob J Jacobson
Mr Jacobson is a researcher from the Idaho National Laboratory He has a diverse background in systems analysis system dynamics statistical consulting software development and project management His work has been in the development and analysis of decision support systems to evalushy
ate policy options and business risks of complex energy and environmental systems His recent work has been in the area of analysis of biomass feedstock logistics
Christopher T Wright
Dr Chris Wright is manager and a senior research engineer for the Idaho National Laboratoryrsquos Biofuels and Reshynewable Energy Department His work supports the Department of Energy Biomass Program in developing analyshysis tools and technology for feedstock supply logistics and conversion of bioshy
mass to valuable fuels chemicals materials and power His knowledge of DOErsquos Biomass Program includes an emphasis on lignocellulosic feedstock supply systems which includes feedstock characterization development preprocessing handling and transportation issues assoshyciated with refining biomass into fuels and chemicals
copy 2013 Society of Chemical Industry and John Wiley amp Sons Ltd | Biofuels Bioprod Bioref 7282ndash302 (2013) DOI 101002bbb 301
AM Argo et al Modeling and Analysis Biochemical biorefinery sizing and environmental sustainability impacts
David J Muth Jr
Dr Dave Muth is a Research Engishyneer at the Idaho National Laboratory in Biofuels and Renewable Energy Technologies He leads the Analysis and Sustainability Group with the Bioenergy Research Team developshying models and modeling techniques which facilitate the evaluation the
feedstock assembly system as it pertains to creating advanced biofuels He is currently working as a contracshytor to the US Department of Energy Office of Biomass Programs located at DOE Headquarters supporting the establishment of technical objectives and research tarshygets for next generation feedstock supply and logistics systems that deliver high quality biomass feedstocks for advanced hydrocarbon fuel production
May M Wu
Dr May Wu a principal energy systems analyst at Argonne National Laborashytory is the PI of biofuel sustainability research funded by the US Departshyment of Energy Her research interests are in the area of water quality and water quantity associated with large-scale development of biofuel convenshy
tional fuel electricity and emerging fuels and life cycle analysis Dr Wu is leading the effort to develop tools and largescale watershed models to assess spatially explicit water footprint of biofuel produced from conventional cellulosic and advanced feedstock and impact of proshyjected future production on regional nutrient sediment and hydrology Dr Wu served as an expert advisor to the Water Working Group of the Council on Sustainable Biomass Production (CSBP)
Yi-Wen Chiu
Dr Yi-Wen Chiu is a postdoctoral apshypointee in the Energy System Division at the Argonne National Laboratory As an interdisciplinary scientist her main research interests are to understand the coupling and interaction of human and natural systems by applying inteshygrated modeling tools She has been
involved in research related to water footprint and water-energy nexus with broad interests related to scenario analysis and environmental impact assessment She also participates in several studies aiming to advance biofuels by determining the feasible pathways of achieving water sustainability goals
Robin L Graham
Dr Robin L Graham is Deputy Associate Laboratory Director for the Computing Environment and Life Science Directorate at the Argonne National Laboratory Formerly at Oak Ridge National Laboratory she worked in the Bioenergy field for many years pioneering biomass feedstock
resource assessments that incorporated both economic and environmental factors She was an author of the original ldquoBillion Tonrdquo study and contributed to its 2011 follow-up An ecosystem ecologist by training she has long been interested in developing sustainable natural resources and began her career working for the RampD Division of Weyerhaeuser Co She currently is leading Argonnersquos Biological and Environmental Science Initiashytive which aims to accelerate our understanding of the fundamental design principles in biological and environshymental systems
302 copy 2013 Society of Chemical Industry and John Wiley amp Sons Ltd | Biofuels Bioprod Bioref 7282ndash302 (2013) DOI 101002bbb

AM Argo et al Modeling and Analysis Biochemical biorefinery sizing and environmental sustainability impacts
7 Jacobson JJ and Searcy EM Uniform-Format Feedstock Supply System Design for Woody Biomass Presented at the Spring Conference of the AICHe Orlando FL April (2010)
8 Langholtz M Graham RC Eaton L Perlack R Hellwinckel C and De la Torre Ugarte D Price projections of feedstocks for biofuels and biopower in the US Energy Policy41484ndash493 (2012)
9 USDA NASS Agricultural Prices Paid US [Online] Department of Agriculture National Agricultural Statistics Service Available at httpusdamannlibcornelledu MannUsdaviewDocumentInfododocumentID =1002 [September 19 2012]
10 USDA-OCEWAOB Agricultural Projects to 2018 Long-term Projections Report OCE-2010-1 US Department of Agriculture and Office of the Chief Economist World Agricultural Outlook Board Washington DC (2009)
11 US Congress Energy Independence and Security Act of 2007 110th Congress 1st Session HR 6 4 (2007)
12 US EIA Annual Energy Outlook 2010 Report No DOEEIAshy0383 US Energy Information Administration Washington DC (2010)
13 Wu M Chiu YW and Demissie Y Quantifying the regional water footprint of biofuel production by incorporatshying hydrologic modeling Water Resrouce Research DOI1010292011WR011809 (2012)
14 NOAA NCDC 1971-2000 US Climate Normals Products Clim 84 Daily Normals [Online] NOAA National Climate Data Center Available at httpwwwncdcnoaagov [September 19 2012]
15 Wang M Huo H and Arora S Methods of dealing with coshyproducts of biofuels in life-cycle analysis and consequent results within the US context Energy Policy 395726ndash5736 (2011)
16 USDA 2002 Census of Agriculture US Department of Agriculture Washington DC (2004)
17 USDA 2007 Census of Agriculture US Department of Agriculture Washington DC (2010)
18 USDA 2008 Farm and Ranch Irrigation Report No AC-02-SS-1 US Department of Agriculture Washington DC (2009)
19 USDA 2003 Farm and Ranch Irrigation Survey Report No AC-02-SS-1 US Department of Agriculture Washington DC (2004)
20 USGS Water Use in the United States 1985 1990 and 1995 [Online] US Geological Survey Available at httpwaterusgs govwatuse [September 19 2012]
21 High Plains Regional Climate Center Crop Coeffi cients for Corn [Online] Available at httpwwwhprccunleduawdn etcropcrop_corntxt [September 19 2012]
22 Marek T Colaizzi P Howell TA Dusek D and Porter D Estimating Seasonal Crop ET Using Calendar and Heat Unit Based Crop Coefficients in the Texas High Plains Evapotranspiration Network Presented at 2006 ASAE Annual Meeting American Society of Agricultural and Biological Engineers Portland OR pp 9ndash12 (2006)
23 Kiniry J Lynd L Greene N Johnson M Casler M and Laser MS Biofuels and water use Comparison of maize and switch-grass and general perspectives new research on biofuels ed by Wright JH and Evans DA Nova Science Publishing New York ( 2008 )
24 Kiniry JR Tischler CR and Van Esbroeck GA Radiation use efficiency and leaf CO2 exchange for diverse C4 grasses Biomass Bioenerg 17(2)95ndash112 (1999)
25 Grassini P Yang H and Cassman KG Limits to maize proshyductivity in western corn-belt A simulation analysis for fully irrigated and rainfed conditions Agr Forest Meteor 1491254ndash 1265 (2009 )
26 Hoos AB and McMahon G Spatial analysis of instream nitroshygen loads and factors controlling nitrogen delivery to streams in the Southeastern United States using spatially referenced regression on watershed attributes (SPARROW) and regional classifi cation frameworks Hydrol Process 232275ndash2294 (2009)
27 Hoos AB Terziotti S McMahon G Savvas K Tighe KC and Alkons-Wolinsky R Data to Support Statistical Modeling of Instream Nutrient Load Based on Watershed Attributes Southeastern United States 2002 US Geological Survey pp 50 (2008)
28 Demissie Y Yan E and Wu M Assessing regional hydrology and water quality implications of large-scale biofuel feedstock production in the Upper Mississippi river basin Environ Sci Technol 469174ndash9182 (2012)
29 Wu M Demissie Y and Yan E Simulated impact of future bioshyfuel production on water quality and water cycle dynamics in the Upper Mississippi river basin Biomass Bioenerg 4144ndash56 (2012)
30 Smith RA Alexander RB and Schwarz GE Natural backshyground concentrations of nutrients in streams and rivers of the conterminous United States Environ Sci Technol 373039ndash 3047 (2003)
31 Chiu YW and Wu M Assessing county-level water footprints of different cellulosic-biofuel feedstock pathways Environ Sci Technol 469155ndash9162 (2012)
32 White PJ CORN Chemistry and Technology 2nd edn ed byWhite PJ and Johnson LA American Association of Cereal Chemists Inc St Paul MN (2003)
33 Wu M and Peng MJ Developing a tool to estimate water withshydrawal and consumption in electricity generation in the United States Report No ANLESD11-2 update Argonne National Laboratory (2011)
34 ANL TTRDC GREET Model [Online] Argonne National Laboratory Transportation Technology RampD Center Chicago IL Available at httpgreetesanlgovindex phpcontent= power_water [August 21 2012]
35 Wu M Mintz M Wang M and Arora S Water consumption in the production of ethanol and petroleum gasoline Environ Manage 44981ndash997 (2009)
36 Hsu DD Inman D Heath GA Wolfrum EJ Mann MK and Aden A Life cycle environmental impacts of selected US ethanol production and use pathways in 2022 Environ Sci Technol 445289ndash5297 (2010)
300 copy 2013 Society of Chemical Industry and John Wiley amp Sons Ltd | Biofuels Bioprod Bioref 7282ndash302 (2013) DOI 101002bbb
Modeling and Analysis Biochemical biorefinery sizing and environmental sustainability impacts AM Argo et al
Andrew Argo
Dr Andrew Argo is senior engineer in the system integration group at the National Renewable Energy Laboratoshyry His work supports the Department of Energy Biomass Program in the areas of strategic systemlevel analysis and integrated biorefinery projects monitoring
Eric C D Tan
Dr Tan is a Senior Research Engineer in the Biorefinery Analysis Group of the National Bioenergy Center at the National Renewable National Laborashytory (NREL) His research interests include the process design economshyics and sustainability for conversion of lignocellulosic biomass to biofuels
with particular emphasis on the application of techno-economic analysis and life cycle assessment methods He also has broad experience in chemically reacting flow simulation and heterogeneous catalysis
Daniel Inman
Dr Daniel Inman is a research scienshytist at the National Renewable Energy Laboratory in Golden Colorado His primary research interests are centered on the sustainability biofuel producshytion and use He is currently involved in several modeling projects including lifecycle assessment of multiple biofushy
els and using system dynamics to examine the growth of the cellulosic biofuels industry
Matthew H Langholtz
Dr Matthew Langholtz is a Natural Resource Economist in the Bioenergy Group at Oak Ridge National Laborashytory He is principle investigator (PI) of the Resource Analysis Project of the Bioenergy Group at Oak Ridge Nationshyal Lab as well as the Short-Rotation Woody Crop Sustainability project His
research interests include biomass resource economics short-rotation woody crops and bioenergy from forest resources He has worked on valuation of non-market externalities and developed biomass supply curves for commercial projects the South and the United States
Laurence M Eaton
Laurence Eaton is a Research Scientist at the Oak Ridge National Laborashytory in the Bioenergy Resource and Engineering Systems Group of the Environmental Sciences Division An economist by training he conducts research to support bioenergy foreshycasting and analysis using economic
land use models and Geographic Information Science He participates in interdisciplinary Resource Assessment activities to support the efficient and sustainable supply of agricultural and forestry resources for commercial domestic bioenergy and bioproducts markets He has worked in the area of applied microeconomics as it reshylates to bioenergy firm input decisions and the valuation of environmental goods and ecological services
Jacob J Jacobson
Mr Jacobson is a researcher from the Idaho National Laboratory He has a diverse background in systems analysis system dynamics statistical consulting software development and project management His work has been in the development and analysis of decision support systems to evalushy
ate policy options and business risks of complex energy and environmental systems His recent work has been in the area of analysis of biomass feedstock logistics
Christopher T Wright
Dr Chris Wright is manager and a senior research engineer for the Idaho National Laboratoryrsquos Biofuels and Reshynewable Energy Department His work supports the Department of Energy Biomass Program in developing analyshysis tools and technology for feedstock supply logistics and conversion of bioshy
mass to valuable fuels chemicals materials and power His knowledge of DOErsquos Biomass Program includes an emphasis on lignocellulosic feedstock supply systems which includes feedstock characterization development preprocessing handling and transportation issues assoshyciated with refining biomass into fuels and chemicals
copy 2013 Society of Chemical Industry and John Wiley amp Sons Ltd | Biofuels Bioprod Bioref 7282ndash302 (2013) DOI 101002bbb 301
AM Argo et al Modeling and Analysis Biochemical biorefinery sizing and environmental sustainability impacts
David J Muth Jr
Dr Dave Muth is a Research Engishyneer at the Idaho National Laboratory in Biofuels and Renewable Energy Technologies He leads the Analysis and Sustainability Group with the Bioenergy Research Team developshying models and modeling techniques which facilitate the evaluation the
feedstock assembly system as it pertains to creating advanced biofuels He is currently working as a contracshytor to the US Department of Energy Office of Biomass Programs located at DOE Headquarters supporting the establishment of technical objectives and research tarshygets for next generation feedstock supply and logistics systems that deliver high quality biomass feedstocks for advanced hydrocarbon fuel production
May M Wu
Dr May Wu a principal energy systems analyst at Argonne National Laborashytory is the PI of biofuel sustainability research funded by the US Departshyment of Energy Her research interests are in the area of water quality and water quantity associated with large-scale development of biofuel convenshy
tional fuel electricity and emerging fuels and life cycle analysis Dr Wu is leading the effort to develop tools and largescale watershed models to assess spatially explicit water footprint of biofuel produced from conventional cellulosic and advanced feedstock and impact of proshyjected future production on regional nutrient sediment and hydrology Dr Wu served as an expert advisor to the Water Working Group of the Council on Sustainable Biomass Production (CSBP)
Yi-Wen Chiu
Dr Yi-Wen Chiu is a postdoctoral apshypointee in the Energy System Division at the Argonne National Laboratory As an interdisciplinary scientist her main research interests are to understand the coupling and interaction of human and natural systems by applying inteshygrated modeling tools She has been
involved in research related to water footprint and water-energy nexus with broad interests related to scenario analysis and environmental impact assessment She also participates in several studies aiming to advance biofuels by determining the feasible pathways of achieving water sustainability goals
Robin L Graham
Dr Robin L Graham is Deputy Associate Laboratory Director for the Computing Environment and Life Science Directorate at the Argonne National Laboratory Formerly at Oak Ridge National Laboratory she worked in the Bioenergy field for many years pioneering biomass feedstock
resource assessments that incorporated both economic and environmental factors She was an author of the original ldquoBillion Tonrdquo study and contributed to its 2011 follow-up An ecosystem ecologist by training she has long been interested in developing sustainable natural resources and began her career working for the RampD Division of Weyerhaeuser Co She currently is leading Argonnersquos Biological and Environmental Science Initiashytive which aims to accelerate our understanding of the fundamental design principles in biological and environshymental systems
302 copy 2013 Society of Chemical Industry and John Wiley amp Sons Ltd | Biofuels Bioprod Bioref 7282ndash302 (2013) DOI 101002bbb