Embed Size (px)
Citation preview

Investigation of availability, demand, targets, and developmentof renewable energy in 2017–2050: a case study in Indonesia
Erdiwansyah Erdiwansyah1,6 • Mahidin Mahidin2 • Husni Husin2 •
Nasaruddin Nasaruddin3 • Khairil Khairil4 • Muhammad Zaki2 • Jalaluddin Jalaluddin5
Received: 11 May 2020 / Revised: 10 September 2020 / Accepted: 3 December 2020 / Published online: 16 January 2021
� The Author(s) 2021
Abstract Abundant potential of renewable energy (RE) in Indonesia is predicted to replace conventional energy which
continues to experience depletion year by year. However, until now, the use of RE has only reached 2% of the existing potential
of 441.7 GW. The main overview of this work is to investigate the availability of RE that can be utilized for electricity
generation in Indonesia. National energy demand and targets in the long run during the 2017–2050 period are also discussed.
Besides, government policies in supporting RE development are considered in this work. The results show that the potential of
RE in Indonesia can be utilized and might replace conventional energy for decades. The use of RE for electricity generation can
be achieved by employing a government policy that supports the investor as the executor of RE development. The selling price
of electricity generated from RE is cheaper than electricity generated from fossils; this makes economy is more affordable for
people. Finally, the target set by the government for utilizing RE as the main energy in Indonesia can be done by implementing
several policies for the RE development. Thus, greenhouse gas emissions and the use of petroleum fuels can be reduced.
Keywords Energy potential � Energy demand � Energy development � Economic growth � Energy policy � Energy targets
List of symbols
RE Renewable energy
SD Sustainable development
MTOE Million tonnes of oil equivalent
BBM Bahan Bakar Minyak
PLN Perusahaan Listrik Negara
LPG Liquefied petroleum gas
CSA Central Statistics Agency
MMSCF Million standard cubic feet per day
PLTP Pembangkit Listrik Tenaga Panas
PLTMH Pembangkit Listrik Tenaga Mikrohidro (micro
hydro power plant)
PLTG Pembangkit Listrik Tenaga gas (gas power
plant)
PLTS Pembangkit Listrik Tenaga Surya (solar power
generation)
PLTB Pembangkit Listrik Tenaga Biomassa (biomass
power plant)
TSCF Trillion standard cubic feet
GWp Gigawatt-peak
PLTW Pembangkit Listrik Tenaga Wave (tidal/wave
power plant)
KEN Komite economic national
EM Energy mix
LC Low carbon
GWh Giga what per hour
ESBP Electricity supply business plan
KEN Komite economic national
& Erdiwansyah Erdiwansyah
& Mahidin Mahidin
1 Doctoral Program, School of Engineering, Universitas Syiah
Kuala, Banda Aceh 23111, Indonesia
2 Department of Chemical Engineering, Universitas Syiah
Kuala, Banda Aceh 23111, Indonesia
3 Department of Electrical and Computer Engineering, Syiah
Kuala University, Banda Aceh 23111, Indonesia
4 Department of Mechanical Engineering, Universitas Syiah
Kuala, Banda Aceh 23111, Indonesia
5 Department of Accounting, Universitas Syiah Kuala,
Banda Aceh 23111, Indonesia
6 Faculty of Engineering, Universitas Serambi Mekkah,
Banda Aceh 23245, Indonesia
123
Int J Coal Sci Technol (2021) 8(4):483–499
https://doi.org/10.1007/s40789-020-00391-4

DME Dimethyl ether
LNG Liquefied natural gas
PLTA Pembangkit Listrik Tenaga air (hydroelectric
power plant)
PLTD Pembangkit Listrik Tenaga diesel (diesel power
plant)
PLTGU Pembangkit Listrik Tenaga gas dan uap (gas
and steam power plants)
PLTMG Pembangkit Listrik Tenaga Mesin gas (gas
engine power plant)
GW Gigawatt
MW Megawatt
MWp Megawatt-peak
UNEP United Nations Environment Program
1 Introduction
Indonesia is one of the Southeast Asia countries and even
in the world that has problems with the energy crisis. The
number of Indonesia’s oil imports during the 2009–2019
period reached 49.1 million tons, with an average import of
3.6%/year (BPS 2019a). Based on the energy mix (EM),
sustainable development (SD) and low carbon (LC) sce-
nario show that Indonesia’s energy demand in 2025 will be
170.8, 154.7 and 150.1 MTOE, respectively. Meanwhile, in
2050, Indonesia’s overall energy demand will reach 548.8,
481.1 and 424.2 MTOE (ESDM 2019). Total primary
energy production consisting of petroleum, natural gas,
coal, and other REs in 2018 reached 411.6 MTOE. From
the total production, 64% or 261.4 MTOE were exported
mainly for coal and LNG. Final energy consumption in
2018 (without biomass) reached 114 MTOE consisting of
transportation sector of 40%, industry of 36%, household
of 16%, commercial of 6%, and other sectors of 2%.
Energy is one of the main factors in the context of
sustainable development to eradicate poverty, protect the
environment, increase prosperity, and speed development
(Santika et al. 2020). The abundant availability of RE in
Indonesia has been widely expressed by several researchers
and has been widely discussed earlier. Indonesia has the
highest availability of coal energy at 51% in Southeast Asia
(Erdiwansyah et al. 2019a). Meanwhile, Indonesia’s oil
production level is the second highest after Brunei Darus-
salam. Indonesia’s oil production is 12.02% while Brunei
Darussalam’s natural gas production is 18.06% (Erdiwan-
syah et al. 2019). Indonesia has targeted the use of RE in
2025 is 23% with a feed-in tariff policy system. RE is very
possible to be used as the main energy to replace petroleum
(fossil) which continues to experience depletion every year.
Discussions on Indonesia’s RE policy and prospects have
been conveyed (Maulidia et al. 2019). The application of
RE in various ways can also reduce carbon emissions
which has been providing high enough air pollution,
especially from vehicles and industry (Deendarlianto et al.
2020). Determination of the RE target of 23% is in line
with the determination of the use of oil consumption by
25% nationally. The selection of a sustainable solar system
(solar), a sustainable biogas system (biogas), an efficient
lighting device (Lighting), an efficient cooling device
(Cooling), and an efficient cooking stove (Cooking) sce-
nario aims to reduce emissions levels sustainably. In this
case, this action is estimated to be able to save cooling
energy by 22.99% in 2050 (Kusumadewi and Limmee-
chokchai 2017; Erdiwansyah et al. 2019b; O’Ryan et al.
2020; Ben Jebli et al. 2020; Khanna et al. 2019). One of the
RE developments that has attracted foreign investors in
solar PV is reported by (Kennedy 2018). The installed solar
PV capacity increased from 9 megawatts (MW) to more
than 240 MW in 2017. However, foreign investors often
face problem such as lack of government policy towards
RE developers. Therefore, many interventions are not
expected in the field. Targets for achieving efficient use of
RE systems have been prioritized in the decarbonization of
Indonesia’s electricity systems (Indra Al Irsyad et al.
2020).
The application of RE has also greatly impacted the
economic improvement and reduced carbon dioxide emis-
sions. In addition, adverse effects on climate change and
global warming can be reduced by applying RE perma-
nently (Gozgor et al. 2020). Investigations on the effects of
economic policy uncertainty differentiation on various
types of energy company investments using the panel
regression model have been reported (Liu et al. 2020).
Economic growth with RE consumption can drive for long-
term financial development (Eren et al. 2019). Investiga-
tions into the short-term and long-term economic growths
of RE use have also been discussed recently (Alam and
Murad 2020), in which the results show that the use of RE
can significantly increase economic growth and improve
welfare. The global energy transition system is one of the
trends to provide promising economic opportunities in the
future (Jenniches 2018). The use of RE can save money
commonly used for energy needs. This is because RE is
cheaper than fossil fuels. The impact of RE and financial
development on carbon dioxide (CO2) emissions and the
economy has been reported (Charfeddine and Kahia 2019),
in which the results show that RE consumption and
financial development influence CO2emissions and eco-
nomic growth. The effect of economic growth on the
consumption of renewable and non-RE used to inspect
Asia-Pacific Economic Cooperation (APEC) countries
(Zafar et al. 2019). The consumption of renewable and
non-RE used to achieve the target in reducing emissions
484 E. Erdiwansyah
123

globally has been implemented since 1997–2014 (Alola
et al. 2019). While in Indonesia, emissions reductions have
also been carried out such as the development of RE by
implementing several policies for developers. Policies that
support RE developers must be made and implemented by
the stakeholders. Besides, the government must also target
more efficient use of energy in the future. The govern-
ment’s step in targeting the use of RE in the future is very
appropriate. Besides, the government can save more bud-
gets and can further improve the welfare of the community.
The energy found in Indonesia is very abundant, espe-
cially those from renewable energy (RE) sources though
they have not been used optimally. This is because the
available resources are inadequate to support the develop-
ment of RE. The study became important due to its dis-
cussion on the availability, demand, targets, economic
growth, and development of RE might improve the quality
of government planning in energy, especially for RE
development planning. Issues in this article can enhance
the future government planning for about 30 years (up to
2050).
2 Material and method
The process of analysis is a very important thing to do in a
study. There are two rare methods used in the study,
namely analysis and categorization. The analysis process is
based on the arguments contained in the categorized lit-
erature. The arguments reviewed in the study are explained
in detail in Sect. 3, while the fifth section presents overall
conclusion. The literature analyzed in this review was
obtained from various databases including Science Direct,
Web of Science, IEEE, and various research results both
from government institutions and from universities. The
database generally produces various fields of science such
as the development of RE that has high quality.
2.1 Analysis data
The literature review analyzed in this research is based on
RE sources that cannot be utilized optimally as shown in
Fig. 1. Where the total potential of RE found in Indonesia
reaches 441.7 GW with an installed capacity of 9.07 GW.
Meanwhile, the new energy can be utilized to date has only
reached 2%. The analysis and review in this paper discuss
the availability, demand, targets, economic growth, and
development of RE in Indonesia in the period of
2017–2050. Renewable energy discussed includes
geothermal, hydropower, bioenergy, wind power, solar
power, and tidal/wave. Once the analysis of RE availability
is done, energy targets and demand in the next few years
are then discussed. Then, energy supply, economic growth,
RE policies, risks, and RE challenges are described
sequentially and finally concluded.
2.2 Categorization
There are 3 types of references used in the study, namely
literature taken from academics, reports from industry, and
documents about various policies. The last two types of
references were collected online by the author or through
research submitted. Collection of academic literature was
obtained from databases such as Science Direct, Web of
Science, and IEEE using the keywords of potential RE. In
this stage, identification was carried out aiming to produce
Fig. 1 RE potential in Indonesia
Investigation of availability, demand, targets, and development of renewable energy in 2017… 485
123
information contained in the literature according to their
respective year of publication. The methodology used
should be more inspirational and make sense to the reader.
All reference sources reviewed in this paper focus on RE.
The process of searching literature was carried out based
on criteria and selected whether they met the research
objectives. Study selection as a reference was obtained
from journals such as RE, Target Energy, Energy Policy,
Economic Growth, Renewable and Sustainable Energy,
Energy Demand, and Energy Supply. The search for
journal sources needed contains keywords related to
energy. This paper summarizes seven categories, namely:
energy potential (EP), RE target (TRE), energy demand
(ED), energy supply (ES), economic growth (EG), policy
RE (PRE), risks and challenges of RE (RCRE). These
topics are independent and are not yet connected to other
researches.
3 Discussion
The installed power plant capacity in Indonesia until 2018
was 56,509.53 MW. This capacity was supplied by PLN of
40,486.60 MW by private sector of 13,350.79 MW, and by
rental power plants of 2,672.14 MW. Most of the sources
of electricity generation in Indonesia are coal energy of
49%, PLTG/PLTGU/PLTMG of 27% from PLTD of 12%,
PLTA/PLTM of 11%, PLTP of 3%, and the rest comes
from RE. The capacity of this power plant continues to
increase every year from 48,739 MW in 2014 (Rahardjo
and Fitriana 2005; Alhamri and Suryani 2016).
Petroleum production in Indonesia in 2018 decreased to
283 million/barrels (778 thousand b/d) compared to 2009
of 346 million/barrels (949 thousand b/d) (Purwanto et al.
2016; ESDM 2019; Nugroho 2019). The decline in oil
production was caused by several factors such as produc-
tion wells that were no longer feasible. While the devel-
opment of new wells for production was still very limited.
However, until now, Indonesia has a dependency on pet-
roleum. The available petroleum cannot meet the needs of
the existing refineries, so the government of Indonesian
continues to import from other countries such as the
2008 2009 2010 2011 2012 2013 2014 2015 2016 2017 2018 201910
15
20
25
30
35
40
45
50
2008 2009 2010 2011 2012 2013 2014 2015 2016 2017 2018 2019130140150160170180190200210220230240250260270
Tota
l oil
impo
rts (%
)
Total oil imports from 2009-2018
Impor Exspor
(b)
Tota
l of p
rodu
ctio
n an
d oi
l im
port
(bar
el)
Total production and oil impor in 2009-2018
Production Impor
(a)
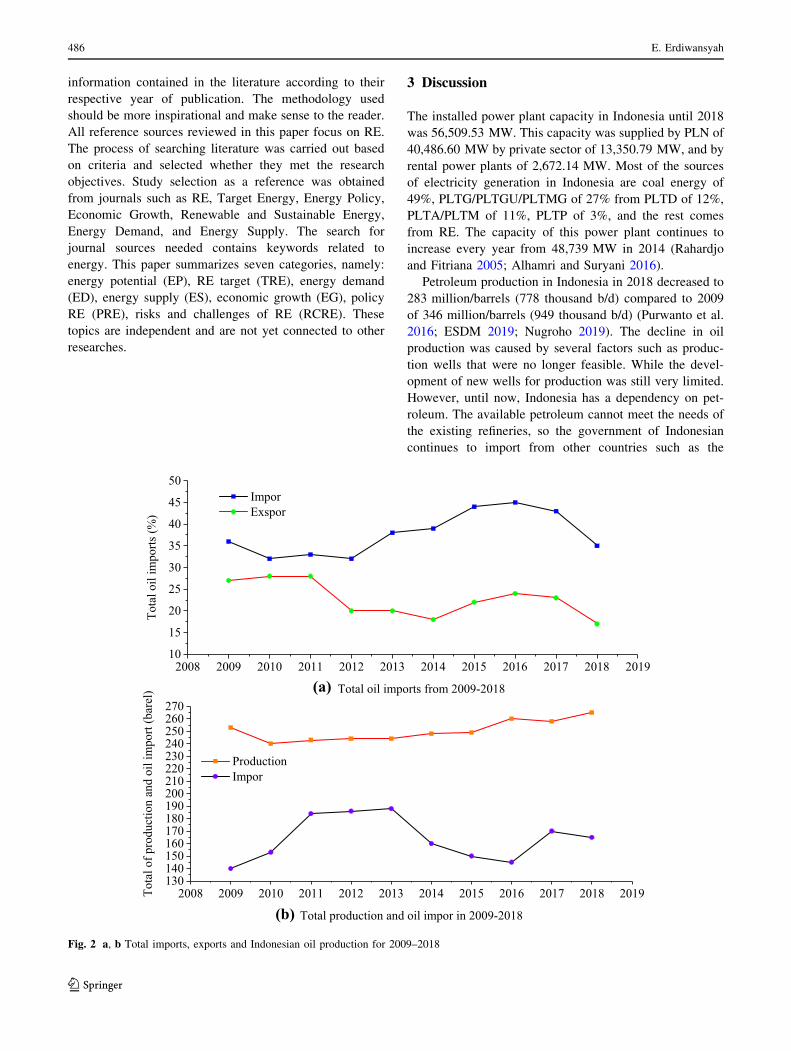
Fig. 2 a, b Total imports, exports and Indonesian oil production for 2009–2018
486 E. Erdiwansyah
123
Middle East. The number of Indonesia’s oil imports from
2009 to 2018 reached more than 35% as shown in Fig.2a.
In general, energy demand in 2018 reached
465.07 million barrels/year including biodiesel fuel. Total
domestic oil production is 278.01 barrels, while the total
amount of oil imported by the government of Indonesian
from oil-producing countries is 165.04 barrels/year. The
comparison of total oil production and import each year
can be seen in Fig. 2b. In 2017, Indonesia was ranked the
third-largest country in terms of crude oil imports after
Singapore and Thailand at US$21.04 and US$ 20.1 billion,
respectively. The total of Indonesia’s oil imports was
US$8.1, Malaysia was US$3.9, the Philippines was
US$3.5, Brunei Darussalam was US$1.6, and Vietnam of
US$93.2 million (CNBC 2017).
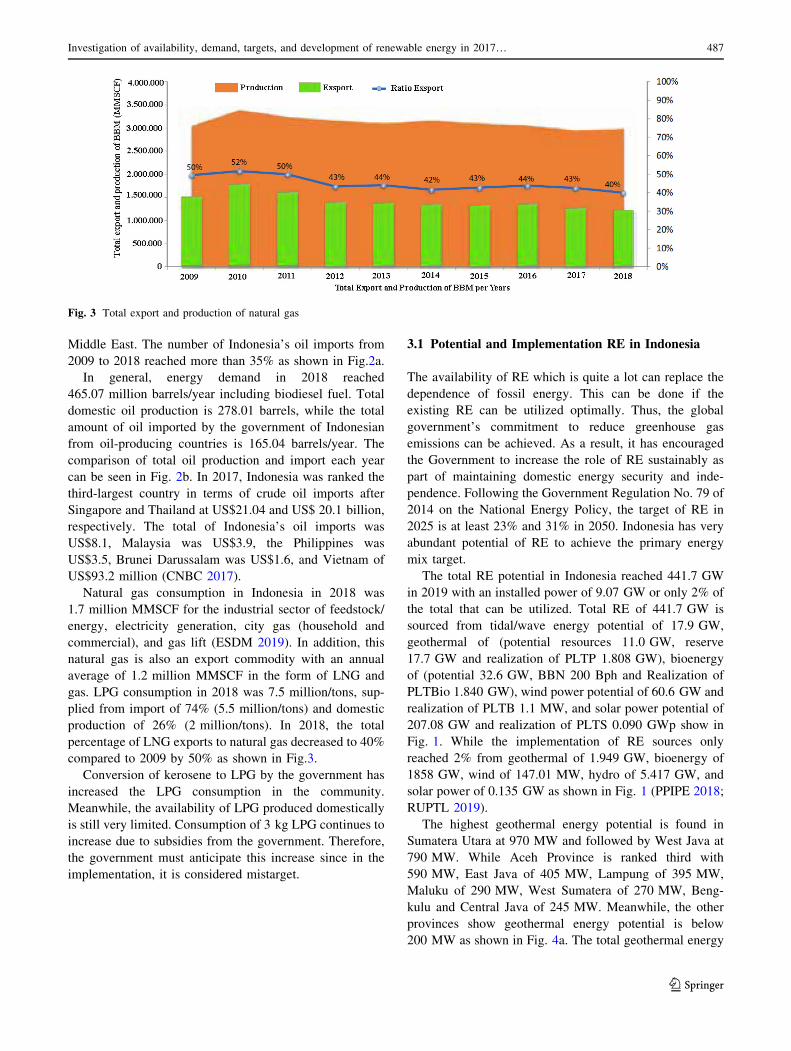
Natural gas consumption in Indonesia in 2018 was
1.7 million MMSCF for the industrial sector of feedstock/
energy, electricity generation, city gas (household and
commercial), and gas lift (ESDM 2019). In addition, this
natural gas is also an export commodity with an annual
average of 1.2 million MMSCF in the form of LNG and
gas. LPG consumption in 2018 was 7.5 million/tons, sup-
plied from import of 74% (5.5 million/tons) and domestic
production of 26% (2 million/tons). In 2018, the total
percentage of LNG exports to natural gas decreased to 40%
compared to 2009 by 50% as shown in Fig.3.
Conversion of kerosene to LPG by the government has
increased the LPG consumption in the community.
Meanwhile, the availability of LPG produced domestically
is still very limited. Consumption of 3 kg LPG continues to
increase due to subsidies from the government. Therefore,
the government must anticipate this increase since in the
implementation, it is considered mistarget.
3.1 Potential and Implementation RE in Indonesia
The availability of RE which is quite a lot can replace the
dependence of fossil energy. This can be done if the
existing RE can be utilized optimally. Thus, the global
government’s commitment to reduce greenhouse gas
emissions can be achieved. As a result, it has encouraged
the Government to increase the role of RE sustainably as
part of maintaining domestic energy security and inde-
pendence. Following the Government Regulation No. 79 of
2014 on the National Energy Policy, the target of RE in
2025 is at least 23% and 31% in 2050. Indonesia has very
abundant potential of RE to achieve the primary energy
mix target.
The total RE potential in Indonesia reached 441.7 GW
in 2019 with an installed power of 9.07 GW or only 2% of
the total that can be utilized. Total RE of 441.7 GW is
sourced from tidal/wave energy potential of 17.9 GW,
geothermal of (potential resources 11.0 GW, reserve
17.7 GW and realization of PLTP 1.808 GW), bioenergy
of (potential 32.6 GW, BBN 200 Bph and Realization of
PLTBio 1.840 GW), wind power potential of 60.6 GW and
realization of PLTB 1.1 MW, and solar power potential of
207.08 GW and realization of PLTS 0.090 GWp show in
Fig. 1. While the implementation of RE sources only
reached 2% from geothermal of 1.949 GW, bioenergy of
1858 GW, wind of 147.01 MW, hydro of 5.417 GW, and
solar power of 0.135 GW as shown in Fig. 1 (PPIPE 2018;
RUPTL 2019).
The highest geothermal energy potential is found in
Sumatera Utara at 970 MW and followed by West Java at
790 MW. While Aceh Province is ranked third with
590 MW, East Java of 405 MW, Lampung of 395 MW,
Maluku of 290 MW, West Sumatera of 270 MW, Beng-
kulu and Central Java of 245 MW. Meanwhile, the other
provinces show geothermal energy potential is below
200 MW as shown in Fig. 4a. The total geothermal energy
Fig. 3 Total export and production of natural gas
Investigation of availability, demand, targets, and development of renewable energy in 2017… 487
123
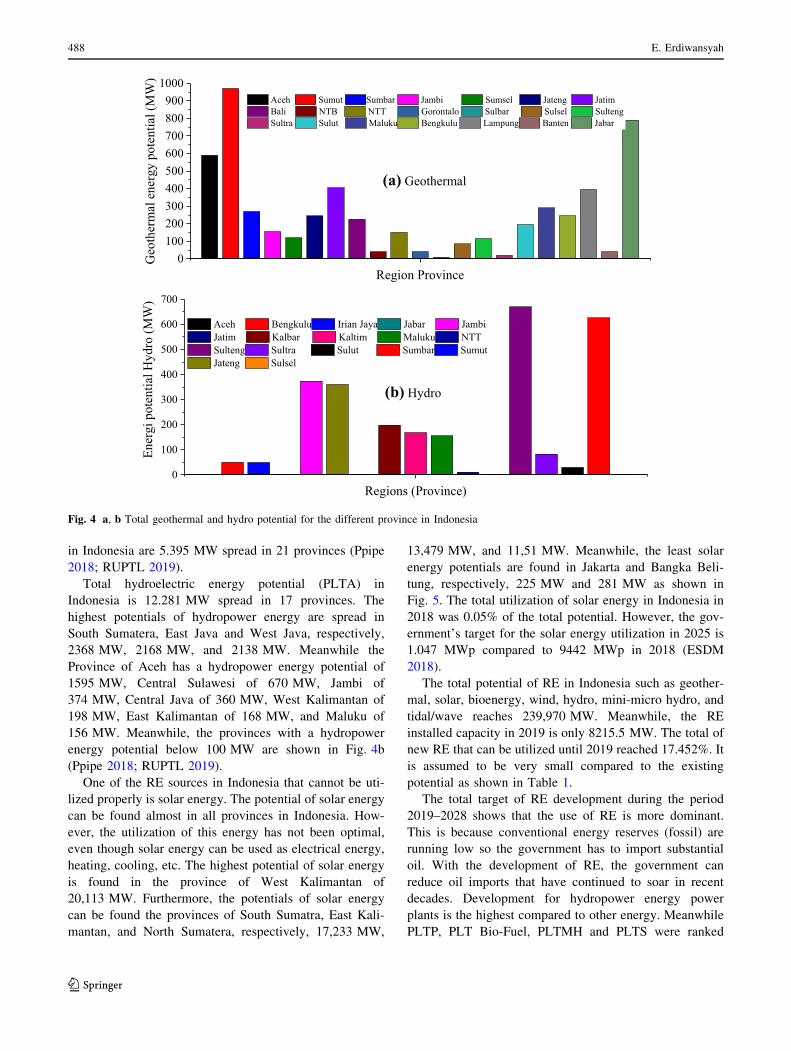
in Indonesia are 5.395 MW spread in 21 provinces (Ppipe
2018; RUPTL 2019).
Total hydroelectric energy potential (PLTA) in
Indonesia is 12.281 MW spread in 17 provinces. The
highest potentials of hydropower energy are spread in
South Sumatera, East Java and West Java, respectively,
2368 MW, 2168 MW, and 2138 MW. Meanwhile the
Province of Aceh has a hydropower energy potential of
1595 MW, Central Sulawesi of 670 MW, Jambi of
374 MW, Central Java of 360 MW, West Kalimantan of
198 MW, East Kalimantan of 168 MW, and Maluku of
156 MW. Meanwhile, the provinces with a hydropower
energy potential below 100 MW are shown in Fig. 4b
(Ppipe 2018; RUPTL 2019).
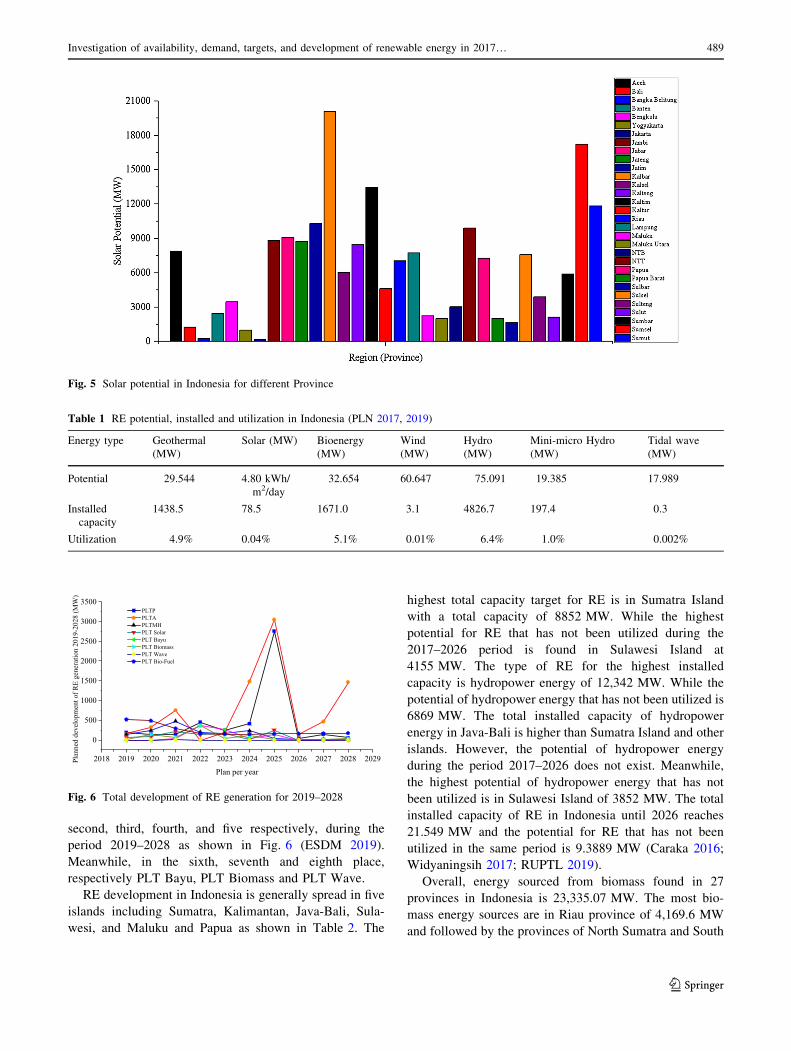
One of the RE sources in Indonesia that cannot be uti-
lized properly is solar energy. The potential of solar energy
can be found almost in all provinces in Indonesia. How-
ever, the utilization of this energy has not been optimal,
even though solar energy can be used as electrical energy,
heating, cooling, etc. The highest potential of solar energy
is found in the province of West Kalimantan of
20,113 MW. Furthermore, the potentials of solar energy
can be found the provinces of South Sumatra, East Kali-
mantan, and North Sumatera, respectively, 17,233 MW,
13,479 MW, and 11,51 MW. Meanwhile, the least solar
energy potentials are found in Jakarta and Bangka Beli-
tung, respectively, 225 MW and 281 MW as shown in
Fig. 5. The total utilization of solar energy in Indonesia in
2018 was 0.05% of the total potential. However, the gov-
ernment’s target for the solar energy utilization in 2025 is
1.047 MWp compared to 9442 MWp in 2018 (ESDM
2018).
The total potential of RE in Indonesia such as geother-
mal, solar, bioenergy, wind, hydro, mini-micro hydro, and
tidal/wave reaches 239,970 MW. Meanwhile, the RE
installed capacity in 2019 is only 8215.5 MW. The total of
new RE that can be utilized until 2019 reached 17.452%. It
is assumed to be very small compared to the existing
potential as shown in Table 1.
The total target of RE development during the period
2019–2028 shows that the use of RE is more dominant.
This is because conventional energy reserves (fossil) are
running low so the government has to import substantial
oil. With the development of RE, the government can
reduce oil imports that have continued to soar in recent
decades. Development for hydropower energy power
plants is the highest compared to other energy. Meanwhile
PLTP, PLT Bio-Fuel, PLTMH and PLTS were ranked
0100200300400500600700800900
1000
(b) Hydro
Geo
ther
mal
ene
rgy
pote
ntia
l (M
W)
Region Province
Aceh Sumut Sumbar Jambi Sumsel Jateng Jatim Bali NTB NTT Gorontalo Sulbar Sulsel Sulteng Sultra Sulut Maluku Bengkulu Lampung Banten Jabar
(a) Geothermal
0
100
200
300
400
500
600
700
Ener
gi p
oten
tial H
ydro
(MW
)
Regions (Province)
Aceh Bengkulu Irian Jaya Jabar Jambi Jatim Kalbar Kaltim Maluku NTT Sulteng Sultra Sulut Sumbar Sumut Jateng Sulsel
Fig. 4 a, b Total geothermal and hydro potential for the different province in Indonesia
488 E. Erdiwansyah
123
second, third, fourth, and five respectively, during the
period 2019–2028 as shown in Fig. 6 (ESDM 2019).
Meanwhile, in the sixth, seventh and eighth place,
respectively PLT Bayu, PLT Biomass and PLT Wave.
RE development in Indonesia is generally spread in five
islands including Sumatra, Kalimantan, Java-Bali, Sula-
wesi, and Maluku and Papua as shown in Table 2. The
highest total capacity target for RE is in Sumatra Island
with a total capacity of 8852 MW. While the highest
potential for RE that has not been utilized during the
2017–2026 period is found in Sulawesi Island at
4155 MW. The type of RE for the highest installed
capacity is hydropower energy of 12,342 MW. While the
potential of hydropower energy that has not been utilized is
6869 MW. The total installed capacity of hydropower
energy in Java-Bali is higher than Sumatra Island and other
islands. However, the potential of hydropower energy
during the period 2017–2026 does not exist. Meanwhile,
the highest potential of hydropower energy that has not
been utilized is in Sulawesi Island of 3852 MW. The total
installed capacity of RE in Indonesia until 2026 reaches
21.549 MW and the potential for RE that has not been
utilized in the same period is 9.3889 MW (Caraka 2016;
Widyaningsih 2017; RUPTL 2019).
Overall, energy sourced from biomass found in 27
provinces in Indonesia is 23,335.07 MW. The most bio-
mass energy sources are in Riau province of 4,169.6 MW
and followed by the provinces of North Sumatra and South
Fig. 5 Solar potential in Indonesia for different Province
Table 1 RE potential, installed and utilization in Indonesia (PLN 2017, 2019)
Energy type Geothermal
(MW)
Solar (MW) Bioenergy
(MW)
Wind
(MW)
Hydro
(MW)
Mini-micro Hydro
(MW)
Tidal wave
(MW)
Potential 29.544 4.80 kWh/
m2/day
32.654 60.647 75.091 19.385 17.989
Installed
capacity
1438.5 78.5 1671.0 3.1 4826.7 197.4 0.3
Utilization 4.9% 0.04% 5.1% 0.01% 6.4% 1.0% 0.002%
2018 2019 2020 2021 2022 2023 2024 2025 2026 2027 2028 2029
0
500
1000
1500
2000
2500
3000
3500
Plan
ned
deve
lopm
ent o
f RE
gene
ratio
n 20
19-2
028
(MW
)
Plan per year
PLTP PLTA PLTMH PLT Solar PLT Bayu PLT Biomass PLT Wave PLT Bio-Fuel
Fig. 6 Total development of RE generation for 2019–2028
Investigation of availability, demand, targets, and development of renewable energy in 2017… 489
123

Sulawesi of 2,796.01 MW and 2,061.04 MW, respectively.
Meanwhile, the smallest biomass energy source is in
Jakarta of 0.5 MW as shown in Fig. 7a. The small potential
of biomass in Jakarta is caused by the area of mapping and
has been met by housing residents. Whereas for forest
areas, it is almost certain that there are no more in Jakarta.
Meanwhile, if compared to the forest area in Riau and
Sumatra Utara provinces, it is far more than Jakarta. Fur-
thermore, the potential source of biogas energy in
Indonesia is also very adequate when used for energy,
especially for electricity generation. The first most poten-
tial sources of biogas energy are in Jakarta, Banten, and
North Sumatera with 126.01 MW, 118.06 MW and
115.05 MW, respectively, as shown in Fig. 7b (Mulyana
2016; Wulandari et al. 2020). The potential for biogas
energy in Indonesia in 2016 reached 2,603 MW. The
potential of biogas is much smaller than the potential of
biomass reaching 30,051 MW. However, it is predicted
that the potential of biogas will continue to increase along
with the increase in other RE sources, mainly from agri-
cultural products. The high biogas in these three provinces
can be due to the high number of the population so that the
potential for biogas produced is more than the other
provinces.
3.2 Target RE
At present, the development of RE refers to Presidential
Regulation No. 5 of 2006 on National Energy Policy. It is
stated that the contribution of RE in the national primary
energy mix in 2025 is 17% with the composition of Biofuel
of 5%, Geothermal of 5%, Biomasses, Nuclear, Water,
Solar, and Wind 5%, and coal liquefied of 2%. For this
reason, the steps to be taken by the Government are to
increase the installed capacity of the Micro Hydro Power
Plant to 2,846 MW in 2025, the installed capacity of
180 MW Biomass in 2020, the installed wind capacity
(PLT Bayu) of 0.97 GW in 2025, solar 0.87 GW in 2024,
and nuclear 4.2 GW in 2024. The total investment absor-
bed by RE development until 2025 is projected at USD
13.197 million.
Utilization of solar energy as electricity generation aims
to increase national energy security, reduce dependence on
the use of fossil fuels, and increase economic investment.
In addition, it can make domestic industries are more
efficient, reduce greenhouse gas emissions, and meet the
government’s target of RE use by 23% by 2025. The
Government of Indonesia has set targets for the use of
installed solar energy in 2025 by 1,008.4 MW (Sugiyono
2016; ESDM 2019). The use of the energy mix in 2025 is
targeted by the government for coal of 54.6%, natural gas/
LNG of 22%, RE of 23% and fossil energy of 0.4%. The
target for energy use in 2025 is adjusted to governmentTable
2R
Eca
pac
ity
and
po
ten
tial
inIn
do
nes
ia2
01
7–
20
26
Reg
ion
sS
um
ater
aK
alim
anta
nJa
wa-
Bal
iS
ula
wes
iM
alu
ku
&P
apu
aIn
do
nes
iato
tal
Gen
erat
or
RE
Cap
acit
y(M
W)
Po
ten
tial
Cap
acit
y(M
W)
Po
ten
tial
Cap
acit
y(M
W)
Po
ten
tial
Cap
acit
y(M
W)
Po
ten
tial
Cap
acit
y(M
W)
Po
ten
tial
Cap
acit
y(M
W)
Po
ten
tial
PL
TP
3.3
05
N/A
N/A
N/A
2.5
10
N/A
40
0N
/A7
5N
/A6
.29
0N
/A
PL
TA
4.2
84
1.1
93
1.0
56
1.8
04
4.5
62
N/A
2.3
23
3.8
52
11
82
01
2.3
42
6.8
69
PL
TM
H9
38
75
21
0N
/A4
37
N/A
22
1N
/A4
3N
/A1
.69
47
52
PL
Tso
lar
55
9N
/A1
2N
/A2
00
52
38
N/A
65
73
15
PL
Tb
ayu
N/A
20
01
50
N/A
25
08
23
17
05
N/A
N/A
57
01
.02
8
PL
Tb
iom
ass
27
41
35
41
30
20
6N
/A2
11
05
5N
/A5
97
17
5
PL
Tw
ave
N/A
N/A
N/A
N/A
N/A
N/A
N/A
25
0N
/AN
/AN
/A2
50
PL
Tb
io-f
uel
41
1N
/A8
30
N/A
43
9N
/A4
.42
3N
/A4
69
N/A
6.5
72
N/A
To
tal
8.8
51
2.3
39
1.2
57
1.8
46
7.9
65
1.0
23
3.1
86
4.1
55
29
02
62
1.5
49
9.3
89
490 E. Erdiwansyah
123

policies in utilizing RE and gas, so that dependence on
fossil energy can be reduced. The development of RE can
be increased until 2028 by seeking to be able to increase
the capacity of PV roofs of 3.200 MW for 1.6 million
customers. Electricity energy production in 2028 is tar-
geted at 500.691 GWh, mostly produced from coal energy
of 272,354 GWh, gas of 110.150 GWh, hydro of
54.736 GWh, Geothermal of 48,217 GWh, RE and fossil
energy of 13,205 GWh and 2,019 GWh, respectively, as
shown in Fig.8a. Based on the composition of electricity
production by type of fuel, the government’s target to
reduce the use of fossil fuels and reduce imports can be
achieved. However, to achieve this target, a strong gov-
ernment policy and adequate resources are needed.
Meanwhile, Fig. 8b shows the composition of the energy
mix for electricity generation. Based on the composition of
the power plant using the energy mix, the government’s
target to reduce greenhouse gas emissions in 2028 can be
achieved. Therefore, air pollution caused by industrial fuels
and vehicles can be realized. The composition of produc-
tion and generation with a mixture of energy during the
period 2019–2028 is shown in Fig. 8a, b. To be able to
support this energy production target, sufficient fuel is
needed with adequate availability. If the availability of this
fuel is lacking, it is highly unlikely that targets for energy
production and emission reductions can be achieved.
The government’s RE targets in 2025 and 2050 are 23%
and 31%, respectively, as shown in Fig. 9a, b. It can be
seen that the RE target becomes greater than the other
energy mix. Meanwhile, the petroleum energy mix will
decrease to 20% by 2050. The increasing population has
driven the increasing demand for energy, especially for
transportation and electricity. Meanwhile, fossil energy
production (non-renewable) will continue to decline,
forcing the government to import petroleum to meet
domestic needs. To overcome fossil fuels that continue to
experience depletion, the government has made several
policies to support the use of RE nationally. The govern-
ment’s target is to meet national energy by building several
electricity generators such as geothermal energy, solar
energy, and bioenergy, hydropower, and wind power.
Besides, the government made policy on the use of biofuels
(B20), namely mixing diesel engine fuel with palm oil to
Fig. 7 a, bTotal potential RE of biomass and biogas for different province (Mulyana 2016)
Investigation of availability, demand, targets, and development of renewable energy in 2017… 491
123

reduce the use of fossil energy (Sugiyono 2016; PPIPE
2018 Nugroho 2019).
3.3 Energy demand
National energy demand in 2050 is targeted at 548.8
MTOE (5.0%) sourced from the energy mix (EM),
2019 2020 2021 2022 2023 2024 2025 2026 2027 20280
50
100
150
200
250
300
(b)
The
com
posi
tion
of e
lect
ricity
prod
uctio
n (G
Wh)
Composition of fuel use per years
Hydro Geothermal Other RE Gas BBM Coal Impor
(a)
2019 2020 2021 2022 2023 2024 2025 2026 2027 20280
10
20
30
40
50
60
70
80
The
com
posi
tion
of th
e m
ixen
ergy
pow
er p
lant
(%)
Composition of the mix energy power plant/years
Hydro Geothermal Other RE Gas BBM Coal Impor
Fig. 8 a Composition of production and b composition of mix energy
Fig. 9 a, b Total target RE for years 2013–2050
492 E. Erdiwansyah
123
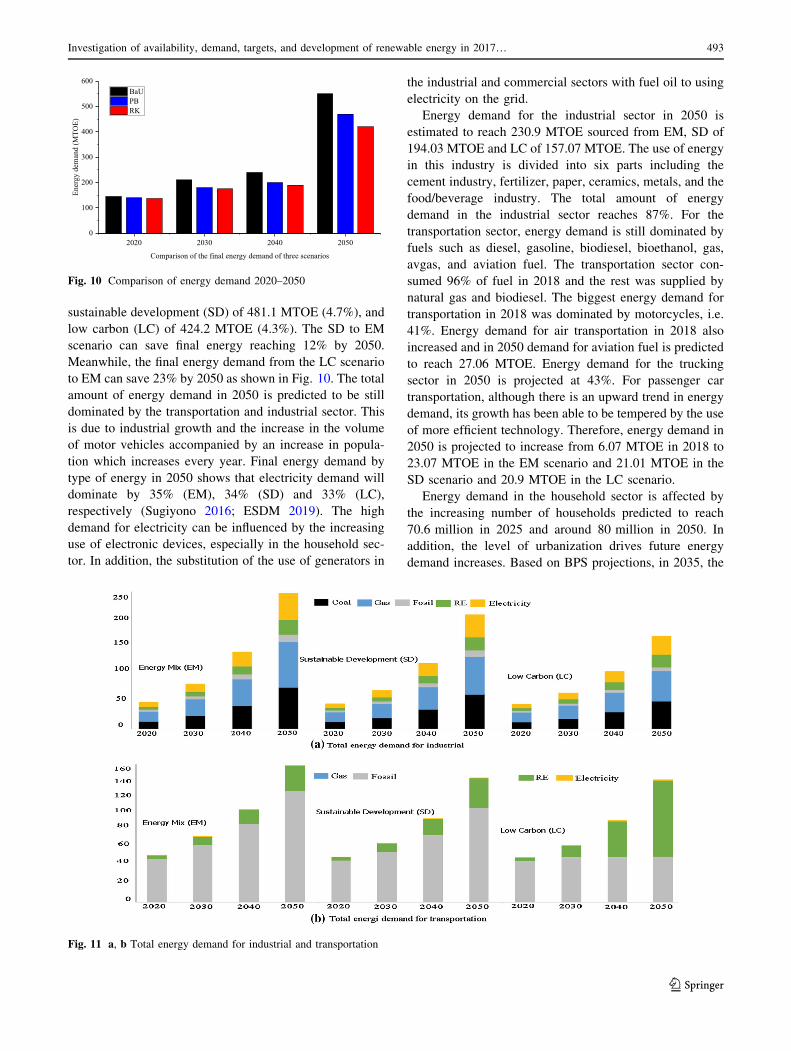
sustainable development (SD) of 481.1 MTOE (4.7%), and
low carbon (LC) of 424.2 MTOE (4.3%). The SD to EM
scenario can save final energy reaching 12% by 2050.
Meanwhile, the final energy demand from the LC scenario
to EM can save 23% by 2050 as shown in Fig. 10. The total
amount of energy demand in 2050 is predicted to be still
dominated by the transportation and industrial sector. This
is due to industrial growth and the increase in the volume
of motor vehicles accompanied by an increase in popula-
tion which increases every year. Final energy demand by
type of energy in 2050 shows that electricity demand will
dominate by 35% (EM), 34% (SD) and 33% (LC),
respectively (Sugiyono 2016; ESDM 2019). The high
demand for electricity can be influenced by the increasing
use of electronic devices, especially in the household sec-
tor. In addition, the substitution of the use of generators in
the industrial and commercial sectors with fuel oil to using
electricity on the grid.
Energy demand for the industrial sector in 2050 is
estimated to reach 230.9 MTOE sourced from EM, SD of
194.03 MTOE and LC of 157.07 MTOE. The use of energy
in this industry is divided into six parts including the
cement industry, fertilizer, paper, ceramics, metals, and the
food/beverage industry. The total amount of energy
demand in the industrial sector reaches 87%. For the
transportation sector, energy demand is still dominated by
fuels such as diesel, gasoline, biodiesel, bioethanol, gas,
avgas, and aviation fuel. The transportation sector con-
sumed 96% of fuel in 2018 and the rest was supplied by
natural gas and biodiesel. The biggest energy demand for
transportation in 2018 was dominated by motorcycles, i.e.
41%. Energy demand for air transportation in 2018 also
increased and in 2050 demand for aviation fuel is predicted
to reach 27.06 MTOE. Energy demand for the trucking
sector in 2050 is projected at 43%. For passenger car
transportation, although there is an upward trend in energy
demand, its growth has been able to be tempered by the use
of more efficient technology. Therefore, energy demand in
2050 is projected to increase from 6.07 MTOE in 2018 to
23.07 MTOE in the EM scenario and 21.01 MTOE in the
SD scenario and 20.9 MTOE in the LC scenario.
Energy demand in the household sector is affected by
the increasing number of households predicted to reach
70.6 million in 2025 and around 80 million in 2050. In
addition, the level of urbanization drives future energy
demand increases. Based on BPS projections, in 2035, the
2020 2030 2040 20500
100
200
300
400
500
600En
ergy
dem
and
(MTO
E)
Comparison of the final energy demand of three scenarios
BaU PB RK
Fig. 10 Comparison of energy demand 2020–2050
Fig. 11 a, b Total energy demand for industrial and transportation
Investigation of availability, demand, targets, and development of renewable energy in 2017… 493
123
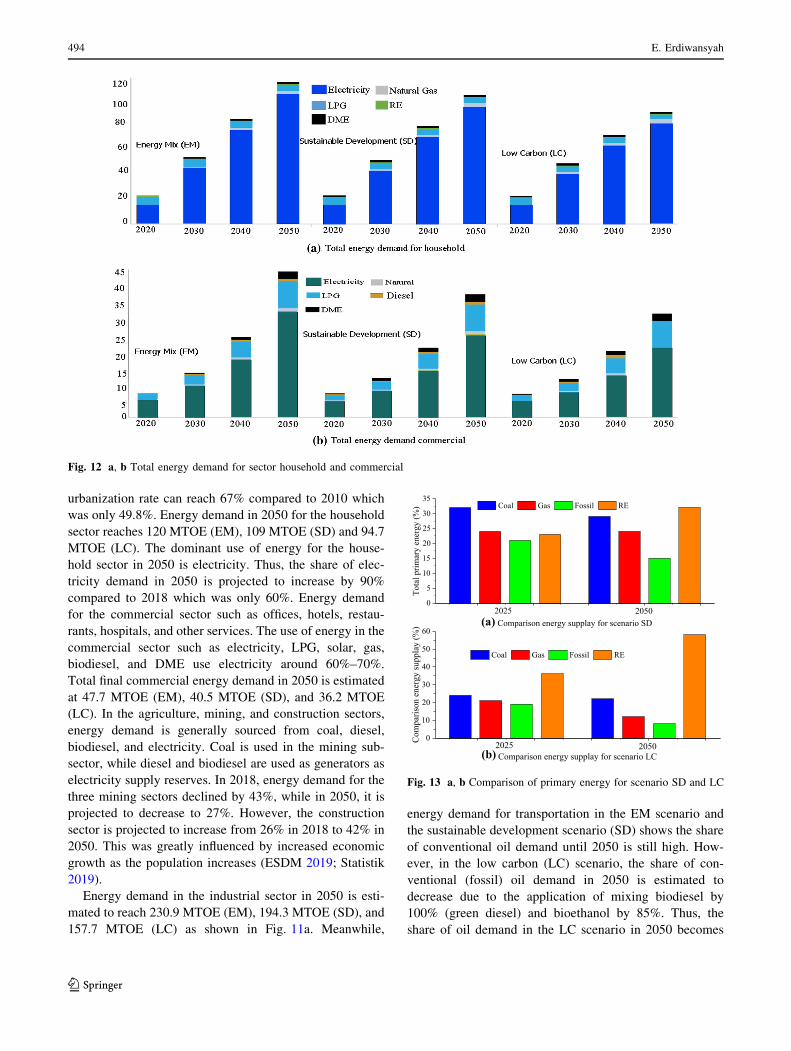
urbanization rate can reach 67% compared to 2010 which
was only 49.8%. Energy demand in 2050 for the household
sector reaches 120 MTOE (EM), 109 MTOE (SD) and 94.7
MTOE (LC). The dominant use of energy for the house-
hold sector in 2050 is electricity. Thus, the share of elec-
tricity demand in 2050 is projected to increase by 90%
compared to 2018 which was only 60%. Energy demand
for the commercial sector such as offices, hotels, restau-
rants, hospitals, and other services. The use of energy in the
commercial sector such as electricity, LPG, solar, gas,
biodiesel, and DME use electricity around 60%–70%.
Total final commercial energy demand in 2050 is estimated
at 47.7 MTOE (EM), 40.5 MTOE (SD), and 36.2 MTOE
(LC). In the agriculture, mining, and construction sectors,
energy demand is generally sourced from coal, diesel,
biodiesel, and electricity. Coal is used in the mining sub-
sector, while diesel and biodiesel are used as generators as
electricity supply reserves. In 2018, energy demand for the
three mining sectors declined by 43%, while in 2050, it is
projected to decrease to 27%. However, the construction
sector is projected to increase from 26% in 2018 to 42% in
2050. This was greatly influenced by increased economic
growth as the population increases (ESDM 2019; Statistik
2019).
Energy demand in the industrial sector in 2050 is esti-
mated to reach 230.9 MTOE (EM), 194.3 MTOE (SD), and
157.7 MTOE (LC) as shown in Fig. 11a. Meanwhile,
energy demand for transportation in the EM scenario and
the sustainable development scenario (SD) shows the share
of conventional oil demand until 2050 is still high. How-
ever, in the low carbon (LC) scenario, the share of con-
ventional (fossil) oil demand in 2050 is estimated to
decrease due to the application of mixing biodiesel by
100% (green diesel) and bioethanol by 85%. Thus, the
share of oil demand in the LC scenario in 2050 becomes
Fig. 12 a, b Total energy demand for sector household and commercial
0
10
20
30
40
50
60
20502025Com
paris
on e
nerg
y su
ppla
y (%
)
Comparison energy supplay for scenario LC
Coal Gas Fossil RE
0
5
10
15
20
25
30
35
(b)
2050
Tota
l prim
ary
ener
gy (%
)
Comparison energy supplay for scenario SD
Coal Gas Fossil RE
2025(a)
Fig. 13 a, b Comparison of primary energy for scenario SD and LC
494 E. Erdiwansyah
123

37% and the RE demand share increases to 62% as shown
in Fig. 11b. Energy demand for the household sector in
2050 is estimated to reach 323.7 MTOE sourced from 120
MTOE (EM), 109 MTOE (SD), and 94.7 MTOE (LC). The
share of electricity demand is estimated to increase from
60% in 2018 to 90% in 2050. The increasing electricity
demand is driven by the increasing use of electronic
equipment such as air conditioners, refrigerators, water
pumping machines, and induction electric stoves. Mean-
while, the demand for LPG in the EM, SD, and LC sce-
narios in 2050 reached 4.8 MTOE, 4.3 MTOE and 3.4
MTOE as shown in Fig. 12a. In the commercial sector such
as offices, hotels, restaurants, hospitals and other services,
the demand for energy is dominated by electricity, LPG,
diesel, gas, biodiesel, and DME, reaching 60%–70%.
Electricity consumption is used for air conditioning (AC),
water pumping machines, and lighting (lamps). Total final
energy demand for the commercial sector in 2050 is esti-
mated to reach 124.4 MTOE sourced from 47.7 MTOE
(EM), 40.5 MTOE (SD), and 36.2 MTOE (LC) as shown in
Fig. 12b.
3.4 Energy supply
In 2050, the primary energy supply is targeted to reach 943
MTOE compared to 2025 at 314 MTOE. The supply of
primary energy for power plants is included in the
modelling based on the assumption of generating capacity
according to the electricity supply business plan (ESBP)
which generates the primary energy requirements for each
power plant (RUEN 2017; Widyaningsih 2017; ESDM
2019; Mahidin et al. 2020). In this case, 298 MTOE (32%)
is sourced from coal energy. It is expected that the use of
coal can increase added value to the process of coal gasi-
fication and coal liquefaction. Energy demand sourced
from gas pipelines, LNG, and LPG in 2050 is predicted to
be 222 MTOE (24%) of the total primary energy supply.
Meanwhile, the supply of RE is around 29% (275 MTOE)
in 2050. The increase in the supply of RE is influenced by
the optimization for the utilization of solar cell energy,
geothermal energy, biomass, and water that is intended for
electricity generation and fuel subsidies in the transporta-
tion sector. In the SD scenario, the primary energy supply
is smaller than the energy mix (EM) scenario of 828
MTOE in 2050. However, in the SD scenario, the RE
energy is greater than the EM scenario, which is 23% in
2025 and 32% in 2050. This figure is following the targets
listed in the KEN and RUEN. In the special LC scenario,
RE increases significantly by 58% in 2050 compared to
2025 by 36%. The comparison of the primary energy mix
with SD and LC 2025–2050 scenarios is shown in Fig.13a,
b.
Table 3 Assumptions and RE scenarios
Assumption Energy mix (EM) Sustainable development (SD) Low carbon (LC)
Economic growth 5.6% (2045)
Population growth 0.7% (2045)
Biodiesel target 20% (2025) 30% (2025) 30% (2025)
30% (2050) 30% (2050) 100% (2050)
Bioethanol target 5% (2025) 20% (2025) 20% (2025)
50% (2050) 85% (2050)
Jargas growth 4.7 SR (2025) 1 juta SR/years [ 1 juta SR/years
LPG substitution with electric
induction cooker
0.5% (2025) 1% (2025) 2% (2025)
2% (2050) 5% (2050)
LPG substitution with DME 20% (2025) 20% (2025) 20% (2025)
Electric car target (% of total
population) vehicle)
0.01% (2025) 0.01% (2025) 0.5% (2025)
0.07% (2050) 0.24% (2050) 1.18% (2050)
Electric motor target (% of total
population) vehicle)
1.38% (2025) 1.44% (2025) 1.18% (2025)
Power plants 1.5% (2050) 1.7% (2050) 3% (2050)
Electricity supply business
plan (ESBP)
RUEN Emission reduction[RUEN
10% switching capacity PLTU to
PLT biomass
30% switching capacity PLTU to
PLT biomass
25% of luxury homes use solar
rooftop
30% of luxury homes use solar
rooftop
Investigation of availability, demand, targets, and development of renewable energy in 2017… 495
123
3.5 Economic growth
Indonesia’s economic growth in 2017 and 2018 were
5.07% and 5.17%, respectively, as reported in the data
from the Central Statistics Agency (CSA) (BPS 2019b). In
2019, it increased to 5.3% and in 2045 it is targeted at
5.6%. ESBP stated that Indonesia’s economic growth uses
BAPPENAS scenario in 2028 of 6.45% (RUPTL 2019).
This is one of the factors to consider in making scenarios of
long-term domestic energy demand. Economic growth
statistics are accompanied by energy demand in general.
Energy demand is closely related to economic activity,
so the assumption of economic growth will be very sen-
sitive to energy demand from the three scenarios developed
as shown in Table 3. Indonesia’s economic growth during
the 2013–2018 period tended to decrease from 5.6%–
5.17% as a result of the global economic downturn due to
financial market uncertainty and declining trade volume at
the world level. The assumption of economic growth is
adjusted to the ‘‘Vision of Indonesia 2045’’ published by
BAPPENAS (Nasional and Nasional 2017; Garuda 2018).
The Indonesia’s economic growth in the next few years is
supported by rising domestic needs, including consumption
and investment, as well as better export growth including
in the manufacturing sector which is a major energy con-
sumer in the industrial sector.
Table 4 Risks and challenges in RE projects
Type RE Risk issues Risk management consideration
Biomass Availability/variability of fuel supply
Variability in resource prices
Environmental obligations are related to fuel handling and
storage
Long-term contracts can solve resource problems.
Fuel handling costs
Emission control
Biogas Resource risks (e.g. reduction in quantity and quality of gas due
to changes in organic raw materials)
Opposition planning is related to the smell problem
Strict safety procedures are needed such as loss control such as
firefighting equipment and services
High level of wear
Wind Long waiting times and upfront costs (e.g. permit planning and
construction costs)
Failure of important components (e.g. gear train/box, bearings,
blades etc.)
Variability of wind resources
Offshore cabling
Turbine makes and models
Manufacturing guarantees from component suppliers
Good wind source data
Loss control e.g. Firefighting can be difficult if the location is
off the coast or altitude
Development of procedures that are generally used
Tidal/wave Survival in a harsh marine environment
Various designs and concepts but without a clear winner
Prototype/technology risk
Small scale and long waiting time
Most of the prototypes and technology demonstration projects
Good resource measurement data
Geothermal Drilling costs and risks that arise (blow out)
Exploration risk (unexpected temperature)
Important components that are damaged, such as pumps
Long waiting time (permission)
Limited operator experience and different aspects of
technology at different locations
Limited sources of measurement data
Agreement on planning can be difficult
’Technology stimulation’ is still unproven but can reduce the
risk of exploration
Solar
thermal
Prototype/technology risks as project size increases and is
combined with others.
RETs, for example, solar towers
Good operating history (already since 1984)
Maintenance can be neglected (especially in developing
countries)
Small
hydro
Flood
Seasonal/annual source variability
Prolonged damage due to off-site monitoring (long response
time) and lack of spare parts
PV Component damage (e.g. short-circuit current)
Weather damage
Theft/vandalism
Performance guarantees are available (for example up to
25 years)
Standard components, with easy substitution
Maintenance can be neglected (especially in developing
countries)
496 E. Erdiwansyah
123

3.6 RE policy
To accelerate the development of RE, the Government of
Indonesia has established several regulations or policies
which are considered to be very supportive:
(1) The Government of Indonesian issued two policies
in 2014 and 2017 concerning national energy and
national energy general plans through Presidential
Regulation numbers 79/2014 and 22/2017, respec-
tively (Widyaningsih 2017).
(2) Presidential Regulation No. 4 of 2016 (Article 14) on
the Acceleration of Electricity Infrastructure. The
government mandates to be able to implement and
accelerate the development of electricity infrastruc-
ture by prioritizing the use of RE (Ublik 2016).
(3) Central and Local Governments can provide support
in the form of fiscal incentives, licensing, and non-
licensing facilities. Besides determining the purchase
price of electricity from each type of RE source, the
establishment of a separate business entity in the
context of supplying electricity to be sold to PT.
PLN (Persero), and/or providing subsidies.
(4) Presidential Regulation No. 66 of 2018 on the
Second Amendment to Presidential Regulation No.
61 of 2015 on Collecting and Using Palm Oil
Plantation Funds, which require the use of biodiesel
for PSO and non-PSO following article 18 paragraph
(1b) (Setmilpres 2018).
(5) Minister of Finance Regulation No. 177/PMK.011/
2007 on Exemption of Import Duties on Imported
Goods for Upstream Oil and Gas and Geothermal
Business Activities (Khadijah 2018).
(6) Minister of Finance Regulation No. 03/PMK.011/
2012 on Procedures for Management and Account-
ability of Geothermal Fund Facilities (Khadijah
2018).
(7) Minister of Energy and Mineral Resources Regula-
tion No. 49 of 2017 is an improvement to the
Minister of Energy and Mineral Resources Regula-
tion No. 10 of 2017 on Principles of Electricity Sales
and Purchase Agreement (ESDM 2017).
(8) Minister of Energy and Mineral Resources Regula-
tion No. 50 of 2017 is a revision of the Minister of
Energy and Mineral Resources Regulation No. 12 of
2017 on Utilization of RE Sources for Electricity
Supply, which is issued to create a better business
climate while still encouraging efficiency practices
and realizing reasonable and affordable electricity
prices.
(9) Minister of Energy and Mineral Resources Regula-
tion No. 49 of 2018 on the Use of Roof Solar Power
Generation Systems by Consumers of PT. Perusa-
haan Listrik Negara (PLN).
KEN mandates for RE mix target in the primary energy
mix of at least 23% by 2025 and minimizes the use of
petroleum less than 25% by 2025. In addition, energy
efficiency is also targeted to decrease by 1% per year to
encourage savings in energy use in all sector. Some targets
in the KEN which are also considered in the projected
energy demand include optimization of the use of natural
gas for domestic use and priority use of fossil energy for
national industrial raw materials. This policy is imple-
mented to maximize the use of RE, minimize the use of
petroleum, optimize the use of natural gas and RE, use coal
as a mainstay of national energy supply, and use nuclear as
a last resort. With the regulations set by the government, it
is expected that the developers (investors) can work better
and the targets set can be achieved.
3.7 Risks and challenges RE
In the construction of RE project, investors sometimes need
to evaluate the risks that may arise when construction or
operations begin. Each RE project has different types of
risks and obstacles (Goh et al. 2014). A study conducted by
the United Nations Environment Program (UNEP) elabo-
rates some of the risks that are generally inherent in the
development of RE projects as shown in Table 4 (Gray
1990; Holdren et al. 2000).
3.8 The electricity selling price
The price of electricity sales to customers from RE is
cheaper compared to conventional energy as shown in
Table 5. Meanwhile, the cost of conventional energy
Table 5 Comparison of selling prices of RE and conventional energy
(Lauranti and Djamhari 2017; Mahidin et al. 2020)
Type of fuels Production price
(USD/MW)
Selling price
(USD/kWh)
Solar power generation 1.9 million 0.081–0.06
Mini-hydro/micro-hydro
power plant
2 million 0.044–0.04
Wind power plant 638 thousand 0.06
Biomass power plant 0.07
Biomass palm oil 1 million 0.053
Biogas power plant 2.1 million 0.086–0.05
Coal-fired power plant 1.5 million 0.045
Energy conventional (diesel) 750 thousand 0.13
Investigation of availability, demand, targets, and development of renewable energy in 2017… 497
123

production is cheaper than RE, except for the production of
wind power plants. However, RE has more advantages than
conventional energy. The benefits of include environment
friendly, more lace emission, reusable, sustainable, and
lower operational costs. Meanwhile, conventional energy
has higher operational costs compared to RE despite lower
production costs. In addition, conventional energy pro-
duces higher emissions than RE.
4 Conclusions
Investigation of the potential for RE regarding the amount
of utilization, energy demand, and the target of power plant
construction during the period of 2017–2050 has been
completed. Various findings have been presented and dis-
cussed earlier so that conclusions can be drawn as follows:
(1) The target of electric energy production in 2028 is
500,691 GWh sourced from 272,354 GWh, gas of
110,150 GWh, hydro of 54,736 GWh, geothermal of
48,217 GWh, RE and fuel energy of 13,205 GWh
and 2019 GWh, respectively. The government of
Indonesia is targeting the use of RE by 23% in 2025
to 31% in 2050.
(2) Demand of national energy in 2050 is estimated at
1545.1 MTOE sourced from EM of 548.8 MTOE
(5.0%), SD of 481.1 MTOE (4.7%), and LC of 424.2
MTOE (4.3%).
(3) By using RE, economic growth is targeted to
increase to 5.6% in 2045 compared to 2019 of 5.3%.
(4) The policy set by the government in supporting the
development of RE to achieve the target of energy
use by 23% in 2025 and to reduce the use of
petroleum by 25% in 2050.
(5) Time of permit issuance, construction price, resource
price, intimidation, etc. is a risk commonly faced by
investors in the development of RE.
Open Access This article is licensed under a Creative Commons
Attribution 4.0 International License, which permits use, sharing,
adaptation, distribution and reproduction in any medium or format, as
long as you give appropriate credit to the original author(s) and the
source, provide a link to the Creative Commons licence, and indicate
if changes were made. The images or other third party material in this
article are included in the article’s Creative Commons licence, unless
indicated otherwise in a credit line to the material. If material is not
included in the article’s Creative Commons licence and your intended
use is not permitted by statutory regulation or exceeds the permitted
use, you will need to obtain permission directly from the copyright
holder. To view a copy of this licence, visit http://creativecommons.
org/licenses/by/4.0/.
References
Alam MM, Murad MW (2020) The impacts of economic growth,
trade openness and technological progress on renewable energy
use in organization for economic co-operation and development
countries. Renew Energy 145:382–390. https://doi.org/10.1016/j.
renene.2019.06.054
Alhamri RZ, Suryani E (2016) Kajian Potensi Energi Panas Bumi
sebagai Alternatif Pembangkit Energi Listrik Terbarukan:
Sebuah Framework Sistem Dinamik. SISFO 5(5):5
Alola AA, Bekun FV, Sarkodie SA (2019) Dynamic impact of trade
policy, economic growth, fertility rate, renewable and non-
renewable energy consumption on ecological footprint in
Europe. Sci Total Environ 685:702–709. https://doi.org/10.
1016/j.scitotenv.2019.05.139
Ben Jebli M, Farhani S, Guesmi K (2020) Renewable energy, CO2
emissions and value added: empirical evidence from countries
with different income levels. Struct Chang Econ Dyn. https://doi.
org/10.1016/j.strueco.2019.12.009
BPS (2019a) Volume Impor Minyak dan Gas Indonesia (1996–2018).
https://databoks.katadata.co.id/datapublish/2019/05/24/berapa-
volume-impor-minyak-indonesia
BPS (2019b) STATISTIK Pertumbuhan Ekonomi Ber Resmi Stat No.
15/02/:1–12
Caraka RE (2016) Simulasi Kalkulator Energi Baru Terbarukan
(EBT) Guna Memenuhi Ketahanan Energi di Indonesia. Stat J
Theor Stat Its Appl 16:77–88
Charfeddine L, Kahia M (2019) Impact of renewable energy
consumption and financial development on CO2 emissions and
economic growth in the MENA region: a panel vector autore-
gressive (PVAR) analysis. Renew Energy 139:198–213. https://
doi.org/10.1016/j.renene.2019.01.010
CNBC. Negara Importir Minyak Terbesar di Asia Tenggara (News
2017) https://www.cnbcindonesia.com/news/20180710101844-
4-22763/wah-ri-ternyata-importir-minyak-terbesar-ketiga-di-
asean
Deendarlianto WA, Widodo T, Handika I, Chandra Setiawan I,
Lindasista A (2020) Modelling of Indonesian road transport
energy seetsctor in order to fulfill the national energy and oil
reduction targ. Renew Energy 146:504–518. https://doi.org/10.
1016/j.renene.2019.06.169
Erdiwansyah M, Mamat R, Sani MSM, Khoerunnisa F, Kadarohman
A (2019a) Target and demand for renewable energy across 10
ASEAN countries by 2040. Electr J 32:106670. https://doi.org/
10.1016/J.TEJ.2019.106670
Erdiwansyah, Mamat R, Sani MSM, Sudhakar K (2019b) Renewable
energy in Southeast Asia: policies and recommendations. Sci
Total Environ. https://doi.org/10.1016/j.scitotenv.2019.03.273
Erdiwansyah, Mamat R, Sani MSM, Sudhakar K, Kadarohman A,
Sardjono RE (2019c) An overview of Higher alcohol and
biodiesel as alternative fuels in engines. Energy Rep 5:467–479.
https://doi.org/10.1016/j.egyr.2019.04.009
Eren BM, Taspinar N, Gokmenoglu KK (2019) The impact of
financial development and economic growth on renewable
energy consumption: empirical analysis of India. Sci Total
Environ 663:189–197. https://doi.org/10.1016/j.scitotenv.2019.
01.323
ESDM (2017) Peraturan Menteri Energi dan Sumber Daya Mineral
Nomor 49 Tahun 2017
ESDM (Utilization of Solar Energy Sources in Indonesia is Still Very
Small. Statement 2018) https://ekonomi.kompas.com/read/2018/
07/16/164127926/esdm-pemanfaatan-sumber-energi-surya-di-
indonesia-masih-sangat-kecil
ESDM. Indonesia Energy Out Look (2019) J Chem Inf Model
53:1689–1699. https://doi.org/10.1017/CBO9781107415324.004
498 E. Erdiwansyah
123

Garuda M (2018) Indonesia 2045 Bentang Pustaka
Goh HH, Lee SW, Chua QS, Goh KC, Kok BC, Teo KTK (2014)
Renewable energy project: project management, challenges and
risk. Renew Sustain Energy Rev 38:917–932
Gozgor G, Mahalik MK, Demir E, Padhan H (2020) The impact of
economic globalization on renewable energy in the OECD
countries. Energy Policy 139:111365. https://doi.org/10.1016/j.
enpol.2020.111365
Gray MA (1990) The United Nations Environment Programme: an
assessment. Envtl L 20:291
Holdren JP, Smith KR, Kjellstrom T, Streets D, Wang X, Fischer S
(2000) Energy, the environment and health. New York United
Nations Dev Program
Indra Al Irsyad M, Halog A, Nepal R, Koesrindartoto DP (2020)
Economical and environmental impacts of decarbonisation of
Indonesian power sector. J Environ Manage 259:109669. https://
doi.org/10.1016/j.jenvman.2019.109669
Jenniches S (2018) Assessing the regional economic impacts of
renewable energy sources—a literature review. Renew Sustain
Energy Rev 93:35–51
Kennedy SF (2018) Indonesia’s energy transition and its contradic-
tions: emerging geographies of energy and finance. Energy Res
Soc Sci 41:230–237. https://doi.org/10.1016/j.erss.2018.04.023
Khadijah NS (2018) Analisis Pembangunan Pembangkit Listrik
Tenaga Panas Bumi (PLTP) Melalui Insentif Fiskal dalam
Mendukung Ketahanan Energi Indonesia. Ketahanan Energi
2018:3
Khanna N, Fridley D, Zhou N, Karali N, Zhang J, Feng W (2019)
Energy and CO2 implications of decarbonization strategies for
China beyond efficiency: modeling 2050 maximum renewable
resources and accelerated electrification impacts. Appl Energy
242:12–26. https://doi.org/10.1016/j.apenergy.2019.03.116
Kusumadewi TV, Limmeechokchai B (2017) CO2 Mitigation in
residential sector in Indonesia and Thailand: potential of
renewable energy and energy efficiency. Energy Proc
138:955–960. https://doi.org/10.1016/j.egypro.2017.10.086
Lauranti M, Djamhari EA (2017) Transisi Energi yang Setara di
Indonesia: Tantangan dan Peluang
Liu R, He L, Liang X, Yang X, Xia Y (2020) Is there any difference
in the impact of economic policy uncertainty on the investment
of traditional and renewable energy enterprises? A comparative
study based on regulatory effects. J Clean Prod 255:120102.
https://doi.org/10.1016/j.jclepro.2020.120102
Maulidia M, Dargusch P, Ashworth P, Ardiansyah F (2019)
Rethinking renewable energy targets and electricity sector
reform in Indonesia: a private sector perspective. Renew Sustain
Energy Rev 101:231–247. https://doi.org/10.1016/j.rser.2018.11.
005
Mulyana R (2016) Pedoman Investasi Bioenergi di Indonesia
Mahidin S, Erdiwansyah H, Hayati H AP, et al (2020) Analysis of
power from palm oil solid waste for biomass power plants: a
case study in Aceh Province. Chemosphere 2020:126714. https://
doi.org/10.1016/j.chemosphere.2020.126714
Nasional MPP, Nasional KBPP (2017) Visi Indonesia 2045 Disam-
paikan Di Jakarta Pada Orasi Ilm Fak Ekon Dan Bisnis Univ
Indones 2017
Nugroho H (2019) Indonesia’s energy development: evaluation of the
2015–2019 medium term development plan and outlook for that
of 2020–2024. Indones J Dev Plan 3:266–272
O’Ryan R, Nasirov S, Alvarez-Espinosa A (2020) Renewable energy
expansion in the Chilean power market: a dynamic general
equilibrium modeling approach to determine CO2 emission
baselines. J Clean Prod 247:119645. https://doi.org/10.1016/j.
jclepro.2019.119645
PLN PT (2017) Rencana Usaha Penyediaan Tenaga Listrik (RUPTL)
PLN 2017
PLN PT (2019) RUPTL: Rencana Usaha Penyediaan Tenaga Listrik
2019–2028. Indones PT PLN Persero 2019
PPIPE B (2018) Outlook Energi Indonesia 2018: Energi Berkelan-
jutan untuk Transportasi Darat. Development 2018:134
Purwanto WW, Muharam Y, Pratama YW, Hartono D, Soedirman H,
Anindhito R (2016) Status and outlook of natural gas industry
development in Indonesia. J Nat Gas Sci Eng 29:55–65
Rahardjo I, Fitriana I (2005) Analisis Potensi Pembangkit Listrik
Tenaga Surya di Indonesia. Strateg Penyediaan List Nas Dalam
Rangka Mengantisipasi Pemanfaat PLTU Batubara Skala Kecil,
PLTN, Dan Energi Terbarukan, P3TKKE, BPPT
RUEN (2017) Target RUEN Dan Kebutuhan Investasi Sub Sektor
Energy Fosil 2017:6
RUPTL (2019) Electricity supply business plan. Rencana Usaha
Penyediaan Tenaga List 2019:2019–2028
Santika WG, Anisuzzaman M, Simsek Y, Bahri PA, Shafiullah GM,
Urmee T (2020) implications of the sustainable development
goals on national energy demand: the case of Indonesia. Energy
196:117100. https://doi.org/10.1016/j.energy.2020.117100
Setmilpres (2018) Salinan Peraturan Presiden Republik Inoonesia No
66/2018 2018:1–9
Statistik BP (2019) Ekonomi Indonesia 2018 Tumbuh 5, 17%.
Diperoleh Pada 2019:1
Sugiyono A (2016) Outlook Energi Indonesia 2015–2035: Prospek
Energi Baru Terbarukan. J Energi Dan Lingkung 12:87–96
Ublik EP (2016) Peraturan Presiden tentang Percepatan Pembangunan
Infrastruktur
Widyaningsih GA (2017) Peraturan Presiden Nomor 22 Tahun 2017
tentang Rencana Umum Energi Nasional. J Huk Lingkung
Indones 4:139–152
Wulandari S, Sumanto S, Saefudin S (2020) Pengelolaan Biomassa
Tanaman dalam Bioindustri Perkebunan Mendukung Pengem-
bangan Bienergi Plant Biomass Management in Plantations
Bioindustry Supporting Bioenergy Development. Perspektif
18:135–149
Zafar MW, Shahbaz M, Hou F, Sinha A (2019) From nonrenewable
to renewable energy and its impact on economic growth: the role
of research and development expenditures in Asia-Pacific
economic Ccoperation countries. J Clean Prod 212:1166–1178.
https://doi.org/10.1016/j.jclepro.2018.12.081
Investigation of availability, demand, targets, and development of renewable energy in 2017… 499
123


![LDRD 140639 Final Report: Investigation of Transmutation ... · 1. 99.99% pure copper targets and obtaining tungsten, gold, bismuth, and silicon [4] 2. platinum/bismuth targets and](https://img.pdfslide.us/doc/110x75/5e7b89312eb9135cf34ce76e/ldrd-140639-final-report-investigation-of-transmutation-1-9999-pure-copper.jpg)