Embed Size (px)
Citation preview

INVESTIGATION OF AGE RELATED CHANGES TO PORCINE CORTICAL BONE
USING NANOINDENTATION AND ASH CONTENT
BY
MICHAEL J. CHITTENDEN
THESIS
Submitted in partial fulfillment of the requirements
for the degree of Master of Science in Mechanical Engineering
in the Graduate College of the
University of Illinois at Urbana-Champaign, 2011
Urbana, Illinois
Adviser:
Professor Iwona Jasiuk
brought to you by COREView metadata, citation and similar papers at core.ac.uk
provided by Illinois Digital Environment for Access to Learning and Scholarship Repository

ii
ABSTRACT
This thesis focuses on the characterization of porcine cortical bone during its development
stage. The goal of this research is to gain a further understanding of cortical bone, and to obtain data
that can be used for inputs and validation of a computational model of cortical bone and individual bone
lamella. The main technique used in this study is nanoindentation, and techniques such as scanning
electron microscopy (SEM) and ash content test are used to find supplemental data. This thesis is
comprised of two different parts, which are to be submitted as two different journal publications.
The second part in the thesis is a joint paper written by myself and a previous graduate student.
This study was performed prior to the main study in the thesis. The previous student completed the
initial experiments and I completed the latter experiments, data analysis, and statistical analysis. This
study uses nanoindentation to measure elastic modulus and hardness at the sub-microscale of the
porcine cortical bone. The mechanical properties were analyzed as a function of age, orientation, bone
structure, and hydration versus dehydration.
The first study in the thesis is the main study. Once again, nanoindentation was utilized to
measure the mechanical properties of porcine cortical bone. More age groups’ sub-microstructures
were tested to obtain a more thorough analysis of the cortical bone development. The elastic modulus
and hardness results were combined with quantitative data obtained from ash content tests to attain
the relationship between composition and mechanical properties in the bone structures.
Nanoindentation was combined with SEM to find the effect of local composition on the bone’s
mechanical properties.

iii
ACKNOWLEDGMENTS
I want to express my sincere appreciation to Professor Iwona Jasiuk for all her help and support.
I am very grateful for her guidance, encouragement, technical advice, and the time that she sacrificed. I
want to express my gratitude to Liang Feng, for his training and collaboration. I would like to thank
Jeremiah Vieregge for his assistance and expertise with nanoindentation. I express my appreciation to
Julio Soares and the MRL staff, and Scott Robinson their patience and equipment support. Finally, I
want to thank my girlfriend, family, and friends for all their inspiration during my years at the University
of Illinois.

iv
TABLE OF CONTENTS
PART I: INVESTIGATION OF AGE RELATED CHANGES TO PORCINE CORTICAL BONE USING
NANOINDENTATION AND ASH CONTENT ............................................................................................. 1
Chapter 1: Introduction ................................................................................................................................ 2
Chapter 2: Experimental Procedures ............................................................................................................ 4
2.1: Sample Preparation .................................................................................................................. 4
2.2: Nanoindentation Sample Preparation ...................................................................................... 4
2.3: Nanoindentation ....................................................................................................................... 4
2.4: Ash Content Sample Preparation .............................................................................................. 6
2.5: Ash Content Test ...................................................................................................................... 7
2.6: SEM Sample Preparation .......................................................................................................... 7
2.7: SEM Imaging ............................................................................................................................. 8
Chapter 3: Results ......................................................................................................................................... 9
3.1: Nanoindentation ...................................................................................................................... 9
3.2: Ash Content ............................................................................................................................. 11
Chapter 4: Discussion .................................................................................................................................. 12
References .................................................................................................................................................. 15
PART II: MECHANICAL PROPERTIES OF PORCINE FEMORAL CORTICAL BONE MEASURED BY
NANOINDENTATION ............................................................................................................................ 18
Chapter 5: Introduction .............................................................................................................................. 19
Chapter 6: Experimental Procedures .......................................................................................................... 21
6.1: Sample Preparation ................................................................................................................ 21
6.2: Nanoindentation ..................................................................................................................... 21
Chapter 7: Results ....................................................................................................................................... 24
Chapter 8: Discussion .................................................................................................................................. 26
References .................................................................................................................................................. 29
Appendix ..................................................................................................................................................... 32

1
PART I: INVESTIGATION OF AGE RELATED CHANGES TO PORCINE CORTICAL BONE USING NANOINDENTATION AND ASH CONTENT
Michael Chittenden1, Iwona Jasiuk1,2*
1Department of Mechanical Science and Engineering, 2Affiliate in the Department of Bioengineering,
University of Illinois Urbana-Champaign, Urbana, IL 61801 *Corresponding author: [email protected]
Abstract
Developing bone undergoes significant structural changes at multiple scales. To gain a better
understanding of this dynamic, living material, porcine bone properties were analyzed from shortly after
birth to maturation. This study utilized nanoindentation with a Berkovich fluid cell tip to measure the
mechanical properties (elastic modulus and hardness) of the cortical femoral bone at a single lamella
level. Individual lamellae were indented in the direction of the long axis of the bone in different
microstructural components (circumferential lamella, interstitial bone, and osteons) using bone samples
from six different age groups: 1 month, 3.5 month, 6 month, 12 month, 30 month, and 48 month. Ash
content tests were performed using bone samples from these same age groups to find quantitative data
on the water content, organic content, and mineral content as a function of age. A grid of indents was
also performed on a bone sample, combined with SEM, to obtain spatial variation in mechanical
properties of bone. Mechanical properties of the microstructural components improved as age
increased, but at different rates for different microstructures. The mineral content increased
correspondingly with age while the porosity decreased. In addition to exploring the composition-
properties relationship at different ages during the development of cortical bone, the composition data
can be used as inputs for a computational model, while the mechanical properties data can serve as
validation for such computational model.

2
Chapter 1: Introduction
Bone is a biological material with a complex hierarchical structure. Bone is a living tissue, which
changes and adapts to its environment to provide the maximum benefits and functionality to the person
or animal. Osteoblast formation and osteoclast resorption allow the bone to make these unique
adaptations. During bone development, the remodeling of the bone is vital for its health and structure,
as the body is continuously changing and experiencing new loads. Bone is composed of hydroxyapatite
(HA) mineral crystals, collagen type I fibers, other organic proteins, and water. The mineral crystals and
the collagen fibers both form independent matrices [1], which are intertwined together for optimal
structural support. Disparate from trabecular bone, cortical bone is the hard outer shell of bone which
serves as the support for the skeletal structure. At a very young age, cortical bone has a woven tissue
structure [2]. The mineralized collagen fibrils have little to no preferential orientation. As the bone
develops, the fibrils form lamellar bone with preferred orientations. At the sub-microscale level,
mineralized collagen fibrils form into fibers, which arrange preferentially into lamellae. At the
microscale level, these lamellae layer into patterns to form concentric lamellae around Haversian canals
(osteons), parallel lamellae around the outer and inner walls of the cortical bone (circumferential
lamellae), and lamellae in between circumferential lamellae and osteons (interstitial lamellae), which
are remnants of circumferential lamellae and osteons.
Macro-scale mechanical properties of bone as a function of age have been thoroughly
investigated [3-10]. Bulk scale mechanical properties of bone have been measured using tensile,
compressive, and bending tests [11-14]. Microscale and sub-microscale properties of bone have been
measured using nanoindentation and other techniques. Oliver and Pharr were the first to develop the
conventional method now used to obtain elastic modulus and hardness from nanoindentation [15].
Nanoindentation was used to measure interstitial bone and osteon properties [16-26], as well as
properties of differently oriented lamellae in the bone [27-32], and hydrated versus dehydrated bone
properties [33-35]. More recent studies have focused on finding a more accurate way to use
nanoindentation on bone [36-39], and analyzing the viscoelastic properties of bone [40-43]. Some
research has focused on the sub-microscale structural properties of bone with respect to age [44-46].
However, not many studies have focused on the mechanical properties changes of very young bone,
which is when most of the change takes place. Also, multiple bone structures have rarely been analyzed
as a function of age. There have been many tests done based on chemical composition of bone [47-51]

3
(some related to nanoindentation as well), but these are often comparatively quantitative, and not
ultimately quantitative.
In our previous study, summarized in Part II, we explored the effects of age, orientation,
hydration versus dehydration, and different tissue types on the mechanical properties of femoral
cortical bone. We found an increase in the elastic modulus and hardness as bone matured, higher
mechanical properties in the longitudinal direction, and higher stiffness and hardness of dehydrated
bone. We also found that interstitial bone had higher elastic modulus and hardness than osteons or
circumferential lamella. These findings provided fundamental understanding of cortical bone sub-
microscale trends, but they were lacking key age groups (very young bone) and chemical composition
analysis combined with indentation data.
The goal of this study is to measure the sub-microscale (single lamella) mechanical properties of
developing bone, focusing on the early stages, but encompassing the whole development timeline. We
measured mechanical properties of different bone structures (osteonal, circumferential and interstitial
lamellae) as a function of age. A second objective of the paper is to obtain quantitative results for
mineral content and water content. This data can then be correlated to the mechanical properties of
the bone. These values will give us a better understanding of the bone development process, and the
data will also be used as validation of a computational model of mechanical properties of a porcine
cortical femur and single lamella. Porcine bone samples from six age groups were nanoindented to
obtain the elastic modulus and hardness of their sub-microstructures: 1 month, 3.5 month, 6 month, 12
month, 30 month, and 48 month. Ash content tests were then performed on the same age groups to
obtain quantitative mineral content and water content data. Scanning electron microscopy (SEM) was
used to acquire qualitative mineral content data between indents within the same bone, and to provide
accurate images of the indented area. Porcine bone was chosen because of its similarity to human bone
and the lack of mechanical properties information on porcine bone in literature. This research can
provide a better understanding of mechanical properties changes in developing bone.

4
Chapter 2: Experimental Procedures
2.1 Sample Preparation
Porcine femoral bones were obtained from the Animal Science Department at the University of
Illinois. Immediately after obtaining the bone, the femurs were wrapped in gauze and soaked with
phosphate buffered saline (PBS) solution. The bones were frozen at -20°C. There were six ages of bone
used for experimentation: 1 month, 3.5 month, 6 month, 12 month, 30 month, and 42 month. Four
swine femurs from different animals were obtained per age.
2.2 Nanoindentation Sample Preparation
Bones were cut into 8mm high cylinders from the mid-diaphysis of the femurs using a band saw.
Samples were then polished with a rotating polishing machine until they were parallel at a height of
about 5 mm. It was important to make sure the top and bottom were completely parallel, because a
slope in the sample could affect the area function of the nanoindenter tip, as well as making the surface
more difficult to image and indent. A series of grit sizes were used to polish: 180P, 600P, 2400P, and
4000P. The samples were then polished with micron cloths of 3μm, 1μm, 0.25μm, and 0.25μm with
corresponding micron powders as lubricant: 3μm, 1μm, 0.3μm, 0.05μm. Bone is a rough material, so it
was essential to completely smooth out the roughness to obtain more accurate modulus results.
Samples were soaked in PBS in the refrigerator for about 12 hours before testing to allow the samples to
completely hydrate. Before testing, the samples were glued onto a petri dish with Crystal Bond 509, and
the petri dish was glued to a magnetic plate. This allowed the samples to be tested while immersed in
PBS, which is close to their physiological conditions.
2.3 Nanoindentation
A Hysitron TI 900 TriboIndenter®, along with a Berkovich fluid cell probe, was used to perform
nanoindentation. Stage calibration was performed with an Aluminum sample, and then a Fused Silica
Quartz sample was indented to ensure that the tip area function was calculating the correct elastic
modulus and hardness values. Samples were tested one at a time. Before each sample was immersed
in PBS, the surface was defined and imaged with the optical microscope. An indentation site was chosen
on the transverse surface of the bone (Figure 1). At least four sites were chosen per sample (2 osteons,
1 interstitial bone, and 1 circumferential lamella). Sometimes extra sites were indented if time
permitted. When choosing interstitial bone and circumferential lamella sites, locations with more visible

5
lamella layers were preferred (Figures 2 and 3). This way, the specific lamella layers could be indented.
When choosing osteons to indent, besides having defined lamella, the osteons chosen varied in size and
color (Figure 4). This was an attempt to choose newer and older osteons with different levels of
mineralization, to attain values which correctly represent the average osteon. Most osteons chosen
were secondary osteons. It must be noted that in the 1 month samples osteons could not be found.
Instead, cavities where future primary osteons might form were located. Also, when testing the bone
tissue in the 1 month samples, lamella layers were not clearly defined. In all other age groups, osteons
and other structures had clear lamella layers (Figures 2-4).
After optically locating the indentation site, PBS was poured over the sample, covering the
tested surface with a 0.5mm-1.5mm deep layer of PBS solution. The site was imaged with in-situ
scanning probe microscopy (SPM) imaging. A width of 40μm was imaged. When osteons were tested,
only the lamella layers 40μm from the Haversian canal were indented. A “click script” was used to select
specific places to indent, and piezo automation was used to make 22-28 indents on the bone. A
diamond fluid cell Berkovich tip with 5µm radius was used to make the indents. The indent function
included a 5 second loading period up to a 2000μN peak. This was the recommended load because it
gave indent depths of around 200nm-400nm, which gave accurate results with the tip function used.
There was a 5 second hold period to reduce creep effect of the bone. This was followed by a 5 second
unloading period. After the indents were complete, the tip was retested on the Quartz to make sure
there were no small pieces of bone stuck to the tip. If the Quartz elastic modulus was not correct, the
tip was taken out and cleaned before testing the next site. This was important to check, because when
bone was tested in wet conditions, it was common for bone pieces to stick to the indenter tip, which
could significantly affect the calculated modulus. PBS was removed from the petri dish so the next site
could be optically imaged (fluid distorted the image). Then the process was repeated again. Each
sample was indented at least 100 times. Three samples were indented per age, making a total of 18
nanoindentation samples.
On one of the 30 month samples, a 10 x 10 grid of indents was performed in addition to
indenting specific lamella layers. The 200μm x 160μm grid encompassed interstitial bone and four
osteons around the outside. The goal of these indents was to distinguish a difference in properties due
to different degrees of mineralization and different spatial structures. This site of 100 indents was
imaged with SEM to correlate the mineralization content to each indent. Five additional indents were

6
made and imaged in-situ to analyze possible pile-up effect of indenting bone. Roughness of the
surrounding tissue was also analyzed.
After obtaining reduced modulus and hardness from the nanoindenter, the elastic modulus of
the nanoindenter tip and the Poisson’s ratio of the sample must be taken into account to find the true
elastic modulus of the material using the Equation (1) developed by Oliver and Pharr [15].
2 21 11 s i
r s i
v v
E E E
(1)
Es corresponds to the elastic modulus of the sample. Er is the reduced modulus obtained from the
nanoindentor. Ei is the modulus of the indenter tip, and ν s and ν i are the Poisson ratios of the sample
and indenter, respectively. The Ei for the diamond indenter tip is 1140 GPa, and the νi is 0.07. Because
diamond is so much stiffer than bone, its effects in Equation (1) are basically negligible. The Poisson’s
ratio of bone is assumed to be νs=0.3 [52], and this term causes the sample modulus to be lower than
the reduced modulus. Equation (2) shows how the hardness is calculated from the ratio of the
maximum load to the projected contact area.
maxPH
A (2)
2.4 Ash Content Sample Preparation
Samples for ash content were either taken from the bone immediately after nanoindentation, or
obtained separately from the mid-diaphysis of the femurs. Four samples from each age were tested,
each from a different femur (24 total samples). Similar to the nanoindentation preparation, the samples
were cut with a band saw into cylinders. Each anatomical position was labeled with a marker or pencil
(anterior, posterior, medial, and lateral). The cylinder was polished with P180 grit paper down to a
height of 2mm. Rectangular specimens were cut out of the cylinder: first, the area of the first specimen
was polished flat on the outside. A 4mm section was cut out of the cylinder using a razor blade. The
inner side was then polished, and the cut ends were polished until flat. The resulting specimen was a
2mm x 2mm x 4mm rectangular prism from the midpoint of the cortical bone shell (radially). Specimens
were taken from the midpoint to avoid testing soft tissue on the outside of the shell or trabecular bone
from the inner side of the shell. Six bone specimens were obtained from each sample with the
positions: Anterior, Medial, Posterior-Medial, Posterior, Lateral, and Anterior-Lateral.

7
2.5 Ash Content Test
Each specimen was hydrated in PBS in a refrigerator for 12 to 24 hours. If specimens were taken
from nanoindentation samples, there was no need for additional hydration because the samples were
already hydrated. The surface of each specimen was dried with a Kim-wipe tissue. Samples were
weighed with a calibrated 0.001g accurate scale. Specimens were placed in lightweight, heat resistant,
ceramic crucibles. Crucibles were also weighed for each set of specimens. Specimens in crucibles were
then heated to 105°C for 6 hours in an oven. They were weighed again to attain the water weight
percentage of each specimen (Equation 3). Specimens were then heated to 600°C in a different
industrial oven and weighed a final time to obtain the collagen weight percentage and mineral weight
percentage (Equations 4 and 5). Crucibles were wiped down with tissue before testing the next set of
specimens.
(3)
(4)
(5)
2.6 SEM Sample Preparation
Samples to be imaged were placed in a 2% paraformaldehyde and 2.5% glutaraldehyde solution
with a 0.1M sodium-cacodylate buffer (pH7.4) immediately after nanoindentation. They were kept in
this solution for one day to preserve the in-vivo tissue structure. Samples were rinsed in 0.1M sodium-
cacodylate buffer for two hours on a shaker table. The bone samples were dried so they could be
imaged using the environmental SEM under the Hi-Vacuum mode. They were soaked in 37%, 67%, 95%,
and 100% ethanol concentrations for 24 hours at each concentration. Samples were then soaked in
hexamethyldisilazane and allowed to air dry to avoid creating micro cracks when the ethanol evaporated
from the bone. Finally, the samples were sputter coated with a layer of gold palladium. Sites of interest
were labeled with painting silver paint near the area. The paint was also used as a “ground” so the
surface of the imaged bone would not stay at a high voltage when charged by SEM electrons (this
sometimes produces glare on the image). Samples were stored in a desiccator before imaging.

8
2.7 SEM Imaging
A JEOL 7000F SEM was used to scan the bone samples. A 20kV beam was used with backscatter
to produce the high contrast images. Energy dispersive spectroscopy (EDS) mode was used to find
variances in mineral content on the bone surface. A zoom of 750x was required to pick out indents
within the array. 400x zoom was used to obtain quality images of the indented surface, and 12,000x
zoom was used to image individual indents.

9
Chapter 3: Results
3.1 Nanoindentation
The goal of this paper was to measure the changes in mechanical properties of different bone
structures as the bone develops, from very young bone all the way to maturation. Other objectives
were to analyze how the porosity and mineral content is affected by age, and to find a possible
correlation between mechanical properties and chemical composition. Figure 5 shows the three
different bone structure’s elastic modulus and hardness as the age increases. Mechanical properties of
each type of structure increase in mechanical properties as the bone matures. From age 30 to age 48,
interstitial bone and osteons decrease in hardness and stiffness.
Figure 6 is a scatter plot of the bone structures’ elastic modulus and hardness as a function of
age. There is a very steep incline in elastic modulus at an early age, and the plot eventually steadies off
until it reaches a peak at 30 months of age. Hardness values followed the same trend. Although the
different bone structures are similar in mechanical properties, their properties do not increase at the
same rate. Interstitial bone (IB) is slightly stiffer than the other structures, especially at a young age.
These property differences between tissue structures are small, but the IB consistently has a higher
modulus. When indenting in the longitudinal direction (on the transverse plane), circumferential lamella
is the least stiff in developing bone.
Bone develops at a very quick rate after birth. By 1 month of age, the elastic modulus of CL, IB,
and Osteons is already 46%, 53%, and 43% of the elastic modulus at 30 months of age. At age 3.5
months, the elastic modulus is of CL, IB and Osteons is at 53%, 83%, and 68% of the elastic modulus at
age 30 months. From 1 month to 3.5 months, the elastic moduli of IB and Osteons exhibit a 55% and
59% increase in 2.5 months. In the 26.5 months from 3.5 to 30 months, the elastic modulus of IB and
Osteons only increases by 21% and 46%. The CL elastic modulus increases at a slower pace with respect
to age. From 1 month to 3.5 months, the elastic modulus of CL increased by 14%, and from 3.5 months
to 30 months, the elastic modulus increased by 90%.
Differences in properties were analyzed with an unpaired, one tail t-test with p=0.05 to
determine if differences were significant. Because of the large number of ages tested and the small
amount of samples per age (3), many of the increases in elastic modulus and hardness were statistically
insignificant differences. When comparing the changes in Circumferential Lamella, the increase from 3.5
to 6 months (61%), and the increase from 6 to 12 months (11%) were the significant differences in

10
elastic modulus. All other increases in CL modulus between ages were insignificant at the p=0.05 level.
The elastic modulus increase from 1 month to 3.5 month Interstitial Bone (61%) was the only significant
increase in elastic modulus of Interstitial Bone. When considering Osteons, there were significant
increases in elastic modulus from ages 1 to 3.5 months (58%), 3.5 to 12 months (16%), and 12 to 30
months (25%). Hardness values followed the same trends as elastic modulus, except for the significant
increase in hardness of Interstitial Bone from 3.5 to 30 months (59%). There are no significant
differences between different bone structures’ elastic modulus except between the 3.5 month CL and IB
(Figure 6).
As a secondary analysis, the osteon data was examined to find the relationship between
stiffness of the lamellae and distance from the Haversian canal. The area imaged with the Scanning
Probe Microscopy was about 40µm by 40µm, so all indents on the Osteon are within 40µm of the
Haversian canal (the interstitial bone is not reached). Each osteon was split into 3 different zones: Close,
Medium, and Far. “Close” was about 0-12µm from the canal, “Medium” was about 12-24µm, and “Far”
was 24-40µm away. The elastic modulus of each indent was categorized, averaged, and filed into a table
(Figure 7). There were no significant changes between any of the zones at any age level. For most ages,
the elastic modulus differences from distance from the Haversian canal are very minimal.
100 indents were performed in a grid (10 x 10) between four osteons and interstitial bone on a
30 month hydrated sample (Figure 8). The sample was imaged with SEM to correlate each indent to its
elastic modulus and hardness values (Figure 9). A value gradient was applied to the cells placed over the
indents, so it is easier to see trends in the data. Blue corresponds to a higher elastic modulus value,
whereas red corresponds to a lower elastic modulus. Indentations which landed on a canal/void or on
the edge of two structures (cement line area) were removed from any averages. Figure 10 shows that
on average, the interstitial bone is stiffer than any osteon. However, this is not a significant difference.
The osteons also vary slightly in mechanical properties. The SEM backscatter images and EDS images
show that the interstitial bone has a lighter color than the osteons, due to its higher concentration of
hydroxyapatite.
Five additional indents were made in this area and in-situ imaged with Scanning Probe
Microscopy (Figure 11). An SEM image can be seen of the same indent in Figure 12. It seems that
micro-cracks have appeared in the indent, which is probably due to a combination of the stress
concentrations created from the indent, and from critically drying the bone. Average pileup was
measured along the side of the indent as well as average roughness of the 4µm x 4µm area. The

11
average pileup around the 5 indents was 8.3nm. The average roughness around each of the 5 indents
was 11.8nm. The roughness was greater than the pileup, which means that there are no pile-up affects
influencing the elastic modulus or hardness calculations of the bone.
3.2 Ash Content
The ash content was measured from four different samples from each of the six ages. Figure 13
contains the average Water Percent, Collagen Percent (organic content composed of mostly collagen),
and Mineral Percent. At animal birth, the bone is woven bone, and it is very porous. This is seen by the
very high water weight content in the 1 month bone. There is a steep drop off in water percentage from
the ages 1 month to 3.5 month. The water content continues to drop with a decreasing rate as the age
increases. While water percentage is decreasing, minerals take its place and mineral content increases
at a decreasing rate as the bone matures. The weight percentage of collagen in the bone stays relatively
constant as the bone develops. Figure 14 illustrates the relationship between collagen and mineral (not
including water) as the bone matures. Besides the 1 month bone having more collagen and less mineral
than the other ages, the ratio of collagen to mineral does not appear to greatly change due to age.
Figure 15 represents the analysis of ash content over different anatomical positions in the bone. It
appears that the Posterior and Anterior-Lateral regions may be more porous in the younger bone, while
the Anterior region is sometimes more mineralized, but there was too much variation in the data to
make any decisive conclusions.
An unpaired, one tail t-test with level p=0.05 was used again to determine which differences
over age were significant. There was a significant drop in water weight percent from 1 month to 3.5
month (114%), and there were significant increases in mineral weight percent from 1 month to 3.5
month (57%) and 3.5 month to 6 month (9%). There was a significant increase in collagen weight
percent from 6 months to 12 months (24%). All other changes in water, collagen, and mineral
percentages due to age were statistically insignificant. The 1 month sample was also significantly higher
in collagen dry weight percent and lower in mineral dry weight percent.
12
Chapter 4: Discussion
Porcine femoral cortical bone was tested to find the mechanical properties at the sub-
microscale level, and the corresponding mineral content as a function of age. The elastic modulus and
hardness increased at each age until age 30. This agrees with other age studies on bone [44, 45, 51].
The osteon and interstitial bone properties decreased from age 30 months to 48 months. Porcine
skeletal maturity is obtained between ages 30 and 36 [53], so it is possible that the bone is already
beginning to age and degenerate by 48 months. The most significant changes in age came in the first
12% of bone development time (3.5/30 months). Not coincidently, this time period also contained the
greatest decrease in porosity and the greatest increase in mineral content.
Three different types of bone structures were tested at each age: circumferential lamellae,
interstitial bone, and osteons. At each age (except 30 month), interstitial bone had a greater elastic
modulus than osteons or circumferential lamella. Interstitial bone hardness was also greater than the
corresponding osteons and CL (except 1 month). This data agrees with most tissue structure analysis
[19, 26]. Generally, IB is more mineralized than the newer osteons. Another trend with bone structures
was that the circumferential lamella tended to have the lowest elastic modulus and hardness of the
bone structures. Circumferential lamella in this study was always tested on the outer edge of the bone,
rather than the inner. It is known that as the bone is maturing, it grows radially, so the outer bone must
be continually remodeled to increase the bone’s radius [54]. New, regenerating bone is less stiff and
less hard than older, developed bone [20]. This could be due to the fact that newly remodeled bone is
initially composed of mostly collagen and significantly less mineral [19, 55, 56]. In the SEM images we
obtained, the circumferential lamellae were darker than interstitial lamellae, indicating less mineral in
that area, which may be the cause of the lower mechanical properties, and slower rate of improvement
with age. Osteons are also often new remodeled bone. However, we took an average of older and
newer secondary osteons, so the elastic modulus and hardness was only slightly less than that of IB.
Although we mention these differences between different cortical bone structures, it must be noted
that the differences were very small, and most differences were statistically insignificant because of the
number of samples used. There was a greater effect due to age than due to tissue structure type.
Secondary osteon analysis was performed on the data to find a relationship between
mechanical properties and distance between Haversian canal. We found no correlation between the
two. This disagrees with data found by Gupta [19] and Rho [26]. However, our data agrees with Burket,

13
who also did not see a noticeable change in osteon elastic modulus or hardness with increasing distance
from the Haversian canal [44].
The ash content experiments provided quantitative water content and mineral content data,
which will be used in a cortical bone model. As age increased, mineral weight percent increased and
water weight percent decreased. Collagen content stayed relatively constant. Both changes in water
and mineral were very drastic at the very young ages, and the changes were less significant as the bone
matured. The mineral percent had a very close direct correlation with elastic modulus, and the water
percent was negatively correlated with elastic modulus (Figure 16). This suggests that mineral content
and porosity have a large impact on cortical bone stiffness and hardness.
The array of indents on the 30 month sample showed a slight correlation between mechanical
properties and variances in local mineral content. However, there was more of an effect of indent
surface shape than mineral ratio. Without choosing the exact location of each indent, some indents fell
on the lamella layers, some fell on the boundaries between the lamella layers, and others fell on micro-
cracks in the bone, rough areas, or voids. These differences in surface seemed to have a greater effect
on calculated elastic modulus and hardness. However, when the indentations on the voids and edges of
the structures were removed, the average elastic modulus tended to be higher in the more dense
mineral areas. This suggests that mineral content has an effect on bone stiffness locally, as well as
globally, which agrees with Smith [57]. This study also demonstrates the importance of carefully
choosing each indentation location to reduce deviation due to surface shape.
Careful consideration was taken when testing the porcine cortical bone. Vigorous polishing
reduced artifacts and roughness for indentation, and testing the samples while immersed replicated in-
vivo conditions. There was no pile up effect, and the roughness of the surface was a very small value.
However, the use of nanoindentation does make some assumptions. The equations used assume that
bone lamella is a linear elastic material at the sub-microscale level [15]. Fan believes there may be some
error associated with this assumption [58]. Other studies focus on the effect of bone viscoelasticity on
measurements of elastic modulus [41-43]. We used a hold time of 5 seconds to reduce creep effect.
Wu suggests that a hold time of under 30 seconds may yield less accurate results for cortical bone [40].
We did not fully study the effect of hold time on the cortical bone, but our indentation depths were at
the same depths as Wu’s high hold time indents. We did make sure that our indentation depths were
no lower than the optimal depths, because we were aware that too low or too high indentation depths
produce higher variance in results.

14
Future work could include Micro Computed Tomography (Micro CT) measurements to analyze
the 3-D structure of cortical bone as it adapts with age. This would provide images of the intricate canal
system, as well as porosity at the nanoscale by using higher resolution. Fourier Infrared Spectroscopy
(FTIR) and Raman could be used for further, more local chemical composition analysis. Future tests
could be done on diseased bone to gain a better understanding of how disease affects the cortical bone
and how to predict its onset.

15
References
1. Novitskaya, E., Chen, P.-Y., Lee, S., Castro-Ceseña, A., Hirata, G., Lubarda, V.A., McKittrick, J. , Anisotropy in the compressive mechanical properties of bovine cortical bone and the mineral and protein constituents. Acta Biomater 2011;In Press, 2011.
2. Jee, W.S.S., Integrated Bone Tissue Physiology: Anoatomy and Physiology, in Bone Mechanics: Handbook, S.C. Cowin, Editor. 2001, CRC Press LLC. p. 5.
3. Ager, J.W., et al., Deep-ultraviolet Raman spectroscopy study of the effect of aging on human cortical bone. Journal of Biomedical Optics, 2005. 10(3): p. 34012-1.
4. Bertazzo, S., C.A. Bertran, and J.A. Camilli, Morphological characterization of femur and parietal bone mineral of rats at different ages. Key Engineering Materials, 2006. 309-311: p. 11-14.
5. Devulder, A., et al., Effect of age on local mechanical properties of haversian cortical bone. Journal of Biomechanics, 2008. 41: p. S494.
6. Ritchie, R.O., et al., Role of microstructure in the aging-related deterioration of the toughness of human cortical bone. Materials Science & Engineering C, Biomimetic and Supramolecular Systems, 2006. 26(8): p. 1251-60.
7. Wang, X., et al., Age-related changes of noncalcified collagen in human cortical bone. Annals of Biomedical Engineering, 2003. 31(11): p. 1365-71.
8. Wang, X. and S. Puram, The toughness of cortical bone and its relationship with age. Annals of Biomedical Engineering, 2004. 32(1): p. 123-135.
9. Zioupos, P., C. Kaffy, and J.D. Currey, Tissue heterogeneity, composite architecture and fractal dimension effects in the fracture of ageing human bone. International Journal of Fracture, 2006. 139(3-4): p. 407-24.
10. Zioupos, P., M. Gresle, and K. Winwood, Fatigue strength of human cortical bone: Age, physical, and material heterogeneity effects. Journal of Biomedical Materials Research - Part A, 2008. 86(3): p. 627-636.
11. Donald T. Reilly, A.H.B.a.V.H.F., The elastic modulus for bone. Journal of Biomechanics, 1975. 7: p. 271-275.
12. Kotha, S.P. and N. Guzelsu, Tensile behavior of cortical bone: Dependence of organic matrix material properties on bone mineral content. Journal of Biomechanics, 2007. 40(1): p. 36-45.
13. McCalden, R.W., et al., Age-related-changes in the tensile properties of cortical bone- the relative importantce of changes in porosity, minerlization and microstructure. Journal of Bone and Joint Surgery-American Volume, 1993. 75A(8): p. 1193-1205.
14. Simkin, A. and G. Robin, Mechanical testing of bone in bending. Journal of Biomechanics, 1973. 6(1): p. 31-39.
15. Oliver, W.C. and G.M. Pharr, An Improved Technique for Determining Hardness and Elastic-Modulus Using Load and Displacement Sensing Indentation Experiments. Journal of Materials Research, 1992. 7(6): p. 1564-1583.
16. Dong, X.N., et al., Random field assessment of nanoscopic inhomogeneity of bone. Bone, 2010. 47(6): p. 1080-1084.
17. Preininger, B., et al., SPATIAL-TEMPORAL MAPPING OF BONE STRUCTURAL AND ELASTIC PROPERTIES IN A SHEEP MODEL FOLLOWING OSTEOTOMY. Ultrasound in Medicine and Biology, 2011. 37(3): p. 474-483.
18. Gupta, H.S., et al., Two different correlations between nanoindentation modulus and mineral content in the bone-cartilage interface. Journal of Structural Biology, 2005. 149(2): p. 138-148.
19. Gupta, H.S., et al., Mechanical modulation at the lamellar level in osteonal bone. Journal of Materials Research, 2006. 21(8): p. 1913-1921.

16
20. Ishimoto, T., et al., Biomechanical evaluation of regenerating long bone by nanoindentation. Journal of Materials Science-Materials in Medicine, 2011. 22(4): p. 969-976.
21. Gan, M., et al., Effect of Compressive Straining on Nanoindentation Elastic Modulus of Trabecular Bone. Experimental Mechanics, 2010. 50(6): p. 773-781.
22. Sun, L.W., et al., Evaluation of the mechanical properties of rat bone under simulated microgravity using nanoindentation. Acta Biomaterialia, 2009. 5(9): p. 3506-3511.
23. Olesiak, S.E., M.L. Oyen, and V.L. Ferguson, Viscous-elastic-plastic behavior of bone using Berkovich nanoindentation. Mechanics of Time-Dependent Materials, 2010. 14(2): p. 111-124.
24. Hengsberger, S., et al., How is the indentation modulus of bone tissue related to its macroscopic elastic response? A validation study. Journal of Biomechanics, 2003. 36(10): p. 1503-9.
25. Hengsberger, S., A. Kulik, and P. Zysset, Nanoindentation discriminates the elastic properties of individual human bone lamellae under dry and physiological conditions. Bone, 2002. 30(1): p. 178-184.
26. Rho, J.Y., et al., Variations in the individual thick lamellar properties within osteons by nanoindentation. Bone, 1999. 25(3): p. 295-300.
27. Reisinger, A.G., D.H. Pahr, and P.K. Zysset, Elastic anisotropy of bone lamellae as a function of fibril orientation pattern. Biomechanics and Modeling in Mechanobiology, 2011. 10(1): p. 67-77.
28. Orias, A.A.E., et al., Anatomic variation in the elastic anisotropy of cortical bone tissue in the human femur. Journal of the Mechanical Behavior of Biomedical Materials, 2009. 2(3): p. 255-263.
29. Willems, N., et al., Determination of the relationship between collagen cross-links and the bone-tissue stiffness in the porcine mandibular condyle. Journal of Biomechanics, 2011. 44(6): p. 1132-1136.
30. Lau, M.-l., Lau, Kin-tak , Yao Yeo, Yan-dong , Au Yeung, Chi-ting and Lee, Joong-hee, Measurement of Bovine Bone Properties through Surface Indentation Technique. Materials & Manufacturing Processes 2010.
31. Guidoni, G., M. Swain, and I. Jager, Nanoindentation of wet and dry compact bone: Influence of environment and indenter tip geometry on the indentation modulus. Philosophical Magazine, 2010. 90(5): p. 553-565.
32. Franzoso, G. and P.K. Zysset, Elastic Anisotropy of Human Cortical Bone Secondary Osteons Measured by Nanoindentation (vol 131, art. no. 021001, 2009). Journal of Biomechanical Engineering-Transactions of the Asme, 2009. 131(11).
33. Lievers, W.B., et al., Effects of dehydration-induced structural and material changes on the apparent modulus of cancellous bone. Medical Engineering & Physics, 2010. 32(8): p. 921-925.
34. Pathak, S., et al., Measuring the dynamic mechanical response of hydrated mouse bone by nanoindentation. Journal of the Mechanical Behavior of Biomedical Materials, 2011. 4(1): p. 34-43.
35. Zwierzak, I., M. Baleani, and M. Viceconti, Microindentation on cortical human bone: effects of tissue condition and indentation location on hardness values. Proceedings of the Institution of Mechanical Engineers Part H-Journal of Engineering in Medicine, 2009. 223(H7): p. 913-918.
36. Isaksson, H., et al., Precision of nanoindentation protocols for measurement of viscoelasticity in cortical and trabecular bone. Journal of Biomechanics, 2010. 43(12): p. 2410-2417.
37. Paietta, R.C., S.E. Campbell, and V.L. Ferguson, Influences of spherical tip radius, contact depth, and contact area on nanoindentation properties of bone. Journal of Biomechanics, 2011. 44(2): p. 285-290.
38. Gardner-Morse, M.G., et al., In Situ Microindentation for Determining Local Subchondral Bone Compressive Modulus. Journal of Biomechanical Engineering-Transactions of the Asme, 2010. 132(9).

17
39. Tang, B., A.H.W. Ngan, and W.W. Lu, An improved method for the measurement of mechanical properties of bone by nanoindentation. Journal of Materials Science: Materials in Medicine, 2007. 18(9): p. 1875-1881.
40. Wu, Z.H., et al., The effect of holding time on nanoindentation measurements of creep in bone. Journal of Biomechanics, 2011. 44(6): p. 1066-1072.
41. Fan, Z.F. and J.Y. Rho, Effects of viscoelasticity and time-dependent plasticity on nanoindentation measurements of human cortical bone. Journal of Biomedical Materials Research Part a, 2003. 67A(1): p. 208-214.
42. Bembey, A.K., et al. Nanoindentation measurements of bone viscoelasticity as a function of hydration state. in 2005 MRS Fall Meeting. 2005. Boston, MA, United States: Materials Research Society, Warrendale, PA 15086, United States.
43. Bembey, A.K., et al., Viscoelastic properties of bone as a function of hydration state determined by nanoindentation. Instrumented Nanoindentation, 2006. 86(33-35): p. 5691-5703.
44. Burket, J., et al., Microstructure and nanomechanical properties in osteons relate to tissue and animal age. Journal of Biomechanics, 2011. 44(2): p. 277-284.
45. Isaksson, H., et al., Rabbit cortical bone tissue increases its elastic stiffness but becomes less viscoelastic with age. Bone, 2010. 47(6): p. 1030-1038.
46. Kavukcuoglu, N.B., et al., Osteopontin deficiency and aging on nanomechanics of mouse bone. Journal of Biomedical Materials Research - Part A, 2007. 83(1): p. 136-144.
47. Bi, X.H., et al., Raman and mechanical properties correlate at whole bone- and tissue-levels in a genetic mouse model. Journal of Biomechanics, 2011. 44(2): p. 297-303.
48. Viswanath, B., et al., Effect of calcium deficiency on the mechanical properties of hydroxyapatite crystals. Acta Materialia, 2010. 58(14): p. 4841-4848.
49. Paschalis, E.P., et al., FTIR microspectroscopic analysis of human osteonal bone. Calcified Tissue International, 1996. 59(6): p. 480-487.
50. Zebaze, R.M.D., et al., Differences in the degree of bone tissue mineralization account for little of the differences in tissue elastic properties. Bone, 2011. 48(6): p. 1246-1251.
51. Donnelly, E., et al., Effects of tissue age on bone tissue material composition and nanomechanical properties in the rat cortex. Journal of Biomedical Materials Research Part A, 2010. 92A(3): p. 1048-1056.
52. Shahar, R., et al., Anisotropic Poisson's ratio and compression modulus of cortical bone determined by speckle interferometry. Journal of Biomechanics, 2007. 40(2): p. 252-264.
53. Tumbleson, M.E.a.L.B.S., ed. Advances in Swine in Biomedical Research. Vol. 2. 1996, Plenum Publishing Corporation: New York. 648.
54. Feng, L.A. and I. Jasiuk, Multi-scale characterization of swine femoral cortical bone. Journal of Biomechanics, 2011. 44(2): p. 313-320.
55. Abbaspour, A., et al., Continuous local infusion of fibroblast growth factor-2 enhances consolidation of the bone segment lengthened by distraction osteogenesis in rabbit experiment. Bone, 2008. 42(1): p. 98-106.
56. Chakkalakal, D.A., et al., MINERAL AND MATRIX CONTRIBUTIONS TO RIGIDITY IN FRACTURE-HEALING. Journal of Biomechanics, 1990. 23(5): p. 425-434.
57. Smith, L.J., J.P. Schirer, and N.L. Fazzalari, The role of mineral content in determining the micromechanical properties of discrete trabecular bone remodeling packets. Journal of Biomechanics, 2010. 43(16): p. 3144-3149.
58. Fan, Z., J.Y. Rho, and J.G. Swadener, Three-dimensional finite element analysis of the effects of anisotropy on bone mechanical properties measured by nanoindentation. Journal of Materials Research, 2004. 19(1): p. 114-123.

18
PART II: MECHANICAL PROPERTIES OF PORCINE FEMORAL CORTICAL BONE MEASURED BY NANOINDENTATION
Michael Chittenden1, Liang Feng1, Jeffrey Schirer2, Michelle Dickinson3, Iwona Jasiuk1,4*
1Department of Mechanical Science and Engineering, 4Affiliate in the Department of Bioengineering,
University of Illinois Urbana-Champaign, Urbana, IL 61801 *Corresponding author: [email protected]
2Hysitron Inc., 10025 Valley View Rd, Minneapolis, MN, 55344, USA 3Department of Chemical and Materials Engineering,
University of Auckland, 92019 Auckland, New Zealand
Abstract
This study uses the nanoindentation technique to examine variations in the local mechanical
properties of porcine femoral cortical bone under hydrated conditions. Bone specimens from three age
groups (6, 12 and 42 months), ranging from young to mature animals, were tested on both the
longitudinal and transverse cross-sectional surfaces. The indentation moduli and hardness of individual
sub-microstructural components within the bone tissue (circumferential lamellae, interstitial lamellae,
osteons, and t-osteons) were measured. In general, both the elastic moduli and hardness increased
with age. However, the magnitudes of these increases were different for each sub-microstructural
component. The longitudinal indentation moduli of the bone structures were generally higher than the
transverse indentation moduli. Dehydrated samples were also tested to allow comparison with
hydrated samples, and these always resulted in higher moduli and hardness than the hydrated samples.
Again, the degree of variation was different for each sub-microstructural component. These results
indicate that the developmental changes in bone have different rates of mechanical change within each
sub-microstructural component.

19
Chapter 5: Introduction
Bone is a living tissue which undergoes continuous remodeling comprising of osteoblastic bone
formation and osteoclastic bone resorption. This remodeling allows bone to change its structure and
composition in response to mechanical, biological, and chemical stimuli. Bone can also be considered as
a multi-phase composite material with a complex hierarchical structure consisting of hydroxyapatite
(HA) mineral crystals, collagen type I, non-collagenous proteins, and fluids. At the nanoscale, stiff HA
mineral crystals and soft collagen molecules combine into mineralized collagen fibers. In cortical bone,
which forms the outer shell of bone, at the sub-microscale, these mineralized fibers are arranged
preferentially to form lamellae. At the microscale level, these lamellae are organized into layered
structures which include concentric lamellae (representing osteons made of lamellae in the form of
concentric cylinders), circumferential lamellae (following outer and inner circumferences of bone shaft),
and interstitial lamellae (made of remnants of concentric and circumferential lamellae) [1]; these
microstructures are referred to as lamellar bone. Bone microstructure develops as a function of animal
maturation and very young cortical bone tissue displays a woven structure, with interlacing arrangement
of mineralized collagen fibers showing no preferential orientation. However, as the bone matures, this
woven bone is gradually replaced with lamellar bone which has preferential orientations. The volume
fractions of the different types of lamellar bone (circumferential, interstitial, and concentric lamellae)
also change with age. While the changes in bone’s structure, composition and macroscale mechanical
properties due to aging have been studied by many investigators [2-10], the age-related changes in
mechanical properties at the microstructural level have not been thoroughly addressed.
Tensile, compression, and bending tests have been used to measure the bulk mechanical
properties of cortical bone [11-14]. Micro scale testing, including nanoindentation, have also been used
to characterize the local properties of bone [15-41]. Factors that can affect the measured mechanical
properties, such as species type, tissue type [24-26, 39], orientation [15, 16, 20], anatomical location,
and degree of mineralization have been studied with nanoindentation as reviewed by Lewis and Nyman
[42]. Since the classical paper by Oliver and Pharr in 1992 [29], which presented a theoretical
framework for nanoindentation technique to measure the local modulus and hardness of a range of
materials, different models have been developed for nanoindentation to obtain more accurate data
analysis [28, 29, 43]. Some recent studies have focused on the viscoelastic and poroelastic properties of
bone [23, 34, 40, 41], or age effects of bone [44-47]. Kavukcouglu et al. [48] used nanoindentation
combined with Raman to characterize the osteopontin deficiency and aging effects on mouse cortical

20
bone. However, the age-related changes in the local mechanical properties of large mammal cortical
bones are still not well characterized.
The objective of this paper is to measure mechanical property variations at the sub-
microstructural (single lamella) level in porcine femoral cortical bone as a function of age. By knowing
the local properties of bone, we can obtain a better understanding of the overall mechanical properties
of bone. These measurements can also serve to validate computational predictions of bone at the single
lamella level. Porcine femoral cortical bone tissues from three different age groups (6, 12, and 42
months) were tested, enabling young, developing, and adult bones to be studied. Swine skeletal
maturity is obtained between the ages of 30-36 months [49]. The bone was immersed in phosphate
buffered saline (PBS) solution during the storage and testing to maintain a hydrated condition in order
to provide an environment which mimics physiological conditions. The bone was then dried and tested
to enable comparisons to previous studies which typically dehydrate and mount bone samples. We
chose to analyze the swine bone because of its comparable anatomy and physiology to a human bone.
Also, there is limited information in literature on swine bone property measurements.

21
Chapter 6: Experimental Procedures
6.1 Sample Preparation
Cortical bone samples were prepared from porcine femurs from animals aged 6, 12, and 42
months. Three different femurs were studied in each age group. The bones were obtained from the
Animal Science Department at the University of Illinois at Urbana-Champaign (UIUC). They were
immediately cleaned from soft tissue, covered with PBS soaked gauze and freshly frozen at -20°C for
storage. Prior to sectioning, the femurs were thawed at 4°C overnight. Mid-diaphysis portions of each
femur were cut and sectioned into small pieces using a band saw and precision diamond saw (Buehler
Isomet 1000, Buehler) under constant water irrigation. Both longitudinal and transverse cross-section
samples were prepared from each femur as shown in Figure 18. The longitudinal direction corresponds
to bone’s long axis direction. The samples’ surfaces selected for nanoindentation testing were very well
polished. After using silicon carbide abrasive paper with progressively finer grit size (P1200, P2400,
P4000) to grind the surfaces of each sample, the samples were then polished using3μm, 1μm and
0.25μm polishing cloths. A final 0.05μm alumina suspension micro-cloth polish was carried out to
ensure a smooth, parallel surface ideal for nanoindentation. The bone samples were then glued onto a
small petri dish using the Crystal Bond thermal glue. The petri dish was then filled with PBS so the bone
could be tested in full hydration.
6.2 Nanoindentation
A Hysitron TI 900 TriboIndenter® was used to perform the nanoindentation tests. Initially, each
bone sample was soaked in PBS without immersing the top surface of the bone. This allowed us to
image the bone surface while keeping the bone sample wet. Optical microscope images were obtained
using TriboIndenter optics. The specific test sites on each sample were then identified and test locations
were accurately positioned. At this point, the samples were completely immersed in PBS and then
imaged using in-situ Scanning Probe Microscopy (SPM) imaging. Specific indent sites were accurately
chosen using the piezo automation positioning. Figure 19 shows the main structural features of interest,
including interstitial lamellae, circumferential lamellae, and osteons. Osteon-like (layered hollow
cylinders) features were also identified in the transverse specimens (on longitudinal surfaces) and
named as t-osteons. These are different from the type T osteons discussed in [50] where the letter “T”
indicates the transverse orientation of collagen fibers within an osteon. These “t” osteons are lamellae
surrounding Volkmann canals which are perpendicular to osteons and Haversian canals, and they can be

22
seen in the longitudinal surface under the optical microscope. Figure 20 shows a possible orientation of
these “t” osteons. Figure 21 shows an optical image of a “t” osteon. Both osteons and t-osteons were
identified in the 6, 12, and 42month old samples. Osteons were more common and well-formed as the
age of the sample increased.
Femurs from three different animals were tested per each age group giving a total of nine
samples. On each sample several osteons were tested. Osteons were tested from different positions to
ensure a more representative set. Within each osteon, 20-30 indents were carried out over three to five
successive thick and thin lamellar layers of the osteonal (Haversian) canal. “Thin lamellae” are the
boundaries between the thick lamellae layers. Under the optical microscope, these boundary lines
appear as thinner lamellae. Most of the osteons tested were secondary osteons. Similarly, in the
circumferential lamellae, three to five successive thick and thin lamellar layers of the dense zone and the
bright line zones were tested (20-30 indents for each location). In the interstitial bone regions, found
between the osteons, thin and thick lamella were also tested (20-30 indents for each location), but
these separations between lamella were sometimes less defined than in osteons and circumferential
lamellae. All samples were initially tested under fully hydrated conditions (PBS solution) and then for
comparison, one sample from each of the 6 and the 42 month age groups was left to air dry and re-
tested the next day to assess the mechanical properties of these sub-microstructural features after
dehydration. A calibrated diamond fluid cell Berkovich probe was used for all tests to ensure that any
fluid meniscus force was kept to a minimum, and all machine calibrations were carried out in PBS
solution, not in air, which is a more standard method. Figure 17 lists the details of each test site and the
number of indentations for each bone type (interstitial bone, circumferential lamellar bone, osteons,
and t-osteons). For all tests, 2000 µN load-controlled indents were applied using a five-second load,
two-second hold and five-second unload trapezoid function.
All indents were performed using a piezo automation positioning, which allows the user to
specifically and accurately define individual indentation locations on an image generated using in-situ
Scanning Probe Microscopy (SPM) imaging. The mathematical model adapted from Oliver and Pharr
[29] was used to calculate the sample hardness ( H ) and reduced Young’s modulus ( rE ). The reduced
modulus is defined by Equation (1).
2 21 11 s i
r s i
v v
E E E
(1)

23
The subscript i corresponds to the indenter material, the subscript s refers to the indented sample
material, and is Poisson’s ratio. For a diamond indenter probe, Ei is 1140 GPa and iis 0.07. ns = 0.3
was used as Poisson’s ratio of bone. The hardness is defined by the ratio of the maximum load to the
projected contact area,
maxPH
A (2)

24
Chapter 7: Results
Figure 22 shows the SPM image of the circumferential lamellae and osteons before and after
indentation. The indentation moduli and hardness results are summarized in Figures 23-25. In Figure 23,
we compared the moduli and hardness of different structural components (interstitial lamellae,
circumferential lamellae, osteons and t-osteons) from all three age groups.
One-way ANOVA combined with t-test was used to analyze the data. At p=0.05 level, there were
no significant differences between the different ages of interstitial bone. With the circumferential
lamella, there was a significant difference between the 12 and 42 month specimens, but not a significant
difference between 6 and 12 months. Osteon moduli were significantly different between the 6 and 42
month bone, but not significantly different between the 6 and 12 or the 12 and 42 month. For each
bone sub-microstructure, there was an increase in moduli and hardness with age. The thick lamella
layers always had higher moduli and hardness than the thin lamella layers, but at p=0.05 level, none of
the thick/thin differences were significant. Both thick and thin lamellae of the circumferential lamellar
bone demonstrated strong correlation to age of bone. The 42 month old samples had a 21% higher
modulus than the 12month samples and the 12-month old samples yielded an 11% higher modulus than
the 6month samples. The thin lamellae within the 42 month old bone showed a 23% increase from the
12 month bone, and the 12 month bone showed a 10% increase from the 6 month sample. The osteons
had lesser modulus increases with age. The thick lamellae in the 42 month old samples showed an 8%
increase in modulus from the 12 month samples and a 12% increase from the 6 to the 12 month
samples. Thin lamellae modulus increased 13% from 12 to 42 month and increased 11% from the 6
month to the 12 month samples. There is little to no effect on modulus by distance from osteon. This is
in agreement with Burket’s analysis on ape bone [44]. Interstitial bone showed the least amount of
change between different ages of bone. From 6 to 12 to 42 months, the thick lamella elastic modulus
only increased by 7% and 3%, respectively. The thin lamella elastic modulus increased by 10% and 8%,
respectively.
The hardness followed the same general trend as the modulus results, where there was an
increase in hardness with increasing age. Figure 24 shows the moduli and hardness values from the
circumferential lamellae and osteons vs. t-osteons of each sample tested under different loading
orientations. When comparing osteons (longitudinal indents) to t-osteons (transverse indents), the
osteons always had a significantly higher elastic modulus and hardness. The 6, 12, and 42 months
osteons had a 45%, 55%, and 36% higher elastic modulus than the t-osteons, respectively. The

25
circumferential lamella was always stiffer and harder in the longitudinal direction than the transverse
direction, but these differences were only significant at the p=0.05 level with the 6 month bone.
Besides the thick lamellae of circumferential lamellar bone, all dehydrated samples
demonstrated a significantly higher indentation modulus than the hydrated samples as shown in Figure
25. Particularly, the transversely indented structures (bright line, t-osteons) had a much higher modulus
when dry than wet. The percent increases from wet to dry for the bright line, thick lamella of t-osteon,
and thin lamella of t-osteon were 71%, 76%, and 110%, respectively. Osteons only showed a 23% and
33% increase in thick and thin lamella from wet to dry bone. The dehydrated interstitial bone had a 17%
higher modulus than the hydrated sample. The circumferential lamellar thick layers showed no
significant differences in modulus, but the thin layer yielded a 22% higher modulus when dehydrated.

26
Chapter 8: Discussion
The objective of this paper was to investigate the effect of several factors such as age, bone
type, hydrated/dehydrated condition and anisotropy (longitudinal versus transverse direction) on the
elastic moduli and hardness of sub-microstructural components of bone (single lamellae). This study is
not to designed quantify the local spatial variations in the mechanical properties of porcine cortical bone
as a complex function of factors such as age, orientation or physiological condition but to investigate in
the average sense the effect of these factors on the mechanical properties of various bone sub-
microstructures. This study was based on the assumption that bone is a linear elastic material [29]. Fan
et al. [37] demonstrated that, due to the anisotropic nature of bone tissue, the Oliver-Pharr method can
miscalculate the area of contact during the test. The test conditions were made as realistic as possible
by immersing samples in PBS solution; however, the viscoelastic/poroelastic characteristics of bone [40,
41] were not fully considered in the calculation of the properties. Considerations such as using an
increased hold period at peak load to help stabilize the materials creep response were used to try to
minimize some of the inherent viscoelastic error when using the Oliver and Pharr method of analysis. In
terms of experimental limitations, the heterogeneity of bone at single lamella level [51, 52] was not
considered in this study.
The main objective of this investigation was to study the effect of age on the mechanical
properties of the different individual microstructural components within bone, such as interstitial
lamellae, circumferential lamellae, osteons (concentric lamellae) and t-osteons. Nanoindentation was
successfully used to measure the indentation modulus and hardness of each component and the results
clearly indicated changes in both indentation modulus and hardness as a function of age. In general, the
cortical bone became stiffer and harder as the age of the animal increased. However, it is important to
note that this developmental effect was not uniform through the bone microstructure. Circumferential
lamella had the greatest change as a function of age, while interstitial bone had the least amount of
change as the bone developed. This may be due to the amount of mineral that is distributed throughout
the collagen matrix in different cortical bone structures as the bone is developing. It is known that
newly created structures, such as osteons or circumferential bone which is increasing radially, are less
mineralized and softer than bone structures which are older [51]. The mechanical properties of a
material are known to correlate to its structure and chemical composition and there are studies showing
the mechanical properties of bone are correlated with mineral content [19, 38].

27
In general, the moduli of dehydrated samples were significantly higher than those of the fully
hydrated samples with a 17% modulus increase in interstitial bone and 28% increase in osteonal bone.
This is consistent with previous observations in Goldstein et al. [17]who showed that dry bone is 22.6%
stiffer than the wet bone. For the t-osteon, a 93% higher modulus was measured when dehydrated,
showing a much greater effect than other components on hydration level. This suggests that the water
content within the Volkmann canal structure component was much higher than within the other
structural components. For the hardness characterization, tests on interstitial bone yielded a 17%
increase from the hydrated to the dehydrated condition, which agrees with Rho and Pharr [21], who
reported a 17% increase. It must be noted that there was a 25.6% average increase in modulus was
shown in the circumferential lamellar bone. This was in the range suggested by [53]. However, it
became obvious that the major contribution to this increase was from the bright line (71.5% increase)
while there were no significant differences between the moduli of thick and thin lamellae in hydrated or
dehydrated conditions. This variation of the modulus and hardness may be explained by the non-
uniform distribution of mineral content [19].
The properties of local components of cortical bone in the transverse direction were overall less
than those in the longitudinal direction. These observations are consistent with other studies
addressing measurements of anisotropy of bone using nanoindentation [15, 16, 20]. Although our
results showed that the hardness of interstitial bone was higher than that of osteonal bone, which is
consistent with other studies [17, 25, 26, 54], the stiffness values of these two types of bone were not
significantly different at any age. This could be due to the closeness in real values between the two
bone structures and the small sample size.
In this study, we introduce a new term, the t-osteon, to denote the osteon-like structures in
transverse direction (seen on the longitudinal place). One possible explanation is that some osteons may
not be perfectly aligned in the longitudinal direction, and the t-osteons which we observed in the
longitudinal cross-section samples were simply the projections of the osteon in the face as shown in
Figure 20. However, this explanation is challenged by the fact that there are large differences between
the mechanical properties of the t-osteons and osteons. Another possibility is that these t-osteons are
the concentric lamellae surrounding the Volkmann canals. MicroCT imaging could be done to
investigate the 3-D internal structure of canals in the bone and shed further light on these structures.
In conclusion, the nanoindentation results showed significant age-related changes in the
mechanical properties of the cortical bone sub-microstructural components. Drying the tissue resulted,

28
in general, in higher mechanical properties; however, the percent differences varied for each different
component within the microstructures. It should be note that these samples were only air dried for 24
hours, and many other studies have used alcohol to dehydrate their specimens and leave them to dry
for much longer time periods. It should be note that these samples were only air dried for 24 hours, and
many other studies have used alcohol to dehydrate their specimens and leave them to dry for much
longer time periods.
Future work could include using more samples and additional age groups and this information
could be combined with the results from the Fourier Infrared spectroscopy (FTIR), Raman and other
techniques to yield the chemical composition information such as mineral content and organic part
content to obtain a more comprehensive understanding of the age effect on the mechanical properties
of cortical bone at the sub-microscale. MicroCT can be used to analyze the voids and canals within the
cortical bone structures to calculate the porosity and characterize the canal network. The structural
information obtained by SEM, could provide further insight on correlations between the chemical
composition, structure, and mechanical properties of bone. The fundamental understanding of
structure-composition-property relations in bone at different structural scales should lead to improved
diagnostic tools for the prediction of the mechanical responses of normal versus diseased bones.

29
References 1. Jee, W.S.S., Integrated Bone Tissue Physiology: Anoatomy and Physiology, in Bone Mechanics:
Handbook, S.C. Cowin, Editor. 2001, CRC Press LLC. p. 5. 2. Bertazzo, S., C.A. Bertran, and J.A. Camilli, Morphological characterization of femur and parietal
bone mineral of rats at different ages. Key Engineering Materials, 2006. 309-311: p. 11-14. 3. Devulder, A., et al., Effect of age on local mechanical properties of haversian cortical bone.
Journal of Biomechanics, 2008. 41: p. S494. 4. Kotha, S.P. and N. Guzelsu, The effects of interphase and bonding on the elastic modulus of
bone: Changes with age-related osteoporosis. Medical Engineering and Physics, 2000. 22(8): p. 575-585.
5. Zioupos, P., C. Kaffy, and J.D. Currey, Tissue heterogeneity, composite architecture and fractal dimension effects in the fracture of ageing human bone. International Journal of Fracture, 2006. 139(3-4): p. 407-24.
6. Ager, J.W., et al., Deep-ultraviolet Raman spectroscopy study of the effect of aging on human cortical bone. Journal of Biomedical Optics, 2005. 10(3): p. 34012-1.
7. Ritchie, R.O., et al., Role of microstructure in the aging-related deterioration of the toughness of human cortical bone. Materials Science & Engineering C, Biomimetic and Supramolecular Systems, 2006. 26(8): p. 1251-60.
8. Wang, X., et al., Age-related changes of noncalcified collagen in human cortical bone. Annals of Biomedical Engineering, 2003. 31(11): p. 1365-71.
9. Wang, X. and S. Puram, The toughness of cortical bone and its relationship with age. Annals of Biomedical Engineering, 2004. 32(1): p. 123-135.
10. Zioupos, P., M. Gresle, and K. Winwood, Fatigue strength of human cortical bone: Age, physical, and material heterogeneity effects. Journal of Biomedical Materials Research - Part A, 2008. 86(3): p. 627-636.
11. McCalden, R.W., et al., Age-related-changes in the tensile properties of cortical bone- the relative importantce of changes in porosity, minerlization and microstructure. Journal of Bone and Joint Surgery-American Volume, 1993. 75A(8): p. 1193-1205.
12. Kotha, S.P. and N. Guzelsu, Tensile behavior of cortical bone: Dependence of organic matrix material properties on bone mineral content. Journal of Biomechanics, 2007. 40(1): p. 36-45.
13. Simkin, A. and G. Robin, Mechanical testing of bone in bending. Journal of Biomechanics, 1973. 6(1): p. 31-39.
14. Donald T. Reilly, A.H.B.a.V.H.F., The elastic modulus for bone. Journal of Biomechanics, 1975. 7: p. 271-275.
15. Fan, Z., et al., Anisotropic properties of human tibial cortical bone as measured by nanoindentation. Journal of Orthopaedic Research, 2002. 20(4): p. 806-810.
16. Rho, J.Y., et al., The anisotropic Young's modulus of equine secondary osteones and interstitial bone determined by nanoindentation. Journal of Experimental Biology, 2001. 204(10): p. 1775-1781.
17. Hoffler, C.E., et al., An application of nanoindentation technique to measure bone tissue lamellae properties. Journal of Biomechanical Engineering-Transactions of the Asme, 2005. 127(7): p. 1046-1053.
18. Xu, J., et al., Atomic force microscopy and nanoindentation characterization of human lamellar bone prepared by microtome sectioning and mechanical polishing technique. Journal of Biomedical Materials Research Part a, 2003. 67A(3): p. 719-726.

30
19. Tai, K.S., H.J. Qi, and C. Ortiz, Effect of mineral content on the nanoindentation properties and nanoscale deformation mechanisms of bovine tibial cortical bone. Journal of Materials Science-Materials in Medicine, 2005. 16(10): p. 947-959.
20. Swadener, J.G., J.Y. Rho, and G.M. Pharr, Effects of anisotropy on elastic moduli measured by nanoindentation in human tibial cortical bone. Journal of Biomedical Materials Research, 2001. 57(1): p. 108-112.
21. Jae-Young, R. and G.M. Pharr, Effects of drying on the mechanical properties of bovine femur measured by nanoindentation. Journal of Materials Science: Materials in Medicine, 1999. 10(8): p. 485-8.
22. Mittra, E., S. Akella, and Y.X. Qin, The effects of embedding material, loading rate and magnitude, and penetration depth in nanoindentation of trabecular bone. Journal of Biomedical Materials Research Part a, 2006. 79A(1): p. 86-93.
23. Fan, Z.F. and J.Y. Rho, Effects of viscoelasticity and time-dependent plasticity on nanoindentation measurements of human cortical bone. Journal of Biomedical Materials Research Part a, 2003. 67A(1): p. 208-214.
24. Zysset, P.K., et al., Elastic modulus and hardness of cortical and trabecular bone lamellae measured by nanoindentation in the human femur. Journal of Biomechanics, 1999. 32(10): p. 1005-1012.
25. Rho, J.Y., T.Y. Tsui, and G.M. Pharr, Elastic properties of human cortical and trabecular lamellar bone measured by nanoindentation. Biomaterials, 1997. 18(20): p. 1325-1330.
26. Rho, J.Y., et al., Elastic properties of microstructural components of human bone tissue as measured by nanoindentation. Journal of Biomedical Materials Research, 1999. 45(1): p. 48-54.
27. Hengsberger, S., et al., How is the indentation modulus of bone tissue related to its macroscopic elastic response? A validation study. Journal of Biomechanics, 2003. 36(10): p. 1503-9.
28. Tang, B., A.H.W. Ngan, and W.W. Lu, An improved method for the measurement of mechanical properties of bone by nanoindentation. Journal of Materials Science: Materials in Medicine, 2007. 18(9): p. 1875-1881.
29. Oliver, W.C. and G.M. Pharr, An Improved Technique for Determining Hardness and Elastic-Modulus Using Load and Displacement Sensing Indentation Experiments. Journal of Materials Research, 1992. 7(6): p. 1564-1583.
30. Fan, Z.F., et al., Mechanical properties of OI type III bone tissue measured by nanoindentation. Journal of Biomedical Materials Research Part a, 2006. 79A(1): p. 71-77.
31. Silva, M.J., et al., Nanoindentation and whole-bone bending estimates of material properties in bones from the senescence accelerated mouse SAMP6. Journal of Biomechanics, 2004. 37(11): p. 1639-1646.
32. Hengsberger, S., A. Kulik, and P. Zysset, Nanoindentation discriminates the elastic properties of individual human bone lamellae under dry and physiological conditions. Bone, 2002. 30(1): p. 178-184.
33. Oyen, M.L., Nanoindentation hardness of mineralized tissues. Journal of Biomechanics, 2006. 39(14): p. 2699-2702.
34. Bembey, A.K., et al. Nanoindentation measurements of bone viscoelasticity as a function of hydration state. in 2005 MRS Fall Meeting. 2005. Boston, MA, United States: Materials Research Society, Warrendale, PA 15086, United States.
35. Oyen, M.L., Poroelastic nanoindentation responses of hydrated bone. Journal of Materials Research, 2008. 23(5): p. 1307-1314.
36. Ortiz, C., et al., Structural and nanoindentation studies of stem cell-based tissue-engineered bone. Journal of Biomechanics, 2007. 40(2): p. 399-411.

31
37. Fan, Z., J.Y. Rho, and J.G. Swadener, Three-dimensional finite element analysis of the effects of anisotropy on bone mechanical properties measured by nanoindentation. Journal of Materials Research, 2004. 19(1): p. 114-123.
38. Gupta, H.S., et al., Two different correlations between nanoindentation modulus and mineral content in the bone-cartilage interface. Journal of Structural Biology, 2005. 149(2): p. 138-148.
39. Rho, J.Y., et al., Variations in the individual thick lamellar properties within osteons by nanoindentation. Bone, 1999. 25(3): p. 295-300.
40. Tang, B., A.H.W. Ngan, and W.W. Lu, Viscoelastic effects during depth-sensing indentation of cortical bone tissues. Philosophical Magazine. 86(33-35): p. 5653-66.
41. Bembey, A.K., et al., Viscoelastic properties of bone as a function of hydration state determined by nanoindentation. Instrumented Nanoindentation, 2006. 86(33-35): p. 5691-5703.
42. Lewis, G. and J.S. Nyman, The use of nanoindentation for characterizing the properties of mineralized hard tissues: State-of-the art review. Journal of Biomedical Materials Research - Part B Applied Biomaterials, 2008. 87(1): p. 286-301.
43. Ulm, F.J., et al., Statistical indentation techniques for hydrated nanocomposites: concrete, bone, and shale. Journal of the American Ceramic Society, 2007. 90(9): p. 2677-92.
44. Burket, J., et al., Microstructure and nanomechanical properties in osteons relate to tissue and animal age. Journal of Biomechanics, 2011. 44(2): p. 277-284.
45. Isaksson, H., et al., Rabbit cortical bone tissue increases its elastic stiffness but becomes less viscoelastic with age. Bone, 2010. 47(6): p. 1030-1038.
46. Ferguson, V.L., et al., Bone development and age related bone loss in make C57BL/6J. Bone, 2003. 33(3): p. 387-398.
47. Miller, L.M., et al., Accretion of bone quality and quality in the developing mouse skeleton. Journal of Bone and Mineral Research, 2007. 22(7): p. 1037-1045.
48. Kavukcuoglu, N.B., et al., Osteopontin deficiency and aging on nanomechanics of mouse bone. Journal of Biomedical Materials Research - Part A, 2007. 83(1): p. 136-144.
49. Tumbleson, M.E.a.L.B.S., ed. Advances in Swine in Biomedical Research. Vol. 2. 1996, Plenum Publishing Corporation: New York. 648.
50. Yoon, Y.J. and S.C. Cowin, An estimate of anisotropic poroelastic constants of an osteon. Biomechanics and Modeling in Mechanobiology, 2008. 7(1): p. 13-26.
51. Gupta, H.S., et al., Mechanical modulation at the lamellar level in osteonal bone. Journal of Materials Research, 2006. 21(8): p. 1913-1921.
52. Kuangshin, T., et al., Nanoscale heterogeneity promotes energy dissipation in bone. Nature Materials, 2007. 6(6): p. 454-8.
53. Reilly, D.T. and A.H. Burstein, Review Article - Mechanical-Properties of Cortical Bone. Journal of Bone and Joint Surgery-American Volume, 1974. A 56(5): p. 1001-1022.
54. Rho, J.Y., et al., Microstructural elasticity and regional heterogeneity in human femoral bone of various ages examined by nano-indentation. Journal of Biomechanics, 2002. 35(2): p. 189-198.

32
Appendix
Figure 1: Indents performed in the longitudinal direction on the transverse plane.
Longitudinal sample
(Indents on transverse plane)

33
Figure 2: Optical image of circumferential lamella nanoindentation site and Scanning Probe Microscopy
Image. Sample 14, 30 month old femur.

34
Figure 3: Optical image of interstitial bone nanoindentation site and Scanning Probe Microscopy Image.
Sample 15, 48 month femur.

35
Figure 4: Optical image of osteon nanoindentation site and Scanning Probe Microscopy Image.
Sample 14, 30 month femur.

36
Figure 5: Elastic modulus and hardness of 6 ages of bone of each structure tested. Error bars represent
standard error between samples.

37
Figure 6: Elastic modulus and hardness of the bone structures as a function of age. Error bars are not
included due to clutter.
Figure 7: Table analysis of elastic modulus in Osteons at different distances from the Haversian canal.
Elastic Modulus
3.5 m 3.5 s.d. 6 m 6 s.d. 12 m 12 s.d. 30 m 30 s.d. 48 m 48 s.d.
1 (Close) 14.75 2.16 17.49 4.58 18.64 4.71 25.47 3.82 19.50 1.51
2 (Medium) 15.62 2.29 17.32 2.69 18.24 2.55 23.89 2.74 18.77 0.28
3 (Far) 17.36 2.30 17.39 3.32 20.53 0.06 23.80 2.48 21.18 4.06

38
Figure 8: Optical image of indentation grid on 30 month bone, including osteons and interstitial bone.
Figure 9: SEM Backscatter image of the four osteons and interstitial bone indented with a 10x10 grid
pattern on 30 month femur. Elastic modulus values for each indent are over the image. Gradients of
blue represent higher modulus, while gradients of red represent lower modulus.
21.7 12.9 18.2 23.9 28.4 29.9 24.9 15.4 20.2 23.7
18.2 19.8 11.6 11.8 24.4 24.2 11.5 13.2 18.4 18.5
16.3 19.2 23.0 20.9 14.7 20.2 21.6 21.1 19.9 16.6
16.1 20.3 22.0 18.4 8.7 19.8 18.7 20.9 10.3 13.9
15.0 19.6 23.1 15.8 20.9 21.2 23.5 24.6 23.8 18.2
14.0 6.6 20.2 22.6 18.7 19.3 18.7 21.3 22.3 18.6
9.5 19.1 25.6 25.5 18.1 8.3 18.7 17.6 17.7 15.8
18.6 24.4 22.4 22.1 17.9 19.4 19.8 17.7 22.4 18.3
23.2 20.9 17.0 13.8 16.3 19.9 20.8 18.7 21.2 21.2
20.5 18.1 18.4 17.1 15.3 19.4 22.1 20.0 19.7 21.6
Osteon 1
Osteon 2
Osteon 3 Osteon 4
Interstitial
Bone
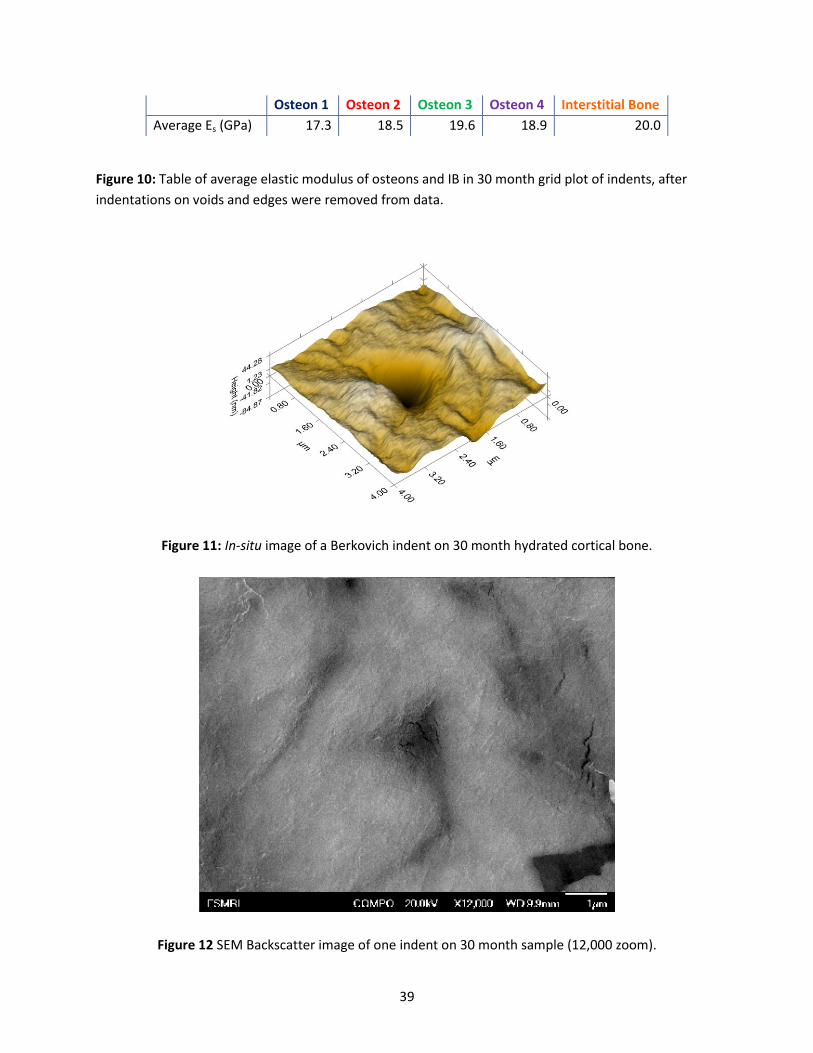
39
Osteon 1 Osteon 2 Osteon 3 Osteon 4 Interstitial Bone
Average Es (GPa) 17.3 18.5 19.6 18.9 20.0
Figure 10: Table of average elastic modulus of osteons and IB in 30 month grid plot of indents, after
indentations on voids and edges were removed from data.
Figure 11: In-situ image of a Berkovich indent on 30 month hydrated cortical bone.
Figure 12 SEM Backscatter image of one indent on 30 month sample (12,000 zoom).
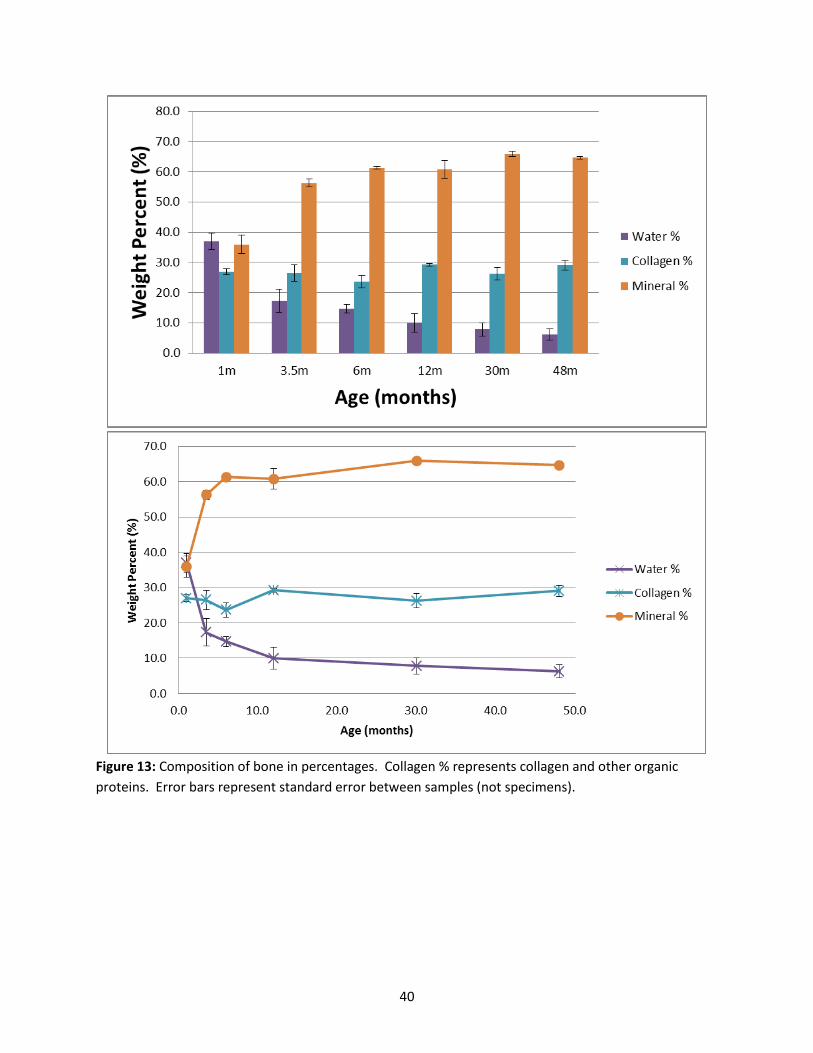
40
Figure 13: Composition of bone in percentages. Collagen % represents collagen and other organic
proteins. Error bars represent standard error between samples (not specimens).

41
Figure 14: Composition of cortical bone not including water.
Figure 15: Bone composition with respect to position. Error bars represent error between specimens.

42
Figure 16: Combined elastic modulus as a function of age with Composition as a function of age.

43
Bone Age
Hydration Condition
Test Site
6 month
Hydrated
6 month
Dehydrated
12 month
Hydrated
42 month
Hydrated
42 month
Dehydrated
T L T L T L T L T L
Interstitial Bone 72 72 72 36
CL
Bright line 20 9 10 9 9
Thick lamellae 36 18 36 12 36 18 17
Thin lamellae 36 18 36 11 36 18 14
Osteon
Thick lamellae 80 20 80 80 36
Thin lamellae 62 20 62 62 21
T-Osteon
Thick lamellae 36 36 36 20
Thin lamellae 24 24 24 20
Total indentations 286 116 40 295 93 286 105 124 53
Figure 17: Summary of nanoindentation experiments: location of each test site and number of
indentations placed at each location.

44
Figure 18: Longitudinal and transverse cross-section sample positions - shaded region indicates surface
subjected to nanoindentation.
Figure19: Optical micrographs taken with at 10x showing structure of osteons, interstitial and
circumferential lamellae, and bright line structures.
Longitudinal sample
(Indents on transverse plane)
Transverse sample
(Indents on longitudinal plane)

45
Figure 20: Sketch of the possible relationship between an osteon and t-osteon.
Figure 21: Optical images comparing osteon to t-osteon. Below the optical images are in-situ images
obtained from the nanoindentor tip scanning the surface.
Cutting Plane (longitudinal cross-section)
Osteon
42 month osteon
(longitudinal)
42 month t-osteon
(transverse)

46
Figure 22: Topographical 40μm SPM images of tested areas of circumferential lamellar dense zone and
osteonal bone. A. Circumferential lamellae before indentations; B. Osteon layers before indentations; C.
Circumferential lamellae after indentations; D. Osteon layers after indentations. The dark brown
triangular shaped marks are the residual indent impressions.

47
Figure 23: Indentation results illustrating the change in mechanical properties as a function of structural
component and age of bone. Standard error used as error bars.
Figure 24: Indentation results showing change in mechanical properties at different structural locations
at a sub-micro scale as a function of indentation orientation. Error bars indicate standard error.

48
Figure 25: Indentation results showing mechanical properties as a function of structural location for 42
month old bone in hydrated and dehydrated conditions. Error bars indicate standard error between
samples.
t-Osteon Osteon Circumferential Lamellae IB
t-Osteon Osteon Circumferential Lamellae IB


![Porcine Epidemic Diarrhea [Autosaved]](https://img.pdfslide.us/doc/110x75/577c808c1a28abe054a92a69/porcine-epidemic-diarrhea-autosaved.jpg)