Embed Size (px)
Citation preview
INVESTIGATION INTO THE APPLICATION AND PERFORMANCEOF CONSTRUCTED WETLANDS
FOR WASTEWATER TREATMENT IN SOUTH AFRICA
by
A WOOD
STEFFEN, ROBERTSON AND KIRSTEN CE (PTY) LTD
Report to the Water Research Commission
WRC Report No 416/1/99ISBN 1 86845 515 7

ACKNOWLEDGEMENTS
Steering Committee:
Mr HC Chapman Water Research CommissionDr S A Mitchell Water Research CommissionMr AL Batchelor CSIRMr D De Haas Umgeni WaterMr L Bredenhaan DWA&FMr P Pybus Stewart Scott IncProf C Breen Inst. Natural ResourcesMr D Huyser Water Research Commission
Additional Acknowledgements:
Mr G Borain Umgeni WaterMr D Human Laubscher Human & Lombard CEMr PGJ Meiring Wates Meiring and Barnard CEMr R Hoffman Wates Meiring and Barnard CEMr D Cassel Lethlabile Town CouncilMr D van der Spuy Ninham Shand CEMr F Loubscher Kruger National ParkMr F Gerber Kruger National ParkCydna LaboratoriesUmgeni Water Laboratories
The Water Research Commission (WRC) is acknowledged for the financial support provided for theinvestigation. The IAWQ Specialist Group on Macrophytes in Water Pollution Control areacknowledged for the willing provision of reports and information on the application andperformance of Constructed Wetlands in water pollution control internationally.

INVESTIGATION INTO THE APPLICATION AND PERFORMANCE OFCONSTRUCTED WETLANDS FOR WASTEWATER TREATMENT
IN SOUTH AFRICA
EXECUTIVE SUMMARY
There are approximately 70 Constructed Wetland systems in operation in South Africa, the greaternumber of which have been constructed for domestic wastewater treatment in small communityapplications. Constructed Wetlands are also being applied at several mining and industrial sites, aswell as for stormwater and urban catchment management, riverine rehabilitation and protection,groundwater recharge and development of urban nature reserves and ecological sites.
The majority of operating Constructed Wetlands in South Africa appear to have been designed basedupon reports on overseas systems, or simple rule-of-thumb assumptions. In many cases this approachhas resulted in systems failing to meet design objectives which is seen as limiting the morewidespread acceptability of the technology. To address this issue the Water Research Commissionsponsored the project to Investigate the Application and Performance of Constructed Wetlands forWastewater Treatment in South Africa.
The project identified a number of established Constructed Wetlands treating domestic wastewaterswhich were investigated in some detail. This was undertaken to (I) provide an overview of how thesystems perform relative to their design objectives, to (ii) identify factors affecting the performanceof alternative configurations and operational approaches, to (iii) assess opportunities for improvingthe relative performance of the different treatment approaches, and to (iv) provide generalrecommendations for the future implementation of the technology in South Africa.
The investigation has confirmed that there have been flaws in the design and operation ofConstructed Wetlands for Wastewater Treatment in South Africa. This has largely been due to ageneral lack of understanding of the mechanisms and processes of wastewater treatment through aConstructed Wetland system. Despite the plants being perceived to be a primary treatmentmechanism, their contribution is generally low, whereas the configuration and operating of thewetland is of significantly greater importance. The primary performance limitation is flow controlthrough the system. Low permeability of the bed media tends to encourage surface flow rather thanfiltration through the bed for systems internationally designed for subsurface flow, and similarly,surface flow systems demonstrate significant short-circuiting. These factors minimise availableresidence times and contact opportunity for optimal treatment.
Despite less than optimal flow conditions and limited plant contributions to pollutant removal, theSouth African systems do demonstrate significant potential for wastewater treatment. Surface flow
systems receiving secondary sewage can achieve removals of COD and SS up to 20 g/m2/d, NH3 andNO3 removal up to 1.5 and 6.0 g/m2/d respectively, but limited pathogen removal of 99%, and lowphosphate removal. Subsurface flow soil systems are severely limited by permeability, but whereflow is maintainable for secondary wastewaters, COD, SS, NO3 and PO4 removal can be in excessof 85%, and pathogen removal of 105 fold, but NH3 removal is low, <30%, due to poor oxygentransfer to the rootzone. Subsurface flow gravel beds can achieve high COD removal rates atloadings up to 100 g COD/m2/d with settled sewage, acting as anaerobic filters. Secondary units arethen required to polish residual organic, nutrients and pathogens.
Engineering design to account for hydraulic limitations can provide a new generation of ConstructedWetlands better able to meet their treatment objectives. Surface flow systems, whether open bed orchannel configuration, may be improved by provision of alternate shallow and deep water areas, andintermediate berms to assist flow and velocity buffering. Multiple species planting in defined areasthrough which the wastewater must flow assists contact opportunities for treatment by physicalfiltration, adsorption and absorption and biological treatment by attached microorganisms.Subsurface flow systems are limited by the permeability of the selected media. For horizontal flowsystems these requires low width to length ratios and effective hydraulic gradients, or in a verticalmode, capacity to effectively distribute the water over the bed surface, and to collect the treatedwastewater from subsurface drains over the full bed area. In each system configuration, performancemay be improved by alternate feeding and draining to balance flow distribution and enhance aerationconditions within the beds, particularly for N removal.
In general there is a move to multiple unit systems which may include subsurface flow constructedwetland, surface flow marshes, ponds, grasslands and forest or shrub areas as required to meet thetreatment and environmental conservation objectives. Mechanical units, such as biological tricklingfilters for ammonia removal, or recirculating sand filters for pathogen removal, may be requiredwhere land is restricted or treatment performance needs to be efficiently controlled.
In conclusion, Constructed Wetlands can provide a viable and effective form of wastewatertreatment. A primary consideration is the need to control the hydraulics to optimise retention timesand contact opportunities for effective treatment. Multiple units, and integrated systems, provide anopportunity to tailor the system to many treatment and ecological objectives.

Areas of the technology for which further research can be of benefit includes:
* Development of complete integrated Constructed Wetland wastewater treatment packages,including nutrient removal, for the full range of urban and rural communities.
* Development of models for the short and long-term processes by which nutrients, organic andmetals can be immobilised and/or transformed during passage through the Wetland systemsunder different operational and maintenance programmes
* Establishment of appropriate species diversity for single and integrated Wetland systems(i.e. not a Frogmouths or Typha Sp monoculture)
* Identification and development of uses and viable markets for Wetland products
* Expansion of the concepts developed for domestic wastewater treatment to the wider field ofenvironmental protection, pollution control and conservation.

C O N T E N T S
SECTION & DESCRIPTION PAGE
1 INTRODUCTION AND SCOPE 1
2 DEVELOPMENT OF CONSTRUCTED WETLAND TECHNOLOGY IN S.A. . . . 2
3 APPLICATION OF CONSTRUCTED WETLANDS 3
4 CONSTRUCTED WETLAND TECHNOLOGICAL APPROACHES 4
4.1 Conventional Configurations: Surface Flow and Subsurface Flow 4
4.2 Integrated Systems 6
5. ADVANTAGES AND CONSTRAINTS OF CONSTRUCTED WETLANDS 13
6. SOUTH AFRICAN CONSTRUCTED WETLAND SYSTEMS 15
6.1 Mpophomeni 15
6.2 Letlhabile 15
6.3 Ladybrand 15
6.4 Bethlehem 15
6.5 Kruger National Park 16
6.6 Pilanesburg Game Reserve 16
6.7 Pietersburg Truck Stop 16
6.8 Klipdrift 16
6.9 Middelburg 16
6.10 Reddersburg 17
6.11 Kranskop 17
6.12 Fnemansheim 17
6.13 Warmbaths Cotton Gin 17
6.14 Karbochem Newcastle 17
6.15 Midrand Residential Home 18
6.16 Mount Grace Hotel 18
6.17 CSIR Campus Wetland 18
6.18 Potchefstroom 18
6.19 Makwane 19
6.20 Umzimkulu Sugar Mill 19
6.21 Felixston Sugar Mill 19

6.22 Milnerton 19
6.23 Oil Industry Wetlands 19
6.24 Bannockburn Minewater 20
6.25 Van Dykes Drift Mine 20
6.26 Atlantis Groundwater Recharge Wetland 20
6.27 Sandton Urban Wetlands 20
7. PERFORMANCE REVIEW OF SELECTED CONSTRUCTED WETLAND SYSTEMS
21
7.1 Mpophomeni 21
7.1.1 System Configuration 21
7.1.2 Wastewater Treatment Performance 21
7.1.3 Hydraulic Characteristics 26
7.1.4 Phosphate Partitioning 27
7.1.5 Pilot Studies 27
7.1.6 Vegetation Development 28
7.1.7 Management 28
7.1.8 Management Recommendations 29
7.2 Letlhabile 29
7.2.1 System Configuration 29
7.2.2 Wastewater Treatment Performance 30
7.2.3 Hydraulic Characteristics 32
7.2.4 Solids Accumulation 32
7.2.5 Vegetation Development 33
7.2.6 Management 33
7.2.7 Management Recommendations 34
7.3 Ladybrand 35
7.3.1 System Configuration 35
7.3.2 Wastewater Treatment Performance 35
7.3.3 Hydraulic Characteristics 39
7.3.4 Surface Solids Accumulation 40
7.3.5 Vegetation Development 40
7.3.6 Management 41
7.3.7 Management Recommendations 42

7.4 Bethlehem 43
7.4.1 System Configuration 43
7.4.2 Wastewater Treatment Performance 43
7.4.3 Hydraulic Characteristics 48
7.4.4 Surface Solids Accumulation 49
7.4.5 Vegetation Development 49
7.4.6 Management 50
7.4.7 Management Recommendations 50
7.5 Kruger National Park 51
7.5.1 System Configuration 51
7.5.2 Wastewater Treatment Performance 52
7.5.3 Crocodile Bridge Wetland System 53
7.5.4 Hydraulic Characteristics 53
7.5.5 Vegetation Development 54
7.5.6 Management 54
7.5.7 Management Recommendations 55
8. DISCUSSION OF SOUTH AFRICAN EXPERIENCES 56
9. GUIDELINES FOR THE IMPLEMENTATION OF CONSTRUCTED WETLANDS58
9.1 Primary Wastewater Treatment 58
9.2 Maximum Loading 58
9.3 Bed Depth and Media 58
9.4 Inlet Distribution 58
9.5 Terracing 59
9.6 Parallel Cells 59
9.7 Vertical Flow 59
9.8 Secondary Wastewater Treatment 59
9.9 Secondary Organic Loading 60
9.10 Tertiary Wastewater Treatment 60
9.11 Hydraulic Control 60
9.12 Plants 61
9.13 System Monitoring 62
10 CHALLENGES/FUTURE RESEARCH OPPORTUNITIES 62

APPENDIX
SECTION AND DESCRIPTION PAGE
A. WASTEWATER POLLUTANT REMOVAL MECHANISMS 64
A.I Treatment Performance of Wetland Systems 64
A.2 Organic Load COD/BOD 66
A.3 Suspended solids 66
A.4 Phosphate 67
A.5 Nitrogen 68
A.6 Pathogen Removal 69
B. ROLE OF THE PLANTS AND BED MEDIA IN WASTEWATER TREATMENT 70B.I Contribution of the Wetland Plants To Wastewater Treatment 70
B.2 Contribution of the Bed Media to Wastewater Treatment 71
B.3 Stability of Constructed Wetland System in Wastewater Treatment 71
C. CONSTRUCTED WETLAND DESIGNED MODELS 72
D. DESIGN GUIDELINES 76
D.I Siting 76
D.2 Layout 76
D.3 Organic Loading 76
D.4 Hydraulic Loading 77
D.5 Detention Time 77
D.6 Evaportranspiration/Infiltration 78
D.7 Pretreatment 78
D.8 Aspect Ratio 78
D.9 Water Depth in Free Water Systems 79
D.10 Subsurface Flow System Bed Depth 79
D.I 1 Media for Subsurface Flow Systems 79
D. 12 Inlet Arrangement 80
D.13 Bed Slope 81

SECTION AND DESCRIPTION PAGE
D.14 Outlet Control 81
D.15 Plants 81
D.16 Planting 82
D.17 Construction 82
D.18 Operation 83
D.19 Management Opportunities 86
D.19.1 Management Aspects 86
D.19.2 Monitoring 86
D.19.3 Process Performance and Control 87
D.19.4 Fate of Specific Constituents 87
D.19.5 Development of Database 88
D.20 Cost of Constructed Wetland Treatment Systems 88
BIBLIOGRAPHY 93

TABLES
SECTION AND DESCRIPTION PAGE
Table 1 Application of Constructed Wetlands Internationally 3
Table 2 South African Application of Constructed Wetlands 4
Table 3 Process Criteria for Constructed Wetlands 5
Table 4 Performance of the Pilot Integrated Wetlands/Trickling Filter 7
Table 5 COD Removal Performance of 3 Stage Integrated Wetland System 8
Table 6 Treatment Performance of Chinese Integrated Wetland System 8
Table 7 Southern African Constructed Wetland Systems 14
Table 8 Wastewater Treatment Performance of Mpophomeni Constructed Wetland 24
(Initial 5 year period)
Table 9 Wastewater Treatment Performance of Mpophomeni Constructed Wetland 24
(Indicating quality of overflow and underflow)
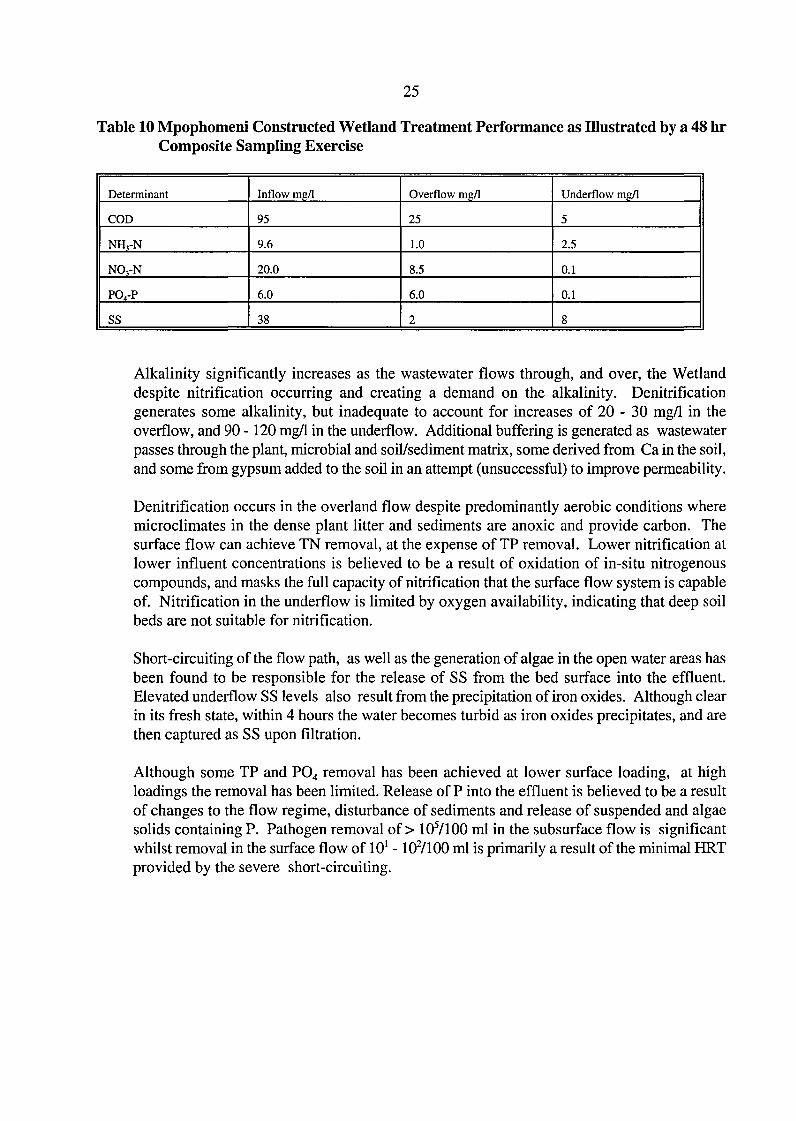
Table 10 Mpophomeni Constructed Wetland Treatment Performance as Illustrated by a 48 hr
Composite Sampling Exercise 25
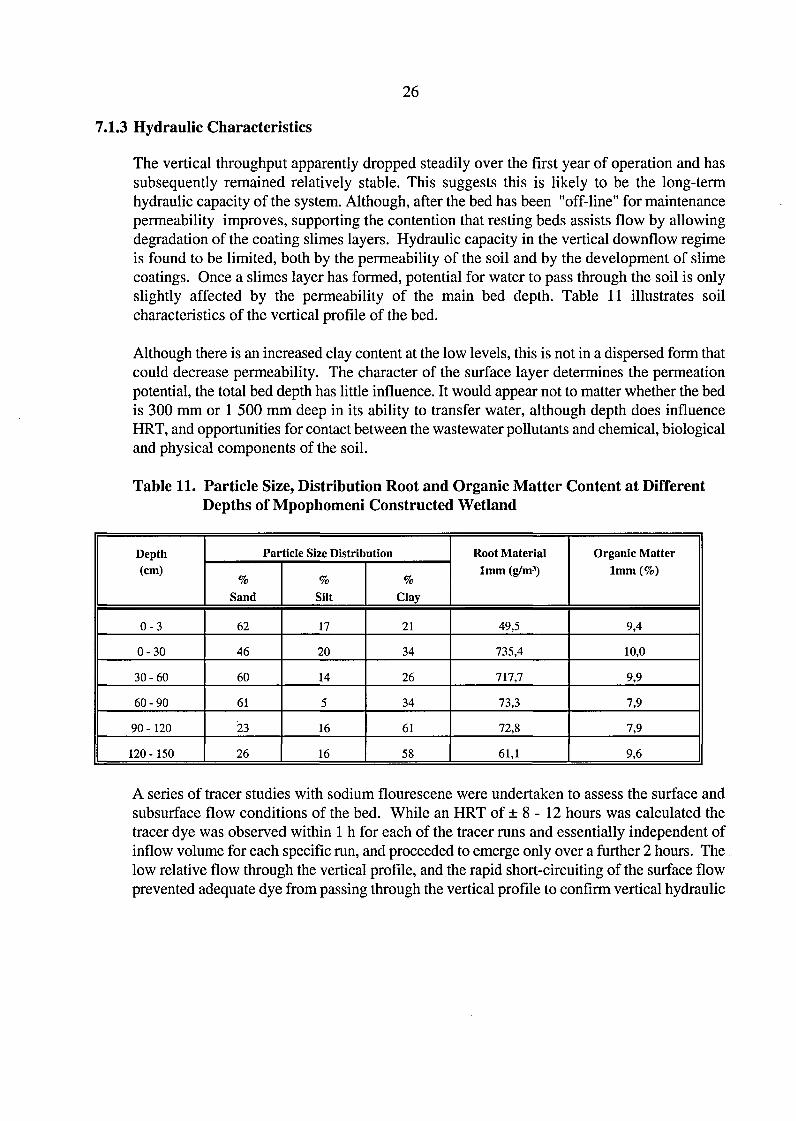
Table 11 Particle Size, Distribution Root and Organic Matter Content at Different Depths of
Mpophomeni Constructed Wetland 26
Table 12 Distribution and Partitioning of Phosphorous in Mpophomeni Constructed Wetland
27
Table 13 Treatment Performance Of Letlhabile Constructed Wetland System Over 2 year Period
30
Table 14 Treatment Performance of Letlhabile Constructed Wetland System Medium Influent
NH3-N (mg/1) 31
Table 15 Treatment Performance of Letlhabile Constructed Wetland High Influent NH3-N (mg/1)
31
Table 16 Performance of Ladybrand Constructed Wetland System 38
Table 17 Spot Sampling of Individual Wetland Cell Outlet Points of Ladybrand Constructed
Wetland System 38
Table 18 Microbiological Quality of Individual Wetland Cell Outline of Ladybrand Constructed
Wetland System 38
Table 19 Performance of Bethlehem Wetland System (combined effluent from beds 1-5) . . 44
Table 20 Bethlehem Constructed Wetland Outlet PO4-P and Flow Volume Compared to Inflow
PO4-P 47
Table 21 Microbiological Analysis of Bethlehem Constructed Wetland System 47
Table 22 Performance of 3 Kruger Park Constructed Wetland Systems Receiving Septic Tank
Effluent 53
Table 23 Challenges for Future Development of Constructed Wetlands for Wastewater Treatment
and Pollution Control 62

Al Regression Analysis of FWS Constructed Wetland Systems Performance 64
A2 Treatment Performance of USA Constructed Wetland Systems 64
A3 Treatment Performance of Dutch Surface Flow Constructed Wetland Systems . . . 65
A4 Treatment of European Subsurface Flow Constructed Wetland Systems 65
A5 Treatment Performance of Vertical Flow Constructed Wetland Systems 65
A6 Treatment Performance of Gavel Bed Hydroponic Horizontal Flow Constructed Wetland
System 65
Bl Uptake of N and P by Three Common Wetland Species 71
Cl Hydraulic Conductivity and Reaction Rates for Subsurface Flow Media Types . . . 74
Dl Soil Physical Characteristics 80
D2 Unpredictable System Disturbances for Constructed Wetlands Treating Wastewaters84
D3 Predictable System Disturbances for Constructed Wetlands Treating Wastewaters 85
D4 Operational Issue - mosquito control 87
D5 Operational Issue - vegetation control 87
D6 Monitoring Parameters for Constructed Wetland Systems 89
D7 Relative Comparison of Cost, Operation and Treatment for Various Constructed Wetland
System Configurations 90
D8 Sub-Surface Flow Wetland - Construction Costs 91
D9 Surface Flow Wetland - Construction Costs 92

FIGURES
PAGE
Figure 1 Cutaway perspective of a Constructed Wetland System 9
Figure 2 Details of reed and crop beds at Abu Attwa Ismailia, Egypt 10
Figure 3 Cresset House Constructed Wetland System. Plan View 11
Figure 4 Cresset House Constructed Wetland System. Side View 11
Figure 5 Decision Support Tree for Constructed Wetland Treatment System Options 12
Figure 6 Mpophomeni Constructed Wetland Plan and Cross Section 23
Figure 7 Letlhabile Sewage Treatment and Constructed Wetland System 36
Figure 8 Ladybrand Sewage Treatment and Constructed Wetland System Schematic 37
Figure 9 Ladybrand Constructed Wetland Cross-Section 45
Figure 10 Bethlehem Constructed Wetland System 46

INVESTIGATION INTO THE APPLICATION AND PERFORMANCEOF CONSTRUCTED WETLANDS IN WASTEWATER
TREATMENT IN SOUTH AFRICA
INTRODUCTION AND SCOPE
Constructed Wetlands in wastewater treatment and pollution control have now been inoperation internationally for over 40 years with several thousand systems in operation aroundthe world, and similarly several thousand articles in scientific and popular press on the subject(Kadlec 1994). These generally demonstrate that Constructed Wetlands can form an effectiveand adaptable treatment option with potential to receive almost any contaminated water thatis treatable by biological and physico-chemical means.
Despite the acknowledged successes of the technology, the inability of many systems toperform as efficiently as intended can largely be related to a lack of understanding of themechanisms by which Constructed Wetland systems actually function, and how these may bebest managed to meet a specific treatment objective (Wood 1994).
There are approximately 70 operating Constructed Wetlands in South Africa. These arepredominantly for the treatment of domestic wastewater where the approach has found anacceptance in the treatment of sewage from small communities, and particularly for theaccommodation facilities in the National Parks, especially the Kruger National Park.Variations of the technology are also utilised for polishing of oxidation pond effluents andconventional secondary treated wastewaters to meet specific final effluent quality objectives.Further applications include several industrial and agricultural effluents, contaminatedmine waters and stormwater runoffs, ground water recharge, riverine protection and for theenvironmental enhancement of urban catchments.
Although there are a number of operating Constructed Wetlands in South Africa there has beenlittle performance data generally available to assist in the development of design andoperational guidelines suitable to the South African wastewater characteristics, climate andtreatment objectives. The majority of the installed systems appear to have been designed basedupon reports on overseas systems, or simple rule-of-thumb assumptions.
The Water Research Commission (WRC) sponsored investigation was intended to reviewinternational application and performance information on the technologies and relate theinternational experiences to what has, and is being established in South Africa. It was alsointended to review how these systems are designed, operated and perform, and what lessonscan be learnt for the further development and improvement of design and operational practicesto improve treatment efficiency and reliability for future systems.

DEVELOPMENT OF THE CONSTRUCTED WETLAND TECHNOLOGYIN SOUTH AFRICA
The application of Constructed Wetlands in waste water treatment in South Africa was initiallystimulated by the need to remove residual nutrients from secondary treated domestic andindustrial effluents. Surface flow Constructed Wetland channels established at Giyani,NkowaKowa, Letlhabile and Newcastle in the early, to mid, 1980's provided a relatively simplemeans of polishing the wastewaters after more conventional secondary treatment. Thereappears to have been little published design criteria for such systems for nutrient polishing, andtheir application was an innovative development of the conventional maturation pond systems.
During this period the Constructed Wetland technology in Europe was tending to developsystems based on filtration of the wastewater through a porous media (soil or gravel) in whichthe aquatic plants were established (Alexander 1986). The flow of wastewater in a subsurfaceflow mode resembling an expanded French drain or a horizontal trickling filter, rather thanponded surface flow approach of the local channels.
The construction of the Mpophomeni Constructed Wetland in KwaZulu Natal in 1985, toremove phosphorus from Biological Trickling Filter effluent, represents the first seriousattempt in South Africa to adapt the application of subsurface flow Constructed Wetlandsystems. Specific consideration was given to the design and operation of the system to ensurethe effluent passes through the specially selected iron rich soil media with the intention forphosphate to be immobilised in the soil as the effluent passed through the Wetland.
Whilst several full-scale systems were being implemented in the early 1980's, local researchof the development of the technology was only in its infancy. The University of Orange FreeState were investigating the polishing of oxidation pond waters through sand and gravelsubsurface flow systems (Wrigley 1988). The University of Witwatersrand produced acomprehensive review entitled 'Wetlands in Municipal Wastewater Treatment' (Rogers 1985),and subsequently established a Constructed Wetland pilot plant at Johannesburg's Olifantsvleisewage works where the ability of nominally natural Wetland configurations were studied fornutrient and pathogen removal potential. The units were also used to assess floating andsubmerged Wetland systems, and the development of plant communities in response toinundation with secondary effluents (Rogers 1990).
Research at the Council for Scientific and Industrial Research (CSIR) in Pretoria from 1985has investigated the importance of the roles of the primary components of the Wetland system:(I) media: soil, gravel, gold slimes, power station and coal ash and combinations thereof;(ii) plants: kikuyu grass, sedges, rushes, reeds and tall grasses;(iii) wastewater type: screened primary domestic sewage, effluents from anaerobic andoxidation ponds, biofilter and activated sludge systems, industrial cooling water, petrochemicaland septic tank effluent. Research has also pursued integrated Wetland units (surface andsubsurface flow) with high rate algal ponds, oxidation ponds, meadows (overland flow),

nitrification columns and low rate anaerobic sludge blanket and anaerobic contact reactors.(Wood 1988, 1990; 1991; Batchelor 1990,1994,1996).
Witwatersrand University has undertaken student projects investigating the role of Wetlandsin acid mine drainage treatment (Fourie 1994), and the Rand Afrikaans University hasinvestigated the accumulation of heavy metals from mining and runoff waters in Wetlandsystems (De Wet 1990; Van der Merwe 1990). The University of Potchefstroom hasinvestigated the ability of a Constructed Wetland system to polish secondary activated sludgeeffluent from an explosives factory, and the microbiology associated with the system (van derWalt 1995), whilst the Universities of Natal and Cape Town and Port Elizabeth, amongstothers, and a number of colleges and schools have had various projects investigating thepotential of Wetland systems in water pollution control.
There has, and is, therefore significant academic and practical interest in Constructed Wetlandsas a technology for wastewater treatment in South Africa.
APPLICATION OF CONSTRUCTED WETLANDS IN SOUTH AFRICA
Most Constructed Wetlands have been built to provide advanced or tertiary treatment ofmunicipal wastewaters, but the range of applications is swiftly expanding. In particular, thetreatment of animal wastes, agricultural runoff and industrial effluents are good potentialcandidates for this technology. Often, ancillary benefits are designed into, and realized from,Wetlands constructed for treatment. Bird and other aquatic wildlife usage is generally higherin treatment Wetlands than in adjacent natural Wetlands, because the treatment Wetland istypically more eutrophic and hence more productive of food and habitat (Kadlec 1994).
Internationally Constructed Wetlands have found application in a wide variety of uses, asillustrated by Kadlec (1994):
Table 1. Application of Constructed Wetlands Internationally (after Kadec 1994)
Application
Municipal Wastewater Treatment
Mine DrainageUrban StormwaterRivers, Lakes & ReservoirsAgricultural RunoffLivestock WastewaterIndustrial
Food ProcessingPetroleumChemical
Landfill LeachateSludge Drying
Scope
Advanced Secondary - Post TertiarySingle families to 200 000 personsCoal, Base & Precious MetalsIn Conjunction with Detention PondsIn-line & RecycleField Scale to Watershed ScaleFeedlots, Dairies, Piggeries
Potato, Sugar, Seafood, Abattoir, BreweryProduct Water, Refinery EffluentPulp & Paper, Textiles,Municipal Landfills, RemediationMunicipal & Industrial
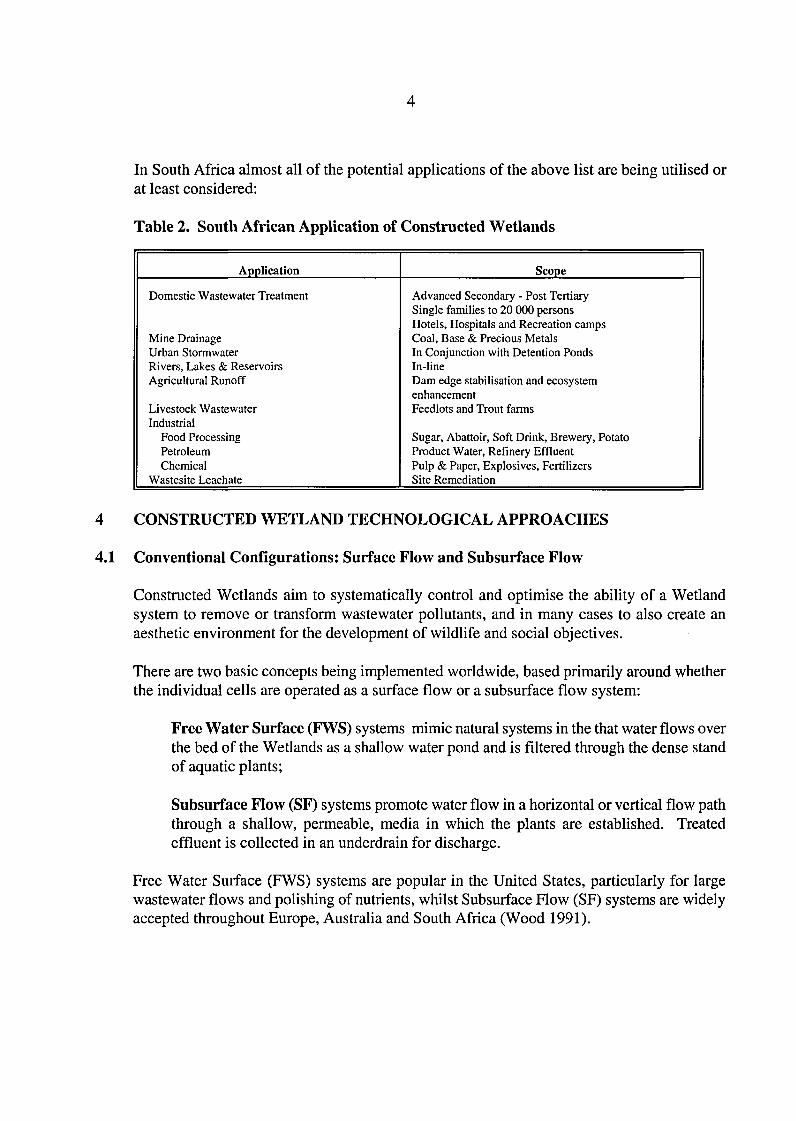
In South Africa almost all of the potential applications of the above list are being utilised orat least considered:
Table 2. South African Application of Constructed Wetlands
Application
Domestic Wastewater Treatment
Mine DrainageUrban StormwaterRivers, Lakes & ReservoirsAgricultural Runoff
Livestock WastewaterIndustrial
Food ProcessingPetroleumChemical
Wastesite Leachate
Scope
Advanced Secondary - Post TertiarySingle families to 20 000 personsHotels, Hospitals and Recreation campsCoal, Base & Precious MetalsIn Conjunction with Detention PondsIn-lineDam edge stabilisation and ecosystemenhancementFeedlots and Trout farms
Sugar, Abattoir, Soft Drink, Brewery, PotatoProduct Water, Refinery EffluentPulp & Paper, Explosives, FertilizersSite Remediation
4 CONSTRUCTED WETLAND TECHNOLOGICAL APPROACHES
4.1 Conventional Configurations: Surface Flow and Subsurface Flow
Constructed Wetlands aim to systematically control and optimise the ability of a Wetlandsystem to remove or transform wastewater pollutants, and in many cases to also create anaesthetic environment for the development of wildlife and social objectives.
There are two basic concepts being implemented worldwide, based primarily around whetherthe individual cells are operated as a surface flow or a subsurface flow system:
Free Water Surface (FWS) systems mimic natural systems in the that water flows overthe bed of the Wetlands as a shallow water pond and is filtered through the dense standof aquatic plants;
Subsurface Flow (SF) systems promote water flow in a horizontal or vertical flow paththrough a shallow, permeable, media in which the plants are established. Treatedeffluent is collected in an underdrain for discharge.
Free Water Surface (FWS) systems are popular in the United States, particularly for largewastewater flows and polishing of nutrients, whilst Subsurface Flow (SF) systems are widelyaccepted throughout Europe, Australia and South Africa (Wood 1991).

No general consensus exists on the overall advantages of the FWS versus SF ConstructedWetland systems, since each application is very much site specific and largely dependent uponland availability, and construction costs and treatment objectives.
Advantages of the FWS are generally lower installation cost and potentially simpler hydraulics.
Advantages of the SF Wetlands are minimisation of vector and odour problems, and possiblygreater assimilation potential per unit area of land in terms of organic and nutrients, particularlywhere winter temperatures are low (Reed 1993). However, the provision of a suitablypermeable media tends to be the most expensive component of the SF systems, and the factorresponsible for the majority of treatment problems when permeability is not adequately cateredfor (Crites 1992).
Table 3 illustrates process criteria for Free Water Surface (FWS) and Subsurface Row (SF)Constructed Wetlands (adapted from Reed (1992) and Knight (1992))
Table 3 Process Criteria for Constructed Wetlands
Factor
Detention time, d
Max BOD loading rate, kg/ha.d
Water or Media Depth, m
Hydraulic loading rate, mm/d
Aspect Ratio C to w
Mosquito Control
Harvest Frequency ,_yr
Typical FWS
5-14
80
0.1-0.5
7-60
2:1 to 10:1
Required
3 - 5
Typical SF
2 - 7
75
0.10-1.0
2-30
0.25:1 to 5:1
Not required
3 - 5
N.B. It should be recognised that areal requirements relate to the variations in wastewaters thatthe systems are generally designed to receive. The FSW systems are usually receivingpretreated or secondary wastewaters while the SF systems often receive primarywastewaters. The SF systems are also often a component of an integrated system wherethe discharge from the SF system passes to a FWS for polishing.
The earlier European design basis for soil media SF systems recommended an areal equivalentof 2 m2/person equivalent (p.e.) (Kickuth 1984), but this was subsequently raised to 5m2 toaccount for permeability limitations found with higher loading rates to soil based systems, andthe tendency to short-circuit by surface rather than subsurface flow (Cooper 1990).
In further developing the SF concept in Europe, systems have tended to move towards gravelbeds to maintain hydraulic control, with >100 systems applied in the UK. A Constructed

Wetland designed upon a basis of 3 mVp.e. and 53 mm/m2/d achieved effluent qualities ofBOD <5 mg/«, SS <30, AmmN < 15 mg/£ at an average Hydraulic Retention Time (HRT) ofonly 7 hours Green (1993)
The Gravel Bed Hydroponic (GBH) system developed by the University of Portsmouth is alsoproving successful for small community installations. The GBH is a narrow, long (up to < 100m), sloping (0.5 -1%), shallow, gravel beds planted with reeds. Where sewage has been fedat a continuous rate of 20d/minute for some 15 hour each day (90mm/m2.d), the bed beingallowed to rest during the night, the treatment showed high elimination rates of SS 79 %; BOD79; NH3 85%; Total coliform 98 faecal coliform 97%. It was also found that as the organicload is removed in the upper sections of the channel the dissolved oxygen concentrationsincrease down the bed, nitrification activity increases to allow combined organic and nitrogenremoval through the channel (Loveridge 1993; Bahgat 1994).
Vertical flow systems are also seen as suitable for achieving effluents which have oxidisedammonia to nitrate as well as BOD removal. Cooper (1994) recommends vertical flow systemsbe based upon 1 m2/p.e when treating settled sewage for BOD removal only and 2 mVp.e forBOD removal followed by separate phase nitrification. The total area is split into at least 2stages to accomplish re-aeration by re-distribution of flows between units. The two stages ofthe vertical flow total surface area may be divided between a number of individual cells at eachstage. These cells are operated sequentially, usually allowing each bed to be loaded I/week.
Haberl (1994) reports upon the development of vertical flow, intermittently operated systemsin Austria. Treating domestic sewage based upon 5 m2/p.e and a 6 hour loading interval (30 -40 mm/d) the treatment efficiency achieved has been highly effective and despite the Austriantemperate climate nitrification was not unduly affected by winter temperature conditions. NH3-N 94%; TN 36%; TP 63% and COD 90%. Urbanc-Bercic (1994) has also reported uponCzechoslovakian system performance of integrated, intermittently loaded vertical andcontinuously loaded horizontal Wetland systems for small domestic sewage treatment.Alternate vertical beds and a horizontal bed at 30 mm/d with gravel and sand media achievedcontaminant removal of NH3-N 97%; NO3-N 74%; Org-N 85%; TP 97%; COD 94%.
4.2 Integrated Systems
The Constructed Wetland system itself is increasingly unlikely to be a single unit but rather anintegration of units, which may include Constructed Wetlands, Marshes, Ponds, Grasslands andeven Forest/Shrub areas. The individual units making up the complete Constructed Wetlandsystem may then operate as surface or subsurface filtration systems, as appropriate to optimisephysico-chemical pollutant removal mechanisms and to balance aerobic and anaerobicbiological degradation reactions, evapotranspiration and infiltration.
Requirements to meet low residual nutrient levels, led to the development of the integratedWetlands, such as the Marsh-Pond-Meadow (M-P-M) systems (Conway 1988). In the M-P-M

option the Marsh may be a sand or gravel media SF unit designed to provide removal oforganic after primary and possibly secondary treatment. The Facultative Pond, with its inherentpopulation of floating and submerged plants, eg algae, Elodea and Potamogeton, providesbuffering capacity and oxygenation of the water for nitrification and pathogen destruction. Thegrass planted Meadow provides final sedimentation and filtration of suspended solids, organicand nitrate removal through denitrification, and further pathogen destruction. Conway (1988)reported that whilst a single SF system receiving secondary treated domestic wastewater at 50mm/d would not be expected to achieve > 50% NH3 removal due to oxygen limitations, a M-P-M may achieve > 75 % NH4 and > 80 % PO4 reduction, at an equivalent loading.
An approach developed in South Africa by Batchelor (1994) to optimise nutrient removal,provides for organic removal via a highly loaded Constructed Wetland (up to lOOg COD/m 2/d)prior to transfer to a Biological Filter for nitrification, and finally to a polishing Wetland FWSstage for nitrate removal. Opportunity to recycle between individual cells is provided to assistin denitrification and alkalinity control of nitrification induced wastewater pH depression. Thecombined anaerobic primary Wetland, Biofilter and FWS meadow Wetland is able to achieveCOD reduction from 400 mg/f to < 40 mg/{ and ammonia reduction from 32 mg/{ to < 2 mg/f,with residual nitrate at < 5 mg/0 at a hydraulic loading of up to 350 mm/d to the primaryWetland, and 125 mm to the FWS units. Table 4 illustrates the COD and ammonia removalefficiency of the South African developed integrated Wetland Biofilter configuration at thehydraulic loading of 200 mm/d to the primary bed and 100 mm/d to the secondary bed.
An alternative to primary anaerobic Wetlands, is to incorporate an Anaerobic Pond operatedin an upflow anaerobic sludge blanket (UASB) mode with a hydraulic detention time of theorder of 24 hrs. The primary treated wastewater feeds to two-stage FWS Wetlands which mayinvolve drawing a recycle stream from the second Wetland, aerating by cascade ormechanically and returning it either to the secondary or primary Wetland bed. Table 5illustrates the reduction in COD and ammonia concentrations between the individualcomponents of such a system. The surface flow Wetland cells are receiving a loading ofapproximately 100 f/m2/d (Batchelor 1994).
Table 4: Performance of the Pilot Integrated Wetlands/Trickling Filter(Application Rate 200 {/m2/d)
Effluent Source
Influent Settled Sewage
Primary Wetland Effluent
Tricking Filter Effluent
Surface Wetland Effluent
Concentration mg/5
COD
413
107
57
35
NH,
35
24
16
9

8
Table 5. COD Removal Performance of 3 Stage Integrated Wetland System(Application Rate 10(Wm7d)
Parameter (mg/C)
COD
NH3-N
Anaerobic Pond
in
577,5
41,4
out
240,9
26,9
Free SurfaceWetland 1
out
109,7
26,5
Free SurfaceWetland 2
out
67.7
19,8
Yang (1994) reports highly effective performance of a combined Stabilisation Pond andConstructed Wetland system. A primary gravel bed unit consists of 3 parallel gravel,Frogmouths communis beds, of a design hydraulic loading of 954 mm/d. Secondary gravelbeds receiving the effluent from the primary beds consists of 2 parallel units of Frogmouthsand cyperus malaccensis loaded at 844 mm/d. A Stabilisation Pond system of 3 parallel pondsof lotus, hyacinth and algal-bacterial symbiotic system loaded at 845 mm/d. Final treatment isachieved in a gravel bed system consisting of two Cyperus beds and one pond in parallel,designed on a basis of 1007 mm/d. The total system has a surface area of 8 400 m2 loaded at370 mm/d. Table 6 illustrates treatment performance over three years. Similarly very effectivetreatment is reported by Wang (1994) where the system involves an Upflow Anaerobic SludgeBlanket cell, a Hyacinth pond and gravel bed SF Wetlands.
Table 6. Treatment Performance of Chinese Integrated Wetland System
Constituent mg/G
BOD
COD
Suspended Solids
Influent
92,8
144,7
140,9
Primary BedEffluent
32,2
83,3
34,6
Secondary BedEffluent
_
17,2
26,7
Figure 1 illustrates a cutaway perspective of a small scale domestic Constructed Wetlandsystem (from Steiner 1993). Figure 2 illustrates the Gravel Bed Hydroponic (GBH) Wetlandchannels of Abu Attwa, Egypt (from Butler 1990). Figure 3 and 4 illustrates the configurationand approach for the vertical flow and recycle Constructed Wetland system for Cresset Houseresidential home in South Africa designed according to the Campshill Trust loading regime of± Im2/p.e and alternate operation of individual beds. Figure 5 illustrates a decision free forselecting Constructed Wetland options (from Batchelor 1994).

like this one are being builtthroughout the nation to handle wastewater from mostly small ruralcommunities and homes where traditional treatment systems area problem.
Wastewater flows into the constructed wetland from a septic tank orother type of primary treatment system. Here the wastewater is evenlydistributed among the plants where microoorganisms and chemicalreactions break down organic materials and pollutants.
Constuctcd wetlands provide simple, effective, and low costwastewater treatment when compared with conventional systems.
Cell I
Wusicwalcr cmcn< the constructed wetland (I)where it K distributed evenly across the width of the first
cell by a series of plastic valves or PVCtccs (2). The first cellcontains gravel (3). A walcrprooflincr is used on the sides and the bottom
of the first cell to conserve water and provide more effective treatment (4).Cattails and bulrushes arc usually planted in the first cell (5). The roots of these marshplants form a dense mat among the gravel (6). Here chemical, biological and physicalprocesses take place which purify the water. Water from the first cell passes into thesecond cell through a perforated pipe embedded in large stone (7). The water levelwithin each cell is regulated by swivel Mandpipcs located in concrete tanks at the endof each cell (8). Wastewater in the second cell is distributed evenly across this cellthrough another perforated pipe (9). Cell 2 has a layer of gravel (10) covered withtopsoil (11) and then mulch (12). This cell is planted with a variety ofomamcntal wet-land plants such as iris, elephant ear and arrowhead (13). The water in cell 2 eventu-ally seeps into the soil below (14) or passes into another perforated pipe (IS) where itis released into a drainfield similar to those used with conventional septic tanks (16).

PRIMARY a O W INTOTHE 1m x 1mDISTRIBUTION CHAMBER
REED BEDS
3m
100mm DEEP GRAVEL-REJECTS
TO WASTE
NOTES ON CROP BEDS- BEDS 1 AND 2 NAPIER GRASS- BED 4 UNPLANTED- BEDS 3. 5, AND 6 PLANTED WITH A PATTERN OF THE
FOLLOWING CROPS :SUMMER = SORGHUM, SUNFLOWER, COTTON, AND MAIZEWINTER - SUGAR BEET, SAFFLOWER, BROADBEANS AND
FODDER BEET
500mm DEEP BEDS
50m
.UMESTONEVGRAVEL
. „ •%. ' •
. . • ' • : . 2 '
o
f 'GRAVEL: ; : ;.-.." • • w - i ; > : G R A V E L . ; i '-:,;••• • 4 .
/ • '/• / " • / • / • / '/• / • / • / • / • . / • / / . / ' / • / / • / / * •
100m
CROP BEDS1: 5 0 BED GRADIENT
PIPES TAKING SEWAGE FROMREED TO CROP BEDS
•— 300mm DEEP BEDS 'NOTES ON REED BEDS- BEDS 1 , 2, 3, 5 AND 6 PHRAGMITES AUSTRAUS- BED 4 NAPIER GRASS

STORMWTER BUNDTO TOP OF BANKTO SUIT NGL
IRRIGATIONRESERVOIR
500 HDPE PIPETO IRRIGATION
FROMSEPTIC TANK
KIKUYUCHANNEL
500 HDPE PIPE\ / TO PRIMARY DISTRIBUTION UNIT
OUTLET SUMP
PLAN
EMBANKMENT %STEPS ^&w})
KIKUYU CHANNEL . H ^ p ^ /
•*J \?
J'^'" " INLET
DISTRIBUTION
INLET PUMP SUMPTO DISTRIBUTION CENTRE
PRIMARYREEDBED
CENTRE
SECONDARYREEDBED1 1 I FLOW
FORMS
CROSS-SECTION FLOW FORMPUMP SUMP
IRIGATIONPUMP SUMP
CRESSET HOUSE CONSTRUCTED WETLAND SYSTEM
FIG. No.
3 & 4

12
Figure 5. Decision Support Tree for Constructed Wetland Treatment System Options(Adapted from Batchelor 1994)
RAW WASTEWATER
PRIMARY TREATMENT
ORGANIC REMOVAL OPTIONS
FACULTATIVEPOND
FREE WATERSURFACEWETLAND
SUBSURFACE FLOWWETLAND
ANAEROBIC POND
NITRIFICATION - DENITRIFICATIONOPTIONS
FACULTATIVE POND NITRIFICATION COLUMN FWS WETLAND
POLISHINGOPTION
MARSH FWS WETLAND SF WETLAND GRASS PLOT

13
5. ADVANTAGES AND CONSTRAINTS OF CONSTRUCTED WETLANDS
Constructed Wetland systems can have certain advantages over conventional treatment systems(adapted from Brix 1987):
I) - low operating, energy and maintenance requirements;ii) - an efficient decentralized approach to wastewater treatment and control;iii) - a robust, low rate process they are able to tolerate a wide range of operational
conditions;iv) - environmentally acceptable offering considerable wildlife conservation potential;v) - potential to integrated into existing forms of effluent treatment.
Constraints to the application of Constructed Wetland systems include:
I) - Land area requires 4-10 times that required for conventional wastewater treatment,and 10-100 times more land where zero discharge is envisaged;
ii) - Lack of defined design and operational guidelines for the various applications andtreatment objectives;
iii) - Engineering difficulties in ensuring optimal flow of water through extensiveshallow open water bodies and/or through the media of the Wetland in subsurfaceflow mode;
iv) - The availability and/or cost of suitably permeable media for subsurface flowsystems ie sands and gravels;
v) - The ability to remove nutrients, particularly phosphate;vi) - Geographical limitations and availability of suitable plant species;vii) - Plant biomass harvesting is constrained by the plant moisture content, difficulties
in harvesting from within an operating Wetland system and limited market forremoved material;

14
Table 7. Southern African Constructed Wetlands Systems
SITE
DaspoortLetlhabileKarbochemMpophomeniLadybrandBethlehemWarmbathsKwazulu HospitalMoeketsiMiddleburgPotchefstroomKlipdriftPietersburg Truck StopPaarlBakubungOil IndustryKruger ParkGrabies FallsMabulaneSelaris PassFelixton MillMidrandFreemansheimKranskopReddersburgNkowa-kowa TownshipOlifantsvlei StormwaterUmzimkulu MillSimonstownMilnertonVan DykesdriftDuvha MineVaal Reefs MineMoekingMankweNamibian HospitalNamibian Border PostNamibian MissionNamibian Farm SchoolNamibian Church & HospitalHlatikuluNkoboSmero SchoolNietgedacht Primary SchoolCarnivore RestaurantCookes Lake ProjectBon Accord QuarryMorgenhof EstateMakalaiLodgeTau LodgeBarwick SchoolSt BrelladesCanadian EmbassyMalalancCSIR PretoriaPort Elizabeth.Chipinge.Miscellaneous Schools.
DESIGN FLOW
Variable.2000m3/d6 000 nrVd.2 500 m'/d.4 300 m3/d.4 200 m'/d.17,5 m3/d.80 mVd.200 m3/d.80 m3/d.80 m3/d.40 m3/d.80 mVd.35 m3/d.<50 m3/d.VariableVariable
<50 m3/d.<20 m3/d.<20 m3/d.400 m3/d.20 m3/d.200 m3/d.200 mVd.500 m3/d.2 200m3/d.Variable4 000 mVd.2 000 m3/d.5 000 m3/d.2 000 m3/d.200 m3/d.1 000 mVd.200 mVd.200 mVd.250 mVd.16 m7d.±450 m'/d.±2O0m3/d.<20m3/d.- 1500 person- 1200 person- 1000 person- 400 personKenya- 500 person- 3.5 MC/day24 person CSIR3Om3/day100 person .
40 m'/day.350 person32 person16 person250 personVariableVariableVariableVariable
CONFIGURATION TREATMENT
Experimental Integrated Systems.Meandering Channel. TertiaryMeandering Channel. TertiaryVertical Subsurface Flow Soil Bed. Tertiary2 Vertical Subsurface Flow Gravel Beds. Tertiary5 Horizontal Subsurface FlowGravel and Ash Beds. TertiarySingle Horizontal Subsurface Flow Soil Bed. SecondarySingle Horizontal Subsurface Flow Soil Bed. Secondary3 x Dual Horizontal Subsurface Flow Soil Beds. SecondarySingle Horizontal Subsurface Flow Gravel Bed. SecondaryIntegrated Channel. TertiarySingle Horizontal Subsurface How Gravel + Ash Bed. SecondaryDouble Gravel Bed and Maturation pond. SecondarySingle Gravel Bed and Maturation pond. SecondarySecondary Horizontal Subsurface How Ash Bed. SecondarySubsurface Flow Gravel Beds. Secondary28 Sand Beds. SecondaryDouble Sand Beds. SecondarySingle Horizontal Subsurfae How Sand Beds. SecondarySingle Horizontal Subsurface Flow Soil Bed. SecondaryVertical Subsurface How Sand Bed. TertiaryIntegrated biofilter/Wetland/flowform. SecondaryDual Horizontal Subsurface How Soil Beds. SecondarySingle Horizontal Subsurface Flow Soil Bed. SecondaryDual Secondary Horizontal Subsurface Flow Gravel Beds Secondary6 Tertiary Soil Beds. Tertiary10 ha Wetlands. Tertiary5 ha Ash Dam/Wetlands. Secondary6 ha Conservation4 ha Tertiary. Conservation8 ha Minewater. Conservation6 Horizontal Subsurface How Sand Beds, Minewater. Seep6 Vertical Subsurface How Slime/Soil Beds. Tertiary2 Horizontal Subsurface How Soil Beds. Tertiary4 Horizontal Subsurface Flow Soil Beds. TertiaryDual Beds and Maturation Ponds. SecondaryDual Soil overlying gravel Beds. SecondarySingle Subsurface How Soil Bed. SecondarySingle Subsurface Flow Soil Bed. SecondarySingle Subsurface How Soil Bed. SecondaryCSIR Integrated Wetland. SecondaryCSIR Integrate Wetland. SecondaryCSIR Integrate Wetland. SecondaryCSIR Integrated Wetland. SecondaryCSIR Integrate Wetland. SecondaryPolishing Wetland and bird sanctuaryIntegrated Wetland. SecondaryCSIR integrated system Wetland. SecondaryCSIR Integrated Wetland. SecondaryCSIR Integrated Wetland. SecondaryCSIR Integrated Wetland. SecondaryCSIR Integrate Wetland. SecondaryCSIR Integrated Wetland. SecondaryCSIR Integrated Wetland. SecondaryCSIR Integrated Wetland for campus facility dischares and stormwaterWetland system to treat base flow in Motherwell Canal (Pilot Project).Zimbabwe. Oxidation pond upgrade from 750 m3/day to 2,lM?/day.CSIR Integrated Wetland systems for sewage treatment

15
6. SOUTH AFRICAN CONSTRUCTED WETLAND SYSTEMS
Table 7 illustrates Constructed Wetlands applied in Southern Africa. The following sectionsummarises the key characteristics of a selected number of the systems to highlight theflexibility in design and application that has been applied in South Africa.
6.1 Mpophomeni
A single SF vertical flow 1.5 m deep soil Wetland of 2 500 m2 surface area. Constructed topolish Biofilter effluent to a phosphate level of <1 mg/0 at a maximum hydraulic loading of200mm/d. The effluent is introduced from a central distribution channel to the surface of thesoil bed, planted with Frogmouths Spp, where it is designed to filter vertically through themedia into a gravel drainage system. The final effluent is discharged onto a marshland abovethe sensitive Midmar dam.
6.2 Letlhabile
The Letlhabile FWS channel Wetland arrangement consists of 10 channels, 5 m wide by 300 mlong, operated in parallel pairs with a water depth of the order of 500 mm and planted withsedges. The system was constructed to assist in phosphate removal and tertiary polishing froma domestic wastewater after treatment through a combined Biofilter and Oxidation pondarrangement, a variation of the TETRO" concept.
6.3 Ladybrand
The Ladybrand SF Wetland system has two vertical flow gravel beds for the polishing of thealgal solids and residual nutrients generated by an aerated lagoon system after primaryanaerobic ponds. The media is a graded fine gravel overlying a coarse gravel base layer, andplanted with Typha Sp. Each cell is 85 m long by 70 m wide, designed to receive nominally2 150 m3/d from the pond system. Overflow from the facultative pond is introduced to theWetland to maintain a water depth of ± 500 mm, filtering downwards through the gravel tobe collected in an under-drainage network.
6.4 Bethlehem
The Bethlehem SF Wetlands consists of 5 previous Maturation ponds providing a combinedsurface area of ± 2 hectares, converted to operate as horizontal flow SF, gravel and ash units,for the polishing of effluent from a Biological Filter and Activated Sludge system. The beds,planted with Frogmouths Sp reed, are operated as parallel units.

16
6.5 Kruger National Park
The Kruger National Park has readily adopted the Wetland technology for the treatment of thewastewaters generated by the camps throughout the park. The larger camps, such as theLethaba, Skukuza and Olifants, which accommodate up to 3 000 persons are provided withconventional Oxidation Pond systems, whilst the smaller camps of Crocodile Bridge andShingwedzi are serviced by septic tanks. The Wetlands units are constructed as horizontalflow SF units operating with two cells in series. The sizing is based on accommodating thepeak flow of the maximum number of visitors, or 5 m2/person. The beds are nominally 1.0mdeep of a sand media and planted generally with Frogmouths Sp.
6.6 Pilansburg Game Reserve
The Wetland system at the Bakgatla Gate site of the Pilansberg National Park was constructedto treat septic tank effluent for a peak population of 300 persons, in a SF horizontal flow gravelbed planted with Frogmouths Sp. The Wetland was a single unit 60 m wide by 20 m long toaccommodate available space and optimise the hydraulic distribution of the waste water acrossthe inlet zone. The media is a sand base with inlet and outlet areas of graded gravel.
6.7 Pietersburg Truck Stop
A truck rest stop, cafeteria and petrol station in Pietersburg has a 2 stage horizontal flow SF,gravel channel Wetland constructed to accommodate the septic tank effluent discharge flowof 50 m3/d. Each cell being 5 m wide, 50 m long by 0.75 m deep, and planted with Typha Sp.
6.8 Klipdrift
A construction camp and service depot for the railways at Klipdrift had a single stagehorizontal flow SF gravel and ash Wetland constructed to treat septic tank effluent at a flowof 40 m3/d. The cell was nominally 7.5 m wide, 30 m long by 0.75 m deep, and planted withFrogmouths Sp.
6.9 Middelburg
A rest stop, cafeteria and petrol station in Middelburg had a single stage horizontal flow SFgravel Wetland constructed to polish the effluent from a Rotating Biological Contractor systemprior to chlorination and discharge. The design flow was a peak flow of 80 m3/d. The cell wasnominally 10 m wide by 20 m long by 0.45 m deep, and planted with Typha Sp.

17
6.10 Reddersburg
The Reddersburg SF Wetland system has two parallel gravel beds for the polishing of the algalsolids and residual nutrients generated in a 5 pond facultative lagoon system after primaryanaerobic ponds. The media is a graded fine gravel 300 mm depth overlying a ±150 mm coarsegravel base layer, and planted with Typha Sp. Each cell is 28 m long by 32.5 m wide, designedto receive nominally 250 m3/d from the pond system.
6.11 Kranskop
A 2 unit parallel horizontal flow SF Wetland systems were constructed in Kranskop accordingto the EC Constructed Wetland Design Guidelines (Cooper 1990) to treat septic tank effluenton a nominal basis of 5m2/person. Each cell has a length of 40 m by width of 55 m. The mediais a graded fine gravel ± 600 mm depth, and planted with Frogmouths Sp. The septic tankeffluent flow is nominally 1 000 mVd.
6.12 Friemansheim
Two independent horizontal flow SF Wetland systems were constructed in Friemansheimaccording to the EC Constructed Wetland Design Guidelines to treat septic tank effluent of anominal basis of 5m2/person. System one has a length of 35 m by width of 22 m and systemtwo a length of 41 m by width of 35 m. The media is a graded fine gravel 5-10 mm of ± 600mm depth, and planted with Frogmouths Sp. The combined septic tank effluent flow isnominally 200 m3/d.
6.13 Warmbaths Cotton Gin
The Warmbaths Cotton Gin horizontal flow SF Wetland was sized to accommodate the septictank effluent discharge at a peak flow of 17.5m3/d, being 35 m long by 16 m wide, andcomprised of a coarse sandy clay soil planted with Typha and Frogmouths Sp.
6.14 Karbochem Newcastle
The Karbochem Wetland system, resembling Letlhabile, consists of a series of 6interconnected open channels, each with a length of ± 750 m by ± 8 m wide and planted withTypha Sp. The system is operated in a shallow FSW mode to provide tertiary treatment to theprocess wastewaters and domestic sewage from the Karbochem industrial chemicals plant afterconventional primary sedimentation, oil capture and extended activated sludge treatment at amaximum daily volume of the order of 6 000 m3/d.
18
6.15 Midrand Residential Home
The Cresset House residential home in Midrand accommodating ± 100 persons has anintegrated vertical flow Wetland system to treat septic tank effluent. It is designed on the basisof the Camps Hill Trust system in the EC Constructed Wetland Design Guidelines. It consistsof an SF gravel channel 40 m long by 3 m wide and nominally 500 mm deep overlaid withkikuyu grass. The effluent is pumped to 4 parallel vertical flow multiple sand media Wetlandunits which are operated on an alternate day basis, decanting to 2 vertical flow secondary sandmedia beds. Each Wetland cell is planted with Frogmouths Sp. The design basis is1 m2/person.
6.16 Mount Grace Hotel
Mount Grace Hotel has an integrated Wetland system to polish effluent from an existingRotating Biological Contactor (RBC). The kitchen and domestic sewage at 90 m3/d passthrough the RBC prior to a series of 5 surface flow Wetland units of ± 200 m2 surface area, anda final maturation pond. The water depth within the Wetland units varies between 20 and 100mm. A variety of plant species were planted to add to the overall aesthetics of the system.
6.17 CSIR Campus Wetland
The CSIR campus in Pretoria has an integrated Wetland system to treat discharges from thevarious research facilities and site runoff. The system consists of both SF and FWS cells andshallow and deep open water areas. It incorporates a variety of aquatic plant species includingEichomia, Lemna, Typha and Frogmouths Sp and various rushes and sedges to enhance theoverall aesthetics.
6.18 Potchefstroom
The Naschem industrial site in Potchefstroom has an integrated Wetland system to treat treateddomestic sewage discharges from a mechanical Activated Sludge plant. The Wetland consistsof meandering, narrow (nominally 2 m wide), FWS cells interspersed by shallow and deepopen water areas traversing approximately 300 m across a golf course. It incorporates avariety of trees and shrubs as well as aquatic plant species including Lemna, Typha andFrogmouths Sp and various rushes and sedges to enhance the overall aesthetics of the system.
19
6.19 Makwane
At Makwane two parallel horizontal flow soil bed SF Units each of 350 m2 surface area wereconstructed to receive a hydraulic loading of 100 mm/d. The pretreatment involves 3faultative Oxidation ponds each of 680 m2 surface area, and a nominal hydraulic retention timeof 9 days. The bed media is a 0,6 m thick clayey sand topped with a 200 mm layer of stone andplanted with Frogmouths Sp.
6.20 Umzimkulu Sugar Mill
Umzimkulu sugar mill in Natal utilised the ash disposal dam to discard waste ash and to treatwaste water. The ash dam had a surface area of 19 000 m2 to which 840 m3/d of effluent and7 200 m3/d ash were disposed. Filtration of the effluent through the ash matrix and theWetland plants developed on the surface of the ash dam provided the efficient wastewatertreatment.
6.21 Felixston Sugar Mill
The Sugar Technology Department (STD) of Tongaat Hulett Sugar designed a Wetland toreceive effluent after anaerobic pretreatment and Activated Sludge aeration. A 2 000 m2
vertical flow SF bed was constructed with river sand and planted with Frogmouths Sp.Thedesign loading was 200 mm/d of the secondary wastewater.
6.22 Milnerton
Milnerton Municipality have created a ± 4 ha FWS Wetland system adjacent to the sewagetreatment works to polish the final discharge after conventional Biological Filtration and flowbalancing in maturation ponds, prior to it being released into the Rietvlei natural Wetland area.The system was created by berming off a section of the natural Wetland and establishing 4 cellsnominally operated as two pairs through which the effluent percolates through thepredominantly Typha Sp vegetation mass and exit in a nominally purified state into the mainriver system of the natural Wetland.
6.23 Oil Industry Wetlands
Two truck washing Wetland systems have been constructed at Pretoria and Secunda oil depots.These are designed to operate on a vertical flow SF format through a layer of course gravel ±700 mm deep to a subsurface drainage layer, and planted with Typha Sp. A maximum loadingrate of 700 Iitres/m2/week and 400 m2 in surface area. A third system utilizes an existingWetland area to receive site drainage and washings after an oil-water separator unit.

20
6.24 Bannockburn Minewater
The Bannokburn FWS Wetland system has been constructed to receive minewater emanatingfrom the open shafts of an abandoned coal mine system at a rate of approximately 10/secondand the surface run-off and leachate from rehabilitated spoil dumps. The system has beenseparated into an upper section with 4 units covering an area of ± 1.5 hectares planted withTypha Sp, and a lower section with a further 4 units and additional 1 ha.
6.25 Van Dykes Drift Mine
A 20 ha Wetland system was created as part of the coal mines rehabilitation programme of apreviously opencast pit area. The objectives were to improve the quality of poor quality waterin a stream crossing the site, to treat pollution arising from on-going mining operations in thearea, and ultimately to operate as a passive treatment system after mine closure, whilstencouraging bird and wildlife to an otherwise relatively barren area.
6.26 Atlantis Groundwater Recharge Wetland
The Atlantis Wetland system is a component of the groundwater recharge system in Atlantiswhich receives seepage from the waste water pond system. There are a total of 12 ponds in thesystem of which only pond 6 is recognised as a Wetland, being dominated by emergentmacrophytes. This has a nominal capacity of 44 000 m3 and an active surface area of the orderto 3 000 m2 receiving approximately 2 000 m3/d treated sewage effluent and between 3 and4 000 m3/d stormwater and groundwater infiltration.
6.27 Sandton Urban Wetlands
Sandton is promoting the development of open space and parkland areas which includeWetland areas. An example is the Sandspruit tributary of the Braamfontein Spruit, which isresidentially developed along its length. The Sandspruit has an average dry weather flow ofthe order of 5 I/second, increasing significantly in storm conditions. To reduce the flood watervelocity, and thereby protection of the Spruit, the Municipality has constructed a series ofdammed, open areas, linked by the Spruit base which is dominated by Wetland plant and treespecies.

21
7. PERFORMANCE REVIEW OF SELECTED CONSTRUCTED WETLAND SYSTEMS
7.1 Mpophomeni
7.1.1 System Configuration
Mpophomeni in KwaZulu Natal is situated on the eastern shore of Midmar Dam, for which thesewage treatment is served by a conventional Biological Trickling Filter (Biofilter) works towhich has been added the Constructed Wetland for polishing final effluent.
The single vertical flow Wetland of 2 500 m2 surface area was designed to treat 500 m3/d tomeet a maximum phosphate level of 1 mg/C P, at a unit surface loading of 200 mm/d. Biofilterhumus tank effluent is introduced from a central concrete channel to the surface of a 1.5 mdeep, phosphate deficient, acidic soil bed, planted with Frogmouths Sp. The wastewaterpercolates vertically through the soil to a drainage system of crushed gravel protected by abidum geotextile membrane and overlying the base hyperplastic liner. The final effluent isdischarged to a marshland via a series of Maturation or Stabilisation ponds (Figure 6).
7.1.2 Wastewater Treatment Performance
The Wetland has suffered poor hydraulic permeability, with consistently of the order of90-95% of inflow passing across the bed surface rather than through the vertical profile. Asthe system has generally received significantly greater hydraulic loading (up to 680 mm/d), ascompared to the design loading, this 5-10% of total flow represents a volume equivalent to30-50% of the initial design load of 200 mm/d.
Despite the system not totally operating as designed, treatment performance has been good.Table 8 illustrates treatment performance over the first 5 years of operation for the waterpassing through the media. Table 9 illustrates consolidated data sets for subsequent annualperiods for wastewater passing both over the surface of the Wetland and through the Wetland.In each case all concentrations with the exception of E.Coli comply with General Standard,and for water passed through the vertical profile, the P concentration is generally < 0.5 mg/1.Continuous monitoring exercises undertaken over periods of 48 hours confirmed the abilityof the Wetland system to achieve a high level of treatment performance in both the surface andsubsurface flow condition. Table 10 illustrates one data set.
No significance of temperature, or plant growth condition, has been identified despite seasonaleffects on incoming wastewater, particularly winter ammonia elevations. This indicates theplant litter acts as a biological support media whether or not the above ground plant structuresare active. It also confirms that plant uptake of pollutants is minimal relative to the highhydraulic, and associated nutrient, loadings to which the surface flow system is exposed.

22
Based upon an estimated average surface loading of 1 700 m3/d and bed area of 2 500 m2
(680 mm/d), the contaminant removal rates ranged from 0.7 - 1.5 g/m2/d for NH3-N, 3.0 -6.0 g/m2/d for NO3-N, 12 - 20 g/m2/d for COD and 7.5 - 20 g/m2/d for SS.

176006/FIG6
O
Xo ooo:OQ.*- a.
<
oooo
150 DIA
A.C PIPE
\ i m i Tii ii i n n i ii 11
50m
\ A \\
I III
-1x 150 DIA A.C. PIPECOLLECTOR DRAIN
-TYPE B-TYPE A
EFFLUENT MANHOLE-
OVERFLOW CHANNEL
PLAN OF REED BED
2000
CONC. LININ
oo
1.5
50 AJ mHYPERPLASTICMEMBRANE
CONC. DISTRIBUTION DRAIN
SECTION B-B
DISCHARGE TOOPEN DRAIN
a:
COLLECTOR DRAIN
MPOPHOMENI CONSTRUCTED WETLANDPLAN AND CROSS SECTION
FIG No.
6

24
Table 8 Wastewater Treatment Performance of Mpophomeni Constructed Wetland(Initial 5 year period)
Determinant
PH
Alkalinity as CaCO,
Conductivity mS/m
NO,-N
NH,-N
PO4-P
ssCOD
TOC
PV
Coliforms/100 ml
E.Coli/100 ml
F.Strep/lOO ml
Inflow mg/1
7.6
43.2
59.8
46
2.8
7.0
39.1
64.1
11.6
10.5
5.6 x 10⁵
1.6 xlO5
3.7 x 10"
Outflow mg/1
7.7
86.1
46.8
15.1
1.2
0.87
13.7
22.5
5.4
5.0
5.5 x 10"
3.4 x 10³
1.3 x 10³
% Removal
_
-99.3
20.1
67.2
57.1
87.7
65.0
64.9
53.4
50
90.1
97.9
96.5
Table 9 Wastewater Treatment Performance of Mpophomeni Constructed Wetland(Indicating quality of overflow and underflow)
Determinant
PH
Alkalinity as CaCO,
Conductivity mS/m
NO,-N
NH,-N
PO4-P
TP
COD
OA
SS
E.Coli/100 ml
Inflow mg/1
7.5
83.5
49.9
15.6
3.6
4.76
5.5
63.1
6.2
20.2
550 000
Overflow mg/1
7.3
105.5
44.9
6.3
2.65
3.0
3.8
40.4
4.1
16.4
2 500
Underflow mg/1
7.1
179
52.4
0.8
3.24
<0.5
<0.5
<33
3.3
29
28
25
Table 10 Mpophomeni Constructed Wetland Treatment Performance as Illustrated by a 48 hrComposite Sampling Exercise
Determinant
COD
NH,-N
NO r N
PO4-P
SS
Inflow mg/1
95
9.6
20.0
6.0
38
Overflow mg/1
25
1.0
8.5
6.0
2
Underflow mg/1
5
2.5
0.1
0.1
8
Alkalinity significantly increases as the wastewater flows through, and over, the Wetlanddespite nitrification occurring and creating a demand on the alkalinity. Denitrificationgenerates some alkalinity, but inadequate to account for increases of 20 - 30 mg/1 in theoverflow, and 90-120 mg/1 in the underflow. Additional buffering is generated as wastewaterpasses through the plant, microbial and soil/sediment matrix, some derived from Ca in the soil,and some from gypsum added to the soil in an attempt (unsuccessful) to improve permeability.
Denitrification occurs in the overland flow despite predominantly aerobic conditions wheremicroclimates in the dense plant litter and sediments are anoxic and provide carbon. Thesurface flow can achieve TN removal, at the expense of TP removal. Lower nitrification atlower influent concentrations is believed to be a result of oxidation of in-situ nitrogenouscompounds, and masks the full capacity of nitrification that the surface flow system is capableof. Nitrification in the underflow is limited by oxygen availability, indicating that deep soilbeds are not suitable for nitrification.
Short-circuiting of the flow path, as well as the generation of algae in the open water areas hasbeen found to be responsible for the release of SS from the bed surface into the effluent.Elevated underflow SS levels also result from the precipitation of iron oxides. Although clearin its fresh state, within 4 hours the water becomes turbid as iron oxides precipitates, and arethen captured as SS upon filtration.
Although some TP and PO4 removal has been achieved at lower surface loading, at highloadings the removal has been limited. Release of P into the effluent is believed to be a resultof changes to the flow regime, disturbance of sediments and release of suspended and algaesolids containing P. Pathogen removal of > 105/100 ml in the subsurface flow is significantwhilst removal in the surface flow of 101 -102/100 ml is primarily a result of the minimal HRTprovided by the severe short-circuiting.
26
7.1.3 Hydraulic Characteristics
The vertical throughput apparently dropped steadily over the first year of operation and hassubsequently remained relatively stable. This suggests this is likely to be the long-termhydraulic capacity of the system. Although, after the bed has been "off-line" for maintenancepermeability improves, supporting the contention that resting beds assists flow by allowingdegradation of the coating slimes layers. Hydraulic capacity in the vertical downflow regimeis found to be limited, both by the permeability of the soil and by the development of slimecoatings. Once a slimes layer has formed, potential for water to pass through the soil is onlyslightly affected by the permeability of the main bed depth. Table 11 illustrates soilcharacteristics of the vertical profile of the bed.
Although there is an increased clay content at the low levels, this is not in a dispersed form thatcould decrease permeability. The character of the surface layer determines the permeationpotential, the total bed depth has little influence. It would appear not to matter whether the bedis 300 mm or 1 500 mm deep in its ability to transfer water, although depth does influenceHRT, and opportunities for contact between the wastewater pollutants and chemical, biologicaland physical components of the soil.
Table 11. Particle Size, Distribution Root and Organic Matter Content at DifferentDepths of Mpophomeni Constructed Wetland
Depth(cm)
0 - 3
0-30
30-60
60-90
90 -120
120-150
Particle Size Distribution
%Sand
62
46
60
61
23
26
%Silt
17
20
14
5
16
16
%Clay
21
34
26
34
61
58
Root Materiallmm (g/m3)
49,5
735,4
717,7
73,3
72,8
61,1
Organic Matterlmm (%)
9,4
10,0
9,9
7,9
7,9
9,6
A series of tracer studies with sodium flourescene were undertaken to assess the surface andsubsurface flow conditions of the bed. While an HRT of ± 8 - 12 hours was calculated thetracer dye was observed within 1 h for each of the tracer runs and essentially independent ofinflow volume for each specific run, and proceeded to emerge only over a further 2 hours. The.low relative flow through the vertical profile, and the rapid short-circuiting of the surface flowprevented adequate dye from passing through the vertical profile to confirm vertical hydraulic

27
conditions, though a limited amount was observed in excess of 24 hours after introduction,illustrating some ingress of the dye into the vertical profile. The implication is that, rather thanthe inflow being equally distributed across the Wetland surface, the system is dominated bypreferential flow which reduce the ability of the Wetland to achieve the desired degree ofwastewater pollutant reduction.
Further evidence of preferential surface flow paths has been the presence of scouring of theWetland surface, and associated litter between the inlet and outlet zones whilst encouragingsediment deposition to its edges, and localised ice covering during winter periods.
7.1.4 Phosphate Partitioning
As the system was designed for phosphate removal, Umgeni Water undertook soil partitioningexercises within the vertical profile. Phosphate content was found to be highest adjacent to thebed surface (Table 12), consistent with a chemical adsorption/precipitation mechanism. Thiswould suggest that the Mpophomeni Wetland has P removal capacity available for many years.
7.1.5 Pilot Studies
In an attempt to solve the permeability problems, pilot trials were instituted by Umgeni Waterusing varying ratios of sand and phosphate deficient clay soil. Significant improvement inpermeability could be achieved without compromising phosphate removal when a ratio of 3:1
Table 12. Distribution and Partitioning of Phosphorous in Mpophomeni ConstructedWetland
Depth(cm)
0-3 (surface)
0-30
30-60
60-90
90 -120
120 -150
Blank
Exchangeable -P(mg/kg soil)
7,4
2,4
1,7
2,2
1,4
2,5
-
Metal Bound Extractable P(mg/kg soil)
26,7
9,4
7,1
7,4
7,2
8,4
8,7
mixture of clay and sand was used. However at high loading rates, the beds could stillmaintain permeability but P removal became saturated, and overall pollutant removal capacity

28
declined. At loadings of 140 mm/d the pilot units were able to achieve 76.5% P removal; 74%NH3; 50% PV; 31.2% NO3 and 95.8% E.coli. At 250 mm/d the P removal reduced to 60%.At loadings of 80 mm/d the removal efficiency increased to allow < 1 mg/1 effluent P to beachieved, associated with NH3, COD, SS and NO3 removals.
7.1.6 Vegetation Development
Although the Wetland gives appearance of being a dense stand of Frogmouths, with which theWetland was initially planted, behind the ± 2 m 'edge effect' the Wetland is a patchwork oflocalised Frogmouths growth interspersed with Typha stands and open water areas, supportinglemna and grasses. Development of Typha has occurred through natural establishment,primarily restricted to the drier edges of the bed and in some open areas within the bed. Sedgesand rushes have also established, as well as of grass species particularly around the edges, andextending into the flooded areas of the Wetland.
Table 11 also indicated the relative root development within the vertical profile of the bed.Core samples indicate a poorly developed root system, 85% of root, occurring in the 0 - 60cmregion. As the majority of the bed depth is root free the presence of the plants has little impactupon the long-term hydraulic potential, and the limited improvement in flow through potentialover several years of operation, indicates that the development of the plants root system doesnot significantly improve permeability.
7.1.7 Management
As there is no facility to alternate the surface water depth it is not possible to effectivelyregulate the hydraulic loading of the Wetland, or to use this management tool to controlmosquito larvae development. However, the location at a distance from the local communityhas limited mosquito nuisance problems. Similarly the apparent well developed ecologicalbalance and natural predators of mosquito larvae appears to operating effectively.
It would also appear that the low organic loading is not encouraging mosquito development tothe levels that may be expected if the system became anaerobic. Excessive organic loadingto the Wetland is not expected as the works has well trained operators running the plant on aday to day basis. The works has also by-pass storage facilities in the event of excessstormwater ingress, or overloading, which should further ensure that effluents reaching theWetland, and subsequently leaving the site are well controlled and acceptable.
Mpophomeni Wetland has been harvested and the surface cleared on several occasions sinceits initial commissioning. This has been undertaken to minimise sealing effects developing asa result of influent solids, degrading plant litter, and microbial biomass growth in the treatmentand stabilisation of the wastewater. However, these clearing operations have had little long-

29
term effect upon the permeability of the resident soil and its ability to accommodate thewastewater in the vertical profile, and with the introduction of the full flow through theWetland it is no longer intended that harvesting will be undertaken. If necessary the bed willbe burnt to clear excess above ground vegetation.
7.1.8 Management Recommendations
1 Install dividers across the Wetland surface to create a meandering channel flow.
2 Install outlet weir to permit management of the water depth to assist management ofHRT and mosquito control.
3 Operate with a water depth of 500 mm to optimise the HRT through the Wetland andincrease the hydraulic head encouraging vertical percolation. External berms may beraised to accommodate the increased surface water depth.
4 Introduce Tilapia to assist in nuisance insect and algae control. Grass carp may beintroduced to control lemna and excessive litter development
5 Provide by-pass facility to permit clearing of the bed occasionally.
6 If P removal is a primary objective reduce loading to achieve required balance betweensurface flow and underflow after amendment of hydraulic control as above.
7.2 LETLHABILE
7.2.1 System Configuration
Letlhabile sewage treatment works receives 1 500 - 2 800 m3/d of predominantly domesticsewage from the town of Letlhabile in the Western Transvaal. Treatment is a variation of the'PETRO' concept utilising Anaerobic Pond primary treatment, Facultative Oxidation Ponds andBiological Trickling Filters and a meandering channel Wetland tertiary polishing stage to Petrosystem discharge, primarily for phosphate removal by plant uptake.
The Wetland channels are designed to operate in a plugflow character. Sets of two channelsreceive flow from a preceding pair as the wastewater flows through the 10 channel lengths.Each channel is 300 m long by ± 5 m wide (maximum available water surface). The HRT ofthe order of 6 - 12 hours through individual channels, and 2.5 - 5 days through the totalsystem, dependent upon water depth in the channel and inflow volumes (Figure 7).
30
7.2.2 Wastewater Treatment Performance
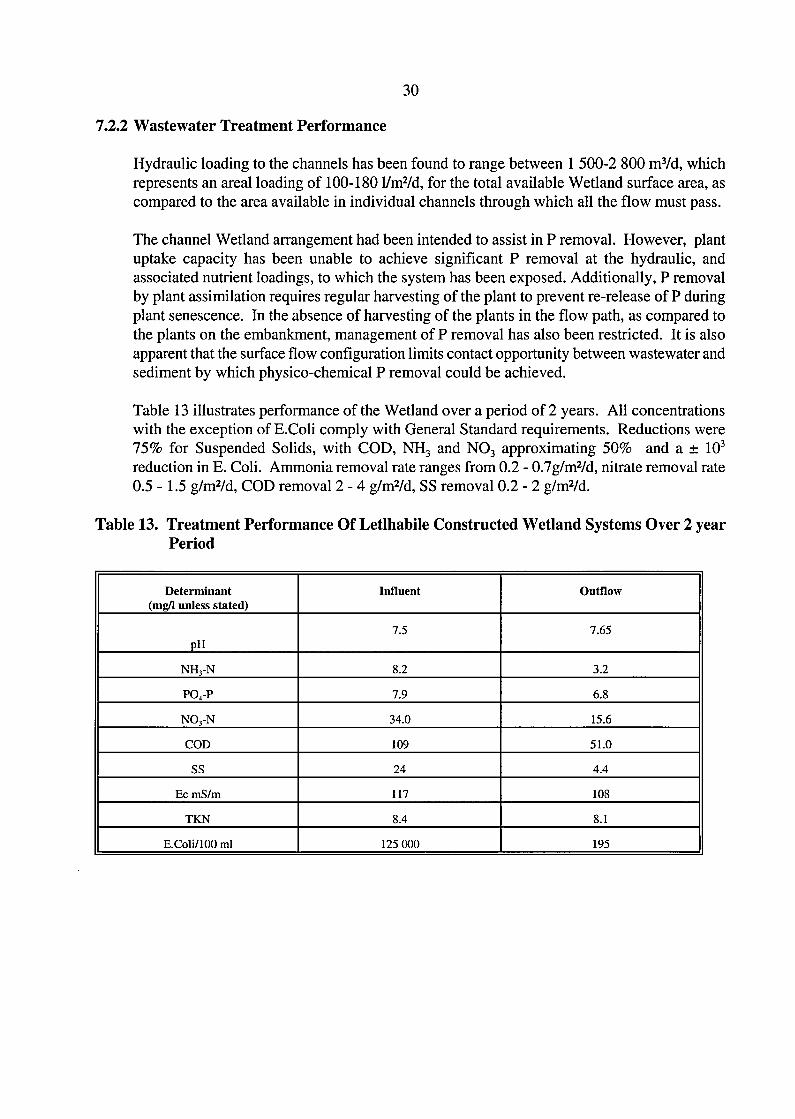
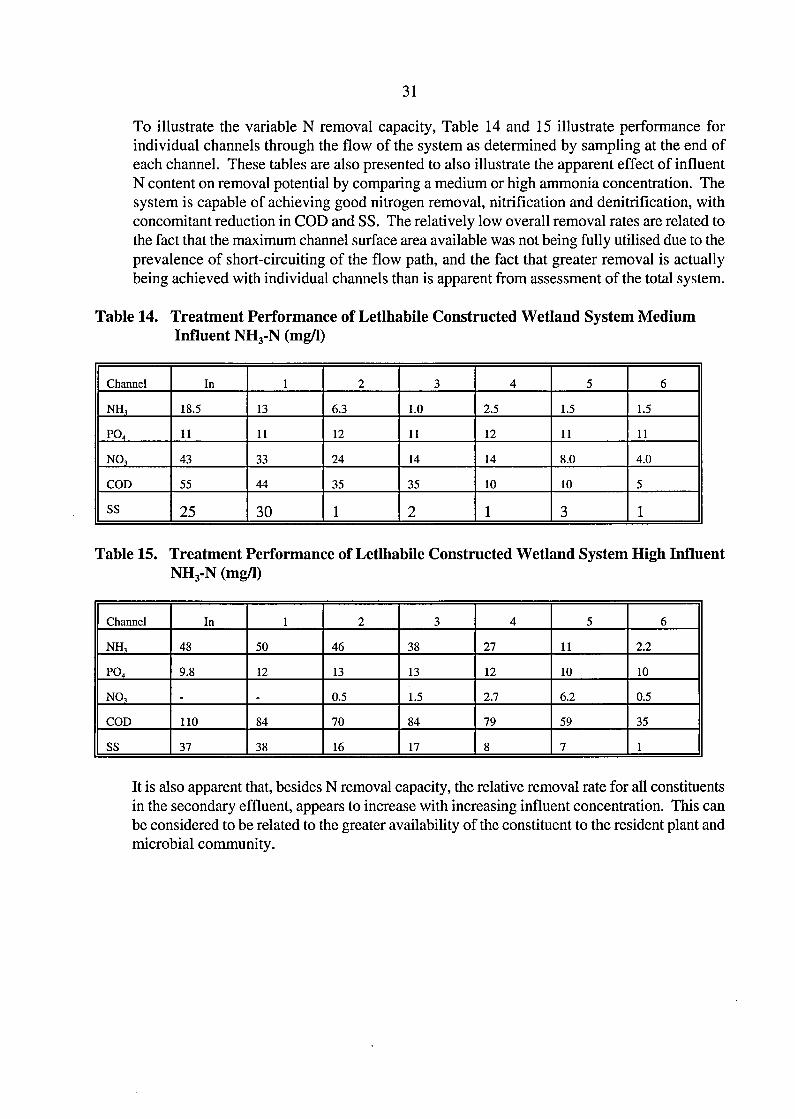
Hydraulic loading to the channels has been found to range between 1 500-2 800 m3/d, whichrepresents an areal loading of 100-180 l/m2/d, for the total available Wetland surface area, ascompared to the area available in individual channels through which all the flow must pass.
The channel Wetland arrangement had been intended to assist in P removal. However, plantuptake capacity has been unable to achieve significant P removal at the hydraulic, andassociated nutrient loadings, to which the system has been exposed. Additionally, P removalby plant assimilation requires regular harvesting of the plant to prevent re-release of P duringplant senescence. In the absence of harvesting of the plants in the flow path, as compared tothe plants on the embankment, management of P removal has also been restricted. It is alsoapparent that the surface flow configuration limits contact opportunity between wastewater andsediment by which physico-chemical P removal could be achieved.
Table 13 illustrates performance of the Wetland over a period of 2 years. All concentrationswith the exception of E.Coli comply with General Standard requirements. Reductions were75% for Suspended Solids, with COD, NH3 and NO3 approximating 50% and a ± 103
reduction in E. Coli. Ammonia removal rate ranges from 0.2 - 0.7g/m2/d, nitrate removal rate0.5 - 1.5 g/m2/d, COD removal 2 - 4 g/m2/d, SS removal 0.2 - 2 g/m2/d.
Table 13. Treatment Performance Of Letlhabile Constructed Wetland Systems Over 2 yearPeriod
Determinant(mg/1 unless stated)
pH
NH rN
PO4-P
NO3-N
COD
SS
Ec mS/m
TKN
E.Coli/100 ml
Influent
7.5
8.2
7.9
34.0
109
24
117
8.4
125 000
Outflow
7.65
3.2
6.8
15.6
51.0
4.4
108
8.1
195
31
To illustrate the variable N removal capacity, Table 14 and 15 illustrate performance forindividual channels through the flow of the system as determined by sampling at the end ofeach channel. These tables are also presented to also illustrate the apparent effect of influentN content on removal potential by comparing a medium or high ammonia concentration. Thesystem is capable of achieving good nitrogen removal, nitrification and denitrification, withconcomitant reduction in COD and SS. The relatively low overall removal rates are related tothe fact that the maximum channel surface area available was not being fully utilised due to theprevalence of short-circuiting of the flow path, and the fact that greater removal is actuallybeing achieved with individual channels than is apparent from assessment of the total system.
Table 14. Treatment Performance of Letlhabile Constructed Wetland System MediumInfluent NH3-N (mg/1)
Channel
NH,
PO4
NO,
COD
SS
In
18.5
11
43
55
25
1
13
11
33
44
30
2
6.3
12
24
35
1
3
1.0
11
14
35
2
4
2.5
12
14
10
1
5
1.5
11
8.0
10
3
6
1.5
11
4.0
5
1
Table 15. Treatment Performance of Letlhabile Constructed Wetland System High InfluentNH3-N (mg/1)
Channel
NH,
PO4
NO,
COD
SS
In
48
9.8
_
110
37
1
50
12
_
84
38
2
46
13
0.5
70
16
3
38
13
1.5
84
17
4
27
12
2.7
79
8
5
11
10
6.2
59
7
6
2.2
10
0.5
35
1
It is also apparent that, besides N removal capacity, the relative removal rate for all constituentsin the secondary effluent, appears to increase with increasing influent concentration. This canbe considered to be related to the greater availability of the constituent to the resident plant andmicrobial community.

32
Although Table 14 and 15 are presented it cannot be assumed that the system is accuratelyrepresented by sampling at the intermediate points in the flow path. The mechanical systemhas been prone to regular failure with the consequence that partially treated sewage isdischarged directly into the Wetland which has detrimentally affected treatment performance,and largely been responsible for the presence of residual E. Coli. Consequently, a number ofmonitoring occasions detected variable quality between the sample points, related to theoperation of the total system including pumped recycle between the oxidation ponds and thebiofilter. As with Mpophomeni, despite nitrification occurring, pH and alkalinity were notreduced, confirming Wetland systems can have high inherent buffering capacity. Again, nosignificant influence of temperature or growth condition of the plant community has beenidentified at Letlhabile.
7.2.3 Hydraulic Characteristics
Tracer studies demonstrated significant internal mixing and dilution within the channel flow,and that plug-flow is not attained in practice. The dye was initially observed to emerge at a timeequivalent to < 50% of the calculated HRT, to peak within a further 2 hour period and continueto appear up to 6-12 hours after introduction. It was clearly evident that water depth within thechannel affected the apparent HRT as a shallow water depth allowed greater preferential flowand short-circuiting, whilst a deeper water level provided greater mixing and dilution. Theflow path of the dye also illustrated preferential flow paths through the vegetation stands andwithin open water. The dye predominantly flowing along the middle of open water areas andto a lesser extent along edges. Open water areas have a limited hydraulic resistance, other thanthe influences of variations in the depth across the channel, and should nominally demonstratelaminar flow characteristics. In contrast, passage through the dense reed areas significantlyaffects the flow pattern and create turbulent flow.
7.2.4 Solids Accumulation
Letlhabile has suffered mechanical plant failures associated with the Biofilter feed pumps andOxidation Pond recycle pumps. This has caused partially treated wastewaters to be by-passeddirectly into the Wetland system. In addition to the greater solids loads, these greater nutrientloads stimulates plant and microbial propagation within the channels, and subsequentdeposition as sludge and sediment as these plants and microbes subsequently die-off. Operatedas a meandering channel system, the primary pair of channels have been subjected to the higherrelative organic and suspended solids loads. This has resulted in significant amount of solidsbeing deposited, which affects the hydraulics and overall treatment potential.

33
The regular access of domestic animals (including goats and cattle), and rush harvesting hasalso caused some damage to the sandy embankments and channel floors with consequenterosion into the channels water area, further affecting available flow paths, and therebytreatment potential.
7.2.5 Vegetation Development
Sedges were planted on the channel embankments for harvesting and use in craft work, andcontinue to dominate the embankments despite the occasional harvesting and cropping bydomestic animals. Typha communities occupy the majority of the internal channel and a lesserproportion of the embankments. Frogmouths is predominantly located in the lower channelsand accounting for ± 15% of the total reed growth.
Extraction of samples of the reed materials from within the surface water flow areas hasindicated that the root penetration of the reeds into the channel base has been primarilyrestricted to the < 200 mm, and primarily into the light sediment depth of the base surface layerof the channel. More prolific has been the growth of the reed roots in the water layer such thatthe shallow surface waters are not predominantly occupied by scarce stem and leaf structuresbut by a dense, hydroponic, root matrix through which the wastewater should percolate, andthereby improve treatment potential.
7.2.6 Management
Weirs between the channels allow the water level to be raised or lowered for maintenancepurposes in the individual channels The overall HRT can be maintained by balancing thewater levels in preceding or subsequent channels. In the event that partially treated wastewateris introduced, the HRT can be extended by raising the weirs.
Occasional introduction of partially treated sewage directly to the Wetland system during by-pass conditions, and the degrading plant, sludges and sediments, does encourage developmentof excessive levels of mosquito and associated nuisance insects. The operators are advised toraise the water level in the channels for several days when mosquito larvae become excessive,to drown the larvae prior to returning the water level to its operational position.
The operators have been advised to attempt to maintain an open water channel through thesystem which has resulted in the occasional manual removal of Typha from the channels.However, this limited activity is rapidly counter-acted by the regrowth of the Typha within thechannels and appears to have little direct benefit.
34
7.2.7 Management Recommendations
1) Clear Wetland channels and rehabilitate channel embankments and floors.
2) Maintain inlet and outlet sumps clear of vegetation and accumulating sediments.
3) Rehabilitate weir structures and valves
4) Monitor inflow volume and presence of by-pass wastewaters to the primary channel ona daily basis and adjust outlet weir level accordingly to provide required flow balancingand extended HRT.
5) Monitor weir settlings of each pair of channels on a daily basis, and adjust accordinglyto ensure balanced and controlled HRT through the total system
6) Plan and schedule regular mosquito control exercises.
7) Organise and control 'harvesting' and 'cropping' exercises to minimise detrimental impactof such operations on channel integrity. If possible provide a dedicatedchannel, or new open 'marsh' area where sedges and/or rushes can be specificallycultivated rather than interfering with a wastewater treatment system component.
8) Maintain channel embankments clear of excessive grass and weed encroachment as a firecontrol management practise.
9) Drain channels down on a monthly basis to assist in the redistribution of solids matteraccumulating within the primary channels, and to deter preferential flow paths frombecoming rigidly established in any of the channels.
10) Ensure the final channel has a well established reed development to assist in the removalof algae and lemna etc that will develop in preceding open water areas.
11) Introduce fish to the channels to assist in insect control.
12) Introduce channel dividers (nominally 200 mm tall) across the width of the channels at± 30 m intervals to assist in maintaining channel hydraulics and isolating sedimentpassage, whilst providing a reasonable minimum water depth for operational control.
35
7.3 LADYBRAND
7.3.1 System Configuration
Ladybrand is a predominantly rural community in the Free State, for which the sewagetreatment system has been constructed as an intermediate approach to wastewater treatment,comprising pond and mechanical components. After coarse screening the sewage is dischargedto anaerobic ponds followed by aerated facultative ponds, passive facultative ponds and finalpolishing and treatment through two Constructed Wetland units The maximum design capacityis estimated at 4 500 m3/d, although average flows of the order of 1 600 m /d have beenrecorded during the investigation periods (Figures 8 and 9).
The Wetlands are operated as vertical flow gravel bed systems, ostensibly for the polishing ofthe algal solids generated in the facultative ponds and residual nutrients and pathogens. Themedia is a graded fine gravel (± 6 mm) of 300 mm depth overlying a 150 mm coarse gravel(±19 mm) base layer, and planted with Typha. The effluent from the facultative pond isintroduced to the Wetland through 3 concrete inlet channels per bed, in a controlled mannerto maintain a water depth of ± 500 mm, filtering downwards through the gravel to be collectedin a drainage network to be drawn off through 3 sets of outlet weir per bed connected to theunderdrain system. The outlets are located on the opposite side to the inlets and lead tomaturation ponds and chlorination prior to release to the water course.
7.3.2 Wastewater Treatment Performance
The combination of anaerobic ponds and the aerated lagoons achieve a high degree of organicload reduction, whilst the bacterial solids carried from the aerated lagoons appear tosettle readily in the facultative ponds. The residual organic and the nutrient load passing intothe facultative ponds encourages development of high populations of algae which is thensubsequently loaded onto the Wetland surface for removal.
Table 16 illustrates the average performance achieved by the Wetland cells. Table 17 indicatesspot sampling of individual Wetland outlet points, and Table 18 microbiological quality of theindividual Wetland outlet points.
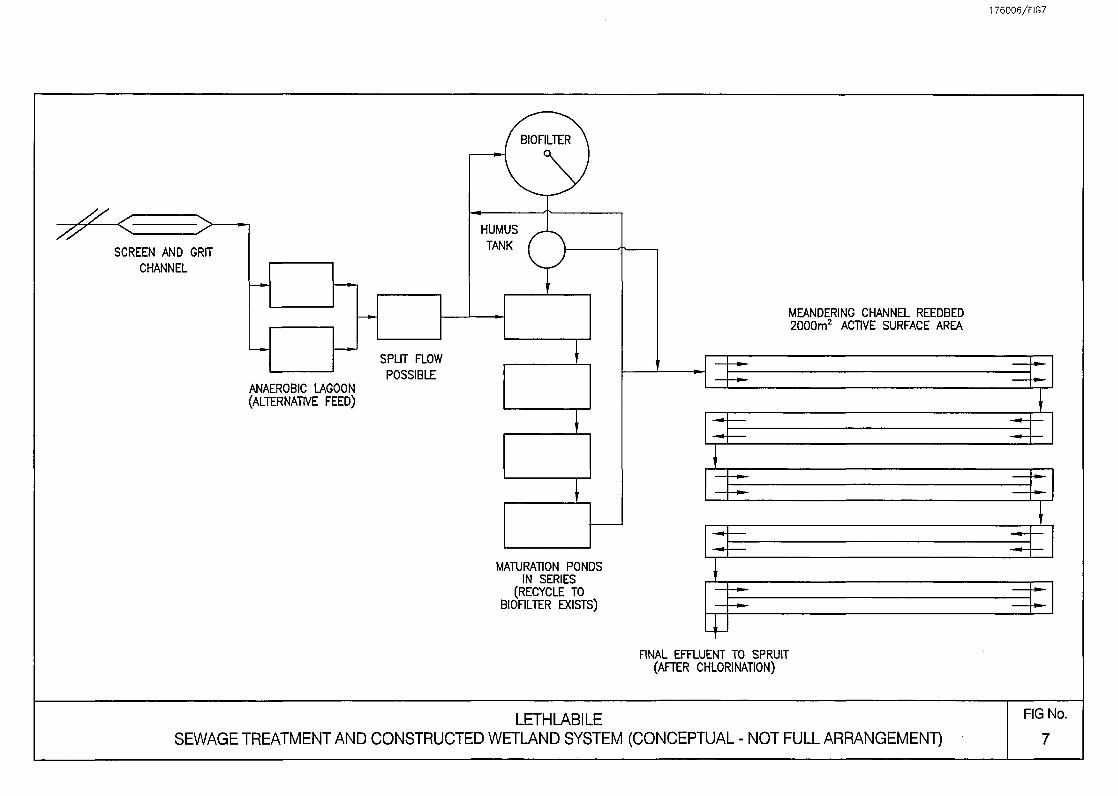
176006/FIG7
SCREEN AND GRITCHANNEL
MEANDERING CHANNEL REEDBED2 0 0 0 m 2 ACTIVE SURFACE AREA
ANAEROBIC LAGOON(ALTERNATIVE
MATURATION PONDSIN SERIES
(RECYCLE TOBIOFILTER EXISTS)
FINAL EFFLUENT TO SPRUIT(AFTER CHLORINATION)
LETHLABILESEWAGE TREATMENT AND CONSTRUCTED WETLAND SYSTEM (CONCEPTUAL - NOT FULL ARRANGEMENT)
FIG No.
7

176006/FIG8
AERATED LAGOONS FACULATIVE POND 1 P O N D 2
s
y N\ y
CREEN AND
4700m 2
GRIT C\
^ ^
WJNEL
4700m 2
ANAEROBIC DAMS
2
360Jjm
S^Jy/T\
3600m2
/T\"
11200m2 4500m2
TA^I II *T1\/C
5900m2 5900m2 7000m2
REEDBED 1 REEDBED 2 MATULATION DAM
DESIGN CAPACITY = 4,2 Ml /d
LADYBRANDSEWAGE TREATMENT AND CONSTRUCTED WETLAND SYSTEM - SCHEMATICS
FIG No.
8

38
Table 16. Performance of Ladybrand Constructed Wetland System
Determinant
PH
TDS
OA
COD
NH,
NO,
NO2
PO,
Inflow
7.0
790
15
162
54
0.7
0.04
174
Outflow
7.2
795
12
115
48
0.6
0.03
178
Table 17. Spot Sampling of Individual Wetland Cell Outlet Pointso of LadybrandConstructed Wetland System
NH,-N
PO4-P
NO,-N
Kj-N
TP
COD
SS
Inflow
44
14
0.9
52
14
162
120
1
51
11
0.2
48
13
92
24
2
36
11
0.3
45
13
80
16
3
40
15
0.2
48
17
66
28
4
36
11
0.0
40
14
80
12
5
30
13
0.1
38
17
86
14
6
30
14
0.1
37
18
78
22
Table 18. Microbiological Quality of Individual Wetland Cell Outlet Points of LadybrandConstructed Wetland System
E.Coli
T.Coli
Inflow
6 700
105
1
3 000
11000
2
3 900
23 000
3
2 400
4 000
4
500
3 000
5
300
5000
6
5 000
7 000
E.Coli/lOOml. T.Coli = Coliforms/lOOml

39
It is evident that although a significant amount of algal suspended solids is being removed bythe Wetlands, what may be considered excessive levels are still present in the outflows, andthe overall nutrient removal is limited, with a maximum NH3-N and PO4-P removal of 30%,with in many cases the outlet quality actually approximating the influent quality.
As with the Mpophomeni Wetland the potential to remove N as the wastewater percolatesthrough the bed is significantly limited by the ability to provide oxygen into the rootzone fornitrification. Whereas denitrification would be expected to be enhanced in the anoxicconditions within the bed where carbon would be readily available from the wastewater anddegrading plant and algal components, the absence of influent nitrate masks any potential thatwould be available for nitrate removal capacity. The low nitrate effluent concentrations dosuggest that any nitrification that has been possible within the bed has been subsequentlydenitrified and removed from the system. It is also considered that the degradation of algalcells and associated plant and microbial material within the Wetland will also contribute N tothe water in a dissolved form which will further mask effective N removal potential whensimply comparing wastewater inflow and outflow qualities.
COD removal has averaged about 50% corresponding to reductions in SS levels. This relativelylow removal potential is considered to result from the availability of the wastewater to passdirectly through the relatively course gravel media and thereby not be filtered and immobilisedto the extent that is possible with fine sand or soil bed Wetlands. As to be discussed in thehydraulic characteristics, it is also apparent that severe short-circuiting occurs which allowsrelatively untreated wastewater to pass indirectly through the system. The difference inoutflow pollutant concentration between individual outlets also reflects a level of preferentialflow within the Wetland which allows some areas to receive greater HRT, and therebyopportunity for treatment.
Although some pathogen removal is evident as the wastewater passes through the Wetland itis relatively low at 90 to 99%, as a result of the short-circuiting occurring through the beds, thecoarse nature of the gravel limiting filtration and immobilisation of pathogens, the relativelyshort HRT available for pathogen destruction, and the cover of the Wetland limiting exposureof the flooded surface waters to UV irradiation to destroy pathogens.
7.3.3 Hydraulic Characteristics
Despite the provision of a defined gravel media, a relatively shallow flowpath through thegravel to the drainage layer, and the vertical flow path as opposed to horizontal, there doesappear to be a hydraulic constraint to the effective performance of the Wetlands. This isconfirmed by monitoring exercises of the outflow volumes from each of the drainage pointswhich demonstrated that, despite nominally equally set levels, there was a 4 times difference

40
in outflow volume between individual outlets, and a difference between the two beds of ±40%.
While an HRT of ± 144 hours is calculated for the flows of 1 600 m3/d and a bed surface areaof 12 000 m2, tracer studies demonstrated the appearance of the dye within 1 hour, indicatingminimal mixing and diffusion has occurred. Adding the dye to the middle inflow point of theWetland cell resulted in visible channelling across the bed surface. The bulk of the dyeappeared at the corresponding outlet channel with some limited diffusion into the side channelsover the period of the discharge of dye, and only traces of dye remaining after 48 hours.
The implication from these results is that rather than the flow being equally distributed acrossthe full Wetland surface area, the system is dominated by short-circuiting and preferential flowpaths developed directly between the influent and effluent points. It is apparent that thewastewater, although introduced at three inlets on one side of the bed does not readily spreadacross the whole bed surface but predominantly short-circuits directly from the inlet down intothe underdrain and away to the outlet. This extreme level of short-circuiting significantlyreduces the effective HRT by at least 10 times and accounts for some of the poor treatmentperformance experienced.
7.3.4 Surface Solids Accumulation
There has been an amount of sediment accumulation on the surface of the Wetland whichaffects the percolation of the inflow vertically into the gravel media by acting as a localisedresistance layer. The sediment layer has arisen from solids carried over from the facultativeponds, as well as the inherent production of plant material which is released into the systemupon the seasonal senescence, which again has tended to accumulate in quiescent zones on theWetland surfaces.
The accumulation of sediment is most pronounced at the inlet side whether sediment broughtin would have the opportunity to settle and deposit as it filtered through the vegetation matrixto distribute water over the bed surface area. It is also evident however, that there aredifferences in the level and position of sediment deposition across the bed surface which appearto have resulted for the preferential flow paths as the water percolates around dense clumps ofreed and seeks the path of least resistance.
7.3.5 Vegetation Development
Although the Wetland cells give the appearance of being a dense stand of Typha, with whichthe Wetland was initially planted, during winter senescence periods where the vegetation wasburnt to clear the surface, it has become apparent that there have remained patchworks oflocalised dense Typha growth interspersed with open water areas and channels. The spread of

41
individual clumps of Typha from the initial planting, rather than the extension of radial rootsfrom which new clumps develop, as is common with Frogmouths growth in Wetlands. Thelocalised growth of the Typha significantly affects the ability to encourage contact with thewastewater and to enhance filtration and minimise short-circuiting and preferential flow pathsaround the clumps rather than physically through them.
When the surface is exposed after burning events, the surface water supports lemna and algaetransferred from the Facultative ponds. Very little evidence of other reeds species such asFrogmouths, sedges or rushes has occurred through natural establishment, and grasses areprimarily restricted to the drier edges of the bed and in some open areas within the bed.
Excavation of Typha clumps also indicated the relatively limited root development within thevertical profile of the bed, with very little root extension below 200 mm. As the majority ofthe bed depth is root free the presence of the plants has little impact upon the ability to createaerobic and nitrification conditions within the depth of the bed, leaving the bed to primarilyfunction as a coarse gravel filter.
7.3.6 Management
Weirs on each of the outlet channels allow the water level to be raised or lowered formaintenance purposes in the individual beds, and theoretically to control flow across the bedwidth. The overall HRT can be maintained by balancing the water levels on the beds. In theevent that sediment accumulation inhibits permeation potential the hydraulic head can beincreased by raising the outlet weirs. The provision of weirs in the individual inlet channelsshould also allow control of the relative flow introduced to each bed, and to the individualareas within each bed.
As the Wetlands are operated in a flooded manner it is not readily possible to get into the bedsto physically harvest the reeds, although a by-pass facility is possible reasonably easy with theLadybrand system. Consequently, the primary management tool to control the plantdevelopment has been to burn reeds back during the winter. Although this is considered toassist in promoting the better development of the reed community in the following season itdoes not remove the plant material in the flooded zone and may still result in the release ofplant nutrient material into the Wetland.
Unlike the Letlhabile sewage treatment plant which has had up to 12 operators and labourerson-site and technical support available from the local authority 2 km away, and Mpophomeniwhich has up to 6 operators, the Ladybrand sewage works generally only has 1 labourer on-sitewhose primary function is to keep the screen clean, with occasional visits from supervisors andmaintenance services. However, it would appear that little attention is paid to the specificmanagement of the Wetland units, which are located some distance from the screen and grit
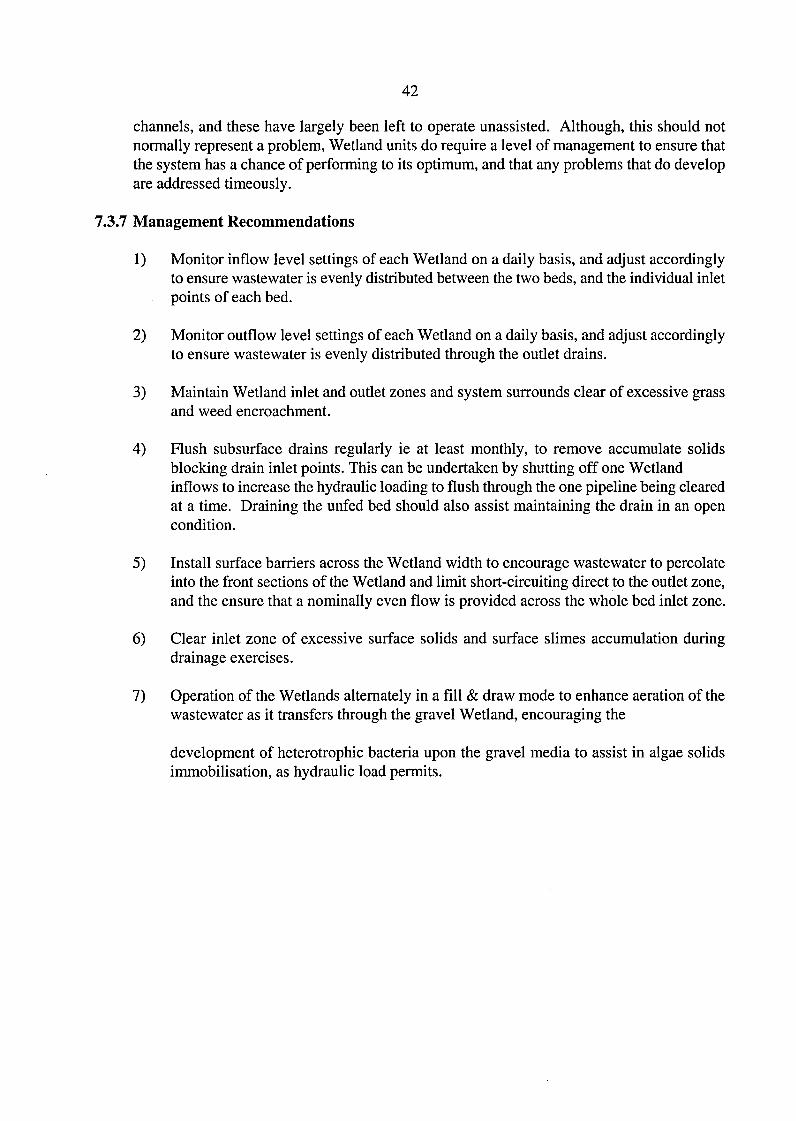
42
channels, and these have largely been left to operate unassisted. Although, this should notnormally represent a problem, Wetland units do require a level of management to ensure thatthe system has a chance of performing to its optimum, and that any problems that do developare addressed timeously.
7.3.7 Management Recommendations
1) Monitor inflow level settings of each Wetland on a daily basis, and adjust accordinglyto ensure wastewater is evenly distributed between the two beds, and the individual inletpoints of each bed.
2) Monitor outflow level settings of each Wetland on a daily basis, and adjust accordinglyto ensure wastewater is evenly distributed through the outlet drains.
3) Maintain Wetland inlet and outlet zones and system surrounds clear of excessive grassand weed encroachment.
4) Flush subsurface drains regularly ie at least monthly, to remove accumulate solidsblocking drain inlet points. This can be undertaken by shutting off one Wetlandinflows to increase the hydraulic loading to flush through the one pipeline being clearedat a time. Draining the unfed bed should also assist maintaining the drain in an opencondition.
5) Install surface barriers across the Wetland width to encourage wastewater to percolateinto the front sections of the Wetland and limit short-circuiting direct to the outlet zone,and the ensure that a nominally even flow is provided across the whole bed inlet zone.
6) Clear inlet zone of excessive surface solids and surface slimes accumulation duringdrainage exercises.
7) Operation of the Wetlands alternately in a fill & draw mode to enhance aeration of thewastewater as it transfers through the gravel Wetland, encouraging the
development of heterotrophic bacteria upon the gravel media to assist in algae solidsimmobilisation, as hydraulic load permits.

43
7.4 BETHLEHEM
7.4.1 System Configuration
Bethlehem is also a predominantly rural town in the Northern Free State, although it has agreater commercial activity than Ladybrand. As a result of a concern over final effluentquality, and particularly phosphate levels, produced by a series of conventional maturationponds receiving effluent at up to 4 500 m3/d from combination Biological Filter and ActivatedSludge system at Bethlehem the maturation ponds were converted into Constructed Wetlands.
Five maturation ponds, with a total surface area of ± 2 ha, were cleared and a media of coarserock from a decommissioned Biological Filter and/or railway ash was installed, prior toplanting with Frogmouths obtained from an adjacent natural Wetland area. The beds operateas horizontal flow subsurface units with a general slope of the Wetland bottom of ± 1%between the inlet and outlet. The inlet depth is ± 600 mm and the outlet ± 1 000 mm. Beds1 to 3 have a surface area of ± 2 400 m2 each, bed 4 is 5 600 m2 and bed 5 is 5 500 m2.
The Wetlands are operated in parallel. The effluent being discharged from the individualcontrol sumps to a chlorination contact channel before discharge to the Spruit. The inletconsist of a single 150 mm cast-iron pipe laid across the bed width and connected into the mainwastewater pipe system from a single, nominally mid-point T-junction. At ± 300 mm intervalsthe pipe has ±10 mm holes drilled into it at approximately the mid level of the pipe. The inletdistribution pipe is then covered with a layer of gravel. The effluent is drawn from the bottomof the outlet zone, again via perforated piping leading to the individual outlet sumps where thewater level can be adjusted as required (Figure 10).
7.4.2 Wastewater Treatment Performance
Although the system was designed to accommodate up to 4 500 m3/d the loading to individualbeds has been erratic, from initially a few hundred m3/d to assist establishment, to 2 000 m3/dthrough bed 5 alone, in receiving the majority of the flow through the works.
Table 9 illustrates performance for the system over a two year period. Table 20 illustrates theoutlet PO4-P concentration relative to flow for each bed. Given the high quality of the influentwastewater the potential for further improvement in quality is limited, and only a ± 40%reduction in COD is achieved and ± 50% NH3-N, NO3-N and SS.
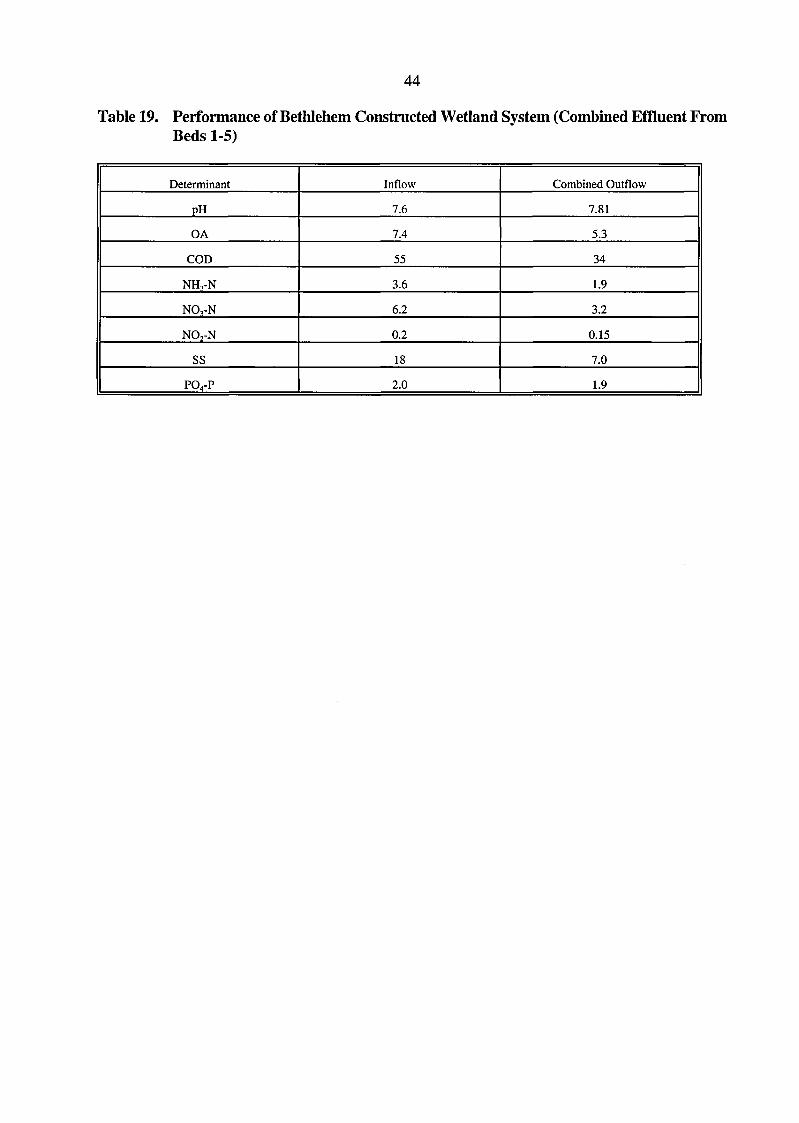
44
Table 19. Performance of Bethlehem Constructed Wetland System (Combined Effluent FromBeds 1-5)
Determinant
pH
OA
COD
NH,-N
NO,-N
NO2-N
SS
PO4-P
Inflow
7.6
7.4
55
3.6
6.2
0.2
18
2.0
Combined Outflow
7.81
5.3
34
1.9
3.2
0.15
7.0
1.9
3800 3000- * • « -
SIDE WALL6mm AGGREGATE
7300
•19mm AGGREGATE FREE WATER LEVEL
V
O °n O O *"„ O ° "„ O "6 °n O °O ° o O °o °_ O °O .
3
EXISTING MATURATION DAMFILLED UP TO REEDBED FLOORWITH IMPERMEABLE CLAY MATERIAL
LADYBRANDCONSTRUCTED WETLAND CROSS-SECTION
FIG. No.
9

TOTAL POTENTIAL FLOWFROM BIOFILTERS = 4500m/DAY
TOTAL AREA = 18300 m 2
NEW EMERGENCYSTORAGE DAM
BETHLEHEM CONSTRUCTED WETLANDFIG. No.
10
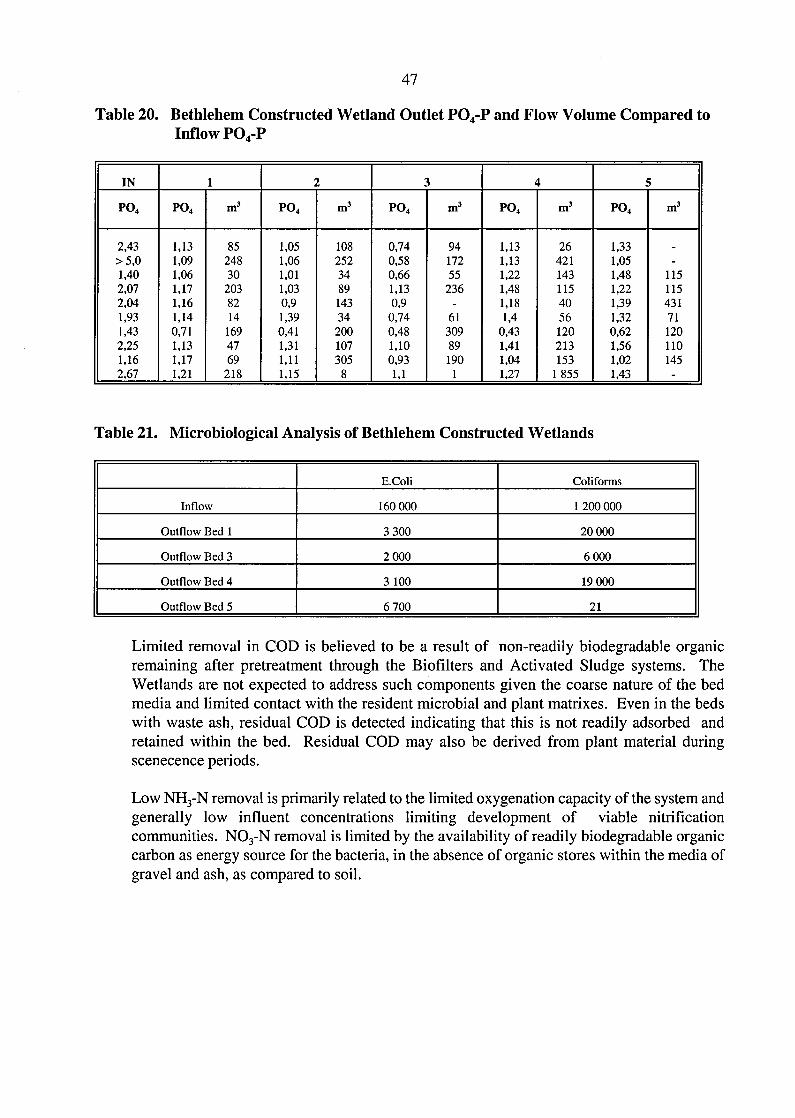
47
Table 20. Bethlehem Constructed Wetland Outlet PO4-P and Flow Volume Compared toInflow PO4-P
IN
PO4
2,43>5,01,402,072,041,931,432,251,162,67
1
PO4
1,131,091,061,171,161,140,711,131,171,21
m3
8524830
2038214
1694769
218
PO4
1,051,061,011,030,91,390,411,311,111,15
5
m3
108252348914334
200107305
8
3
PO4
0,740,580,661,130,9
0,740,481,100,931,1
m3
9417255
236-
6130989190
1
4
PO4
(
1,131,13L,221,481,181,4),431,411,041,27
m3
264211431154056120213153
1 855
PO4
(
1,331,051,481,221,391,32),621,561,021,43
m3
_
-11511543171120110145-
Table 21. Microbiological Analysis of Bethlehem Constructed Wetlands
Inflow
Outflow Bed 1
Outflow Bed 3
Outflow Bed 4
Outflow Bed 5
E.Coli
160 000
3 300
2 000
3 100
6 700
Coliforms
1 200 000
20 000
6 000
19 000
21
Limited removal in COD is believed to be a result of non-readily biodegradable organicremaining after pretreatment through the Biofilters and Activated Sludge systems. TheWetlands are not expected to address such components given the coarse nature of the bedmedia and limited contact with the resident microbial and plant matrixes. Even in the bedswith waste ash, residual COD is detected indicating that this is not readily adsorbed andretained within the bed. Residual COD may also be derived from plant material duringscenecence periods.
Low NH3-N removal is primarily related to the limited oxygenation capacity of the system andgenerally low influent concentrations limiting development of viable nitrificationcommunities. NO3-N removal is limited by the availability of readily biodegradable organiccarbon as energy source for the bacteria, in the absence of organic stores within the media ofgravel and ash, as compared to soil.

48
Although some enhanced PO4-P removal is indicated for the beds incorporating waste ash, itis considered minimal and subsequent to the first two years of operation the benefits ofincorporating the waste ash are not apparent. The implication from this observation is that thePO4-P adsorption potential of the waste ash has become saturated, although the generally poorPO4-P removal from the start indicates the initial capacity was also limited. It may also betaken to suggest that preferential flow paths developed through the ash bed may have mitigatedagainst the full phosphate adsorption potential being utilised.
Table 21 illustrates Microbiological quality where the individual beds achieve ± 99% reductionin E. coli and ± 99.9% removal of Total Coliforms. The lack of difference between the bedperformance again suggests the ash bed, which may have been expected to have a greaterpathogen removal, is performing no better than completely gravel beds.
7.4.3 Hydraulic Characteristics
A primary factor limiting wastewater treatment capacity is the poor hydraulic control throughthe beds and tendency for short-circuiting between inlet and outlet. Despite a projected HRTof the order of 20-24 hours, tracers studies demonstrated the dye emerging within 1 hour, topeak within a 2 hour period, but continue to appear up to 48 hours after initial introduction.
The path of the dye upon its introduction into the bed illustrated a dominant flow path acrossthe surface of the inlet zone prior to descending into the bed media. The dye was also observedto travel along the edges of the bed directly between the inlet and the outflow sump wheresurface ponding provides a zone of lower resistance to flow that the media itself. The tracerstudies illustrated the Wetlands do not operate in a distinct plug flow mode, but that there isinternal mixing, diffusion and retention in the path between input and output.
The predominantly very coarse gravel (> 50 mm diameter having come from obsoleteBiological Trickling Filters) used as the bulk of the media, supplemented with railway ashensures a relatively good permeability. Exercises to assess the void volumes by filling anddraining beds, indicated void volume of the order of 30-50% of the bed volume. Moreimportantly, the rate of the decline, and subsequent rise in water depth, through the bed duringsuch exercises identified significant hydraulic gradients exist. Water 'mounding' was clearlyevident during such exercises as there was a definite surge which takes several minutes to betransferred to the inlet zone as the outlet valves are initially fully opened, and subsequentlyclosed. Collection of outflow to a single point in one corner of each bed also encourages agradient to be generated in the horizontal profile across the bed. The water from the proximityof the drain outlet will be preferentially drawn through the outlet and water from the furtherzones of the bed remain static and drawdown in the vertical profile.
Hydraulic loading experiments demonstrated that the gravel beds can accommodate loadingsof up to 500 mm/d without undue surface flooding, by maintaining the outlet discharge at a
49
low level and providing an acceptable hydraulic lead through the bed length. However, at asurface loading of 250 mm/d the combined ash/gravel bed demonstrated more significantponding even where an equivalent hydraulic gradient is provided.
7.4.4 Solids Accumulation
Surface blinding of the inlet zones appears to be a result of solids carried from the humustanks, some growth of microbial and slimes mass, and deposition of plant litter. The surfaceof the beds appears relatively clear from ± 2 metres from the inlet zone. When the beds areoperated at a low hydraulic load infiltration of the wastewater into the bed system occurs.However, where excessive hydraulic loads occur slimes and sediments are carried furtheracross the bed surface inhibiting the vertical percolation of the wastewater, and causinglocalised ponding, and channelling along the bed sides and direct to the outlet zones.
Dye studies also identified the inability of the inlet pipe to maintain an even distribution acrossthe full bed width due to the fact that the inlet pipes were no longer lying level, that a numberof the outlet holes were not discharging wastewater, and that wastewater was not being evenlydistributed across the bed width as intended. Uncovering the inlet pipe revealed that manydistribution holes had become blocked with a mixture of sludge and leaves from within, andthat the covering of gravel was, at many points, providing a barrier to release of the wastewaterfrom the hole and further encouraging solids accumulation from within against the hole.
During hydraulic loading, and bed draining, exercises no significant amount of suspendedsolids were released, although there was a turbidity to the drainage water and an H2S odourdemonstrating that the water within the Wetland was predominantly anaerobic. Limited solidsdrawn through the bed during draining activities supports the contention that solidsaccumulation within the void volumes over time is limited. The solids within the bedpredominantly undergoing degradation and stabilisation.
7.4.5 Vegetation Development
The reed communities has developed to fully occupy the bed surface area of beds 1 to 3 whichwere intensively planted at construction, and no readily visible 'bald' patches are observed.Again it appears that the relatively low organic loadings, and beneficial climatic conditions,have permitted a proliferation of reeds. The low organic and hydraulic loadings will encouragea combined aerobic and anaerobic microbial community better stabilising the environmentaround the plant roots, the rhizosphere, and minimising the production of toxic anaerobic by-products, particularly H2S and fatty acids. Beds 4 and 5 which were not fully planted initiallystill remain relatively sparsely populated, although many new shoots are visible spreadinghorizontally from existing established reeds.

50
A problem with beds 4 and 5 has been that rather than Frogmouths as planted into beds 1to 3, Arundo donax were planted into beds 4 and 5. The root systems of this grass have notextended more than ± 200 mm in depth, limiting the viable depth of the rootzone throughwhich the wastewater percolates, and inherently encouraging the wastewater to pass underthe rootzone in predominantly anaerobic conditions.
Although shallow root growth is expected for grass species such as Arundo donax, theconventional rootzone reedbed concept assumes that roots will penetrate to occupy, andaerate, the whole bed volume. However, excavations in both the ash and gravel beds alsoindicated that the Frogmouths and Typha root growth was also limited to the top ± 200 mmwith very little penetration to any further depth despite > 5 years of growth. The denser ashmedia appearing to inhibit the effective of root development more than the coarse gravel.
7.4.6 Management
Each bed inlet sump is provided with valving to control the individual bed inflow. Theoutlet sumps are provided with standpipes and three valves which enables the water depthwithin each of the Wetlands to be independently controlled. Under normal operationalconditions the water is maintained at the upper discharge level to optimise HRT throughthe system. On a regular basis the water levels are dropped to allow the inlet and outletzones to be cleared of excess weed growth encroaching from the embankments, and controlof mosquito and other insect life which otherwise proliferate in ponded areas.
Little attention appears to have been given to ensuring that inflow to each of the beds isappropriately monitored and controlled. Each bed has received variable loading, with themajority of the wastewater by-passing beds 1 to 3 and being released into beds 4 and 5. Animplication is that, in providing a gravity feed system to a number of Wetland units inseries, it is necessary to maintain control of the individual flows to prevent overloading orunderloading of individual beds.
Another valuable observation from the Bethlehem systems is the necessity to operate theoutlet drain discharge level to control the water level within the beds at a subsurfaceposition. Adjusting the valve allows the control of the hydraulic head through the bed andto the outlet, but only when effectively managed.
7.4.7 Management Recommendations
1) Monitor inflow volume to each Wetland on a daily basis and adjusted accordingly toprovide each bed with a comparable loading.
2) Monitor outflow valve settings of each Wetland on a daily basis, and adjustaccordingly to ensure water does not pond in the effluent zone and/or excessivelyflood the influent zones.

51
3) Maintain Wetland inlet and outlet zones and system surrounds clear of excessivegrass and weed encroachment.
4) Flush inlet distribution pipelines regularly ie at least monthly, to remove accumulatesolids blocking outlets points. This can easily undertaken by shutting off all otherWetland inflows to cause all wastewater to flush through the one pipeline beingcleared at a time.
5) Monitor inflow distribution across the bed width to ensure that the inlet pipe systemis appropriately levelled and that a nominally even flow is provided across the wholebed inlet zone.
6) Clear gravel and associated vegetation from around the influent pipe distributionnozzles and allow wastewater to flow freely onto the inlet zone.
7) Replace Arundo donax (Spanish Grass) in beds 4 & 5 with Frogmouths reed aspossible.
8) Replace inlet flow metres as possible.
9) Drain beds down on a monthly basis to assist in the redistribution of solids matteraccumulating within the bed, and particularly from the inlet zone, and to introduceaeration to the lower bed levels.
10) Clear inlet zone of excessive surface solids and surface slimes accumulation duringdrainage exercises.
11) Operation of the Wetlands with the outlet drain position set at a mid-point level toenhance aeration of the wastewater as it transfers through the upper levels of theWetland, as hydraulic load permits.
7.5 KRUGER NATIONAL PARK
7.5.1 System Configuration
The Kruger National Park has adopted the Wetland technology for the treatment of thewastewaters generated by the camps throughout the Park. The larger camps, such asLethaba, Olifants, and Skukuza were initially provided with conventional Oxidation Pondsystems, whilst the smaller camps of Crocodile Bridge and Shingwedzi were identified assuitable for Constructed Wetlands at a time when the Wetland technology in South Africawas just being introduced in the late 1980's. During 1992-93 the Park installed Wetlandsystems at each of their camps either to polish pond effluent or to treat the septic tankeffluent directly. There are presently 17 systems in operation

52
The Wetland units generally follow a common format, being designed to accommodate themaximum possible number of visitors that are to be accommodated at the camp at any onetime, and then providing an additional contingency of ± 25% to account for limitations inthe knowledge of the technology and the desire to be conservative rather than risk furtherproblems. Additional contingency is built into the hydraulic capacity of the beds in that themedia depth has been set at 1 000 mm, rather than the generally accepted depth of 600 mmfor Rootzone systems, but less than the Mpophomeni bed depth of 1 500 mm which wasused as an example of the technology at the time of the initial interest in the approach.
The Wetland systems also generally consist of two beds of river sand operated in series toensure adequate organic load capacity and disposal of effluent via evaporation andinfiltration from the bed rather than unnecessary discharge to the local rivers, which wouldinherently attract wildlife to the discharge which is also undesirable.
7.5.2 Wastewater Treatment Performance
Table 22 illustrates the performance of 3 Kruger Park constructed wetland systemsreceiving septic tank effluent. The Crocodile Wetland indicates a better PO4-P removalefficiency than the other systems which is believed to be a result of the greater PO4-Padsorption potential of the sand media in this system, and partially the significantly denservegetation development in the Crocodile system which has been in operation for > 7 years.
COD and SS removal has generally been as good as would be expected from basically sandfiltration beds, but the presence of surface short-circuiting at Mobeni and Tshokwane, andcontainment of the effluent in the discharge sumps allowing algal and bacterialdevelopment, results in elevated effluent pollutant qualities.
NH3-N removal is limited by the ability of the nitrifying bacteria to compete for theavailable oxygen in the system. Although > 70% removal in NH3 -N is indicated for theCrocodile bridge system this is achieved at an HRT in excess of 5 days (assuming minimalshort-circuiting potential). Each of the other sites where an effluent is being dischargedfrom the primary Wetland demonstrate significantly poorer NH3-N removal efficiency,generally < 25%. This poor performance is primarily related to poor vegetationdevelopment on the bed surface and the propensity to short-circuit.
Each of the Wetland, has a second Wetland cell to receive the overflow. Usually thedischarges from the primary beds is adsorbed within the secondary beds and no finaldischarge occurs. Although this suggests the Wetlands designed are over-sized it isnecessary to see this in respect of the greater desire to protect the receiving environmentand not to produce a discharge steam which may attract wildlife to the sites with consequentimpact upon the integrity of the site.

53
7.5.3 Crocodile Bridge Wetland System
The Crocodile Bridge Wetland system one of the two original Wetland units has receivedseptic tank effluent for almost 7 years with little direct management other than occasionalremoval of excess above ground plant. The system consists of two beds of river sandoperated in series of which only the first Wetland has to date been planted withFrogmouths. The second Wetland is to contain and polish discharges from the firstWetland prior to discharge to the Crocodile river.
Table 22. Performance of 3 Kruger Park Constructed Wetland System ReceivingSeptic Tank Effluent
pH
TDS
Ec
T.Alk
COD
OA
NH r N
PO4-P
Ca
Mg
Na
Cl
ss
CrocodileBridge
In
7.55
787
108
390
166
23
44
6.4
37
22
105
90
4
CrocodileBridge
Out
7.25
748
102
215
23
11
10.5
1.3
35
33
105
99
3
Mopani
In
7.3
929
127
510
142
18
25
5.6
25
55
121
105
28
Mopani
Out
7.65
1187
158
175
35
12
29.25
6.2
36
66
204
138
4
Shingwedzi
In
6.9
518
72
290
135
18
36
7.2
29
15
46
31
15
Shingwedzi
Out
7.15
570
79
325
30
10
33
5.4
39
17
66
34
3.5
7.5.4 Hydraulic Characteristics
Based upon a projected HRT of the order of72-96 hours, automatic samplers were only setto sample the discharged effluent over the first 48 hours to indicate any early break throughand to provide an indication of the treatment performance, whilst visual observation by theplant supervisor over following days was undertaken to indicate the release of the dye andthe extent of the discharge pattern.
The period over which dye emerged from the bed clearly illustrated that the Wetlands arenot operating in a distinct plug flow mode, but that there is internal mixing, diffusion andretention in the path between input and output. The tracer studies also illustrate that if

54
practical hydraulics of small scale systems are not engineered correctly into larger systemsthe expected performance may be severely jeopardised.
Due to the density of the vegetation growth within the Wetland, and the apparentprevalence of snakes within the Wetland, it was not possible to enter the Wetland to assessthe extent of surface ponding and the path of the dye into the bed itself. However, theabsence of vegetation on the secondary bed did clearly illustrate that despite the relativelypermeable sandy media, surface ponding readily occurs. Elevated organic load in the feedto the primary bed enhancing slime and bacterial development causes a significantly greaterponding effect at the inlet of the primary bed than observed in the secondary.
7.5.5 Vegetation Development
It was not easy to get into the Wetland centre to assess the root system development of theplants but individual examples of the Reed community dug out from the edge of theWetland demonstrated that the root system which could be removed easily was relativelyshallow ie the bulk of the root system was < 300 mm in length, indicating that the reeds arenot actively extending their root systems in the vertical direction when water is relativelyreadily available to them, and the media itself provides resistance to penetration.
The depth of the Wetlands at ± 1 000 mm allows a substantial part of the bed volume, andthe wastewater that occupies the voids, not to be in contact with the plant root system, andtherefore available for biological and physico-chemical interactions with the plant systemand the treatment potential that this offers. It is also possible that the presence of rootmaterial in the upper bed zones rather than enhancing permeability by opening up channelsand providing channels through dead root systems, practically inhibits permeability in asand material. Consequently, the path of least resistance through the bed may be throughthe root free zones of the lower bed and the bulk of the wastewater may not contact withthe rootzone to any significant degree. Passage through a predominantly anaerobicsubsurface and sub-rootzone system may be considered to account for the limited ammoniareduction achieved through the Wetlands, despite relatively extended HRT's and generallygood COD reduction.
7.5.6 Management
Wastewater from septic tank and/or and primary pond systems, is collected into a concretesump from which a number of outlet pipes (usually 3) transfer the wastewater to thedischarge points across the inlet of the Wetland. Since the pipework to the inlet points isburied, it is not possible to adjust the levels of the pipes to ensure an even distribution ofwastewater to each section of the inlet zone. At the relatively low flows to which theWetlands are generally subjected, a difference of 1 or 2 mm in collection or discharge levelhas a significant impact upon the distribution of the wastewater to the inlet zone.

55
A limited number of inlet positions across the width of the Wetland restricts the distributionof the wastewater, particularly where the media is relatively impermeable. Surfacechannelling is apparent emanating from the individual inlet pipes out across the surface ofthe Wetland rather than spreading widthwise to optimise percolation efficiency.
In recognising that the earlier Wetland inlets encouraged the ponding and channelling ofwastewater on the bed surface the more recent inlets comprise of an angled down-pipe intoa coarse gravel inlet zone ostensibly to encourage the wastewater to penetrate directly intothe lower depths of the bed and optimise subsurface flow characteristics. The approachappears to improve wastewater penetration into the beds. This is possibly a result ofanaerobic conditions within the depth of the bed being less prone to bacterial slimedevelopment which occurs on the aerobic surface layers, and possibly that the inlet pipe bycoarse gravel increases the surface area open for infiltration, whilst discharging direct to asand surface creates a limitation to percolation.
Total subsurface flow by introducing the wastewater to the bottom of the bed is not feasiblewhere there is an inherent resistance to percolation from the Wetland media. Sandy mediahas limited permeability potential in relation to the hydraulic load imposed upon theimmediate area around the inlet downpipes. Consequently, the wastewater seeks its pathof least resistance, that being to flood the coarse gravel layer to break onto the bed surfacearound the inlet down pipe as if the downpipe was not present.
7.5.7 Management Recommendations
1) Provide inlet distribution across the whole width of the Wetland rather than atisolated, ie 3, individual points, to enhance infiltration potential and to minimiselocalised ponding. This can be achieved by increasing the number of inlet pipes,providing a perforated pipe across the inlet zone, providing a distribution pipe witha number of adjustable T-pieces rather than individual inlet pipes, and/or providinga coarse gravel zone across the whole inlet area into which the wastewater isdischarged and which will inherently enable the wastewater to distribute through thewhole inlet zone and subsequently into the base media.
2) Wetlands need not be > 500 mm deep, the greater depth to which the reed root systemwill actively penetrate, to economise on construction cost and to reduce short-circuiting through the base layer where the root system does not hinder percolation.
3) Monitor outflow stand-pipe outlet settings of each Wetland on a daily (weekly asappropriate) basis, and adjust accordingly to ensure wastewater does not excessivelyflood the influent zones. As the beds are composed of river sand with limitedhydraulic permeability potential over the lengths of the Wetlands as established, it isrecommended that the outlet weir height be maintained at the mid-height point inbeds with low inflow and as required at even lower levels in beds with an outflow.

56
4) Allow primary beds to fill on a bimonthly basis prior to dropping outlet weir positionback to the lower operational level to assist in the redistribution of solids matteraccumulating within the bed, and particularly from the inlet zone, and to introduceaeration to the lower bed levels.
5) Maintain Wetland inlet and outlet zones clear of excessive grass and weedencroachment.
6) Rush inlet distribution pipelines regularly ie at least weekly, to remove accumulatedsolids blocking the surface of the inlet zones.
7) Monitor inflow distribution across the bed width to ensure that the inlet pipe systemis appropriately levelled and that a nominally even flow is provided across the wholebed inlet zone.
8) Clear gravel and associated vegetation from around the influent pipe distributionnozzles and allow wastewater to flow freely onto the inlet zone.
9) Clear inlet zone of excessive surface solids and surface slimes accumulation duringdrainage exercises.
8 DISCUSSION OF SOUTH AFRICAN EXPERIENCES
Within the discussion of the individual systems consideration has been given to the reasonsfor limitations in the treatment performance, whether subsurface flow (horizontal andvertical), and surface flow configurations. A fundamental finding is that the hydrauliccontrol of the system is essential to the effective operation of the system as a wastewatertreatment technology. Low permeability of the bed media tends to encourage surface flowrather than filtration through the bed for systems internationally designed for subsurfaceflow, and similarly, surface flow systems demonstrate significant short-circuiting. Thesefactors minimise available residence times and contact opportunity for optimal treatment.
Although success has been achieved on the pilot scale, by mixing bed medias to optimisepermeability, difficulties arise with large systems in maintaining adequate heterogeneity inthe mixing and difficulties in preventing short-circuiting and preferential channelformation. Blending tends to set a permeability reflecting the content of fine particles andclays, ie. the blending of soil with a permeability of 10"7m/s with a gravel of 10'1 m/s in a1:1 ratio does not create an effective permeability of lO^m/s. The permeability may remainof the order of 10~6 m/s depending on the potential to develop hydraulic channels, andchemical reactions that affect the structural stability of the media. If blending is to beenvisaged careful laboratory evaluations should be undertaken initially to prevent thedevelopment of problems after a full scale system has been constructed.
57
Operation in the vertical mode may also encourage channelling. Considering theMpophomeni experience, it is possible to project that at a flow of 500 m3/d a vertical bedof 1,5 m deep 50 m by 50 m would theoretically create a unit hydraulic velocity of200 mm/d. If this Wetland were to operate in the horizontal flow mode the unit hydraulicvelocity would be 6 670 mm/d as the flow has to flow through an area of 75 m2 in thevertical cross-section. This suggests that, depending upon the vertical cross-section of theWetland, the horizontal subsurface flow systems require a media which can be an order ofmagnitude flow more for the same volume of wastewater.
It has also been demonstrated that the flow path of the wastewater is also considered toaffect the ability of the Wetland to remove P. Horizontal flow Wetlands have a longer pathlength than vertical Wetlands and can take advantage of less important mechanisms (eg.plant uptake and solid state diffusion). Since vertical Wetlands have a short path length,the loss of adsorption and precipitation media through dissolution may constitute animportant loss of resource. A longer path length implies a larger store of substrates.
At loadings of 100 mm/d with secondary effluent it should be possible to achieve anacceptable permeability and P removal with most available soils and clay/sand mixes forvertical flow systems. Horizontal flow systems will require lower loading rates to achievethe same relative permeation potential due to the increased path length. The design loadingof 200 mm/d appears to be optimistically high for clay based systems, but local conditionsmay allow such, and even higher loadings dependent upon the degree of treatment requiredand the relative adsorptive capacity of the soil.
The Letlhabile system has demonstrated the potential, and benefits, of Wetland systems tomaintain good final effluent quality, despite variable performance of the more conventionalsecondary wastewater treatment process preceding the Wetland. This is particularlyadvantageous in accepting that South Africa is prone to interruptions of the electrical supplyas a consequence of climatic and local service conditions and that technical back-up forsmall local sewage works is generally limited to effectively respond to ensure dischargesto the receiving water environments are well protected.
It has been practice to burn the plant growth on an annual or biannual basis, ostensibly toencourage regrowth and reduce surface weed growth. However, it is apparent that the plantlitter in surface flow systems, and on the surface of systems designed for subsurface flowbut experiencing permeability problems, positively contributes to the sediment, nutrient andpathogen removal capacity of the system by acting as a living biological filter. Byharvesting down to the bed surface level, treatment potential can be compromised.
The experiences of Bethlehem and the Kruger Park systems has demonstrated that there isa clear opportunity for short-circuiting within a gravel and sand subsurface flow systemswhen operated in a horizontal configuration. If this flow path dominates the hydraulics ofthe whole system the subsurface flow essentially reverts to a surface flow and one couldsave significantly on the construction costs by negating the gravel or sand media and thesubsurface drainage network, the primary capital cost items of the subsurface flow system.

58
The experience of Ladybrand has clearly illustrated the difficulties in optimising verticalflow through a coarse media to optimise retention within the wetland and to minimiseshort-circuiting. In such cases, a sand media would be preferable for vertical flow systems.
Despite less than optimal flow conditions and limited plant contributions to pollutantremoval, the South African systems do demonstrate significant potential for wastewatertreatment. Surface flow systems receiving secondary sewage can achieve removals of CODand SS up to 20 g/m2/d, NH3 and NO3 removal up to 1.5 and 6.0 g/m2/d respectively, butlimited pathogen removal of 99%, and low phosphate removal. Subsurface flow soilsystems are severely limited by permeability, but where flow is maintainable for secondarywastewaters, COD, SS, NO3 and PO4 removal can be in excess of 85%, and pathogenremoval of 105 fold, but NH3 removal is low, <30%, due to poor oxygen transfer to therootzone. Subsurface flow gravel beds can achieve high COD removal rates at loadings upto 100 g COD/m2/d with settled sewage, acting as anaerobic filters. Secondary units arethen required to polish residual organic, nutrients and pathogens.
9 GUIDELINES FOR THE IMPLEMENTATION OF CONSTRUCTED WETLANDS
9.1 Primary Wastewater Treatment
• For the treatment of primary wastewaters such as septic tank and anaerobic pondeffluents, agricultural and industrial wastewaters with an organic character(>500 mg/0 COD), it is recommended that a gravel bed SF system be implementedto provide primary organic reduction in conditions that will limit odour generation.
9.2 Maximum Loading
• Primarily based upon the detailed investigations of the South African CSIR, loadingto the primary bed can be as high as 100 gCOD/m2/d and 1 000 0/m2/d with anexpectation of > 60% reduction in COD and SS. In practice, it is recommended thatat least two primary beds each loaded at a maximum of 50 gCOD/m2/d be constructedto provide flow and load contingency.
9.3 Bed Depth and Media
• To optimise anaerobic processes in the bed depth and allow extended degradation ofresidual solids and organic whilst minimising odour generation potential and possibletoxic effects on the plant community, the primary bed may be 700-1 000 mm deepcontaining washed gravel of 20-40 mm diameter and void fraction of > 50%.
9.4 Inlet Distribution
• Wastewater should as far as possible be introduced across the full bed width. Tofurther optimise and control hydraulic integrity the length : width ratio should be asgreat as practical site topography and permeability (Kf) potential of the media, as

59
determined by D'Arcy's Law, will allow at the given hydraulic loading. A minimumlength to width ratio of 1:1 is recommended for washed gravel, and maximum of 3:1.The inlet zone should be of coarse media to accommodate the elevated unit organicand solids loadings and to allow clearance, as and when required.
9.5 Terracing
Where practical a terraced arrangement and/or series of cells will allow greaterhydraulic control and assist in minimising short-circuiting potential and optimisesredistribution of flow. Open water and baffled areas within the flow path can assistin maintaining hydraulic integrity through the Wetland system.
An irregular site may be adapted to provide a desired configuration by theincorporation of baffling or meandering channels in both the FWS and SF option.
9.6 Parallel Cells
• The provision of parallel discreet Wetland units allows flexibility in operation andthe capacity to alternate feeding regimes to encourage simultaneous nitrification-denitrification and overall waste water treatment potential.
9.7 Vertical Flow
• Vertical flow beds should contain graded media to restrict channelling of thewastewater directly to the underdrain. A surface layer of coarse river sand overlyingpea gravel is recommended above the drainage layer. The drainage layer should bearranged to collect the underflow from across the full bed area rather than localisedareas.
• Integrated vertical flow units, at > ± 200 f/m2/d, should be provided with parallel cellsallowing for alternate feeding and draining regimes, operating single beds on a dailybasis, and return after between 3 and 6 days.
9.8 Secondary Wastewater Treatment
• Secondary treatment, after a primary SF cell, may be accomplished with either a FWSMarsh, a Pond, a shallow, (250-400 mm), gravel SF, or a Biological Trickling Filterto optimise nitrification potential. The selection being depended upon treatmentpriorities, site location and relative economics of SF media as compared to FWS,open pond or Biological Filtration.
60
9.9 Secondary Organic Loading
Secondary FWS and SF Wetland units can be loaded at 15-30 gCOD/m2/d or 100-200 0/m2/d with an expectation of a further 60% reduction in COD and SS load and> 30-50% reduction in ammonia. A recommended design loading would be15 gCOD/m7d.
For nitrification-denitrification in a shallow SF or FWS system a loading of 2-5 gNH3-N/m2 may also be applied with the recommendation being to design for a lowerloading, ie 2g NH3-N/m7d.
A biofilter loaded at 5m3/m2/d top surface area should achieve comparablenitrification but would have limited overall NO3-N removal if identification isrequired, a Biofilter may be followed by subsequent polishing through an FWS or SFWetland.
9.10 Tertiary Wastewater Treatment
• Where a pond or shallow SF unit is utilised the resultant effluent may require finalpolishing. A FWS Wetland of macrophytes or grass, or a low rate or recirculatingsand filter loaded at 100-200 C/m2/d should suffice.
• For PO4-P and pathogen removal it is preferable to provide a suitable iron rich media,either as a soil or a soil-sand-gravel mix for which hydraulic permeability can bemaintained either by the selection of permeable media mix, the provision of terracingor intermittent loading to draw the water through the media matrix. Coarse waste ashor equivalent may be utilised but leaching of salts and dissolution of fines inhibitinghydraulic integrity must be accounted for.
• Wetland systems are able to remove lOMO5 pathogens/100 mf, at HRT's >7 days, butthey are not expected to produce pathogen free discharges. This is due to the limitedhydraulic time within the Wetland system, and the additional contribution fromanimal and birds frequenting the Wetland.If General Standard final effluent quality is required some form of disinfection shouldbe provided.
9.11 Hydraulic Control
• Hydraulic integrity is the over-riding factor in ensuring optimal treatmentperformance. Outlet collection and transfer facilities between Wetland cells shouldallow for collection across the width of the bed and not encourage preferential flowto a single point.
• Hydraulic and Organic Loading rates indicated above should be used only as a guideand tailored to specific treatment objectives and individual site conditions.

61
Recirculation of effluent between cells, the provision of aeration cascades, or moresophisticated aeration and recirculation facilities can improve overall treatmentperformance by providing additional hydraulic control and better distribution of thecontaminant loads throughout the cells.
Intermittently loading the cells enhances overall treatment efficiency, particularlynitrification and total nitrogen removal.
For the maintenance and control of water level within the cells, the level of waterdraw-off should be flexible and adjustable.
The basic requirements for effluent control are:
a) When the system receives maximum flow, water mounding should not resultin surface flow in the upstream section of the bed.
b) When the system receives low flow, the outlet level should be controlled tomaintain adequate water depth throughout the bed to prevent drying out of theplant root systems, particularly in highly permeable gravel horizontalsubsurface flow systems.
c) The depths of root contact in water should be as uniform as possible.
Only where native ground conditions may make seepage excessive or threatengroundwater contamination is it necessary to seal the Wetland bed with a clay orsynthetic liner.
9.12 Plants
Local Wetland plant species, preferably Frogmouths should be used for the primarySF and FWS cells, although Typha and Schoenoplectus are acceptable, with densegrass such as blue, bermuda or kikuyu grass in shallow, (<100 mm) FWS/Meadowunits.
Planting density should be as numerous as economically viable to provide in relationto creating as rapid establishment of good plant cover as possible. Planting may becarried out with nursery cultivated seedlings or clumps of shoots obtained from alocal natural or Constructed Wetland. Plant spacing should be ± 9/m2 in small bedsbut may be reduced to ± 3/m2, or even 1/m2 in large Wetlands as an economymeasure.
In most cases harvesting of the vegetation is not required, but may be undertaken toencourage more complete cover of the bed surface and to discourage preferentialchannel formation. Where excess plant material is accumulating the bed may beburned annually without detrimentally affecting system integrity.

62
9.13 System Monitoring
• In order to ensure that the Wetlands are developing and subsequently operatingefficiently it is advisable that regular inspections and water quality sampling ananalysis be performed, and flow/water level monitoring included in the managementof the systems. Monitoring of the system and plant development and basic health ona regular basis would also permit control measures to be taken timeously in the eventof flow/water level and water stress problems or aphid infestations occurring.
•10 CHALLENGES/FUTURE RESEARCH OPPORTUNITIES
Table 23. Challenges for Future Development of Constructed Wetlands for WastewaterTreatment and Pollution Control (adapted from Haberl 1994)
Application
Treatment of Primary Settled and SecondaryTreated Sewage
Tertiary Effluent Polishing
Domestic Water Treatment
Environmental Enhancement
Urban/Rural Run-off Management
Toxicant Management
Land-fill and Mining Leachate Treatment
Industrial Effluents
Sludge Management
Biomass Production
Groundwater Recharge
Pretreatment and Storage of Water for ReuseSchemes
Some Challenges/Research Opportunities
Provision of complete integrated Wetland systems, including nutrient removal, forall community sizes.
Long-term maintenance of functionality particularly in regard to phosphorus andnitrogen removal, and paltogen destruction
Development of Constructed Wetland potential for providing clean drinking waterin degraded catchments
Establishment of appropriate species diversity for integrated Wetland systems.
Identification of appropriate sites and strategies for Constructed Wetland systemsand associated, design, operation and maintenance requests.
Development of understanding and modelling of the processes by which metalsand organic can be immobilised and/or transformed
Development of understanding and modelling of the processes by which metalsand organic can be immobilised and/or transformed
Development of understanding and modelling of the processes by which metalsand organic can be immobilised and/or transformed
Long-term disposal of residues which may contain substantial levels of heavymetals and toxic material
Identification and development of uses and viable markets for Wetland products
Development of understanding of the potential of Wetlands as GroundwaterRecharge systems.
Assess levels of treatment appropriate to different reuse options and localeconomics

64
A WASTEWATER POLLUTANT REMOVAL MECHANISMS
A.I Treatment Performance of International Constructed Wetland Systems
Table Al illustrates the analysis of the performance of FWS systems for the removal ofTSS, BOD5, TP, TN and Faecal coliforms (Kadlec 1994).
Table Al. Regression Analysis of FWS Constructed Wetland Systems Performance(Kadlec 1994)
Constituent
TSS
BODj
TP
TN
FC
Regression
Co = 5,1+0,16 QR2 = 0,23, N = 1 582
S.E in Co = 13,6
Co = 4,7 + 0,17 QR2 = 0,62, N = 440
S.E in Co = 13,6
C0 = 0,34Ci0,9()
R2 = 0,73, N = 369S.E in In Cn = 1,09
C o - 0 ,75 Ci0,75 qo,O9
R2 = 0,36, N = 353S.E in In Co = 0,60
Co = 6,66 C i034 ! o,5iR2 = 0,36, N = 107S.E in log Co = 2,16
Limitations
0,002 < q < 28,60,1 < C, < 8070,0 < Co < 290
0,27 < q < 25,410 < C, < 680
0,5 < Co < 227
0,11 < q < 33,30,02 < Cj < 20
0,009 < Co C 20
0,02 < q < 28,60,25 < C, < 400,01 < Co < 29
0,02 < q < 28,60,25 < C, < 400,01 < Co < 29
Unit
cm/dmg/Cmg/{
cm/dmg/fmg/f
cm/dmg/fmg/C
cm/dmg/Cmg/C
cm/dmg/fmg/f
Co = outlet concentration mg/C, q = hydraulic loading rate cm/d, Q = inlet concentration rng/f
Table A2 (from Knight 1992) illustrates the performance data for 69 FWS and 15 SF orHybrid Wetland systems in the USA, predominantly receiving secondary wastewaters andranging in size from 40 m2 to 1 093 hectares. Tables A3,4 and 5 for European systemspredominantly receiving primary wastewaters from Brix (1993), and Table A6 performanceof the Egyptian GBH system from Loveridge (1993).
Table A2. Treatment Performance of USA Constructed Wetland Systems (FromKnight, 1992 Area use variable)
Constituent mg/f
BOD,
Suspended Solids
NH,-N
Total Nitrogen
Total Phosphorus
Influent
38,3
49,4
7,5
13,9
4,2
Effluent
10,5
15,3
4,2
5,0
1,9
% Removal
73
69
44
64
55

65
Table A3. Treatment Performance of Dutch Surface Flow Constructed Wetland System(Area use >20 mVp.e from Brix 1993)
Constituent nig/C
BOD5
COD
Kjeldahl-N
Total-P
Suspended Solids
Influent
257
530
55
14
260
Effluent
11
70
22
4.2
10
% Removal
96
87
40
30
96
Table A4. Treatment Performance of European Subsurface Flow Constructed WetlandSystems (Area use ± 10 mVp.e from Brix 1993)
Constituent mg/C
BOD5
Total-N
Total-P
Suspended Solids
Influent
97
28.5
8.6
98.6
Effluent
13.1
18.0
6.3
13.6
% Removal
86.5
36.8
26.7
86.2
Table A5. Treatment Performance of Vertical Flow Constructed Wetland Systems(Area use ± 5 nrVp.e from Brix 1993)
Constituent mg/C
BOD5
COD
Total-N
NH4-N
PO4-P
Suspended Solids
Total Coliform/lOOml
Influent
200
300
40
35
8.2
200
29 990
Effluent
<10
<10
30
<1
0.2
<10
0
Removal %
>95
>95
25
>97
98
>95
>99.99
Table A6. Treatment Performance of Gravel Bed Hydroponic (GBH) Horizontal FlowConstructed Wetland (Area use < 5 mVp.e from Loweridge 1993)
Constituent mg/C
BOD5
Suspended solids
NHj-N
T.Coliforms/lOOml
F. Coliforms/lOOml
Influent
92
77
20
440 000
210 000
Primary BedEffluent
19
15
4
20 000
9 000
Secondary BedEffluent
10
8
1
4 000
2 000
Removal %
>90
90
95
99
99

66
A.2 Organic Load Removal (COD/BOD)
Constructed Wetlands generally function as low rate attached growth biofilters for thedegradation of organic waste water pollutants. The plant material, sediments and bed mediaprovides the support and attachment surface for microorganisms able to anaerobically,anoxically and aerobically, (dependent upon oxygen source available) reduce the organicpollutants to CO2, CH4, H2S etc and produce new microbial cells and inert residual solids.
The slow decomposition of plant matter accumulating on the bed surface also provides amatrix of low bulk density, high water holding and cation exchange capacity and therebya high potential to biologically transform organic material and nutrients.
A detailed assessment of Constructed Wetland systems in the USA (Knight 1992) indicatesthat BOD removal rates tend to be consistent over time and does not appreciably diminishat the higher loading rates of over 300 kg/ha/d, remaining at between 70 - 90%. Treatmentefficiency appears to reduce at low loading rates or inlet concentrations (5 -10 mg BOD/1)believed to be as a result of internal BOD generation and possibly insufficient media formicrobes at such low concentrations, although Green (1994) reports some UK gravel andsand bed systems receiving high quality secondary effluents consistently produced effluentswith BOD of 1 mg/C or less.
Removal rate appears to reduce at HRT below to 5 days, with an optimum at ± 7 days.Reed (1988) has suggested a reaction rate equivalent to:
K2O = Ko (37,31 V'172)
in which KQ = 1,839 for typical wastewaters and 0,198 for industrial wastewaters with highCOD.T| = porosity.
Overloading of organic materials may result in clogging, decreased treatment efficiency,and odour emissions (Reed 1988). In circumstance where there is a large oxygen demandupon the roots, the root itself will be starved of oxygen and die (Armstrong 1990).
A.3 Suspended Solids Removal
Constructed Wetlands generally have long hydraulic residence times allowing particulatesolids to settle within the Wetland. Additional removal mechanisms are provided bybacterial growth or adsorption to other solids (plants, pond bottom and suspended solids).The outflow suspended solids levels are generally minimal.
Build-up of detrital solids within the system is generally considered low as a result of longretention times allowing mineralization mechanisms. Mitsch (1993) reports an annualsediment accumulation from 6 to 20 mm/y, with high inflow Wetlands having highersediment accumulation rates than low flow inflow Wetlands. The inlet areas may require

67
additional attention where high loadings per unit area are evident. Kadlec (1993). foundsolids removal to occur predominantly in the initial 20 - 40% of the Constructed Wetland.
Since the removal of suspended solids is primarily as a result of sedimentation andattachment mechanisms the removal efficiency is generally very high in Wetland systemsup to loading rates greater than 150 kg/ha/d, with an optimal HRT of ± 5 days. As withorganic removal, SS removal efficiency decreases at low input concentrations (Knight1994).
A.4 Phosphate Removal
Removal of phosphate through a Constructed Wetland is primarily by:
• Absorption to inorganic fractions within the media, particularly Fe, Al, Si andCa compounds;
• Absorption and absorption to organic and inorganic fractions within theWetland matrix;
• Plant, algal and microbial uptake.
Since phosphate removal is predominantly determined by physico-chemical immobilisationwith media and sediment components the ability to contact the wastewater with the media,and the chemical composition of the media and sediments determines the effectiveness withwhich phosphate can be removed. Adsorption alone cannot account for all the phosphateremoval over a long period of time. According to the Freundlich or Langmuir equations,the adsorption equilibrium is reached in a few hours. Subsequent mechanisms of slowmineralisation and insolubilisation that involves chemical precipitation, biological activitiesor both, are not well known (Aulenbach 1988). It has been observed that soils have thecapacity to regain, and in some cases enhance, their adsorptive capacities after apparentlyhaving reached saturation and subsequently been allowed to rest. The phenomenon isexplained by the slow dissolution of aluminium and iron compounds creating new sites foradsorption of phosphate with time (Ellis 1967). Alternate drying and wetting restore theadsorption capacity of soils (Ryden 1980), and precipitation and transformation process insoils also contribute (Craft 1993).
Typical maximum Total phosphate removal for unharvested natural Wetlands is given byKnight (1992) as 0,3-0,4 kg/ha/d, although plant uptake is obviously species and conditionrelated and can account for between 0,05 - 1,1 kg/ha/d. Due to natural senescenceconditions, much of assimilated material can be re-released with long-term plant phosphateremoval being as low 0,002 - 0,05 kg/ha/d. Newman (1993) found an average retention of1,46 kg/ha/d as a result of plant uptake and other immobilisation mechanisms, whilstMitsch (1993) found low flow (14 - 20 mm/d) Wetlands retain 1.14 -1.57 kg/ha/d whilehigh flow (48-54 mm/d) Wetlands retain 3.70 - 7.83 kg/ha/d.
In attempting to quantify the physico-chemical phosphate removal potential of ConstructedWetlands Mann (1990), determined maximum phosphate sorption capacity of 26 and

68
48 mg/kg for two gravel types used for subsurface flow beds, and Jenssen (1992) 4 Kg/m3
for light expanded clay aggregate (LECA). Gale (1994) determined phosphate sorptioncapacities of 196 and 281 mg/kg for sandy soil used in surface flow
Constructed Wetlands. Subsurface flow systems tend to encourage chemicalprecipitation of phosphate, at least in the short-term, with removal rates as high as 15kg/ha/d, and effluent concentrations below 0,5 mg/C where the media is of an iron oraluminium rich character, and hydraulic permeability is maintained.
A.5 Nitrogen Removal
Ammonia can be removed during passage through a Constructed Wetland by severalprocesses:
• Biological oxidation to nitrate through nitrification;• Volatilisation as nitrogenous gases to the atmosphere at elevated pH;• Absorption to organic and inorganic fractions within the soil/plant microbial
matrix;• Plant, algal and microbial uptake.
Nitrite is usually found as a transition form in very limited concentrations tending to berapidly converted through to nitrate as the primary oxidised form of nitrogen.
Nitrate is removed by:• Biological reduction to nitrous oxides and nitrogen gas through denitrification;• Absorption to organic and inorganic fractions within the soil/plant microbial
matrix.
Where low organic and hydraulic loads are applied to the Wetland, the SF and FWSsystems can then become essentially a low rate nitrification biofilter whereby nitrifyingbacteria are able to compete for sites on the media, sediments and the plant litter matrixwith the aerobic heterotrophs. Adequate oxygen to support a degree of nitrification canthen be supplied via direct diffusion from the atmosphere as well as that produced by theplants themselves (Williams 1992; Loveridge 1993).
Nitrification is limited by the availability of oxygen to the microorganisms and competitionfrom alternative demands on the oxygen, consequently ammonia removal rates inconventional FWS Wetlands appears to be of the order of 10 kg/ha/d where 70 - 90%removal may be expected (Knight 1992). Nitrogen removal rates in SF Wetlands tends tobe low due to the limitations of oxygen transfer except where aeration is enhanced bydesign or operation, where ammonia removal can exceed 50 kg/ha/d. Hammer (1994) citesconservative loading for Toyal Nitrogen at less than 3 to 5 kgTN/ha/d and hydraulic loadingrates about 20 to 30 mm/d to achieve outflow concentrations of less than 5 mg/f.
Total nitrogen removal, requiring nitrate removal can be related to the availability oforganic carbon with rates of up to 100 kg/ha/d potentially available where nitrate rich
69
waters are combined with correspondingly organic rich wastes. Where the availableorganic carbon has already been removed, nitrate removal can be related to the availabilityof carbon from the resident plant and biomass communities and capacity of endogenousdenitrification which limits TN removal to ± 10 kg/ha/d for FWS Wetlands where aerobicsurface waters predominate.
Removal efficiency is reportedly variable with loadings between 10-80 kg/ha/d believedto be a response to the availability of carbon under anoxic conditions. Rogers (1990 foundhigh nitrogen removal possible with vertical flow Constructed Wetlands, 91% TN removalat a loading of 10 mg/mVd and 5 cm/d, of which > 90% was attributed to plant uptake. VanOostrom (1994) also found nitrogen removal rates as high as 9,5 g/m2/d, and an average of5,2 to 5,5 gN/m2/d for Wetlands treated abattoir effluent with 50% recycle over a plantedmatrix. The plants (including plant litter) were considered to be responsible for about 50%of nitrogen removal, and developing anaerobic conditions responsible for denitrification.
SF Wetlands generally show good nitrate removal because of the greater capacity to createanoxic conditions and opportunities for immobilisation of high populations of facultativebacteria within the media ecosystem. TN removal in FWS Wetlands tends to decrease atdesign HRT's of below 5 days (Knight 1992).
A.6 Pathogen Removal
Pathogenic bacteria and viruses are removed by such mechanism as:
• Die-off from exposure to unfavourable conditions, including UV in sunlight,and temperatures unfavourable for cell reproduction;
• Predation by other microorganisms resident within the Wetland system;• Absorption to organic and inorganic fractions within the soil/plant microbial
matrix;• Inactivation by inhibitors produced by plants and microbes within the Wetland
system.
Pathogen removal is primarily related o the exposure of the wastewater to UV sunlightirradiation and adsorption to plant, microbial and media materials. Subsurface flowsystems, particularly soil media, can achieve removals of 4 - 5 orders due to an enhancedability to immobilise the pathogens within the soil bed. (Bavor 1994, Williams 1994).Bavor (1992) reports reductions of 3 to 5 orders of magnitude demonstrated for faecalcoliform populations and a range of other indicator bacteria and viruses, demonstrating acapability to reach recreational standard water quality (20 faecal coliforms/100 mil). Rivera(1994) only reports removal of 13,6 to 68% for faecal coliforms from SF gravel Wetlandunits in Mexico, and 4,9% to 99,9% for systems in the UK. Although the presence ofplants appears to improve the removal efficiency the difference of < 10% is insignificantcompared to the several orders of magnitude of bacteria present in wastewater.
70
Parasite removal of up to 100% was recorded in planted gravel beds, although present insoil based systems effluent. Williams (1994) found four gravel beds operating at a retentiontime of about 6 hours, 2 to 3 log reduction in indicator bacteria, and viruses are typical,suggesting adsorption is an important pathogen removal process. Netter (1994) reportingof a septic tank effluent treatment soil based SF Wetland which has operated for 10 yearsfound microbial removal at 103 to 104. However, the mean hydraulic retention time was 25to 40 days.
B THE ROLE OF THE PLANTS AND BED MEDIA IN WASTEWATERTREATMENT
B.I Contribution of the Wetland Plants To Wastewater Treatment
Although the plants are the most obvious components of the Wetland ecosystem,wastewater treatment is accomplished through an integrated combination of biological,physical and chemical interactions between the plants, the media and the inherent microbialcommunity.
The plants were previously, and are still often, claimed to provide adequate oxygen via itsrootzone to encourage oxidative degradation of the wastewater organic and nitrogencompounds passing through the system. In practice, the amount of oxygen that can bereleased by the plants is now appreciated to be nominal in most SF systems, and limited tothe immediate environment around the roots (Armstrong 1990; Brix 1992).
The limited aeration around the roots effectively prohibits the wastewater from attainingoxidative conditions, and ensures that anaerobic conditions will predominate unless theorganic load to the Wetland is itself low, and/or that the Wetland is shallow enough toensure that the majority of the bed volume will eventually become occupied by an effectivemacrophyte root system able to 'leak' a reasonable amount of oxygen into the bed, oraeration devices are incorporated into the Wetland design (Burka 1990; Davies 1992;Batchelor 1994).
The benefits of the plants in wastewater treatment Wetlands can then be summarised as:
i) Aesthetics. The primary benefit of a vegetated Wetland as compared to a simple soilor gravel filter for organic and suspended solids reduction is that it adds an aestheticand ecological appeal to the wastewater treatment unit.
ii) Odour Control. A secondary benefit is that the plant and associated litter layerprovides a natural odour biofilter, which assists in limiting odours from the system,such that it can be safely positioned relatively close to the community for which it isto serve.
iii) Wastewater Treatment. A third benefit of the plants and surface litter biofilter isthat the wastewater is subjected to aerobic and anaerobic treatment as it passes
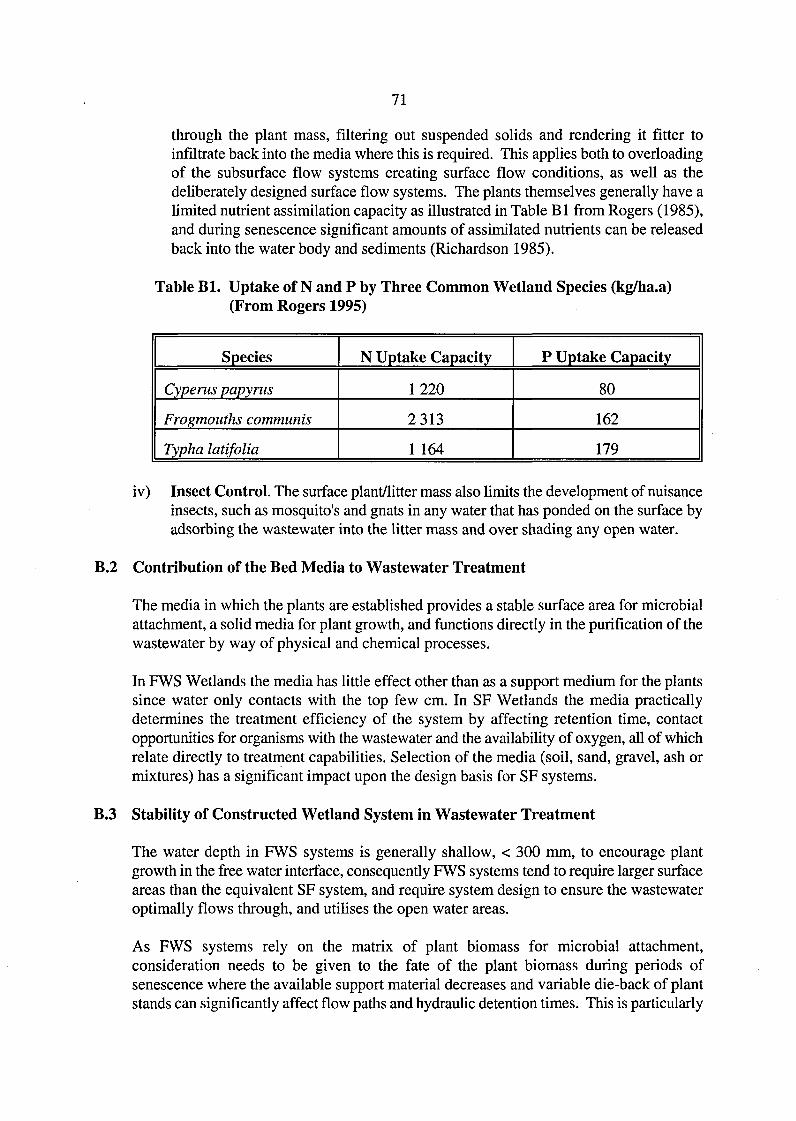
71
through the plant mass, filtering out suspended solids and rendering it fitter toinfiltrate back into the media where this is required. This applies both to overloadingof the subsurface flow systems creating surface flow conditions, as well as thedeliberately designed surface flow systems. The plants themselves generally have alimited nutrient assimilation capacity as illustrated in Table Bl from Rogers (1985),and during senescence significant amounts of assimilated nutrients can be releasedback into the water body and sediments (Richardson 1985).
Table Bl. Uptake of N and P by Three Common Wetland Species (kg/ha.a)(From Rogers 1995)
Species
Cyperus papyrus
Frogmouths communis
Typha latifolia
N Uptake Capacity
1220
2 313
1 164
P Uptake Capacity
80
162
179
iv) Insect Control. The surface plant/litter mass also limits the development of nuisanceinsects, such as mosquito's and gnats in any water that has ponded on the surface byadsorbing the wastewater into the litter mass and over shading any open water.
B.2 Contribution of the Bed Media to Wastewater Treatment
The media in which the plants are established provides a stable surface area for microbialattachment, a solid media for plant growth, and functions directly in the purification of thewastewater by way of physical and chemical processes.
In FWS Wetlands the media has little effect other than as a support medium for the plantssince water only contacts with the top few cm. In SF Wetlands the media practicallydetermines the treatment efficiency of the system by affecting retention time, contactopportunities for organisms with the wastewater and the availability of oxygen, all of whichrelate directly to treatment capabilities. Selection of the media (soil, sand, gravel, ash ormixtures) has a significant impact upon the design basis for SF systems.
B.3 Stability of Constructed Wetland System in Wastewater Treatment
The water depth in FWS systems is generally shallow, < 300 mm, to encourage plantgrowth in the free water interface, consequently FWS systems tend to require larger surfaceareas than the equivalent SF system, and require system design to ensure the wastewateroptimally flows through, and utilises the open water areas.
As FWS systems rely on the matrix of plant biomass for microbial attachment,consideration needs to be given to the fate of the plant biomass during periods ofsenescence where the available support material decreases and variable die-back of plantstands can significantly affect flow paths and hydraulic detention times. This is particularly

72
important in FWS systems as plant senescence also coincides with reduced temperaturesand associated biological reaction kinetics.
Attachment sites in a SF system will tend to be more stable than in a FWS system,microbial concentrations will be expected to be greater, and temperature fluctuations lesssignificant. These factors should result in a more balanced organic degradationperformance, particularly under winter conditions. Whereas nutrients assimilated in theplant biomass of FWS systems is potentially released directly into the surface water, wintersenescence nutrients are more likely to remain immobilised in the media matrix of SFsystems.
FWS Wetlands do permit algae and floating macrophyte communities to develop in the freewater interface which tend to be significantly more photosynthetically active thanmacrophytes in generating O2, and indirectly in removing CO2 from the water causing anincrease in water pH towards the alkaline which can assist phosphate precipitation andammonia volatilisation.
Sediments and plant litter forming on the soil surface of FWS Wetlands also provides asupplemental carbon source for denitrification such that nitrogen removal can readily occursimultaneously, whereas nitrogen removal in SF systems is severely limited by the abilityof oxygen to get to the subsurface water flow and nitrification occurs where organicdemand is removed.
A further aspect to the FWS's is the general need to provide some form of nuisance insectcontrol, particularly mosquitos, which readily proliferate in shallow wastewaters. Althoughnatural Wetlands tend to have developed natural biological balances, FWS's require theprovision of fish, usually Gambusia species, which will harvest the nuisance insects andmaintain an acceptable insect population level. As systems develop there will usually bea natural immigration of other predator species, particularly frogs, and other amphibianswhich will further contribute to insect control.
C. CONSTRUCTED WETLAND DESIGN MODELS
Although Constructed Wetland systems have been implemented internationally for over 20years, there are still disparities in design philosophy and practical performance reliabilityof operating systems. It is also apparent that design models which are based uponidentifying a large number of limiting factors and reaction kinetics is not always practical,particularly where the primary consideration is for a relatively simple design basis for a lowmaintenance technology.
Early Constructed Wetlands specifically designed for wastewater treatment tended to adoptthe SF approach where the wastewater was encouraged to flow through the media in whichthe plants were established rather than over the surface. The design basis reported in theliterature for this approach tended to assume a simple relationship between biologicaldegradation of BOD and hydraulic detention time proximating to first-order plug flowkinetics (Boon 1985);
Ce = Ci exp (-K.t)

73
where Ci and Ce = influent and effluent BOD5 mg/0, K = temperature dependent rateconstant, d"1, t = hydraulic detention time, d.
A generalised rate constant (K) of 5,2 is reported to describe the removal of BOD fromsewage in a bed which is to be 600 mm deep operated at a minimum temperature of 8°C,approximating to 2,2 m2/p.e for domestic sewage BOD and suspended solids removal.However, except in low-risk situations where the effluent quality is not critical this seemsto be optimistic (Tannersdorf 1986; Cooper 1988) and the European Guidelines (WRC1990) recommend a KB0D rate constant, of 0.1 for design purposes, or a Wetland surfacearea of 5 m2/ person served by the system for settled domestic sewage or septic tankeffluent. This largely ignores the specifics of hydraulic and reaction kinetic factors, nutrientand pathogen removal requirements.
The Water Pollution Control Federation, Manual of Practice, (WPCF 1990), indicate thetemperature coefficient be based upon a modified van't Hoff-Arrhenius equation, where:
KT = K2O(1,O6)T-20
KT = rate constant at temp T, d"1; K20 = rate at 20 °C, d"1; and T = operating temp °C.
This description of biological degradation rate constants is supported by several authors(Tchobanoglous 1980; EPA 1988; Conley 1991; Crites 1992) although Conley (1991)suggests 0,7 d"1 for preliminary design, noting that coefficient impacts upon bed volume notalways represented in designs based upon surface area and a shallow bed depth.
In the SF concept, to ensure predominantly subsurface flow is maintained, the EuropeanGuidelines (Cooper 1990) recommend hydraulic slope be provided according to D'Arcy'sLaw as:
(dh/ds) = Qs/(Ac.Kf)
dh/ds = bed slope inlet to outlet, m/m; Qs = average flow, mVs; Kf = hydraulic conductivityof full developed bed, m/s; Ac = cross-sectional area of bed, m2.
Although it has been suggested that conductivity of a soil based Wetland would stabiliseto ± 3 x 10"3 m/s as the root structures develop flow channels (Boon 1986), this has not beenfound to occur in practice and the European Guide (Cooper, 1990) further recommends thata design hydraulic conductivity of no greater than the original media be used. It is similarlyadvised that the length : width ratio of the Wetland should provide wastewater velocitiesthrough the media which will not encourage short-circuiting, scouring or erosion. Boon(1986) indicated a maximum velocity of 6.4 m/d for soil bed systems.
Simple Wetland system design models based upon hydraulic detention time calculated asa function of the subsurface bed void volume and flow rate ignores the practicalities of themedia not being homogenous in character and the presence of the roots, rhizomes andmedia debris. The US EPA Guidelines (1988) recognise the hydraulic constraints of soilmedia and recommend the use of sands or gravelly sands in SF systems. Table Clillustrates data presented for the reaction kinetics and hydraulic conductivity for sand based

74
SF systems:
Table Cl. Hydraulic Conductivity and Reaction Rates for Subsurface Flow MediaTypes (From EPA 1988)
Media Type
Medium Sand
Coarse Sand
Gravelly Sand
Max 10%Grain Size.mm
1
2
8
Porosity(n)
0.42
0.39
0.35
HydraulicConductivity(KJ -Vitf.d
420
480
500
1.84
1.35
0.86
In practise, a large proportion of the wastewater pollutants are entrained within a limitedarea of the inlet zones or headworks to be degraded over time, and does not become effluentBOD. Reed (1988) proposed that the overall BOD reduction in the Wetland can then berepresented as:
Ce/Ci = F.exp (-K.t)
where F is the fraction of BOD which does not settle out in the inlet zone.
Crites (1992) indicated the F fraction can range from 0.52 for primary or septic tankeffluent to 0.75 for pond effluent and 0.8 for secondary or tertiary effluents. The differencein F fraction largely being considered to be related to the characteristics of the suspendedsolids, and potential to settle or be filtered through the inlet zone. Primary effluentsgenerally have readily settleable solids, whilst secondary and pond effluents generally haveless readily settleable suspended solids, particularly algae and colloidal solids.
The detention time is corrected for the fraction of Wetland volume occupied by plants andlitter, using a void ratio typically 0.75 (Reed 1990). Consequently, a Wetland system maybe better defined as a number of unit processes, providing a high rate primary zone for upto 75% of the organic load removal and then secondary and possibly tertiary units todegrade the residual pollutants.
Although these assumptions have primarily been related to FWS systems, the basis isapplicable to SF systems and consideration needs to be given to the validity of presentheadworks BOD loss for conditions of significant evapotranspiration or rainfall, and wheretransient conditions occur, such as those occasioned by pump shut-off or start-ups, rainevents, and the diurnal cycle of evapotranspiration (Kadlec 1989).
In his review of Wetland system design Tchobanoglous (1992) presented a model whichcharacterises the fate of pollutants in a one dimensional (horizontal) direction, given by:
-Vx d-dCA ck
+ Dxdx2
+G

75
a = total porosity, mVm3; B = retardation factor accounting for sorption and phase changeCA= concentration of compound A, g/m3; Vx = average fluid velocity in the X-direction,m/s; Dx = effective longitudinal diffusion coefficient, m2/s; x = distance, m. G = lumpedparameter used to account for all generation terms, g/m7s. G accounts for rate expressionsfor processes including bacterial conversion, gas adsorption/desorption, sedimentation,natural decay, adsorption, volatilisation and chemical reactions.
Rather than the first order, saturation and Monod-type rates commonly used to define theprocesses occurring in Constructed Wetlands, the materials balance for a contaminantsubject only to adsorption is given as:
dS/dt \b/a + dC/dt = -Vx dC/dx
S = mass of solute sorbed per unit mass of dry materials (composite function may berequired, depending on type of Wetland), g/g; \b = bulk density of the material comprisingthe solid surfaces in the Wetland, g/m3; a = porosity; C - concentration of contaminant inthe liquid phase, mg/f; Vx - average fluid velocity in the X (inlet to outlet) direction, m/s.
The US EPA (1988) recommend that factors accounting for the coefficients of specificsurface area for microbial growth be considered for FWS Wetlands, such as the surface areaof vegetative stems and leaves in the water column. For SF Wetlands the specific surfacearea for microbial growth is considered important but not critical, whilst the media porosityis critical in predicting the required area for a given level of treatment. Media porosity istaken to have a direct relationship with microbial degradation rate constant. Such detailedmodels, although providing significant insight into the functioning of defined ConstructedWetlands, are difficult to relate to practical conditions, and particularly to large Wetlandexpanses, where the flow characteristics and retardation factors are not homogenous andtherefore not definable in terms of simple plug flow kinetics.
Whether the Wetland is operated in a surface flow mode or subsurface, experience isdemonstrating that flow hydraulics are not uniform, which subsequently becomes theprimary limiting factor in determining the hydraulic retention within the Wetland andcontract opportunities. (Kadlec 1988, Kadlec 1992, Haberl 1992, Netter 1992, Wood 1994).The observations of Kadlec (1992) relative to FWS Wetlands appear equally applicable tothe SF regime. The mixing characteristics of wastewater flowing through a Wetland arean intermediate between plug flow and well mixed, where the open void areas are likely tobe mixed and dense areas plug flow, even for long narrow Wetlands. It may also thereforebe interpreted that as with Kadlecs finding for freewater systems, assuming plug flowconditions in subsurface Wetlands can produce rate constants that are in error by as muchas a factor of 4, and the hydraulics possible within the Wetland effectively control theperformance of the system rather than the unit degradation rates, temperature constants,settlement and immobilisation within the inlet zone, or rates of oxygenation.

76
D DESIGN GUIDELINES
D.I Siting
When planning the siting of a Constructed Wetland system for wastewater treatment thefollowing factors have to be considered:
• elevation of land in relation to the town (or wastewater treatment works) i.e. gravityflow versus pumping is to be considered,
• topography (whether steeply sloping or flat) and whether valleys or depressions couldbe made use of to reduce costs,
• type of soil (rocky, clayey or sandy soil), which influences excavation.• groundwater pollution potential; i.e the distance from water sources, boreholes and
wells.• prevailing winds. Wetlands should preferably be down wind of the residential area.
If correctly loaded and well operated, and keeping mosquito breeding in check,secondary treatment Wetlands need not be further than 300 m away fromthe nearest habitation, for treating volumes of greater than 250 m7d, and as close as25 m for individual houses or volumes less than 1 mVd.
D.2 Layout
Wetlands on flat ground may have any practicable shape. Overflows from Wetland cell toWetland cell could consist of sufficiently large connecting pipes, overflow weirs, or rip raparrangements which could function to aerate and further distribute the effluent across thewidth of the Wetlands when passing from one Wetland to another. On steeper ground, theWetland would be long and narrow along the contours and special overflows have to bedesigned.
Sub-dividing the required surface area into individual units allows greater hydraulic control,flexibility in maintenance, and treatment reliability. These may be further arranged to offerparallel or series flow. Compartmentalisation also allows integration of independentWetland components ie subsurface flow pretreatment, ponded areas and marshes, tooptimise treatment and site limitations.
D.3 Organic Loading
Organic loading should be designed to limit odour and insect problems or hydraulicproblems in the inlet zones. The loading may also be determined by the carbon requiredto enhance nitrogen removal via denitrification where the primary objective of theindividual Wetland cell in nutrient removal.
The EPA Design Guidelines (1988) suggests the upper loading of Wetlands is of the orderof 110 kg BOD/ha/d which is comparable to the recommended loading rates forStabilisation Pond systems in South Africa (WISA 1988). This loading seems to have beenbased upon the assumption that BOD removal is determined by the amount of oxygen thatcan be supplied by the plants and surface diffusion. This assumption discounts the

77
significant amount of BOD that is removed anaerobically and anoxically as well asimmobilised within the sediments for prolonged degradation. The Tennesse ValleyAuthority (Gover 1994) recommend a design limit of 0,24 kg/m2/d of BOD at a Wetlandsystems inlet area, which can be increased as high as 0,49 kg/m2/d of BOD in large systems,systems on steep slopes, and where reduced inlet width is advantageous (Gover 1994).Such loadings are comparable to loadings recommended for Biofilter systems in SouthAfrica which may be considered to be far better aerated. High influent loadings maytherefore tend to allow anaerobic conditions to dominate, with subsequent odour generationto be considered in the location of the site.
D.4 Hydraulic Loading
Hydraulic loading is generally determined by the organic or nutrient loading forming theprimary design basis. Where the system configuration is for a SF system, the hydraulicloading can be a more significant factor in determining the length to width ratio ofhorizontal flow systems or the overall surface area of vertical flow systems.
FWS systems generally have hydraulic loading rates less than 200mm/d whilst hybridsystems generally range for 50 to 200mm/d, and Constructed SF Wetlands range from 20to 30 mm/d. From the review of USA experiences, Knight (1992) recommended HLRs notexceed 25- 50mm/d for FWS and 60-80mm/d for SF Wetlands.
For SF Wetlands it has been suggested (Boon 1986) that superficial velocity be kept under8,6 m/d to prevent disturbance of the root-rhizone structure and subsequent poorplant growth and to allow sufficient contact time for treatment. This guideline restricts theuse of long, narrow beds or beds with steep hydraulic gradients. Although it seemsreasonable to restrict the superficial horizontal velocity there does not appear to be a strongtheoretical basis for the maximum value published. For gravel bed channels Green (1993)reports an optimal loading to the inlet width to be 0,4 m/m3 at a bed depth of 0,6 m being5 m7m3.
D.5 Detention Time
Treatment performance is related to detention time which the wastewater is retained withthe system. This is determined by the void volume in the system and water depth.Estimating the detention time in a Wetland system can be difficult. Flow characteristics cancreate dead zones as well as preferential flow paths. Similarly, changes in development ofthe plant cover and surface topography affects both flow paths and void volume over time.
Knight (1992) reports a detention time of 6-7 days as optimal for primary and secondarytreatment in FWS Wetlands, whereas longer periods can give rise to stagnant anaerobicconditions, but are required for significant TN and TP removal. SF Wetlands have beenfound to perform highly efficiently at detention times of < 1 day in terms of BOD and SSremoval (Cooper 1990; Green 1994; Combes 1994; Hiley 1994).In several cases efficientlyat TN and TP removal where suitable loading conditions and media are provided,particularly where operated in the vertical intermittent flow regime (Williams 1992; 1994;Cooper 1994; Haberl 1994).

78
D.6 Evapotranspiration/Infiltration
The water losses due to evaporation and infiltration can affect the feasibility of the variousWetland designs in arid climates, and their performance during peak summer months.Infiltration would be expected to be low in relation to the hydraulic loading rate of mostConstructed Wetland systems, but may be of concern if groundwater protection is requiredor the loading is so low or irregular that for certain periods the Wetland system may entera negative water balance situation.
Evapotranspiration rates from Wetlands and lake evaporation are roughly equal (Hammer1992, Martin 1994), although on a short-term basis the vegetative effects can be variable,due to growing season enhancement and off-season mulching effects of litter. Marsh(1994) utilizes an evapotranspiration/evaporation water loss factor of 0,85 x site pan.
Infiltration or seepage rates will be variable dependent upon site factors such as the basesoil conditions, degree of compaction upon construction, natural sealing capacity of thewastewater by physico-chemical and biological interactions and slimes development, andthe ability of plant roots to penetrate the base and create preferential flow paths.
Knight (1990) reports measured values for Florida cypress domes were from 1.3 to 4 mm/d,0.0mm for a Michigan fen and 5 mm/d in a converted rice field Wetland in South Carolina.
D.7 Pretreatment
Some form of pretreatment, at least to the primary level, is typically used for SF Wetlandsystems. Systems without pretreatment are reported to have frequent clogging at theinfluent end, excessive surface deposits, and problems with insects and odours (Bucksteeg1985). Primary treatment using septic or conservancy tanks is suitable for small tomoderate sized systems. Several recent Chinese systems treating combined domestic andindustrial wastewater incorporate a primary Upflow Anaerobic Sludge Blanket (UASB)reactor, resembling a large upflow septic tank, as pretreatment for gross organic andsuspended solids removal prior to FWS and SF Wetlands (Hu 1994). As a low technologyapproach Anaerobic and Facultative Ponds may be an acceptable form of preliminarytreatment but can add large concentrations of algae as evident at the South Africa
Constructed Wetland Systems of Ladybrand and Lethlabile. In these cases a variable leveldraw-off in the lagoon may help reduce the algal load on the Wetland component.
D.8 Aspect Ratio
Treatment performance is largely the ability to ensure the full bed area is utilised and thatshort-circuiting is minimised and contact with the plant roots and stems optimised. Thiscan be achieved by the provision of a high length to width ratio, or adequate inflowdistribution and outflow collection, and placement of internal baffles as flow integrators.Knight (1992) found that for FWS Wetlands the removal efficiency for BOD and TNincreases and apparently levels off at a length:width ratio greater than about 4:1 to 6:1,although efficient systems have operated at ratios of up to 75:1.

79
For horizontal flow SF Wetlands the hydraulic permeability of the media tends to set thelength:width ratio. The lower the permeability the greater the length such that SF systemstend to mainly be 1:1 or less. Where the media is highly permeable ie coarse gravel, andhydraulic gradient is enhanced by base sloping and outlet level control SF channels of 50:1can, and are, successfully utilised. In particular the longer channel configuration is believedto enhance the capacity to remove carbon and simultaneously nitrify and denitrify in asingle unit by allowing oxygen gradient to be generated along the path length.
D.9 Water Depth in Free Water Systems
The water level in systems and the duration of flooding can be important factors in theselection and maintenance of Wetland vegetation. Typha grow well in submerged soils andmay dominate in standing water of over 150 mm. Frogmouths and other reed species occuralong the shorelines of water bodies where the water table is below the surface but will alsogrow in water depth of deeper than 1 500 mm. Rushes, such as Scirpus, can tolerate longperiods of submergence and occur at water depths of 75-250 mm, above which than tendto be out competed by Typha or Frogmouths. Sedges, such as Cyperus, generally prefermoist partially submerged soils.
Where alternative Wetland plant species are to be considered for environmental or aestheticrequirements it is necessary to consider the hydrological adaptability of the plant inselecting its position and suitability for the Wetland system.
D.10 Subsurface Flow System Bed Depth
SF systems have generally been designed with a bed depth of ± 600 mm to accommodatethe root development of the plants (Cooper 1990). However, plant roots have not alwaysbeen found to readily penetrate such depths and the bed profile remain primarily root free.
Kadlec (1994) found plant roots not to penetrate further than 100-150 mm in gravel bedsystems. Adcock (1994) reports that a clay-based Wetland demonstrated very littlepenetration of plant roots penetrating the clay, but rather forming a solid mat of roothydroponically in the overlying water layer. Breen (1994) found root densities to bepartitioned between the upper and lower layers on a 2:1 split respectively of SF Wetlandsnominally at 600 mm depth.
The GBH systems utilise a bed depth of ± 250 mm (Williams 1992,1994), and there seemsto be little benefit is providing media for depths above 500 mm, except where necessary toprovide a hydraulic slope to the base of the bed, whilst the surface remains flat, which mayresult in the inlet being unacceptably shallower than the outlet.
D.l l Media for Subsurface Flow Systems
There are numerous media types and combinations that may be used, dependent on desiredtreatment effect. These range from the coarse gravel of the Krefeld systems (Seidel 1976),waste power station ash (Wood 1988) to phosphate deficient clayey soils often used in theRoot Zone Method (Cooper 1987; Healey 1988). Local media types should be evaluated

80
in terms of their hydraulic permeability and nutrient (esp. P) adsorption capacities.
For carbonaceous and nitrogenous removal, a coarse sand or gravel is preferable, soils witha high Al or Fe content are required for P removal. The permeability limitations of media,particularly soils, will ultimately be the deciding factor on the hydraulic loading that thesubsurface flow Wetland system can accommodate where pollutant adsorption is thedesired treatment mechanism. Table Dl illustrates a range of physical characteristics forpeat and mineral soils (Faulkner 1994).
Table Dl Soil Physical Characteristics (From Faulkner 1994)
Soil Type
PeatFibricHemicSapric
MineralGravelSandClay
Total Porosity (%)
>9084-90
<84
2035-5040-60
Hydraulic conductivity (m/d)
>1,30,01 -1,3
<0,01
100 -1 0001-100<0,01
Bulk Density (g/cm3)
<0,090,09 - 0,20
>0,20
- 2 , 1 '1,2 -1,81,0-1,6
D.12 Inlet Arrangement
Inlet design has been found to have significant effects on the hydraulics and can give poorand uneven hydraulic conditions (Bavor 1994). This applies to both FWS and SF systemswhere influent is introduced at individual points rather than evenly across the inlet area.
For the horizontal SF systems the feed is introduced across the width of the inlet area. Theinlet zone serves to distribute the incoming wastewater into the main media throughout itsdepth. This is particularly important to reduce short-circuiting and surface flow potential.To improve the distribution an inlet zone filled of 60-100 mm stones 0,5 to 1 m wide canbe constructed.
Whilst the practice of burying the inlet pipework in the inlet gabion with riser pipes at about5 m intervals have been successful, more access to the distribution system is advisable.Riser pipes have been adjusted monthly to remove humus solids or a tanker hose may beconnected about twice per year. Also glass fibre reinforced concrete inlet channels withadjustable weir plates at 1 m intervals has found favour with plant operators (Green 1994).
In some systems, a simple pipe with a series of adjustable T-pieces has been used to actas an inflow distributor across the bed width.
For vertical flow systems the influent can be introduced from herring-bone agriculturalpiping or central channels, spray systems or contoured channels criss-crossing the surfaceto approximate even distribution to the whole area. An alternative is to create a singleinlet zone similar in form to that of the horizontal flow systems and allow a layer of liquorto remain on the surface (50-100 mm). This will form a combination of the horizontal andvertical flow systems, since a proportion of the inlet area will be performing the majority

81
of the treatment (particularly filtering action) as effluent percolates through the system.
The additional capital and operating cost of providing multiple inlet points should beweighed against the advantages of step feed and the creation of nominally completelymixed Wetland systems as compared to nominally plug flow.
D.13 Bed Slope
SF systems are designed with the minimum slope needed to allow the water to pass throughthe bed (calculated from the D'Arcy's Law equation) and to use a level surface to permitcomplete flooding for weed control. Many cases of surface flow with systems initiallydesigned for subsurface flow are believed to be due to inadequate hydraulic design.
Kadlec (1988) found significant water mounds can develop due to vegetation resistance.Water will mound near the inlet to provide the necessary head to drive water through thevegetation which may cause problems in berm stability and short-circuiting in FWS systemswith large length to width ratios.
Butler (1991) reported the GBH gravel channels demonstrate predominantly subsurfaceflow at a loading of 5 C/min/m bed width. Extra flow capacity can be achieved byincreasing the bed depth, provided the depth does not inhibit plant establishment.
D.14 Outlet Control
The most effective way to provide sufficient hydraulic gradient and control in addition tothat provided from D'Arcy's law and base slope, is to locate the effluent manifold at, orbelow, the level of the bed bottom and connect that to an adjustable outlet pipe or gate. Inthis manner, the water level in the bed is adjustable and can be better maintained below themedia surface for all, or the majority of the bed.
The surface flow, meadow systems may involve simple discharge to a single inlet zoneconsisting of a coarse material to assist distribution and filtering prior to the mass of the bedsystem. These will usually have large length to width ratios to capitalise of inletconstruction requirements.
D.15 Plants
It is generally accepted that better wastewater treatment is achieved in vegetated rather thanunvegetated beds, and largely interpreted to be a result of an oxygenated rhizosphere,although the amount of oxygen provided to aerobic microorganisms is not well defined.
The more common vegetation species planted in Constructed Wetlands are reeds(Frogmouths Sp.) bu\rush(Typha Sp) and cattail (Scirpus Sp). Other plant species utilisedinclude pickerelweed (Pontederia Sp), dutch potato (Sagittoria Sp), duckweed (Lemna Sp)and miscellaneous sedges, rushes and grasses.

82
In general, plants that are available locally should be used, this will not only blend in withthe environment to a greater degree, but will also be of economic advantage for the initialplanting, and subsequent replanting if required.
D.16 Planting
Constructed Wetlands have been planted in a number of different ways:I) using rhizome sectionsii) using clumps of reedsiii) using seedlings grown in a greenhouse.
Lawson (1988)examined the use of clumps, seedlings, stem cuttings, rhizome sections anddirect seeding and favoured using seedlings because they tended to provide more rapidcover. A bed planted with seedlings could be substantially covered after the first growingseason having a greater density of shoots and a more uniform cover than a similar bedestablished from rhizome sections. Lawson (1988) also recommends planting rhizomes inlate spring using small rhizome segments with one or two growing shoots planted at adensity of at least 2nr2 and at an oblique angle with some portion above the water level.
The water level should be kept as high as possible to suppress weeds, minimise the effectsof frosts and prevent droughting, say 5 cm above bed level.
Green (1994) reported good bed reed cover after two seasons when established for nurserycultivated stock other than a downward grading in the height of the reeds towards the outlet.At the present time, there are few organisations selling seedlings but propagation is nowwell-defined and it should be possible for an intended user to either grow its own supplyor provide the information to a local market gardener.
D.17 Construction
The hydraulic performance of either type of Wetlands can be significantly influenced byimproper construction, and several systems with short circuiting of flow have been built.The FWS system must be carefully graded to ensure uniform flow, but compaction may notbe necessary. Only where the resident soil base is unsuitable for direct planting (ie claywhich restrict root penetration ability), is it necessary to provide a layer of rooting media.
Where it is necessary to prevent or minimise seepage a sealant of clay (with hydraulicconductivity of less than 10"8 m/s), bentonite, synthetic fabric (with a smooth surface andabout 1 mm thickness), or asphalt is required. SF beds need careful control duringconstruction due to the traffic involved with placement of the media. In several cases thebed had been carefully graded, and then that surface was seriously disrupted whendelivering the media.
Hammer (1994) reports that the incorporation of perpendicular deep water zones in FWSWetlands can eliminate the need for high length-to-width ratios by redistributing water atseveral points throughout a Wetland cell to correct for the inevitable short-circuiting thatoccurs in shallow-flow systems. Deep water zones effectively increase the ratio between

83
actual and theoretical hydraulic retention times more cost-effectively than constructinglong, narrow Wetland cells.
D.18 Operation
Intermittent flow can assist in overall pollutant removal, particularly with SF systems byallowing the bed to drain and draw in additional oxygen. May (1992) reporting on UKgravel bed channels systems found intermittent flow to allow almost complete BOD andammonia removal, whilst continuous flow onto the beds discourages nitrification.
The beneficial effects of using recycle flows are given as (I) to reduce the concentration ofBOD (ii) to control the transport of contaminants to achieve effective treatment and (iii) tocontrol the production of odour Tchobanoglous (1993). If the concentration of BOD andsuspended solids is too great, the oxygen transported to the plant roots may be wasted intreating sludge that accumulates around the roots, as opposed to treating the organic matterin the fluid bulk. Consequently recycle assists in balancing the loading to the inlet area.
In nominally plug flow Wetland systems sludge will first accumulate near to the inflow andprogressively extend towards the outlet zone across the Wetland until it begins to affecteffluent quality. The need for periodic drying to degrade surface slimes needs considerationat the design stage to allow continued operation of a treatment system whilst part is off-linedrying.
Tables D2 and D3 extracted from the E.C. Guidelines (1990) indicate unpredictable andpredictable system disturbances and associated management opportunities.

84
Table D2 Unpredictable System Disturbances for Constructed Wetlands Treating Wastewaters (From E.C. Guidelines 1990)
Disturbance
Record storm
event
Change in:
Chemical
constituents
and concern-
trations
Vegetation
damage
Pests
mosquitoes,
Malfunctions/
Construction
failures
Design flaw
Systems
High hydraulic loading rates
Decreased storage capacity
Insufficient residence time
Channelling
High Sediment loads
High chemical loads
High chemical loads
Increased toxicity (vegetation
wildlife)
Release of chemicals from
Sediments/vegetation
Change in chemical form
Increased debris, flow hindrance
Elemental release from vegetation
Change in conditions for replanting
Complaints from neighbours
Reduced flow and water level control
Reduced flow and water level control
Inability to respond to need for
changes in operations
Limited treatment capacity
Limited lifespan
"New Species.Ball operation modifications may need to be considered
WaterInflow
X
X
X
X
X
X
X
X
WaterOutflow
X
X
X
X
X
WaterDepth
X
X
X
X
X
X
X
X
x
Dilution
X
X
X
X
X
X
Recir-culation
X
X
X
X
X
X
X
PretreatmentPond
X
X
X
X
X
X
X
X
X
X
ChemicalAddition
X
X
X
X
Vegetation Replant PredatorHarvest Control
X X
X
X X
X X
X X*
X X

85
Table D3 Predictable System Disturbances for Constructed Wetlands Treating Wastewaters (From E.C. Guidelines 1990)
Disturbance
Startup
Seasonal
Features
Vegetation establishmentMicrobial flora colonization
Technical system debugging
Extreme precipitation
Extreme temperatures
Vegetation growth/decay
Population composition changes (microbial,algal)
Symptoms
Widely fluctuating inflow-outflow chemistries,after taking flow velocity changes into account
High loading rates
Decreased storage capacity
Insufficient residence time channelling
Insufficient flow
Freezing; sheet flow over ice surface
Flushing of chemical, nutrients, and microbes from decaying vegetation ,sediment
Gradual change in treatment efficiency
Operational Modifications
Control loading rates, i.e., water flow rate, chemical considerations
0 water inflow rates0 freshwater source
Control water depths - critical for vegetation establishment and development of conditions suitable for targetmicrobial populations Dilution/recirculationChemical additions
Control loading rates, i.e, water flow rates chemical concentrations
° water inflow rates° dilution0 recirculation
Increased storage capacity
° stormwater diversion° detention pond• increased water depth
Control outflow ratesInstallation of baffles
Freshwater source, recirculation, parallel cells
Reticulation, aeration, control water depthPreheated water
Secondary treatment pond treatment Vegetation harvest or burning Recirculation to increase nutrientretentionDrawdown and oxidation
Secondary treatment pond Reticulation
86
D. 19 Management Opportunities (Adapted from Tchobanoglus 1993)
D.19.1 Managements Aspects
While improved designs for Constructed Wetlands and greater understanding of theprocesses occurring in them are important, of equal or even greater importance is the long-term operation and maintenance of the Wetland treatment systems once they areconstructed. Management techniques must be developed that will allow for operationalchanges to be made in response to changes in the wastewater characteristics, effluentquality, climatic conditions, and effluent discharge requirements. Depending on the designobjectives, the major operational and management issues associated with ConstructedWetlands include:
• Hydraulic controls• Structural integrity• Water quality structures• Water quality requirements• Vector (pest) control, particularly in FWS Wetlands• Vegetation control (manipulation)
Where the system is intended to provide sociological benefits, issues to be consideredinclude:
• Wildlife habitat management• Education• Recreation
For each of the operational and management issues, a clear set of operating instructionsmust be developed for each system so that corrective actions can be taken as the needarises. In dealing with each of the issues, it will be important to define (1) the operatinggoals, (2) the basis for problem identification, (3) the causative factors, (4) the appropriatemanagement strategies, (5) the lead time, and (6) the method(s) that will be used to evaluatethe effectiveness of the control. Examples of the type of information that must bedeveloped for vector and vegetation control for Constructed Wetlands are identified inTables D4 and D5, respectively. Having a set of instructions for the operation of aConstructed Wetland will improve the operation and performance of these systems.
D.19.2 Monitoring
Monitoring issues are related to regulatory requirements, process performance and control,the fate of specific constituents, and the development of a database.

87
Table D4 Operational issue - mosquito control (From Tchobanoglus 1993)
Item
Operating goalProblem identificationCausative factorsManagement strategies
Lead timeEvaluation of control
Objective/action
Control of mosquitoes;Increased counts in resting box, emergence traps, dip samples;Excessive plant growth, lack of predators;Draw water surface down, use biological controls such as fishigambusia), use chemical controls (e.g., Bear oil 1000);2 to 3 weeks, depending on sampling frequency;Reduced larval count.
Table D5 Operational issue - vegetation control (From Tchobanoglus 1993)
Item
Operating goalProblem identification
Causative factors
Management strategies
Lead timeEvaluation of control
Ob j ective/action
Process performance;Clogging of flow paths, odours from decomposition, short-circuiting, low density, poor plant health;Aggressive growth, lack of vegetative management, excessivewater depth, poor water flow patterns, seasonal variation,grazing;Reduce water depth, soil enhancement, supplemental planting,controlled burns, periodic harvesting;Growing season;Vegetation surveys, vegetation maps, photographic records.
D.19.3 Process Performance and Control
An important reason for monitoring the performance of Constructed Wetlands is to collectdata that can be used to develop process performance and control strategies. A suggestedlist of monitoring parameters for Constructed Wetlands is presented in Table D6, adaptedfrom Mitsch (1993). The specific parameters that need to be monitored will depend on thedesign objectives, local conditions, and regulatory requirements. In addition to meetingregulatory reporting requirements, monitoring data should be used to assess processstability and performance, spotting trends before they become problems. If the process isfound to be unstable during certain times of the year, corrective measures (such as effluentrecycle) can be undertaken to improve the stability of the process.
D.19.4 Fate of Specific Constituents
Long-term monitoring can be used to define the fate of specific constituents, which, in turn,can be used to define the dynamics of Constructed Wetlands. Long-term data are neededto define the removal, retardation, transformation and movement of specific constituentswithin the Wetland. This type of information will be needed as Constructed Wetlands areused to meet the restrictive inland water quality standards that are based on specificconstituents. For compounds such as heavy metals and refractory organic compounds, it
88
may become mandatory to know their fate in the Wetland and potential for re-release atsome future time.
D.19.5 Development of Database
Although it is difficult to get operators to collect anything but the bare minimum operatingdata, every effort should be made to collect data that can also be used to develop a databaseon the operation of the system.
D.20 Cost of Constructed Wetland Treatment Systems
The cost of Wetland treatment systems is dependent upon the annual and unit cost for thesystems should be compared, the cost of land and the labour requirements includingmanagement, supervisory and technical demand and training. It has been estimated thatWetlands systems may be as low as 10% of conventional systems designed to meetcomparable effluent standards (Cooper 1988).
Green (1994) in reporting on the application of primarily SF Wetlands in the UK with animported media found the capital costs to be of the order of £100/person equivalent(approximately $170) for small community applications ie ± 150 people, whilst the unitcost reduced dramatically as the application enlarged ie to ± £40/person equivalent at 1 000people (approximately $70/person equivalent). The operational costs were calculated as1 man day per year or £0,08/person equivalent/yr (approximately $0.14/personequivalent/yr).
Schultz (1994) reported that US FWS costs, where the systems were generally larger, weretypically $33 750 to $56 250 per hectare, whilst SF costs were typically $56 250 to $78 750per hectare where suitable on-site medias are available. However, where suitable mediarequired purchasing and haulage to site the unit costs were typically increased to >$157 500per hectare. In both cases land costs are excluded.
Table D7 illustrates comparative costs estimated for various Constructed Wetlandconfigurations.
Batchelor (1996 Personal Communication) has provided a summary of a costing schedulefor a small community wetland system incorporating subsurface primary beds and surfaceflow secondary or trtiary beds. The costing can be taken as indicative for South Africanconditions. The system sizing should accommodate 10 m3/d settled sewage withcontingency and up to 20 mVd with operational care and consideration.

89
Table D6 Monitoring Parameters for Constructed(Adapted from Mitsch 1993)
Parameter
Water quality"Dissolved oxygenHourly dissolved oxygenTemperatureConductivitypHBODSSParticle size distributionNutrientsChlorophyll AMetals (Cd, Cr, Cu, Pb, Zn)Bacteria (total and faecalcoliform)EPA priority pollutantsOther organicBiotoxicity
SedimentsRedox potentialSalinitypHOrganic matter
BiotaPlankton (zooplankton tow)InvertebratesFishBirdsEndangered speciesMosquitoes
Wetland developmentFlowrateFlowrate distributionWater surface elevationsMarsh surface elevations
Project phase(pre, or during, or
construction orongoing)
OngoingOngoingPre, during, ongoingPre, during, ongoingPre, during, ongoingPre, during, ongoingPre, during, ongoingPre, during, ongoingPre, during, ongoingOngoingPre, during, ongoingPre, during, ongoing
Pre, during, ongoingPre, during, ongoingPre, during, ongoing
Pre, during, ongoingPre, ongoingPre, during, ongoingPre, post
OngoingOngoingOngoingPre, during, ongoingPre, during, ongoingPre, during, ongoing
OngoingOngoingOngoingOngoing
Wetland System
Location
In, out, along profileSelected locationsIn, out, along profileIn, outIn, outIn, out, along profileIn, out, along profileIn, out, along profileIn, out, along profileWithin Wetland, along profileIn, out, along profileIn, out
In, out, along profileIn, out, along profileIn, out
In, out, along transectsIn, out, along transectsIn, out, along transectsIn, out, along transects
Within Wetland, alongtransectsWithin Wetland, alongtransectsWithin Wetland, alongtransectsWithin Wetland, alongtransectsWithin Wetland, alongtransectsWithin Wetland, selectedlocations
In, outWithin WetlandWithin WetlandWithin Wetland
Frequencyof collection
WeeklyQuarterlyDaily/weeklyWeeklyWeeklyWeeklyWeeklyWeeklyWeeklyQuarterlyQuarterlyMonthly
SemiannuallyAnnuallySemiannually
QuarterlyQuarterlyQuarterlyQuarterly
QuarterlyQuarterlyQuarterlyQuarterlyQuarterlyWeekly duringcritical months
ContinuousAnnuallySemiannuallyQuarterly
' Water quality for pre- and during construction refers tot he wastewater that is to be applied to the Wetland.
Ultimately, the database can be used to develop (1) improved process designs for newsystems, (2) improved process control measures, (3) improved long-term managementstrategies, and (4) information that will be of use to the profession.

90
Table D7 Relative Comparison of Cost, Operation, and Treatment for Various Constructed Wetland System Configurations
Configuration
FWS
SF
FWS+SF
SF+FWS
FWS-FWS
FWS-SF
FWS-SF-P
SF-P/C-SF
EFF-AIR
LandArea
H
L
M
M
H
M
M-H
L
L
SubtractECost
na
H
M
M
na
M
na
H
na
Evaluation/A Grading
L/H
H/L
N/M
M/M
M/M
M/M
H/H
H/H
na/L
Cold ClimateEffect
H
L
H
H
H
H
H
L
na
L
H
L
L
M
M
L
H
na
AdvancedTreatment
M
M-H
M-H
M-H
M
H
M-H
H
na
NitrificationEnhancement
(NO3 Reduction)
L
L
L
M
M-H
H
M-H
H
na
DenitriflcationEnhancement
(N Removal)
L
L
L
L-M
L
H
M
H
H
PhosphorusSorption
Enhancement
N
N-H
N-H
N-H
N
N-H
N-H
N-H
na
EffluentDissolvedOxygen
M
L
L
M
H
L
M-H
L
H
a. Evaluation of soil without major rock.b. That provided by configuration only, not by operation.c. BOD and SS effluent concerntrations 20 mg/1 of less.d. Dependant on physical and chemical characteristics of SF substrate.
SFSSFPSF/P =P/CEFF-AIR =HMLNna =
surface flow cellsubsurface flow cellpondsurface flow cell or pond, etcpond, etc., or cascade.effluent aerationhighmediumlownonenot applicable
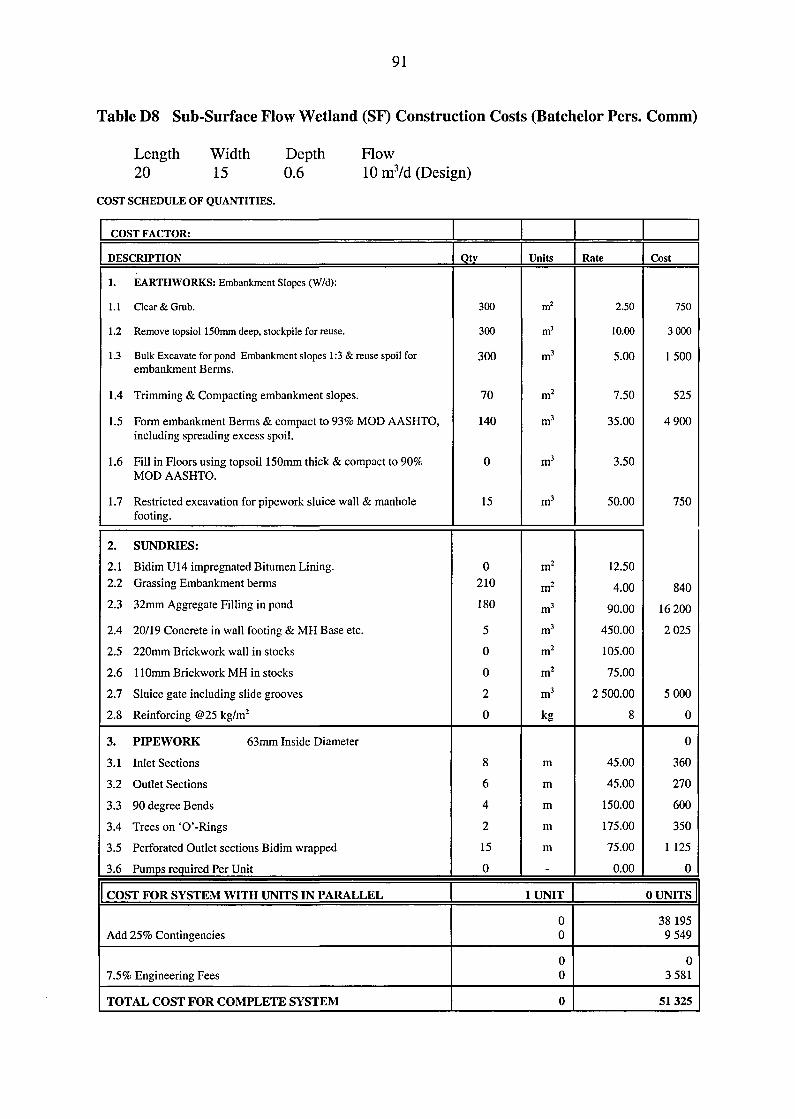
91
Table D8 Sub-Surface Flow Wetland (SF) Construction Costs (Batchelor Pers. Comm)
Length20
Width15
Depth0.6
Flow10 mVd (Design)
COST SCHEDULE OF QUANTITIES.
COST FACTOR:
DESCRIPTION
1. EARTHWORKS: Embankment Slopes (W/d):
1.1 Clear & Grub.
1.2 Remove topsiol 150mm deep, stockpile for reuse.
1.3 Bulk Excavate for pond Embankment slopes 1:3 & reuse spoil forembankment Berms.
1.4 Trimming & Compacting embankment slopes.
1.5 Form embankment Berms & compact to 93% MOD AASHTO,including spreading excess spoil.
1.6 Fill in Floors using topsoil 150mm thick & compact to 90%MOD AASHTO.
1.7 Restricted excavation for pipework sluice wall & manholefooting.
2. SUNDRIES:
2.1 Bidim U14 impregnated Bitumen Lining.2.2 Grassing Embankment berms
2.3 32mm Aggregate Filling in pond
2.4 20/19 Concrete in wall footing & MH Base etc.
2.5 220mm Brickwork wall in stocks
2.6 110mm Brickwork MH in stocks
2.7 Sluice gate including slide grooves
2.8 Reinforcing @25 kg/m2
3. PIPEWORK 63mm Inside Diameter
3.1 Inlet Sections
3.2 Outlet Sections
3.3 90 degree Bends
3.4 Trees on 'O'-Rings
3.5 Perforated Outlet sections Bidim wrapped
3.6 Pumps required Per Unit
COST FOR SYSTEM WITH UNITS IN PARALLEL
Add 25% Contingencies
7.5% Engineering Fees
TOTAL COST FOR COMPLETE SYSTEM
Qty
300
300
300
70
140
0
15
0210
180
5
0
0
2
0
8
6
4
2
15
0
Units
m2
m3
m3
m2
m3
m3
m3
m2
m2
m3
m3
m2
m2
m3
kg
m
m
m
m
m
1UNIT
00
00
0
Rate
2.50
10.00
5.00
7.50
35.00
3.50
50.00
12.50
4.00
90.00
450.00
105.00
75.00
2 500.00
8
45.00
45.00
150.00
175.00
75.00
0.00
Cost
750
3 000
1500
525
4 900
750
840
16 200
2 025
5 000
0
0
360
270
600
350
1 125
0
0 UNITS
38 1959 549
03 581
51325
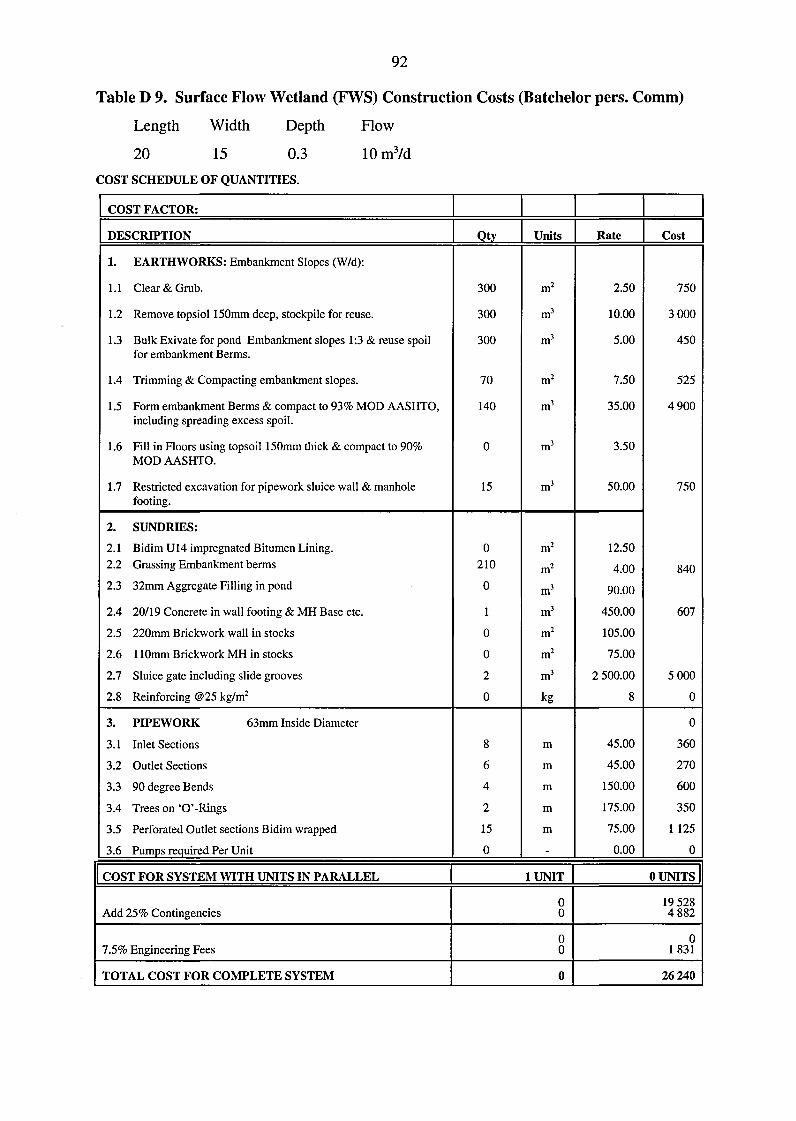
92
Table D 9. Surface Flow Wetland (FWS) Construction Costs (Batchelor pers. Comm)
Length Width Depth How
20 15 0.3 10m3/d
COST SCHEDULE OF QUANTITIES.
COST FACTOR:
DESCRIPTION
1. EARTHWORKS: Embankment Slopes (W/d):
1.1 Clear & Grab.
1.2 Remove topsiol 150mm deep, stockpile for reuse.
1.3 Bulk Exivate for pond Embankment slopes 1:3 & reuse spoilfor embankment Berms.
1.4 Trimming & Compacting embankment slopes.
1.5 Form embankment Berms & compact to 9 3 % MOD AASHTO,including spreading excess spoil.
1.6 Fill in Floors using topsoil 150mm thick & compact to 90%MOD AASHTO.
1.7 Restricted excavation for pipework sluice wall & manholefooting.
2. SUNDRIES:
2.1 Bidim U14 impregnated Bitumen Lining.
2.2 Grassing Embankment berms
2.3 32mm Aggregate Filling in pond
2.4 20/19 Concrete in wall footing & MH Base etc.
2.5 220mm Brickwork wall in stocks
2.6 110mm Brickwork MH in stocks
2.7 Sluice gate including slide grooves
2.8 Reinforcing @25 kg/m2
3. PIPEWORK 63mm Inside Diameter
3.1 Inlet Sections
3.2 Outlet Sections
3.3 90 degree Bends
3.4 Trees on 'O'-Rings
3.5 Perforated Outlet sections Bidim wrapped
3.6 Pumps required Per Unit
COST FOR SYSTEM WITH UNITS IN PARALLEL
Add 2 5 % Contingencies
7.5% Engineering Fees
TOTAL COST FOR COMPLETE SYSTEM
Qty
300
300
300
70
140
0
15
0
210
0
1
0
0
2
0
8
6
4
2
15
0
Units
m2
m3
m3
m2
m3
m3
m3
m2
m2
m3
m3
m2
m2
m3
kg
m
m
m
m
m
1 U N I T
00
00
0
Rate
2.50
10.00
5.00
7.50
35.00
3.50
50.00
12.50
4.00
90.00
450.00
105.00
75.00
2 500.00
8
45.00
45.00
150.00
175.00
75.00
0.00
Cost
750
3 000
450
525
4 900
750
840
607
5 000
0
0
360
270
600
350
1 125
0
0 UNITS
19 5284 882
01831
26 240
93
BIBLIOGRAPHY
Adcock, P W,et al, 1994. Nutrient Partitioning in a Clay - Based Surface Flow Wetland. Pres4th Int. Conf. Methods in Water Pollution Control. Ghangzhou, People's Republic ofChina.
Alexander, W V, et al, 1987. Experimental Investigation into the use of Emergent Plants to TreatSewage in South Africa. Wat. Sci. Tech, 19 (10), 51-59.
Armstrong, W. 1990. Measurements and Modelling of Oxygen Release from Roots ofFrogmouths australis. Pres. Int. Conf. Wetlands in Water Pollution Control. Cambridge,England. Sept 24-28.
Armstrong, W; et al, 1990, Measurement; modelling of oxygen release from roots of frogmouthsaustralis. Proc. Int. Conf, on the Use of Constructed Wetlands in Water Pollution Control,Pergamon Press 41-52
Aulenbach, D B, et al, 1988 Studies on the mechanism of phosphorus removal from treatedwastewater by sand. J.W.P.C.F. Vol 60.12 2089-2094
Bahgat, M M M. 1994. The Abu-Attwa Gravel Bed Hydroponic (GBH) for Sewage treatment.The Egyptian Experience. IAWQ. Specialist Group. Macrophytes in Water PollutionControl. Newsletter. May IAWQ London.
Batchelor, A, et al, 1994. Recent advances in constructed wetland technology.Wat.Sew.Eff. 14 (2) 9-16
Batchelor, A, et al, 1990. Constructed Wetland Research Programme in South Africa.In Constructed Wetlands - Water Pollution Control. P F Cooper Ed Pergamon Press.Oxford, UK.
Batchelor, A, et al, 1996. A Critical Evaluation of a Pitot Scale Subsurface Flow Wetland: 10years. After Commission. Pres, 5th Int. Conf. Wetlands Water Pollution Control. Vienna.September. 15-19.
Bavor, H J. 1994. Challenges for Development in Advanced Constructed Wetlands Technology.Proc 4th Int Conf on Wetland System for Water Pollution Control. Nov 1994.
Bavor, H J, et al, 1992. Nutrient removal and disinfection performance on the Byron BayConstructed Wetland System. In: Constructed Wetlands in Water Pollution Control: Ed.H J Bavor. Pergamon Press, London.
Bercic, O U, et al, 1994. Integrated Constructed Wetland for Small Communities. 4th Int Confon Wetland System for Water Pollution Control. Nov 1994.
94
Boon, AG. 1985. Report of a visit by members and staff of WRC to Germany (FRG) toinvestigate the root zone method for treatment of wastewaters. WRC Report 376 S,Stevenage, August 1985 (revised in February 1986)
Breen, P F, et al, 1994. Artificial Wetlands Treating Waste water- Rootzone Conditions andSystem Performance -a Comparison of Vertical and Horizontal How Systems. Pres 4th Int.Conf. Methods in water Pollution Control. Guangzhou, People's Republic of China
Breen, P F, et al, 1994. Rootzone Dynamics in Constructed Wetlands Receiving Wastewater:A Comparison of Vertical and Horizontal Flow Systems. Pres. 4th International SpecialistConference on Wetland Systems and Water Pollution Control. Guangzhou, People'sRepublic of China.
Brix, H. 1987.Treatment of Waste water in the Rhizosphere of Wetlands Plants - The Root ZoneMethod. Wat. Sci. Technol. 19 RIO 107-118.
Brix, H. 1992. Functions of Macrophytes in Constructed Wetlands. Pres. Int. Conf.Wetlands in Water Pollution Control. H J Bavor Pergamon Press, London.
Brix, H. 1993. Wastewater treatment in Constructed Wetlands. System design, removalprocesses and treatment performance. In Constructed Wetlands for Water QualityImprovement. Ed. G A Moshir, CRC Press Inc. Bota Raton, Florida.
Bucksteeg, K. 1987. Discussion of treatment of wastewaters in the rhizosphere of wetlandplants- the root zone method. -HBrix. Water Science and Technology, 19, pi 063,1987.
Burka, U, et al, 1990. A new community approach to wastewater treatment with higher waterplants, p359 in Constructed Wetlands in Water Polluting Control (PF Cooper and BCFindlater (Eds)). Pergamon Press, Oxford, UK, 1990.
Butler, J E, et al, 1990, Design, construction, establishment and operation of gravel bedhydroponic (GBH) systems for secondary, tertiary sewage treatment. Pros. Int. Conf.on the use of constructed wetlands in water pollution control. Pergamon Press 539-542
Butler, J E, 1991. Gravel bed hydroponic systems (GBH) for sewage treatment. Proceedingsof African Regional Symposium on Techniques for Environmentally Sound WaterResources Development. Pentech Press, London, pp 96 -105
Butler, J E, et al, 1992. Gravel Bed Hydroponics - A Method of Wastewater Treatment andCrop Production. ISOSC Proceedings. 97-113.

95
Butler, J E, et al, 1990, Gravel bedhydroponic systems used for secondary and tertiarytreatment of sewage effluent. J. IWEM. 4(3), 276 284
Conley, L M. 1991. An Assessment of the Root Zone Method of Wastewater Treatment.Research Journal. WPCF. 63:239-247.
Conway, T E. 1988. The Iselin Marsh pond Meadow. Pres. int. conf Constructed Wetlands inWater Pollution Control. Chattanooga. Tennessee June 13-17 1988.
Coombes, C. 1990. Reed Bed Treatment Systems in Anglian Water. In. ConstructedWetlands in Water Pollution control. Ed. P F Cooper and B C Findlater, PergamonPress.
Cooper, J D. 1986. Measurement of Hydraulic Conductivity for Root-zone Sewage TreatmentBeds. Inst. Hydrology - Recommendations to Water Research Centre, April.
Cooper, P F, et al, 1994. Reed Bed Treatment Systems for Sewage Treatment in the UnitedKingdom: the First 10 Years Experience. Proc 4th Int Conf on Wetland System forWater Pollution Control. Nov 1994.
Cooper, P F. 1993 The use of Reed Bed Systems to treat domestic sewage: the EuropeanDesign and Operations Guidelines for Reed Bed Treatment Systems. p203-217 inConstructed Wetlands for Water Quality Improvement. G Moshiri (Ed.). LewisPublishers, Boca Raton, Fla, USA. 1993.
Cooper, P F, et al, 1987. The Use of frogmouths for Wastewater Treatment by the Root ZoneMethod. "Aquatic Plants for Water Treatment and Resource Recovery". (Ed. K RReddy).
Cooper, P F, et al, 1989. Sewage treatment by reed bed systems. J. IWEM,3 (1), 60 - 40
Cooper, P F, 1990. EC/EWDCA Design Guidelines. Pres. Int. Conf. Use of ConstructedWetlands in Water Pollution Control. England, 24 - 28 September.
Crites, R W, 1992. Design Criteria and Practice for Constructed Wetland. Pres Int ConfWetlands in Water Pollution Control. Sydney, Australia. Nov 30-Dec 3.
Cueto, A J, 1992. Development of Criteria for the Design and Constriction of EngineeredAquatic Treatment Units in Texas. In Moshiri G A Ed. Constructed Wetlands for WaterQuality Improvement. Lewis Pub. Ann Arbor.
Davies, TH, 1988. Reed Bed Treatment of Wastewaters. An European Perspective.Water, Sydney 15, 32-33+39.

96
Davies, T H, 1992. The Use of Constructed Wetlands for Treating Industrial Effluents. Pres.Int. Conf. Wetlands in Water Pollution Control. Sydney, Australia. Nov30-Dec 3.
EPA, 1988. Constructed Wetlands and Aquatic Plant Systems for Municipal WastewaterTreatment. EPA 625/1-88/022. Cincinnati, OH.
EPA, 1993. Subsurface Row Constructed Wetlands for Wastewater Treatment. ATechnology Assessment EPA 832-R-93-008.
European Design and Operations Guidelines for Reed Bed Treatment Systems, 1990. Cooper,P F ed, EC/EWPCA Emergent Hydrophyte Treatment Systems Expert Contact Group,WRc Swindon, Swindon, England, A-5, 1990.
Fourie, A B, et al, 1994. Some lessons learned from the use of artificial wetlands for treatingacid mine drainage. Proc 3rd Int Conf Env Issues and Waste Management in Energyand Minerals Production.
Green, M B. 1993. Growing confidence in the use of constructed reeds beds for polishingwastewater effluents. Proceedings of Water Environment Federation. 66th AnnualConference and Exposition. General Topics, Vol 9, p86-98.
Green, M B. 1993. Reedbed Treatment for Small Communities - UK Experience. InConstructed Wetlands for Water Quality Improvement. Ed GA Moshiri. Lewis Pub.
Green, M B, et al, 1994. Constructed reed beds: A cost effective way to polishwastewater effluents for small communities. Water Environmental Research, Vol 66(3),pl88-192.
Haberl, R. 1990. Seven Years of Research Work and Experience with Wastewater Treatmentby a Reedbed System. Pres. Int. Conf. Wetlands in Water Pollution Control.Cambridge, England. Sep 24-28.
Hammer, D A, et al, 1992. Designing Constructed Wetlands for Nitrogen Removal. InWetlands in Water Pollution Control. Ed. H J Bavor, Pergamon Press, London.
Hammer, D A. 1994.. Designing Constructed Wetlands for Nitrogen Removal. Wat. Sci.Tech 29(4) 15-27.
Healey, K J, et al, 1988. The Operation of an Artificial Reed Bed at the Mpophomezi SewageTreatment Works. Seminora Water supply and Sanitation. Kwazulu. IWSA ElangeniHotel, Durban 28-30 June.
Hensman, L C. 1985. The use of algae for the removal of phosphorous from secondarywastewater effluents. PhD thesis. University of Pretoria.

97
Hiley, P D, 1990. The Reality of Sewage Treatment Using Wetlands. Pres Int. Conf.Wetlands in Water Pollution Control. Cambridge, England. Sep 24-28.
Hu, KP, et al, 1994. Design of Sub-Surface Flow Constructed Wetland Systems. Pres 4thInt. Conf. Methods in water Pollution Control. Guangzhou, People's Republic ofChina.
Jensen, A, et al, 1992. Presentation and Management of Natural Wetlands in the southAustralian Murray Valley. In: Wetlands on Water Pollution Control. Ed. H J BavarPergamon Press, London.
Jensen,A, et al, 1994.Cold- Climate Constructed Wetlands. Pres 4th Int. Conf. Methods inwater Pollution Control. Guangzhou, People's Republic of
Kadlec, R H, 1989. Hydrologic Factors in Wetland Treatment. In: Constructed Wetlands inWastewater Treatment. Ed. DA Hammer. Lewis Press. MI373.
Kadlec, R H, 1991. Engineering Aspects of Constructed Wetland Systems: An EngineeringPerspective of Biological Challenges. Pres. Int. Conf. Wetlands in Water PollutionControl. Sydney, Australia. Nov 30-Dec 3.
Kadlec, R H, 1992. Hydraulic Design of Free Water Surface Treatment Wetlands. InMoshiri G A Ed. Constructed Wetlands for Water Quality Improvement. Lewis Pub.Ann Arbor.
Kadlec, R H, 1992. Engineering Aspects of Constructed Wetland Systems: An EngineeringPerspective of Biological Challenges. Pres. Int. Conf. Wetlands in Water PollutionControl. Sydney, Australia. Nov 30-Dec 3.
Kadlec, R H, 1993. Hydraulic and solids accumulation in gravel bed treatment system. In.Constructed Wetlands in Water Quality Improvement. Ed. G. Moshiri, CNC Press.Boca Ratan, Florida.
Kikuth, R. 1984. Application of the root zone process. Landschaft & Stadt, 16 (3), 145 -153.
Knight, R L et al, 1990. Design of the Fort Deposit, Alabama. Constructed WetlandTreatment System. In: Constructed Wetlands in Water Pollution Control. Ed. P FCooper. Pergamon Press, London.
Knight, R L. 1992. Wetlands for Wastewater Treatment Data Base. Pres. Int. Conf.Wetlands in Water Pollution Control. Sydney, Australia. Nov 30 - Dec 3.
Lawson, G J, 1985. Cultivation rceds/Pragmites autralis, for root zone treatment of sewage.Contract report ITE project, WRc Processes

98
Loveridge, R F, 1993. Secondary and Tertiary Treatment of Sewage in Egypt Using ArtificialWetlands and Gravel Beds. Water Africa Conference, Johannesburg. October.
Mann, R A, 1990. Phosphorus removal by Constructed Wetlands. Substratum adsorption.In: Constructed Wetlands in Water Pollution Control. Ed. P F Pergamon Press, London.
Mitchell, D S , ^ al, 1994. The Use of Wetlands for Water Pollution Control in Australia: anEcological Perspective. Pres 4th Int. Conf. Methods in water Pollution Control.Guangzhou, People's Republic of China
Netter, R. 1992. Flow Characteristics of Planted Soil Filters. In Moshiri G A Ed.Constructed Wetlands for Water Quality Improvement. Lewis Pub. Ann Arbor.
Netter, R. 1994. 10 Years Experience with the Use of the Planted Soil Filter at See(Germany)for the Treatment of Septic Tank Effluent. Pres 4th Int. Conf. Methods inwater Pollution Control. Guangzhou, People's Republic of China..
Norris, G. 1993. STED a viable and cheaper alternative to waterborne sewerage. N\M0DNov 17-21.
Parr, T W. 1987. Experimental studies on the propagation and establishment of reeds(Frogmouths australis) for root zone treatment of sewage. Contract report no.T08018el to WRc. Institute of Terrestrial Ecology, Monks Wood experimental Station,Huttingdon. November 1987.
Parr, TW. 1989. Management of reeds in reed bed treatment systems. Contract reportNo.T08018il to WRc. Institute of Terrestrial Ecology, Monks Wood ExperimentalStation, Huttingdon. March 1989.
Reed, S, et al. 1988. Natural Systems for Wastewater Management Treatment. McGraw-Hill, New York.
Reed, S C, 1990. An Inventory of Constructed Wetlands Used for Wastewater Treatment inthe United States. Prepared for USEPA RREL, Cincinnati, OH,
Reed, SC, 1992. Constructed Wetland Design: The First Generation. Wat. Env. Res. 64-6-776-781.
Richardson, C. J. 1985. Mechanisms controlling phosphorous retention capacity in freshwaterwetlands. Science 228 1424-7.
Rivera, F. et al 1994. Removal of Pathogens from Waste water by the Root Zone Method(RZM) Pres 4th Int. Conf. Methods in water Pollution Control. Guangzhou, People'sRepublic of China.
99
Rogers, F E H, 1985. Wetlands for Wastewater Treatment with special reference toMunicipal Wastewaters. Witwatersrand Univ, Press Johannesburg, RSA.
Rogers, F E H, et al, 1985, Wetlands for Wastewater Treatment using aquatic plants andartificial wetlands. Water, Sydney 14 (3) 20-4.
Rogers, K H, et al, 1990. Hydraulics, Root Distribution and phosphorous removalinexperimental wetland systems. Pres Int conf Constructed Wetlands in Water PollutionControl. Cambridge, England. Sept.
Rogers, K H, et al, 1991. Nitrogen removal in experimental wetland treatment systems:Evidence for the role of aquatic plants. Res. Journal. WPCF. 63(7)934-941.
Seidel, K, et al, 1976. Macrophytes and water purification. In Biological Control of WaterPollution. Edited by Tourbier, J. & Pierson, R.W.). University of Pennsylvania Press,pp 109-121.
Slater, N P, et al, 1990. Artificial Wetlands. A process and Performance Overview. UmgeniWater. Pietermaritzburg. R.S.A.
Steiner, J T, et al, 1993. General Designs, Construction and Operation Guidelines for SmallConstructed Wetlands, Wastewater Treatment Systems. In Constructed Wetlands forWater Quality Improvement. Ed. G A Moshiri Lewis Publishers.
Tchobanoglous, G, et.al 1980, Wetlands Systems for Wastewater Treatment: An EngineeringAssessment. US Environmental Protection Agency, Office of Water ProgrammeOperations, Series Water EPA 430/9-80-007, Washington DC
Tchobanoglous, G.1980, Wetlands Systems for Wastewater Treatment: US EPA 430/9-80-007 Washington DC, USA.
Tchobanoglous, G, et.al 1992, Constructed Wetlands and Aquatic Plant Systems: Research,Design, Operation and Monitoring Issues. In Moshiri G A Ed. Constructed Wetlandsfor Water Quality Improvement, Lewis Pub. Ann Arbor.
van der Merwe, C G, et al, 1990. Observations on concentrations of heavy metals, Zn, Mn,Ni, Fe in the water, sediments and aquatic plants, Typha capensis and Arundo donax ofa stream affected by goldmine and industrial effluent. Water SA, 19(2) 119-124.
van der Walt, et al, 1995. A Reedbed system for secondary treatment of a mixed effluent.Pres Biotechnology for Africa. Univ Pretoria, 13-15 Nov.
van Oostrom, A J, 1994. Nitrogen Removal in Constructed Wetlands Treating Nitrified MeatProcessing Wastewater. Pres 4th Int. Conf. Methods in water Pollution Control.Guangzhou, People's Republic of China.
100
Vymazal, J. Constructed Wetlands for Wastewater Treatment in the Czech Republic -State ofthe Art. Pres 4th Int. Conf. Methods in water Pollution Control. Guangzhou, People'sRepublic of China.
Wang, J S, et al, 1994. Analysis of the configuration and the Treatment Effect of ConstructedWetland Wastewater Treatment System for Different Wastewaters in South China. 4thInt Conf on Wetland System for Water Pollution Control. Nov 1994.
Water Pollution Control Federation (WPCF), 1990. Manual of Practice, Natural Systems forwastewater Treatment. FD-16 Washington DC, USA.
Williams, J B, et al, 1992. Nitrogen Transformations in Gravel Bed Hydroponic Beds used asa Tertiary Treatment Stage to Sewage Treatment. Pres. Int. Conf. Wetlands in WaterPollution Control. Sydney Australia. Nov30-Dec3.
Williams, J B et al 1992. Microbial mechanisms operating in gravel bed hydroponic bedsused as a tertiary treatment stage for sewage effluents Proc. IAWQ Conf. on wetlandsystems in water pollution control, Sydney, Australia. Nov 30 - Dec 3.
Williams, J, et al, 1994.The Removal of Pathogenic Microorganisms during SewageTreatment in Gravel Bed Hydroponic Constructed Wetlands. Pres 4th Int. Conf.Methods in water Pollution Control. Guangzhou, People's Republic of China.
WISA 1988. Manual on the Design of Small Sewage Works. Water Institute of SouthernAfrica. Johannesburg, South Africa.
Wong, M H, et al, 1994. Reclamation of Polluted Riverwater for Aquaculture of Nutrients byMicroalgae. 4th Int Conf on Wetland System for Water Pollution Control. Nov 1994.
Wood, A,etal, 1988. Research to develop engineering guidelines for the implementation ofconstructed wetlands for wastewater treatment in Southern Africa. Pres. Int. Conf.Wetlands in Wastewater Treatment. Chattanooga, Tennessee, June 13-17.
Wood, A, 1990. Constructed Wetlands for Wastewater Treatment - Engineering and DesignConsiderations. Pres Int Conf Use of Constructed Wetlands in Water Pollution Control.Cambridge, England. 24-28 September.
Wood,, A, 1991. Application of Constructed Wetlands for Wastewater Treatment in SouthAfrica. Pres. WISA Biennial Conference, Kempton Park, May 13-15.
Wood, A. 1994. Constructed Wetland in Water Pollution Control: Fundamental to theirUnderstanding. Proc 4th Int Conf on Wetland System for Water Pollution Control. Nov1994.

101
Wood, A, 1994. Constructed Wetlands in Water Pollution Control. Fundamentals to theirUnderstanding. Pres. Int. Conf. Constructed Wetlands in Water Pollution Control.Guangzhou, People's Republic of China
Wood, A, 1996. Investigation into the Application and Performance of Constructed Wetlandsfor Waste Water Treatment in South Africa. Pres, W.I.S.A. Biennial Conference, PortElizabeth. May.
WRC, 1990. European Design and Operational Guidelines for Reedbed Treatment Systems.WRC Report UI17 Stevenage, England.
Wrigley, T J et al, 1988. The ability of an artificially established wetland system to upgradeoxidation pond effluent to meet water quality criteria. Water SA, 14(4) 171-177.
Yang, P Y, et al, 1994. A Small Wastewater Treatment Alternative for a Moderately LandLimited Requirement in the Tropics. Yang, P Y, Chen, H. Pres 4th Int. Conf. Methodsin Water Pollution Control. Guangzhou, Peoples Republic of China.
Yang, P Y, et al, 1994. Removal Efficiency of the Constructed Wetland WastewaterTreatment System at Bainikeng. 4th Int Conf on Wetland System for Water PollutionControl. Nov 1994.