Embed Size (px)
Citation preview
Investigation and modelling of friction stir
welded copper canisters
Therese Källgren
Doctoral Thesis
Stockholm 2010
Department of Materials Science and Engineering
Royal Institute of Technology (KTH)
SE-100 44 Stockholm, Sweden
Contact information:
KTH Industrial Engineering and Management
Department of Department of Materials Science and Engineering
Royal Institute of Technology
Brinellvägen 23
SE-100 44 Stockholm
Sweden
ISBN 978-91-7415-568-6
ISRN KTH/MSE--10/04--SE+MAT/AVH
© Therese Källgren 2010 This thesis is available in electronic version at: http://media.lib.kth.se
Printed by E-print, Stockholm
ABSTRACT
This work has been focused on characterisation of Friction Stir Welding (FSW) joints, and modelling of the process, both analytically and numerically. The Swedish model for final deposit of nuclear fuel waste is based on copper canisters as a corrosion barrier with an inner pressure holding insert of cast iron. FSW is the method chosen to seal the copper canisters, a technique invented by The Welding Institute (TWI).
The first simulations were based on Rosenthal’s analytical medium plate model. The model is simple to use, but has limitations. Finite element models (FEM) were developed, initially with a two-dimensional geometry. Due to the requirements of describing both the heat flow and the tool movement, three-dimensional models were developed. These models take into account heat transfer, material flow, and continuum mechanics. The geometries of the models are based on the simulation experiments carried out at TWI and at Swedish Nuclear Fuel Waste and Management Co (SKB). Temperature distribution, material flow and their effects on the thermal expansion were predicted for a full-scale canister and lid. The steady state solutions have been compared with temperature measurements, showing good agreement.
In order to understand the material flow during welding a marker technique is used, which involves inserting dissimilar material into the weld zone before joining. Different materials are tested showing that brass rods are the most suitable material in these welds. After welding, the weld line is sliced, etched and examined by optical microscope. To understand the material flow further, and in the future predict the flow, a FEM is developed. This model and the etched samples are compared showing similar features. Furthermore, by using this model the area that is recrystallised can be predicted. The predicted area and the grain size and hardness profile agree well.
Microstructure and hardness profiles have been investigated by optical microscopy, Scanning Electron Microscopy (SEM), Electron Back Scatter Diffraction (EBSD) and Rockwell hardness measurements. EBSD visualisation has been used to determine the grain size distribution and the appearance of twins and misorientation within grains. The orientation maps show a fine uniform equiaxed grain structure. The root of the weld exhibits the smallest grains and many annealing twins. The appearance of the nugget and the grain size depends on the position of the weld. A large difference can be seen both in hardness and grain size between the start of the weld and when the steady state is reached.
Keywords: Friction Stir Welding (FSW), Copper, Welding, Finite Element Method (FEM), SKB, Material flow

CONTENTS
1 INTRODUCTION ............................................................................................................................. 11
1.1 The Swedish programme for nuclear waste ............................................................................ 11 1.2 The barriers ............................................................................................................................ 11 1.3 Canister manufacturing .......................................................................................................... 12 1.4 Welding of the lid to the copper canister ................................................................................ 13 1.5 Aim of thesis ............................................................................................................................ 14
2 FRICTION STIR WELDING (FSW) .............................................................................................. 15 2.1 General ................................................................................................................................... 15 2.2 Weld features .......................................................................................................................... 16 2.3 Process parameters ................................................................................................................. 16 2.4 FSW advantages, disadvantages and defects .......................................................................... 18 2.5 Material flow tracer techniques .............................................................................................. 20 2.6 Deformation, Recrystallisation and dynamic recrystallisation ............................................... 21 2.7 Deformation zone model ......................................................................................................... 22 2.8 FSW of copper alloys .............................................................................................................. 22 2.9 Possible materials and applications for the FSW method ....................................................... 23
3 METHODS ......................................................................................................................................... 25 3.1 Optical microscopy ................................................................................................................. 25 3.2 Hardness measurements ......................................................................................................... 25 3.3 Scanning Electron Microscope ............................................................................................... 26 3.4 Electron Backscatter Diffraction ............................................................................................ 26 3.5 Heat flow experiment .............................................................................................................. 28 3.6 Material Flow experiment by a marker material technique .................................................... 28 3.7 Material flow modelling by using a tracer technique ............................................................. 29 3.8 Modelling the size of the thermomechanically affected zone .................................................. 29
4 MODELLING .................................................................................................................................... 33 4.1 General heat transfer .............................................................................................................. 33
4.1.1 Rosenthal’s analytical model ........................................................................................................... 33 4.1.2 FEM solid model ............................................................................................................................. 34
4.2 General Material Flow ........................................................................................................... 37 4.2.1 Fluid dynamic model ....................................................................................................................... 37 4.2.2 Thermomechanical analysis supported by computational fluid dynamics method (paper C and D) 38 4.2.3 Material flow modelling of FSW process (paper E, F and G) ......................................................... 39
5 INVESTIGATIONS AND SUMMARY OF APPENDED PAPERS ............................................. 41 5.1 Paper A ................................................................................................................................... 41 5.2 Paper B ................................................................................................................................... 43 5.3 Papers C and D ....................................................................................................................... 44 5.4 Paper E ................................................................................................................................... 45 5.5 Paper F ................................................................................................................................... 47 5.6 Paper G ................................................................................................................................... 49
6 CONCLUDING REMARKS ............................................................................................................ 51
7 FUTURE WORK ............................................................................................................................... 55
8 REFERENCES .................................................................................................................................. 57

LIST OF APPENDED PAPERS AND AUTHOR CONTRIBUTION IN EACH PAPER
Paper A Microstructure development in copper welded by the FSW-process T. Källgren, R. Sandström MRS 2003 Scientific Basis for Nuclear Waste Management XXVII, Kalmar, Sweden, June 15-18, 2003. Paper B Microstructure and temperature development in copper welded by the FSW-process T. Källgren, R. Sandström 4th International Symposium on FSW, Park City, USA, April, 2003. Paper C Finite Element Modelling of Temperature Distribution in Friction Stir Welding Process and Its Influence on Distortion of Copper Canisters T. Källgren, L.-Z. Jin, R. Sandström MRS spring meeting 2004, Scientific Basis for Nuclear Waste Management XXVIII San Francisco, CA, USA. April 12-16, 2004. Paper D Finite Element Modelling of Friction Stir Welding on Copper Canister T. Källgren, L.-Z. Jin, R. Sandström 5th International Friction Stir Welding symposium, Metz, France, 14-16 September, 2004. Paper E Material Flow during Friction Stir Welding of Copper T. Källgren, L.-Z. Jin, R. Sandström 7th international Friction Stir Welding symposium, Awaji Island, Japan, 20-22 May 2008. Paper F Flow Modelling of Friction Stir Welding using brass markers in copper T. Källgren, L.-Z. Jin, R. Sandström, Submitted to Science and Technology of Welding and Joining. Paper G Influence of tool geometry on the material flow during friction stir welding of copper T. Källgren, L.-Z. Jin, R. Sandström, Submitted to Journal of Material Processing Technology.
Paper A The author of this thesis made the measurements, evaluated the results and wrote the manuscript, supervised by Sandström. Paper B The author of this thesis made the experiments, measurements and modelling work, evaluated the results and wrote the manuscript, supervised by Sandström. Paper C The author of this thesis made the evaluation of the results and wrote the manuscript, supervised by Sandström. The modelling part of the work was done in close cooperation with Jin. Paper D The author of this thesis made the evaluation of the results and wrote most of the manuscript, supervised by Sandström. The modelling part of the work was done in close cooperation with Jin. Paper E The author of this thesis suggested the study, planned, performed the welding, evaluated the results and wrote the major part of the manuscript, supervised by Sandström. The modelling part of the work was done in close cooperation with Jin. Paper F The author of this thesis suggested this study, planned, performed the welding and evaluated the results, supervised by Sandström. The modelling part of the work was done in close cooperation with Jin. The author wrote the manuscript together with the co-authors. Paper G The author of this thesis suggested this study, planned, performed the welding and evaluated the results, supervised by Sandström. The modelling part of the work was done in close cooperation with Jin. The author wrote the manuscript together with the co-authors.
ACKNOWLEDGEMENTS
First of all I would like to thank my supervisor Prof. Rolf Sandström for giving me the opportunity to work in his group. Moreover I am indebted to his valuable help and guidance. I would like to thank Dr. Lai-Zhe Jin for his help and inspiring discussions, especially concerning the modelling part of my research.
This project is financially supported by the Swedish Nuclear Fuel Waste and Management Co (SKB) and the Brinell centre at KTH. The members of the project committee are gratefully acknowledged. I would specially thank L. Cederqvist and M. Tigerström at the SKB’s canister laboratory for their interesting suggestions and assistance.
Lena Ryde at SIMR is thanked for help with EBSD measurements and for discussions, R. E. Andrews at The Welding Institute (TWI) for his kind help. Hans Bergquist and Wen-Li Long at MSE for technical support, Henry and P-O Söderholm for all help with sample preparation and always a happy smile.
Thanks to all my colleagues and friends at MSE; Dennis for all the lunches and help with computers and language problems, Anna for motivating me in various fields and Henrik at SIMR for discussions about the project. But most of all, thanks to my family and my guys Per and Vincent.

11
1 INTRODUCTION 1.1 The Swedish programme for nuclear waste SKB, the Swedish Nuclear Fuel and Waste Management Company are responsible for taking care of spent nuclear fuel. The general guidelines and requirements for taking care of the spent fuel are decided by the government, but the work will carried out by SKB. The final deposition have to be safe for 100 000 years [1]-[17], but longer time periods are also simulated to ensure safe storage up to 1 000 000 year. For each kWh of electricity delivered, the nuclear utilities are paying SEK 0.01 to the Nuclear Waste Fund. Today’s balance in the fund is approximately SEK 40 billion. This money will be used to secure a safe deposit of the nuclear waste.
The starting point given by Swedish law and international agreements is the following:
• SKB will build, run and deposit the spent nuclear fuel in a final repository.
• The repository will be designed so it is impossible for unauthorized persons to be near the waste, both before and after final deposit.
• The Swedish waste will be placed in Sweden.
• The spent nuclear fuel will not be reprocessed.
• The repository will be designed by the generations which have used the fuel and planned so that the deposit will be safe without any surveillance or maintenance.
SKB and the Finnish equivalent Posiva collaborate on the canister manufacturing and welding methods. Finland has the same basic conditions for the repository and will use the same method as Sweden [1], [2], [14], [18].
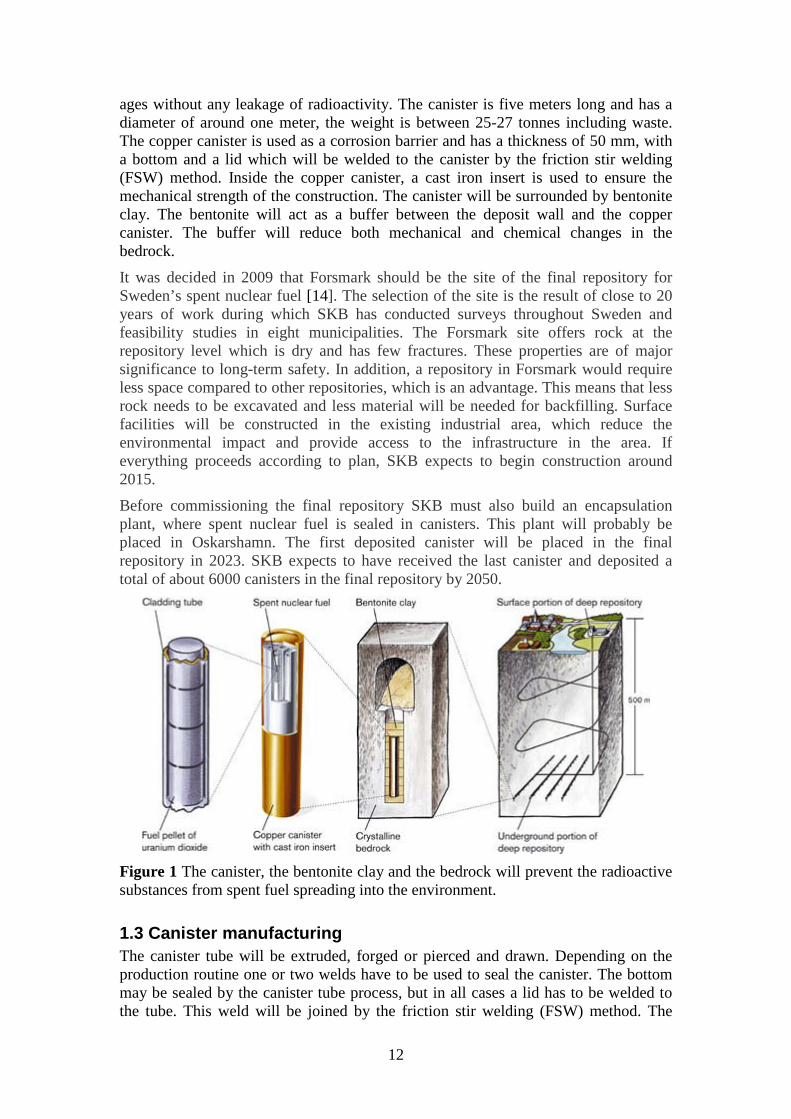
1.2 The barriers The spent fuel will placed in copper canisters, which will be deposited 500 m under the ground level, see Figure 1. The repository will survive both earthquakes and ice
12
ages without any leakage of radioactivity. The canister is five meters long and has a diameter of around one meter, the weight is between 25-27 tonnes including waste. The copper canister is used as a corrosion barrier and has a thickness of 50 mm, with a bottom and a lid which will be welded to the canister by the friction stir welding (FSW) method. Inside the copper canister, a cast iron insert is used to ensure the mechanical strength of the construction. The canister will be surrounded by bentonite clay. The bentonite will act as a buffer between the deposit wall and the copper canister. The buffer will reduce both mechanical and chemical changes in the bedrock.
It was decided in 2009 that Forsmark should be the site of the final repository for Sweden’s spent nuclear fuel [14]. The selection of the site is the result of close to 20 years of work during which SKB has conducted surveys throughout Sweden and feasibility studies in eight municipalities. The Forsmark site offers rock at the repository level which is dry and has few fractures. These properties are of major significance to long-term safety. In addition, a repository in Forsmark would require less space compared to other repositories, which is an advantage. This means that less rock needs to be excavated and less material will be needed for backfilling. Surface facilities will be constructed in the existing industrial area, which reduce the environmental impact and provide access to the infrastructure in the area. If everything proceeds according to plan, SKB expects to begin construction around 2015.
Before commissioning the final repository SKB must also build an encapsulation plant, where spent nuclear fuel is sealed in canisters. This plant will probably be placed in Oskarshamn. The first deposited canister will be placed in the final repository in 2023. SKB expects to have received the last canister and deposited a total of about 6000 canisters in the final repository by 2050.
Figure 1 The canister, the bentonite clay and the bedrock will prevent the radioactive substances from spent fuel spreading into the environment.
1.3 Canister manufacturing The canister tube will be extruded, forged or pierced and drawn. Depending on the production routine one or two welds have to be used to seal the canister. The bottom may be sealed by the canister tube process, but in all cases a lid has to be welded to the tube. This weld will be joined by the friction stir welding (FSW) method. The
13
copper material used is pure oxide free copper with 50 ppm phosphor, so-called OFP-Copper.
The copper canister always has the same design, see Figure 1. But the design of the cast iron insert, which is inserted into the copper canister, is decided by the waste that will be placed in the capsule. Some of the cast iron inserts are designed so that they will hold 12 fuel elements and some are designed to hold 4 elements.
1.4 Welding of the lid to the copper canister Two separate methods to join the lid to the canister were developed. Electron beam welding (EBW) and friction stir welding methods were developed at the SKB canister laboratory in Oskarshamn [11], [12], [17], [19], [20]. The two methods were evaluated and FSW was the winning concept. In the development of welding defect free 50 mm thick copper canisters, a starting ramp was developed. This starting ramp starts 75 mm above the joint line. A starting hole is drilled in the ramp. The rotating tool is inserted in the starting hole When the copper is sufficiently heated the tool is moved forward. When the tool has reached steady state the tool is moved to the joint line. After a full revolution of the canister (360 degrees), the tool is moved to the starting ramp where the tool is removed, leaving an exit hole. The starting ramp can then be machined off and a perfect weld line is achieved [17], [21].

14
1.5 Aim of thesis The purpose of this work is to characterise and model the friction stir welding of thick copper canisters to provide an understanding of the physical processes involved in the welding. This is needed to optimise and to produce a void free weld with satisfactory mechanical and corrosion properties.
In order to understand the process, the heat production from the shoulder and pin has to be understood. The geometry of the heat zone is also of great interest, not only for prediction of grain size development and material properties but also to understand and predict the material flow. Some of these questions have been answered after the work with this thesis, others are still under development:
• How does the material flow near the shoulder, in the middle and in the weld root?
• Which parameters are most important to control?
• Is it the shoulder or the pin that produces the most heat flux and mixing of material?
• What parameters are most influential to the grain size?
• How is the process affected by the change in tool design?
• If a void is found by ultra sonic testing after welding, is it possible to weld this area again and thereby make the void disappear? Should the same tool be used or a shorter tool? Is the method to make the void disappear different depending on how far down in the weld zone the void is found, the size of the void or the location of the void?
• Is it possible to model the welding and thereby predict weld quality, grain size, weld zones and formation of voids?
15
2 FRICTION STIR WELDING (FSW) 2.1 General Friction stir welding (FSW) is a welding method invented in order to join non-weldable high alloyed aluminium alloys. The method was invented in 1991 at The Welding Institute (TWI), UK, and has enhanced welding of many alloys that earlier had to be cast or undergo expensive surface preparation before or/and after welding [22]. TWI holds a number of patents on the process. Due to a large scientific effort many alloys in different applications can be welded by the FSW method today. The FSW method produces a good weld quality due to the non-consumable tool which consists of a shoulder and a pin. This tool is inserted into the weld line and moved forward along the weld. The rotation of the tool and the forward movement produce heat which softens the material and makes it flow from the front of the tool to the back. Although the material softens it will not reach liquidus temperature. The high plastic deformation and the high temperature make the material recrystallise and fine grains are generated in the weld zone. The weld’s features depend on the pin/shoulder geometry and material parameters.
16
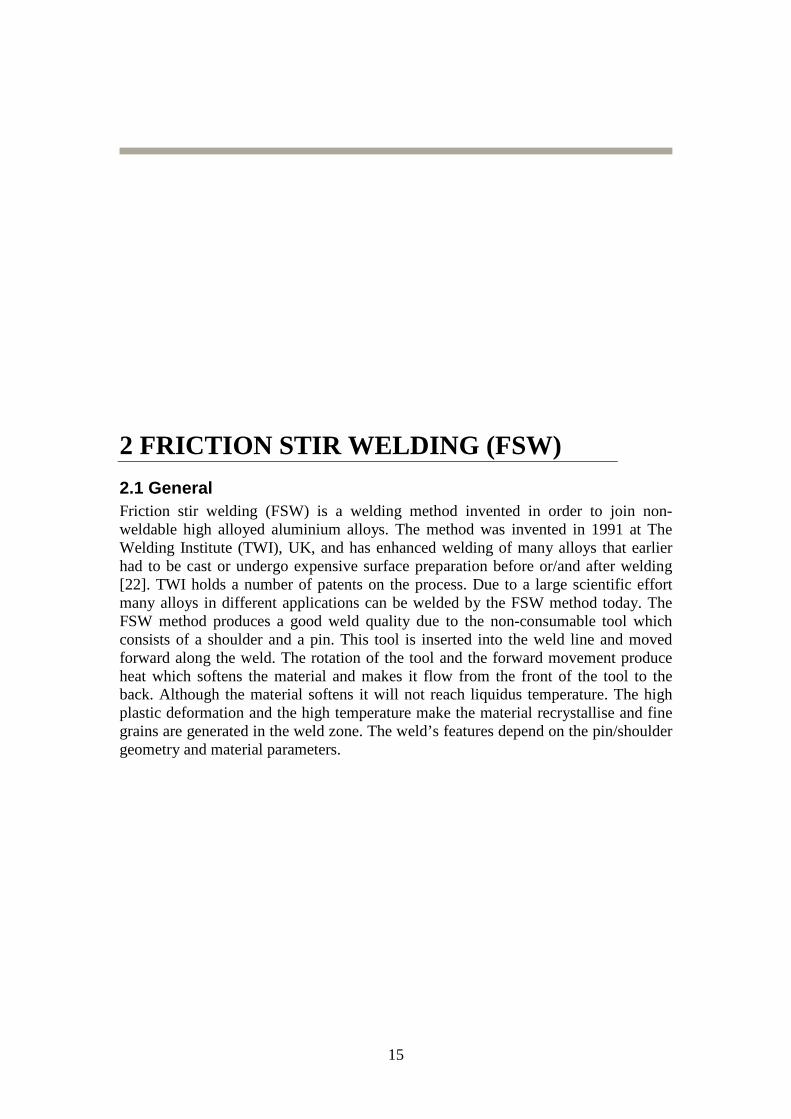
Figure 2 A schematic overview of the FSW process.
2.2 Weld features Most friction stirred welds have four different zones in the weld region: weld nugget, thermomechanically affected zone (TMAZ), heat affected zone (HAZ) and unaffected material, see Figure 2. The nugget has fine equiaxial grains and has undergone recrystallisation due to extensive deformation and high temperature. In this area the grain is some magnitude smaller than the parent material. The “onion-rings” commonly referred to can be seen in this area. The origins of this structure are not fully understood, see more in (2.4 FSW advantages, disadvantages and defects). The thermomechanically affected zone occurs on both sides of the nugget zone. Strain and temperature is lower than in the nugget area, resulting in a mixture of fine and larger grains since this area is only partially recrystallised. In the heat affected zone the grains are larger and affected only by the high temperature, not by any deformation. In many materials this is the region with the poorest mechanical properties. Further from the weld centre unaffected material is found.
2.3 Process parameters Traverse force - Acts parallel to the tool motion, this force arise from resistance between the material and the tool, decreasing temperature increase this force. Too high force can result in tool breakage.
Traverse speed - The traverse speed is the tool’s movement along the joint line. Decreasing the traverse speed will result in a hotter weld.
Tool tilt angle - The tool is angled relative to the canister in order to produce a smother weld with less weld flash. The tilt angle is 1.5- 4.5 degrees, such that the back is lower than the front in traverse direction. The tilting assists the forging action. If the tilt angle is too small this will result in defects on the advancing side. However, if the tilt angle is too big this will result in excessive surface flash. This will in turn generate insufficient material for the nugget zone, resulting in tunnel defects [23].
Plunge depth and vertical pressure - The plunge depth is the depth of the weld tool from the shoulder at the surface down to the end of the pin in the weld root. The depth depends on the pressure of the tool and helps the material to be forged. This parameter is a critical parameter to ensure good weld quality and have to be set correctly to
17
ensure necessary downward pressure and to ensure that the tool fully penetrates the weld. The increase in vertical pressure results in increasing temperature. If the pin depth is too big, the material will be extruded and give a large weld flash. If the depth is too small it will result in defects on the advancing side of the surface [23]
Weld tool rotation - The number of revolution per seconds of the tool. The rotation of the tool results in movement of the material from the front to the back of the pin. Higher tool rotation speed generates higher temperature due to higher friction heat and results in a more intense stirring.
Tool temperature - The product of the rotation speed and the torque of the spindle is equal to the heat input and thereby affects the temperature of the tool. If the material is too cold, voids may be present and the tool may break. On the other hand, if the temperature is too high this can result in defects due to liquidation of low-melting phases [24].
Torque - The torque depends on the rotation of the tool, the down force, the friction coefficient and the flow strength of the material. The torque can be used to calculate the power required from P=ω*M, were M is the torque of the tool and ω is the rotation rate.
Tool design - It is very important to have a well-designed weld tool since this may improve weld quality and maximize tool rotation and traverse speed. The tool consist of a shoulder and a pin, each made of a strong, tough and hard wearing material at the specific high temperature. The material also has to have good oxidation resistance and low conductivity. Further, the weld cycle should be modified so that forces acting on the tool are as low as possible and without any abrupt changes. The pin design for copper welds has a triflute design, which is a complex system of three tapering threaded flutes, which increase the material movement around the tool [25]. The good creep rupture alloy Nimonic 105 is used as probe material for 50 mm thick copper. This material is further processed by a carbo-nitriding process to increase wear resistance. The shoulder often has a concave profile that maintains the downward pressure and prevents the material displacement of the pin. In the copper welds the temperature is up to 950°C during 1 h, a severe condition that requires an extreme material. Many different shoulder materials have been tested but today a sintered tungsten alloy called densimet is used. This is a good shoulder material due to its high temperature capability, good machining characteristics and high thermal conductivity [17].
Pre-heating/pre-cooling - Materials with high melting points, such as steel and titanium, have difficulties in some cases to sustain enough softening and plasticity through the friction heat produced by the weld tool. Then, preheating or an external heating source can be a way to get around the problem so that a good material flow can be achieved. Cooling can be used in lower melting point metals, such as aluminium and magnesium, to reduce grain growth of recrystallised grains.
Base material - Balasubramanian [26] have investigated aluminium alloys with different yield strength, ductility and hardness trying to find a relationship between the base material properties and the process rotation speed and traverse rate. He has also developed empirical formulas for prediction of defect free welds.

18
2.4 FSW advantages, disadvantages and defects The FSW method have a number of advantages over conventional welding methods due to the good mechanical properties of the weld if correct welding parameters are used, the possibility to operate in all different positions and the absence of any toxic fumes. The reason for these advantages is that the process takes place in a solid state. The fact that no consumables are used (filler material or gas) gives the method a low environmental impact as well. To ensure a perfect weld, the joining temperature should be well controlled and the material flow from the front of the tool should be in balance with the backward vacant region [27], [28]. However, the method is not without problems. One of the problems FSW designers have to deal with is the exit hole (the hole left after withdrawal of the tool). Another drawback is the high forces and large machines that make the method less flexible than manual processes. Defects can also be a big problem if the process window is not fully understood or if some of the process parameters are set incorrectly, see Figure 3.
19
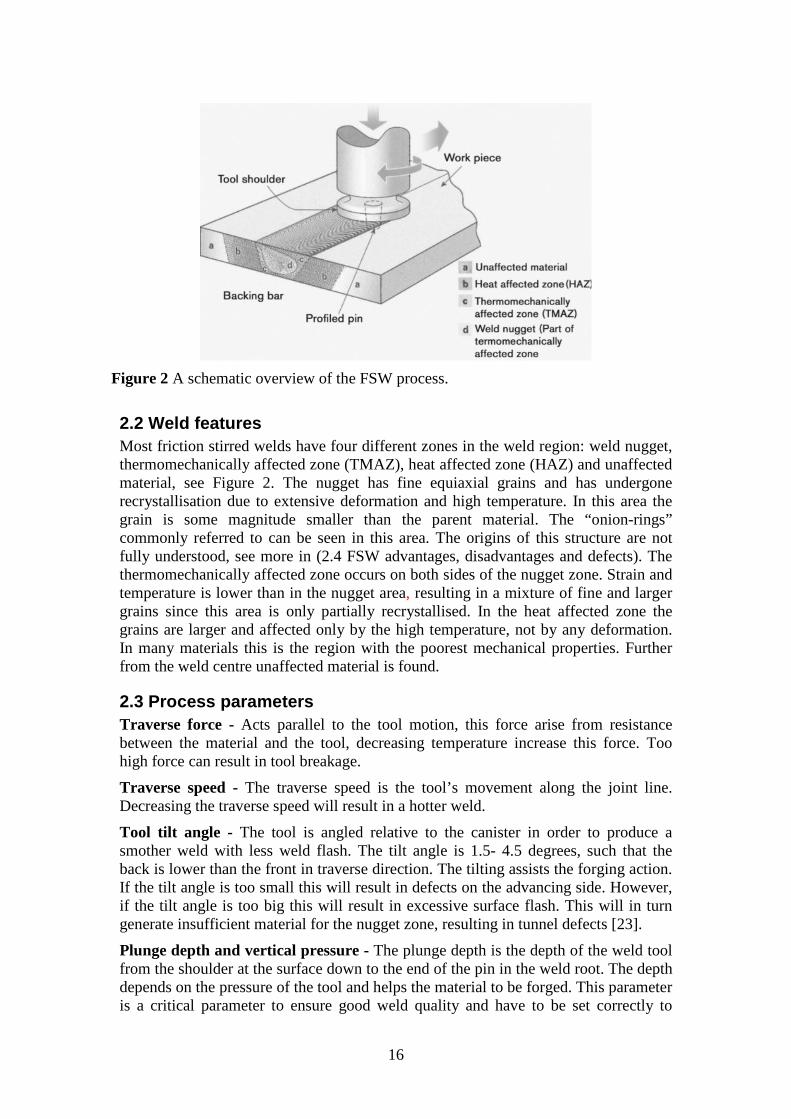
Figure 3 Void occurrences [27].
Tunnel defects, lack of fill, wormhole - If the traverse speed is too high or the rotation speed is too low the temperature will not be high enough, resulting in long tunnel-like defects. The defects can occur at the surface or subsurface. The tilt angle may also affect the occurrence of tunnel defects, too small or too big angles can cause this defect. Wormhole initiate near the bottom of the weld if the traverse speed increases with constant rotation speed [29].
Kissing bonds - Low temperature can provide so-called “kissing bonds” due to the limited forging action of the tool. In this condition, the materials of the joined parts have only slight contact and little mixing. It is a very small defect that is difficult to find by non-destructive testing methods. The weld may have the appearance of a defect free weld, but when tested, e.g. for tensile strength, the poor test results reveal that there are problems. This defect can also be detected by SEM.
Lack of penetration - If the pin is too short, the bottom of the weld will not be welded and if the tool is too long it will be pressed to the backing plate. It is extremely important to have a pin with correct length. Lack of penetration can be a potential source of fatigue cracks.
Onion rings - Onion rings are not a defect, but more of a characteristic in some welds. They occur in the nugget zone and can be seen cross-section after welding, slicing and etching. The feature looks like onion rings [30]. Krishnan suggested that the onion rings were formed due to the friction heat generated by the rotation of the tool and the extrusion caused by the material flow on the retreating side. The rings cannot be seen in all welds. Krishnan et al have a solution to the phenomenon; onion rings disappear when the rotation speed is increased the temperature rises. The hotter weld condition produces less friction by which the formations disappear. This is also seen in Xie et al’s study on copper alloys [31] But Xie et al have different explanation of the formation, suggesting that the onion rings consist of altering coarse grain bands and fine grain bands.
20
According to Chen et al and Larsson et al [32] the onion rings have a great influence on the tensile strength and elongation percentage of the weld. Chen et al produced fine welds with a tilt angle of 3°-4° which have “onion rings.” These welds also have the best mechanical properties.
Lazy S - This is a series of black, regularly spaced, curved lines, occurring in the nugget zone. They probably originate in the oxide layer on the initial surface, which was extruded and pushed down during the weld process [23].
Nugget collapse - can occur if the process is too hot.
Surface flash- is a result of too much pressure at the weld tool under high temperature condition.
Banded texture in weld direction – Appears as a banded texture in the weld direction, the appearance is not fully understood. Threadgill stated that the formation of a banded texture was due to the forward motion of the tool one revolution [30], [33]. Sutton et al have another explanation, suggesting that the rings consisted of alternating hard particle-rich regions and hard particle-poor regions [34].
Surface galling - is a feature at the weld surface that may occur during hot welding condition [27], [28], [35]. The surface quality problem is due to the pick-up of material by the weld tool. The tool moves the material to the surface where large fragments of material can be seen.
2.5 Material flow tracer techniques Two different tracer techniques have been established by different researchers for visualization of the material flow; the first is a tracer technique by marker material where a dissimilar material is inserted into the weld line. The second technique is to weld two dissimilar materials with the FSW process and then see the material mixing. The marker materials have been different Al-composites [36], [37], [38], steel balls [39], copper foil [40], [41], plasticine and brass rods [42]. The used dissimilar base materials are different magnesium alloys [43], aluminum to copper alloys [44], [45].
Reynolds et al used Al-composites, a 1.8 mm thick 5454-O in a base plate of 2195-T8. He stated that the material in the centerline was transported backwards approximately one pin diameter while material on the advancing side of the pin round the pin and ends up almost in its original insertion point [37].
Colligan have developed a concept to understand the material flow by inserting steel balls as tracers embedded in the weld path. The weld process was then stopped at specific intervals. The weld line was there after radiographed to see the steel balls’ movement. The result showed two types of material flow; simple extrusion and chaotic mixing, depending on location in weld zone [39].
Dickerson et al used 0.1 mm thick copper stripes as a tracer material. The method included a stop action technique were the flow was “frozen” in the weld path. Conventional radiography, x-ray and metallographic investigations were used, showing that copper was a good tracer material [41]. Guerra et al also used copper in aluminium welds and showed that there is a difference between the advancing and retreating sides of the tool. Moreover, the two sides have different thermomechanical histories and properties. This investigation also showed that the shoulder was the prime source for the material flow near the top of the weld, and the pin geometry only had a minor effect [40]. But on the lower part the geometry of the pin was the
21
dominant factor for material movement. Schmidt et al used copper stripes to estimate the flow velocity in FSW welds. Two different procedures were developed to estimate the average velocity. The experimental work supported the presence of sticking condition at the tool/matrix interface [46].
Johnson has welded dissimilar materials, not in order to understand the FSW process and flow, but to get good quality magnesium welds. He concluded that success was due to which material was placed on the advancing side and the retreating side respectively. This shows that the FSW process is an asymmetrical process and the sides have different heat and material flow due to the rotation of the tool [43]. Abdollah et al have welded aluminium to copper and produced welds with reasonable weld quality. In the mix zone intermetallic compounds have been observed [45] Ouyang et al also tried to FSW aluminium to copper but found it difficult to produce good welds due to the brittle intermetallic compounds. They suggested that some kind of interlayer should be used to produce sound welds [44]
Liechty et al have tried another way of modelling the material flow. Whereas most experimental investigations have been carried out metallic materials, Liechty et al used plasticine as base material. Plasticine is an amorphous clay material which have previously been used to model extrusion of metals. The stress-strain behaviour is similar to metals and the experiments can be performed at much lower cost. In these trials no dissimilar material is present. Instead the marker plasticine is coloured. The experiment shows that high rotation speeds results in the material rotating around the tool many revolutions travelling forward with it. Also a vertical (surface-weld root) motion during welding is observed [47]
2.6 Deformation, Recrystallisation and dynamic recrystallisation
Recrystallisation replaces deformed grains with new non-deformed grains, which grow until the original grains are consumed. The recrystallisation depends on several parameters such as temperature, deformation, grain size and time, which in turn are dependent on each other. The static recrystallisation occurs during cooling of deformed material, while dynamic recrystallisation occurs after heat treatment. The critical temperature to initiate recrystallisation decreases with annealing time. The deformation must provide nuclei and stored energy to drive grain growth. But increasing deformation affects the critical temperature since high deformation needs less heat to initiate recrystallisation. Increase in grain size also affects the temperature, larger grains result in fewer grain boundaries which result in a decrease of nucleation rate and an increase in recrystallisation temperature. More deformation results in finer final grain size, due to the increased nucleation rate. Dynamic recrystallisation is of great industrial interest due to the new grains being smaller than the initial grains and thereby having improved mechanical properties in room temperature. In a stress-strain curve, the onset of dynamic recrystallisation can be recognized by a distinct peak in the flow stress in hot working data, due to the softening effect of recrystallisation.
The recrystallisation depends on several parameters such as temperature, deformation, grain size and time which in turn are interdependent. The static recrystallisation occurs during cooling of deformed material, dynamic after heat treatment. The critical temperature to initiate recrystallisation decreases with annealing time. The deformation must provide nuclei and stored energy to drive grain growth. But increasing deformation affects the critical temperature, high deformation needs less
22
heat to initiate recrystallisation. Increase in grain size also affects the temperature, larger grains result in less grain boundaries which in turn result in a decreased nucleation rate and increased recrystallisation temperature. More deformation results in finer final grain size, due to the increase of nucleation rate. Dynamic recrystallisation is of great industrial interest due to the new grains being smaller than the initial grains thereby having improved mechanical properties in room temperature. In a stress-strain curve, the onset of dynamic recrystallisation can be recognized by a distinct peak in the flow stress in hot working data, due to the softening effect of recrystallisation.
In Eriksson’s and Sandström’s work the yield stress decreases dramatically once the temperature approaches the solidus temperature. A consequence of this is that the heat generation in the material close to the tool decreases if the temperature exceeds the solidus temperature. A self-stabilizing effect is then established at a temperature below solidus temperature [48]. However the strain rate dependence is not included in this model. The temperature dependent yield stress is a driver for the heat source.
2.7 Deformation zone model A flow-partitioned deformation zone model is developed by Arbegast [27], [28]. This model predicts the formation of voids during FSW by using the fact that defects forms under the influence of temperature field, strain rates and tool geometries. No experimental data is shown so the validation of the model is not stated, but this is one of the first models to predict defects.
2.8 FSW of copper alloys Conventional fusion techniques are difficult to use when joining thick section of copper alloys. The reason is the high thermal diffusivity of copper, which is up to 100 times higher than of steel alloys. The high thermal diffusivity of copper results in a higher heat input requirements in the FSW process. To achieve this, a lower weld speed is needed than for example aluminium alloys. Today it is possible to weld 1.5 -50 mm thick pure copper (or oxygen-free copper) plates [31], [49], [50], [51]. Xie et al showed that using a lower rotation speed at constant traverse speed, thereby producing less heat into the weld zone decreased the recrystallised grain size. Significant onion rings could also be seen in the cooler welds [31]. Lee et al have welded 4 mm thick copper plates and done investigations on the grain size and tensile strength of the welds. The grain size in the nugget zone was finer than in the base material due to recrystallisation and the grain size in the heat effected zone was coarser due to the annealing effect. The nugget showed a softening effect after welding due to the lower density of the dislocation showing that the hardness depends mainly on the density of dislocations rather than the grain size. The traverse tensile strength in the weld zone was found to be 87% of the base materials [50]. Sakthivel et al have done almost the same investigation as Lee et al but looked at 2 mm welds [52]. The two investigations show little difference; Lee et al did not find a distinct thermomechanically affected zone whereas Sakthivel at al found this. The hardness also showed a significant difference. Sakthivel et al showed that the highest hardness were within the weld nugget were as Lee et al showed the opposite. The tensile strength in the two cases was approximately the same. Sakthivel also revealed that it was on the advancing side that fracture occurred.
23
Investigations have also been done on 2 mm thick copper to 60/40 Brass [53]. Meran [54] has welded 3 mm brass (70%Cu-30%Zn) plates showing a good result.
Abdollah-Zadeh et al have produced aluminium to copper lap joints with reasonable weld quality, this have also been tried by Ouyang et al with a less good result [55], [44].
2.9 Possible materials and applications for the FSW method The process is currently patented by TWI in most industrialised countries and licensed to over 183 users. The most common joint design for FSW use is butt or lap joints but also more complex design can be used, for example fillet joints. FSW was from the beginning used on aluminium alloys but today a wide variety of materials are used. Today the method can be used on non-ferro metals (Mg, Cu, Ti), steel, thermoplastics, metal matrix composites and dissimilar alloys. In high temperature alloys such as Ti and steel it is difficult to find a suitable tool material and design due to the high forces on the tool, but progress is being made.
There are many applications where FSW is used today here are some highlights;
-Aluminum alloys 2XXX and 7XXX are used in lightweight assemblies such as fuselages, fins and wings. Eclipse Aviation is adopting FSW for joining skin components in Eclipse 500 aircraft.
- FSW has been shown to produce superior as-welded mechanical properties compared to typical arc welding processes in high-strength aluminum alloys. FSW has been used to join 2519Al-T87 to produce armor with a combination of high ballistic performance and static strength.
- Helicopter platforms, masts and booms for sailing boats, panels for decks in shipbuilding and marine applications.
- High speed trains made of aluminum extrusions are joined by FSW.

24
25
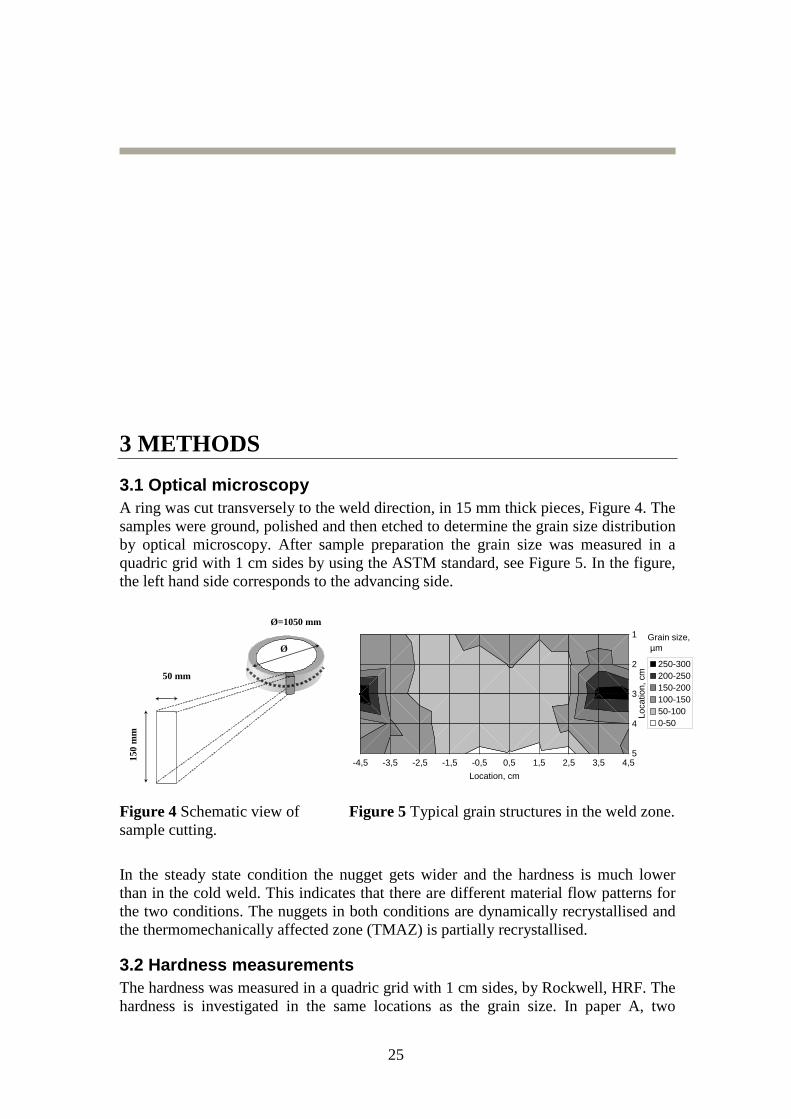
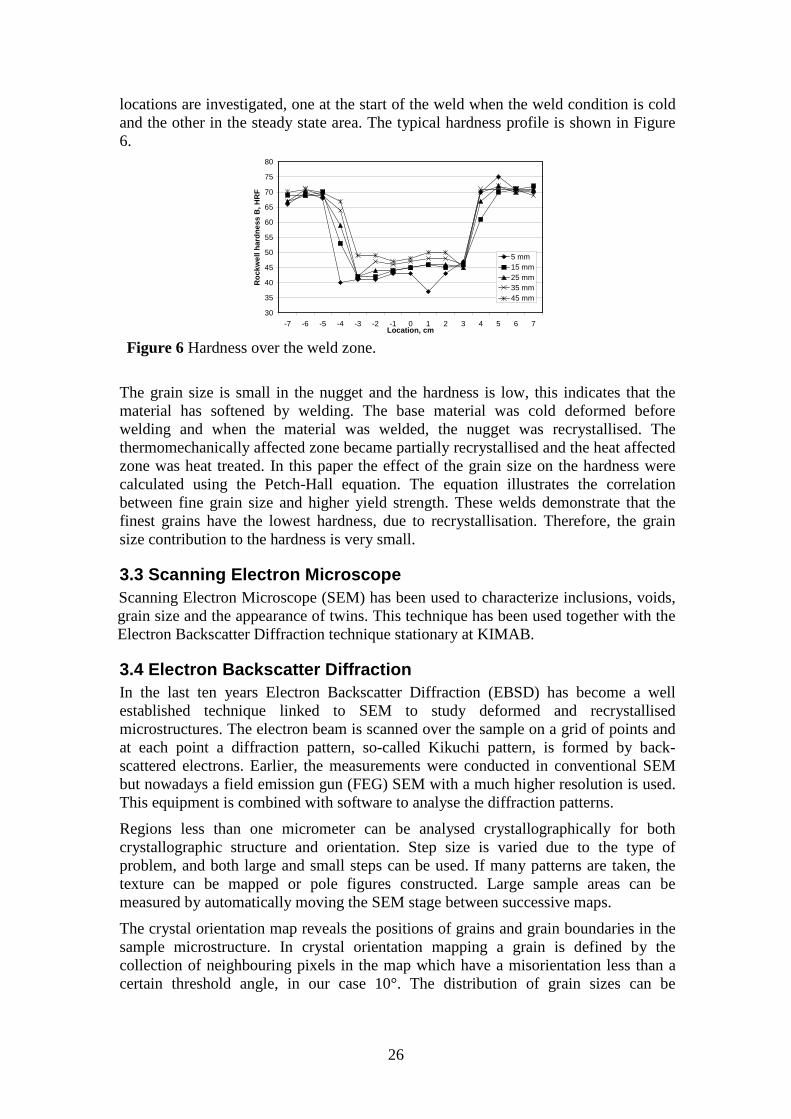
3 METHODS 3.1 Optical microscopy A ring was cut transversely to the weld direction, in 15 mm thick pieces, Figure 4. The samples were ground, polished and then etched to determine the grain size distribution by optical microscopy. After sample preparation the grain size was measured in a quadric grid with 1 cm sides by using the ASTM standard, see Figure 5. In the figure, the left hand side corresponds to the advancing side.
Ø
Ø=1050 mm
50 mm
150
mm
-4,5 -3,5 -2,5 -1,5 -0,5 0,5 1,5 2,5 3,5 4,5
5
4
3
2
1
Location, cm
Loca
tion,
cm
250-300200-250150-200100-15050-1000-50
Grain size, µm
Figure 4 Schematic view of sample cutting.
Figure 5 Typical grain structures in the weld zone.
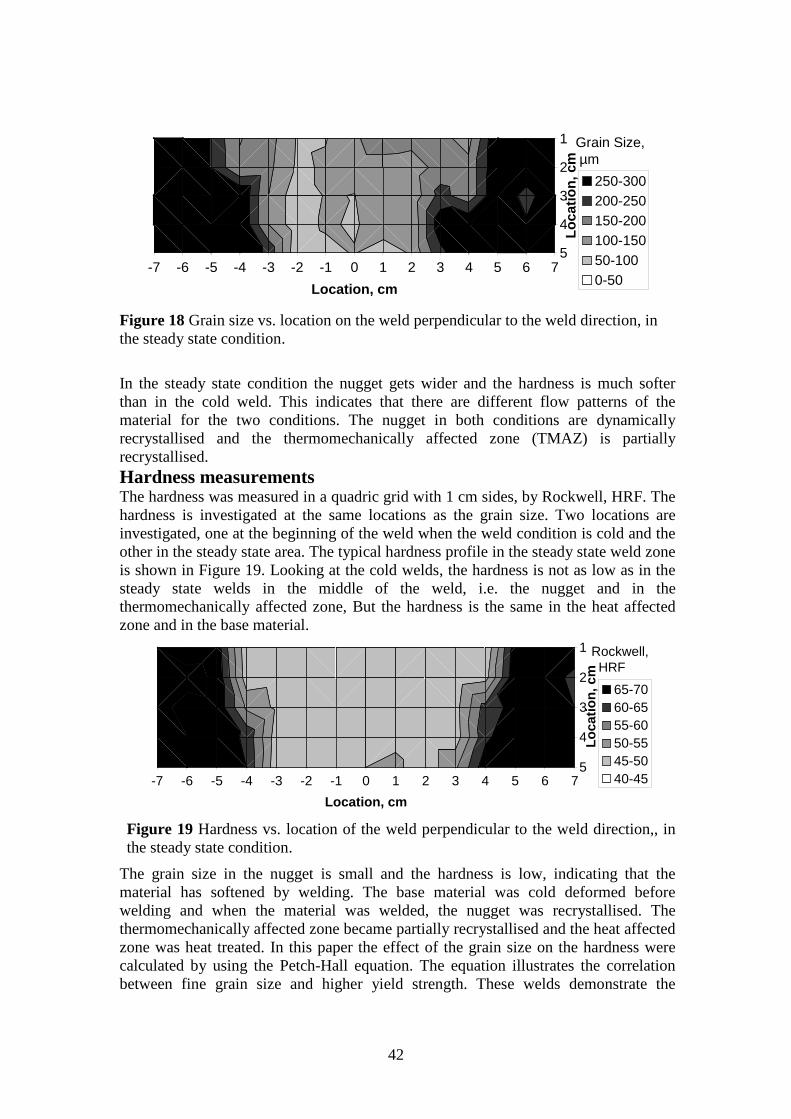
In the steady state condition the nugget gets wider and the hardness is much lower than in the cold weld. This indicates that there are different material flow patterns for the two conditions. The nuggets in both conditions are dynamically recrystallised and the thermomechanically affected zone (TMAZ) is partially recrystallised.
3.2 Hardness measurements The hardness was measured in a quadric grid with 1 cm sides, by Rockwell, HRF. The hardness is investigated in the same locations as the grain size. In paper A, two
26
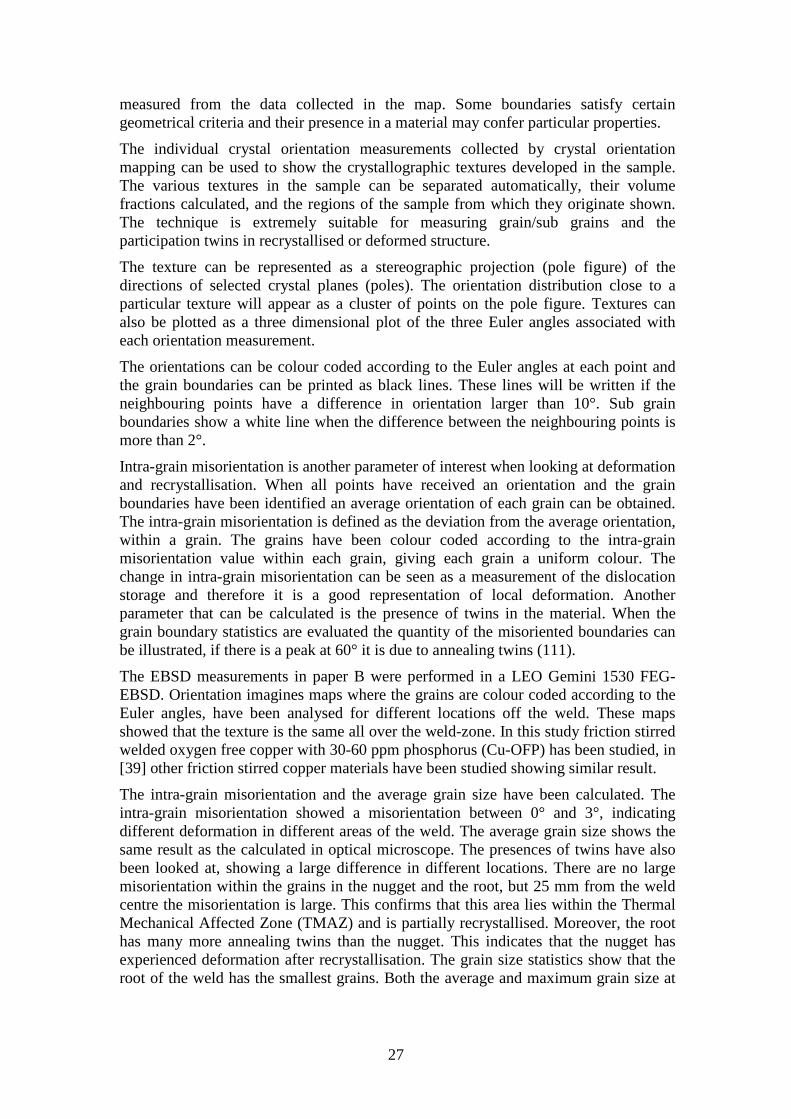
locations are investigated, one at the start of the weld when the weld condition is cold and the other in the steady state area. The typical hardness profile is shown in Figure 6.
30
35
40
45
50
55
60
65
70
75
80
-7 -6 -5 -4 -3 -2 -1 0 1 2 3 4 5 6 7Location, cm
Roc
kwel
l har
dnes
s B
, HR
F5 mm15 mm25 mm35 mm45 mm
Figure 6 Hardness over the weld zone.
The grain size is small in the nugget and the hardness is low, this indicates that the material has softened by welding. The base material was cold deformed before welding and when the material was welded, the nugget was recrystallised. The thermomechanically affected zone became partially recrystallised and the heat affected zone was heat treated. In this paper the effect of the grain size on the hardness were calculated using the Petch-Hall equation. The equation illustrates the correlation between fine grain size and higher yield strength. These welds demonstrate that the finest grains have the lowest hardness, due to recrystallisation. Therefore, the grain size contribution to the hardness is very small.
3.3 Scanning Electron Microscope Scanning Electron Microscope (SEM) has been used to characterize inclusions, voids, grain size and the appearance of twins. This technique has been used together with the Electron Backscatter Diffraction technique stationary at KIMAB.
3.4 Electron Backscatter Diffraction In the last ten years Electron Backscatter Diffraction (EBSD) has become a well established technique linked to SEM to study deformed and recrystallised microstructures. The electron beam is scanned over the sample on a grid of points and at each point a diffraction pattern, so-called Kikuchi pattern, is formed by back-scattered electrons. Earlier, the measurements were conducted in conventional SEM but nowadays a field emission gun (FEG) SEM with a much higher resolution is used. This equipment is combined with software to analyse the diffraction patterns.
Regions less than one micrometer can be analysed crystallographically for both crystallographic structure and orientation. Step size is varied due to the type of problem, and both large and small steps can be used. If many patterns are taken, the texture can be mapped or pole figures constructed. Large sample areas can be measured by automatically moving the SEM stage between successive maps.
The crystal orientation map reveals the positions of grains and grain boundaries in the sample microstructure. In crystal orientation mapping a grain is defined by the collection of neighbouring pixels in the map which have a misorientation less than a certain threshold angle, in our case 10°. The distribution of grain sizes can be
27
measured from the data collected in the map. Some boundaries satisfy certain geometrical criteria and their presence in a material may confer particular properties.
The individual crystal orientation measurements collected by crystal orientation mapping can be used to show the crystallographic textures developed in the sample. The various textures in the sample can be separated automatically, their volume fractions calculated, and the regions of the sample from which they originate shown. The technique is extremely suitable for measuring grain/sub grains and the participation twins in recrystallised or deformed structure.
The texture can be represented as a stereographic projection (pole figure) of the directions of selected crystal planes (poles). The orientation distribution close to a particular texture will appear as a cluster of points on the pole figure. Textures can also be plotted as a three dimensional plot of the three Euler angles associated with each orientation measurement.
The orientations can be colour coded according to the Euler angles at each point and the grain boundaries can be printed as black lines. These lines will be written if the neighbouring points have a difference in orientation larger than 10°. Sub grain boundaries show a white line when the difference between the neighbouring points is more than 2°.
Intra-grain misorientation is another parameter of interest when looking at deformation and recrystallisation. When all points have received an orientation and the grain boundaries have been identified an average orientation of each grain can be obtained. The intra-grain misorientation is defined as the deviation from the average orientation, within a grain. The grains have been colour coded according to the intra-grain misorientation value within each grain, giving each grain a uniform colour. The change in intra-grain misorientation can be seen as a measurement of the dislocation storage and therefore it is a good representation of local deformation. Another parameter that can be calculated is the presence of twins in the material. When the grain boundary statistics are evaluated the quantity of the misoriented boundaries can be illustrated, if there is a peak at 60° it is due to annealing twins (111).
The EBSD measurements in paper B were performed in a LEO Gemini 1530 FEG-EBSD. Orientation imagines maps where the grains are colour coded according to the Euler angles, have been analysed for different locations off the weld. These maps showed that the texture is the same all over the weld-zone. In this study friction stirred welded oxygen free copper with 30-60 ppm phosphorus (Cu-OFP) has been studied, in [39] other friction stirred copper materials have been studied showing similar result.
The intra-grain misorientation and the average grain size have been calculated. The intra-grain misorientation showed a misorientation between 0° and 3°, indicating different deformation in different areas of the weld. The average grain size shows the same result as the calculated in optical microscope. The presences of twins have also been looked at, showing a large difference in different locations. There are no large misorientation within the grains in the nugget and the root, but 25 mm from the weld centre the misorientation is large. This confirms that this area lies within the Thermal Mechanical Affected Zone (TMAZ) and is partially recrystallised. Moreover, the root has many more annealing twins than the nugget. This indicates that the nugget has experienced deformation after recrystallisation. The grain size statistics show that the root of the weld has the smallest grains. Both the average and maximum grain size at
28
25 mm from the weld centre is considerably larger than the grains within the nugget. In this analysis, all grain measurements smaller than 5 pixel points were removed.
3.5 Heat flow experiment Heat flow experiments have been carried out at the SKB canister laboratory in Oskarshamn. These studies have involved thermocouples which have been drilled into the weld line at full canisters welds. A thermographic camera has also been installed at the laboratory.
3.6 Material Flow experiment by a marker material technique Investigation of the material flow can be visualized by a marker material. In these studies a dissimilar material has been inserted into the weld line. Aluminum, lead, and brass materials have been inserted before welding and analyzed afterwards. These tests were performed at KIMAB with a milling machine. The rotation speed was 1090 rpm, the traverse motion was performed manually (with small changes if needed) and the tilt angle varied between 0 and 2 degree. The base material was 50 mm thick, 67 mm wide copper plates and the tool material was MA 754. Brass rods with a diameter of 9 mm gave the best test results in these earlier tests, therefore these rods have been used further.
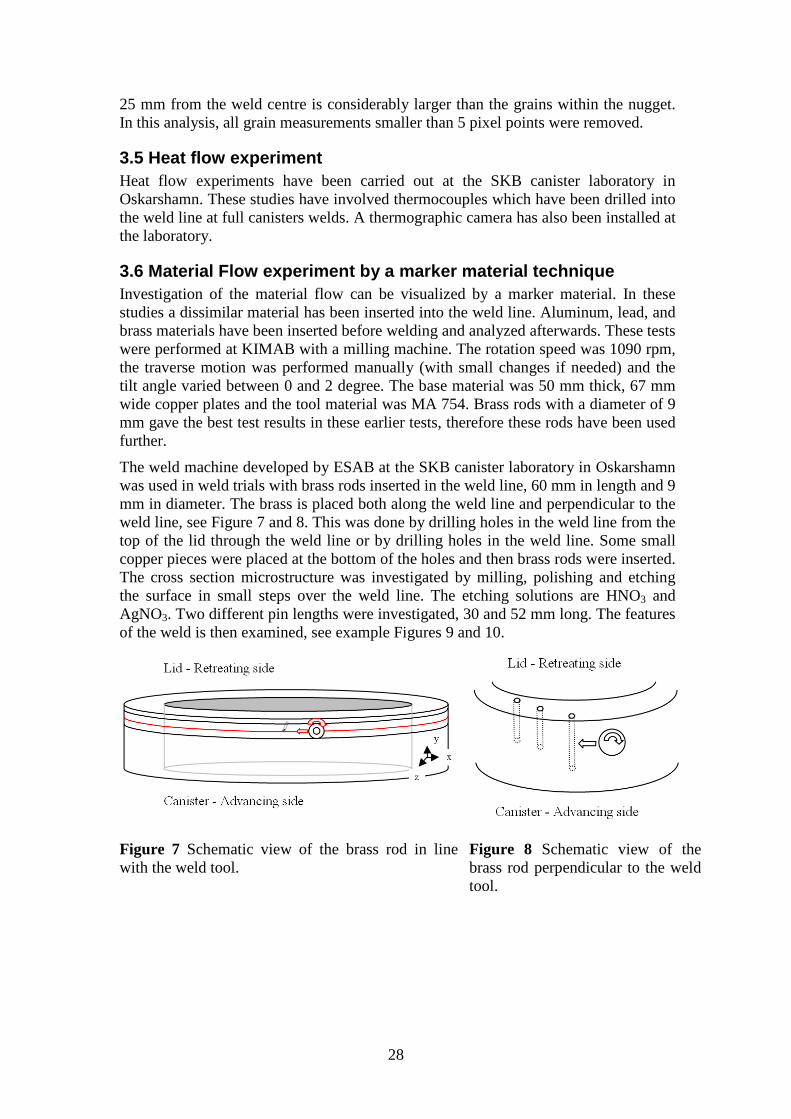
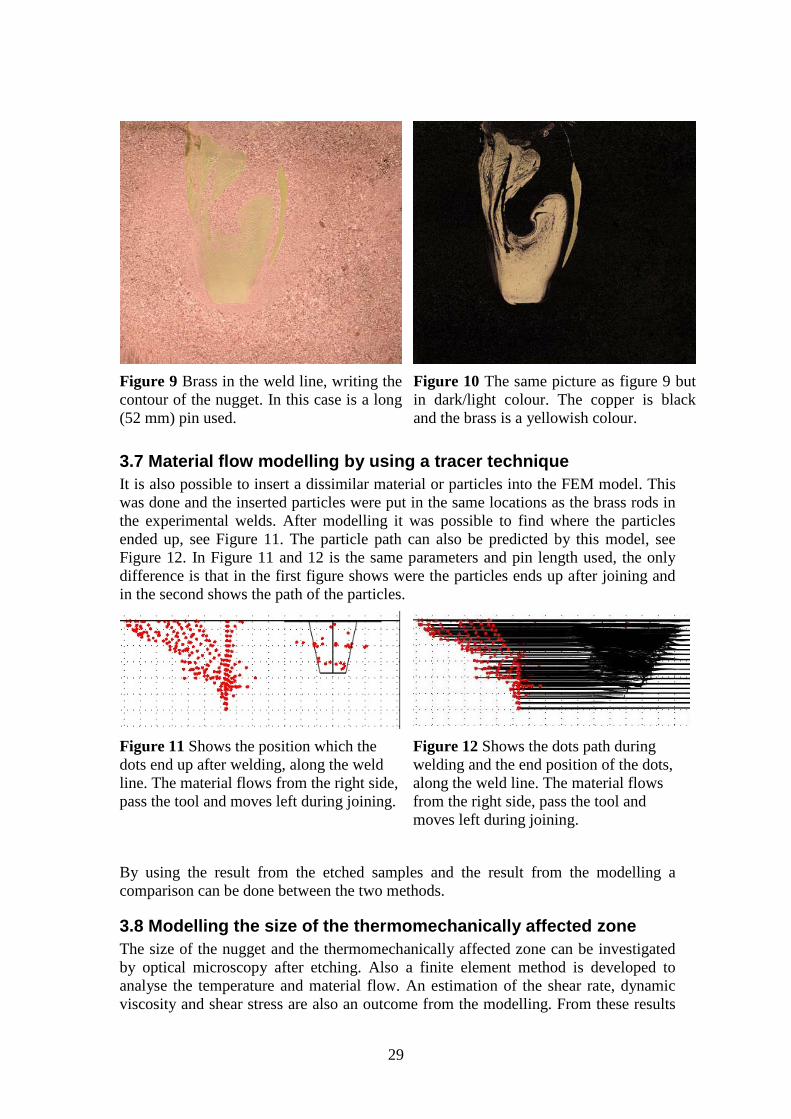
The weld machine developed by ESAB at the SKB canister laboratory in Oskarshamn was used in weld trials with brass rods inserted in the weld line, 60 mm in length and 9 mm in diameter. The brass is placed both along the weld line and perpendicular to the weld line, see Figure 7 and 8. This was done by drilling holes in the weld line from the top of the lid through the weld line or by drilling holes in the weld line. Some small copper pieces were placed at the bottom of the holes and then brass rods were inserted. The cross section microstructure was investigated by milling, polishing and etching the surface in small steps over the weld line. The etching solutions are HNO3 and AgNO3. Two different pin lengths were investigated, 30 and 52 mm long. The features of the weld is then examined, see example Figures 9 and 10.
Figure 7 Schematic view of the brass rod in line with the weld tool.
Figure 8 Schematic view of the brass rod perpendicular to the weld tool.
29
Figure 9 Brass in the weld line, writing the contour of the nugget. In this case is a long (52 mm) pin used.
Figure 10 The same picture as figure 9 but in dark/light colour. The copper is black and the brass is a yellowish colour.
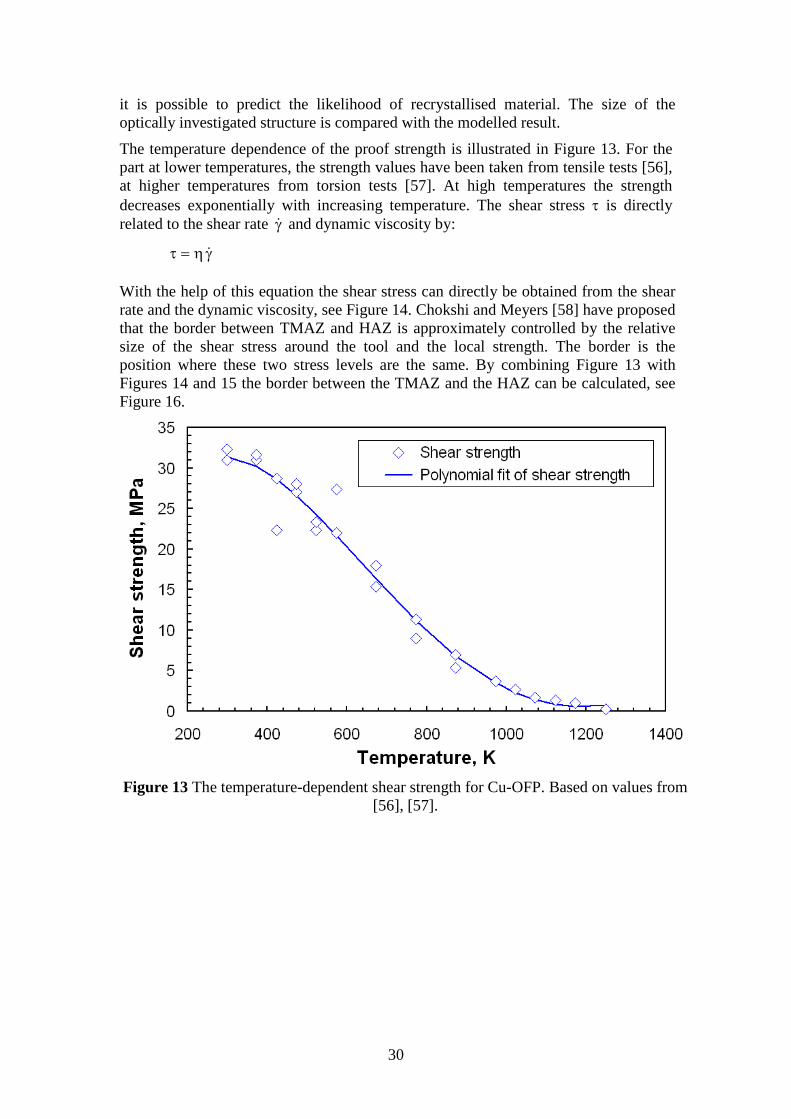
3.7 Material flow modelling by using a tracer technique It is also possible to insert a dissimilar material or particles into the FEM model. This was done and the inserted particles were put in the same locations as the brass rods in the experimental welds. After modelling it was possible to find where the particles ended up, see Figure 11. The particle path can also be predicted by this model, see Figure 12. In Figure 11 and 12 is the same parameters and pin length used, the only difference is that in the first figure shows were the particles ends up after joining and in the second shows the path of the particles.
Figure 11 Shows the position which the dots end up after welding, along the weld line. The material flows from the right side, pass the tool and moves left during joining.
Figure 12 Shows the dots path during welding and the end position of the dots, along the weld line. The material flows from the right side, pass the tool and moves left during joining.
By using the result from the etched samples and the result from the modelling a comparison can be done between the two methods.
3.8 Modelling the size of the thermomechanically affected zone The size of the nugget and the thermomechanically affected zone can be investigated by optical microscopy after etching. Also a finite element method is developed to analyse the temperature and material flow. An estimation of the shear rate, dynamic viscosity and shear stress are also an outcome from the modelling. From these results
30
it is possible to predict the likelihood of recrystallised material. The size of the optically investigated structure is compared with the modelled result.
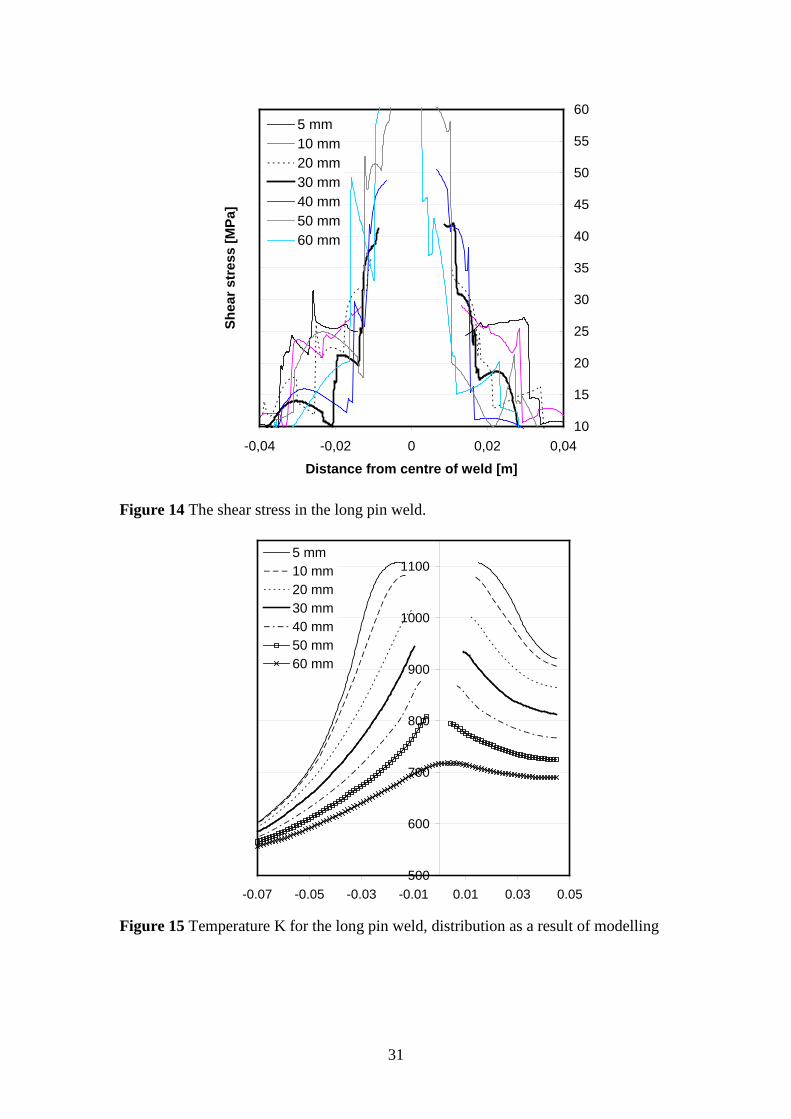
The temperature dependence of the proof strength is illustrated in Figure 13. For the part at lower temperatures, the strength values have been taken from tensile tests [56], at higher temperatures from torsion tests [57]. At high temperatures the strength decreases exponentially with increasing temperature. The shear stress τ is directly related to the shear rate γ and dynamic viscosity by:
γη=τ
With the help of this equation the shear stress can directly be obtained from the shear rate and the dynamic viscosity, see Figure 14. Chokshi and Meyers [58] have proposed that the border between TMAZ and HAZ is approximately controlled by the relative size of the shear stress around the tool and the local strength. The border is the position where these two stress levels are the same. By combining Figure 13 with Figures 14 and 15 the border between the TMAZ and the HAZ can be calculated, see Figure 16.
Figure 13 The temperature-dependent shear strength for Cu-OFP. Based on values from
[56], [57].
31
10
15
20
25
30
35
40
45
50
55
60
-0,04 -0,02 0 0,02 0,04
Distance from centre of weld [m]
Shea
r str
ess
[MPa
]
5 mm10 mm20 mm30 mm40 mm50 mm60 mm
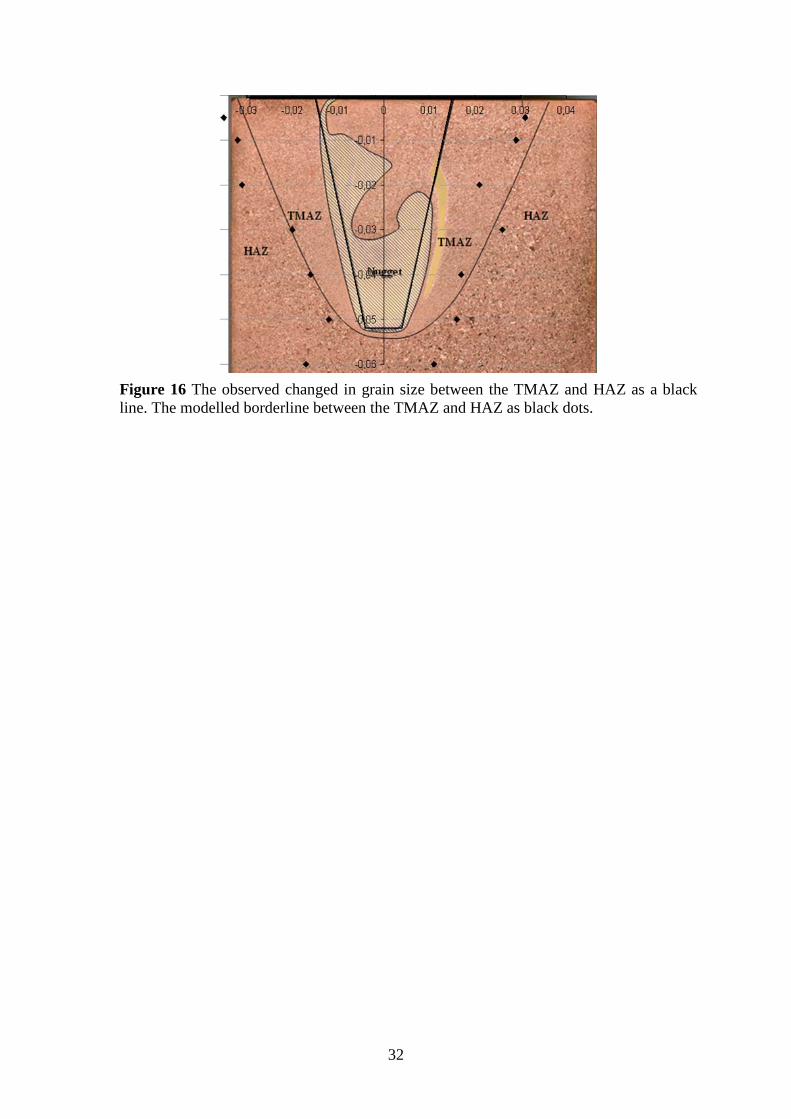
Figure 14 The shear stress in the long pin weld.
500
600
700
800
900
1000
1100
-0.07 -0.05 -0.03 -0.01 0.01 0.03 0.05
5 mm10 mm20 mm30 mm40 mm50 mm60 mm
Figure 15 Temperature K for the long pin weld, distribution as a result of modelling
32
Figure 16 The observed changed in grain size between the TMAZ and HAZ as a black line. The modelled borderline between the TMAZ and HAZ as black dots.
33
4 MODELLING 4.1 General heat transfer
4.1.1 Rosenthal’s analytical model Rosenthal’s general medium plate solution is an analytical model. It considers a point heat source moving at a constant speed across a wide plate of finite thickness d. The plate surface is assumed to be impermeable to heat. In order to maintain the net flux of heat through both boundaries equal to zero, it is necessary to introduce mirror reflections [59] as imaginary heat sources being placed below the workpiece z = 0 and z = d. The imaginary source is located symmetrically at distances ± 2id. In this way an equal amount of heat is applied back into the workpiece. Moreover, the model is based on welding parameters when the joining has reached steady state.
−×
−=− ∑
+∞=
−∞=
i
iii
00 R
2av)exp(1/R
2avxexp
2ππq
TT (1)
where the distance of each imaginary source qi from the i point of interest
222i 2id)(zyxR −++= (2)
x is the heat source’s direction of movement and y is perpendicular to that movement, q0 is the net power received by the weld, v the welding speed, pCρλa ⋅= the thermal diffusivity, λ the thermal conductivity, Cp the heat capacity, i is an integer, and v is the weld speed.
Russell and Shercliff [60] base the heat generation on a constant friction stress at the interface, equal to the shear yield stress at elevated temperature. The heat input is applied as a point or line source as in Rosenthal’s equations.
In [61] temperature measurements are made with embedded thermocouples during welding. An intuitive model, similar to Rosenthal's moving point source solution was
34
developed to quantitatively correlate the temperature field in FSW to basic process variables.
4.1.2 FEM solid model Chao’s and Qi’s model [62] is based on the assumption that the heat generation comes from sliding friction between the tool and material. This is done by using Coulomb’s law to estimate the friction force. Moreover, the pressure at the tool surface is set constant and thereby enabling a radially dependent surface heat flux distribution generated by the tool shoulder. In this model the heat from the pin is neglected. Xu and Reynolds [63] have used finite element models to describe the material flow around the pin. This is done by using a solid mechanical two-dimensional finite element model. It includes heat transfer, material flow, and continuum mechanics. The pin is included but not the threads of the pin.
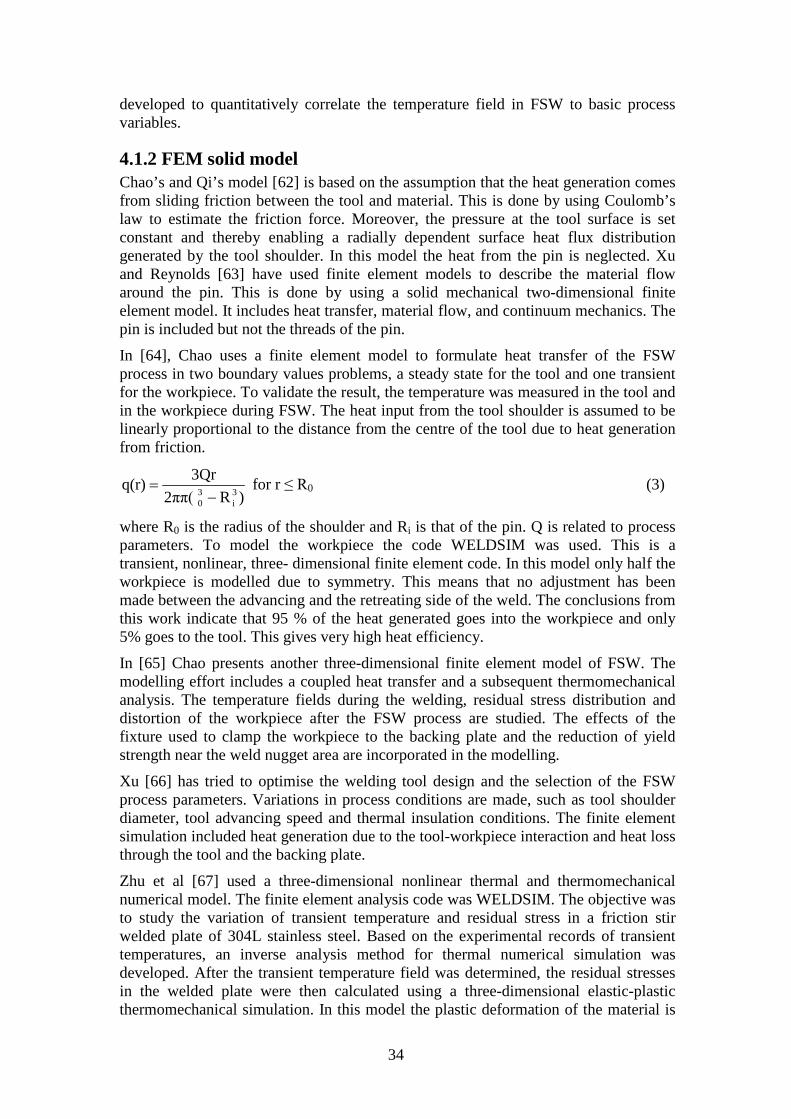
In [64], Chao uses a finite element model to formulate heat transfer of the FSW process in two boundary values problems, a steady state for the tool and one transient for the workpiece. To validate the result, the temperature was measured in the tool and in the workpiece during FSW. The heat input from the tool shoulder is assumed to be linearly proportional to the distance from the centre of the tool due to heat generation from friction.
)R2ππ(3Qrq(r) 3
i30 −
= for r ≤ R0 (3)
where R0 is the radius of the shoulder and Ri is that of the pin. Q is related to process parameters. To model the workpiece the code WELDSIM was used. This is a transient, nonlinear, three- dimensional finite element code. In this model only half the workpiece is modelled due to symmetry. This means that no adjustment has been made between the advancing and the retreating side of the weld. The conclusions from this work indicate that 95 % of the heat generated goes into the workpiece and only 5% goes to the tool. This gives very high heat efficiency.
In [65] Chao presents another three-dimensional finite element model of FSW. The modelling effort includes a coupled heat transfer and a subsequent thermomechanical analysis. The temperature fields during the welding, residual stress distribution and distortion of the workpiece after the FSW process are studied. The effects of the fixture used to clamp the workpiece to the backing plate and the reduction of yield strength near the weld nugget area are incorporated in the modelling.
Xu [66] has tried to optimise the welding tool design and the selection of the FSW process parameters. Variations in process conditions are made, such as tool shoulder diameter, tool advancing speed and thermal insulation conditions. The finite element simulation included heat generation due to the tool-workpiece interaction and heat loss through the tool and the backing plate.
Zhu et al [67] used a three-dimensional nonlinear thermal and thermomechanical numerical model. The finite element analysis code was WELDSIM. The objective was to study the variation of transient temperature and residual stress in a friction stir welded plate of 304L stainless steel. Based on the experimental records of transient temperatures, an inverse analysis method for thermal numerical simulation was developed. After the transient temperature field was determined, the residual stresses in the welded plate were then calculated using a three-dimensional elastic-plastic thermomechanical simulation. In this model the plastic deformation of the material is
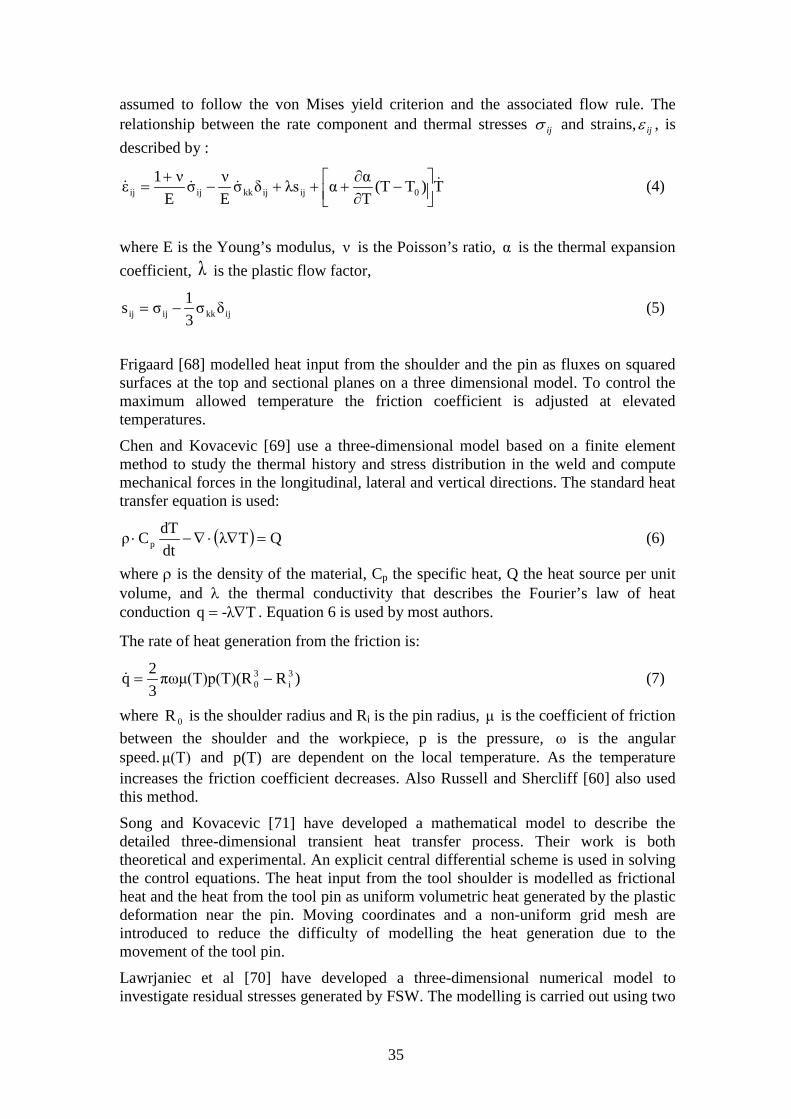
35
assumed to follow the von Mises yield criterion and the associated flow rule. The relationship between the rate component and thermal stresses ijσ and strains, ijε , is described by :
T)T(TTααλsδσ
Eνσ
Eν1ε 0ijijkkijij
−
∂∂
+++−+
= (4)
where E is the Young’s modulus, ν is the Poisson’s ratio, α is the thermal expansion coefficient, λ is the plastic flow factor,
ijkkijij δσ31σs −= (5)
Frigaard [68] modelled heat input from the shoulder and the pin as fluxes on squared surfaces at the top and sectional planes on a three dimensional model. To control the maximum allowed temperature the friction coefficient is adjusted at elevated temperatures.
Chen and Kovacevic [69] use a three-dimensional model based on a finite element method to study the thermal history and stress distribution in the weld and compute mechanical forces in the longitudinal, lateral and vertical directions. The standard heat transfer equation is used:
( ) QTλdtdTCρ p =∇⋅∇−⋅ (6)
where ρ is the density of the material, Cp the specific heat, Q the heat source per unit volume, and λ the thermal conductivity that describes the Fourier’s law of heat conduction T-λq ∇= . Equation 6 is used by most authors.
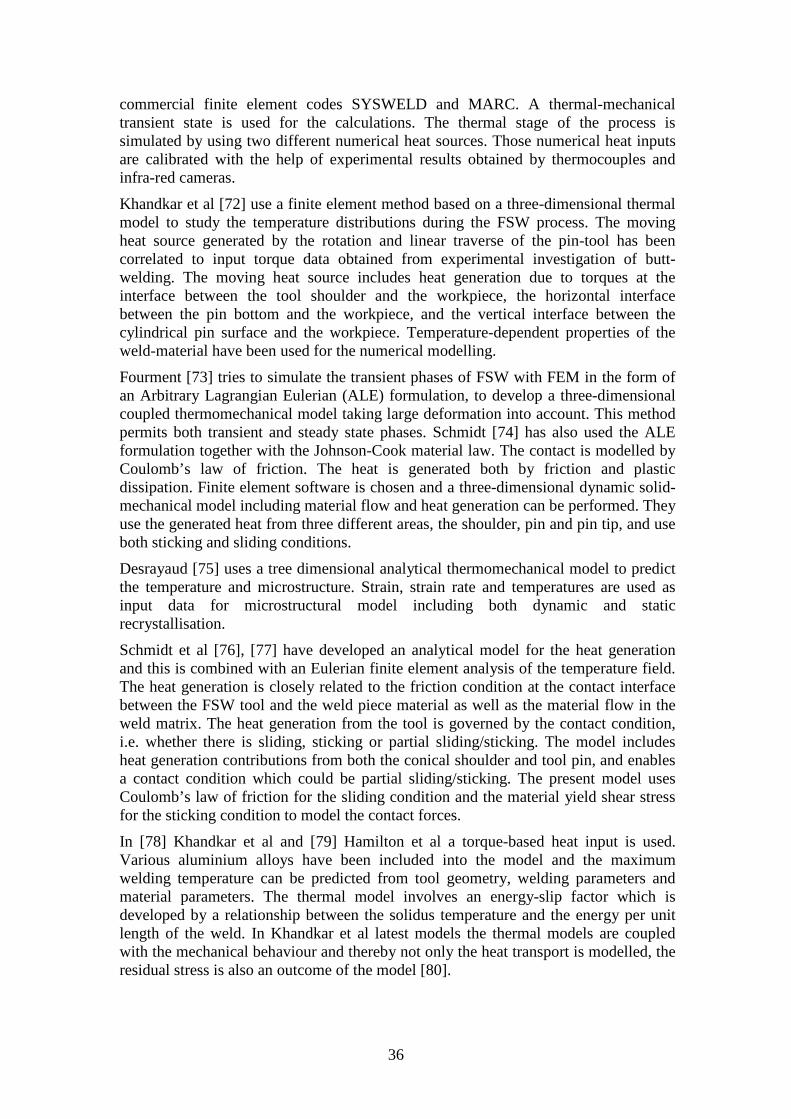
The rate of heat generation from the friction is:
)R(Rπωμ(T)p(T)32q 3
i30 −= (7)
where 0R is the shoulder radius and Ri is the pin radius, μ is the coefficient of friction between the shoulder and the workpiece, p is the pressure, ω is the angular speed. μ(T) and p(T) are dependent on the local temperature. As the temperature increases the friction coefficient decreases. Also Russell and Shercliff [60] also used this method.
Song and Kovacevic [71] have developed a mathematical model to describe the detailed three-dimensional transient heat transfer process. Their work is both theoretical and experimental. An explicit central differential scheme is used in solving the control equations. The heat input from the tool shoulder is modelled as frictional heat and the heat from the tool pin as uniform volumetric heat generated by the plastic deformation near the pin. Moving coordinates and a non-uniform grid mesh are introduced to reduce the difficulty of modelling the heat generation due to the movement of the tool pin.
Lawrjaniec et al [70] have developed a three-dimensional numerical model to investigate residual stresses generated by FSW. The modelling is carried out using two
36
commercial finite element codes SYSWELD and MARC. A thermal-mechanical transient state is used for the calculations. The thermal stage of the process is simulated by using two different numerical heat sources. Those numerical heat inputs are calibrated with the help of experimental results obtained by thermocouples and infra-red cameras.
Khandkar et al [72] use a finite element method based on a three-dimensional thermal model to study the temperature distributions during the FSW process. The moving heat source generated by the rotation and linear traverse of the pin-tool has been correlated to input torque data obtained from experimental investigation of butt-welding. The moving heat source includes heat generation due to torques at the interface between the tool shoulder and the workpiece, the horizontal interface between the pin bottom and the workpiece, and the vertical interface between the cylindrical pin surface and the workpiece. Temperature-dependent properties of the weld-material have been used for the numerical modelling.
Fourment [73] tries to simulate the transient phases of FSW with FEM in the form of an Arbitrary Lagrangian Eulerian (ALE) formulation, to develop a three-dimensional coupled thermomechanical model taking large deformation into account. This method permits both transient and steady state phases. Schmidt [74] has also used the ALE formulation together with the Johnson-Cook material law. The contact is modelled by Coulomb’s law of friction. The heat is generated both by friction and plastic dissipation. Finite element software is chosen and a three-dimensional dynamic solid-mechanical model including material flow and heat generation can be performed. They use the generated heat from three different areas, the shoulder, pin and pin tip, and use both sticking and sliding conditions.
Desrayaud [75] uses a tree dimensional analytical thermomechanical model to predict the temperature and microstructure. Strain, strain rate and temperatures are used as input data for microstructural model including both dynamic and static recrystallisation.
Schmidt et al [76], [77] have developed an analytical model for the heat generation and this is combined with an Eulerian finite element analysis of the temperature field. The heat generation is closely related to the friction condition at the contact interface between the FSW tool and the weld piece material as well as the material flow in the weld matrix. The heat generation from the tool is governed by the contact condition, i.e. whether there is sliding, sticking or partial sliding/sticking. The model includes heat generation contributions from both the conical shoulder and tool pin, and enables a contact condition which could be partial sliding/sticking. The present model uses Coulomb’s law of friction for the sliding condition and the material yield shear stress for the sticking condition to model the contact forces.
In [78] Khandkar et al and [79] Hamilton et al a torque-based heat input is used. Various aluminium alloys have been included into the model and the maximum welding temperature can be predicted from tool geometry, welding parameters and material parameters. The thermal model involves an energy-slip factor which is developed by a relationship between the solidus temperature and the energy per unit length of the weld. In Khandkar et al latest models the thermal models are coupled with the mechanical behaviour and thereby not only the heat transport is modelled, the residual stress is also an outcome of the model [80].
37
4.2 General Material Flow
4.2.1 Fluid dynamic model The contact conditions in FSW are complex, depending on alloy, welding parameters, tool design, etc. Previous models, both analytical and numerical, for simulation of the heat generation assume a known contact condition at the contact interface, e.g. either as pure sliding or sticking. Another way of looking at the modelling is by using a fluid dynamic model.
Colegrove uses an analytical model to estimate the heat generation for tools with a threaded pin. Parallel to this, Colegrove and Shercliff [81] work on a material flow model. Colegrove [82] uses a computational fluid dynamics (CFD) package called FLUENT to model viscous material flow around the FSW tool, calculating both thermal and material flow. Both slip and stick boundary conditions have been used in the model. Moreover, both two-dimensional and three-dimensional tool shapes are modelled, but, it is only the tool pin that is modelled. Four different tool shapes have been modelled. The modelling result shows that the difference between slip and stick conditions is small and the pressure and forces are similar. Furthermore, pressure plots suggest that voids most likely appear at the advancing side of the tool, and this is something also seen in copper welds [83]. One of the approaches to represent the flow stress was developed for modelling ballistic impacts
3)/T̂))(1εCln()(1Bε(Aτ mn −++= (8) τ is the shear stress, ε is the effective linear strain, A, B, n, C, m is material dependent.
roommelt
room
TTTT
T̂−
−= (9)
T is the temperature.
The shear flow stress is converted to viscosity η .
ε3τη
= (10)
Reynolds et al use two models in [84] to explain the FSW process. The first is a thermal model which is used to simulate temperature profiles in friction stir welds, Equation 6. The total torque at the shoulder is divided into shoulder, pin bottom and vertical pin surface. The required inputs for the model are total input power, tool geometry, thermophysical properties of the material being welded, welding speed and boundary conditions. The output from the model can be used to rationalize observed hardness and microstructure distributions. The second model is a fully coupled, two-dimensional fluid dynamics based model that is used to make parametric studies of variations in properties of the material to be welded (mechanical and thermophysical) and variations in welding parameters. This is done by a non slip boundary condition at the tool workpiece interface. The deformation behaviour is based on deviatoric flow stress using the Zener-Hollomon parameter. Results from this model provide insight regarding the effect of material properties on friction stir weldability and on potential mechanisms of defect formation. The deviatoric stress tensor is also used by Ulysse [85] to model the stir-welding process using three-dimensional visco-plastic modelling. In this work parametric studies have been conducted to determine the
38
effect of tool speeds on plate temperatures and to validate the model predictions with available measurements. In addition, forces acting on the tool have been computed for various welding and rotational speeds. It is found that pin forces increase with increasing welding speeds, but the opposite effect is observed for increasing rotational speeds. Numerical models such as the one presented here will be useful in designing welding tools which will yield desired thermal gradients and avoid tool breakage. Nandan et al [86] have presented a numerical analyse of three-dimensional material flow and heat transfer in mild steel. The temperature, cooling rates and plastic flows are solved by the equations of conservation of mass, momentum and energy together with the boundary conditions. In this model the non-Newtonian viscosity is determined from the computed values of strain rate, temperature and material properties. Temperatures and total torque was compared with experimental values showing good agreement.
4.2.2 Thermomechanical analysis supported by computational fluid dynamics method (paper C and D)
During FSW, the welding tool moves along the contour of the canister. This movement is relative in nature between welding tool and canister. The velocity of the welding tool passing through the contour of the canister is the same in quantity as that for the canister material passing through the tool pin, but with opposite directions. This velocity u can be described by incompressible Navier-Stokes equation
( ) uηpFuuρtuρ 2∇+∇−=⋅∇⋅⋅+∂∂ (11)
where F is the volume force, p the pressure, and η the dynamic viscosity which is temperature and strain rate dependent.
The heat transfer is governed by the heat equation
( ) QTλtTCρ p =∇⋅∇−∂∂
⋅ (12)
where ρ is the density of the material, Cp the specific heat, Q the heat source per unit volume, and λ the thermal conductivity that describes the Fourier’s law of heat conduction T-λq ∇= . Due to a relative displacement between the canister and the welding tool, the effect of convective heat in the canister should be taken into account.
The above equations are coupled through T, Q, and η terms. As elaborated before, free convection exists in the model. The Q term in the heat equation is thus substituted by the divergence of the convective heat flux
TuCρ p ∇⋅⋅⋅ (13)
using the concept that the velocity field is divergence free. The velocity field w)v,(u,u = in Eq. (13) is described by the Navier-Stokes equation, which is
dependent on the temperature through the dynamic viscosity η. Due to the effect of welding heat influx, the canister could be distorted by the thermal expansion during FSW process. Such a strain-displacement relation in a continuum leads to the Navier’s equation.
Kuc 1 =∇⋅∇− (14)
39
where K the volume force, and c is a tensor.
The thermal expansion affects the displacement, stress and strain. This influence can be accounted for by decomposing strain ε into thermal strain thε and elastic strain elε
( )refelthel TTαεεεε −⋅+=+= (15)
and by inserting it into Navier’s equation. With parameter coupling, a finite element model describing multi-physical phenomena is established.
4.2.3 Material flow modelling of FSW process (paper E, F and G) From a computational point of view, FSW process is a sequential coupling of material flow and heat generation. It is possible to simulate the FSW by coupling mass, momentum, and heat transport conservation equations. For a homogeneous fluid with constant density, the steady−state mass and momentum transport can be described by the incompressible non−Newtonian transport equations:
0u =∇ ( ) τg ρp- uu ρ ⋅∇++∇=∇⋅ (16)
where u is the velocity vector, ρ the density, g the gravitational acceleration vector, p the pressure, and τ is the shear stress tensor given by γ η τ = . ( ) ( )[ ]Tuuγ ∇+∇= is the rate of strain tensor and η is the dynamic viscosity. The temperature−dependent dynamic viscosity for non−Newtonian Cu−OFP can explicitly be expressed as [90]:
( )
+
+−+−
= − ϕT
kζ4v
TTTT
kζ2vexp γηη
B
0a200
B0mβ0 (17)
where T is the temperature in Kelvin and 0ζ , av Bk , T0, and ϕ are constants. The pre−factor mvh=η0 is the viscosity of the fluid in the high temperature limit; where h is Planck’s constant and vm the atomic volume of the fluid. The exponent β is the shear−rate sensitivity that associates with the viscosity relaxation.
The heat transport in the welding process is governed by the steady-state energy equation:
( ) ( ) u: τTk T uC ρ p ∇+∇⋅∇=∇⋅ (18)
where k is the thermal conductivity and Cp is the specific heat. The term on the left side of Eq. 18 represents the divergence of the convective heat flux under the condition of 0u =∇ ; while the second term on the right side, where Einstein notation of summation over repeated indices is given, stands for the viscous heat converted from internal energy, which is also known as viscous dissipation. The latent heat release due to the recrystallisation is not considered in the current study. In the current study, the heat flux generated by the friction between work piece and tool wall is explained by the viscous dissipation because there is a similarity between the frictional sliding and shear deformation of viscous material in terms of thermal-viscous coupling [88]. The mass and momentum transport in Eq. 16 and energy balance in Eq. 18 are then coupled through the velocity vector u and the dynamic viscosity η.

40
41
5 INVESTIGATIONS AND SUMMARY OF APPENDED PAPERS 5.1 Paper A The purpose of paper A was to examine the variation in grain size and hardness as a function of welding conditions. In this investigation two weld locations were examined, one at the start of the weld, where the welding temperature rises from ambient to >800°C and the welding speed is ramped up progressively to the steady state speed. The other location is where the welding conditions have reached steady state. Moreover, the effect of the grain size on the hardness is looked at, using the Petch- Hall equation. Optical microscopy The ring was cut transversely to the weld direction, in 15 mm thick pieces. The samples were ground, polished and then etched to determine the grain size distribution by optical microscopy. After sample preparation the grain size was measured in a quadric grid with 1 cm sides by using the ASTM standard, see Figure 18. In the figure, the left side corresponds to the advancing side.
42
-7 -6 -5 -4 -3 -2 -1 0 1 2 3 4 5 6 75
4
3
2
1
Location, cm
Loca
tion,
cm
250-300200-250150-200100-15050-1000-50
Grain Size, µm
Figure 18 Grain size vs. location on the weld perpendicular to the weld direction, in the steady state condition.
In the steady state condition the nugget gets wider and the hardness is much softer than in the cold weld. This indicates that there are different flow patterns of the material for the two conditions. The nugget in both conditions are dynamically recrystallised and the thermomechanically affected zone (TMAZ) is partially recrystallised. Hardness measurements The hardness was measured in a quadric grid with 1 cm sides, by Rockwell, HRF. The hardness is investigated at the same locations as the grain size. Two locations are investigated, one at the beginning of the weld when the weld condition is cold and the other in the steady state area. The typical hardness profile in the steady state weld zone is shown in Figure 19. Looking at the cold welds, the hardness is not as low as in the steady state welds in the middle of the weld, i.e. the nugget and in the thermomechanically affected zone, But the hardness is the same in the heat affected zone and in the base material.
-7 -6 -5 -4 -3 -2 -1 0 1 2 3 4 5 6 75
4
3
2
1
Location, cm
Loca
tion,
cm
65-7060-6555-6050-5545-5040-45
Rockwell, HRF
Figure 19 Hardness vs. location of the weld perpendicular to the weld direction,, in the steady state condition.
The grain size in the nugget is small and the hardness is low, indicating that the material has softened by welding. The base material was cold deformed before welding and when the material was welded, the nugget was recrystallised. The thermomechanically affected zone became partially recrystallised and the heat affected zone was heat treated. In this paper the effect of the grain size on the hardness were calculated by using the Petch-Hall equation. The equation illustrates the correlation between fine grain size and higher yield strength. These welds demonstrate the
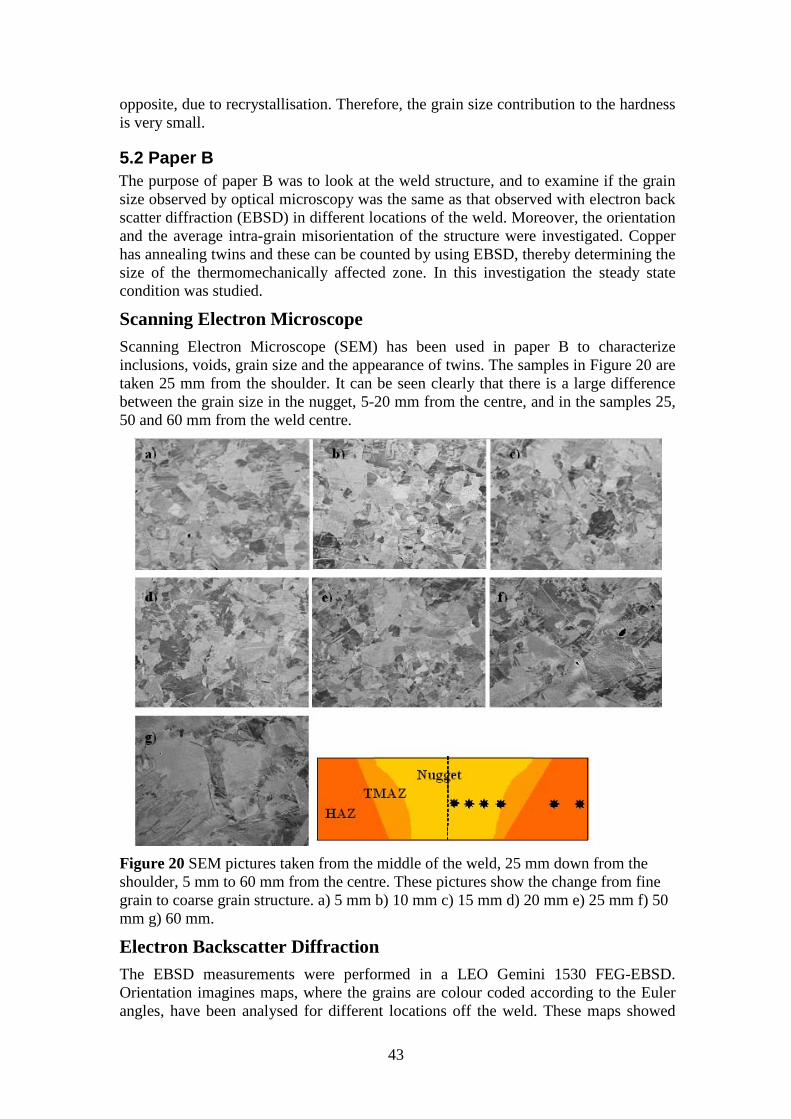
43
opposite, due to recrystallisation. Therefore, the grain size contribution to the hardness is very small.
5.2 Paper B The purpose of paper B was to look at the weld structure, and to examine if the grain size observed by optical microscopy was the same as that observed with electron back scatter diffraction (EBSD) in different locations of the weld. Moreover, the orientation and the average intra-grain misorientation of the structure were investigated. Copper has annealing twins and these can be counted by using EBSD, thereby determining the size of the thermomechanically affected zone. In this investigation the steady state condition was studied.
Scanning Electron Microscope Scanning Electron Microscope (SEM) has been used in paper B to characterize inclusions, voids, grain size and the appearance of twins. The samples in Figure 20 are taken 25 mm from the shoulder. It can be seen clearly that there is a large difference between the grain size in the nugget, 5-20 mm from the centre, and in the samples 25, 50 and 60 mm from the weld centre.
Figure 20 SEM pictures taken from the middle of the weld, 25 mm down from the shoulder, 5 mm to 60 mm from the centre. These pictures show the change from fine grain to coarse grain structure. a) 5 mm b) 10 mm c) 15 mm d) 20 mm e) 25 mm f) 50 mm g) 60 mm.
Electron Backscatter Diffraction The EBSD measurements were performed in a LEO Gemini 1530 FEG-EBSD. Orientation imagines maps, where the grains are colour coded according to the Euler angles, have been analysed for different locations off the weld. These maps showed
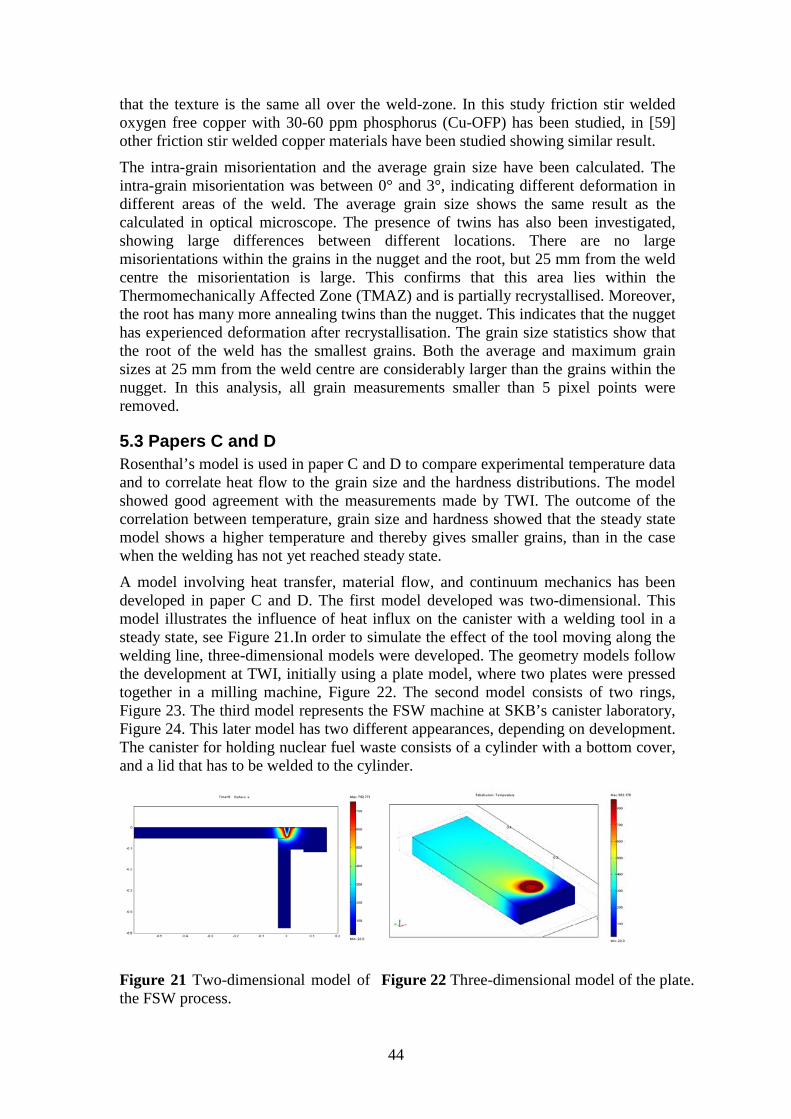
44
that the texture is the same all over the weld-zone. In this study friction stir welded oxygen free copper with 30-60 ppm phosphorus (Cu-OFP) has been studied, in [59] other friction stir welded copper materials have been studied showing similar result.
The intra-grain misorientation and the average grain size have been calculated. The intra-grain misorientation was between 0° and 3°, indicating different deformation in different areas of the weld. The average grain size shows the same result as the calculated in optical microscope. The presence of twins has also been investigated, showing large differences between different locations. There are no large misorientations within the grains in the nugget and the root, but 25 mm from the weld centre the misorientation is large. This confirms that this area lies within the Thermomechanically Affected Zone (TMAZ) and is partially recrystallised. Moreover, the root has many more annealing twins than the nugget. This indicates that the nugget has experienced deformation after recrystallisation. The grain size statistics show that the root of the weld has the smallest grains. Both the average and maximum grain sizes at 25 mm from the weld centre are considerably larger than the grains within the nugget. In this analysis, all grain measurements smaller than 5 pixel points were removed.
5.3 Papers C and D Rosenthal’s model is used in paper C and D to compare experimental temperature data and to correlate heat flow to the grain size and the hardness distributions. The model showed good agreement with the measurements made by TWI. The outcome of the correlation between temperature, grain size and hardness showed that the steady state model shows a higher temperature and thereby gives smaller grains, than in the case when the welding has not yet reached steady state.
A model involving heat transfer, material flow, and continuum mechanics has been developed in paper C and D. The first model developed was two-dimensional. This model illustrates the influence of heat influx on the canister with a welding tool in a steady state, see Figure 21.In order to simulate the effect of the tool moving along the welding line, three-dimensional models were developed. The geometry models follow the development at TWI, initially using a plate model, where two plates were pressed together in a milling machine, Figure 22. The second model consists of two rings, Figure 23. The third model represents the FSW machine at SKB’s canister laboratory, Figure 24. This later model has two different appearances, depending on development. The canister for holding nuclear fuel waste consists of a cylinder with a bottom cover, and a lid that has to be welded to the cylinder.
Figure 21 Two-dimensional model of the FSW process.
Figure 22 Three-dimensional model of the plate.
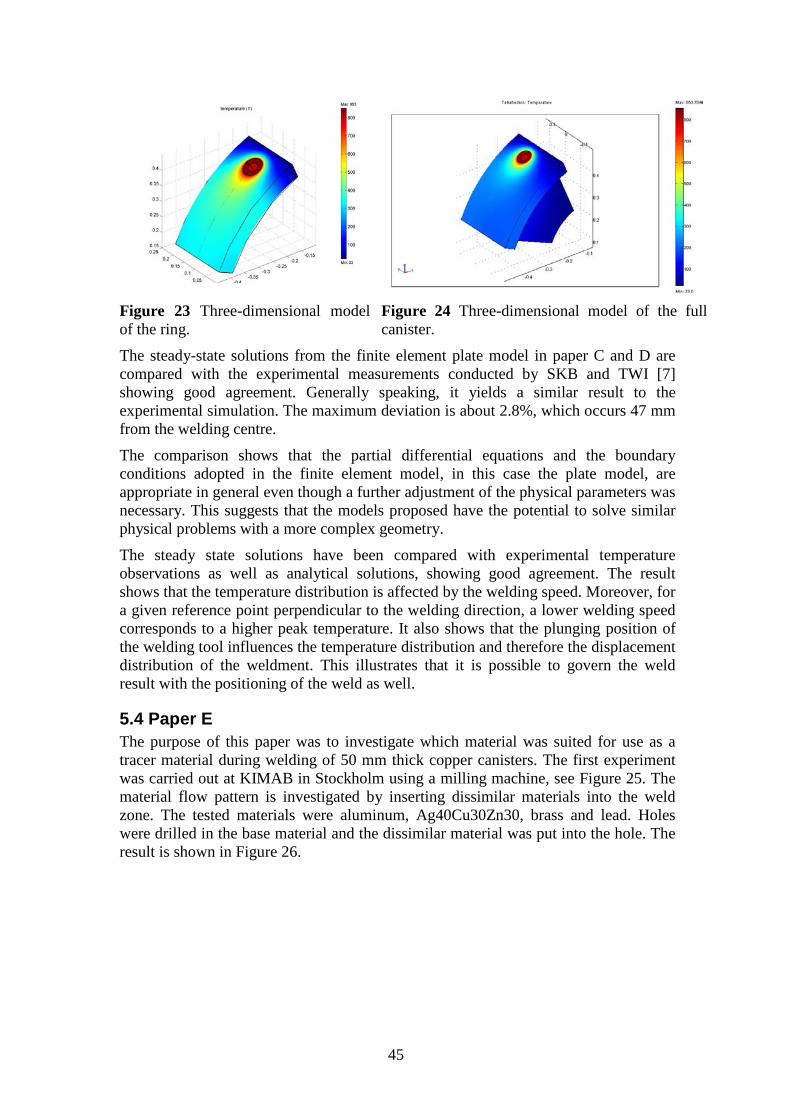
45
Figure 23 Three-dimensional model of the ring.
Figure 24 Three-dimensional model of the full canister.
The steady-state solutions from the finite element plate model in paper C and D are compared with the experimental measurements conducted by SKB and TWI [7] showing good agreement. Generally speaking, it yields a similar result to the experimental simulation. The maximum deviation is about 2.8%, which occurs 47 mm from the welding centre.
The comparison shows that the partial differential equations and the boundary conditions adopted in the finite element model, in this case the plate model, are appropriate in general even though a further adjustment of the physical parameters was necessary. This suggests that the models proposed have the potential to solve similar physical problems with a more complex geometry.
The steady state solutions have been compared with experimental temperature observations as well as analytical solutions, showing good agreement. The result shows that the temperature distribution is affected by the welding speed. Moreover, for a given reference point perpendicular to the welding direction, a lower welding speed corresponds to a higher peak temperature. It also shows that the plunging position of the welding tool influences the temperature distribution and therefore the displacement distribution of the weldment. This illustrates that it is possible to govern the weld result with the positioning of the weld as well.
5.4 Paper E The purpose of this paper was to investigate which material was suited for use as a tracer material during welding of 50 mm thick copper canisters. The first experiment was carried out at KIMAB in Stockholm using a milling machine, see Figure 25. The material flow pattern is investigated by inserting dissimilar materials into the weld zone. The tested materials were aluminum, Ag40Cu30Zn30, brass and lead. Holes were drilled in the base material and the dissimilar material was put into the hole. The result is shown in Figure 26.
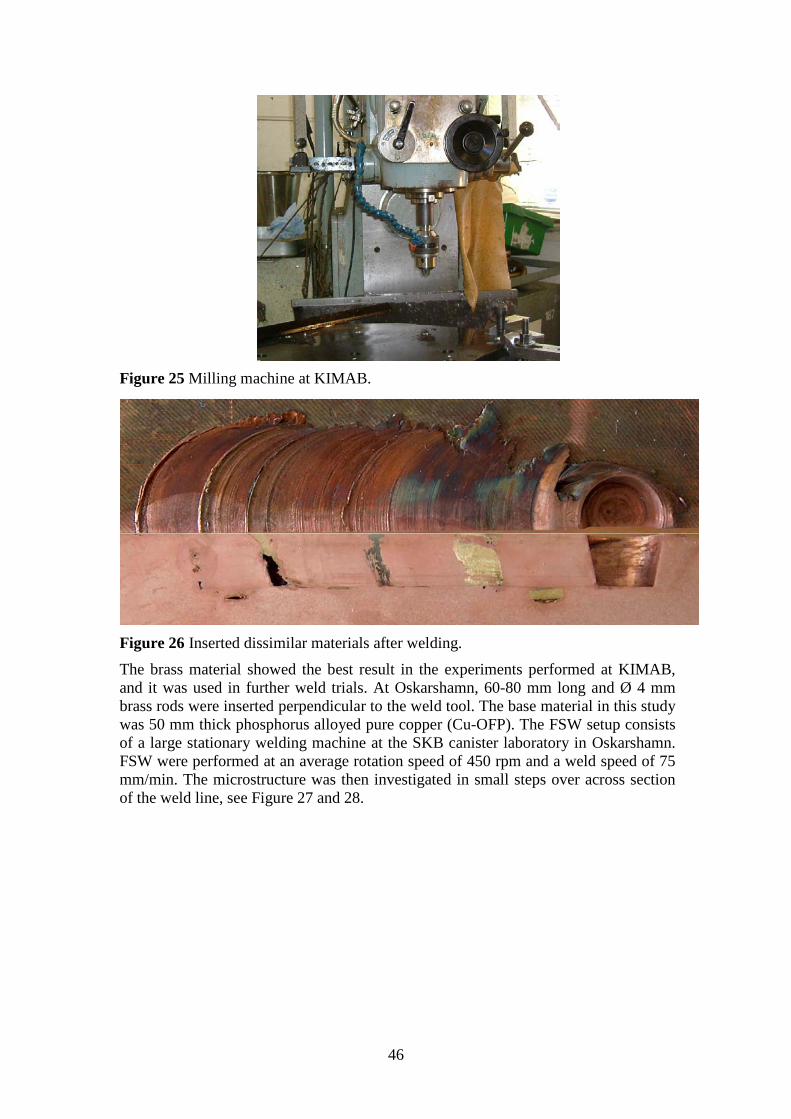
46
Figure 25 Milling machine at KIMAB.
Figure 26 Inserted dissimilar materials after welding. The brass material showed the best result in the experiments performed at KIMAB, and it was used in further weld trials. At Oskarshamn, 60-80 mm long and Ø 4 mm brass rods were inserted perpendicular to the weld tool. The base material in this study was 50 mm thick phosphorus alloyed pure copper (Cu-OFP). The FSW setup consists of a large stationary welding machine at the SKB canister laboratory in Oskarshamn. FSW were performed at an average rotation speed of 450 rpm and a weld speed of 75 mm/min. The microstructure was then investigated in small steps over across section of the weld line, see Figure 27 and 28.
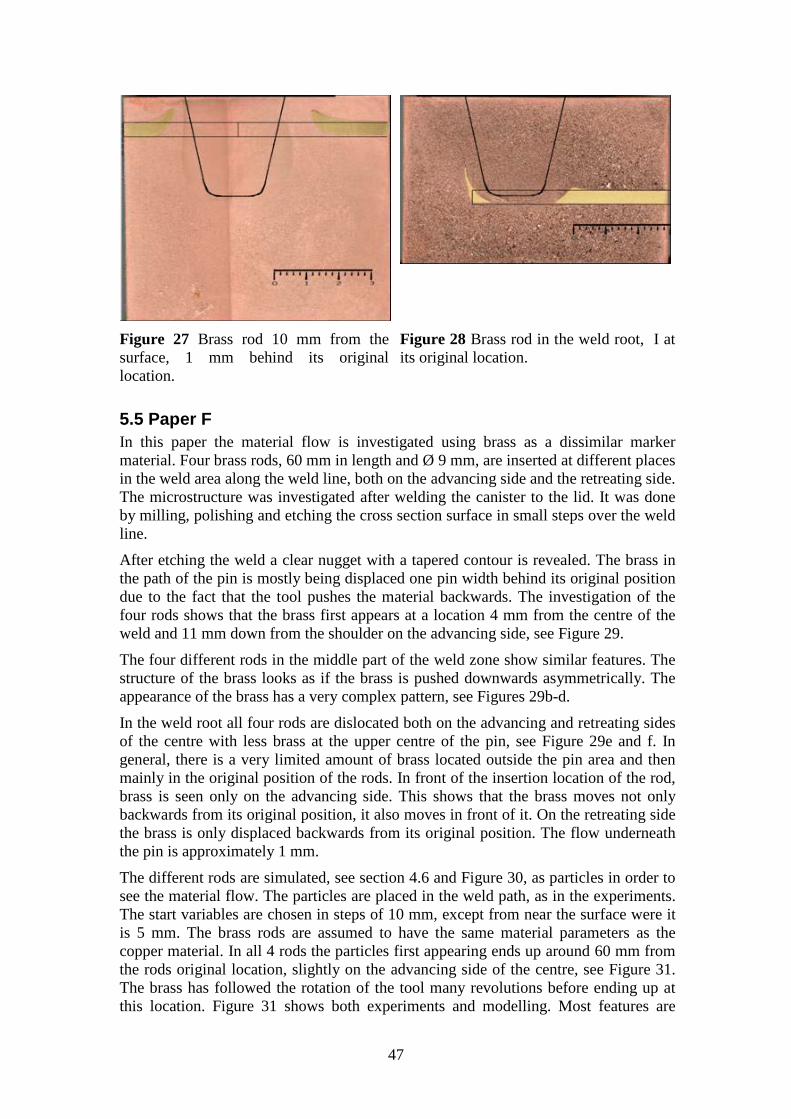
47
Figure 27 Brass rod 10 mm from the surface, 1 mm behind its original location.
Figure 28 Brass rod in the weld root, I at its original location.
5.5 Paper F In this paper the material flow is investigated using brass as a dissimilar marker material. Four brass rods, 60 mm in length and Ø 9 mm, are inserted at different places in the weld area along the weld line, both on the advancing side and the retreating side. The microstructure was investigated after welding the canister to the lid. It was done by milling, polishing and etching the cross section surface in small steps over the weld line.
After etching the weld a clear nugget with a tapered contour is revealed. The brass in the path of the pin is mostly being displaced one pin width behind its original position due to the fact that the tool pushes the material backwards. The investigation of the four rods shows that the brass first appears at a location 4 mm from the centre of the weld and 11 mm down from the shoulder on the advancing side, see Figure 29.
The four different rods in the middle part of the weld zone show similar features. The structure of the brass looks as if the brass is pushed downwards asymmetrically. The appearance of the brass has a very complex pattern, see Figures 29b-d.
In the weld root all four rods are dislocated both on the advancing and retreating sides of the centre with less brass at the upper centre of the pin, see Figure 29e and f. In general, there is a very limited amount of brass located outside the pin area and then mainly in the original position of the rods. In front of the insertion location of the rod, brass is seen only on the advancing side. This shows that the brass moves not only backwards from its original position, it also moves in front of it. On the retreating side the brass is only displaced backwards from its original position. The flow underneath the pin is approximately 1 mm.
The different rods are simulated, see section 4.6 and Figure 30, as particles in order to see the material flow. The particles are placed in the weld path, as in the experiments. The start variables are chosen in steps of 10 mm, except from near the surface were it is 5 mm. The brass rods are assumed to have the same material parameters as the copper material. In all 4 rods the particles first appearing ends up around 60 mm from the rods original location, slightly on the advancing side of the centre, see Figure 31. The brass has followed the rotation of the tool many revolutions before ending up at this location. Figure 31 shows both experiments and modelling. Most features are
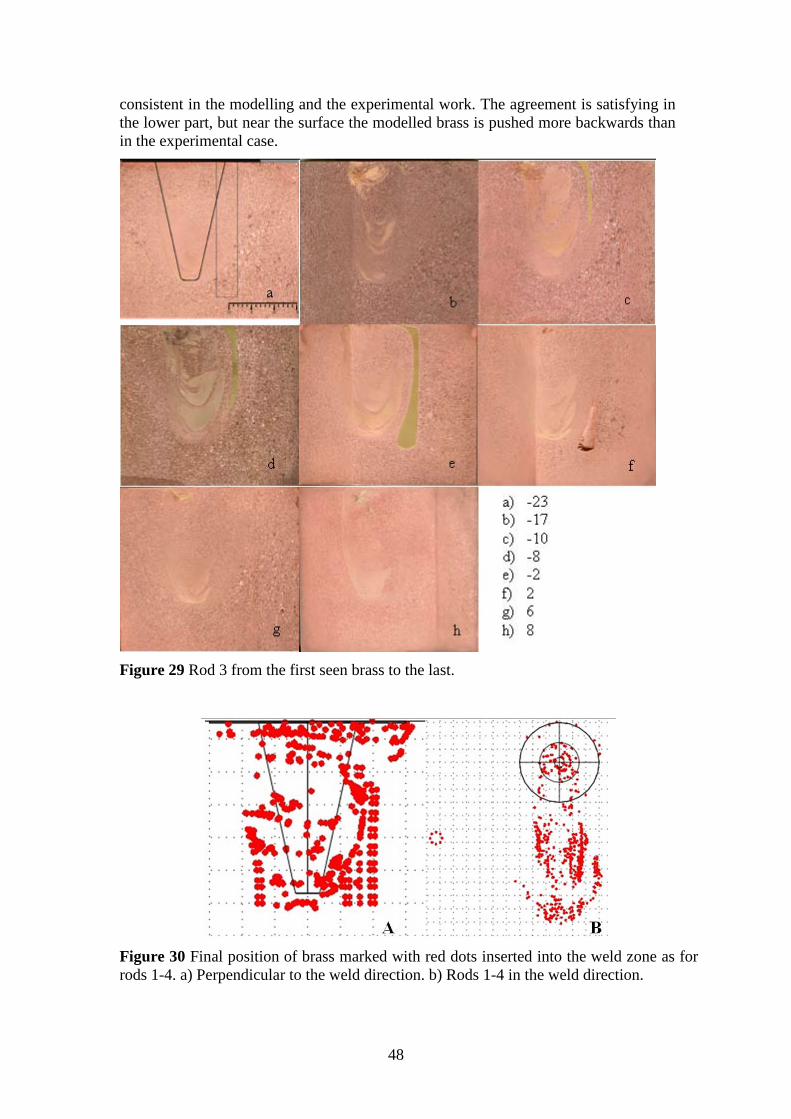
48
consistent in the modelling and the experimental work. The agreement is satisfying in the lower part, but near the surface the modelled brass is pushed more backwards than in the experimental case.
Figure 29 Rod 3 from the first seen brass to the last.
Figure 30 Final position of brass marked with red dots inserted into the weld zone as for rods 1-4. a) Perpendicular to the weld direction. b) Rods 1-4 in the weld direction.
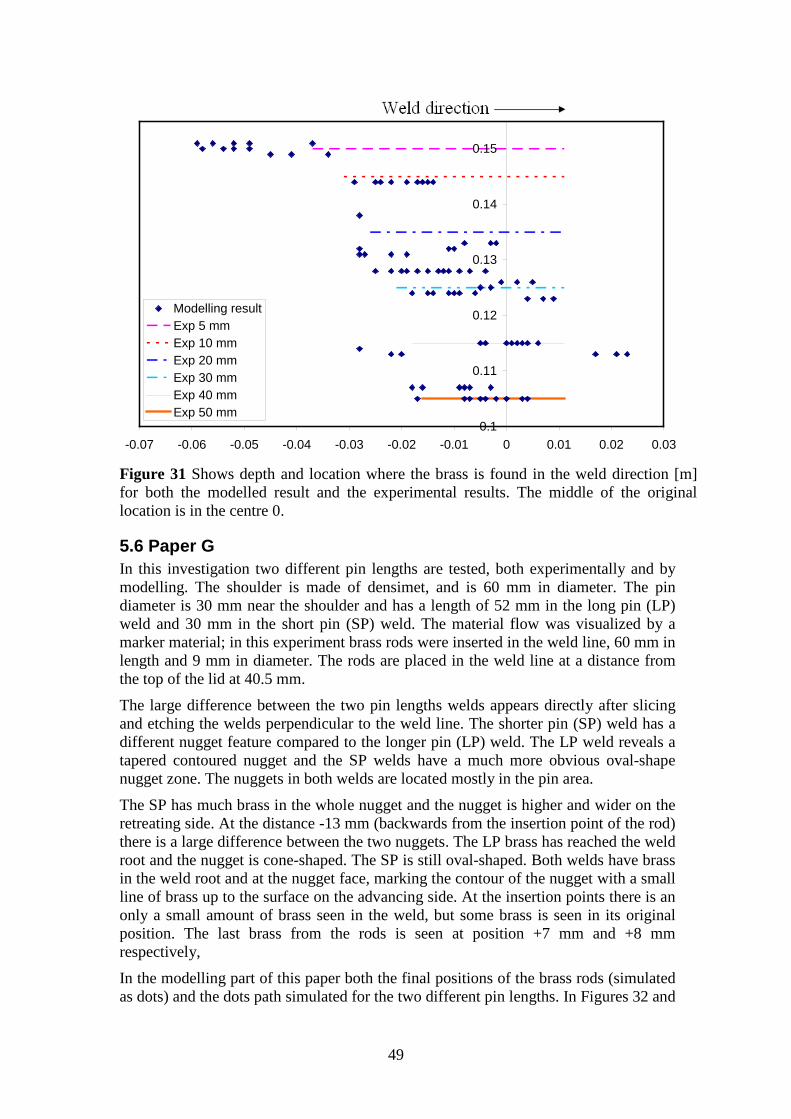
49
0.1
0.11
0.12
0.13
0.14
0.15
-0.07 -0.06 -0.05 -0.04 -0.03 -0.02 -0.01 0 0.01 0.02 0.03
Modelling resultExp 5 mmExp 10 mmExp 20 mmExp 30 mmExp 40 mmExp 50 mm
Figure 31 Shows depth and location where the brass is found in the weld direction [m] for both the modelled result and the experimental results. The middle of the original location is in the centre 0.
5.6 Paper G In this investigation two different pin lengths are tested, both experimentally and by modelling. The shoulder is made of densimet, and is 60 mm in diameter. The pin diameter is 30 mm near the shoulder and has a length of 52 mm in the long pin (LP) weld and 30 mm in the short pin (SP) weld. The material flow was visualized by a marker material; in this experiment brass rods were inserted in the weld line, 60 mm in length and 9 mm in diameter. The rods are placed in the weld line at a distance from the top of the lid at 40.5 mm.
The large difference between the two pin lengths welds appears directly after slicing and etching the welds perpendicular to the weld line. The shorter pin (SP) weld has a different nugget feature compared to the longer pin (LP) weld. The LP weld reveals a tapered contoured nugget and the SP welds have a much more obvious oval-shape nugget zone. The nuggets in both welds are located mostly in the pin area.
The SP has much brass in the whole nugget and the nugget is higher and wider on the retreating side. At the distance -13 mm (backwards from the insertion point of the rod) there is a large difference between the two nuggets. The LP brass has reached the weld root and the nugget is cone-shaped. The SP is still oval-shaped. Both welds have brass in the weld root and at the nugget face, marking the contour of the nugget with a small line of brass up to the surface on the advancing side. At the insertion points there is an only a small amount of brass seen in the weld, but some brass is seen in its original position. The last brass from the rods is seen at position +7 mm and +8 mm respectively,
In the modelling part of this paper both the final positions of the brass rods (simulated as dots) and the dots path simulated for the two different pin lengths. In Figures 32 and
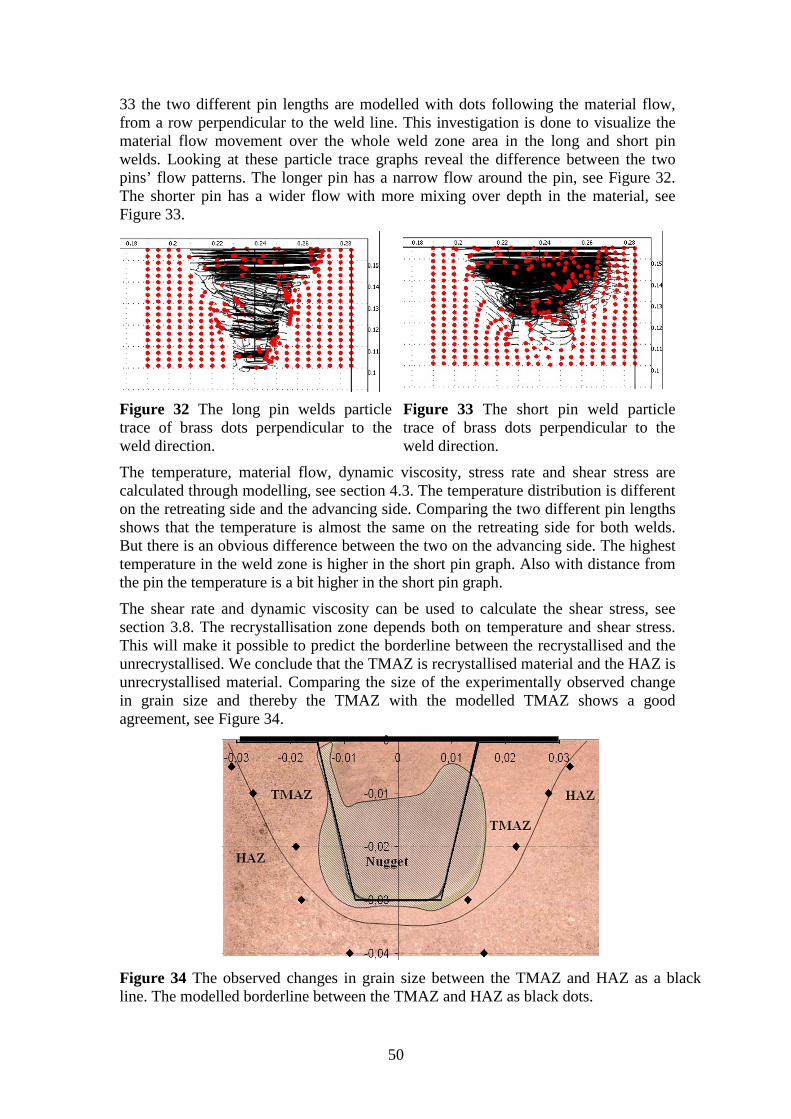
50
33 the two different pin lengths are modelled with dots following the material flow, from a row perpendicular to the weld line. This investigation is done to visualize the material flow movement over the whole weld zone area in the long and short pin welds. Looking at these particle trace graphs reveal the difference between the two pins’ flow patterns. The longer pin has a narrow flow around the pin, see Figure 32. The shorter pin has a wider flow with more mixing over depth in the material, see Figure 33.
Figure 32 The long pin welds particle trace of brass dots perpendicular to the weld direction.
Figure 33 The short pin weld particle trace of brass dots perpendicular to the weld direction.
The temperature, material flow, dynamic viscosity, stress rate and shear stress are calculated through modelling, see section 4.3. The temperature distribution is different on the retreating side and the advancing side. Comparing the two different pin lengths shows that the temperature is almost the same on the retreating side for both welds. But there is an obvious difference between the two on the advancing side. The highest temperature in the weld zone is higher in the short pin graph. Also with distance from the pin the temperature is a bit higher in the short pin graph.
The shear rate and dynamic viscosity can be used to calculate the shear stress, see section 3.8. The recrystallisation zone depends both on temperature and shear stress. This will make it possible to predict the borderline between the recrystallised and the unrecrystallised. We conclude that the TMAZ is recrystallised material and the HAZ is unrecrystallised material. Comparing the size of the experimentally observed change in grain size and thereby the TMAZ with the modelled TMAZ shows a good agreement, see Figure 34.
Figure 34 The observed changes in grain size between the TMAZ and HAZ as a black line. The modelled borderline between the TMAZ and HAZ as black dots.
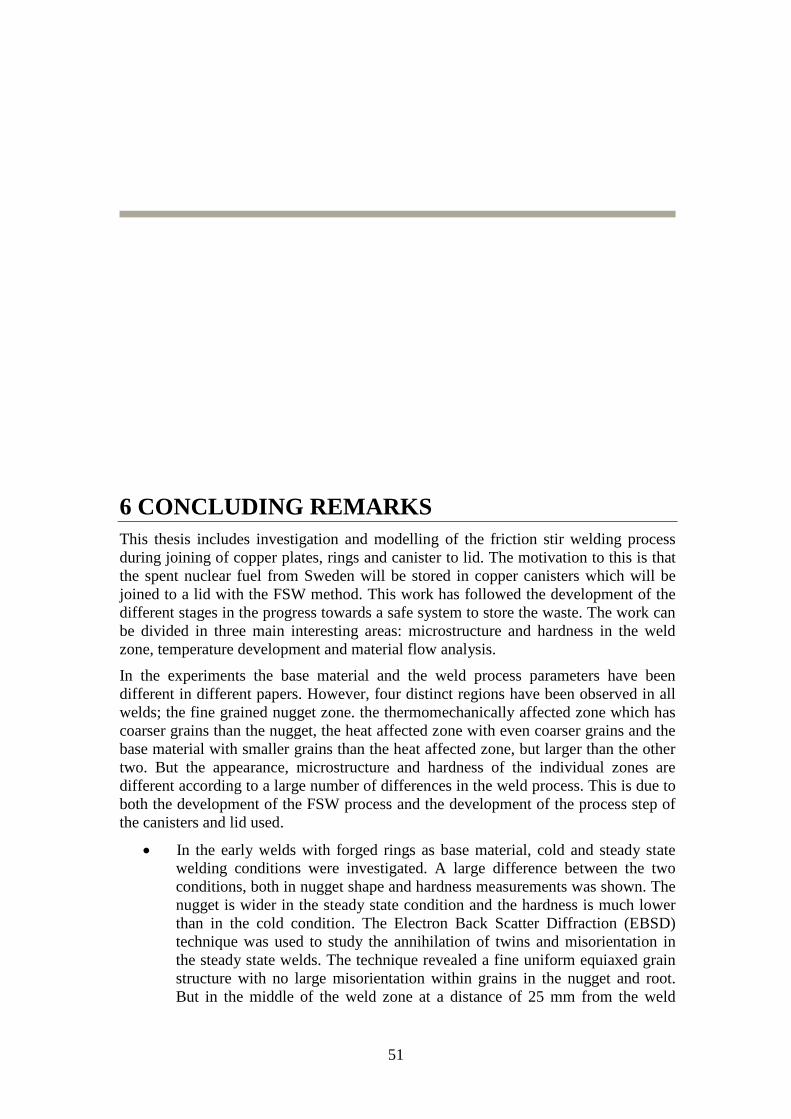
51
6 CONCLUDING REMARKS This thesis includes investigation and modelling of the friction stir welding process during joining of copper plates, rings and canister to lid. The motivation to this is that the spent nuclear fuel from Sweden will be stored in copper canisters which will be joined to a lid with the FSW method. This work has followed the development of the different stages in the progress towards a safe system to store the waste. The work can be divided in three main interesting areas: microstructure and hardness in the weld zone, temperature development and material flow analysis.
In the experiments the base material and the weld process parameters have been different in different papers. However, four distinct regions have been observed in all welds; the fine grained nugget zone. the thermomechanically affected zone which has coarser grains than the nugget, the heat affected zone with even coarser grains and the base material with smaller grains than the heat affected zone, but larger than the other two. But the appearance, microstructure and hardness of the individual zones are different according to a large number of differences in the weld process. This is due to both the development of the FSW process and the development of the process step of the canisters and lid used.
• In the early welds with forged rings as base material, cold and steady state welding conditions were investigated. A large difference between the two conditions, both in nugget shape and hardness measurements was shown. The nugget is wider in the steady state condition and the hardness is much lower than in the cold condition. The Electron Back Scatter Diffraction (EBSD) technique was used to study the annihilation of twins and misorientation in the steady state welds. The technique revealed a fine uniform equiaxed grain structure with no large misorientation within grains in the nugget and root. But in the middle of the weld zone at a distance of 25 mm from the weld
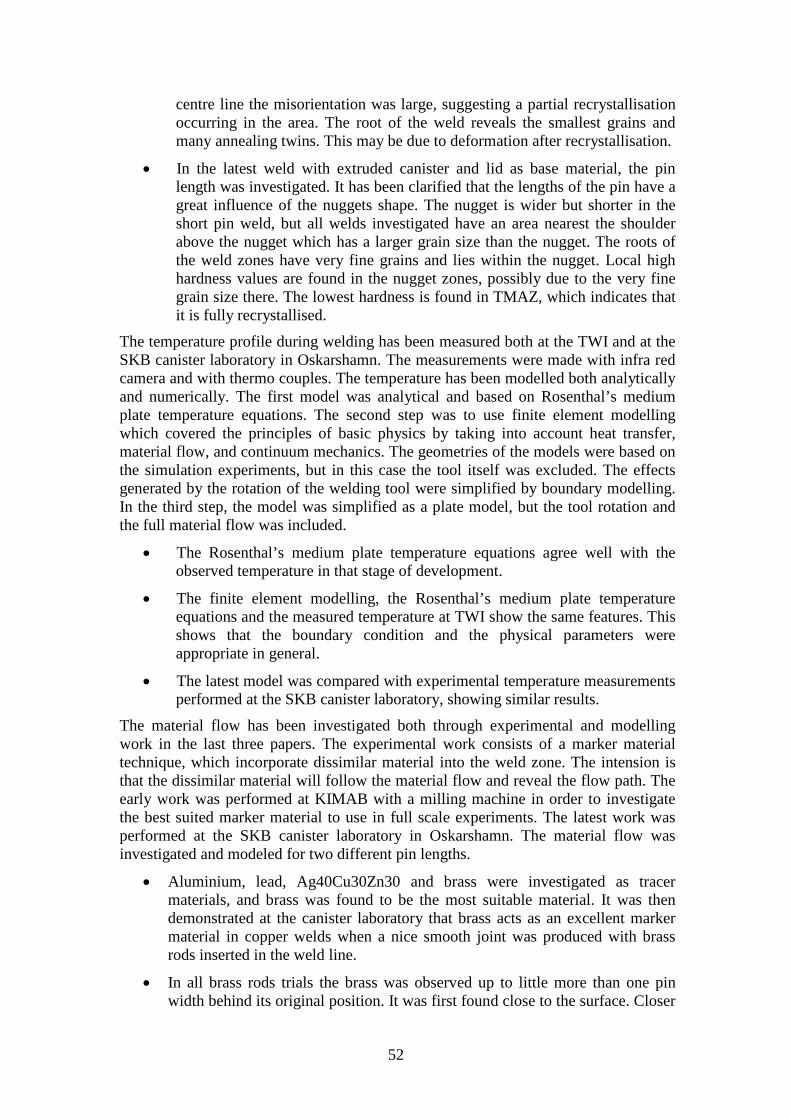
52
centre line the misorientation was large, suggesting a partial recrystallisation occurring in the area. The root of the weld reveals the smallest grains and many annealing twins. This may be due to deformation after recrystallisation.
• In the latest weld with extruded canister and lid as base material, the pin length was investigated. It has been clarified that the lengths of the pin have a great influence of the nuggets shape. The nugget is wider but shorter in the short pin weld, but all welds investigated have an area nearest the shoulder above the nugget which has a larger grain size than the nugget. The roots of the weld zones have very fine grains and lies within the nugget. Local high hardness values are found in the nugget zones, possibly due to the very fine grain size there. The lowest hardness is found in TMAZ, which indicates that it is fully recrystallised.
The temperature profile during welding has been measured both at the TWI and at the SKB canister laboratory in Oskarshamn. The measurements were made with infra red camera and with thermo couples. The temperature has been modelled both analytically and numerically. The first model was analytical and based on Rosenthal’s medium plate temperature equations. The second step was to use finite element modelling which covered the principles of basic physics by taking into account heat transfer, material flow, and continuum mechanics. The geometries of the models were based on the simulation experiments, but in this case the tool itself was excluded. The effects generated by the rotation of the welding tool were simplified by boundary modelling. In the third step, the model was simplified as a plate model, but the tool rotation and the full material flow was included.
• The Rosenthal’s medium plate temperature equations agree well with the observed temperature in that stage of development.
• The finite element modelling, the Rosenthal’s medium plate temperature equations and the measured temperature at TWI show the same features. This shows that the boundary condition and the physical parameters were appropriate in general.
• The latest model was compared with experimental temperature measurements performed at the SKB canister laboratory, showing similar results.
The material flow has been investigated both through experimental and modelling work in the last three papers. The experimental work consists of a marker material technique, which incorporate dissimilar material into the weld zone. The intension is that the dissimilar material will follow the material flow and reveal the flow path. The early work was performed at KIMAB with a milling machine in order to investigate the best suited marker material to use in full scale experiments. The latest work was performed at the SKB canister laboratory in Oskarshamn. The material flow was investigated and modeled for two different pin lengths.
• Aluminium, lead, Ag40Cu30Zn30 and brass were investigated as tracer materials, and brass was found to be the most suitable material. It was then demonstrated at the canister laboratory that brass acts as an excellent marker material in copper welds when a nice smooth joint was produced with brass rods inserted in the weld line.
• In all brass rods trials the brass was observed up to little more than one pin width behind its original position. It was first found close to the surface. Closer
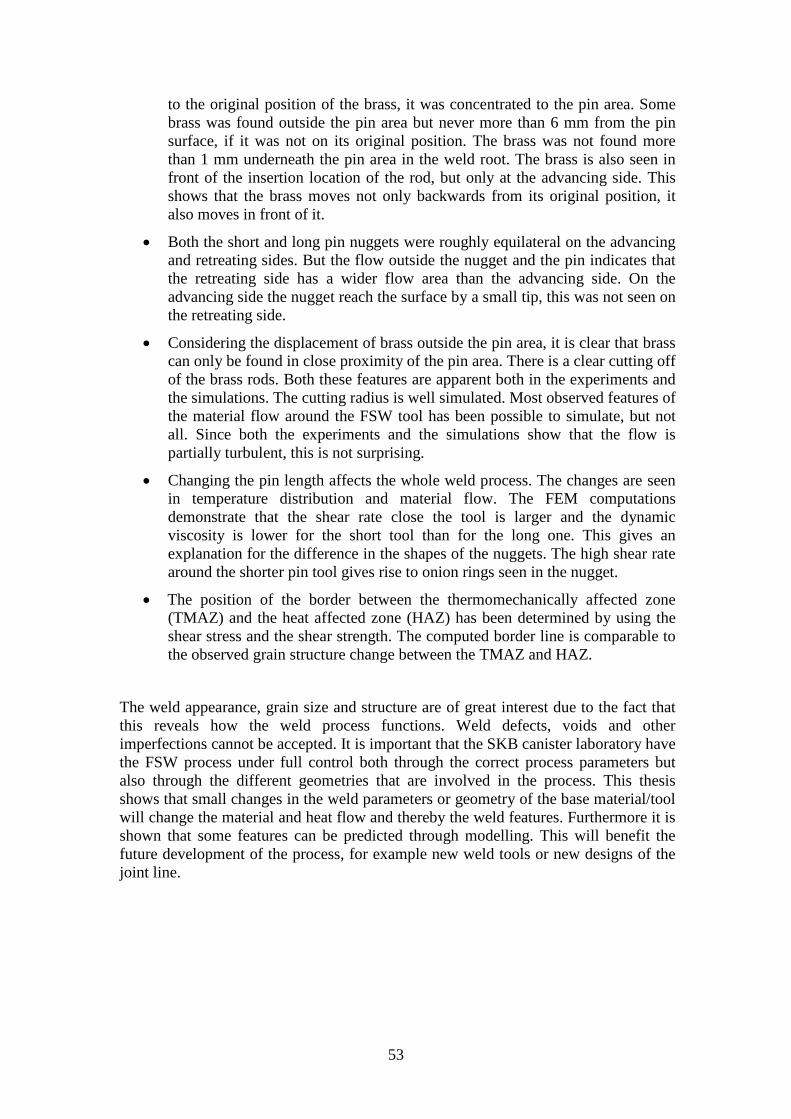
53
to the original position of the brass, it was concentrated to the pin area. Some brass was found outside the pin area but never more than 6 mm from the pin surface, if it was not on its original position. The brass was not found more than 1 mm underneath the pin area in the weld root. The brass is also seen in front of the insertion location of the rod, but only at the advancing side. This shows that the brass moves not only backwards from its original position, it also moves in front of it.
• Both the short and long pin nuggets were roughly equilateral on the advancing and retreating sides. But the flow outside the nugget and the pin indicates that the retreating side has a wider flow area than the advancing side. On the advancing side the nugget reach the surface by a small tip, this was not seen on the retreating side.
• Considering the displacement of brass outside the pin area, it is clear that brass can only be found in close proximity of the pin area. There is a clear cutting off of the brass rods. Both these features are apparent both in the experiments and the simulations. The cutting radius is well simulated. Most observed features of the material flow around the FSW tool has been possible to simulate, but not all. Since both the experiments and the simulations show that the flow is partially turbulent, this is not surprising.
• Changing the pin length affects the whole weld process. The changes are seen in temperature distribution and material flow. The FEM computations demonstrate that the shear rate close the tool is larger and the dynamic viscosity is lower for the short tool than for the long one. This gives an explanation for the difference in the shapes of the nuggets. The high shear rate around the shorter pin tool gives rise to onion rings seen in the nugget.
• The position of the border between the thermomechanically affected zone (TMAZ) and the heat affected zone (HAZ) has been determined by using the shear stress and the shear strength. The computed border line is comparable to the observed grain structure change between the TMAZ and HAZ.
The weld appearance, grain size and structure are of great interest due to the fact that this reveals how the weld process functions. Weld defects, voids and other imperfections cannot be accepted. It is important that the SKB canister laboratory have the FSW process under full control both through the correct process parameters but also through the different geometries that are involved in the process. This thesis shows that small changes in the weld parameters or geometry of the base material/tool will change the material and heat flow and thereby the weld features. Furthermore it is shown that some features can be predicted through modelling. This will benefit the future development of the process, for example new weld tools or new designs of the joint line.

54
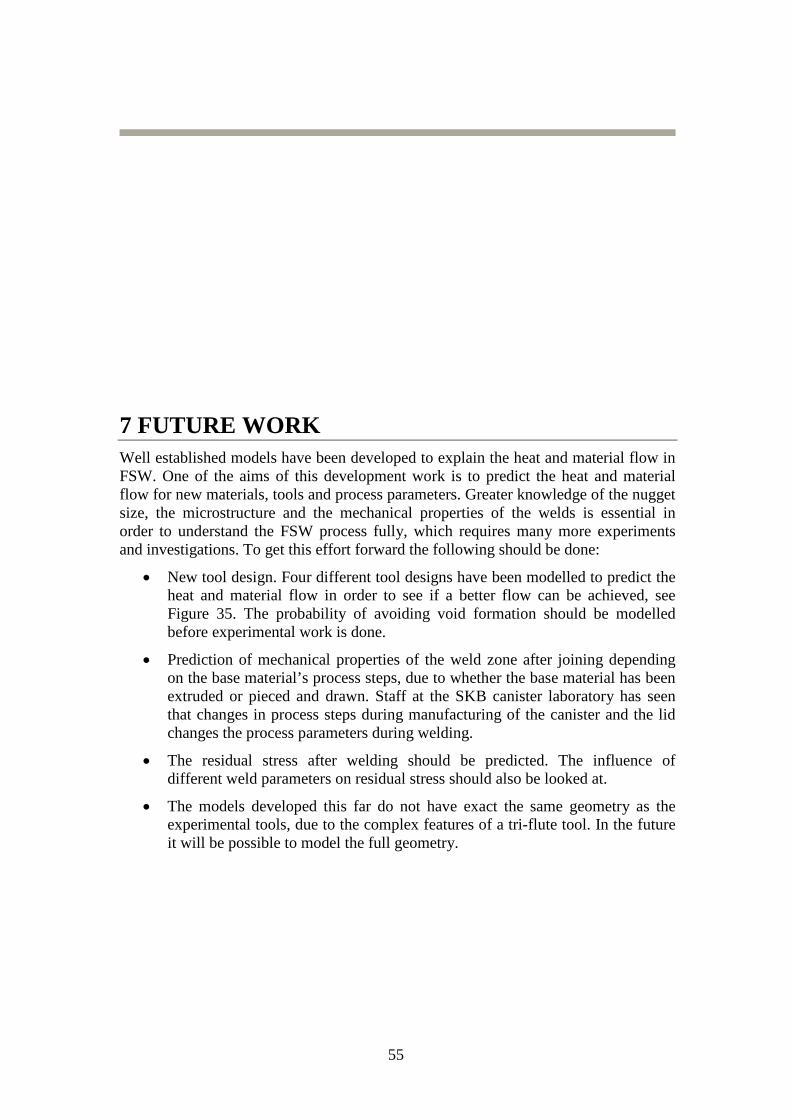
55
7 FUTURE WORK Well established models have been developed to explain the heat and material flow in FSW. One of the aims of this development work is to predict the heat and material flow for new materials, tools and process parameters. Greater knowledge of the nugget size, the microstructure and the mechanical properties of the welds is essential in order to understand the FSW process fully, which requires many more experiments and investigations. To get this effort forward the following should be done:
• New tool design. Four different tool designs have been modelled to predict the heat and material flow in order to see if a better flow can be achieved, see Figure 35. The probability of avoiding void formation should be modelled before experimental work is done.
• Prediction of mechanical properties of the weld zone after joining depending on the base material’s process steps, due to whether the base material has been extruded or pieced and drawn. Staff at the SKB canister laboratory has seen that changes in process steps during manufacturing of the canister and the lid changes the process parameters during welding.
• The residual stress after welding should be predicted. The influence of different weld parameters on residual stress should also be looked at.
• The models developed this far do not have exact the same geometry as the experimental tools, due to the complex features of a tri-flute tool. In the future it will be possible to model the full geometry.
56
Figure 35 Four different pin designs: a) Conical b) Triflute c) Triflat d) Eliptical
57
8 REFERENCES [1] www.posiva.fi, 2009-10-23.
[2] www.world-nclear.org, 2009-10-23.
[3] KBS 1 -Handeling of spent nuclear fuel and final storage of vitrified high level reprocessing waste, 1977.
[4] KBS 2 -Handeling and final storage of unreprocessed spent nuclear fuel, 1978.
[5] KBS 3 -Final storage of spent nuclear fuel, 1983.
[6] SKB, Long-Term, Safety for KBS-3 Repositories at Forsmark and Laxemar -A First Evaluation, Main Report of the SR-Can Project, SKB Technical report No. TR-06-09, Swedish Nuclear Fuel and Waste Management Co., Stockholm, 2006.
[7] C.-G. Andersson, P. Eriksson, M. Westman, SKB, lägesrapport kapseltillverkning, R-04-14, Svensk Kärnbränslehantering AB, 2004.
[8] R-06-04, Kapsel för använt kärnbränsle Svetsning för tillverkning och förslutning, Svensk Kärnbränslehantering AB, sep 2006.
[9] SKB, R-06-06, Kapsel för använt kärnbränsle oförstörande provning av svetsar, Svensk Kärnbränslehantering AB, 2006.
[10] PASS -Projekt Alternativ Studier för Slutförvar, Slutrapport (In Swedish), October, 1992.
[11] C.-G. Andersson, Development of fabrication technology for copper canisters with cast inserts, Swedish Nuclear Fuel and Waste management Co, SKB report TR-02-07, August 2001.
[12] C.-G Andersson, P. Eriksson, M. Westman, G. Emilsson, Status report, Canister fabrication, SKB TR-04-23, 2004.
[13] R. Sandström, Extrapolation of canister material properties, Nuclear Waste, State-of the art reports 2001, KASAM, Stockholm, 2001.
[14] www.skb.se, 2009-10-23.
[15] Översiktstudie 95, Lokalisering av djupförvar för använt kärnbränsle, 1995.
[16] C.-G. Andersson, R.E. Andrews, B.G.I. Dance, M.J. Russell, E.J. Olden, R.M. Sanderson, A Comparison of copper Canister Fabrication by the Electron Beam and Friction Stir Welding, Proceedings, 2nd International Symposium on FSW, Gothenburg, Sweden, June, 2000.
[17] L. Cederqvist, A weld that last for 100 000 years: FSW of Copper Canisters, Proceedings of the fourth International Conference on FSW, May 14-16, 2003, Park City, USA.
[18] D.G. Bennett, R. Gens, Overview of European concepts for high-level waste and spent fuel disposal with special reference waste container corrosion, Journal of Nuclear Materials, 379 (2008), 1-8.
58
[19] D. Tscharntke, C. Muller, U. Ronneteg, H. Rydén, Ultrasonic Investigations on Copper Canister Welds in preparation for the Storage of Spent Nuclear Fuel in a Deep Repository, ECNDT 2006-We.4.6.2.
[20] C. Muller, M. Pavlovic, K. Takahashi, U. Ewert, M. Rosenthal, G. Brekow, R. Böhm, U. Ronneteg, J. Pitkänen, POD Evaluation of NDE Techniques for Canister-Components for Risk Assessment of Nuclear Waste Encapsulation, 6th International Conference on NDE in Relation to structural Intregrity for Nuclear and Pressurized Components, October 2007, Budapest, Hungary.
[21] L. Cederqvist, FSW to seal 50 mm thick copper canisters –a weld that lasts for 100,000 years, Fifth International Friction Stir Welding Symposium, 14-16 September 2004, Metze, France.
[22] R.S. Mishra, Z.Y. Ma, Friction stir welding and processing, Materials Science and Engineering R, 50 (2005).
[23] H.-B. Shen, K. Yan, T. Lin, S.-B. Chen, C.-Y. Jiang, Y. Zhao, The investigation of typical welding defects for 5456 aluminium alloy friction stir welds, Materials Science and Engineering, A 433 (2006), 64-69.
[24] http://en.wikipedia.org/wiki/Friction_stir_welding, 2009-10-29.
[25] W.M. Thomas, E.D. Nicholas, S.D. Smith, Friction stir welding-Tool developments, TMS Annual Meeting and Exhibition, New Orleans, LA, USA, February 2001.
[26] V. Balasubramanian, Relationship between base metal properties and friction stir welding process parameters, Materials Science and Engineering, A480 (2008), 397-403.
[27] W.J. Arbegast, Friction Stir Welding and Processing, ASM International, Materials Park, OH, 2007, ISBN-13 978-0-87170-840-3, Chapter 13.
[28] W.J. Arbegast, A flow-partitioned deformation zone model for defect formation during friction stir welding, Scripta Materialia, 58 (2008), 372-376).
[29] R. Nandan, T. DebRoy, H.K.D.H. Bhadeshia, Recent advances in friction-stir welding process, weldment structure and properties, Progress in Material Science, 53 (2008), 980-1023.
[30] K.N. Krishnan, on the formation of onion rings in friction stir welds, Materials science and Engineering, A327 (2002), 246-251.
[31] G.M. Xie, Z.Y. Ma, L. Geng, Development of a fine grained microstructure and the properties of a nugget zone in friction stir welded pure copper, Scripta Materialia, 57 (2007), 73-76.
[32] H. Larsson, joining of dissimilar al-alloys by Friction Stir Welding, Second International symposium on Friction Stir Welds, Gothenburg, Sweden, 2002.
[33] P.L. Threadgill, Friction Stir Welding-A state of the art, TWI report-678/1999.
59
[34] M.A. Sutton, B. Yang, A.P. Reynolds, R. Taylor, Microstructural studies in friction stir welds in 2024-T3 aluminium, Material of Science and Engineering, A323 (2002), 160-165.
[35] M.B Silva, M. Skjoedt, P. Vilaca, N. Bay, P.A.F. Martins, Single point incremental forming of tailored blanks produced by friction stir welding, Journal of Materials Processing Thechnology, Volume 209, Issue 2, 19 Jan 2009, Pages 811-820.
[36] B. London, M. Mahoney, B. Bingel, R. Calabrese, D. Waldron, Experimental methods for determining material flow in friction stir welds, The third International symposium on Friction Stir Welding, Kobe, Japan, 27-28 September, 2001.
[37] A.P Reynolds, Flow visualization and simulation in FSW, Scripta Materialia, 58 (2008), 338-342.
[38] T.U. Seidel, A.P. Reynolds, Visualization of the Material Flow in AA2195 Friction-Stir Welds Using a Marker Insert Technique, Metallurgical and Materials Transactions A, Volume 32A, November 2001-2879.
[39] K. Colligan, Material Flow Behaviour during Friction Stir Welding of Aluminium, Welding Journal 78, July 1999, 229-237.
[40] M. Guerra, C Schmidt, J.C. Mc Clure, L.E. Murr, A.C. Nunes, Flow pattern during friction stir welding, Materials Characterization, 49 (2003), 95-101.
[41] T. Dickerson, H.R. Shercliff, H. Schmidt, A weld marker technique for flow visualization in friction stir welding, 4th International Symposium on Friction Stir Welding, Park City, Utah, USA, 14-16 May 2003.
[42] T. Källgren, L.-Z. Jin, R Sandström, Material Flow during Friction Stir Welding of Copper 7th international Friction Stir Welding symposium, Awaji island, Japan, 20-22 May 2008.
[43] R. Johanson, P. Threadgill, Friction Stir Welding of Magnesium alloys, Magnesium Technology 2003, TMS, 2003.
[44] J. Ouyang, E. Yarrapareddy, R. Kovacevic, Microstructural evolution in the friction stir welded 6061 aluminum alloy (T6-temper condition) to copper, Journal of Materials Processing Technology, 172 (2006), 110-122.
[45] A. Abdollah-Zadeh, T. Saeid, B. Sazgari, Microstructural and mechanical properties of friction stir welded aluminum/copper lap joints, Journal of alloys and Compounds, 460 (2008), 535-538.
[46] H.N.B. Schmidt, T.L. Dickerson, J.H. Hattel, Material flow in butt friction stir welds in AA2024-T3, Acta Materialia, 52 (2006), 1199-1209.
[47] B.C. Liechty, B.W. Webb, The use of plasticine as an analog to explore material flow in friction stir welding, Journal of Materials Processing Technology, 184 (2007), 240-250.
[48] M. Eriksson, R. Sandström, Influence of the weld speed on the fatigue on friction stir welds, and comparison with MIG and TIG, International Journal of Fatigue, Volume 25, Issue 12, Dec 2003, 1379-1387.
60
[49] C.-G. Andersson, R.E. Andrews, Proceedings of the first International Symposium on Friction Stir Welding , Thousand Oaks, CA, USA, June, 1999.
[50] W.-B. Lee, S.-B. Jung, The joint properties of copper by friction stir welding, Materials Letters, 58 (2004), 1041-1046.
[51] K. Savolainen, Friction stir weldability of copper alloys, Helsinki University of Technology, ISBN 951-22-7092-7, 2004.
[52] T. Sakthivel, J. Mukhopadhyay, Microstructure and mechanical properties of friction stir welded copper, Journal of Material Science, 8126-8129, June 2007.
[53] H.S. Park, T.K. Kimura, T. Murakami, Y. Nagano, K. Nakata, M. Ushio, Microstructure and mechanical properties of friction stir welds 60%Cu-40Zn copper alloy, Materials Science and Engineering, A371 (2004), 160-169.
[54] C. Meran, The joint properties of brass plates by friction stir welding, Materials Design, 27 (2006), 719-726.
[55] A. Abdollah-Zadeh, T. Saeid, B. Sazgari, Microstructural and mechanical properties of friction stir welded aluminium/copper lap joints, Journal of Alloy and Compounds, 460 (2008), 535-538.
[56] R. Sandström, J. Hallgren, G. Burman, Stress strain flow curves for Cu-OFP, SKB report R-09-14, 2009.
[57] V.G. Garcia Fernández, Constitutive relations to model hot flow of commercial purity copper, PhD thesis, Barcelona Technical Univ., 2004
[58] A.H. Chokshi, M.A. Meyers, The prospects for superplasticity at high strain rates: preliminary considerations and an example, Scripta Metallurgica et Materialia, 24, 605-610, 1990.
[59] Ø. Grong, Metallurgical Modelling of Welding, The Institute of Materials, London, UK, Book No. 557, ISBN 0-901716-37-5, 1994.
[60] M.J. Russell, H.R. Shercliff, 1st International Symposium on Friction Stir Welding, held at the Rockwell Science Center, Thousand Oaks, California, 14-16 June 1999.
[61] J.C. McClure, W. Tang, L.E. Murr, X. Guo, Z. Feng, J.E. Gould, A Thermal Model of Friction Stir Welding, Trends in Welding Research, Proceedings of the 5th International Conference, Pine Mountain, GA, United States, June 1-5, 1998.
[62] Y. J. Chao, X. Qi, Heat Transfer and Thermo-Mechanical Analysis of Friction Stir Joining of AA6061- T6 Plates, 1st International Symposium on Friction Stir Welding, Thousand Oaks, California, 14-16 June, 1999.
[63] S. Xu, X. Deng, A.P. Reynolds, T.U. Seidel, Finite element simulation of material flow in friction stir welding, Science and Technology of Weld and joining, 6 nr 3, 191-193, 2001.
[64] Y. J. Chao, X. Qi, W. Tang, Heat transfer in friction stir welding- experimental and numerical studies, 5 th International Friction Stir Welding Symposium, Metz, France, 14-16 September, 2004.
61
[65] Y. J. Chao, X. Qi, Thermal and thermo-mechanical modeling of friction stir welding of aluminum alloy 6061-T6, Journal of Materials Processing and Manufacturing Science, v 7, n 2, p 215-233, Oct, 1998.
[66] J. Xu, S.P. Vaze, R.J. Ritter, K.J. Colligan, J.R. Pickens, Experimental and numerical study of thermal process in friction stir welding, Joining of Advanced and Specialty Materials VI - Proceedings from Materials Solutions 2003 on Joining of Advanced and Specialty Materials, Pittsburgh, PA, United States, Oct, 2003.
[67] X. K. Zhu, Y.J. Chao, Numerical simulation of transient temperature and residual stresses in friction stir welding of 304L stainless steel, Journal of Materials Processing Technology, v 146, n 2, p 263-272, Feb, 2004.
[68] Ø. Frigaard, Ø. Grong, O. T. Midling, A process model for friction stir welding of age hardening aluminium alloys, Metallurgical and Materials Transactions A, Volume 32, 2001.
[69] C. Chen, R. Kovacevic, Thermomechanical modeling and force analysis of friction stir welding by the finite element method, Proceedings of the Institution of Mechanical Engineers, Part C: Journal of Mechanical Engineering Science, v 218, n 5, p 509-520, May, 2004.
[70] D. Lawrjaniec, A. Abisror, C. Decker, M. Kocak, J. Dos Santos, Numerical simulation of friction stir welding, Materials Science Forum, v 426-432, n 4, p 2993-2998, 2003.
[71] M. Song, R. Kovacevic, Heat transfer modeling for both workpiece and tool in the friction stir welding process: A coupled model, Proceedings of the Institution of Mechanical Engineers, Part B: Journal of Engineering Manufacture, v 218, n 1, p 17-33, 2004.
[72] Z. Khandkar, J.A. Khan, P.A. Reynolds, A thermal model of the friction stir welding process, American Society of Mechanical Engineers, Heat Transfer Division, v 372, n 5, p 115-124, 2002.
[73] L. Fourment, S. Guerdoux, M. Miles, T. Nelson, Numerical Simulation of friction stir welding process using both Lagrangian and Arbitrary Lagrangian Eulerian Formulations, 5 th International Friction Stir Welding Symposium, Metz, France, 14-16 September, 2004.
[74] H. Schmidt, J. Hattel, Modelling thermomechanical conditions at the tool/matrix interface in friction stir welding, 5 th International Friction Stir Welding Symposium, Metz, France, 14-16 September, 2004.
[75] Ch. Desrayaud, P. Heurtier, D. Alléhaux, F. Montheillet, Thermomechanical and microstructural modelling of the friction stir welding processs, 5 th International Friction Stir Welding Symposium, Metz, France, 14-16 September, 2004.
[76] H.N. Schmidt, J. Hattel, J.R. Wert, Modeling of the Contact Condition of the Tool/Matrix Interface In Friction Stir Welding, 7th International Seminar on Numerical Analysis of Weldability, Mathematical Modeling of Weld Phenomena, 7, 2003.
62
[77] H.N. Schmidt, J. Hattel, J. Wert, An analythical model for the heat generation in friction stir welding, Modelling and Simulation in Materials science and engineering, 12 (2004), 143-157.
[78] M.Z.H. Khandkar, J. A. Khan, A. P. Reynolds, M.A. Sutton, Predictions of temperature distribution on thermal history during friction stir welding: input torque based model, Science and Technology of Welding and Joining, 8 (3) (2003), 165-174.
[79] C. Hamilton, S. Dymek, A. Sommers, A thermal model of friction stir welding in aluminium alloys, International Journal of Machine Tools & Manufacture, 48 (2008), 1120-1130.
[80] M.Z.H. Khandkar, J.A. Khan, A.P. Reynolds, M.A.Sutton, Predicting residual thermal stresses in friction stir welded metals, Journal of Materials Processing Technology, 174 (2006), 195-203.
[81] H.R. Shercliff, P.A. Colegrove, modelling of Friction Stir Welding, Mathemetical Modelling of Weld Phenomena 6, 2002.
[82] P.A. Colegrove, Modelling the friction stir welding of aerospace alloys, 5 th International Friction Stir Welding Symposium, Metz, France, 14-16 September, 2004.
[83] C. Westman, TWI project, 3/3 1998.
[84] A.P. Reynolds, Z. Khandkar, T. Long, J. Khan, Utility of relatively simple models for understanding process parameter effects on FSW, Source: Materials Science Forum, v 426-432, n 4, p 2959-2964, 2003.
[85] P. Ulysse, Three-dimensional modeling of the friction stir-welding process, International Journal of Machine Tools and Manufacture, v 42, n 14, p 1549-1557, November, 2002.
[86] R. Nandan, G.G. Roy, T.J. Lienert, T. Debroy, Three-dimensional heat and material flow during friction stir welding of mild steel, Acta Materialia, 55 (2007), 883-895.
[87] L.-Z. Jin, R. Sandström, Steady non-Newtonian flows in copper and iron aluminide at elevated temperatures, Journal of Materials Processing Technology, 189 (2007), 428-434.
[88] M. Kameyama, Comparison between thermal-viscous coupling and frictional sliding, Tectonophysics, 376 (2003), 185-197.