Embed Size (px)
Citation preview

Investigation and Evaluation of Water
Permeation through BaCe0.8Y0.2O3-δ
Electrolyte for Solid Oxide Fuel Cells
Selgin AL
A thesis submitted for the degree of Doctor of Philosophy (PhD) in Chemical
Engineering at Newcastle University
School of Chemical Engineering and Advanced Materials
February 2016

i
Abstract
The commercial development of solid oxide fuel cells (SOFCs) is limited due to problems
such as carbon deposition at the anode, temperature gradients in the cell and dilution of fuel at
the anode. The purpose of this study is to investigate the feasibility of utilising a water
permeable membrane in an SOFC with simultaneous water permeation. The idea is to
transport water from cathode to anode for reforming of hydrocarbon fuels at the anode which
could help overcome the above mentioned limitations.
A mathematical model is developed for hydration of BaCe0.8Y0.2O3-δ (BCY20) and
BaCe0.9Y0.1O3-δ (BCY10) using the Nernst–Planck equation. This is used to calculate
diffusion coefficients of protonic defects and oxygen vacancies (responsible for water
permeation). The diffusion coefficients of protonic defects are found to be greater than
oxygen vacancies within the membranes, which are in agreement with literature. The
concentration of protonic defects increases rapidly at the hydration surface of the membrane
following the introduction of water into the reaction chamber. This suggests that the presence
of water initiates a rapid formation of protonic defects.
The water permeation for unmodified and catalytically modified BCY20 surfaces with
platinum is measured between 500–800 °C. The feasibility of coupled water permeation with
the water gas shift reaction (WGSR) is done at 700 °C. Data suggests that there is an increase
in water permeation when the feed side surface is catalytically modified compared with
unmodified surface. This implies that platinum catalyses water permeation by increasing the
oxygen/hydrogen exchange rate on the feed side surface. However, the water permeation
decreases when platinum is applied on the permeate side surface, indicating that platinum
plays a blocking role in water recombination. When 1% carbon monoxide is supplied to the
permeate side during the coupled water permeation with the WGSR study, a 1.5 fold increase
in the water permeation is observed. The post operation x−ray diffraction analysis of
membranes revealed that BCY20 decomposed to cerium oxide and barium carbonate.
The study also explored the simultaneous water and oxygen transport through BCY20.
Results demonstrated that water transport is independent of externally applied potential.
Additionally, there is no dramatic change observed in oxygen transport due to presence of
water in air at the cathode. Fuel cells fuelled with carbon monoxide or methane displayed low
power densities compared to conventional SOFCs due to insufficient water permeation and
low catalytic activity of anode towards reforming reactions as well as carbon deposition.

ii
Acknowledgements
I would first of all like to acknowledge the Ministry of National Education of Turkey, my
sponsor, for financial support.
I would like to thank my supervisors, Prof Ian Metcalfe and Dr Evangelos Papaioannou, for
their supervision and advice throughout my study. I would also like to thank Dr Danai Poulidi
for her guidance and help in the laboratory in the early stage of the study.
My sincere appreciation is extended to Dr Guangru Zhang and Dr Feng Song for their useful
advice, support and help. I would like to acknowledge Dr Feng Song for his help with the
model and software. Next, I would like to thank technical and administrative stuff of the
Newcastle University.
Special thanks and appreciation go to my family. I am grateful for their support and patience.
I would further like to thank Dr Deniz Sarica, Prasna Ray, Sotiria Tsochataridou and Dr Claire
Thompson for being such great friends.

iii
Table of Contents
Abstract ........................................................................................................................................ i
Acknowledgements .................................................................................................................... ii
Table of Contents ....................................................................................................................... iii
List of Figures ........................................................................................................................... vii
List of Tables ........................................................................................................................... xiv
Nomenclature............................................................................................................................ xv
Chapter 1 Introduction ................................................................................................................ 1
1.1 Overview .......................................................................................................................... 1
1.2 Project Rationale .............................................................................................................. 4
1.3 Thesis Organisation.......................................................................................................... 7
Chapter 2 Literature Survey ....................................................................................................... 8
2.1 Introduction to Fuel Cells ................................................................................................ 8
2.2 Solid Oxide Fuel Cells ................................................................................................... 11
2.2.1 Benefits and Drawbacks ........................................................................................... 13
2.3 Thermodynamics and Electrochemistry of SOFCs ........................................................ 14
2.3.1 Nernst Potential ........................................................................................................ 14
2.3.2 Fuel Cell Efficiency ................................................................................................. 16
2.3.3 Irreversible Voltage Losses ...................................................................................... 16
2.4 Electrolyte Materials for SOFCs .................................................................................... 19
2.4.1 Oxide Ion Conductors .............................................................................................. 19
2.4.2 Proton Conductors .................................................................................................... 22
2.4.3 Y-Doped Barium Cerate (BCY) ............................................................................... 26
2.5 Water Permeation Mechanism in BCY Membrane ........................................................ 31
2.5.1 Mechanism of Water Transport ................................................................................ 31

iv
2.5.2 Reported Literature Values ....................................................................................... 34
2.5.3 Modelling ................................................................................................................. 37
2.6 Summary ........................................................................................................................ 39
Chapter 3 Methodology ............................................................................................................ 40
3. 1 Experimental ................................................................................................................. 40
3.1.1 Membrane Preparation ............................................................................................. 40
3.1.2 Experimental Set up ................................................................................................. 41
3.1.2.1 Membrane Reactor ....................................................................................... 41
3.1.2.2 Experimental Rigs ........................................................................................ 42
3.1.3 Catalytic Membrane Surface Modification for Water Permeation and Water Gas
Shift Reaction Experiments ............................................................................................... 44
3.1.4 List of Experiments .................................................................................................. 45
3.1.5 The Analysis System ................................................................................................ 53
3.2 Analytical Techniques .................................................................................................... 54
3.2.1 X–Ray Diffraction (XRD) ........................................................................................ 55
3.2.2 Scanning Electron Microscopy (SEM) .................................................................... 57
3.2.3 Energy Dispersive X–Ray Spectroscopy (EDXS) ................................................... 57
3.3 High Temperature Membrane Sealants .......................................................................... 58
Chapter 4 Modelling Hydration of BCY Membranes .............................................................. 62
4.1 Introduction .................................................................................................................... 62
4.2 Development of Model .................................................................................................. 63
4.2.1 Physical model ......................................................................................................... 63
4.2.2 The Nernst–Planck Equation .................................................................................... 64
4.2.3 Mathematical Model ................................................................................................ 67
4.3 Model Boundary Condition ........................................................................................... 71
4.4 Model Results and Discussion ....................................................................................... 75
4.4.1 Electrical Potential of Membranes ........................................................................... 75
4.4.2 The Diffusion Coefficients of Defects ..................................................................... 82

v
4.4.3 The Concentration Distributions of Defects within the Membranes ........................ 85
4.5 Summary ........................................................................................................................ 87
Chapter 5 Water Permeation and Water Gas Shift Reaction through BCY20 Membrane
Modified with Platinum ............................................................................................................ 89
5.1 Introduction .................................................................................................................... 89
5.2 Characterisation of BCY20 Membrane and Platinum Layer ......................................... 91
5.2.1 X–Ray Diffraction (XRD) ........................................................................................ 91
5.2.2 Scanning Electron Microscopy (SEM) .................................................................... 92
5.2.3 Energy Dispersive X–Ray Spectroscopy (EDXS) ................................................... 94
5.3 Water Permeation through BCY20 Membrane Modified with Platinum ...................... 96
5.4 Membrane Based Water Gas Shift Reaction Coupled with Water Permeation through
BCY20 Membrane Modified with Platinum ..................................................................... 103
5.5 Post Operation Analysis ............................................................................................... 112
5.6 Summary and Conclusions .......................................................................................... 116
Chapter 6 Investigation of Simultaneous Water and Oxygen Transport through BCY20
Membrane for IT-SOFCs ........................................................................................................ 118
6.1 Introduction .................................................................................................................. 118
6.2 Water Permeation under Polarisation ........................................................................... 122
6.3 Water Permeation under Polarisation and Air as a Carrier .......................................... 127
6.3.1 Water and Oxygen Permeation under Polarisation ................................................. 127
6.3.2 Current –Voltage Curve .......................................................................................... 130
6.4 Fuel Cell Operations using Various Fuels with Simultaneous Water Permeation ....... 132
6.5 Summary ...................................................................................................................... 136
Chapter 7 Conclusions and Suggested Future Work .............................................................. 137
7.1 Overall Conclusions ..................................................................................................... 137
7.2 Suggested Future Work ................................................................................................ 140
References .......................................................................................................................... 142
Appendix A ........................................................................................................................ 154

vi
Appendix B ........................................................................................................................ 158
Appendix C ........................................................................................................................ 162
Appendix D ........................................................................................................................ 163
Appendix E ........................................................................................................................ 164
Appendix F ........................................................................................................................ 165
Appendix G ........................................................................................................................ 166
Appendix H ........................................................................................................................ 167
Appendix I ......................................................................................................................... 169
Appendix J ......................................................................................................................... 170
Appendix K ........................................................................................................................ 172

vii
List of Figures
Figure 1.1: A schematic representation of a working solid oxide fuel cell with simultaneous
water permeation, 𝑉𝑜 •• represents an oxygen vacancy at an oxygen site, 𝑂𝑜𝑥 represents a
lattice oxygen and 𝑂𝐻𝑜 • represents a proton at an oxygen site (protonic defect). The
transport of water takes place via protons that hop between hydroxide sites and counter
diffusion of oxygen vacancies throughout the membrane from the cathode to the anode. The
electrons are transported via the external circuit. The steam reforming reaction takes place at
the anode to produce hydrogen and carbon monoxide. Carbon monoxide further undergoes
water gas shift reaction to produce hydrogen and carbon dioxide. The heat is transferred to the
anode for endothermic reforming reactions................................................................................ 6
Figure 2.1: Schematic of a fuel cell consists of a porous anode and cathode and a dense
electrolyte between them. Reactant gases are fed to anode and cathode inlets, product gases
leave from anode and cathode outlets; directions of ions through electrolyte are shown.
Electrons flow through an external circuit. [35]. ........................................................................ 9
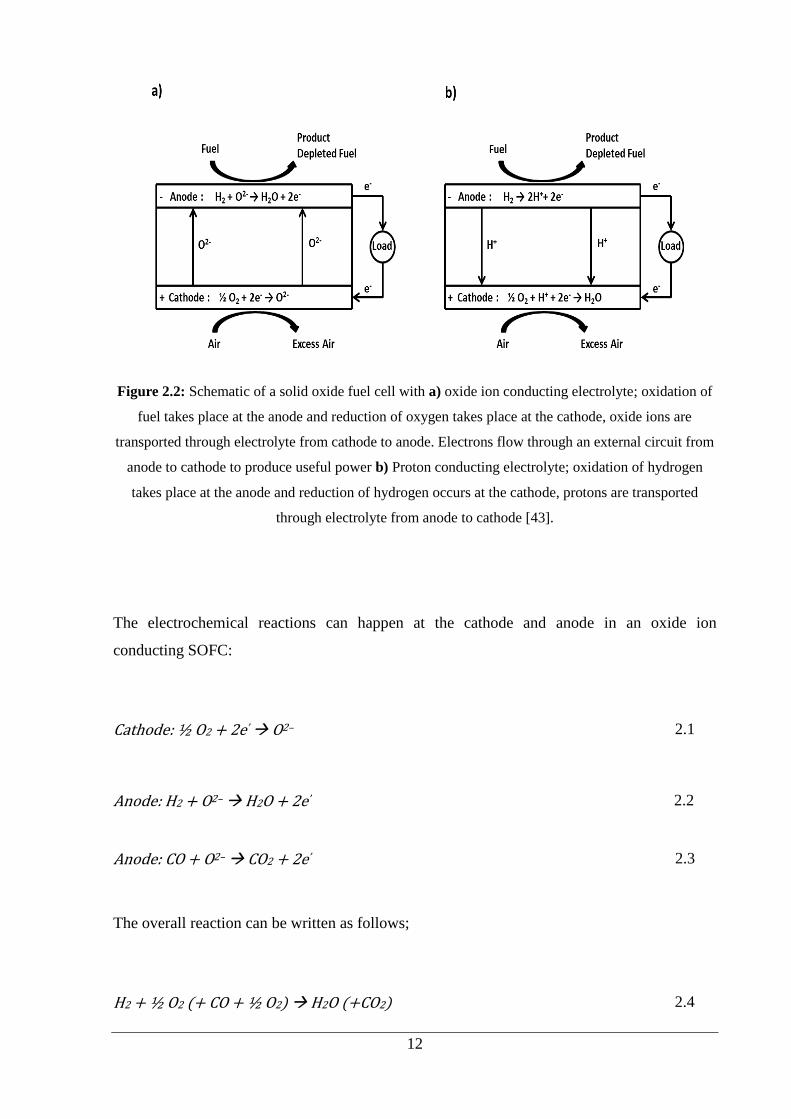
Figure 2.2: Schematic of a solid oxide fuel cell with a) oxide ion conducting electrolyte;
oxidation of fuel takes place at the anode and reduction of oxygen takes place at the cathode,
oxide ions are transported through electrolyte from cathode to anode. Electrons flow through
an external circuit from anode to cathode to produce useful power b) Proton conducting
electrolyte; oxidation of hydrogen takes place at the anode and reduction of hydrogen occurs
at the cathode, protons are transported through electrolyte from anode to cathode [43]. ........ 12
Figure 2.3: The theoretical and actual fuel cell voltages. The activation polarisation voltage
losses dominate at low current density region due to slow kinetics of electrode reactions. The
ohmic polarisation becomes dominant at the intermediate current density region mainly due to
electrolyte resistance to ions. At high current density region, concentration polarisation is
present due to mass transport reduction to electrodes [35] ...................................................... 17
Figure 2.4: Fluorite structure of stabilized zirconia (large sphere; Zr/Ce, small; O) [49]. ...... 20
Figure 2.5: Temperature dependence of oxide ion conductivity for major SOFC electrolytes.
The horizontal dotted line displays the limit of conductivity to build devices with an
electrolyte thickness of 15 micron or less. CGO; Ce1-xGdxO2-x/2 , LAMOX; La2Mo2O9 ,
LSGM; La0.8Sr0.2Ga0.8Mg0.2O2.8 , YSZ; yttria-stabilized zirconia [3]....................................... 21
Figure 2.6: Ideal crystal structure of perovskite oxide ABO3 [53]. ......................................... 22

viii
Figure 2.7: The conductivities of major proton conducting perovskites in hydrogen versus
temperature [12]. ...................................................................................................................... 27
Figure 2.8: Schematic representation of water transport mechanism within BCY membrane.
H2O reacts with one 𝑉𝑜 •• and one 𝑂𝑜𝑥 at the high 𝑃𝐻2𝑂 surface and forms two hydroxyl
groups (𝑂𝐻𝑜 •). Then the protons as an interstitial defects hop between hydroxyl groups
towards low 𝑃𝐻2𝑂 surface as 𝑉𝑜 •• diffuses at the opposite direction. At the low
𝑃𝐻2𝑂 surface, H2O is released and 𝑉o •• and 𝑂𝑜𝑥 are formed. No electronic charge carrier is
involved. ................................................................................................................................... 31
Figure 3.1: Schematic of the dual chamber membrane reactor a) Membrane based
permeation/reaction experiments; a two–chamber reactor design with two gas compartments,
i.e. feed side (water introduced) and permeate side (water permeated) was used. The
membranes were bonded to an alumina tube. The gas tightness of the membranes was ensured
by using the prepared ceramic sealants around the alumina tube and the membrane. This
alumina tube was then placed in a quartz tube. b) Reactor design for fuel cell/polarisation
experiments; platinum was painted on both sides of the sintered membrane covering an area
of 0.5 cm2 as cathode and anode and platinum was also painted as a reference electrode with
an area of 0.05 cm2. Gold mesh connecting with a gold wire was attached to each side of the
membrane as a current collector. .............................................................................................. 42
Figure 3.2: Detailed schematics of the experimental rigs compose of gas supplies, feed
control, water saturator, furnace, membrane reactor, gas analysis and PC control for a)
Permeation/reaction experiments, b) Fuel cell/ polarisation experiments. .............................. 44
Figure 3.3: Catalytically modified and unmodified membrane systems for water permeation
and water gas shift reaction experiments a) without any platinum, b) platinum is applied on
both sides, c) platinum is applied only on the permeate side, d) platinum is applied only on
the feed side (Platinum surfaces are sintered at 980 °C for 10 min) The compositions of feed
gases to both sides of the membrane and associated permeation and reactions are also shown.
.................................................................................................................................................. 45
Figure 3.4: Schematic representation of the BCY membrane to measure electrical potential
difference during hydration and dehydration of the membrane at 700 °C in a single chamber
reactor. One side of the membrane surface is sealed by using both a hydrophobic dense
membrane and a ceramic sealant to isolate this surface from the surrounding atmosphere. A
thin platinum layer is applied on the exposed surface. The electrical connections are ensured
by using gold wires. The flow rates of feed gases are 200 ml/min. The reactor chamber is fed
with dry helium for 24 hrs to minimise water concentration in the solid oxide before the

ix
measurement, then the gas is switched to 1% H2O in nitrogen. The reactor is fed with 1% H2O
in nitrogen during hydration process and fed with dry helium during dehydration process. ... 46
Figure 3.5: Cell configurations for dc measurements. a) Helium is fed to anode and 3% H2O
in argon is fed to cathode to investigate the effect of polarisation on water permeation. b)
Helium is fed to anode and air is fed to cathode to determine oxygen evolution at the anode
under polarisation. c) 3% H2O and air are fed to cathode together to investigate effect of one
to other and to carry out comparison with a & b. d) Finally, various fuels (hydrogen, carbon
monoxide, methane) are individually fed to anode for fuel cell measurements. ...................... 52
Figure 3.6: Bragg diffraction [97] ........................................................................................... 56
Figure 3.7: Configuration of sealant application to membrane module which is applied for the
seals 9-13. a) Silver paste is applied around the outer diameter of the alumina tube. Then it is
kept for 24 hrs at the room temperature to dry. b) The prepared ceramic paste is applied
around the membrane as shown. Then membrane module is placed into the reactor after 3 hrs
drying at the room temperature. The temperature is taken to the 900 °C at a ramp rate of 1
°C/min. It is kept at this temperature for 30 min and then the temperature is cooled down to
700 °C at a ramp rate of 1 °C/min. ........................................................................................... 60
Figure 4.1: Schematic of hydration of the BCY membrane. The first process involves
transport of water in the gas phase, the second process is water diffusion in the gas boundary
layer, in the third process defect formation reaction takes place (water reacts with oxygen
vacancy and lattice oxygen to form protonic defects) and the fourth process displays diffusion
of defects within the membrane. The surface is coated with a thin platinum layer. The other
surface of the membrane is sealed to isolate this surface from the surrounding atmosphere... 64
Figure 4.2: Illustration of a finite volume within BCY membrane that represents
discretisation of membrane for fluxes of species. 𝐽𝑥 − ∆𝑥 and 𝐽𝑥 + ∆𝑥 represent neighboring
volumes. .................................................................................................................................... 72
Figure 4.3: The electrical potential change of BCY membranes upon hydration and
dehydration measured under open circuit conditions at 700 °C. a) Al2O3 (no signal is
observed, only background signal is seen), b) BCY20, c) BCY10. (The membrane reactor is
fed with dry helium for 24 hrs before the experiments, and then 1% H2O in nitrogen is
introduced to the reactor chamber which corresponds to first peaks in the graphs. The second
peak appears when 1% H2O in nitrogen is switched back to dry helium. The flow rates of
gases are 200 ml/min) ............................................................................................................... 76
Figure 4.4: The comparison of experimental and modelled electrical potentials upon
hydration. Lines = modelled results, stars= experimental results. a) BCY20, b) BCY10 ....... 79

x
Figure 4.5: The electrical potential difference profiles upon hydration for different periods
within the membranes. (X=0 represents “exposed side of the membrane”, x=L mm represents,
“isolated side of the membrane”, L=membrane thickness.) a) BCY20. b) BCY10. The profiles
are obtained as a function of time by solving Equations 4.21 and 4.23 which relate the
concentration distribution of species to the electric potential. ................................................. 81
Figure 4.6: The comparison of diffusion coefficients of protonic defects and oxygen
vacancies with the literature. All the literature data presents diffusion coefficients for
BaCe0.9Y0.1O3- δ (BCY10), the diffusion coefficients determined in this study are for both
BaCe0.8Y0.2O3- δ (BCY20) and BCY10. .................................................................................... 83
Figure 4.7: Concentration distributions of protonic defects and oxygen vacancies within the
BCY membranes for different periods upon hydration, a) BCY10 and b) BCY20, respectively.
The schematic on the right represent the distribution of defects within the membranes to aid
visualisation of graphs. The lines on the edges represent the concentration changes of defects.
(•) represents protons, (◌) represents oxygen vacancy, and (●) represents lattice oxygen. Water
( ) incorporates into the membrane from the exposed surface, then protons diffuse towards
to isolated surface and the oxygen vacancies diffuse towards to exposed surface. .................. 87
Figure 5.1: Schematic diagram of membrane based water permeation coupled with water–gas
shift reaction. Water permeates from feed side to permeate side and reacts with carbon
monoxide to generate hydrogen and carbon dioxide. ............................................................... 90
Figure 5.2: XRD patterns of BCY20 pellets in comparison with the reference data. ............. 91
Figure 5.3: a) The surface of fresh BCY20 membrane (after sintering at 1450 °C for 12 hrs),
b) cross section SEM image of BCY20. c) The surface image of platinum layer (after
sintering at 980 °C for 10 min) and d) cross section of SEM image of the porous platinum
layer. Platinum layer thickness is about 5 µm. ......................................................................... 94
Figure 5.4: The EDXS scan of BCY20 pellet surface ............................................................. 95
Figure 5.5: Molar fluxes of water permeated across the BCY20 membrane for four different
membrane configurations (platinum is only on the feed side, platinum on both sides, without
any platinum and platinum is only on the permeate side) at the temperature range from 500 °C
to 800 °C. (Feed side inlet gas concentration: 3% H2O in nitrogen; permeate side inlet gas
concentration: dry helium, flow rates of gases are 100 ml/min). Platinum surfaces are sintered
at 980 °C for 10 min, is ~5 µm thick and ~61% porous. .......................................................... 97
Figure 5.6: Arrhenius representation of water permeation for catalytically modified
membrane surfaces. Water concentration is 3% in nitrogen on the feed side, helium is used on
the permeate side. ................................................................................................................... 100

xi
Figure 5.7: a) SEM image of dense platinum layer before the experiment. b) SEM image of
platinum layer after the experiment. c) A photo of platinum layer after the experiment taken
with the Dino-lite digital microscopy. .................................................................................... 103
Figure 5.8: Permeate side outlet gas compositions for bare BCY20 membrane configuration
at 700 °C (mass 28, oxygen, hydrogen and carbon dioxide). The flow rates of gases are 100
ml (STP)/min. During step one: permeate side inlet: He; feed side inlet: Ar. During step two:
permeate side inlet: He; feed side inlet: 3% H2O in Ar. During step three: permeate side inlet:
1% CO in He; feed side inlet: 3% H2O in Ar. a) mass spectrometer data b) hygrometer data
(water) ..................................................................................................................................... 106
Figure 5.9: Permeate side outlet gas compositions for feed side_Pt|BCY|Pt_permeate side
membrane configuration at 700 °C (mass 28, oxygen, hydrogen and carbon dioxide), The
flow rates of gases are 100 ml (STP)/min. During step one: permeate side inlet: He; feed side
inlet: Ar. During step two: permeate side inlet: He; feed side inlet: 3% H2O in Ar. During step
three: permeate side inlet: 1% CO in He; feed side inlet: 3% H2O in Ar. a) mass spectrometer
data b) hygrometer data (water) ............................................................................................. 109
Figure 5.10: Permeate side outlet gas compositions for feed side_BCY|Pt_feed side
membrane configuration at 700 °C (mass 28, oxygen, hydrogen and carbon dioxide), The
flow rates of gases are 100 ml (STP)/min. During step one: permeate side inlet: He; feed side
inlet: Ar. During step two: permeate side inlet: He; feed side inlet: 3% H2O in Ar. During step
three: permeate side inlet: 1% CO in He; feed side inlet: 3% H2O in Ar. a) mass spectrometer
data b) hygrometer data (water). ............................................................................................ 110
Figure 5.11: Permeate side outlet gas compositions for feed side_Pt|BCY_permeate side
membrane configuration at 700 °C (mass 28, oxygen, hydrogen and carbon dioxide), The
flow rates of gases are 100 ml (STP)/min. During step one: permeate side inlet: He; feed side
inlet: Ar. During step two: permeate side inlet: He; feed side inlet: 3% H2O in Ar. During step
three: permeate side inlet: 1% CO in He; feed side inlet: 3% H2O in Ar. a) mass spectrometer
data b) hygrometer data (water) ............................................................................................. 111
Figure 5.12: XRD patterns of the fresh and used BCY20 membranes. a) Fresh BCY20
membrane, b) Feed side of the bare BCY20 membrane after the experiment, c) Permeate side
of the bare BCY20 membrane after the experiment, d) Permeate side of the “feed_
Pt|BCY20_permeate” membrane after the experiment. The perovskite structure is indicated by
+, the peaks indicative of BaCO3, CeO2 and Y2O3 are indicated by ▼,● and o, respectively.
................................................................................................................................................ 113

xii
Figure 5.13: Post operation SEM images of the external surfaces of feed sides (a&b) and
permeate sides (c &d). Feed side: a) bare surface b) platinum surface, Permeate side: c) bare
surface d) platinum surface. ................................................................................................... 115
Figure 6.1: Schematic representation of co-transport of oxygen and water from cathode side
to anode side. The transport of oxygen involves reduction of oxygen at the cathode (Equation
a), then incorporation into electrolyte and bulk diffusion via oxygen vacancies (𝑉𝑜 •• ) within
the electrolyte (Equation b). The reverse reaction (Equation c) takes place at the anode.
Electron transfer occurs via the external circuit. The transport of water from cathode to anode
takes place via the reaction of water with oxygen vacancy and lattice oxygen at the surface
(Equation d). Then diffusion within the electrolyte occurs as interstitial defects (𝐻𝑖 •) that
jumps between OH groups (Equation e) and finally water desorption happens (Equation f) at
the anode. The electronic charge carrier does not involve in water transport. All the reactions
are shown in Kröger –Vink notation....................................................................................... 120
Figure 6.2: a) The water concentration is presented versus the applied potential. The potential
is applied between working (cathode) and reference electrode (anode side). The insert graph
shows the raw data that is obtained using the hygrometer at the anode outlet which exhibits
the change in water concentration at the anode side versus time. Argon is used as a carrier gas
at the cathode side. (water concentration is observed for 3600 s under non–polarised
conditions, then the potential is applied between 0 V and -1 V with -100 mV steps and the
acquisition time is 200 s per set voltage, `a` corresponds to 0 mV and `k` corresponds to -1 V,
between a and k corresponds -100 mV step) b) The current is presented versus the applied
potential c) The oxygen concentration is observed at the anode outlet using the mass
spectrometer. All measurements are done at 700 °C. ............................................................. 123
Figure 6.3: Schematic illustration of water transport within the electrolyte under polarisation.
The transport of water occurs via oxygen vacancies within the electrolyte regardless of
applied potential in water containing environment. ............................................................... 124
Figure 6.4: a) The water concentration is presented versus the applied potential at the anode
outlet after polarisation is applied at 3600 s. Water concentration change versus time is also
shown. Air is used as carrier gas at the cathode side. (water concentration is observed for 3600
s under non-polarised conditions, and then the polarisation is applied between 0 V and -1 V
with 100 mV steps and the acquisition time is 200 s per set voltage, ‘a’ corresponds to 0 mV,
‘k’ corresponds to -1 V with -100 mV step between them) b) Oxygen evolution is monitored
at the anode outlet by the mass spectrometer in the presence of only air and 3% H2O in air is
present at the cathode and the anode gas is helium. ............................................................... 128

xiii
Figure 6.5: The current is presented versus overpotential. Measurements are done for two
cases; only air is present at the cathode and 3% H2O in air is present at the cathode. Helium is
fed to anode. ........................................................................................................................... 131
Figure 6.6: I–V curves at 700 °C and dependence of overpotentials on current density a)
Anode: 5% H2, Cathode: Air, b) Anode: 5% H2, Cathode: 3% H2O in air............................. 133
Figure 6.7: I–V–P curves at 700 °C for different anode and cathode gas compositions, (▄)
Anode: 5% CO, Cathode: Air, (●) Anode: 5% CO, Cathode: 3% H2O in air, (▲) Anode: 5%
CH4, Cathode: Air, (▼) Anode: 5% CH4, Cathode: 3% H2O in air ....................................... 135
Figure A.1: Three electrode set up in a single chamber reactor for impedance measurements.
................................................................................................................................................ 154
Figure A.2: The electrical conductivity of BCY20 membrane as a function of temperature.
(▲) 20% O2 balance Ar, (●) 2.3% H2O balance N2, (♦) 5% H2 + 2.3% H2O balance He. .... 155
Figure A.3: The Arrhenius plot of bulk conductivity of BCY20. .......................................... 156
Figure C.4: Molar fluxes of water permeated through the BCY20 membrane for different
membrane thicknesses (Feed side inlet gas concentration: 3% H2O in nitrogen, permeate side
inlet gas concentration: dry helium, flow rates of gases are 100 ml/min) .............................. 162
Figure D.5: a) XRD patterns of BCY10 pellets. b) cross section SEM image of BCY10. The
pellets were sintered at 1450 °C for 12 hrs …………………………………………………163
Figure E.6: Data comparison for the hygrometer ………………………………………… 164
Figure G.7: Calibration curves for different gases employed in the experiments …………166
Figure I.8: The repeat measurement of the electrical potential difference of BCY membranes
upon hydration and dehydration at 700 °C for Chapter 4 a) BCY20, b) BCY10. …………169

xiv
List of Tables
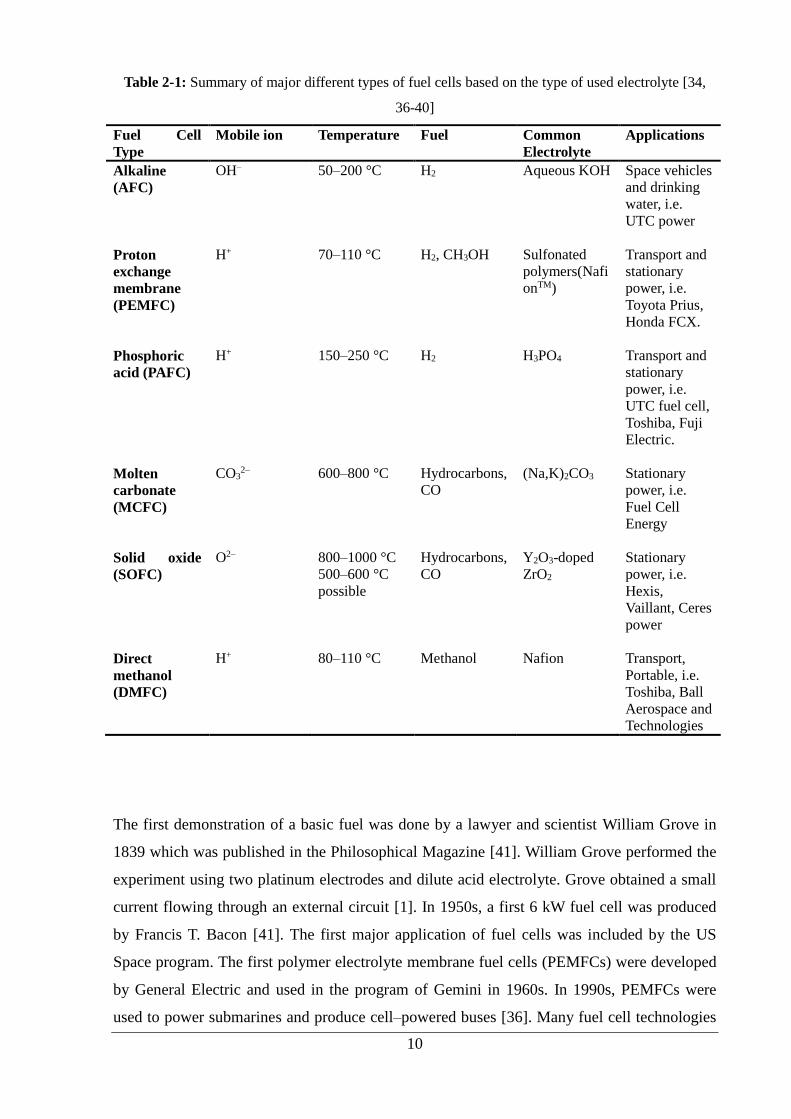
Table 2-1: Summary of major different types of fuel cells based on the type of used
electrolyte [34, 36-40] .............................................................................................................. 10
Table 2-2: Kröger-Vink notation for point defects in crystals. MX is chosen as an example
compound with M2+ as cation and X2- as anion........................................................................ 24
Table 2-3: Summary of experimental results for hydration thermodynamics of BCY10 and
BZY10. ..................................................................................................................................... 35
Table 3-1: Experimental procedure for membrane based water–gas shift experiments coupled
with water permeation. ............................................................................................................. 50
Table 3-2: List of the sealants studied for BCY membrane module ........................................ 59
Table 4-1: Initial concentration of species (see Appendix H for detailed calculations). ......... 69
Table 4-2: Fitted chemical diffusion coefficients calculated from the model at 700⁰C. ......... 82
Table 5-1: Calculated stoichiometric ratios for BCY20 from the EDXS results. .................... 95
Table 5-2: Post operation EDXS average surface compositions of feed sides and permeate
sides. ....................................................................................................................................... 116
Table K-1: EDXS of the bare surface of BCY20 on the feed side after experiment. ............ 172
Table K-2: EDXS of the bare surface of BCY20 on the feed side after experiment. ............ 172
Table K-3: EDXS of the bare surface of BCY20 on the permeate side after experiment. .... 173
Table K-4: EDXS of the bare surface of BCY20 on the permeate side after experiment. ... 173
Table K-5: EDXS of the platinum surface of BCY20 on the permeate side after experiment.
................................................................................................................................................ 174
Table K-6: EDXS of the platinum surface of BCY20 on the permeate side after experiment.
................................................................................................................................................ 174

xv
Nomenclature
List of acronyms
SOFC Solid oxide fuel cell
MCFC Molten carbonate fuel cell
BCY Yttrium–doped barium cerate
BCG Gadolinium–doped barium cerate
BCY20 20 mol% yttrium–doped barium cerate
AFC Alkaline fuel cell
PEMFC Proton exchange membrane fuel cell
PAFC Phosphoric acid fuel cell
YSZ Yttria–stabilised zirconia
LSGM La0.8Sr0.2Ga0.8Mg0.2O2.8
CGO Gadolinium–doped ceria
CSO Samarium–doped ceria
TGA Thermo–gravimetric analysis
IT–SOFC Intermediate temperature solid oxide fuel cell
BCY10 10 mol% yttrium–doped barium cerate
STP Standard temperature and pressure
MFC Mass flow controller
XRD X–ray diffraction
SEM Scanning electron microscopy
EDXS Energy dispersive X–rays spectroscopy
LSCF La0.6Sr0.4Co0.2Fe0.8O3-δ
WGSR Water gas shift reaction
WE Working electrode
CE Counter electrode
OCP Open circuit potential
DC Direct current

xvi
List of symbols
e' Electron
F Faraday`s constant (96485 C/mol)
N Avogadro’s number
n Amounts of electrons
E Reversible open circuit voltage
ΔG Change in Gibbs–free energy (J/mol)
ΔH Change in enthalpy of reaction (J/mol)
ΔS Change in entropy of reaction (J/K.mol)
T Temperature
∆𝐺⁰ Change in standard state Gibbs–free energy
R Universal gas constant (8.314 J/K.mol)
𝑃 Partial pressure of species
𝐶𝑝 Heat capacity of species
𝐸⁰ Standard cell voltage
Α Electron transfer coefficient
𝑖0 Exchange current density
ηact Activation overpotential
ηohm Ohmic overpotential
I Current
R Ohmic resistance (not to be confused with universal gas constant)
ηcont Concentration overpotential
𝑖𝐿 Limiting current density
𝑡 Goldschmidt tolerance factor
𝑟𝐴 Radius of the A-site cation
𝑟𝐵 Radius of the B-site cation
𝑟𝑂 Radius of the lattice oxygen
𝛿 Oxygen deficiency
𝐾 Equilibrium constant
𝑆 Effective dopant concentration
∆𝐻⁰ Hydration enthalpy

xvii
∆𝑆⁰ Hydration entropy
��𝐻2𝑂 Chemical diffusion coefficient of water
𝐷𝑂𝐻𝑜• Diffusion coefficient of protonic defects
𝐷𝑉𝑜•• Diffusion coefficient of oxygen vacancies
𝐽𝐻2𝑂 Water flux
𝐽 Mass transfer flux (mol/m2.s)
𝑢 Convection rate (m/s)
𝐶 Concentration (mol/m3)
𝛻𝑉 Electrical potential difference (V)
𝑧 Charge number of species
𝑘𝐵 Boltzman constant
𝑈 Mobility of ions (m2/V.s)
𝑅𝑒 Reaction rate (mol/m2.s)
𝑘𝑓 Film mass transfer coefficient (m/s)
𝐶𝑜𝑢𝑡 Bulk concentration (mol/m3)
𝑘1 Forward reaction rate constant (m2/mol.s)
𝑘2 Reverse reaction rate constant (m2/mol.s)
𝑃𝐻2𝑂∗ Partial pressure of water on the membrane surface
𝑅𝑎 The value of reaction rate (m2/mol.s)
𝑃0 Atmospheric pressure (Pa)
𝑆 Surface area (m2)
∆𝑡 Time interval (s)
∆𝑥 Space interval (m)
𝐿 Membrane thickness
Tpb Three–phase boundaries
h• Electron holes
VWR Potential between working and reference electrodes (V)
ɳ Overpotential (V)
𝑉𝑜•• Oxygen vacancy
𝑂𝑜𝑥 Lattice oxygen
𝑂𝐻𝑜• Hydroxide species

1
Chapter 1
Introduction
1.1 Overview
One of the main concerns of society is to produce clean and environmentally friendly energy
from renewable sources by shifting from high carbon technology to low carbon technology.
The use of traditional techniques such as combustion based power plants depend on fossil
fuels. The standard way of producing energy relies on transforming chemical energy of a
fossil fuel into thermal energy, then mechanical energy and finally electrical energy in terms
of producing stationary power which decreases the transformation efficiency and increases the
production of CO2. Although being industrially relevant, use of fossil fuels to generate power
had led to the phenomena of global warming. Therefore, it is vital for the future to implement
new efficient and environmentally friendly energy technologies.
Fuel cells are electrochemical devices which can directly convert the chemical energy of fuels
into electrical energy. This can offer to the world a prospect of power generation with lower
pollutant emission and high energy efficiency. These devices have wide applications such as
combined heat and power systems, domestic heat and power, portable power and
transportation [1]. Especially, stationary fuel cell systems are attractive due to the fact that
they have potential to compete with the current technologies in terms of efficiency and cost.
High temperature fuel cells such as solid oxide fuel cells (SOFCs) and molten carbonate fuel
cells (MCFCs) can use natural gas or hydrocarbon fuels without the need for external
reformer to convert the fuel to hydrogen. Therefore, they can eliminate the need for hydrogen
production and storage. Moreover, the overall efficiency of the high temperature fuel cells can
be increased up to 70% by using combined systems such as SOFC–gas turbine to use the
waste heat to produce electricity [1, 2]. The gas turbine can be run by the SOFC exhaust.

2
One of the strongest candidates in fuel cell technology is solid oxide fuel cells owing to their
high conversion efficiency and fuel flexibility. This type of cell offers using a range of fuels
obtained from fossil fuels to synthetic hydrocarbons produced from biomass and other
renewable sources (i.e. electrolysis) [3]. A conventional SOFC utilises an oxide ion
conducting ceramic electrolyte, usually yttria–stabilised zirconia operating at elevated
temperature (750–1000 °C) [4]. However, operation of an SOFC at high temperature has
limitations such as longer start up time, electrode sintering, catalyst poisoning, thermal stress
and expensive interconnect materials [5]. A period is required to burn fuel in order to reach
the operating temperature. In addition, the thermal mismatch due to different thermal
coefficients of cell components can cause mechanical failure of the cell. Agglomeration of
metal electrodes at high operational temperature reduces active surface area of electrodes.
Due to those operational limitations of high temperature SOFC’s, developments in SOFC
technology is recently focused on lowering the operating temperature (500–800 °C) and
enhancing the ionic conductivity of electrolyte. Enhancement of conductivity of electrolyte is
concentrated on two major approaches; investigation of new materials and improvement of
existing materials. One of the approaches in development of new materials is based on proton
conducting electrolytes which show high protonic conductivity at intermediate temperatures
(500–800 °C) and can utilise hydrocarbon fuels such as natural gas.
SOFCs use hydrogen or a mixture of hydrogen and carbon monoxide obtained by internal
reforming of hydrocarbons or natural gas. Internal reforming of a fuel is more effective than
external reforming due to the fact that no additional system for hydrogen production and
storage is required. This reduces heat losses and expense of SOFCs. However, there are
several limitations with internal reforming which are needed to be overcome. One of the
major issues with use of carbon containing fuel is carbon deposition (coking) owing to
hydrocarbon pyrolysis, especially when a nickel containing anode is used. (Nickel is typically
used as an electrode for high temperature fuel cells.) Coking causes deactivation of the anode
very rapidly when the fuel cell is operated at temperatures below 850 °C [6].
In addition to carbon build up, temperature gradient along the cell is another major issue. For
instance, steam reforming of methane is a fast endothermic reaction that takes place at the fuel
entry of the fuel cell whereas exothermic fuel cell reactions take place slowly in the cell. This
results in instabilities and sub–cooling in this section of the SOFC. This temperature gradient
3
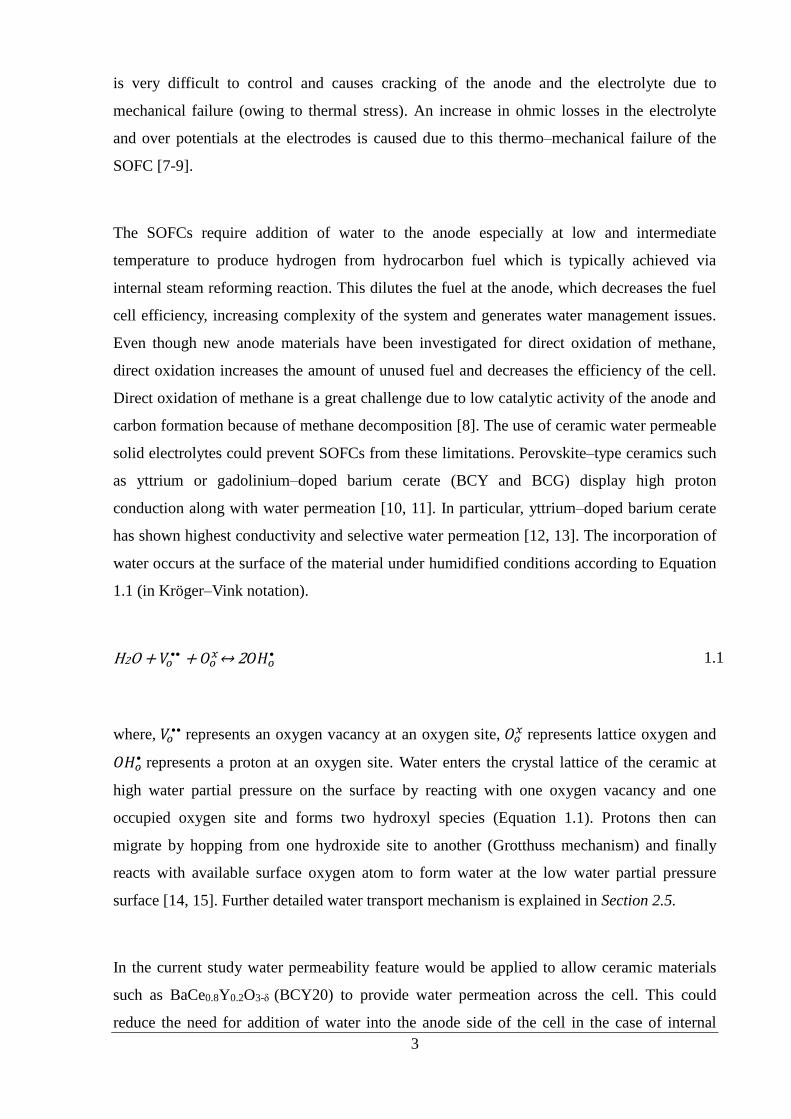
is very difficult to control and causes cracking of the anode and the electrolyte due to
mechanical failure (owing to thermal stress). An increase in ohmic losses in the electrolyte
and over potentials at the electrodes is caused due to this thermo–mechanical failure of the
SOFC [7-9].
The SOFCs require addition of water to the anode especially at low and intermediate
temperature to produce hydrogen from hydrocarbon fuel which is typically achieved via
internal steam reforming reaction. This dilutes the fuel at the anode, which decreases the fuel
cell efficiency, increasing complexity of the system and generates water management issues.
Even though new anode materials have been investigated for direct oxidation of methane,
direct oxidation increases the amount of unused fuel and decreases the efficiency of the cell.
Direct oxidation of methane is a great challenge due to low catalytic activity of the anode and
carbon formation because of methane decomposition [8]. The use of ceramic water permeable
solid electrolytes could prevent SOFCs from these limitations. Perovskite–type ceramics such
as yttrium or gadolinium–doped barium cerate (BCY and BCG) display high proton
conduction along with water permeation [10, 11]. In particular, yttrium–doped barium cerate
has shown highest conductivity and selective water permeation [12, 13]. The incorporation of
water occurs at the surface of the material under humidified conditions according to Equation
1.1 (in Kröger–Vink notation).
H2O + 𝑉𝑜•• + 𝑂𝑜
𝑥↔ 2𝑂𝐻𝑜• 1.1
where, 𝑉𝑜•• represents an oxygen vacancy at an oxygen site, 𝑂𝑜
𝑥 represents lattice oxygen and
𝑂𝐻𝑜• represents a proton at an oxygen site. Water enters the crystal lattice of the ceramic at
high water partial pressure on the surface by reacting with one oxygen vacancy and one
occupied oxygen site and forms two hydroxyl species (Equation 1.1). Protons then can
migrate by hopping from one hydroxide site to another (Grotthuss mechanism) and finally
reacts with available surface oxygen atom to form water at the low water partial pressure
surface [14, 15]. Further detailed water transport mechanism is explained in Section 2.5.
In the current study water permeability feature would be applied to allow ceramic materials
such as BaCe0.8Y0.2O3-δ (BCY20) to provide water permeation across the cell. This could
reduce the need for addition of water into the anode side of the cell in the case of internal

4
reforming. Hence, fuel dilution limitation can be overcome. The conversion of fuel and the
overall efficiency of the cell may increase. Additionally, water permeation across the cell
could facilitate carbon removal. Permeated water from cathode to anode can react with carbon
and form carbon dioxide and hydrogen. This could make the use of hydrocarbon fuels
possible without carbon deposition.
Water permeation could provide less complex reforming steps in the cell. Since water
permeation will occur from the cathode through the electrolyte to the anode, the addition of
water to fuel at the anode may be reduced. Even at a later stage the addition of water to the
anode may be interrupted owing to the fact that product water will be available as a result of
electrochemical cell reactions at both anode and cathode. In the case of use of methane as
fuel, CO and H species will be produced as a result of steam reforming reaction and oxidised
electrochemically at the triple–phase boundaries (the solid electrolyte–anode–gas interface) of
the anode side to form water and carbon dioxide. Therefore, high thermal efficiency, lower
temperature gradient and uniform fuel distribution may be achieved along with reduced
coking due to distributed water permeation. Furthermore, the exothermic fuel cell reactions
can provide the necessary heat required for the endothermic hydrocarbon reforming reaction,
such as steam reforming of methane. The SOFC would thus behave as a heat exchange
membrane reactor.
1.2 Project Rationale
Researchers have looked at the structural evolution, phase transitions from room temperature
to high temperature, thermal analysis and electrical conductivity studies for yttrium doped
barium cerates so far [16-20]. A few research groups have studied hydration thermodynamics
of materials such as lanthanum tungstate, barium cerate and zirconate using
thermogravimetric analysis [21-23]. These studies mostly involved determination of the
standard enthalpy and entropy of hydration of the materials. In addition, there are still on–
going research on rare earth metal yttrium doped barium cerates and mixed barium
cerate/barium zirconate as electrolytes for SOFCs [24-26]. However, most of the research has
focused on different fabrication methods, utilisation of humidified H2 or dry H2 as a fuel and
air or O2 as oxidant, conductivity measurements, sinter activity, chemical stability [24, 27-32].

5
These reports have not investigated the water transport features of proton conductors in terms
of internal reforming and use of hydrocarbon fuels via water permeation in a fuel cell. For
such an approach to be viable it is important to understand the mechanism of water transport
and specifically the nature of the surface sites that are required for water incorporation into
the membrane as well as water evolution. It is also crucial to confirm that water permeation
can occur without compromising power output (as fuel oxidation leads to water production
anyway). Thus, there is a need for determining to what extent the water permeation will be
beneficial for this system. This type of novel SOFC (which can act as a fuel cell, a water
permeator and a heat exchanger) is a complex device and has not been investigated in
literature to the best of the author’s knowledge.
The overall aim of this study is to investigate yttrium–doped barium cerate in terms of water
permeation behaviour along with multi–species transport at the intermediate temperature
(500–800 °C) and its application on a solid oxide fuel cell including simultaneous water
permeation. This feature will be evaluated in terms of internal reforming for the cell. The
mechanistic understanding of water permeation coupled with hydrocarbon SOFC, can also
allow rational design of fuel cells for improved water permeation and performance.
Figure 1.1 presents a schematic of the distributed water introduction in an operational solid
oxide fuel cell. Water and air are introduced at the cathode where protonic defects are created
as a result of the reaction between water, oxygen vacancies and the lattice oxygen. (Water
does not diffuse as molecules, but rather as a result of diffusion of protonic defects and
oxygen vacancies within the material). The cathode here represents the high partial pressure
of the water surface and the anode represents the low partial pressure of the water surface.
The chemical potential difference of water between cathode and anode creates continuum
driving force for water permeation in the cell. The permeated water is consumed in the
internal hydrocarbon reforming reactions at the anode where protons and electrons are also
formed as a part of the fuel cell reaction (e.g. the fuel is chosen as methane). This should
result in direct internal reforming and reduce fuel cell temperature gradients (due to
distributed water permeation) compared to conventional internal reforming as well as
facilitate carbon removal which could make the use of hydrocarbons possible without carbon
deposition. Even, injection of water to cathode may be interrupted at a later stage since water
will be produced as a result of anode and cathode electrochemical reactions which can be used

6
for reforming reactions without the need for addition of water to cathode (probably at high
current densities). The final system could theoretically be self–sustained in water supply.
Figure 1.1: A schematic representation of a working solid oxide fuel cell with simultaneous water
permeation, 𝑉𝑜•• represents an oxygen vacancy at an oxygen site, 𝑂𝑜
𝑥 represents a lattice oxygen and
𝑂𝐻𝑜• represents a proton at an oxygen site (protonic defect). The transport of water takes place via
protons that hop between hydroxide sites and counter diffusion of oxygen vacancies throughout the
membrane from the cathode to the anode. The electrons are transported via the external circuit. The
steam reforming reaction takes place at the anode to produce hydrogen and carbon monoxide. Carbon
monoxide further undergoes water gas shift reaction to produce hydrogen and carbon dioxide. The
heat is transferred to the anode for endothermic reforming reactions.
In order to study the practicability of the concept described above the following objectives are
evaluated.
1. Hydration behaviour of BCY membrane and defect distribution during hydration
and extract diffusion coefficients of defects.
2. The water permeation flux of BCY20 membrane under different temperatures.
3. The effect of surface modification on water permeation.
7
4. The ability and stability of BCY20 membrane for coupled water gas shift reaction
(WGSR) and water permeation in addition to the role of surface modification.
5. The effect of simultaneous oxygen and water transport on water and oxygen
transport in one membrane reactor.
6. The fuel cell performances with simultaneous water permeation via utilisation of
different fuels.
1.3 Thesis Organisation
This thesis is comprised of seven chapters. Chapter 1 gave a general overview and
introduction of the project. Chapter 2 presents a literature survey regarding fuel cells,
perovskite structure, electrolyte materials, water permeation mechanism related to defect
chemistry. Chapter 3 describes the membrane preparation process, reactor module,
experimental protocol, the list of experiments that were performed, the fundamental of the
analytical techniques that were used to analyse structure, morphology and texture of the
membrane as well as the studied high temperature membrane sealant materials which is
crucial for permeation experiments. Chapter 4 provides information about investigation of
hydration and dehydration behaviour of the membrane and exploration defect distribution
during hydration and extraction of diffusion coefficient of defects. Chapter 5 characterises the
membrane and discusses water permeation of the membrane at different temperatures as well
as the effect of surface modification on water permeation. The feasibility of water gas shift
reaction via water permeation and post operation analysis are also presented. Chapter 6
investigates the effect of simultaneous oxygen and water transport on water and oxygen
permeation. Besides, an evolution of the fuel cell performances with simultaneous water
permeation. Finally, Chapter 7 discusses overall conclusions and recommendations for future
work.

8
Chapter 2
Literature Survey
This chapter presents a brief introduction to fuel cells in Section 2.1, followed by details on
SOFCs in Section 2.2. The general thermodynamics of SOFCs are described in Section 2.3.
The electrolyte materials based on the type of conducting species (charge carriers) are
described in Section 2.4. Finally, Section 2.5 contains information about BCY electrolyte
material and its specific feature for water permeation. The transport mechanism for water
permeation as well as reported experimental values is also described.
2.1 Introduction to Fuel Cells
Fuel cells are electrochemical devices which can convert directly the chemical energy of fuels
into electrical energy through chemical reactions. A single fuel cell consists of two electrodes,
anode and cathode, and an electrolyte which separates the two electrodes and ensures ionic
conduction for fuel oxidation [33]. Although the charge carrier depends on the type of fuel
cells, direct or indirect oxidation of fuels via reforming steps take place at the anode and
oxygen reduction usually from air takes place at the cathode [34]. The electrolyte enables
ionic conduction between anode and cathode and prevents direct combustion of fuel and
oxidant. A schematic operation of a fuel cell along with directions for ion conduction across
the cell is shown in Figure 2.1.

9
Figure 2.1: Schematic of a fuel cell consists of a porous anode and cathode and a dense electrolyte
between them. Reactant gases are fed to anode and cathode inlets, product gases leave from anode and
cathode outlets; directions of ions through electrolyte are shown. Electrons flow through an external
circuit. [35].
The main types of fuel cells depending on the electrolyte type used, such as Alkaline (AFC),
Proton Exchange Membrane or Polymer Electrolyte Membrane Fuel Cell (PEMFC),
Phosphoric Acid Fuel Cell (PAFC), Molten Carbonate Fuel Cell (MCFC), Direct Methanol
Fuel Cell (DMFC) and Solid Oxide Fuel Cell (SOFC) are presented in Table 2.1 including
applications and specifications [36-38]. Each fuel cell operates with the same procedure, but
differs from each other by charge carrier. MCFCs and SOFCs are also classified as high
temperature fuel cells whereas AFCs, PEMFCs and PAFCs are classified as low temperature
fuel cells.
10
Table 2-1: Summary of major different types of fuel cells based on the type of used electrolyte [34,
36-40]
Fuel Cell
Type
Mobile ion Temperature Fuel Common
Electrolyte
Applications
Alkaline
(AFC)
OH– 50–200 °C H2 Aqueous KOH Space vehicles
and drinking
water, i.e.
UTC power
Proton
exchange
membrane
(PEMFC)
H+ 70–110 °C H2, CH3OH Sulfonated
polymers(Nafi
onTM)
Transport and
stationary
power, i.e.
Toyota Prius,
Honda FCX.
Phosphoric
acid (PAFC)
H+ 150–250 °C H2 H3PO4 Transport and
stationary
power, i.e.
UTC fuel cell,
Toshiba, Fuji
Electric.
Molten
carbonate
(MCFC)
CO32– 600–800 °C Hydrocarbons,
CO
(Na,K)2CO3 Stationary
power, i.e.
Fuel Cell
Energy
Solid oxide
(SOFC)
O2– 800–1000 °C
500–600 °C
possible
Hydrocarbons,
CO
Y2O3-doped
ZrO2
Stationary
power, i.e.
Hexis,
Vaillant, Ceres
power
Direct
methanol
(DMFC)
H+ 80–110 °C Methanol Nafion Transport,
Portable, i.e.
Toshiba, Ball
Aerospace and
Technologies
The first demonstration of a basic fuel was done by a lawyer and scientist William Grove in
1839 which was published in the Philosophical Magazine [41]. William Grove performed the
experiment using two platinum electrodes and dilute acid electrolyte. Grove obtained a small
current flowing through an external circuit [1]. In 1950s, a first 6 kW fuel cell was produced
by Francis T. Bacon [41]. The first major application of fuel cells was included by the US
Space program. The first polymer electrolyte membrane fuel cells (PEMFCs) were developed
by General Electric and used in the program of Gemini in 1960s. In 1990s, PEMFCs were
used to power submarines and produce cell–powered buses [36]. Many fuel cell technologies

11
and ideas have been under development since then. Fuel cells created very attractive new
technology due to its–low/zero pollutant (no harmful pollutants such as NOx and SOx) and
higher efficiency compared to conventional energy systems.
The SOFC technology has been attracting much attention among these five main types of fuel
cells and many researchers and companies are investigating possible developments due to the
fact that SOFCs are the most suitable and green sources for residential energy purposes and
they have the ability to hybridise with gas turbines and combined heat power systems (CHPs)
[4]. Such a hybrid system can reach the efficiency of 70% [2]. Besides, higher operation
temperature SOFCs provide the fuel flexibility for hydrocarbons and higher fuel cell
efficiency (has the highest conversion rate) at about 1000 °C among these fuel cells [42]. The
uses of hydrocarbons eliminate the problems regarding with hydrogen production, storage,
safety and cost. Recent developments focused on the intermediate temperature operation of
SOFCs between 500–800 °C and development of the electrical performance of the cell. These
include investigation of carbon/sulphur tolerant anodes, low cost current collectors, sealant
materials and lowering the operating temperature.
2.2 Solid Oxide Fuel Cells
Figure 2.2 shows the basic operation principle of an SOFC with an oxide ion conductor and a
proton conducting electrolyte. An SOFC composes two electrodes and an electrolyte between
them. In a conventional SOFC, a nickel cermet anode, a perovskite cathode and a dense
yttria–stabilized zirconia oxide ion conducting ceramic electrolyte are generally used as
components. SOFC operates at 500–1000 °C and can utilise various range of fuel types such
as natural gas, methane and other hydrocarbons [43]. In the case of a proton conducting
SOFC, hydrogen will be oxidised to produce protons at the anode then protons migrate
through the solid electrolyte to react with oxygen and produce water at the cathode.
12
Figure 2.2: Schematic of a solid oxide fuel cell with a) oxide ion conducting electrolyte; oxidation of
fuel takes place at the anode and reduction of oxygen takes place at the cathode, oxide ions are
transported through electrolyte from cathode to anode. Electrons flow through an external circuit from
anode to cathode to produce useful power b) Proton conducting electrolyte; oxidation of hydrogen
takes place at the anode and reduction of hydrogen occurs at the cathode, protons are transported
through electrolyte from anode to cathode [43].
The electrochemical reactions can happen at the cathode and anode in an oxide ion
conducting SOFC:
Cathode: ½ O2 + 2e’ O2– 2.1
Anode: H2 + O2– H2O + 2e’ 2.2
Anode: CO + O2– CO2 + 2e’ 2.3
The overall reaction can be written as follows;
H2 + ½ O2 (+ CO + ½ O2) H2O (+CO2) 2.4

13
In the case of a proton conducting SOFC, the electrochemical reactions that can take place
are;
Cathode: ½ O2 + 2H• + 2e’ H2O 2.5
Anode: H2 2H• + 2e’ 2.6
2.2.1 Benefits and Drawbacks
The SOFC technology can provide some advantages such as use of existing fuels (i.e.
methane, natural gas) and infrastructure, high conversion efficiency, silent operation, low/zero
pollutant emission [43]. An operational SOFC offers about 40%–55% total energy efficiency,
however, they can reach up to about 70% total energy efficiency with combined heat and
power generation [44]. This is a significant improvement compared to conventional internal
combustion engines which offer about 30% total energy efficiency. In vehicles SOFC could
be employed as an auxiliary unit to run air conditioning, for this application SOFC could offer
useful heat, low emission, use of the same hydrocarbon fuel as the engine compared to
existing battery [45]. In terms of stationary application, SOFC can reduce carbon dioxide
emission by up to 50% compared to electric generation using pipeline gas. However, there are
some disadvantages in terms of application of SOFCs. The SOFCs should have sufficient
power density to compete with internal combustion engines and also should have less cost
compared to other ways of power generation. The current cost is reported as about $1 500/kW
and should be reduced to about $400/kW to be commercially available [44]. Due to requiring
long time and more energy to start up compared to existing petrol and electrical vehicles, it is
not common in transportation yet [2].

14
2.3 Thermodynamics and Electrochemistry of SOFCs
2.3.1 Nernst Potential
In a hydrogen fuel cell, n electrons pass through an external circuit, water is produced and
hydrogen is used. The charge that passes through the circuit is;
–nNe = –nF (Coulombs) 2.7
F is the Faraday’s constant (96487 Coulombs/mole of electrons), N is Avogadro’s number; e is
the charge of one electron, n is mole of electrons transferred per mole of hydrogen. The
electrochemical work is done [41];
We = – neFE 2.8
E is the reversible open circuit voltage of the cell. If there is no loss in the system, the
electrochemical work corresponds to the Gibbs–free energy released (ΔG), which is also
defined as the maximum work the cell can produce [41].
ΔG = –neFE 2.9
E= – ΔG / neF 2.10
Equation 2.10 presents reversible open circuit voltage of the hydrogen fuel cell [1].
The Gibbs energy is defined as below:
ΔG = ΔH –TΔS 2.11
In the case of hydrogen oxidation in solid oxide fuel cells the overall reaction involved is:

15
H2 + ½O2 → H2O 2.12
The Gibbs−free energy of this reaction (Equation 2.12) can be written as [46]:
ΔG = ΔG⁰ + RTln𝑃𝐻2𝑂
𝑃𝐻2𝑃𝑂21/2
2.13
Where ΔG⁰ is the standard state Gibbs-free energy at 25 °C and 1 atm, R is the universal gas
constant (8.314 J/K mol), T is the temperature in Kelvin (298 K) and 𝑃 is the partial pressure
of the species. ΔG⁰ can be calculated for Equation 2.12 as follows:
∆G = ∆Gproducts – ∆Greactants 2.14
ΔG⁰ = 𝐺𝐻2𝑂⁰ – 𝐺𝐻2
⁰ – ½ 𝐺𝑂2⁰
2.15
At a temperature T, ∆G can be calculated using Equation 2.11 and the Equations below:
𝐻𝑇 = 𝐻⁰ + ∫ 𝐶𝑝𝑑𝑇
𝑇
298
2.16
𝑆𝑇 = 𝑆⁰ + ∫
𝐶𝑝
𝑇
𝑇
298
𝑑𝑇
2.17
𝐶𝑝 represents the heat capacity of species.
From Equations 2.10 and 2.13 it is possible to calculate the ideal potential of the cell:
𝐸 = ∆𝐺⁰
𝑛𝑒𝐹−
𝑅𝑇
𝑛𝑒𝐹𝑙𝑛
𝑃𝐻2𝑂
𝑃𝐻2𝑃𝑂21/2
2.18

16
The Nernst equation is then:
𝐸 = 𝐸⁰ −𝑅𝑇
𝑛𝑒𝐹𝑙𝑛
𝑃𝐻2𝑂
𝑃𝐻2𝑃𝑂21/2
2.19
The electrons transferred in Equation 2.12 is 2, thus, 𝑛𝑒= 2.
𝐸 = 𝐸⁰ −𝑅𝑇
2𝐹𝑙𝑛
𝑃𝐻2𝑂
𝑃𝐻2𝑃𝑂21/2
2.20
Where 𝐸 represents the actual voltage of the cell and 𝐸⁰ represents the standard cell potential.
Equation 2.20 shows that the Nernst equation is influenced by the temperature and reactant
concentrations.
2.3.2 Fuel Cell Efficiency
The theoretical efficiency of the fuel cell is determined by the Gibbs free energy, ΔG, and the
enthalpy of formation, ΔH. The enthalpy of formation presents the heat obtained from burning
the fuel [44].
Efficiency = ∆𝐺𝑓
∆𝐻𝑓 2.21
However, the irreversible voltage losses exist in real applications. The real efficiency of the
cell depends on those losses; activation losses, ohmic losses and concentration losses which
are described in the following section.
2.3.3 Irreversible Voltage Losses
The theoretical potential of the cell is usually higher than its actual potential owing to three
main voltage losses: activation losses, ohmic losses and concentration losses. The regions
where these voltage losses are dominant are shown in Figure 2.3.

17
Figure 2.3: The theoretical and actual fuel cell voltages. The activation polarisation voltage losses
dominate at low current density region due to slow kinetics of electrode reactions. The ohmic
polarisation becomes dominant at the intermediate current density region mainly due to electrolyte
resistance to ions. At high current density region, concentration polarisation is present due to mass
transport reduction to electrodes [35]
Activation Losses
The reason for the activation over potentials is the slow kinetics of the reactions in both anode
and cathode. The activation losses are usually expressed by a semi–empirical Tafel Equation.
ηact = 𝑅𝑇
𝛼𝑛𝐹 𝑙𝑛 𝑖/𝑖0 2.22
α is electron transfer coefficient, 𝑅 is the ideal gas constant and 𝑖0 represents the exchange
current density [35]. Exchange current density is the rate at which the fuel cell reaction is in
equilibrium, in which case the net current equals to zero. Activation losses decrease with the
increasing reaction kinetics. Thus, high temperature SOFCs have lower activation losses than
low or intermediate temperature SOFCs since higher operation temperature increases the
reaction rate.
18
Ohmic Losses
Ohmic losses are caused by the resistance to the electrons through the electrodes and
interconnects and to the ions through the electrolyte [1]. The total ohmic resistance of the cell
is composed of electronic, ionic and contact resistance of the cell. It is represented by Ohms
Law.
ηohm= iR 2.23
where i represents current and R presents resistance of the electrolytes and electrodes.
The big contribution of the ohmic resistance of the fuel cell comes from the electrolyte of the
cell since ionic conduction has higher impact on the ohmic resistance than electronic
resistance and contact resistance. Ohmic losses could be decreased by using high conductive
electrodes, designing good bipolar plates and interconnects, using appropriate materials, and
by making electrolytes thinner [1].
Concentration Losses
The change in the mass transport of the surface electrodes causes concentration losses. The
failure to transport enough reactant mass to the electrode surface results in reduction in cell
voltage. Concentration polarisation of the cell is expressed by the equation [1]:
ηcont = 𝑅𝑇
𝑛𝐹 𝑙𝑛 (1 −
𝑖
𝑖𝐿 ) 2.24
Where 𝑅 corresponds to ideal gas constant, 𝑇 represents temperature of the cell, 𝐹 represents
Faraday constant, 𝑛 represents the number of electrons exchanged, 𝑖𝐿 represents limiting
current density when the fuel is consumed at its maximum speed and i represents current
density of the cell.
Activation losses are slightly smaller than concentration losses for high temperature SOFCs
[35].

19
2.4 Electrolyte Materials for SOFCs
A good solid state electrolyte should have the following features; high ionic conductivity and
low electronic conductivity, high chemical stability in oxidising/reducing environment at
elevated temperature, thermal expansion compatibility with other cell components and low
gas permeability [34]. The electrolyte in SOFCs can carry oxide ion (O2-), proton (H+) or both
charges. In this section, both oxide ion conductors and proton conductors will be discussed.
Special focus will be given on both oxide ion and proton transport which results in water
permeation.
2.4.1 Oxide Ion Conductors
Oxide ion conductors are promising electrolytes owing to their high ionic conductivities and
selectivities at high temperatures. A number of oxide ion conductors have been investigated
with different structures; fluorite–type (MO2) (doped bismuth oxide, zirconia, ceria,
pyrochlore) perovskite, apatite and related structures (lanthanum gallate, brownmillerites,
BiMeVOX) [47]. Yttria stabilised zirconia (YSZ), magnesium–doped lanthanum gallate
(LSGM) and gadolinium or samarium–doped ceria (CGO or CSO) have been widely
investigated for SOFCs. The conduction mechanism of solid oxide ion conductors is based on
creation of oxygen vacancy by doping rare earth metals or metal oxides into the crystal
structure. In fluorite oxides, MO2 where M is a relatively large four-valent cation such as Zr4+,
substitution of lower valent cations such as Y3+ into the host lattice creates oxygen vacancies
to maintain charge neutrality. YSZ is the typical example of this kind of doped-oxide material
with fluorite structure (as shown in Figure 2.4), and has good mechanical and electrical
properties at high temperatures. It can also show oxide ion conductivity of approximately 0.1
S/cm at 1000 ⁰C [2]. At low temperatures, oxide ion conductivity decreases due to lower
mobility and high activation enthalpy of oxygen ions [48]. The maximum conductivity was
achieved for YSZ with 8% Y2O3 doping [49]. Higher substitution of yttrium into the crystal
causes lattice distortion (lattice stress and deviation from cubic symmetry) to the crystal
which results in lower ionic conductivity [45, 50].

20
Figure 2.4: Fluorite structure of stabilized zirconia (large sphere; Zr/Ce, small; O) [49].
Each electrolyte has advantages and disadvantages. For instance, LSGM has higher ionic
conductivity than YSZ as can be seen from Figure 2.5; however, LSGM is reported to react
with Ni in the case of use of a Ni-ceria anode. The reaction between LSGM and Ni results in a
highly resistive phases and higher anode polarisation which leads to degradation of the cell
performance [51]. The conductivities of major oxide ion conductors are given in Figure 2.5.

21
Figure 2.5: Temperature dependence of oxide ion conductivity for major SOFC electrolytes. The
horizontal dotted line displays the limit of conductivity to build devices with an electrolyte thickness
of 15 micron or less. CGO; Ce1-xGdxO2-x/2 , LAMOX; La2Mo2O9 , LSGM; La0.8Sr0.2Ga0.8Mg0.2O2.8 ,
YSZ; yttria-stabilized zirconia [3].
Besides the fluorite structure, pyrochlore and the perovskite structures have been investigated
for oxide ion conductivity. The pyrochlore structure has the formula of A2B2O7, for instance,
Gd2Zr2O7. Doped ceria based electrolytes have higher ionic conductivity than YSZ especially
at low temperatures such as 500 °C. However, these electrolytes are relatively unstable at the
temperature of above 700 °C. Even though Bi2O3 has higher ionic conductivity compared to
YSZ, Bi2O3 based electrolytes are thermodynamically unstable in reducing atmosphere. They
decompose to metallic Bi under reducing atmosphere [52].
Acceptor doping of perovskite aluminates, for example LnAlO3, is one of the attractive
materials due to their low cost, moderate thermal expansion and higher stability in reducing
atmosphere. The reasons that prevent these materials from becoming commercially viable are
poor sinterability, porosity and high grain boundary resistance. These difficulties can be
solved by different applications such as addition of aluminium with gallium [52]. The oxygen

22
ion conductivity of In-, Sc-, Y- doped perovskites is sufficient, however, the application
remains in the research scale owing to the high cost [52].
Recent studies include LaGaO3- based perovskites, derivatives of Bi4V2O11, La2Mo2O9,
perovskite and brownmillerite like phases, several new pyrochlores such as (Gd, Ca)2Ti2O7-α
and apatite materials derived from Ln10-xSi6O26±α where Ln is a rare earth cation [52]. These
materials show better performance over common ZrO2- and CeO2- based solid electrolytes. In
order to reduce the operating temperature of SOFCs, other types electrolyte materials such as
proton conductors gained interest.
2.4.2 Proton Conductors
The oxides with perovskite structure (ABO3) show proton conductivity when they are
exposed to hydrogen and/or water rich environment.
Figure 2.6: Ideal crystal structure of perovskite oxide ABO3 [53].
The ideal structure of a cubic ABO3 perovskite is shown in Figure 2.6 in which A and B
represents cations. A cation has 12–fold oxygen coordination while B cation has 6–fold

23
oxygen coordination. The BO6 octahedra share corners and have 180° B-O-B bonding. The
ideal cubic structure can deviate due to the difference between the ionic radii of A, B and O2-.
The relationship between radii’s is given below.
𝑡 =𝑟𝐴 +𝑟𝑂
√2(𝑟𝐵+𝑟𝑂) 2.25
Where t represents the tolerance factor (also known as the Goldschmidt tolerance factor) and
𝑟𝐴, 𝑟𝐵 , 𝑟𝑂 present the ionic radii of An+, Bm+, O2-, respectively.
Perovskite oxide is formed between 0.75 < 𝑡 < 1.1. The ideal cubic perovskite structure (𝑡 ≈1)
has higher oxide ion mobility due to the fact that the oxygen sites have the same energy levels
[54]. The deviation creates lower symmetries such as orthorhombic and monoclinic [55]. This
can increase activation energy for proton conduction. The ionic conductivity can be improved
by doping the A and/or B site with a similar radius cation and lower valence. This leads to less
local distortions from the perovskite structure and increases stability.
The generation of oxygen vacancies in perovskite oxides occur by substitution of B- site
cation by a lower valent cation. This doping introduces oxygen vacancies to compensate for
an acceptor dopant M as shown in the following solid state reaction using Kröger–Vink
notation [56]:
𝑀2𝑂3 → 2𝛿𝑀𝐵, + 𝛿𝑉𝑜
•• + 2(1 − 𝛿)𝑀𝐴• + (6-𝛿)𝑂𝑜
𝑥 2.26
Where 𝛿 is the effective number of oxygen vacancies generated by doping per unit cell
(normally less than 0.2). The dopant atoms generally sit in the 𝐵 sites, however, it may also sit
in 𝐴 sites as shown in Equation 2.26. The doping of aliovalent cation such as Y3+ introduces
oxygen vacancies owing to the electrical neutrality condition from a few percent to twenty
percent [56, 57] (Aliovalent cations have different valence electrons, i.e. A Y3+ ion (ionic
radiu, 0.83 A) replacing a Ce4+ (ionic radiu, 0.94 A) [17]). Further doping can diminish
conductivity after reaching the maximum value due to the formation of neutral defect pairs.
The doping is generally notated with the initial letters of oxide material following with the
one letter abbreviation of the dopant material and the mole percent of the doping material. For

24
instance, BCY20 (BaCe0.8Y0.2O3-δ) signifies twenty mole percent yttrium doped barium
cerate.
The point defects in crystals are described by Kröger–Vink notation as stated below in Table
2.2 [57, 58].
Table 2-2: Kröger-Vink notation for point defects in crystals. MX is chosen as an example compound
with M2+ as cation and X2- as anion.
Symbol Type of defect
𝑽𝑴" Vacant 𝑀 site with effective -2 charge (
with respect to the ideal lattice)
𝑽𝑿•• Vacant 𝑋 site : 𝑋 ion vacancy with
effective +2 charge
𝑴𝑴𝒙 , 𝑿𝑿
𝒙 𝑀 , 𝑋 ion on lattice site, respectively,
(neutral)
𝑳𝑴′ 𝐿 + dopant ion on 𝑀 site with effective
charge -1
𝑵𝑴• 𝑁 3+ dopant ion on 𝑀 site with effective
charge +1
𝒆′ Free electron in conduction band
𝒉• Free electron hole in valance band
𝑴𝒊•• Interstitial 𝑀 ion with effective charge +2
𝑿𝒊" Interstitial 𝑋 ion with effective charge -2
The transport of protons occur via formation of 𝑂𝐻𝑜• groups in the perovskite structure. In dry
hydrogen atmosphere, this takes place according to Equation 2.27 [59];
H2 + 2𝑂𝑜𝑥↔ 2𝑂𝐻𝑜
• + 2e’ 2.27

25
The dissociative adsorption of water also leads to formation of 𝑂𝐻𝑜• groups in water rich
environment as given in Equation 1.1. Hydrogen dissolves into the oxide as protons and
bonds to oxygen ions to form 𝑂𝐻𝑜• groups (substitutional hydroxide). This defect is described
as interstitial protons; 𝐻𝑖•, and presumed as protonic defects [60]. The protons then hop from
one oxygen atom to another in the crystal by diffusing rotationally around the oxygen ion. The
attached hydrogen to the oxygen atom may cause reduction of perovskite to elemental metals
or binary oxides in Equation 2.27 [61]. Thus, Equation 1.1 is considered to be the most
important reaction for formation of 𝑂𝐻𝑜• groups.
Proton conduction was first shown in doped–SrCeO3 ceramics by Iwahara et al [62] in 1981.
They show the highest proton conduction in hydrogen containing atmosphere at high
temperatures by using metal doped SrCeO3 as an electrolyte at 600–1000 °C. They also
verified the proton conduction by the voltage behaviour of a hydrogen-oxygen cell. The
voltage of the cell increased with decreasing water vapour pressure at the cathode. The water
vapour pressure change at the anode influenced the voltage of the cell. In the case of oxygen
ion conducting electrolyte, the reverse situation should happen.
Similar studies have been done on SrCeO3, BaCeO3, BaZrO3 based ABO3 type perovskites by
doping a trivalent cation M such as Y, Nd, Sm, Gd and Yb since they displayed protonic
conduction under hydrogen containing atmosphere at elevated temperatures [63]. The
activation energy required for proton conduction is lower than conventional oxide ion
conductors. Moreover, they exhibit both oxygen and proton ion conduction and can be used as
solid electrolyte for various purposes such as steam electrolyser, fuel cells and membrane
reactor for gas separations.
Recently, they have been investigated for intermediate temperature solid oxide fuel cells since
the benefit of water production at the cathode hence the fuel dilution at the anode is avoided
[19]. Kreuer and co–workers [15] studied the diffusivity of protonic defects, oxygen ion
vacancies and water solubility in single Gd and Y–doped BaCeO3 crystals. The data obtained
from conductivity measurements and TGA (Thermo gravimetric analysis) were used to
calculate transference numbers and the chemical diffusion coefficient of water. Their results
exhibited no strong evidence for the degree of hydration for defect interactions whereas an

26
increase in the oxygen relaxation around oxygen ion vacancies with decreasing vacancy
concentration was found. They suggested the water saturation limit was controlled by the
dopant distribution over two cation sites.
Thangadurai and co–workers [55] have recently studied materials for proton conducting solid
oxide fuel cells. They looked at the role of A- and B- site cations in the perovskite structures
on electrical properties and their chemical stabilities in CO2, H2S and H2O. They prepared
Gd+Pr, Sm, Sm+Ca, Eu–doped perovskite type BaCeO3 and some double perovskite–related
structure. Their chemical stability results showed that Ce based compounds were unstable in
CO2 at elevated temperature and in H2O at around 100 °C whereas Nb based sample showed
good stability in these environments. Barium zirconate was indicated to be stable in CO2
environment, however, various conductivity data of the barium zirconate was reported by the
research groups from as low as 10-6 S/cm to as high as 10-2 S/cm at 600 °C as reported by
Babilo et al [64]. Therefore, due to the highest electrical conductivity for Ce–based
perovskites and consistency in the literature with regards to conductivity and transport
mechanism, Y–doped barium cerate is chosen in this study.
2.4.3 Y-Doped Barium Cerate (BCY)
Protons were reported as minority charge carriers in 1960s in some oxide ion conductors such
as LaAlO3, LaYO3 and SrZrO3. These materials then turn out to be proton conductors in a
hydrogen containing atmosphere [14]. Especially SrCeO3 and BaCeO3 related compounds
show high protonic conductivity. The first orthorhombic structure of BaCeO3 was determined
by Jacobson et al [65] at the room temperature which was found to be more stable. Barium
cerate exhibits predominantly ionic conductivity at the region of low oxygen partial pressure
and mixed ionic–electronic conductivity (hole conductivity) at high oxygen partial pressure
region [66]. These materials are very poor hydrogen transport membranes due to lack of
electronic conductivity (see Equation 2.27).
Since then these materials have been tested by many researchers using porous platinum or
nickel as anode and cathode in various electrochemical cells. The proton conducting oxides
can be used as an electrolyte in SOFCs and could reduce the operating temperature in the

27
range of 500–800 °C. The proton conducting based intermediate temperature solid oxide fuel
cells (ITSOFCs) can have higher power output than oxygen ion conducting electrolytes owing
to having higher ionic conductivity in these temperature ranges. Their protonic conductivities
were reported in the order of 10-3 to 10-2 S/cm in hydrogen containing environment [63].
Stoichiometric modification of BaCeO3 permits improvement of its properties. Yttrium–doped
barium cerate showed the highest conductivity among the other rare–earth metal doped oxides
as shown in Figure 2.7 [12, 67]. The conductivity of barium cerate was reported as about
5×10⁻² S/cm at 700 °C by 20% Y doping in hydrogen containing environment by Iwahara
[12]. Similar results (0.049 S/cm) were obtained in wet hydrogen environment in this study
using electrochemical impedance spectroscopy. The conductivity measurements were carried
out in three different atmospheres and the results are presented in Appendix A. The
conductivity of barium cerate increases with Y concentration up to 0.2 [68] which may be due
to an increase in charge carrier concentration.
Figure 2.7: The conductivities of major proton conducting perovskites in hydrogen versus temperature
[12].

28
The effect of dopant concentration on conductivity, crystal structure and hydration properties
were studied by Takeuchi et al [17] and Tauer et al [69]. Takeuchi et al investigated yttrium
doping level of 0 ≤ x ≤ 0.3 for BaCe1-xYxO3-δ and reported the maximum total conductivity
in the range of 0.15 ≤ x ≤ 0.25. Tauer et al reported a linear correlation between the dopant
concentration and hydration expansion of BCY.
One of the significant properties that can affect proton conduction in these types of ceramics
as well as doping level is synthesis method. Several synthesis and sintering methods were
studied in order to produce dense ceramic pellets [18, 70-72]. Densification and crystal
structure of the material are important parameters for proton conduction. The most common
methods used in the field are solid state reaction and sol–gel method. It is possible to obtain
dense ceramics with density values of ~95% using both processes. However, solid state
reaction procedure requires higher sintering temperature (~1200 °C) than sol gel method
(~1000 °C).
BCY20 was also studied to solve carbon deposition problem which is widely seen with the
oxide ion conductors. Tomita et al [73] studied an SOFC based on BCY20 as an electrolyte
and anode without using an anode. A layer was about 10 µm thick created by using heat
treatment at 1700 °C to serve as an anode. The heat treatment ensured BaO vaporisation on
the membrane surface and creation of Ce rich phase. The heat treated BCY20 cells showed
good performance with methane, ethane, propane, and butane. There was no carbon
deposition observed. In addition, the cell did not react with CO2 under CO2 containing
environment, showing that Ce–rich phase acted as a protective layer to CO2 in the gas mixture
due to the fact that a reaction between CeO2 and CO2 is not possible thermodynamically.
In addition to the highest conductivity of BCY20, the feature of mixed oxide ion and proton
conduction at the intermediate temperatures (500–800 °C) made this material promising for
SOFCs due to the fact that both conduction mechanism will result in ambipolar diffusion of
protonic defects and oxide ion vacancies [74]. BCY20 membrane can absorb water vapour
into oxygen ion vacancies and create interstitial protonic defects in the wet surface by reacting
with one oxygen vacant and one occupied oxygen site [75]. The evolution of water can then
occur in the dry surface. This water permeation ability makes BCY20 interesting for solid
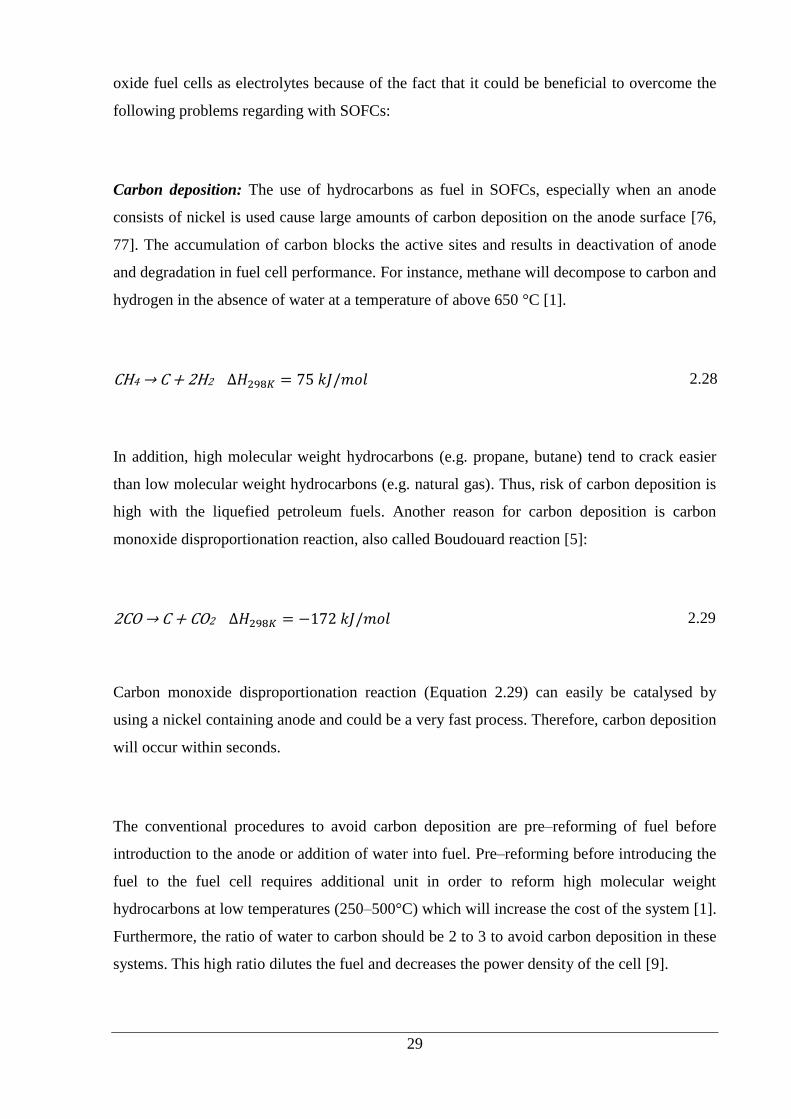
29
oxide fuel cells as electrolytes because of the fact that it could be beneficial to overcome the
following problems regarding with SOFCs:
Carbon deposition: The use of hydrocarbons as fuel in SOFCs, especially when an anode
consists of nickel is used cause large amounts of carbon deposition on the anode surface [76,
77]. The accumulation of carbon blocks the active sites and results in deactivation of anode
and degradation in fuel cell performance. For instance, methane will decompose to carbon and
hydrogen in the absence of water at a temperature of above 650 °C [1].
CH4 → C + 2H2 ∆𝐻298𝐾 = 75 𝑘𝐽/𝑚𝑜𝑙 2.28
In addition, high molecular weight hydrocarbons (e.g. propane, butane) tend to crack easier
than low molecular weight hydrocarbons (e.g. natural gas). Thus, risk of carbon deposition is
high with the liquefied petroleum fuels. Another reason for carbon deposition is carbon
monoxide disproportionation reaction, also called Boudouard reaction [5]:
2CO → C + CO2 ∆𝐻298𝐾 = −172 𝑘𝐽/𝑚𝑜𝑙 2.29
Carbon monoxide disproportionation reaction (Equation 2.29) can easily be catalysed by
using a nickel containing anode and could be a very fast process. Therefore, carbon deposition
will occur within seconds.
The conventional procedures to avoid carbon deposition are pre–reforming of fuel before
introduction to the anode or addition of water into fuel. Pre–reforming before introducing the
fuel to the fuel cell requires additional unit in order to reform high molecular weight
hydrocarbons at low temperatures (250–500°C) which will increase the cost of the system [1].
Furthermore, the ratio of water to carbon should be 2 to 3 to avoid carbon deposition in these
systems. This high ratio dilutes the fuel and decreases the power density of the cell [9].

30
The water permeable ceramic electrolyte could offer another prospect to this problem. The
distributed water permeation from cathode through electrolyte to anode could facilitate carbon
removal as follows [78, 79]:
C + H2O → CO + H2 ∆𝐻298𝐾 = 131.3 𝑘𝐽/𝑚𝑜𝑙 2.30
C + 2H2O → CO2 + 2H2 ∆𝐻298𝐾 = 90.1 𝑘𝐽/𝑚𝑜𝑙 2.31
The reactions shown in Equations 2.30 and 2.31 can remove the accumulated carbon from
active sites of the anode. Thus, a carbon deposition free internal reforming may be achieved.
Temperature Gradient: In order to avoid carbon deposition, high ratio of water/carbon is
used. However, this creates large temperature gradients in the anode due to the fast and
endothermic reforming reactions along with dilution of the fuel [78, 80]. The heat produced
due to exothermic electrochemical cell reactions is higher than the heat consumed in
reforming reaction which introduces the management of temperature gradient in the cell as a
problem and requires cooling of the cell. It was also reported [9] that hydrogen coverage is
higher because of low use of hydrogen in electrochemical reactions and the current density is
lower at the beginning of anode compared to downstream of cell due to temperature drop at
this point.
These inhomogeneity’s could be eliminated by the introduction of distributed water through
the electrolyte. As a result, hydrogen will be consumed as it is produced. That will ensure
even distribution of hydrogen (fuel distribution) which will result in distribution of
temperature in the cell. Moreover, it will decrease addition of water since product water will
also be available to be consumed. Thus, fuel conversion will increase and hence efficiency of
the system.

31
2.5 Water Permeation Mechanism in BCY Membrane
2.5.1 Mechanism of Water Transport
The water is transported through the membrane in the form of protonic defects and oxygen
vacancies by a water partial pressure gradient across the membrane. In a region where oxygen
partial pressure is low to moderate (where electronic defects can be ignored), the ambipolar
transport of protonic defects and oxygen vacancies is possible [81]. The protonic defects
(𝑂𝐻𝑜•) are formed when the doped oxide is exposed to water vapour by reacting with an
oxygen vacancy (VO••) and a stationary oxygen site (𝑂𝑜𝑥) at this surface [82]. The protonic
defects are then free to jump from one oxygen site to another (Grotthuss mechanism) whereas
the oxygen vacancies move in the opposite direction as shown in Figure 2.8.
Figure 2.8: Schematic representation of water transport mechanism within BCY membrane. H2O
reacts with one 𝑉𝑜•• and one 𝑂𝑜
𝑥 at the high 𝑃𝐻2𝑂 surface and forms two hydroxyl groups (𝑂𝐻𝑜•). Then
the protons as an interstitial defects hop between hydroxyl groups towards low 𝑃𝐻2𝑂 surface as 𝑉𝑜••
diffuses at the opposite direction. At the low 𝑃𝐻2𝑂 surface, H2O is released and 𝑉o•• and 𝑂𝑜
𝑥 are formed.
No electronic charge carrier is involved.

32
The reaction equilibrium constant as a function of the concentration of protonic defects and
oxygen vacancy and partial pressure of water (𝑃𝐻2𝑂 ) for Equation 1.1 is expressed as:
𝐾 =𝐶𝑂𝐻𝑂•2
𝑃𝐻2𝑂 𝐶𝑉𝑂••𝐶𝑂𝑂𝑥
2.32
Due to the constant oxygen site (site restriction) in the membrane, electroneutrality condition,
and the assumption of the negligible electronic charge carriers in barium cerate the following
reactions can be written [14];
𝐶𝑂𝐻𝑂• + 𝐶𝑉𝑂
•• + 𝐶𝑂𝑂𝑥= 3 2.33
From the electroneutrality condition;
2𝐶𝑉𝑂•• + 𝐶𝑂𝐻𝑂• − 𝑆 = 0 2.34
Where 𝑆 refers to the effective dopant concentration, 𝑆 = 𝐶𝑌𝐶𝑒′ – 𝐶𝑌𝐵𝑎• , 𝑌𝐶𝑒′ is the doping level
of yttrium on 𝐶𝑒 site and 𝑌𝐵𝑎• is the doping level of yttrium on 𝐵𝑎 site.
From Equation 2.33 and 2.34, 𝐶𝑉𝑂••and 𝐶𝑂𝑂𝑥can be obtained as a function of protonic defect
concentration:
𝐶𝑉𝑂•• = 𝑆 − 𝐶𝑂𝐻𝑂
•
2
2.35
𝐶𝑂𝑂𝑥=
6−𝑆 − 𝐶𝑂𝐻𝑂•
2
2.36

33
By substituting Equations 2.33 and 2.34 in Equation 2.32, the concentration of protonic
defects can be obtained as a function of 𝑃𝐻2𝑂 and K as follows [83]:
𝐶𝑂𝐻𝑂• = 3𝐾 𝑃𝐻2𝑂 − √𝐾 𝑃𝐻2𝑂 (9𝐾 𝑃𝐻2𝑂 −6𝐾 𝑃𝐻2𝑂 𝑆+𝐾 𝑃𝐻2𝑂 𝑆
2+24𝑆−4𝑆2
𝐾 𝑃𝐻2𝑂 −4
2.37
The equilibrium constant can be determined by using the theoretically obtained Equation 2.37
with the experimental data obtained from the thermogravimetric analysis [84]. From the
thermogravimetric analysis, the concentration of protonic defects at a fixed water vapour and
oxygen partial pressure can be obtained from the mass change of sample using the following
equation:
𝐶𝑂𝐻𝑂• = 2𝑀𝑠𝑎𝑚𝑝𝑙𝑒
𝑀𝐻2𝑂
∆𝑤
𝑤𝑠𝑎𝑚𝑝𝑙𝑒 2.38
Where 𝑀𝑠𝑎𝑚𝑝𝑙𝑒 and 𝑀𝐻2𝑂 are the molar mass of the perovskite material and water,
respectively, 𝑤𝑠𝑎𝑚𝑝𝑙𝑒 is the mass of the sample and ∆𝑤 is the mass change of the sample. The
change in weight of the sample is measured as a function of time at a fixed water and oxygen
partial pressure. When the weight of the sample reaches a stable value by time, the
equilibrium is assumed between the sample and gas phase. The weight of the sample at
equilibrium at each condition is obtained and used to calculate concentration of protonic
defects via Equation 2.38. Similar approach can be applied to determine concentration of
oxygen vacancies at a fixed oxygen partial pressure using the thermogravimetric
measurements. From Equation 2.32, the equilibrium constant can be found.
The equilibrium constant, K, for hydration reaction given in Equation 1.1 can also be
calculated from [85]:
𝐾 = 𝑒−(∆𝐻
𝑅𝑇+∆𝑆
𝑅)
2.39

34
Where, ∆𝐻 and ∆𝑆 represents hydration enthalpy and entropy, respectively. Hydration
enthalpy and entropy has been obtained by using different experimental techniques (i.e.
dilatometry, conductivity, TGA measurements) at various temperatures and doping levels in
literature. Those values are discussed in the next section.
2.5.2 Reported Literature Values
The hydration enthalpy and entropy are studied by a few research groups listed in Table 2.3.
The hydration enthalpy and entropy of BCY membrane as a function of yttrium doping level
(0< x <0.2) was reported by Kreuer et al [86]. The hydration enthalpy and entropy that they
found were ∆𝐻⁰ =–162.2 𝑘𝐽/𝑚𝑜𝑙 and ∆𝑆⁰ =–166.7 𝐽/𝑚𝑜𝑙 𝐾. Their findings suggested that
the hydration enthalpy and entropy does not show significant change with temperature and
doping level has a weak impact on hydration thermodynamics.
Coors et al [20] performed conductivity and dilatometry measurements for BaCe0.9Y0.1O3-δ
(BCY10) at the temperature range of 300–1000 °C. They calculated hydration enthalpy and
entropy of BCY10 as ∆𝐻⁰ =–156.1 𝑘𝐽/𝑚𝑜𝑙 and ∆𝑆⁰ =–145.2 𝐽/𝑚𝑜𝑙 𝐾 using dilatometry,
where the lattice expansion was correlated with respect to a dry sample. They attributed the
difference in data with Kreuer et al [86] to thermogravimetric analysis where weight gain is
used to determine hydration thermodynamics and water entrance into the pores may result in
overestimation of data. A few years later, Ricote et al [87] reported a hydration enthalpy of
– 123 𝑘𝐽/𝑚𝑜𝑙 and entropy of – 113 𝐽/𝑚𝑜𝑙 𝐾 for BCY10.
More recently, Kjolseth et al [22] also studied the hydration enthalpy of BaZr0.9Y0.1O3-δ
(BZY10) at the temperature range of 300–900 °C and BCY10 at 600 °C. The authors reported
standard hydration enthalpies as ∆𝐻⁰ =–81 ± 4 𝑘𝐽/𝑚𝑜𝑙 for BZY10 and ∆𝐻⁰ =–170 ±
6 𝑘𝐽/𝑚𝑜𝑙 for BCY10 and concluded that hydration enthalpies of samples are independent of
temperature which is in agreement with Kreuer`s findings.

35
The data for entropy of hydration is in line with Norby`s baseline [88] where it is given as
∆𝐻⁰ =–120 ± 40 𝐽/𝑚𝑜𝑙 𝐾, however, there are still some discrepancies in the values. It was
suggested by Yamazaki et al [89] that the scatter in data might be due to barium deficiency
over A and B sites or oxygen incorporation. Norby et al [88] also investigated about 40
perovskite systems to identify any relation between hydration enthalpy and entropy, however
they could not find any relation between them.
The differences in values for hydration enthalpy and entropy between Kreuer et al [86] and
Ricote et al [87] as given in Table 2.3 can be due to doping level and/or cerium content.
Yttrium may sit on both A and B sites, however, only B sites doping contributes oxygen
vacancy formation and so thus hydration of the sample. In addition doping level has an effect
on conductivity measurements (e.g. affects proton mobility). Therefore, the effective doping
level can effect hydration thermodynamics which are usually determined by doing
conductivity and hydration measurements. This implies that sample preparation, density of the
sample and experimental conditions have an influence on reported values.
Table 2-3: Summary of experimental results for hydration thermodynamics of BCY10 and BZY10.
Authors Material ∆𝐻⁰ 𝑘𝐽/𝑚𝑜𝑙 ∆𝑆⁰ 𝐽/𝑚𝑜𝑙. 𝐾
Kreuer et al (1999) [86] BCY10 -162.2 -166.7
Coors et al (2005) [20] BCY10 -156.1 -145.2
Ricote et al (2009) [87] BCY10 -123 -113
Kjolseth et al (2010) [22] BCY10 -170 –
Kreuer et al (1999) [86] BZY10 -75.7 -86.2
Schober et al (2000) [90] BZY10 -74.2 -86.8
Kjolseth et al (2010) [22] BZY10 -81 –
The diffusion coefficients of species within these materials were mostly obtained by the
means of conductivity measurements in literature. The total conductivity is measured with
various water contents under an electrical driving force. The contribution of oxygen ion

36
vacancies is determined as a function of water content and subtracted from the total
conductivity. The diffusion coefficient of protonic defect is then calculated from the
remaining conductivity on the water content. Oishi et al [91] measured the mobility of each
defect species from electrical conductivity and calculated the diffusion coefficients using the
Nernst–Einstein equation which relates partial conductivity of species to mobility of species
and then diffusion coefficients. The diffusion coefficients of defects were reported for BCY10
at 700 °C by a few researchers. Kreuer et al [92] reported the diffusion coefficient of oxygen
vacancy as 𝐷𝑉𝑜•• = 5 × 10⁻⁵𝑐𝑚2/𝑠, Coors et al [20] used AC impedance spectroscopy and
found the values of 𝐷𝑉𝑜•• = 5 × 10⁻⁶𝑐𝑚2/𝑠 and 𝐷𝑂𝐻𝑜• = 1.7 × 10⁻⁶𝑐𝑚2/𝑠 , Oishi et al [91]
reported those values as 𝐷𝑉𝑜•• = 8 × 10⁻⁶𝑐𝑚2/𝑠 and 𝐷𝑂𝐻𝑜• = 1 × 10⁻⁵𝑐𝑚2/𝑠 and Grimaud et
al [93] reported the diffusion coefficient of oxygen vacancy as 𝐷𝑉𝑜•• = 6.6 × 10⁻⁶𝑐𝑚2/𝑠.
All the techniques that were used in those measurements have their own limitations. A TGA
technique involves measuring the weight change of a sample upon exposure to a humid
atmosphere which may result in overestimation of data due to water entrance into pores of the
sample. Another method is AC conductivity measurement which is an indirect method and
requires correlation of conductivity data with equivalent circuits. In most cases, the data of the
material is not ideal and requires appropriate data fitting techniques [56]. This correlation
reduces the reliability of data and brings difficulties on data interpretation. On the other hand,
DC conductivity measurements are unable to distinguish between bulk and grain boundary
conductivity since only total conductivity can be measured.
Apart from electrical conductivity measurements, Secondary Ion Mass Spectroscopy (SIMS)
was also employed to measure diffusion coefficients of species in literature. In this technique,
the sample is exposed to an atmosphere which contains isotopes of diffusing species for a
certain time. Then the sample is removed and bombarded with ion beam which creates
secondary ion flux emitted from the surface or near the surface of the sample [94]. This is
then fed to the mass spectrometer. The ratios of isotopes are recorded while the ion beam
penetrates into the sample from which the depth profile can be obtained. By correlating
sample exposure time with isotopic ratio and using Fick`s second diffusion law, the
coefficients of species can be obtained [95]. However, this is a very expensive technique and
not available in most research laboratories.

37
We move the research beyond determination of hydration properties of materials and
conductivity measurements, and further investigate water permeation capabilities of disc
shaped membranes for practical membrane applications by studying the effects of presence of
electrodes (surface treatments –surface reactions) on either side (feed or permeate) and on
both sides of the membrane on water permeation over the temperature range of 500–800 °C
which has not been investigated so far. In addition, the diffusion coefficients of defects are
determined by applying a different method from literature which is cheaper and an effective
way for providing in–situ and real time data. Also, the feasibility of using permeated water for
reforming of fuels as well as the possibility of solving problems regarding with internal
reforming is studied. Moreover, operations of fuel cells with various fuels (i.e. hydrogen,
carbon monoxide, and methane) with simultaneous water permeation are carried out.
2.5.3 Modelling
The chemical diffusion coefficient of water was derived by Kreuer et al [82], based on the
assumption that ambipolar diffusion of protonic defects and oxygen vacancies and ignoring
the volume change during water absorption as follows (see derivation in Appendix B);
��𝐻2𝑂 = (2−𝑋)𝐷𝑂𝐻𝑜
• 𝐷𝑉𝑜••
𝑋𝐷𝑂𝐻𝑜• +2(1−𝑋)𝐷𝑉𝑜
•• 2.40
Where 𝐷𝑂𝐻𝑜• and 𝐷𝑉𝑜•• are the diffusion coefficient of protonic defects and oxygen vacancies
and 𝑋 represents the degree of hydration which is defined as the fraction of oxygen vacancies
in the dry state filled by 𝑂𝐻− groups.
The chemical diffusion coefficient of water can be obtained using the equation above under
some conditions such as small oxygen vacancy concentration and no defect interactions. In
humidified oxygen environment such as in fuel cells, the model may not be valid since
incorporation of oxygen may compete with water dissolution reaction and ambipolar diffusion
may not exist under these conditions.

38
Coors [81] produced an equation for the molar flux of permeated water by using Fick`s first
law for steady state diffusion, assuming that the molar flux of permeated water depends on
membrane thickness.
𝐽𝐻2𝑂 = −��𝐻2𝑂𝛻𝐶𝐻2𝑂 2.41
By using the relationship between concentration and the chemical diffusion coefficient of
water and integrating the equation across the membrane thickness the following equation can
be written;
𝐽𝐻2𝑂 = − 1
∆𝑥 ∫ ��𝐻2𝑂
𝐶𝐼𝐼
𝐶𝐼
(𝐶)𝑑𝐶 2.42
Where ∆𝑥 is the membrane thickness, I and II represent wet and dry surfaces of the
membrane, respectively.
By inserting the expression for ��𝐻2𝑂 into Equation 2.42:
𝐽𝐻2𝑂 = − 𝐷𝑂𝐻𝑜•𝐷𝑉𝑜••
∆𝑥 ∫
(𝛾 − 𝐶)𝑑𝐶
𝑎𝑐 + 𝑏
𝐶𝐼𝐼
𝐶𝐼
2.43
The final solution can be obtained by integration as follows:
𝐽𝐻2𝑂 = 𝐷𝑂𝐻𝑜
• 𝐷𝑉𝑜••
∆𝑥 (𝐷𝑂𝐻𝑜• −2𝐷𝑉𝑜
••) [(𝐶𝐼𝐼 − 𝐶𝐼) + (
𝑏
𝑎+𝛾)𝑙𝑛 [
(𝑎𝐶𝐼+𝑏)
(𝑏𝐶𝐼𝐼+𝑏)]] 2.44
Where, 𝛾 = 2[𝑌𝐶𝑒′ ], 𝑎 = (𝐷𝑂𝐻𝑜• − 2𝐷𝑉𝑜••) and 𝑐 = 2𝐷𝑉𝑜••.

39
Equation 2.44 shows that the water flux is inversely proportional to membrane thickness.
Therefore water permeation experiments are conducted in this study for different bare BCY20
membrane thicknesses to verify this hypothesis. It was observed that as the membrane
thickness increases, water permeation decreases (see appendix C) which indicates that bulk
diffusion reduces the overall water permeation for thicker membranes.
2.6 Summary
The demand for clean energy production from fuel cells require solving problems associated
with existing materials or implementing new materials. Based on all the reviews in this
chapter, oxide ion conducting SOFC electrolytes especially YSZ has limitations in terms of
becoming commercially viable. Efforts have been made to overcome those limitations,
however, that increased the price of the system. Doped barium cerates have been shown as
good proton conductors and considered to be good electrolyte materials for SOFCs. Doping
with lower valent cation creates oxygen vacancies to satisfy electro neutrality condition which
allows this material to be able to permeate water from high water partial pressure surface to
low water partial pressure surface. By using barium cerate as an electrolyte with given
electrode materials, this specific feature of the material may be applied to overcome
previously mentioned limitations with internal reforming. There are some work based on
barium cerates to clarify its conductivity, however, no comprehensive work has been done to
investigate this material as a water permeator and an electrolyte in SOFCs. Furthermore, a
detailed study of stability and durability of barium cerate under reducing and oxidising
conditions will be carried out by post operation analysis.

40
Chapter 3
Methodology
This chapter describes the material preparation and methods used for the membrane based
experiments in addition to the experimental set up. The details of membrane fabrication, the
experimental set up, the surface modification and the list of experiments are given in Section
3.1. The analysis system used in the experiments to collect data is also described in Section
3.1. The characterisation techniques used to identify the crystal structure and the morphology
of the membrane before and after the experiments are detailed in Section 3.2. The
investigation of high temperature membrane sealants, a curial step to be able to perform
membrane based experiments in the laboratory was carried out systematically in Section 3.3.
3. 1 Experimental
3.1.1 Membrane Preparation
The electrolyte pellets were prepared uniaxially by pressing approximately 2.2 g of BCY20
and BCY10 powders at 3 tons using a 20 mm diameter die. The final green discs were
approximately 2 mm thick and after a sintering program the final diameter and thickness were
approximately 1.4–1.6 mm. The pellets were sintered by following the program below under
ambient air.

41
1 Ramp to 1450 °C at a rate of 1 °C/min
2 Dwell at 1450 °C for 12 hrs
3 Ramp to room temperature at a rate of 1 °C/min
The sintering temperature of the membrane is chosen high in order to get a dense and uniform
structure. The geometric dimension and mass of the pellets were used to estimate the density.
The relative density of BCY pellet was more than 95% of the theoretical density (6.154 g/cm3
[72]). After the sintering process, the pellets (solid electrolytes) were polished using a SiC
sand paper with a grit of 600, washed with deionised water. The mass of sample was
measured after drying the sample.
3.1.2 Experimental Set up
3.1.2.1 Membrane Reactor
A two–chamber reactor design with two gas compartments, i.e. feed side (water introduced)
and permeate side (water permeated), was used in this study as shown in Figure 3.1a. The
membranes were bonded to an alumina tube with 8 mm ID and 12 mm OD. The gas tightness
of the membranes was ensured by using the prepared ceramic sealants around the alumina
tube and the membrane as described in Section 3.3. This alumina tube was then placed in a
quartz tube as shown in Figure 3.1a. The volume of this quartz reactor was about 50 cm3. O–
rings (Viton) were used between the tubes and the Swagelok fittings to prevent gas leak. The
final reactor was inserted into a tube furnace vertically (Vecstar Furnaces, UK). The
temperature of the reactor during the experiments was controlled by using a digital
thermometer (Kane–May KM340) connected to a K–type thermocouple. The reactor module
shown in Figure 3.1b was modified slightly for the polarisation/fuel cell experiments. The
electrode connections were enabled to the Ivium potentiostat/galvanostat by the gold wires
purchased from Alfa Aesar and insulated by using a one bore and two bores alumina tubes. A
gold mesh (Pi–kem) was used as a current collector connected to the working and the counter
electrodes.

42
Figure 3.1: Schematic of the dual chamber membrane reactor a) Membrane based permeation/reaction
experiments; a two–chamber reactor design with two gas compartments, i.e. feed side (water
introduced) and permeate side (water permeated) was used. The membranes were bonded to an
alumina tube. The gas tightness of the membranes was ensured by using the prepared ceramic sealants
around the alumina tube and the membrane. This alumina tube was then placed in a quartz tube. b)
Reactor design for fuel cell/polarisation experiments; platinum was painted on both sides of the
sintered membrane covering an area of 0.5 cm2 as cathode and anode and platinum was also painted as
a reference electrode with an area of 0.05 cm2. Gold mesh connecting with a gold wire was attached to
each side of the membrane as a current collector.
3.1.2.2 Experimental Rigs
The schematics of the experimental rigs used in this study are shown in Figure 3.2a and
Figure 3.2b. The stainless steel tubing was used for heated lines and Perfluoroalkoxy (PFA)
tubing was used for the other gas connections in the rigs. The flow rates of gases were
controlled by the Chell Hastings electronic mass flow controllers (MFCs). The flow rates of
gases were also checked at the outlet using a Varian digital flow meter (1000 series). Water
level was controlled with a Grant Instrument (Grant Scientific, UK) water bath. The

43
concentration of water leaving the water bath was controlled by changing the water bath
temperature. Three percent water concentration was obtained at about 25 °C of water bath
temperature. The inlet tubes were heated to 80 °C by wrapping the lines with heated tapes in
order to avoid water condensation and a Cole–Parmer CRS moisture trap was used to capture
the moisture in the permeate side stream before the membrane reactor. The total flow rates of
the feed and permeate gas streams were 100 ml (STP)/min. All the experiments were
performed under atmospheric pressure. The gases were analysed using two dew point
hygrometers (Vaisala HMT330, Finland) and a mass spectrometer (Thermostar TM, Pfeiffer
Vacuum).

44
Figure 3.2: Detailed schematics of the experimental rigs compose of gas supplies, feed control, water
saturator, furnace, membrane reactor, gas analysis and PC control for a) Permeation/reaction
experiments, b) Fuel cell/ polarisation experiments.
3.1.3 Catalytic Membrane Surface Modification for Water Permeation and Water Gas Shift
Reaction Experiments
Platinum resin obtained from ESL Europe (type 5542–print grade) was applied onto the
membrane surface in different configurations using a small fine brush. The membranes were
then heated up using a programmed temperature ramp of 20 °C min-1 to 980 °C, held for 10
min, then 20 °C min-1 to 25 °C to sinter platinum metal onto the membrane surface. The four
different membrane configurations were prepared for water permeation and water gas shift
reaction as without any platinum, platinum on both sides, platinum is only on the permeate
side and platinum is only on the feed side as shown in Figure 3.3.

45
Figure 3.3: Catalytically modified and unmodified membrane systems for water permeation and water
gas shift reaction experiments a) without any platinum, b) platinum is applied on both sides, c)
platinum is applied only on the permeate side, d) platinum is applied only on the feed side (Platinum
surfaces are sintered at 980 °C for 10 min) The compositions of feed gases to both sides of the
membrane and associated permeation and reactions are also shown.
3.1.4 List of Experiments
a) Hydration Experiment for the Model
The commercial BCY20 powder was purchased from Marion Technology (France) and was
used to prepare BCY20 membrane. BCY10 powder was prepared via solid state method using
BaCO3 (99%, Aldrich), CeO2 (99%, Aldrich), and Y2O3 (99%, Aldrich). The precursors were
mixed in an appropriate ratio and ground with ethanol. The mix was ball milled for 4 hrs and
then calcined at 1300 °C for 10 hrs. Both membranes were prepared by uniaxial pressing of 2
g of BCY powder at 3 tons using a 20 mm diameter die and were sintered at 1450 °C for 12
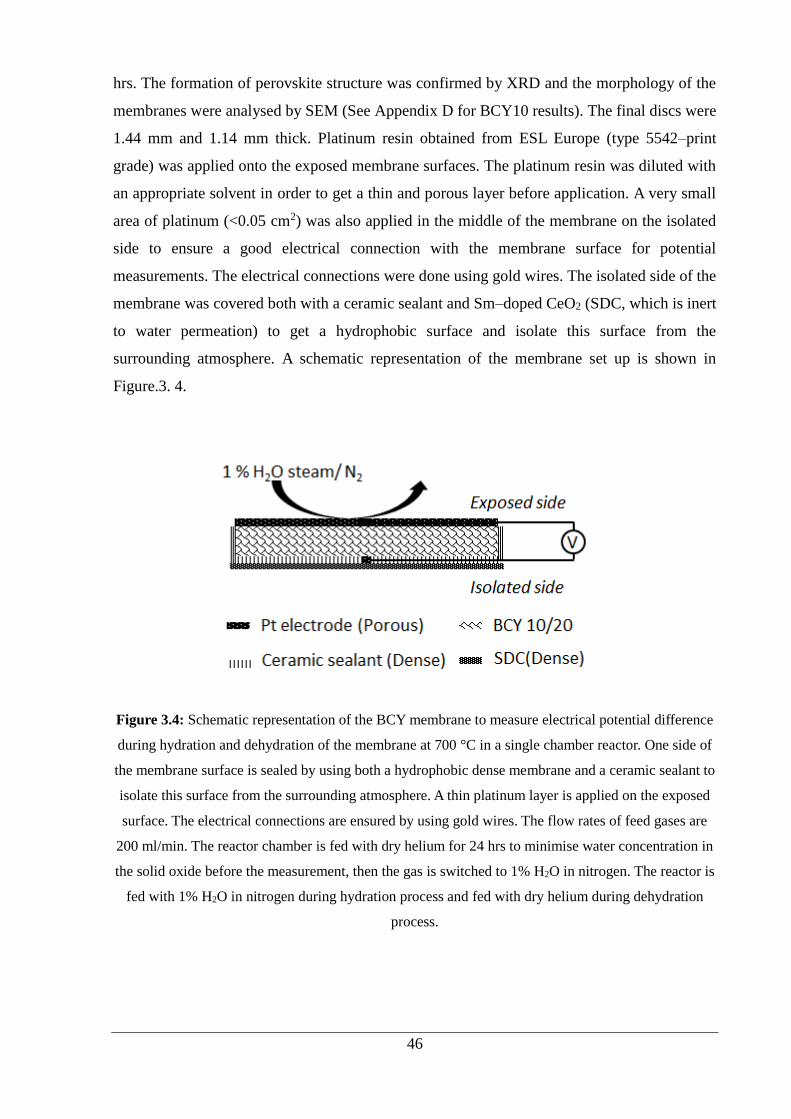
46
hrs. The formation of perovskite structure was confirmed by XRD and the morphology of the
membranes were analysed by SEM (See Appendix D for BCY10 results). The final discs were
1.44 mm and 1.14 mm thick. Platinum resin obtained from ESL Europe (type 5542–print
grade) was applied onto the exposed membrane surfaces. The platinum resin was diluted with
an appropriate solvent in order to get a thin and porous layer before application. A very small
area of platinum (<0.05 cm2) was also applied in the middle of the membrane on the isolated
side to ensure a good electrical connection with the membrane surface for potential
measurements. The electrical connections were done using gold wires. The isolated side of the
membrane was covered both with a ceramic sealant and Sm–doped CeO2 (SDC, which is inert
to water permeation) to get a hydrophobic surface and isolate this surface from the
surrounding atmosphere. A schematic representation of the membrane set up is shown in
Figure.3. 4.
Figure 3.4: Schematic representation of the BCY membrane to measure electrical potential difference
during hydration and dehydration of the membrane at 700 °C in a single chamber reactor. One side of
the membrane surface is sealed by using both a hydrophobic dense membrane and a ceramic sealant to
isolate this surface from the surrounding atmosphere. A thin platinum layer is applied on the exposed
surface. The electrical connections are ensured by using gold wires. The flow rates of feed gases are
200 ml/min. The reactor chamber is fed with dry helium for 24 hrs to minimise water concentration in
the solid oxide before the measurement, then the gas is switched to 1% H2O in nitrogen. The reactor is
fed with 1% H2O in nitrogen during hydration process and fed with dry helium during dehydration
process.

47
The potential measurements were done by using an electrochemical workstation in a single
chamber reactor at 700 °C and at atmospheric pressure. The reactor was fed with 1% H2O in
nitrogen during hydration process and with dry helium during dehydration process. The total
flow rates of gases were 200 ml/min. The reactor was fed with dry helium for 24 hrs to
minimise water concentration in the solid membrane before the measurement, then the gas
was switched to 1% H2O in nitrogen. Water level was controlled with a Grant Instrument
water bath by varying the temperature and the inlet tubes were heated by wrapping the lines
with heated tapes in order to avoid water condensation in line during hydration process. A
moisture trap was used to ensure that helium gas was dry before entering the reactor. A blank
experiment was performed with an Al2O3 membrane following the same experimental
procedure in order to verify electrical potential changes of BCY membranes.
b) Water Permeation Experiments
Water permeation experiments were conducted with 1mm thick membranes with and without
catalytic surface modification shown in Figure 3.3 in the temperature range of 500–800 °C.
Dry helium (BOC, UK) was fed to the permeate side as sweep gas and 3% H2O in nitrogen
(BOC, UK) was fed to the feed side of the membrane reactor. The total flow rates of the feed
and permeate gas streams were 100 ml (STP)/min. Water level in the feed stream was
controlled with the Grant Instrument water bath. The permeate side outlet stream water mole
fraction and feed side inlet stream water mole fraction were monitored by using dew point
Vaisala hygrometers, hygrometer 1 and hygrometer 2, as shown in Figure 3.2a. The water
permeation fluxes as a function of temperature were measured. Measurements were taken at
each temperature after the steam flux reached a stable value. The water on the feed side was
kept as 3% for all membranes.
In order to make sure that the hygrometer works efficiently and calculate any possible
deviation in readings, the reading of hygrometer was compared to the theoretical value of
water vapour at a specific temperature and associated error in readings of hygrometers is
calculated as follows:

48
%𝐸𝑟𝑟𝑜𝑟 =|𝑇𝑣 − 𝐸𝑣|
𝑇𝑣 × 100%
3.1
Where, 𝑇𝑣 is the theoretical value of water vapour concentration and 𝐸𝑣 is the experimental
value of water vapour concentration at a specific temperature. The calculated error percentage
for hygrometers is maximum 3% of readings (See Appendix E).
The mass spectrometer was connected to the permeate side hygrometer (hygrometer 2) to
check any possible leak from feed side to permeate side. The nitrogen leak (feed) to the
helium side (permeate) was monitored by the mass spectrometer during the experiments.
Before every experiment, a leak test was performed at the operating temperature and any
possible leak was monitored during the experiments. If there was any leak, the data was
corrected as shown in Equation 3.2. It was assumed that the amount of water leaking to the
permeate side is similar to the amount of nitrogen leaking to the permeate side. The molar
flux of water, 𝐽𝑥, is determined by using the mole fractions (𝑥), on the feed and permeate side
as follows:
𝐽𝑥 = [𝑥]𝑜𝑢𝑡𝐹1
𝑉𝑚
1
60
1
𝑆𝐴 3.2
where [𝑥]𝑜𝑢𝑡 = 𝑥(𝐻2𝑂)𝑝𝑒𝑟𝑚 − 𝑥 (𝑁2)𝑝𝑒𝑟𝑚𝑥(𝐻2𝑂)𝑓𝑒𝑒𝑑
𝑥(𝑁2)𝑓𝑒𝑒𝑑 with 𝑥(𝐻2𝑂)𝑝𝑒𝑟𝑚 is the water mole
fraction and 𝑥 (𝑁2)𝑝𝑒𝑟𝑚 is the nitrogen mole fraction on the permeate side. 𝑥(𝐻2𝑂)𝑓𝑒𝑒𝑑 is the
mole fraction of water and 𝑥(𝑁2)𝑓𝑒𝑒𝑑 is the mole fraction of nitrogen on the feed side. 𝐹 is
the flow rate of the feed gas on the permeate side in ml (STP)/min, 𝑉𝑚 is the molar volume (1
mole equals to 22,400 ml at STP), the 1/60 factor is to convert the rate from minutes to
seconds and finally SA designates the flux area, cm2 (the active area of the membrane surface
which was exposed to water).

49
c) Membrane Based Water–Gas Shift Reaction Coupled with Water Permeation
Experiments
Membrane based water–gas shift experiments coupled with water permeation were conducted
using the membrane configurations in Figure 3.3 (Section 3.1.3) and the experimental set up
illustrated in Figure 3.2a (Section 3.1.2) with a 1.2 mm thick membranes. The membrane
module was placed inside the furnace which was used to heat the membranes to 900 °C with a
heating rate of 1 °C/min and then hold for 30 min so as to soften the sealant. The temperature
then was decreased to the operating temperature of 700 °C with ramp of 1 °C/min. Every
heating up and cooling down process was performed by using helium and argon at a flow rate
of 20 ml (STP)/min to protect both catalysts from undergoing any oxidation reaction.
The membrane reactor consists of two gas compartments which were separated by the BCY20
membrane; feed side and permeation side. The outlet of the permeate side was monitored by
using one of the hygrometer and the mass spectrometer. The second hygrometer was used to
monitor water inlet on the feed side. The leak rate was followed by checking the argon level
on the permeate side. All experiments were carried out at a fixed temperature of 700 °C under
atmospheric pressure on both sides of the membrane.
The membrane based water gas shift experiments coupled with water permeation experiments
were carried out in three steps as shown in table 3.1. Each step was given the time period to
reach a steady state mole fraction of outlet gases on the permeate side (the change in mole
fraction less than 10 ppm per minute in the outlet gases on the permeate side). In step one, dry
helium and dry argon were supplied to feed and permeate side of the membrane, respectively.
In step two, feed side stream was switched to 3% H2O in argon. In step three, 1% carbon
monoxide in helium was introduced to (5% carbon monoxide in helium was diluted with
helium to obtain about 1% carbon monoxide in helium) to the permeate side. The gases were
supplied at a total flow rate of 100 ml (STP)/min.

50
Table 3-1: Experimental procedure for membrane based water–gas shift experiments coupled with
water permeation.
Step One Step Two Step Three
Permeate side stream
composition
dry He dry He 1% CO in He
Feed side stream
composition
dry Ar 3% H2O in Ar 3% H2O in Ar
Additional experiments were also performed at the temperature of 25 °C and 700 °C to
evaluate the influence of diluting 5% carbon monoxide to 1% carbon monoxide in helium and
find best flow rates and operating procedure (i.e. manual valve switching) to mix the gases.
The mole fractions of outlet gases (𝑥) are converted into the rate of product formation
(nmol/cm2s) by using the flow rates of gases and active membrane surface area (see Equation
3.3). It should be noted that there could be a contribution to carbon dioxide production
significantly due to a reaction between the reducing gas (carbon monoxide) and
sealant/membrane or carbon monoxide disproportionation. Thus, for a realistic calculation of
carbon dioxide production from water gas shift reaction, these contributions should be
subtracted. In order to determine this contribution to carbon dioxide rate (𝑦), immediately
after step three, 3% H2O in argon was switched to argon in the feed side during all
experiments and the obtained average carbon dioxide mole fraction was subtracted from the
mole fraction of carbon dioxide in step three in order to calculate the rate of carbon dioxide
formation due to water permeation coupled with water–gas shift reaction. After that these
values were subtracted from the mole fractions of products in step three the rate of products
was calculated using Equation 3.3 where 𝐹 is the flow rate of the feed gas on the permeate
side in ml (STP)/min, 𝑉𝑚 is the molar volume (1 mole equals to 22,400 ml at STP), the 1/60
factor is to convert the rate from minutes to seconds and finally SA designates the flux area,
cm2 (see Appendix F). The mole fractions of permeate side outlet gases were recorded with
the mass spectrometer. The maximum and minimum error associated with readings of mass
spectrometer is 10%.
𝐽𝑥 = [𝑥 − 𝑦]𝐹1
𝑉𝑚
1
60
1
𝑆𝐴 3.3

51
The performances of membrane reactors were compared in terms of the rate of products
formed due to water permeation. Following the experiments the membrane reactors were
removed for post operation analysis. The membrane surfaces on the feed and permeate side
were analysed by XRD, SEM and EDXS analysis.
d) Polarisation/ Fuel Cell Experiments
The BCY20 disc membrane was prepared with a thickness of 1.4–1.6 mm and then polished
to a thickness of 0.5 mm with an abrasive grinding paper (SiC, 600 grit). Platinum was
painted on both sides of the sintered membrane covering an area of 0.5 cm2 as cathode and
anode and a platinum resin was painted as a reference electrode with an area of 0.05 cm2. The
three–electrode set up was prepared as shown in Figure 3.1b. A three–electrode cell composed
of an anode, cathode, and reference electrode (working and counter electrodes were deposited
symmetrically to serve as cathode/anode, the reference electrode was deposited near the edge
of the pellet) was used to determine the overpotentials of the electrodes. Platinum was used as
the electrode materials. By using a third electrode (RE), it is possible to measure the
overpotentials of anode and cathode.
The ohmic–free overpotentials of electrodes were determined by ɳ= VWR - OCP - IR, where
VWR is the potential applied with respect to the reference electrode, OCP is the open circuit
potential and IR is the voltage drop between the working electrode and the reference
electrode. The ohmic resistance of the electrolyte was determined by current interruption
technique. The electrical resistance of the electrodes is negligible since platinum is a good
electronic conductor. A gold mesh connecting with a gold wire was attached to each side of
the membrane as a current collector. The gold wires leading from the electrodes were
connected to the potentiostat/galvanostat (Ivium Compactstat with booster). The accuracy of
Ivium compactstat in measured current/potential is 0.2%. The experiments were conducted
using the dual chamber reactor shown in Figure 3.1b.
The experiments were performed at a fixed temperature of 700 °C. The current–voltage
characteristics were obtained by DC measurements for each cell configuration shown in

52
Figure 3.5. The performance of the fuel cell modules were evaluated by measuring the OCP
and the current associated with the application of potentials from OCP to 0 V with 1 mV/s
steps. The simultaneous transport of oxygen and water from cathode to anode for fuel cell
applications was investigated by employing the oxygen electrochemical pump technique. The
potential was applied between 0 V and -1 V with 100 mV steps and an acquisition time of 200
s per voltage level between working and reference electrode (counter and reference electrodes
were placed at the anode side). The current density was calculated based on geometric area of
cathode (0.5 cm2). In order to obtain the overpotential of the working electrode, the
contribution of the ohmic loss was subtracted. The ohmic loss was mainly due to the
electrolyte since the thick electrolyte was used for experimental convenience.
Figure 3.5: Cell configurations for dc measurements. a) Helium is fed to anode and 3% H2O in argon
is fed to cathode to investigate the effect of polarisation on water permeation. b) Helium is fed to
anode and air is fed to cathode to determine oxygen evolution at the anode under polarisation. c) 3%
H2O and air are fed to cathode together to investigate effect of one to other and to carry out
comparison with a & b. d) Finally, various fuels (hydrogen, carbon monoxide, methane) are
individually fed to anode for fuel cell measurements.

53
Operation with excess current could damage the membrane. Therefore, a preliminary
experiment was conducted to determine the range of the applied potential between 0 V and -2
V. However, the limiting current was not determined under these conditions since this requires
the application of voltages beyond -2 V which will give a current beyond the limitation of
Ivium Compactstat.
Zero grade gases (impurity less than 10 ppm) were supplied by BOC/UK with a composition
of 20.5% oxygen and 79.5% nitrogen. Inlet water was controlled using the water bath and
monitored with the hygrometers. Before the introduction of gases to the chambers, dry gas
(helium) was passed across the membrane to remove residual water vapour at the operating
temperature for 2 hrs. The hydrogen, oxygen and water concentration were evaluated by the
mass spectrometer and the hygrometers (Vaisala, Finland) at the anode outlet as shown in
Figure 3.2b. The anode side outlet was monitored with a hygrometer and a mass spectrometer.
The outlet gas concentrations were monitored. The stable readings were taken as the
concentrations at each applied potential. Similar calculation was carried out for oxygen
evolution. For known gas flow rate and the gas concentration at the anode side the oxygen
evolution can be obtained using Equation 3.2 given in the previous section.
3.1.5 The Analysis System
Mass spectrometry was used in order to identify the product gases leaving the membrane
reactor in the permeate side in this study. For the analyses of the outlet gases, the mass
spectrometry was the suitable equipment due to the suitable response time and accuracy. It
can detect the change in gas composition as low as 0.5 s.
In the mass spectrometer, a sample of gas enters into the vacuum chamber, and then these
neutral particles in the sample are bombarded with low energy electrons that are emitted by
the filament to produce ions. The positively charged ions are accelerated in an electric field.
The ions are then separated according to their mass to charge (m/e) ratio by the four rod
electrodes before the detector. The separated ions are detected by the ion detector. The data
recorded by the mass spectrometer can be converted into the mole fractions by the software.
First step of calculating mole fraction of a specific mass is to calculate partial pressure of that

54
mass. Partial pressure of a specific mass shows relative amount of that mass as a fraction of
total. The total pressure is measured in the total pressure plate mounted in the ion source.
Finally, an algorithm is used to calculate partial pressures by taking into account the peak
intensity, the ionisation probability, the fragmentation factor and a transmission factor [96].
The calibration of the mass spectrometer was carried out before every experiment. The mass
spectrometer was calibrated for water permeation experiments by using a standard calibration
gas mixture of; 2% nitrogen, 2% oxygen, 1% hydrogen balance in helium. For water gas shift
experiments, the calibration was performed using 2% methane, 2% carbon monoxide, 2%
oxygen, 2% carbon dioxide, 2% hydrogen balance in helium standard calibration gas mixture
and individual 1% argon gas calibration balanced with helium. The carrier gas was helium for
all membrane based experiments. The calibration was performed by using the same flow rate
as the experiments (See Appendix G for calibration plots).
The water content of the feed stream leaving the water bath and the water content of permeate
stream leaving the membrane reactor were monitored by a dew point hygrometer (Vaisala
HMT337) which has an accuracy of ±0.2 °C of the dew point. The unit was self–calibrated
and calibrated by comparing the readings of the instrument to working standards of the
manufacturer (Vaisala Oyj, Finland). To ensure that the hygrometers were working efficiently
and precisely; they were checked regularly with each other and send back to the manufacturer
for calibration.
3.2 Analytical Techniques
This section describes the characterisation techniques that used to analyse microstructure,
morphology and chemical composition of the membranes.

55
3.2.1 X–Ray Diffraction (XRD)
X–rays are electromagnetic radiation which has wavelengths in the Angstrom range (10-10m).
X–rays are generated by bombarding a metal with high energy electrons [97]. The electrons
slow down as they plunge into the metal and collide with the electrons from the inner shell of
an atom. This collision of incoming electrons with the electrons creates electron vacancy and
an electron with high energy drops into the vacancy and emits the excess energy as an x–ray
photon [98].
X–ray diffraction (XRD) is a technique used to measure approximate space between layers
and rows of atoms to determine the crystal structures, orientation of the crystal structures and
measure the size, shape and stress in the crystal structure. Every structure reflects the x–rays
at specific angles which gives the characteristic of the sample. When the incident x–ray hits
the lattice plane, the reflection happens in the same angle as shown in Figure 3.6. The spacing
between two lattices is expressed by Bragg`s law.
n λ=2 d sinθ 3.4
Where d represents the distance between the planes, θ represents the incident angle, λ is the
wavelength of the beam and n is an integer.

56
Figure 3.6: Bragg diffraction [97]
When the geometry of incoming x–rays entering the sample fits with the Bragg equation,
constructive interference occurs and a peak is seen in the intensity. The lattice parameters can
be estimated by using Miller indices (h, l, k). Miller indices are the reciprocals of intersection
distances in the structure [98]. The relationship between lattice parameters and Miller indices
for an orthorhombic cell such as BCY10 is given below where a, b, c are the lattice
parameters.
1
𝑑ℎ𝑙𝑘2 =
ℎ2
𝑎2+𝑙2
𝑏2+𝑘2
𝑐2
3.5
In this work, XRD characterisation technique is used to determine crystallographic structure
and phase purity of the membranes before and after the experiments. A scan step size of 0.033
degrees with a scan time of 100 s per step was used to scan through 0 < θ < 90° for XRD
analysis of the membranes. The results were compared with references and the International
Centre for Diffraction Data (ICDD) database in order to determine crystal structure.

57
3.2.2 Scanning Electron Microscopy (SEM)
Scanning electron microscope (SEM) uses a beam of energetic electrons to examine samples
on a very fine scale. An electron beam is generated by an electron gun (usually tungsten) and
collimated by the condenser lens. The final magnetic lens corrects astigmatism and alignment
and focuses the beam into the sample. When the beam (primary electrons) hits the particle in
the sample, signal detection begins. The secondary electrons are detected and converted into
electronic signal and finally exhibited as an image on cathode ray tube (CRT). The screen of
the CRT has various spots called pixel which changes depending on the samples topography
[99]. SEM gives information about topography, morphology, composition and crystallography
of the samples.
In this work, SEM characterisation technique is used to determine the morphology of the
membranes before and after the experiments. Density and porosity of the membranes can be
easily seen from the SEM images of BCY20.
3.2.3 Energy Dispersive X–Ray Spectroscopy (EDXS)
Energy dispersive x–ray spectroscopy (EDXS) is a semi-quantitative analytical technique
which is commonly applied to determine chemical characterisation of a sample such as
elemental identification. In this technique, an incoming x–ray excites an electron in the inner
shell of the sample and leaves a vacancy behind. A higher energy outer shell electron then fills
this vacancy and emits a characteristic x–ray. These x–rays are unique for each element and
named based on the name of the electron shells such as K, L, and M. The number of shells
that are jumped by the electron are subscripted as α (one-shell jump), β (two-shell jump) and
so on [100]. For instance, Kα x–rays are emitted by the electron jump from the L shell to the K
shell. The number and the energy of the x–rays are measured by a detector in order to identify
elemental composition of the sample.
EDXS has been used in this study to quantify the elemental composition of the BCY20
membranes before and after the experiments so as to investigate any structural changes on the
membrane surface.

58
3.3 High Temperature Membrane Sealants
High temperature membrane sealants are crucial to obtain a gas tight membrane module for
laboratory studies. A good sealant material should have certain properties such as good
chemical compatibility with the membrane and the support tube, easy and flexible design,
similar thermal expansion coefficient to the membrane module and so on [101]. The thermal
mismatch between the membrane and the seal often causes damaging of membrane module.
Thus, it is important to ensure the membrane and the seal has similar solidity and thermal
expansion under the same operating conditions. The thermal expansion coefficient for BCY20
is reported about 14-16×10-6/K in the literature [70].
The most common used sealant materials for the membrane studies so far are gold, silver O–
rings and glass–based materials. The problems associated with these sealant materials are; O–
rings require an external compression force and glass sealants have higher melting points to
fill the gaps between the membrane and tube. In addition, it is extremely difficult to remove
the membrane without damaging after the experiments. Therefore, an investigation of sealant
material compatible with the membrane properties is necessary for the accuracy of the
measurements.
A number of sealant materials listed in Table 3.2 are tested for the membrane based
permeation/reaction experiments. The table simply displays the materials that are used to
prepare the sealants along with mixing percentages of them by weight. The preparation of disc
membrane and the test module are described in Section 3.1. All the sealants are tested using
nitrogen in one chamber and helium in the other chamber. The gas tightness of each
membrane is verified using the experimental temperature. The helium stream is analysed
using a mass spectrometer for possible nitrogen leak. All given leak rates are based on
nitrogen composition in helium. The membrane is considered gas tight if the nitrogen
concentration is less than 10 ppm in helium side.
The seal 1 and 2 are purchased from Fuel Cell Materials (70 wt. % Silver, 70 wt. % Gold) and
applied to the membrane module as shown in Figure 3.1a. The membrane module is kept at
59
the room temperature for 24 hrs to dry before placing into the reactor. After placing the
membrane into the reactor, the temperature is taken to 700 °C at a ramp rate of 1 °C/min.
Following the introduction of gases, approximately 1% leak rate is observed. The main
problem is poor bonding of silver/gold paste to the alumina tube.
Table 3-2: List of the sealants studied for BCY membrane module
Series Material , wt. % Material, wt. % Material, wt. % Observation
1 Silver, 70 - - Poor
2 Gold, 70 - - Poor
3 Toku Ceramic,
p24,50
Ceramabond
503, 50
- Moderate
4 Waterglass,100 - - Poor
5 Gold, 20 Water glass,80 - Poor
6 V4, 50 Water glass,50 - Poor
7 V8, 50 Water glass, 50 - Poor
8 Pyrex glass, 50 Water glass, 50 - Poor
9 LSCF, 20 Water glass, 80 - Poor
10 BCY20, 20 Water glass, 80 - Poor
11 BCY20, 40 Pyrex glass, 50 NaAlO2, 10 Good
12 BCY20,40 Water glass,60 - Poor
13 BCY20, 60 Pyrex, 40 - Very Good
The ceramic sealant pastes, seal 3 (Toku ceramic–p24, Aremco Ceramabond 503) are mixed
50 wt. % and applied to the counter of the alumina tube and dried 3 hrs at room temperature
and tested again at 700 °C. This mixture displays good performance under the dry gas
atmosphere, however, in the presence of steam, the leak rate increases above 1%.
The seal 4, water glass (35–45 wt. % sodium silicate (Na2SiO3), Aremco 571–l) separated on
the membrane surface and blocked the permeation/reaction area of the membrane. The gold
paste (seal 5) is applied to prevent the water glass leaking onto the membrane surface before

60
application of the water glass around the alumina tube as shown in Figure 3.7. The leak rate
obtained with this method is below 1%, but still lower than aimed in this study which is below
20 ppm.
Two sealant materials V4 and V8 (V4; 40SiO2_15B2O3_27BaO_18MgO, mol% and
40SiO2_15B2O3_27BaO_10MgO_8ZnO, mol%) provided by Instituto de Ceramica y Vidrio
are also tested as the seals 6 and 7. The sealant paste is prepared by mixing with 50 wt. %
water glass. The sealant material is found cracked after cooling the reactor to the room
temperature and the leakage is high (above 1%) compared with the sealant materials studied
previously.
Figure 3.7: Configuration of sealant application to membrane module which is applied for the seals
9-13. a) Silver paste is applied around the outer diameter of the alumina tube. Then it is kept for 24 hrs
at the room temperature to dry. b) The prepared ceramic paste is applied around the membrane as
shown. Then membrane module is placed into the reactor after 3 hrs drying at the room temperature.
The temperature is taken to the 900 °C at a ramp rate of 1 °C/min. It is kept at this temperature for 30
min and then the temperature is cooled down to 700 °C at a ramp rate of 1 °C/min.
The investigation of sealant material continued until a sealant recipe is found which has
similar properties such as thermal expansion coefficient to the membrane. Subsequently,
testing Pyrex glass which is obtained by crushing the Pyrex glass tubes (SiO2 (80.6 wt. %),
B2O3 (13 wt. %), Na2O (4 wt. %), Al2O3 (2.3 wt. %), K2O (0.1 wt. %)), seal 8, this approach
is extended involving the membrane material. The seal 8 responded in similar way as the seal
4.

61
The following curing method is applied for the seals 9-13; silver paste is applied around the
outer diameter of the alumina tube as shown in Figure 3.7a. Then it is kept for 24 hrs at the
room temperature to dry. Subsequently, a ceramic paste is prepared using the mixture given in
Table 3.2. The water glass is used as the solvent. The ceramic paste is applied around the
membrane as shown in Figure 3.7b. The membrane module is placed into the reactor after 3
hrs drying at the room temperature. The temperature is taken to the 900 °C at a ramp rate of 1
°C/min. Since the Pyrex has a melting point of 820 °C. It is kept at this temperature for 30
min and then the temperature is cooled down to 700 °C at a ramp rate of 1 °C/min.
Application of the silver paste prevented the Pyrex glass separating onto the membrane
surface and closing the reaction area as well as increasing the performance of the ceramic
sealant materials.
First attempt is carried out using the LSCF (La0.6Sr0.4Co0.2Fe0.8O3-δ) powder 20 wt. % and the
water glass 80 wt. %. The sealant is found cracked when the temperature is cooled down.
Thus, the powder is switched to BCY20 and the content of the Pyrex glass is reduced in the
mixture. From the seal 10 to 13, similar procedure is followed. The seal 13 exhibited the best
performance among them. The success is 100% (nitrogen composition in helium stream is
less than 10 ppm). There is no crack observed in the sealant material and the membrane itself
when the temperature is cooled down to the room temperature. This suggests that the thermal
expansion/shrinkage of the sealant material and the membrane are close to the each other. The
gas tightness and the bonding of the seal are achieved in the test 13.
Different sealing recipes are studied in order to find a compatible sealant material to the
BCY20 membrane and the alumina tube. The chemical and thermal properties of the seal are
significantly important to obtain a gas tight and inert sealant material under the operating
conditions for the experiments. The recipe 13 resulted in the very best performance for the
dense BCY20 membranes using the given procedure. The seal 13 is used for all the
experiments unless the otherwise is stated.

62
Chapter 4
Modelling Hydration of BCY Membranes
4.1 Introduction
In this chapter, a model is developed to calculate the diffusion coefficients for the transfer of
defects and simulate concentration distributions of defects within the BCY10 and BCY20
membranes. The multi–species mass transfer processes within BCY membranes can be
simulated using the Nernst–Planck equation. The Nernst–Planck equation with boundary
conditions is used to calculate diffusion coefficients of defects in COMSOL. All the partial
differential equations are solved numerically. This also provided the information of the
concentration distribution of the defects along the thickness of the membrane. Additionally,
the electrical potential profiles along the thickness of the membrane can also be predicted.
The model is validated experimentally. This is done by monitoring the transient behaviour of
electrical potential change during hydration of the membranes by changing the surrounding
atmosphere at the membrane surface as a function of time at a fixed temperature, until
equilibrium is reached. The experiment is performed in a single chamber reactor by isolating
one side of the membrane from the surrounding atmosphere. The transient potential difference
along the thickness of the membrane can be measured between exposed and isolated surfaces.
A potential difference is established between exposed and isolated surfaces due to
concentrations gradients of species having different diffusion coefficients.

63
4.2 Development of Model
The species mass transfer processes within BCY membranes can be simulated with the
Nernst–Planck equation. The concentration profile of protonic defects and oxygen vacancies
across the membrane thickness can be obtained by applying suitable boundary conditions on
the gas/membrane interface.
4.2.1 Physical model
Figure 4.1 shows the schematic of the physical process of this study. The hydration of the
membrane surface, the electrical potential change and diffusion of defects (𝑂𝐻𝑂• , 𝑉𝑂
••) along
the thickness of the BCY membranes are modelled and evaluated. The existence of charged
species within the membrane is dependent on the molecular species (such as water vapour,
oxygen etc.) in the surrounding gaseous environment. The electronic defects (electrons and
holes) within the BCY membranes have been ignored, as the possibility of their existence is
low because the gaseous environment in this study consists of 1% water vapour in nitrogen.
Therefore, the oxygen partial pressure is assumed to be very low and constant. The model is
based on solution of the Nernst–Planck equation with boundary conditions in a membrane
system which is in contact with the gas phase.
The water transport involves four steps as shown in Figure 4.1 which are as follows:
1. The convection of water vapour (steam) in the gas phase.
2. The diffusion of water through the boundary layer and platinum layer.
3. The reaction of water with BCY membrane surface and its incorporation.
4. The migration of 𝑂𝐻𝑂• and 𝑉𝑂
•• species within the BCY membrane.

64
Figure 4.1: Schematic of hydration of the BCY membrane. The first process involves transport of
water in the gas phase, the second process is water diffusion in the gas boundary layer, in the third
process defect formation reaction takes place (water reacts with oxygen vacancy and lattice oxygen to
form protonic defects) and the fourth process displays diffusion of defects within the membrane. The
surface is coated with a thin platinum layer. The other surface of the membrane is sealed to isolate this
surface from the surrounding atmosphere.
4.2.2 The Nernst–Planck Equation
The Nernst–Planck equation is a conservation of mass equation which describes the effect of
an ionic concentration gradient and an electric field on the motion of chemical species,
especially on ions. The conservation of mass equation is [102]:
𝑑𝑐𝑖𝑑𝑡= −
𝑑𝐽𝑖𝑑𝑥
4.1
The flux function 𝐽𝑖 represents molar flux of ith ion species (mol/m2s) and 𝑐𝑖 represents molar
concentration of ith ion species (mol/m3).

65
The molar flux of ion species consists of three parts; convection, diffusion and migration.
𝐽𝑖 = 𝐽𝑖,𝑐 + 𝐽𝑖,𝑑 + 𝐽𝑖,𝑚 4.2
𝐽𝑖 = 𝑐𝑖𝑢 − 𝐷𝑖𝑐𝑖 + 𝑐𝑖𝑈𝑖𝐹𝑖,𝑒 4.3
Equation 4.3 describes movement of charged species. All species in bulk will be transported
with a common velocity, 𝑢 (m/s), in the absence of concentration gradient and electrical field.
The mass flux of species i under these conditions is described as the convective flux and
given as 𝑐𝑖𝑢.
In the presence of concentration gradients of species, diffusion flux arises. The mass flux of
species i due to diffusion is given by Fick`s first law, 𝐷𝑖𝑐𝑖 . The coefficient 𝐷𝑖 (m2/s) is
referred as the diffusion coefficient of the species i. Since the diffusion mass flux takes place
from high concentration to low concentration, substitution of diffusion mass flux to overall
mass flux is given as −𝐷𝑖𝑐𝑖.
When charged species are transported, the movement of charged species will create an electric
field. This kind of transport is referred as migration. The mass flux due to migration also
contributes the overall flux equation. The created electrical field is proportional to the
negative gradient of potential (V) and gives rise to a force for charged species i as follows:
𝐹𝑖,𝑒 = −𝑧𝑖𝑒 ∇𝑉 4.4
Where 𝑧𝑖 represents the charge number of species and 𝑒 represents the elementary charge of
an electron (C).

66
The Nernst–Planck equation is constituted as follows:
𝑑𝑐𝑖𝑑𝑡= 𝑐𝑖𝑢 − 𝐷𝑖
𝑑𝑐𝑖𝑑𝑥− 𝑐𝑖𝑈𝑖𝑧𝑖𝑒
𝑑𝑉𝑖𝑑𝑥
4.5
Mobility of species is related to diffusion coefficients by the Nernst–Einstein relation as
follows:
𝑈𝑖 = 𝐷𝑖
𝑘𝐵 𝑇 4.6
and,
𝐹 = 𝑒𝑁𝐴 4.7
𝑘𝐵 = 𝑅
𝑁 4.8
where 𝐹 and 𝑘𝐵 are Faraday constant (C/mole) and Boltzmann constant (J/K), 𝑅 is the
universal gas constant (J/K mole), 𝑁 Avogadro constant (1/mole) , 𝑒 is the elementary charge
(C) and T is the temperature (K).
The Nernst–Planck equation can be rewritten as:
𝑑𝑐𝑖𝑑𝑡= 𝑐𝑖𝑢 − 𝐷𝑖
𝑑𝑐𝑖𝑑𝑥− 𝑐𝑖𝑧𝑖
𝐷𝑖𝐹
𝑅𝑇
𝑑𝑉𝑖𝑑𝑥
4.9
where i represents all the species that are present in the membrane and u represents gas flow
rate.
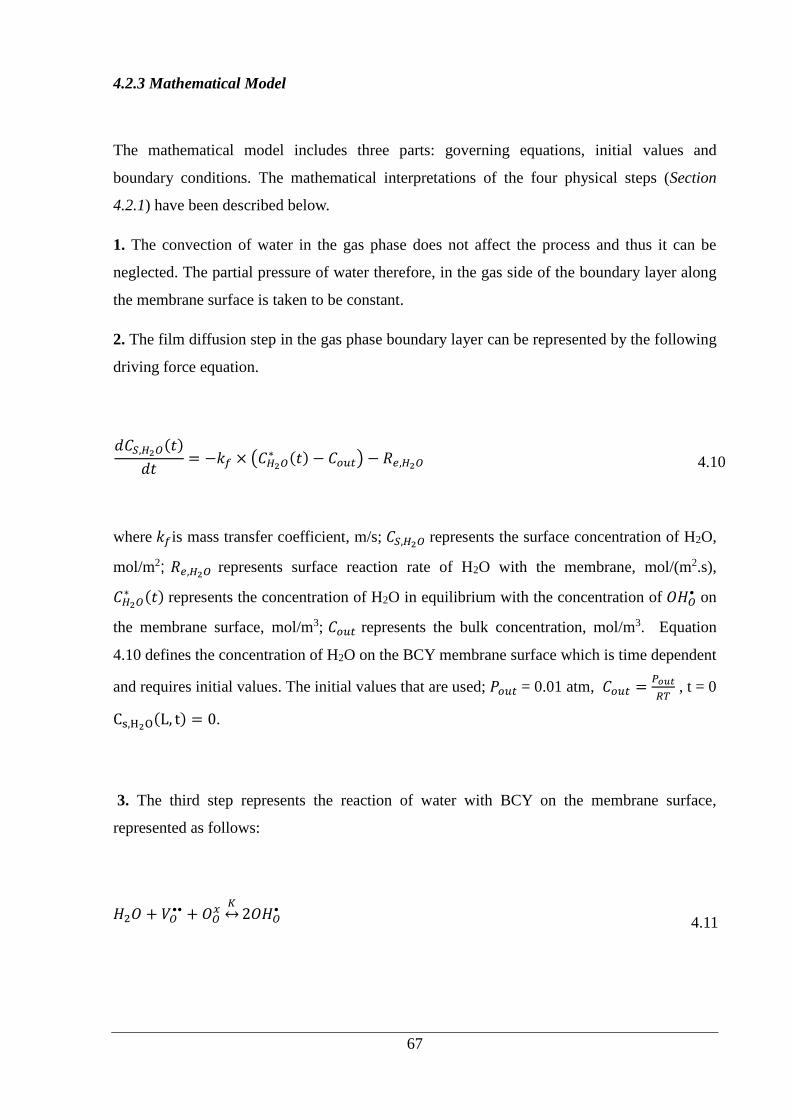
67
4.2.3 Mathematical Model
The mathematical model includes three parts: governing equations, initial values and
boundary conditions. The mathematical interpretations of the four physical steps (Section
4.2.1) have been described below.
1. The convection of water in the gas phase does not affect the process and thus it can be
neglected. The partial pressure of water therefore, in the gas side of the boundary layer along
the membrane surface is taken to be constant.
2. The film diffusion step in the gas phase boundary layer can be represented by the following
driving force equation.
𝑑𝐶𝑆,𝐻2𝑂(𝑡)
𝑑𝑡= −𝑘𝑓 × (𝐶𝐻2𝑂
∗ (𝑡) − 𝐶𝑜𝑢𝑡) − 𝑅𝑒,𝐻2𝑂 4.10
where 𝑘𝑓is mass transfer coefficient, m/s; 𝐶𝑆,𝐻2𝑂 represents the surface concentration of H2O,
mol/m2; 𝑅𝑒,𝐻2𝑂 represents surface reaction rate of H2O with the membrane, mol/(m2.s),
𝐶𝐻2𝑂∗ (𝑡) represents the concentration of H2O in equilibrium with the concentration of 𝑂𝐻𝑂
• on
the membrane surface, mol/m3; 𝐶𝑜𝑢𝑡 represents the bulk concentration, mol/m3. Equation
4.10 defines the concentration of H2O on the BCY membrane surface which is time dependent
and requires initial values. The initial values that are used; 𝑃𝑜𝑢𝑡 = 0.01 atm, 𝐶𝑜𝑢𝑡 =𝑃𝑜𝑢𝑡
𝑅𝑇 , t = 0
Cs,H2O(L, t) = 0.
3. The third step represents the reaction of water with BCY on the membrane surface,
represented as follows:
𝐻2𝑂 + 𝑉𝑂•• +𝑂𝑂
𝑥𝐾↔2𝑂𝐻𝑂
• 4.11

68
𝐾 =𝑘1𝑘2=
𝐶𝑂𝐻𝑂•2
𝐶𝑉𝑂••𝐶𝑂𝑂𝑥 𝑃𝐻2𝑂
∗ /𝑃0 4.12
where 𝐾 is the reaction equilibrium constant, 𝑘1 is the forward reaction rate constant
(m2/mol.s), 𝑘2 is the reverse reaction rate constant (m2/mol.s), 𝑃𝐻2𝑂∗ is the partial pressure of
water on the membrane surface and 𝑃0 is the atmospheric pressure (Pa).
The equation 4.12 relates equilibrium constant (thermodynamic value) to forward and reverse
rate constants. If one of the rate constants is known, the other one can be calculated by using
equilibrium constant.
The concentration of reactants will be reduced by the forward reaction, but also will be
increased by the reverse reaction, thus the net reaction rate of Equation 4.11 (𝑅𝑎, mol/m2.s) is
given as follows:
𝑅𝑎 = (𝑘1 𝐶𝑉𝑂••𝐶𝑂𝑂𝑥𝑃𝐻2𝑂∗ /𝑃0) − 𝑘2𝐶𝑂𝐻𝑂•
2 4.13
𝑅𝑎 = 𝑘1 {(𝐶𝑉𝑂••𝐶𝑂𝑂𝑥𝑃𝐻2𝑂∗ /𝑃0) −
1
𝐾𝐶𝑂𝐻𝑂•2 }
4.14
The reaction rates of reactants and products can be shown with Equations 4.15 to 4.18
respectively.
𝑅𝑒,𝐻2𝑂 = −𝑅𝑎 4.15
𝑅𝑒,𝑂𝑂𝑥 = −𝑅𝑎 4.16
𝑅𝑒,𝑉𝑂•• = −𝑅𝑎 4.17

69
𝑅𝑒,𝑂𝐻𝑂• = 2𝑅𝑎 4.18
where, 𝑅𝑒 represents surface reaction rate of species.
Reaction rates from Equation 4.15 to 4.18 are time dependent and require initial values. The
initial values of the various species in the membranes used in this study are calculated from
the stoichiometry of BCY membranes equilibrium with the given gas–phase environment at
the surface and presented in Table 4.1(See Appendix H for detailed calculations). The doping
concentrations of yttrium used in the analysis are 20 mol% for BCY20 and 10 mol% for
BCY10.
Table 4-1: Initial concentration of species (see Appendix H for detailed calculations).
Species Concentration Charge
BCY20 (BaCe0.8Y0.2O2.9) 1.7371×10⁴ mol/m3 0
𝑂𝑂𝑥 5.0377×10⁴ mol/m3 0
𝑌𝐶𝑒′ 3.4743×10³ mol/m3 -1
𝑉𝑂•• 1.7371×10³ mol/m3 2
OH𝑂• 0 1
Species Concentration Charge
BCY10 (BaCe0.9Y0.1O2.95) 1.5130×10⁴ mol/m3 0
𝑂𝑂𝑥 4.4633×10⁴ mol/m3 0
𝑌𝐶𝑒′ 1.513×10³ mol/m3 -1
𝑉𝑂•• 7.565×10² mol/m3 2
OH𝑂• 0 1
4. The fourth step includes the diffusion of two species ( 𝑂𝐻𝑂• and 𝑉𝑂
•• ) within the BCY
membranes. This process is represented with the Nernst–Planck equation. In this study one–
dimensional transport through the membranes along the thickness is considered.

70
The Nernst–Planck equation is derived in Equation 4.9. The first term of the equation
represents convection, the second part and the third part represent diffusion (due to
concentration gradient) and migration (electrical potential gradient), respectively. The
convection part of the equation can be ignored as the rate of convection in the gas phase is too
rapid as compared to diffusion processes. Therefore Equation 4.9 becomes:
𝐽𝑖 = −𝐷𝑖𝛻𝑐𝑖 − 𝑐𝑖𝑧𝑖𝐷𝑖𝐹
𝑅𝑇𝛻𝑉
4.19
The conservation form of mass transfer equation in one–dimension is:
𝑑𝑐𝑖𝑑𝑡+𝑑
𝑑𝑥𝐽𝑖 + 𝑐𝑖𝑢 = 𝑅𝑖
4.20
By substituting Equation 4.19 into Equation 4.20, the conservation equation can be presented
as:
𝑑𝑐𝑖𝑑𝑡+𝑑
𝑑𝑥(−𝐷𝑖𝛻𝑐𝑖 − 𝑧𝑖𝑐𝑖
𝐷𝑖𝐹
𝑅𝑇𝛻𝑉) + 𝑐𝑖𝑢 = 𝑅𝑖
4.21
Equation 4.21 applies to all of the species within BCY membrane and represents a series of
equations.
The electro neutrality condition applies throughout the membrane:
∑𝑧𝑖𝑐𝑖𝑖
= 0 4.22
The net charge throughout the membrane is zero, meaning that the number of Q-1 charged
species where Q is the number of species present, can be solved using Equation 4.21. The

71
remaining species concentration can be calculated using Equation 4.22. The movable charges
within the BCY membrane are 𝑂𝐻𝑂• and 𝑉𝑂
•• which are both positive. Thus, a negative charge
should be taken into account for the electro neutrality condition. The negative charge used is
𝑌𝐶𝑒′ . The diffusion coefficient of 𝑌𝐶𝑒
′ compared to protonic defect and oxygen vacancy is very
small. Therefore, the diffusion coefficient for 𝑌𝐶𝑒′ is considered to be very low and constant.
The electrical potential is calculated using the relations below by adding the mass transfer
equation of every charged species and multiplying this sum with 𝐹𝑧𝑖 . The current density
(associated with defect concentration) relation is given as follows:
i𝑡 = 𝐹∑𝑧𝑖(−D𝑖𝛻𝑐𝑖 − z𝑖c𝑖u𝑚𝑖𝐹𝛻𝑉)
𝑛
𝑖=1
4.23
Equation 4.23 displays conservation of electric charge and relates electric potential to
concentration. Equations 4.21 and 4.23 are time and space dependent and require initial
values and boundary conditions described in the next section. These are sufficient to describe
the concentration distribution of ions, vacancies and the electric potential within the
membranes as a function of time and space.
4.3 Model Boundary Condition
Discretisation of Membrane
The water diffusion in the membrane may be treated as a one–dimensional problem in order
to predict defect distribution along the thickness of the membrane. This assumption could be
employed only when membrane thicknesses are small compared to radial surface areas. Thus,
diffusion can be assumed to happen in one direction. Equations used in this model are
therefore considered to be only in one dimension. The electric potential of the isolated surface
of the membrane at x= L is specified as 0 V.

72
The BCY membrane can be discretised into finite volumes as shown in Figure 4.2. The
system can be then solved using high level software for the numerical solutions of differential
equations [103].
Figure 4.2: Illustration of a finite volume within BCY membrane that represents discretisation of
membrane for fluxes of species. 𝐽𝑥−∆𝑥 and 𝐽𝑥+∆𝑥 represent neighboring volumes.
When only the diffusion is taken into consideration, based on mass balance, the relationship
of the concentration of species i with time can be given as in Equation 4.24.
𝑆 × [C𝑖(𝑥, 𝑡 + ∆𝑡) − C𝑖(𝑥, 𝑡)] × ∆𝑥 = 𝑆 × [𝐽𝑖(𝑥, 𝑡) − 𝐽𝑖(𝑥 + ∆𝑥, 𝑡)] × ∆𝑡 4.24
Both sides of the equation can be divided by 𝑆 × ∆𝑥 × ∆𝑡;
[C𝑖(𝑥, 𝑡 + ∆𝑡) − C𝑖(𝑥, 𝑡)] ∆𝑡⁄ = − [𝐽𝑖(𝑥 + ∆𝑥, 𝑡) − 𝐽𝑖(𝑥, 𝑡)] ∆𝑥⁄ 4.25

73
Boundary Conditions
The water dissociation reaction occurs on the surface of BCY membrane, 𝑂𝐻𝑂• is produced on
this surface and permeates into BCY membrane (in the positive direction shown in Figure 4.1)
where 𝐽𝑂𝐻𝑂• represents the flux of 𝑂𝐻𝑂• at the boundary of the membrane (mol/m2s).
At the boundary, the mass balance of 𝑂𝐻𝑂• can be written as following:
𝑆 × (𝐶𝑂𝐻𝑂• (𝑡 + ∆𝑡)|
𝑥=0− 𝐶𝑂𝐻𝑂
• (𝑡)|𝑥=0) = −𝑆 × ∆𝑡 × 𝐽𝑂𝐻𝑂
• (𝑡)|𝑥=0
+ 𝑆 × ∆𝑡 × 𝑅𝑂𝐻𝑂• |𝑥=0
4.26
Where 𝑆 represents the surface area (m2), 𝐽𝑂𝐻𝑂• represents the flux of 𝑂𝐻𝑂• at the boundary of
membrane (mol/m2.s) and 𝑅𝑂𝐻𝑂• represents the surface reaction rate of 𝑂𝐻𝑂• (mol/m2.s).
Following the same steps for 𝑉𝑂•• , the boundary conditions for 𝑂𝐻𝑂
• and 𝑉𝑂•• for both surfaces
are:
x=0 exposed surface boundary conditions;
𝐽𝑂𝐻𝑂• (𝑡)|𝑥=0= −
𝑑𝐶𝑂𝐻𝑂• (𝑡)
𝑑𝑡|𝑥=0
+ 2𝑅𝑎|𝑥=0 4.27
𝐽𝑉𝑂••(𝑡)|𝑥=0= −
𝑑𝐶𝑉𝑂••(𝑡)
𝑑𝑡|𝑥=0
− 𝑅𝑎|𝑥=0 4.28
V=0 4.29
x=L isolated surface boundary conditions;
𝑑𝐶𝑖𝑑𝑥
= 0 4.30
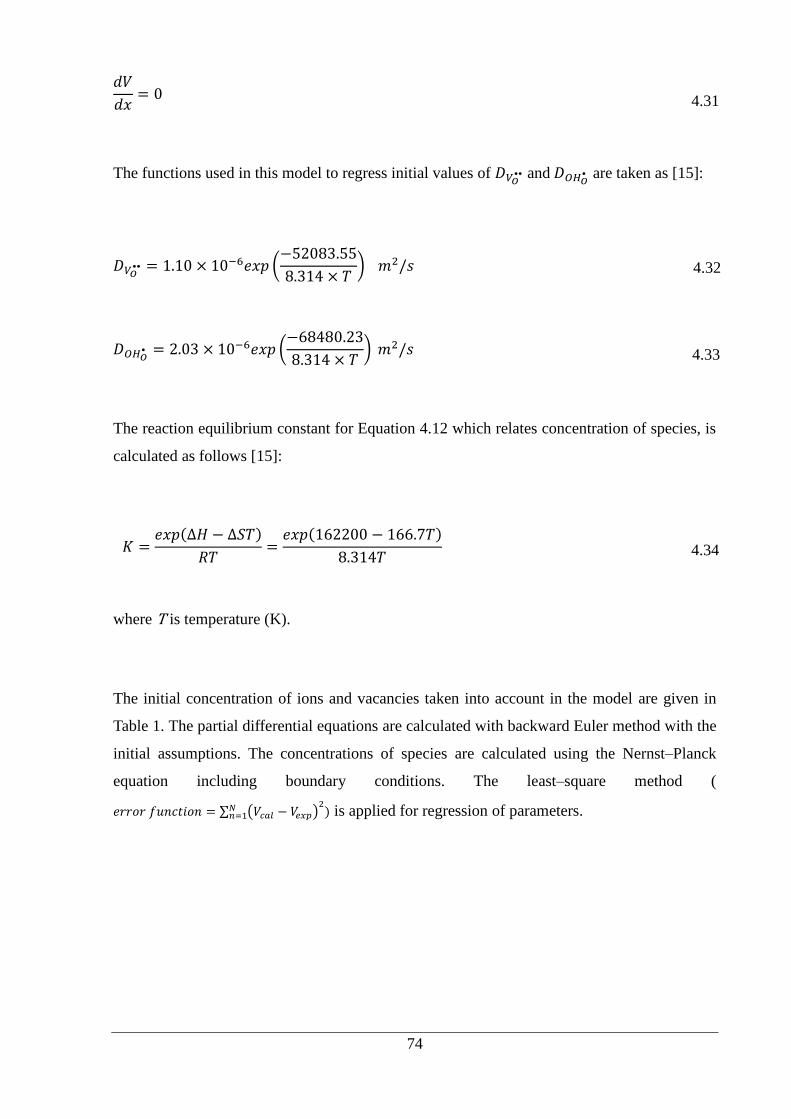
74
𝑑𝑉
𝑑𝑥= 0 4.31
The functions used in this model to regress initial values of 𝐷𝑉𝑂•• and 𝐷𝑂𝐻𝑂• are taken as [15]:
𝐷𝑉𝑂•• = 1.10 × 10⁻⁶𝑒𝑥𝑝 (
−52083.55
8.314 × 𝑇) 𝑚2/𝑠 4.32
𝐷𝑂𝐻𝑂• = 2.03 × 10⁻⁶𝑒𝑥𝑝 (
−68480.23
8.314 × 𝑇) 𝑚2/𝑠 4.33
The reaction equilibrium constant for Equation 4.12 which relates concentration of species, is
calculated as follows [15]:
𝐾 =𝑒𝑥𝑝(∆𝐻 − ∆𝑆𝑇)
𝑅𝑇=𝑒𝑥𝑝(162200 − 166.7𝑇)
8.314𝑇 4.34
where T is temperature (K).
The initial concentration of ions and vacancies taken into account in the model are given in
Table 1. The partial differential equations are calculated with backward Euler method with the
initial assumptions. The concentrations of species are calculated using the Nernst–Planck
equation including boundary conditions. The least–square method (
𝑒𝑟𝑟𝑜𝑟 𝑓𝑢𝑛𝑐𝑡𝑖𝑜𝑛 = ∑ (𝑉𝑐𝑎𝑙 − 𝑉𝑒𝑥𝑝)2)𝑁
𝑛=1 is applied for regression of parameters.

75
4.4 Model Results and Discussion
4.4.1 Electrical Potential of Membranes
The hydration process of BCY membranes involves two significant processes; the mass
transfer process and the formation of electric field within the membrane to maintain electro
neutrality. The multi–species mass transfer processes within BCY membranes that are affected
by electric field, can be simulated using the Nernst – Planck equation.
Figure 4.3 shows the experimental results for the electrical potential change during hydration
and dehydration of Al2O3, BCY20 and BCY10 membranes, respectively. The graph presented
in Figure 4.3.a is obtained from a blank experiment that performed with an Al2O3 membrane.
Al2O3 membrane is operated at the same conditions as BCY20 and BCY10 membranes in
order to confirm whether the potential change occurs due to hydration/dehydration of BCY20
and BCY10 membranes. Al2O3 membrane is chosen since hydration of this material does not
involve defect formation and diffusion [104]. During this experiment, dry helium is fed to the
reaction chamber which is then switched to 1% H2O in nitrogen at 500 s and kept the same
until it is switched back to dry helium again after 2500 s. As seen from Figure 4.3a that no
potential change is observed by the change in surrounding environment. Therefore, the
potential changes observed in Figure 4.3b and Figure 4.3c can be attributed to potential
changes of BCY20 and BCY10 membranes during hydration and dehydration due to
formation and conduction of charged defects.

76
Figure 4.3: The electrical potential change of BCY membranes upon hydration and dehydration
measured under open circuit conditions at 700 °C. a) Al2O3 (no signal is observed, only background
signal is seen), b) BCY20, c) BCY10. (The membrane reactor is fed with dry helium for 24 hrs before
the experiments, and then 1% H2O in nitrogen is introduced to the reactor chamber which corresponds
to first peaks in the graphs. The second peak appears when 1% H2O in nitrogen is switched back to dry
helium. The flow rates of gases are 200 ml/min)
The time necessary to change the surrounding atmosphere of the membranes and obtain a
stable water concentration inside the reactor chamber is very short (~17 s) compared to the
equilibration time (>500 s). Therefore, the partial pressure of water is assumed constant
during hydration of membranes.

77
The electrical potential change is associated with concentration gradients of the mobile
charges 𝑂𝐻𝑂• and 𝑉𝑂
•• during hydration and dehydration within the membranes. The water
incorporation within the membrane does not affect its electro neutrality. When no external
electrical driving force is applied; the chemical potential difference (concentration gradient)
of water between the surrounding atmosphere and the membrane is the driving force for water
incorporation.
The first peaks in Figure 4.3b and 4.3c are related to a potential change during hydration in
both cases; the second peaks correspond to potential change during dehydration. Water
concentration in the gas phase for hydration of the membranes is kept as 1% for both
membranes. The experiments are repeated for both membranes to see if they are reproducible.
The transient behaviour of the membranes are reproduced (see Appendix I). Following the
introduction of 1% H2O in nitrogen to the reactor chamber, an electrical potential difference is
observed due to sudden increase in the water partial pressure and a quick change in the ratio
of oxygen vacancy and protonic defect at the exposed surface compared to the bulk. The
electrical potential overshoots (~2 s) and then it slowly decays toward final initial state (~500
s). This demonstrates that electrical potential increases quickly when water incorporates into
the membrane and decreases with the diffusion of species. When 1% H2O in nitrogen is
subsequently switched to the dry helium, the electrical potential changes in exactly the
opposite trend; dehydration occurs fast at first then extends over many seconds and eventually
approaches the initial state. The hydration of membranes is enough to extract diffusion
coefficient of defects within the membranes. Thus further discussion will continue based on
hydration of membranes.
The approximate potential difference values for BCY20 and BCY10 are 10 mV and 35 mV,
respectively. As seen from Figure 4.3b and Figure 4.3c that BCY10 displayed higher potential
difference and shorter charge redistribution period than BCY20. This divergence may be
associated with the difference in concentration of charge carriers, surface kinetics and
diffusion coefficients of protonic defects and oxygen vacancies. For every mole of dopant,
half mole of oxygen vacancy is formed. Thus, BCY10 has lower oxygen vacancy
concentration than BCY20. By assuming that both membranes have similar surface kinetics
(since temperature, electrode and water concentration are the same for both membranes), it

78
may be said that charge separation and redistribution happen quicker when charge carrier
concentration is less.
The potential difference between the surfaces increases fast at the beginning and then slowly
diminishes. The sudden change in electrical potential could be due to the fast kinetic process
of the adsorption, dissociation and incorporation of water on to the surface/bulk or/and fast
defect formation. This fast hydration was also observed by Schober et al [105]. Their
dilatometry results showed rapid expansion with the injection of water into the dilatometer
(water concentration ~ 0.03%) followed by slow expansion.
Additionally, the diffusion coefficients of protonic defects are reported as greater value than
that of oxygen vacancies in literature [14, 91]. Similarly, Yoo et al [106-108] studied mass
relaxation of BaCe0.95Yb0.05O2.975 and SrCe0.95Yb0.05O2.975 proton conductors upon hydration
and dehydration. They also reported fast diffusion of H followed by sluggish diffusion of O.
Therefore, it may be speculated that protons incorporate into the membrane fast and diffuse
quickly by leaving oxide ions behind. This can create an unbalanced charge distribution due
to the distribution of fixed negatively charged species within the membranes. As the oxide
ions catch up the protons, the electrical potential difference returns to its initial level and the
concentrations gradients of species disappear within the membrane. The uniform charge
distribution is restored and the potential becomes uniform again.
The overshoot period (~2 s) in electrical potential is short compared to the period to establish
uniform concentration distribution (400–500 s) as seen from Figure 4.3b and 4.3c, implying
that bulk diffusion period is two orders magnitude higher than the surface processes (i.e.
adsorption, protonic defect formation). Additionally, this period is higher for BCY20
membrane than BCY10 membrane (BCY10, ~550 s and BCY 20, ~650, see Figure 4.3).
These differences may be related to the difference in membrane thicknesses (diffusion length
for re–equilibration) or dopant concentrations.
The experimental data and model fit for potential change during hydration is shown in Figure
4.4. The optimisation module in Comsol is used to find best match to the experimental data.

79
This option allows finding the optimum parameters to minimise difference between estimated
and experimental data after many iterations of calculations (least–square type). Figure 4.4
shows a satisfactory fit between model and experimental data (R2 = 0.997 for BCY20 and R2
= 0.986 for BCY10). However, some deviation is observed when the potential difference
decreases. The fitting process for a straight line can be managed easily, on the other hand a
curve fitting process is much complex. The least square optimisation which is a well-
established and simple method was used in this study and showed a reasonable fit with the
experimental data. One limitation with this method is that the data points which are differ
from the majority of the data can skew the regression [109]. This may be the reason for the
deviation is seen in Figure 4.4.
Figure 4.4: The comparison of experimental and modelled electrical potentials upon hydration. Lines
= modelled results, stars= experimental results. a) BCY20, b) BCY10
The electrical potential profiles within the BCY20 and BCY10 membranes during hydration
are shown in Figure 4.5. The profiles are predicted as a function of time by using Equations
4.21 and 4.23 which relate the concentration distribution of species to the electrical potential.
The electrical potential increases rapidly with a decreasing rate for both membranes. This
rapid increase is associated with adsorption of water at the membrane surface, increasing
protonic defect concentration and diffusion of protonic defects into the membrane down its

80
concentration gradient, as the concentration gradient approaches the balance, the potential
difference decreases.
The electrical potential of BCY10 reaches its maximum level faster than the electrical
potential of BCY20 (~100 s for BCY20 and ~75 s for BCY10, see Figure 4.4). This might be
due to faster protonic defect formation on the BCY10 membrane surface or faster diffusion
coefficients. The difference in the magnitude of measured electrical potentials might be
attributed to the difference in concentration of protonic defects at the membrane surfaces,
physical properties of membranes (e.g. thickness) and water concentration in the feed gas as it
was also observed by Kee et al [110]. Kee et al [110] increased water concentration from 1%
to 2% in hydrogen containing environment and observed an increase in electrical potential
from 25 mV to 50 mV. Similar study is also done by Vollestad et al [111]. They obtained
electrical potential profile within the 20 mole% yttrium–doped barium zirconate membrane
and predicted the electrical potential using Gauss law instead of the electro neutrality
condition. They used 2% water concentration in the feed side and obtained about 20 mV
potential difference relative to the permeate side by using a two chamber reactor (they used
inert gas in the permeate side). The magnitudes of electrical potential obtained in this study
are in similar range with those reported in literature.

81
Figure 4.5: The electrical potential difference profiles upon hydration for different periods within the
membranes. (X=0 represents “exposed side of the membrane”, x=L mm represents, “isolated side of
the membrane”, L=membrane thickness.) a) BCY20. b) BCY10. The profiles are obtained as a
function of time by solving Equations 4.21 and 4.23 which relate the concentration distribution of
species to the electric potential.

82
4.4.2 The Diffusion Coefficients of Defects
The model mentioned above is used to predict chemical diffusion coefficients of 𝑂𝐻𝑂•
and 𝑉𝑂••. The predicted values of chemical diffusion coefficients are presented in Table 4.2.
The initial values are assumed based on the work by Kreuer et al [15] and set the same for
both BCY20 and BCY10. The diffusion coefficients of 𝑂𝐻𝑂• and 𝑉𝑂
•• are calculated using the
Nernst–Planck equation with the boundary conditions, the remaining species concentration
gradient is calculated using the electro neutrality condition. As previously discussed in
Section 4.4.1 the amount of protonic defects at the interface increases and diffuses rapidly at
the beginning when the membrane is exposed to humid atmosphere by water dissolution and
occupation of oxygen vacancies. The diffusion coefficients of protonic defects are found to be
greater than diffusion coefficients of oxygen vacancies for both membranes which is in
agreement with Oishi et al [91] and Kreuer et al [14]. Oishi et al [91] found protonic diffusion
coefficient value higher than oxygen vacancy diffusion coefficient from their conductivity
measurements for BCY10 membrane.
Table 4-2: Fitted chemical diffusion coefficients calculated from the model at 700⁰C.
Parameter BCY20 (cm2/s) BCY10 (cm2/s)
𝐷𝑉𝑂•• 1.58×10⁻⁵ 1.27×10⁻⁵
𝐷𝑂𝐻𝑂• 3.83×10⁻⁵ 6.2×10⁻⁵
The diffusion coefficient of protonic defects for BCY20 membrane at low temperatures,
between 50 °C and 350 °C was experimentally determined by Kreuer et al [15]. Their result
depicted an increase in diffusion coefficient of protonic defects from 10-10 to 10-8 cm2/s as the
temperature rose from 50 °C to 350 °C. Additionally, the diffusion coefficient of oxygen
vacancy for BCY10 at 700 °C has been reported [92] as 𝐷𝑉𝑜•• = 5 × 10⁻⁵𝑐𝑚2/𝑠 which is in
agreement with the findings in this study. The diffusion coefficients are compared with
literature as shown in Figure 4.6 which is mainly obtained from electrical conductivity
measurements [86, 91-93]. Although, the data presented in Figure 4.6 is for BCY10 (due to
the fact that BCY10 has been commonly studied in the literature), the diffusion coefficients of
defects for BCY20 is close to literature values of BCY10. Also, the diffusion coefficients of

83
defects for BCY10 are in good agreement with literature within the accuracy of data. The
small scatter in data in Figure 4.6 could be due to the techniques that are used to obtain
diffusion coefficients.
Figure 4.6: The comparison of diffusion coefficients of protonic defects and oxygen vacancies with
the literature. All the literature data presents diffusion coefficients for BaCe0.9Y0.1O3- δ (BCY10), the
diffusion coefficients determined in this study are for both BaCe0.8Y0.2O3- δ (BCY20) and BCY10.
Coors and Swartzlander [20] measured partial conductivities of two species (𝑂𝐻𝑂• and 𝑉𝑂
•• )
derived from total conductivity and used Kreuer`s ambipolar steam diffusivity model which
relates partial ionic conductivities and diffusion coefficients. Their results suggest that the
diffusion coefficients of 𝑂𝐻𝑂• and 𝑉𝑂
•• for BCY10 can be calculated using
DVO••=3.628×10⁻³exp(
-0.552 eV
kB×T) cm2/s and 𝐷𝑂𝐻𝑂
• = 7.74 × 10⁻⁴𝑒𝑥𝑝 (−0.332 𝑒𝑉
𝑘𝐵×𝑇) cm2/s. The
exponential factor for 700 °C is 1.38×10⁻³. Thus, the diffusion coefficient values at 700 °C can

84
be calculated as 𝐷𝑉𝑂•• = 5 × 10⁻⁶ 𝑐𝑚2/𝑠 and 𝐷𝑂𝐻𝑂
• = 1.7 × 10⁻⁶ 𝑐𝑚2/𝑠 , respectively. They
found oxygen vacancy diffusion coefficient higher than protonic defect diffusion coefficient.
The diffusion coefficients calculated in the current study shows that protonic defects diffuse
faster than oxygen vacancies contradictory to the results of Coors and Swartzlander [20]. This
difference could be owing to the techniques. They used dilatometry (to determine degree of
hydration) and impedance spectroscopy (i.e. total conductivity can vary with time in wet
atmosphere due to water adsorption, deconvolution of impedance spectra).
The diffusion coefficients of oxygen vacancy and protonic defect in this study are slightly
higher than the values observed in literature (Figure 4.6). This difference might be owing to
grain boundaries. It was reported that water diffuse faster in the grain boundaries than bulk
[112]. However, the presence of grain boundaries in the conductivity measurements tends to
decrease the conductivity of the membrane. During hydration, the bulk conductivity remains
unchanged; but the grain boundary conductivity decreases due to an increase in grain
boundary resistance (Grain boundary resistance increases due to depletion in oxygen vacancy
concentration in that region. Oxygen vacancy concentration depletion is more severe than
protonic defect concentration depletion due to the difference in the effective charges).
Therefore, the total conductivity decreases (total conductivity = bulk + grain boundary).
The report on the role on grain boundaries on the diffusivity of water [112] which in turn
relates to conductivity is quite recent, this explanation may not be considered by some of the
studies reported in Figure 4.6 [86, 91, 93, 113]. Most of those values in literature were derived
from the conductivity data (no correction for grain boundary resistance in the total resistance)
which were measured as a function of temperature and partial pressure of oxygen and water,
thus it is possible that they could underestimate diffusion coefficients of defects.
In addition, the assumptions associated with the model (e.g. strict electro neutrality condition,
fast surface reaction kinetics) in the current study and errors in mathematical calculations can
play a role in the deviation between diffusion coefficients obtained in this study compared
with literature. However, another possibility might be that, the thermodynamic values
(hydration enthalpy and entropy) are taken from literature measured and given for BCY10
membrane used for determination of the equilibrium constant. The same thermodynamic

85
values were used for BCY20 based on the study by Kreuer [86] that reported that doping
level has a weak effect on hydration thermodynamics.
The model in this study considered only ambipolar transport of water (protons and oxygen
vacancies). In reality, this may not be the case, especially under fuel cell operating conditions.
In hydrogen/oxygen containing environment, there will be contribution of holes and electrons
along with defect transport. Moreover, the counter and/or simultaneous diffusion defects
could affect the apparent water flux, thus diffusion coefficients of defects. The data in this
study and literature does not account for third defect species.
4.4.3 The Concentration Distributions of Defects within the Membranes
Figure 4.7 displays concentration distributions of 𝑂𝐻𝑂• and 𝑉𝑂
•• during hydration for different
periods across the membranes predicted using the model by solving mass conservation
equations computationally. Defect concentrations vary non–linearly along the membrane
thicknesses with time. The concentration profiles of 𝑂𝐻𝑂• and 𝑉𝑂
•• have an opposite trend at
the surface of both the membranes. The 𝑉𝑂•• concentration decreases at the hydration surface
as the concentration of 𝑂𝐻𝑂• increases at this surface. This is expected since oxygen vacancies
are filled with protons at the surface.
As can be seen from both the calculated data and schematic that the concentration changes of
oxygen vacancy and protonic defect is asymmetric. This could be also easily seen from lines
next to the schematic. The schematic represents the concentration of protonic defects and
oxygen vacancies change with time and thickness through the membranes. The lines on the
edges present increase or decrease in concentrations, both defects are transported down their
concentration gradients.
In addition, the oxygen vacancy concentration distribution does not show a large
concentration gradient between surfaces and bulk unlike protonic defect concentration. This
could be because of the stoichiometric ratios. The concentration of 𝑂𝐻𝑂• exhibits a rapid
increase at the hydration surface with the introduction of water into the reactor chamber

86
asserting that the formation of protonic defects is a very fast process. This is confirmed with a
concentration versus time analysis. As seen from Figure 4.7 that protonic defect concentration
increases fast on the exposed surface at 50 s and then continues increasing with a slowing
rate. The concentration gradients disappear with time, which indicates that the membrane is
completely hydrated. BCY20 has higher protonic defect concentration on the exposed surface
than BCY10. This is due to higher availability of oxygen vacancy on the BCY20 surface than
BCY10.

87
Figure 4.7: Concentration distributions of protonic defects and oxygen vacancies within the BCY
membranes for different periods upon hydration, a) BCY10 and b) BCY20, respectively. The
schematic on the right represent the distribution of defects within the membranes to aid visualisation
of graphs. The lines on the edges represent the concentration changes of defects. (•) represents protons,
(◌) represents oxygen vacancy, and (●) represents lattice oxygen. Water ( ) incorporates into the
membrane from the exposed surface, then protons diffuse towards to isolated surface and the oxygen
vacancies diffuse towards to exposed surface.
4.5 Summary
A direct simple method is developed to calculate concentration distributions of 𝑉𝑂••and 𝑂𝐻𝑂
•
within the BCY membranes and extract the diffusion coefficients of defects from behaviour of
the membrane during hydration. The protonic defect diffusion coefficient shows higher value

88
than oxygen vacancy diffusion coefficient which is in agreement with the literature showing
that the model for hydration of the membrane is valid. However, the values are one order of
magnitude higher than those reported in the literature which might be due to using different
paths to extract diffusion coefficients. This study introduces a novel approach and
groundwork to develop more complex models to those in literature. It also presents new data
for the BCY membrane materials used during hydration/dehydration at an elevated
temperature and may be useful for different physical membrane configurations for future
applications.

89
Chapter 5
Water Permeation and Water Gas Shift
Reaction through BCY20 Membrane Modified
with Platinum
5.1 Introduction
The water permeation behaviour of BCY20 membrane which is modified with platinum (as
catalyst/electrode) is studied in the temperature range of 500–800 °C. For practical
applications, it is important to understand the mechanism of water incorporation and water
evolution from the membrane. Both these phenomena depend on the active surface sites that
are required for water disassociation/incorporation into the membrane. Therefore, the
membrane surfaces are modified in different configurations. This may be beneficial in terms
of designing electrode structures for fuel cells to be operated with simultaneous water
permeation.
The feasibility of utilising permeated water in water gas shift reaction is further investigated
in mono–membrane reactor. This process involves water splitting on the feed side followed by
water transport across the membrane to react with carbon monoxide on the permeate side.
Water permeation coupled with water–gas shift reaction is carried out by using carbon
monoxide on one side and water vapour on another side of membrane as shown in Figure 5.1.
Permeated water reacts with carbon monoxide to generate carbon dioxide and hydrogen given
by the equation:

90
Water gas shift reaction: CO + H2O ↔ CO2 + H2 ΔH298K = -41 kJ/mol 5. 1
The feasibility of water–gas shift reaction through water permeation has not been reported in
literature. Therefore, water permeation coupled with water–gas shift reaction is studied in this
chapter. The role of catalytic surface modification on water–gas shift reaction in the
membrane reactor is investigated along with the influence of reducing gas (i.e. carbon
monoxide) on the permeate side as a driving force for water permeation.
Figure 5.1: Schematic diagram of membrane based water permeation coupled with water–gas shift
reaction. Water permeates from feed side to permeate side and reacts with carbon monoxide to
generate hydrogen and carbon dioxide.
The stability of the BCY20 membranes after their use in water permeation coupled with
water–gas shift reaction is examined by post operation analysis. This will suggest whether the
membrane is stable under harsh environment (i.e. carbon dioxide and water) and water
permeation could facilitate carbon removal formed by carbon monoxide disproportionation.
The water permeation coupled with water–gas shift reaction experiments are typically carried

91
out for more than 45 hrs. The membranes are characterised using different analytical
techniques such as x–ray diffraction (XRD), scanning electron microscopy (SEM) and energy
dispersive x–ray spectroscopy (EDXS).
5.2 Characterisation of BCY20 Membrane and Platinum Layer
5.2.1 X–Ray Diffraction (XRD)
XRD technique is used to identify the formation of the perovskite structure in BCY20
membrane by comparing the data with the references and the International Centre for
Diffraction Data (ICDD) database. The x–ray diffraction pattern (CuKα, 1.5406 A°) of the
sintered BCY20 pellets is shown in Figure 5.2. The match with the standard BCY20
rhombohedral structure is excellent (ICDD-01-070-6750) [19, 72, 114].
Figure 5.2: XRD patterns of BCY20 pellets in comparison with the reference data.

92
The peaks in Figure 5.2 indicate a single phase perovskite structure. According to the XRD
results, the configuration determined in this work is rhombohedral. In the case of doping more
than 20 mole % Y3+ , the main perovskite XRD peaks could split and Y2O3 peaks would
appear indicating that the sample has a single phase tetragonal perovskite–type structure
[115]. However, no Y2O3 peaks are observed as secondary phases in this study indicating that
the sample contains 20 mol% or less Y–dopant concentration. Figure 5.2 clearly demonstrates
that the sample has peaks with low intensity at 2θ values: 24 and 27⁰. The search in
crystallographic database revealed that the peaks can be attributed to BaCO3 impurity in the
sample. BaCO3 decomposes into BaO and CO2 at 1300⁰C. The sample was sintered at 1450⁰C
for 12 hrs, thus it is expected that BaO enters the perovskite structure and forms XRD patters
of BCY20. Similar low intensity BaCO3 peaks in the diffraction pattern of BCY10 was also
reported in literature[116]. Figure 5.2 displays that the intense peaks of Y2O3 and CeO2 are not
present.
5.2.2 Scanning Electron Microscopy (SEM)
The SEM analysis is carried out for further characterisation of the BCY20 membrane
morphology in terms of microstructure, sintering conditions, density and pore sizes. The SEM
analysis is employed under a vacuum atmosphere with various magnifications.
Figure 5.3a and Figure 5.3b illustrates the surface and cross section SEM images of the
BCY20 membrane sintered at 1450 °C for 12 hrs. As can be seen the microstructure of the
surface is clear, dense (shows very few pores) and crack free. This is consistent with the high
relative density which is 95% of theoretical density (6.154 g/cm3 [72]). The geometric
dimensions and mass are used to estimate the relative density of the membrane. The dense
layer is connected with grain boundaries which can clearly be seen from the image in Figure
5.3a. The grain sizes are in the range of ca 1 µm to ca 2 µm. As shown in Figure 5.3b the
membrane is completely dense. BaO evaporation and small Ce1-xYxO2 peaks are reported in
the literature [117] due to the high sintering temperature above 1500 °C. This phenomenon is
not observed in this study (in the XRD and SEM analysis) even though the membrane is
sintered at 1450 °C.

93
The platinum layer deposited on the BCY20 membrane surface (after sintering) is illustrated
in Figure 5.3c. It can be observed that platinum is well distributed with homogen pores on the
membrane surface. There is no uncovered membrane surface observed. Figure 5.3d exhibits
the cross section image of BCY20 and platinum layer. The BCY20 and platinum seems to be
well connected. The thickness of porous platinum layer is found about 5 µm which is
determined using the SEM analysis is shown in Figure 5.3d. The average surface loading for
catalytically modified membrane surfaces is approximately 4.1 mg/cm-2. The loading amount
is obtained by measuring the mass of unmodified BCY20 membrane and modified BCY20
membrane with platinum to find the amount of platinum deposited on the membrane. This
value is divided by the surface area of catalyst coated on the membrane surface. The porosity
of platinum layer is also estimated. The platinum layer is about %61 porous under the current
condition of the study. (See Appendix J for detailed calculation for the amount of deposited
platinum onto membrane and estimation of the porosity of platinum layer.) The porosity
calculation is done by assuming that platinum is pure and dense. Figure 5.3c shows
distribution of lots of small voids. It is difficult to compare calculated porosity value with
Figure 5.3c due to high magnification of SEM image and approximations in calculation.
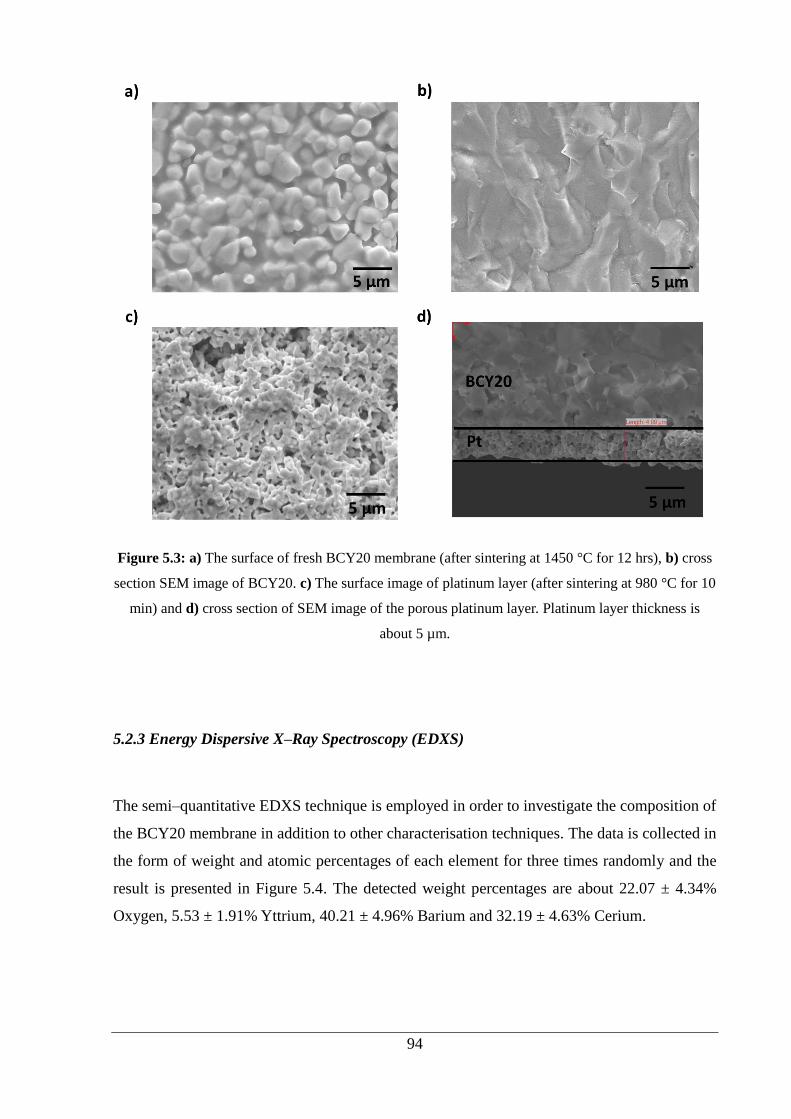
94
Figure 5.3: a) The surface of fresh BCY20 membrane (after sintering at 1450 °C for 12 hrs), b) cross
section SEM image of BCY20. c) The surface image of platinum layer (after sintering at 980 °C for 10
min) and d) cross section of SEM image of the porous platinum layer. Platinum layer thickness is
about 5 µm.
5.2.3 Energy Dispersive X–Ray Spectroscopy (EDXS)
The semi–quantitative EDXS technique is employed in order to investigate the composition of
the BCY20 membrane in addition to other characterisation techniques. The data is collected in
the form of weight and atomic percentages of each element for three times randomly and the
result is presented in Figure 5.4. The detected weight percentages are about 22.07 ± 4.34%
Oxygen, 5.53 ± 1.91% Yttrium, 40.21 ± 4.96% Barium and 32.19 ± 4.63% Cerium.

95
Figure 5.4: The EDXS scan of BCY20 pellet surface
In order to obtain the stoichiometric ratios from the EDXS data, the moles of each element
should be calculated. The mole of each element in the membrane is obtained by dividing the
weight percent of each element by its molecular weight. By choosing barium as a basis
element, the amounts of elements are divided by the amount of moles of barium present and
the calculated stoichiometric ratios are presented in Table 5.1.
Table 5-1: Calculated stoichiometric ratios for BCY20 from the EDXS results.
Membrane Condition Approximate atom (%)
Ba Ce Y O
BCY20 bare 14.9 ± 1.8 11.7 ± 1.7 3.2 ± 0.9 70.2 ± 13.9
BCY20 bare
Stoichiometric ratio
Ba Ce Y
1 0.78 0.21
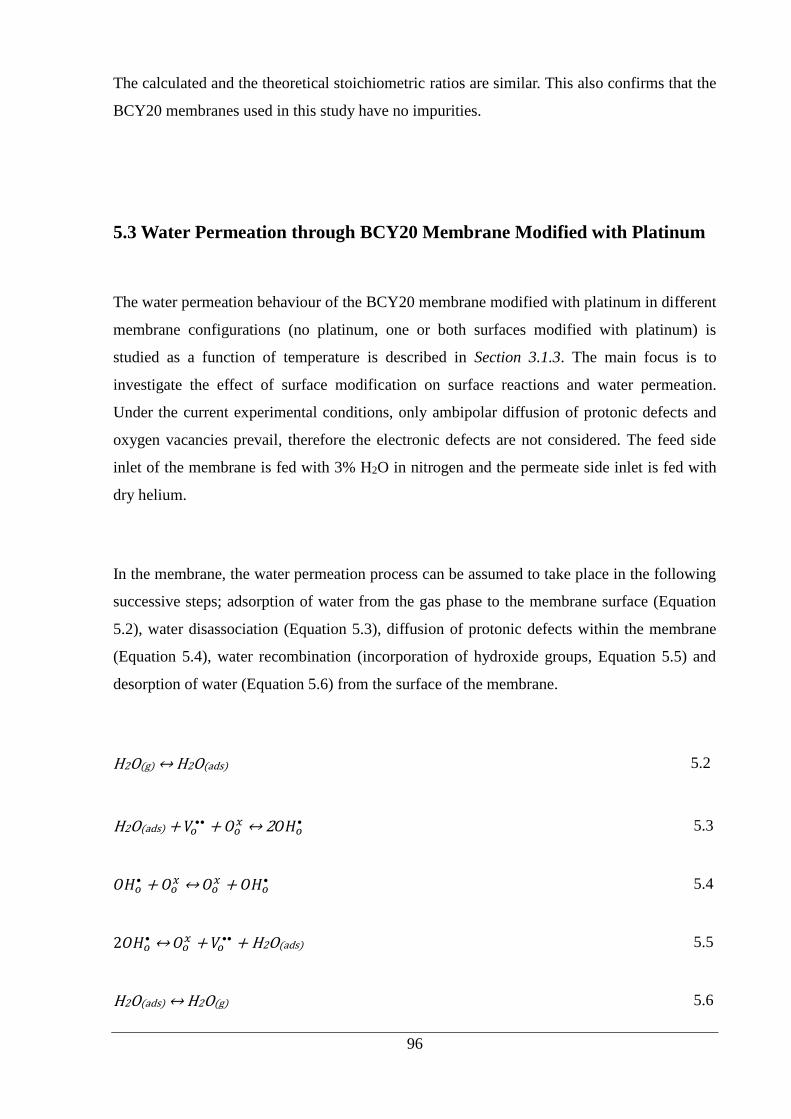
96
The calculated and the theoretical stoichiometric ratios are similar. This also confirms that the
BCY20 membranes used in this study have no impurities.
5.3 Water Permeation through BCY20 Membrane Modified with Platinum
The water permeation behaviour of the BCY20 membrane modified with platinum in different
membrane configurations (no platinum, one or both surfaces modified with platinum) is
studied as a function of temperature is described in Section 3.1.3. The main focus is to
investigate the effect of surface modification on surface reactions and water permeation.
Under the current experimental conditions, only ambipolar diffusion of protonic defects and
oxygen vacancies prevail, therefore the electronic defects are not considered. The feed side
inlet of the membrane is fed with 3% H2O in nitrogen and the permeate side inlet is fed with
dry helium.
In the membrane, the water permeation process can be assumed to take place in the following
successive steps; adsorption of water from the gas phase to the membrane surface (Equation
5.2), water disassociation (Equation 5.3), diffusion of protonic defects within the membrane
(Equation 5.4), water recombination (incorporation of hydroxide groups, Equation 5.5) and
desorption of water (Equation 5.6) from the surface of the membrane.
H2O(g) ↔ H2O(ads) 5.2
H2O(ads) + 𝑉𝑜•• + 𝑂𝑜
𝑥 ↔ 2𝑂𝐻𝑜•
5.3
𝑂𝐻𝑜• + 𝑂𝑜
𝑥 ↔ 𝑂𝑜𝑥 + 𝑂𝐻𝑜
• 5.4
2𝑂𝐻𝑜• ↔ 𝑂𝑜
𝑥 + 𝑉𝑜•• + H2O(ads) 5.5
H2O(ads) ↔ H2O(g) 5.6

97
Figure 5.5 shows the leakage corrected water permeation flux for membrane surfaces
modified with platinum. Pt|BCY20 represents the membrane configuration where the feed
side of the membrane is modified with platinum and the permeate side is bare. Similarly,
Pt|BCY20|Pt represents the membrane configuration where the both sides of the membrane
are modified with platinum. BCY20 represents the membrane configuration of bare
membrane with no modification while BCY20|Pt represents the membrane configuration
where only permeate side of the membrane is modified with platinum. Figure 5.5 exhibits
that surface kinetics have an effect on water permeation.
Figure 5.5: Molar fluxes of water permeated across the BCY20 membrane for four different
membrane configurations (platinum is only on the feed side, platinum on both sides, without any
platinum and platinum is only on the permeate side) at the temperature range from 500 °C to 800 °C.
(Feed side inlet gas concentration: 3% H2O in nitrogen; permeate side inlet gas concentration: dry
helium, flow rates of gases are 100 ml/min). Platinum surfaces are sintered at 980 °C for 10 min, is ~5
µm thick and ~61% porous.
The influence of platinum on the surface offers an important starting point to the
understanding of surface mechanism of water permeation through the membrane. It can be

98
observed from Figure 5.5 that the water permeation increases as the temperature rises from
500 °C to 800 °C. This suggests that the process is thermally activated and temperature plays
an important role on surface reaction rates and/or bulk diffusion of protons and oxygen
vacancies possibly through an increase in diffusion coefficients. 700 °C is an optimum
temperature for operation of intermediate temperature solid oxide fuel cell and water
permeation [3, 51].
The application of platinum on the feed side surface of the membrane slightly increases water
permeation (Figure 5.5). A water permeation flux of ca 13 nmol/cm2s is obtained at 700 °C
for unmodified BCY20 membrane whereas a water permeation flux of ca 17 nmol/cm2s is
obtained for Pt|BCY20 membrane under similar operating conditions. The surface reaction
on the feed side of the membrane composes of multiple steps such as adsorption of water onto
the membrane surface, dissociation of water and incorporation of hydroxyl groups and proton
into the membrane (Equation 5.3). All these steps contribute to the permeation in the same
direction. This implies that platinum coating on the feed side surface of the membrane
enhances the combined rate of water adsorption, dissociation and incorporation into the
membrane.
It is known that [118, 119] surface coatings such as platinum and silver accelerates oxygen
exchange kinetics strongly and lowers the activation energy of oxygen dissociation on its
surface compared to membrane surface without metallic coating. Similarly, another study by
Yu et al [120] showed that platinum is highly catalytic for incorporation of protons into the
bulk of Fe–doped SrTiO3 membrane and Mather et al [121] reported an increase in hydrogen
permeation for feed side platinum coated SCYb (Sr0.97Ce0.9Yb0.1O3-δ) membrane. Also,
Hancke et al [122] investigated the effect of platinum on the surface exchange rate of
hydrogen. Their result showed that platinum slightly decreased activation energy for surface
exchange of hydrogen and the authors suggested that either hydrogen dissociation or charge
transfer is rate limiting for platinum coated BCY10 surface. Platinum (Pt[110]) dissociates
water on its surface with an activation energy of 0.44 eV [123] whereas the BCY membrane
dissociates water on its surface with an activation energy of ~ 0.54 eV [15]. Therefore it is
speculated that, similar to the reports of oxygen and hydrogen dissociation and incorporation
into membranes, in this study platinum can also accelerate the dissociation and incorporation
of water (as hydroxyl groups) into the membrane. As a result of that there is an increase in

99
concentration of hydroxyl groups on the feed side surface of the membrane. This would
increase the concentration gradient of hydroxyl groups across the membrane, leading to high
water permeation rate across the membrane.
This study (see Section 4.4.2) and literature suggests that the diffusion of protons across the
membrane is faster than that of the oxygen vacancies [14, 91]. Increasing the concentration of
hydroxide groups on the feed side membrane surface increases the protonic defects within the
bulk of the membrane. This increases the rate of transport of protonic defects across the
membrane which in turn increases the rate of transport of oxygen vacancies in the bulk of the
membrane to maintain electro–neutrality. This is another speculation for the enhancement of
water permeation rate observed in Figure 5.5 in the presence of platinum on the feed side
surface.
The activation energy for the process of water permeation through Pt|BCY20 and BCY20 is
calculated from Arrhenius plot (Figure 5.6). The calculated activation energies are 19.8±0.6
kJ/mol for Pt|BCY20 and 22.3±0.7 kJ/mol for bare BCY20. This indicates that platinum
coating decreased the activation energy as compared to bare surface. As previously discussed
the low activation energy of water dissociation on platinum surface enhances the water
permeation rate through the membrane.

100
Figure 5.6: Arrhenius representation of water permeation for catalytically modified membrane
surfaces. Water concentration is 3% in nitrogen on the feed side, helium is used on the permeate side.
Conversely, it is observed from Figure 5.5 that the rate of water permeation decreases when
platinum is applied on the permeate side surface of the membrane and both the sides of the
membrane as compared with the bare membrane. The water permeation flux is ca 11
nmol/cm2s for Pt|BCY20|Pt and ca 7 nmol/cm2s for BCY20|Pt membrane at 700 °C. This
leads to the assumption that platinum is not catalytically active for water recombination or
water desorption. The obtained activation energies (from Figure 5.6) for both membrane
configurations were 31.8±1 kJ/mol and 37.9±1.1 kJ/mol, respectively.
Recombination of water is a reaction between proton and oxygen on the permeate side which
may follow a different path than feed side. This is based on the observations in Figure 5.5
where the overall water permeation flux is decreased by the surface modifications on the
permeate side. By assuming that surface morphology of the platinum layer is similar to the
bare surface on the permeate side (since surface morphology affects active catalytic area), it
can be speculated that platinum on the permeate side has a lower number of active sites for
water recombination due to some site–blocking mechanism as compared to the bare
membrane surface.

101
The formation of one O−H bond depends upon breaking another O−H bond and protons could
exchange with partner hydroxyl atoms to form water on the permeate platinum surface. Thus,
evolution of water on the permeate side relies on instantaneous recombination of protons and
oxygen. The combination energy of water on the platinum surface has the same activation
energy as water dissociation. But the recombination of two hydroxyl groups on the platinum
surface with evolution of water can lead to the formation of adsorbed oxygen on the platinum
surface. This adsorbed oxygen may limit the recombination of other hydroxyl groups to form
water and as a consequence reduce the water evolution from the surface. This is not the case
with bare membrane surface. It has been reported that [124] water desorption from platinum
surface does not have simple kinetics, but rather have several paths, including OH
recombination and O–surface coverage. However, it is not clear which step is the rate
determining step.
Another possible explanation would be the slow kinetics of hydroxyl group desorption from
the membrane surface to the platinum surface on the permeate side and low ionic conductivity
of platinum. Hence, the effective electrochemical active area is reduced by dense part of
platinum on the permeate side for water recombination. The water permeation rate will
therefore be limited by surface recombination of hydroxyl groups in the case of platinum
coated permeate side surface.
Alternatively there might be the existence of counter reaction which could give the impression
of a decrease in water permeation. Instead of water permeation, platinum may catalyse
hydrogen evolution from the system (𝐻2𝑂 + 𝑉𝑜•• + 2𝑒′ → 𝑂𝑜
𝑥 + 𝐻2) [125]. However, it was
difficult to determine the hydrogen leaving the membrane under the current experimental
conditions since the difference in water flux should correspond to hydrogen evolution which
is below the accuracy of mass spectrometer. Also, this reaction will lead to a decrease in the
concentration of oxygen vacancies within the membrane, and hence the water permeation.
Nonetheless, there was no reduction observed in water permeation over many hours.
The difference in the mechanism of water permeation between Pt|BCY20|Pt and BCY20|Pt
membrane configurations cannot be distinguished easily. The difference in two cases may be

102
attributed to different amount, distribution and morphology of platinum deposited on the
permeate side membrane surface.
The blocking effect is further investigated by using a dense platinum layer on the permeate
side (Figure 5.7a) produced via pulsed laser deposition technique (Giessen, Germany).
However, no conclusive result is obtained from these experiments due to the fact that the
surface coverage area of platinum is smaller than the alumina tube diameter facing the
membrane surface. In addition, examination of the membranes after the experiment exhibits
that the dense platinum layer is deformed (Figure 5.7b and Figure 5.7c).
Platinum layer seems cracked in Figure 5.7b and 5.7c. This deformation of platinum layer
could be attributed two reasons: water permeation or different thermal expansion coefficients
of materials. In the case of water permeation, the amount of water that incorporated into the
membrane on the feed side needs to come out on the permeate side due to chemical potential
difference of water between surfaces. If dense platinum layer blocks water evolution, water
may create a path by deforming platinum layer to evolve. In the second case, platinum and
BCY20 have different thermal expansion coefficients: 9×10⁻⁶ K and 14-16×10-6 K,
respectively. Platinum may crack during temperature increase from room temperature to
700⁰C since it has lower thermal expansion coefficient than BCY20.

103
Figure 5.7: a) SEM image of dense platinum layer before the experiment. b) SEM image of platinum
layer after the experiment. c) A photo of platinum layer after the experiment taken with the Dino-lite
digital microscopy.
5.4 Membrane Based Water Gas Shift Reaction Coupled with Water
Permeation through BCY20 Membrane Modified with Platinum
In order to determine the possibility for the use of BCY20 perovskite material (with and
without catalytic surface modification, similar to Section 5.3) as a membrane in a reforming
membrane reactor the following study is intended. The experimental design is done in a way
that water splitting reaction takes place on one side of the membrane while water gas shift
reaction takes place on the other side. The results are intended to provide information about
the possibility of coupling these reactions together in a membrane reactor using BCY20
perovskite material. Additionally the stability of the membrane is studied before introducing it
in the exothermic fuel cell with charge transfer reactions.

104
All the experiments are performed in three steps at 700 °C for over 45 hrs. The experimental
details are given in Section 3.1.4c. In step one, helium and argon are introduced to permeate
and feed side, respectively to flush the system of any residual and entrapped air. In step two,
3% H2O in argon is introduced to the feed side and helium is fed to the permeate side to
monitor water permeation. The carrier gas is switched from nitrogen to argon in this step (as
compared with Section 5.3) as nitrogen and carbon monoxide have the same mass/charge ratio
(m/z=28) which generates a problem of differentiating these gases in the mass spectroscopy
i.e. if there are any leaks/bypass in the system. Finally, in step three, helium is switched to
about 1% carbon monoxide in helium in the permeate side while the feed side gas is kept the
same as 3% H2O in argon.
The results are obtained by plotting the mole fraction of gases in the permeate side (ordinate)
against time (abscissa), exemplified in Figure 5.8. To aid the discussion, these mole fractions
are converted to production rates (nmol/cm2s) using Equation 3.2. The performances of the
membranes are compared in terms of the rate of product formation, particularly hydrogen.
The rate of hydrogen formation is taken as a basis for water permeation in step three, since the
only source for hydrogen is water in the system.
One limitation in the analysis could be an error in evaluation of carbon dioxide mole fractions
on the permeate side. This error can arise due to a reaction between feed gas and
membrane/sealant and/or carbon monoxide disproportionation (Equation 2.29). The limitation
in the evaluation of carbon dioxide mole fraction is overcome by, subtracting the mole
fraction of the lean carbon dioxide emission obtained in the absence of water–gas shift
reaction, from the mole fraction of carbon dioxide obtained in the presence of water–gas shift
reaction. This is given by the Equation 3.3 (Section 3.1.4c).

105
a) BCY20 Membrane
The mole fractions of outlet gas, including carbon monoxide, carbon dioxide, hydrogen,
oxygen, water, argon and helium, on the permeate side of the bare BCY20 membrane are
illustrated in Figure 5.8. As explained previously, during step one, helium is supplied to the
permeate side whereas argon is supplied to the feed side so as to totally purge out any
entrapped/adsorbed air from the membrane. An insignificant trace of argon detected in
permeate side (<0.002 %) indicates that the membrane is well sealed.
In step two, 3% H2O in argon is supplied to the feed side for water permeation studies. As
seen in Figure 5.8b (step two) that after an initial increase water permeation reached a steady
state of ca 9 nmol/cm2s. The initial increase is attributed to the hydration of membrane for
water permeation. The driving force for water permeation is the partial pressure difference
between the surfaces.
In step three, about 1% carbon monoxide in helium is introduced to the permeate side of the
membrane. An increase in oxygen and mass 28 peaks suggests that there is some residual air
purged into the permeate side possible from the dead volume of the switching valve. The
direct analysis of the results for water permeation coupled with water–gas shift reaction
within the first 3 hrs of step three is difficult. This is due to the fact that wide possibilities of
side reactions are envisioned within these 3 hrs. These involve reactions such as water–gas
shift reaction, carbon monoxide oxidation and carbon monoxide disproportionation reaction.

106
Figure 5.8: Permeate side outlet gas compositions for bare BCY20 membrane configuration at 700 °C
(mass 28, oxygen, hydrogen and carbon dioxide). The flow rates of gases are 100 ml (STP)/min.
During step one: permeate side inlet: He; feed side inlet: Ar. During step two: permeate side inlet: He;
feed side inlet: 3% H2O in Ar. During step three: permeate side inlet: 1% CO in He; feed side inlet:
3% H2O in Ar. a) mass spectrometer data b) hygrometer data (water)
It is also observed from Figure 5.8a step three that there is a delay followed by a slow increase
in hydrogen formation after the introduction of 1% carbon monoxide in helium on the
permeate side of the membrane. Carbon dioxide formation is observed as soon as helium is
switched to 1% carbon monoxide, however hydrogen is not observed for about one and half
an hour in step three. In addition, a rapid increase in water evolution is observed
simultaneously during the first three hours of introduction of 1% carbon monoxide in helium
on the permeate side of the membrane. One reason for this observed delay in hydrogen
formation and the rapid increase in water permeation could be that the hydrogen formed in the
water–gas shift reaction is oxidised by the oxygen from the residual air (Equation 5.7). There
is also a possibility that there is some water vapour contained in the residual air.
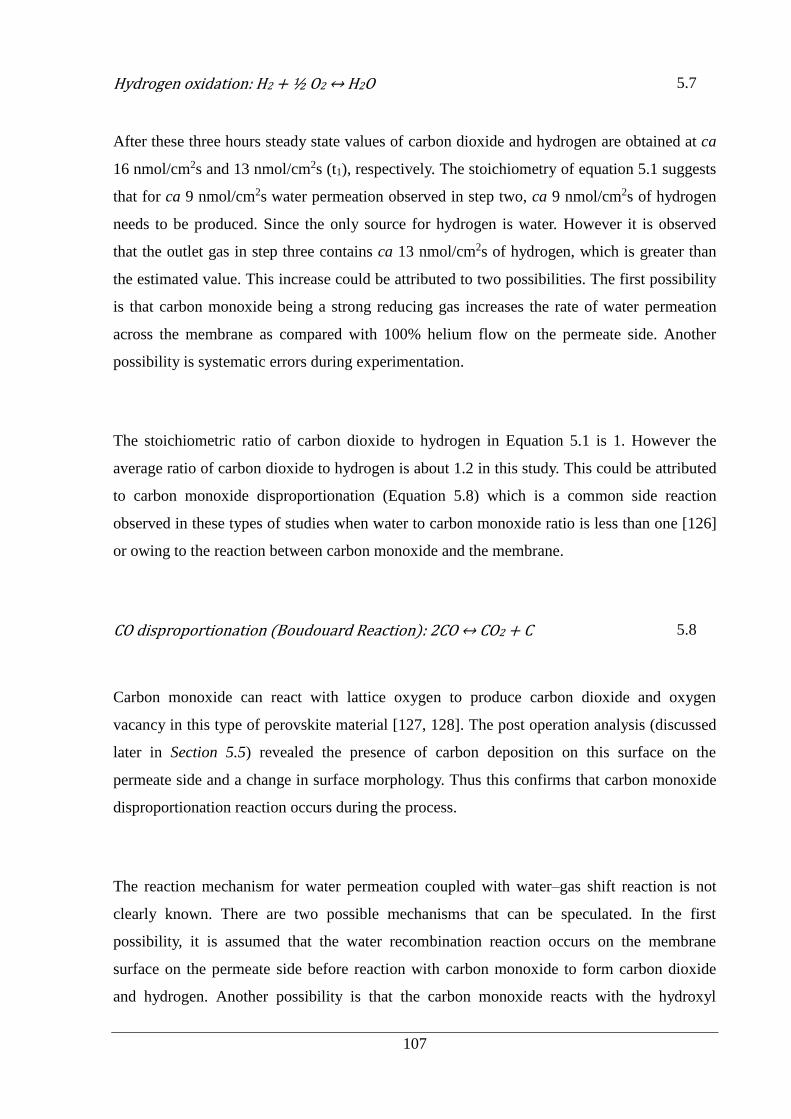
107
Hydrogen oxidation: H2 + ½ O2 ↔ H2O 5.7
After these three hours steady state values of carbon dioxide and hydrogen are obtained at ca
16 nmol/cm2s and 13 nmol/cm2s (t1), respectively. The stoichiometry of equation 5.1 suggests
that for ca 9 nmol/cm2s water permeation observed in step two, ca 9 nmol/cm2s of hydrogen
needs to be produced. Since the only source for hydrogen is water. However it is observed
that the outlet gas in step three contains ca 13 nmol/cm2s of hydrogen, which is greater than
the estimated value. This increase could be attributed to two possibilities. The first possibility
is that carbon monoxide being a strong reducing gas increases the rate of water permeation
across the membrane as compared with 100% helium flow on the permeate side. Another
possibility is systematic errors during experimentation.
The stoichiometric ratio of carbon dioxide to hydrogen in Equation 5.1 is 1. However the
average ratio of carbon dioxide to hydrogen is about 1.2 in this study. This could be attributed
to carbon monoxide disproportionation (Equation 5.8) which is a common side reaction
observed in these types of studies when water to carbon monoxide ratio is less than one [126]
or owing to the reaction between carbon monoxide and the membrane.
CO disproportionation (Boudouard Reaction): 2CO ↔ CO2 + C 5.8
Carbon monoxide can react with lattice oxygen to produce carbon dioxide and oxygen
vacancy in this type of perovskite material [127, 128]. The post operation analysis (discussed
later in Section 5.5) revealed the presence of carbon deposition on this surface on the
permeate side and a change in surface morphology. Thus this confirms that carbon monoxide
disproportionation reaction occurs during the process.
The reaction mechanism for water permeation coupled with water–gas shift reaction is not
clearly known. There are two possible mechanisms that can be speculated. In the first
possibility, it is assumed that the water recombination reaction occurs on the membrane
surface on the permeate side before reaction with carbon monoxide to form carbon dioxide
and hydrogen. Another possibility is that the carbon monoxide reacts with the hydroxyl

108
groups on the membrane surface, that are formed during water permeation (Equation 5.3), to
liberate carbon dioxide and hydrogen.
It is to be noted that the first 3 hrs have similar results for the next set of studies involving
platinum coating on membranes and it is expected that the reasons for this observation is
same as in the study of bare membrane. Thus the discussion for the first 3 hr analysis has been
omitted from the next sections.
b) Pt|BCY20|Pt Membrane
The permeate side outlet gas composition for Pt|BCY|Pt membrane reactor is given in Figure
5.9. The same experimental steps are followed as the previous membrane system as explained
in Section 3.1.4c. The results of step one and two are similar to that observed in the case of
bare membrane. The Pt|BCY20|Pt membrane exhibits a water permeation of ca 7 nmol/cm2s
which is expected based on the observations of water permeation studies (Section 5.3). The
membrane displays similar behaviour as bare BCY membrane when carbon monoxide was
introduced to the permeate side. Carbon dioxide level increases quickly due to water–gas shift
reaction (Equation 5.1), carbon monoxide disproportionation reaction (Equation 5.8) and
carbon monoxide oxidation (Equation 5.9) (due to some oxygen purge from dead volume of
gas lines). Finally, hydrogen and carbon dioxide rate reach a steady state values of ca 9
nmol/cm2s and ca 13 nmol/cm2s (at t2), respectively. As compared with bare membrane there
is reduction in the hydrogen and carbon dioxide rate. This could be associated to the low
water permeation observed in Section 5.3 for Pt|BCY20|Pt membrane.
Carbon monoxide oxidation: CO + ½O2 ↔ CO2 5.9

109
Figure 5.9: Permeate side outlet gas compositions for feed side_Pt|BCY|Pt_permeate side membrane
configuration at 700 °C (mass 28, oxygen, hydrogen and carbon dioxide), The flow rates of gases are
100 ml (STP)/min. During step one: permeate side inlet: He; feed side inlet: Ar. During step two:
permeate side inlet: He; feed side inlet: 3% H2O in Ar. During step three: permeate side inlet: 1% CO
in He; feed side inlet: 3% H2O in Ar. a) mass spectrometer data b) hygrometer data (water)
c) BCY20|Pt Membrane
The result plot for BCY20|Pt membrane displays similar trend as bare membrane seen from
Figure 5.10. A final steady state value for water permeation of ca 7 nmol/cm2s is observed in
step two. The water permeation of Pt|BCY20|Pt membrane and BCY20|Pt membrane are
similar, this is similar to the conclusion of Section 5.3. This result is expected as compared to
the bare membrane (Section 5.3). The steady state amount of carbon dioxide and hydrogen
were ca 14 nmol/cm2s and ca 13 nmol/cm2s (at t3), respectively. It has been observed that a

110
trend of higher rates of carbon dioxide to hydrogen exists in all catalytic/non–catalytic
membrane configurations studied so far.
Figure 5.10: Permeate side outlet gas compositions for feed side_BCY|Pt_feed side membrane
configuration at 700 °C (mass 28, oxygen, hydrogen and carbon dioxide), The flow rates of gases are
100 ml (STP)/min. During step one: permeate side inlet: He; feed side inlet: Ar. During step two:
permeate side inlet: He; feed side inlet: 3% H2O in Ar. During step three: permeate side inlet: 1% CO
in He; feed side inlet: 3% H2O in Ar. a) mass spectrometer data b) hygrometer data (water).

111
d) Pt|BCY20 Membrane
The Pt|BCY20 membrane demonstrated the best performance compared to other membrane
configurations in terms of water permeation (Section 5.3). The water permeation rate is ca 12
nmol/cm2s was obtained in step two. Similarly the steady state rate of carbon dioxide and
hydrogen are ca 20 nmol/cm2s and ca 18 nmol/cm2s (at t4) as shown in Figure 5.11. The water
permeation rate is found to have increased by a factor of ca 1.5 when 1% carbon monoxide in
helium is used on the permeate side instead of an inert gas alone in Pt|BCY20 membrane
calculated from hydrogen rate. This increase in water permeation is higher than other
membrane configurations. It can therefore be concluded that Pt|BCY20 membrane is the best
candidate for water permeation coupled with water–gas shift reaction.
Figure 5.11: Permeate side outlet gas compositions for feed side_Pt|BCY_permeate side membrane
configuration at 700 °C (mass 28, oxygen, hydrogen and carbon dioxide), The flow rates of gases are
100 ml (STP)/min. During step one: permeate side inlet: He; feed side inlet: Ar. During step two:
permeate side inlet: He; feed side inlet: 3% H2O in Ar. During step three: permeate side inlet: 1% CO
in He; feed side inlet: 3% H2O in Ar. a) mass spectrometer data b) hygrometer data (water)

112
The ratio of carbon dioxide to hydrogen is varied from 1.1 to 1.4 for all membrane
configurations. However, the rate of carbon dioxide formation is higher than the rate of
hydrogen formation for all membranes. By comparing the membrane performances in terms
of the rate of products, it can be suggested that platinum is not a good candidate for water
permeation coupled with water–gas shift reaction on the permeate side. However, it has a
positive role on the feed side of the membrane and could be used as a catalyst/electrode on the
feed side.
5.5 Post Operation Analysis
After simultaneous water permeation and water–gas shift experiments, the membranes are
characterised by XRD, SEM and EDXS analyses in order to check any possible change in the
structure, phase and chemical compositions of the membranes. The analysis will reveal the
chemical stability of the membranes directly under actual operating conditions including the
effects of multi–species transport, mass transport, and electrodes. The results from XRD
analysis are presented in Figure 5.12 and compared with fresh BCY20 membrane (Figure
5.12a).
Figure 5.12b displays the XRD result of feed side of the BCY20 membrane that is subjected
to 3% H2O in argon for about 45 hrs at 700 °C during water permeation and coupled with
water–gas shift experiment. Figure 5.12b indicates decomposition to CeO2 and BaCO3. This
instability in water containing environment is reported previously [129-131]. BaCeO3 reacts
with H2O and CO2 according to Equations below [132];
BaCeO3 + H2O → Ba(OH)2 + CeO2 5.10
BaCeO3 + CO2 → BaCO3 + CeO2 5.11

113
XRD analysis of feed side (where water is introduced) in Figure 5.12b depicts no peaks of
Ba(OH)2 due to a reaction between barium cerate and water. This might be due to loss of Ba
at high temperature which will result in Ba–deficient phases. Another possible explanation
might be the amorphous nature of Ba(OH)2 [133]. Also, the peak at 26⁰ 2θ might be CeO2 or
crystallised silicate in Figure 5.12b.
Figure 5.12: XRD patterns of the fresh and used BCY20 membranes. a) Fresh BCY20 membrane, b)
Feed side of the bare BCY20 membrane after the experiment, c) Permeate side of the bare BCY20
membrane after the experiment, d) Permeate side of the “feed_ Pt|BCY20_permeate” membrane after
the experiment. The perovskite structure is indicated by +, the peaks indicative of BaCO3, CeO2 and
Y2O3 are indicated by ▼,● and o, respectively.

114
Figure 5.12c and Figure 5.12d demonstrates the permeate side of the membrane that is
subjected to 1% carbon monoxide in helium about 30 hrs at 700 °C during the experiments. It
is seen that BCY20 lost most of its crystal structure and perovskite phase was no longer
recognisable. Both membranes decomposed to BaCO3 and CeO2. Also, multiple minor phases
are observed. The presence of SiO2 and Ag can be attributed to the sealant material that used
in the experiments. By taking into account the partial pressures of water (3%) in argon on the
feed side and carbon dioxide (about 0.02%) in helium on the permeate side, and the change in
phases (comparing the XRD traces), it can be said that barium cerate reacts easily with carbon
dioxide than water. However, in the presence of porous platinum electrode on both sides the
instability would be expected to be lower than the bare membrane surface. Due to the fact that
platinum covers the membrane surface partially and block the exposure to carbon dioxide and
water. The analyses of these surfaces are not presented here since XRD traces only showed
the characteristic of platinum peaks. Results indicate that BCY20 is unstable under water,
carbon monoxide and carbon dioxide containing environment.
SEM surface images of feed and permeate sides of BCY20 membranes, bare and platinum
surfaces, after the experiments are given in Figure 5.13. The Hitachi TM3030 Scanning
Electron Microscopy which has a premium secondary electron (SE) detector was used in the
analysis. Figure 5.13a and Figure 5.13b depict the feed side surfaces. Distributions of small
particles are observed in Figure 5.12a. EDXS measurements indicate an approximate atom
surface composition of ca 36.3% barium, ca 0.6% cerium and ca 63.1% oxygen in this
surface as given in Table 5.2. Table 5.2 displays the average atomic percentages, the
measurements are performed more than ones; see Appendix K for other EDXS results. By
taking into account XRD and EDXS analysis, these small particles can be ascribed to cerium
oxide. SEM image of platinum surface on the feed side displays a little agglomeration and
morphology change underneath, possibly a reaction between water and barium cerate
according to Equation 5.10.

115
Figure 5.13: Post operation SEM images of the external surfaces of feed sides (a&b) and permeate sides (c &d).
Feed side: a) bare surface b) platinum surface, Permeate side: c) bare surface d) platinum surface.
Figure 5.13c and Figure 5.13d show the permeate side surface images. Both surfaces indicate
a morphology change and distribution of black spots over the whole surfaces. Figure 5.13d
depicts agglomeration of platinum particles over the whole surface. EDXS analysis (Table
5.2) suggests carbon content on these surfaces and implies higher carbon content in the
presence of platinum on that surface. This displays that carbon accumulation increases in the
presence of platinum on the permeate side which could be owing to carbon monoxide
disproportionation under this condition. Another reason might be carbon monoxide binding of
platinum active sites since carbon monoxide can bind platinum strongly even at low ppm
levels [134, 135]. In the case of Figure 5.13c, the surface morphology change could also be
due to solid–gas reaction on the BCY20 surface since carbon monoxide could adsorb and
react with the lattice oxygen [136]. The presence of silicon in Table 5.2 can be attributed to
the sealant used in this study.

116
Table 5-2: Post operation EDXS average surface compositions of feed sides and permeate sides.
Location
Approximate atom (%)
Ba Ce Y O Pt Si C
Feed side, bare
surface 36.3±2.96 0.6±0.40 - 63.1±2.61 - - -
Feed side,
platinum surface - - - - 100±0.01 - -
Permeate side,
bare surface 24.8±0.49 0.6±0.35 0.1±0.18 70.3±1.08 - - 4.2±1.33
Permeate side,
platinum surface 3.4±0.46 - - - 22.6±0.29 2±0.35 72±1.10
5.6 Summary and Conclusions
In this chapter, BCY20 perovskite material catalytically modified/unmodified are used as
membranes so as to perform water permeation and simultaneous water permeation and water
gas shift experiments. The first set of experiments showed that platinum can increase water
permeation when it is applied on the feed side surface of the membrane, suggesting that
platinum is catalytic for water dissociation/ incorporation. A decrease is observed in water
flux when platinum is coated on the permeate side of the membrane compared with bare
membrane. This implies that platinum has a negative role in water recombination. Platinum
coating on the permeate side seems to create a blocking mechanism for water recombination.
This could be due to the fact that platinum reduces the active sites for recombination on the
permeate side or low ionic conductivity of platinum layer.
The second set of experiments (water permeation coupled with water–gas shift reaction
experiments) is conducted for four different membrane configurations in three steps for over
45 hrs. By comparing the rate of hydrogen production in step three and water flux in step two,
it is found that the water permeation rate depicted an increase in the presence of reducing gas
on the permeate side in step three. Moreover, the water permeation rate and post operation
analysis suggest that the presence of platinum on the permeate side is detrimental for both
water permeation and water–gas shift reaction.

117
Platinum coating on the permeate side surface of the membrane decreased water permeation
via a site–blocking mechanism and also increased carbon deposition via carbon monoxide
disproportionation reaction. In addition, post operation SEM images of permeate side
platinum shows agglomeration which in turn reduces the available porous surface area for
water recombination. On the other hand, unmodified permeate side surface of the membrane
analysis exhibits decomposition into cerium oxide and barium cerate. Neither platinum nor
bare BCY20 membrane is favourable for water permeation and water–gas shift reaction on the
permeate side of the membrane. In the case of practical membrane applications, a better
electrode which has less catalytic activity towards carbon monoxide disproportionation and
high catalytic activity for hydrogen/oxygen evolution should be preferred.
The equilibrium carbon monoxide conversion of water–gas shift reaction at 700 °C with a 1:1
ratio of water to carbon monoxide is reported as 55% by Haryanto et al [137]. That ratio is
very low (about 0.01) under these experimental conditions which resulted in undesirable side
reactions (e.g. carbon monoxide disproportionation). In order to achieve full carbon monoxide
conversion higher water flux is needed. By assuming that membrane thickness is a rate
limiting step of bulk diffusion and the relationship between water flux and membrane
thickness is linear, a 35–fold decrease in membrane thickness (~34 µm) is required to provide
sufficient water flux for full carbon monoxide conversion in the case of using Pt|BCY20
membrane reactor which gives a better performance in terms of water permeation and stability
than other membrane configurations under the current experimental conditions. In addition,
platinum should not be preferred as an electrode on the permeate side of the membrane in the
case of using a water permeable electrolyte. While the water permeation seems to very low
for practical operation of a solid oxide fuel cell, this study enables evaluating the concept and
guides towards improving of membrane performance.

118
Chapter 6
Investigation of Simultaneous Water and
Oxygen Transport through BCY20 Membrane
for IT-SOFCs
6.1 Introduction
In conventional hydrocarbon–fuelled fuel cells, water is injected to the anode side which
results in several problems in terms of the cell degradation and efficiency as discussed in
Section 2.4.3. Water permeable electrolytes could offer introduction of water to the cathode
side along with air as oxidant and could eliminate most of these problems. Water permeation
from the cathode side of cell to the anode side could facilitate hydrocarbon reforming so that
IT–SOFCs can directly use hydrocarbon fuels without any previous reforming treatment.
Moreover, as the process continues water will be generated as a result of fuel cell reactions,
hence with sufficient time, the introduction of water to the cathode side may even be
decreased or interrupted. For a water permeable electrolyte to be viable for hydrocarbon
reforming in IT–SOFCs it is important to understand the coupled transport mechanism for
water and oxygen from cathode side to anode side.
The main charge carriers for both water and oxygen transport in perovskite type of materials
are protons (H•) and oxygen vacancies (VO••) [138]. The transport of water starts with water
splitting reaction at the interface between the electrode and electrolyte or on the electrolyte
surface (H2O(g) + 𝑉𝑜•• + 𝑂𝑜
𝑥 ↔ 2𝑂𝐻𝑜•). Then, the transport of water within the electrolyte takes
place as follows:

119
OHO•+ OOx ↔OOx + OHO• 6.1
The oxygen incorporation into the electrolyte and desorption from the electrolyte at the
electrode–electrolyte interface , are shown by the reversible reaction [139]:
1/2 O2(g) + 2e′ + VO•• ↔ OOx 6.2
where e′ is the electron from the electrode, VO•• is the oxygen vacancy and OOx is the lattice
oxygen. The transport of oxygen within the electrolyte is expressed by Equation 6.3 [118,
140]:
OOx 𝑉𝑜•• ↔ OOx
6.3
Equation 6.2 involves a number of steps including adsorption, disassociation, ionisation and
incorporation of oxide ions into the oxygen vacancies of lattice at the electrochemically active
region. The electrochemically active regions are the three phase boundaries in fuel cells where
electrode, electrolyte and gas phase are in contact [141, 142] and necessary when electrode
possesses electronic and electrolyte possesses ionic conductivity. Also, Equation 6.3 displays
bulk diffusion. The BCY20 electrolyte is capable of transporting both oxygen and water at the
same time under fuel cell operating conditions as shown in Figure 6.1. However, Equations
6.1 to 6.3 indicate that both water and oxygen incorporation into the electrolyte and diffusion
within the electrolyte requires oxygen vacancies and oxygen sites within the electrolyte,
assuming that both oxygen and water chemical potential gradients are in the same direction.
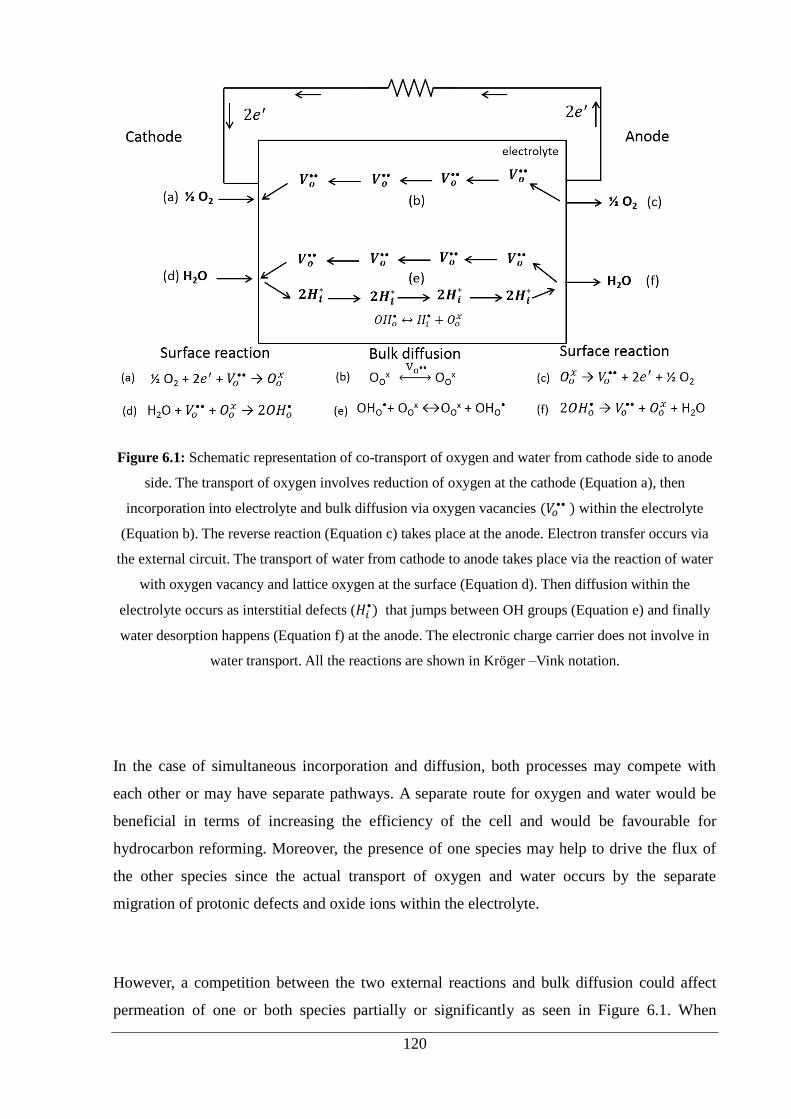
120
Figure 6.1: Schematic representation of co-transport of oxygen and water from cathode side to anode
side. The transport of oxygen involves reduction of oxygen at the cathode (Equation a), then
incorporation into electrolyte and bulk diffusion via oxygen vacancies (𝑉𝑜•• ) within the electrolyte
(Equation b). The reverse reaction (Equation c) takes place at the anode. Electron transfer occurs via
the external circuit. The transport of water from cathode to anode takes place via the reaction of water
with oxygen vacancy and lattice oxygen at the surface (Equation d). Then diffusion within the
electrolyte occurs as interstitial defects (𝐻𝑖•) that jumps between OH groups (Equation e) and finally
water desorption happens (Equation f) at the anode. The electronic charge carrier does not involve in
water transport. All the reactions are shown in Kröger –Vink notation.
In the case of simultaneous incorporation and diffusion, both processes may compete with
each other or may have separate pathways. A separate route for oxygen and water would be
beneficial in terms of increasing the efficiency of the cell and would be favourable for
hydrocarbon reforming. Moreover, the presence of one species may help to drive the flux of
the other species since the actual transport of oxygen and water occurs by the separate
migration of protonic defects and oxide ions within the electrolyte.
However, a competition between the two external reactions and bulk diffusion could affect
permeation of one or both species partially or significantly as seen in Figure 6.1. When

121
oxygen and water share active sites then, water may occupy oxygen adsorption sites at the
cathode surface. This would deteriorate the oxygen reduction reaction and incorporation into
the electrolyte or/and water may consume oxygen vacancies within the electrolyte. Resulting
in reduction of their concentration and hence reducing the oxide ion conductivity of the
electrolyte. One can equally consider oxygen to be occupying water sites at the cathode
surface or within the electrolyte and hence reducing the water permeation flux.
Another possibility is that they could both deteriorate each other’s transport partially instead
of one stops the other`s incorporation and diffusion completely. In order to utilise these
electrolytes in fuel cells the complex electrochemistry must be known. There has been no
attention to this mechanism in the oxidant side in terms of fuel cell application in the
literature. Therefore, a better understanding of the behaviour of this system can lead to a
better evaluation of the feasibility of water permeable electrolytes to be used for hydrocarbon
reforming. For instance, if water affects oxygen conduction significantly, this may undermine
the overall fuel cell efficiency. Since oxygen produces current and helps fuel combustion at
the anode. However, water transport would decrease temperature gradient and help reducing
carbon deposition.
Previous chapter has focused on the water permeation behaviour of the membrane and the
feasibility of water gas shift reaction via utilising the permeated water. In addition to that, the
first part of this study will evaluate the water, oxygen and simultaneous oxygen and water
transport by using current–overpotential characteristics and evolution of water and oxygen at
the anode. This will reveal the additive or hindering effect of water on oxygen incorporation
and transport, providing a direct and critical assessment of simultaneous water and oxygen
transport for IT–SOFCs. Finally, the second part of this study will look at the fuel cell
performance using various fuels for internal reforming and evaluate the ability of the
membrane for simultaneous multi–tasks.

122
6.2 Water Permeation under Polarisation
The results for water concentration without and with polarisation are presented in Figure 6.2.
The cathode side of the cell (previously referred as feed side, Chapter 5) represents where 3%
water in argon is fed and the anode side of the cell (previously referred as permeate side,
Chapter 5) represents where helium is fed. This terminology has been used throughout the
chapter to avoid confusion and ease the discussion. The working electrode is placed at the
cathode side. The anode outlet stream is analysed by using a hygrometer and a mass
spectrometer. Stable water concentration at the anode outlet is observed for 3600 s before
application of polarisation at a fixed temperature of 700 °C. Then the potential is applied from
0 V to -1 V at 3600 s. The insert in Figure 6.2a shows the water concentration before and
during the polarisation, where ‘a’ corresponds to 0 V and ‘k’ corresponds to -1 V applied
potential. The difference between each step is 100 mV with an acquisition time of 200 s to
monitor any change in water concentration with the applied potential. Figure 6.2a shows the
measured water concentration versus the applied potential between 0 V and -1 V, the steady
values are taken as the water concentration at each applied potential. Figure 6.2b presents an
I–V curve obtained during water concentration using the cell configuration in Figure 3.5a.
The anode side outlet stream monitored using the mass spectrometer, is also given in Figure
6.2c.

123
Figure 6.2: a) The water concentration is presented versus the applied potential. The potential is
applied between working (cathode) and reference electrode (anode side). The insert graph shows the
raw data that is obtained using the hygrometer at the anode outlet which exhibits the change in water
concentration at the anode side versus time. Argon is used as a carrier gas at the cathode side. (water
concentration is observed for 3600 s under non–polarised conditions, then the potential is applied
between 0 V and -1 V with -100 mV steps and the acquisition time is 200 s per set voltage, `a`
corresponds to 0 mV and `k` corresponds to -1 V, between a and k corresponds -100 mV step) b) The
current is presented versus the applied potential c) The oxygen concentration is observed at the anode
outlet using the mass spectrometer. All measurements are done at 700 °C.
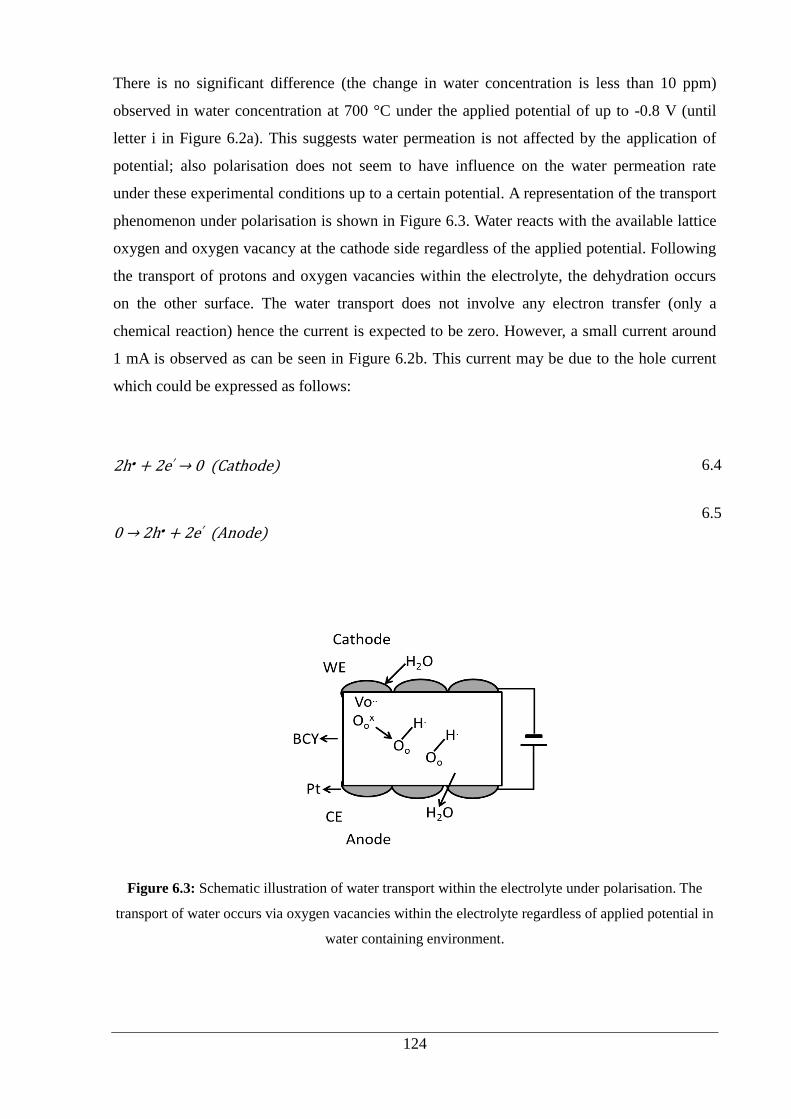
124
There is no significant difference (the change in water concentration is less than 10 ppm)
observed in water concentration at 700 °C under the applied potential of up to -0.8 V (until
letter i in Figure 6.2a). This suggests water permeation is not affected by the application of
potential; also polarisation does not seem to have influence on the water permeation rate
under these experimental conditions up to a certain potential. A representation of the transport
phenomenon under polarisation is shown in Figure 6.3. Water reacts with the available lattice
oxygen and oxygen vacancy at the cathode side regardless of the applied potential. Following
the transport of protons and oxygen vacancies within the electrolyte, the dehydration occurs
on the other surface. The water transport does not involve any electron transfer (only a
chemical reaction) hence the current is expected to be zero. However, a small current around
1 mA is observed as can be seen in Figure 6.2b. This current may be due to the hole current
which could be expressed as follows:
2h• + 2e′ → 0 (Cathode) 6.4
0 → 2h• + 2e′ (Anode)
6.5
Figure 6.3: Schematic illustration of water transport within the electrolyte under polarisation. The
transport of water occurs via oxygen vacancies within the electrolyte regardless of applied potential in
water containing environment.

125
As suggested by Grover [81], the hole current may be neglected at low and moderate oxygen
pressures demonstrating that water transport process is independent of an externally applied
potential and occurs due to chemical diffusion.
Subsequently, the water concentration starts to decrease at the anode side for the applied
potential values below -0.8 V. Simultaneously oxygen evolution at the anode side outlet
stream is observed represented in Figure 6.2c. This may be attributed to decomposition of
water on this side due to the following reasons. The voltage of water decomposition for
standard conditions at 700 °C is calculated as ~ 0.99 V. However, the potential is applied
versus reference electrode, not counter electrode (anode).Thus, -0.8 V is not the cell potential
between cathode (working electrode) and anode (counter electrode). Thus, the exact cell
potential is unknown. The reference electrode`s potential is assumed to be more or less stable
(versus hydrogen electrode) and taken as a pseudo reference.
On the other hand, water may decompose at lower potential than the theoretical value. This
may be owing to the fundamental difference between liquid water and gaseous water
electrolysis. The voltage of electrolytic water splitting at room temperature and 1 bar ambient
pressure is 1.23V (U⁰) [143]. However, when the water vapour is used, the partial pressure of
all gases is changeable. In this case, the decomposition voltage of water is given as follows
[143];
U = 𝑈°- 𝑅𝑇
2𝐹𝑙𝑛
𝑃𝐻2𝑂
√𝑃𝑂2 .𝑃𝐻2 6.6
Where U is the decomposition voltage of water, 𝑈° is the decomposition voltage of water at
standard conditions; R, T and F represent the universal gas constant, the temperature in Kelvin
and the Faraday constant, respectively. 𝑃𝐻2𝑂 is the partial pressure of water at the cathode
(working electrode) side, 𝑃𝑂2 is partial pressure of oxygen at the anode (counter electrode)
side, and 𝑃𝐻2 is partial pressure of hydrogen at the cathode.

126
Even for known 𝑃𝐻2𝑂 at the cathode, it is not possible to estimate the decomposition voltage
of water under these conditions since the cathode outlet stream is not analysed and partial
pressure of hydrogen is unknown. Also, 𝑃𝐻2 and 𝑃𝑂2 vary with the gas flow and the current.
This phenomenon of water splitting below standard decomposition voltage was observed and
reported in the literature by Walch et al [143].
As can be seen from Figure 6.2b and 6.2c, following the decomposition of water, oxygen
evolution is observed. Subsequently, the current density increases from ~ 0 A/cm2 to ~ - 0.14
A/cm2. This increase could correspond to proton and oxide ion current (electrolysis current)
due to water splitting. However, the cathode side outlet stream is not analysed. That is out of
the scope this work since the interest is investigation of water on oxygen transport. The water
decomposition can take place based on the following electrode reactions [144]:
Anode: H2O(g) → 2H• +2e′ + ½O2
O2-→ ½ O2 + 2e′
6.7
Cathode: 2H• +2e′ →H2
H2O(g) + 2e′ → H2 + O2-
6.8
It is also observed that decrease in water concentration at the anode side is not equal to
increase in oxygen concentration at the anode outlet, suggesting that oxygen is pumped from
cathode to anode electrochemically. Pumping hydrogen from anode to cathode is another
possibility due to mixed conductivity which in turn could affect water permeation rate. This
could be investigated further. However, since cathode side water concentration is much higher
than anode side water concentration, pumping oxygen would be much favourable.
In conclusion, water permeation is not affected by externally applied potential and it remains
as a chemical reaction rather than an electrochemical reaction. The driving force for this
reaction is the partial pressure difference of water between two surfaces.
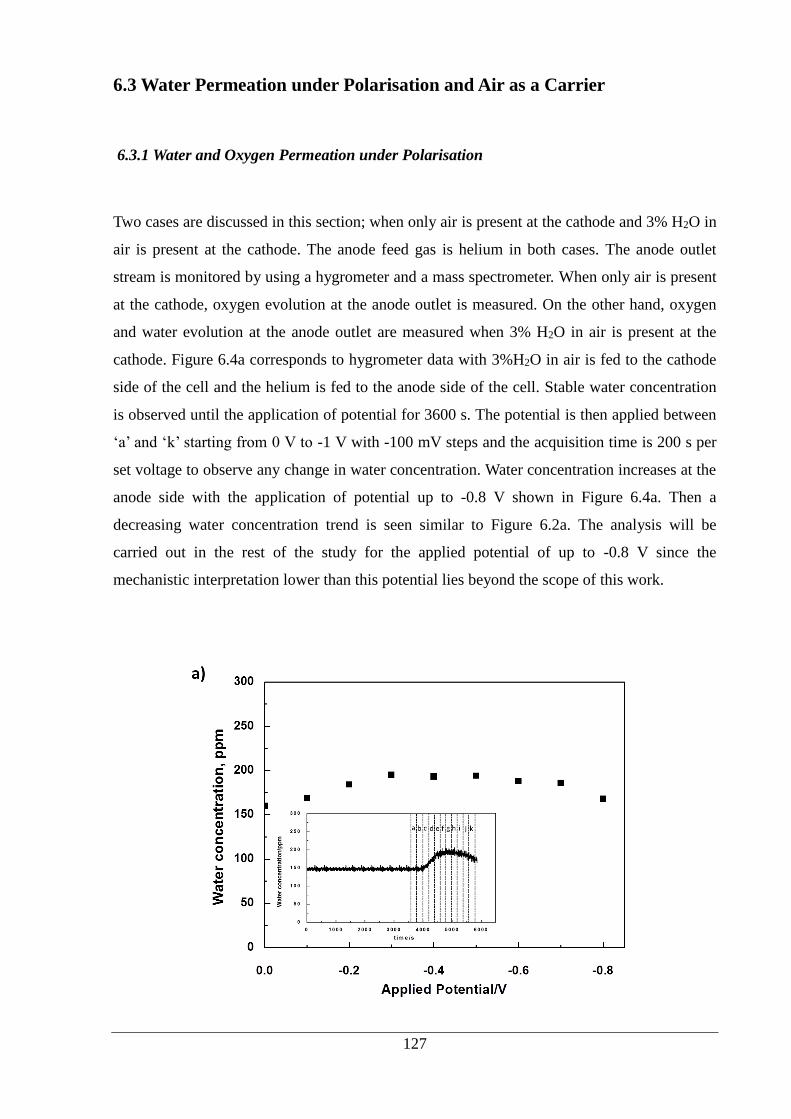
127
6.3 Water Permeation under Polarisation and Air as a Carrier
6.3.1 Water and Oxygen Permeation under Polarisation
Two cases are discussed in this section; when only air is present at the cathode and 3% H2O in
air is present at the cathode. The anode feed gas is helium in both cases. The anode outlet
stream is monitored by using a hygrometer and a mass spectrometer. When only air is present
at the cathode, oxygen evolution at the anode outlet is measured. On the other hand, oxygen
and water evolution at the anode outlet are measured when 3% H2O in air is present at the
cathode. Figure 6.4a corresponds to hygrometer data with 3%H2O in air is fed to the cathode
side of the cell and the helium is fed to the anode side of the cell. Stable water concentration
is observed until the application of potential for 3600 s. The potential is then applied between
‘a’ and ‘k’ starting from 0 V to -1 V with -100 mV steps and the acquisition time is 200 s per
set voltage to observe any change in water concentration. Water concentration increases at the
anode side with the application of potential up to -0.8 V shown in Figure 6.4a. Then a
decreasing water concentration trend is seen similar to Figure 6.2a. The analysis will be
carried out in the rest of the study for the applied potential of up to -0.8 V since the
mechanistic interpretation lower than this potential lies beyond the scope of this work.

128
Figure 6.4: a) The water concentration is presented versus the applied potential at the anode outlet
after polarisation is applied at 3600 s. Water concentration change versus time is also shown. Air is
used as carrier gas at the cathode side. (water concentration is observed for 3600 s under non-polarised
conditions, and then the polarisation is applied between 0 V and -1 V with 100 mV steps and the
acquisition time is 200 s per set voltage, ‘a’ corresponds to 0 mV, ‘k’ corresponds to -1 V with -100
mV step between them) b) Oxygen evolution is monitored at the anode outlet by the mass
spectrometer in the presence of only air and 3% H2O in air is present at the cathode and the anode gas
is helium.
Under non–polarised conditions water interacts with oxygen vacancies and the lattice oxygen
at the cathode side of the cell and forms two protonic defects at this surface. The protons then
jump from one oxygen site to another until they reach the other surface where dehydration
occurs, protons react with available surface oxygen atoms and leave the lattice. In the
presence of high oxygen partial pressure at the cathode side, oxygen may compete for oxygen
vacancies at this surface according to reaction shown in Equation 6.2. The water
concentration does not show any significant change when air is used as a carrier gas instead of
argon as shown in Figure 6.4a under the current experimental condition. This means that
under the non–polarised experimental conditions where oxygen partial pressure is ~ 0.2 atm
similar to air that is used in fuel cells, the presence of oxygen has no parasitic effect on water

129
permeation due to a competition for oxygen vacancies. It has been reported that this may be
the case in extreme conditions where the oxygen partial pressure is above 0.5 atm [85]. This
may be due to incorporation of water is more facile than incorporation of oxygen.
On the other hand, the water concentration alters with the application of the potential as
shown in Figure 6.4a. The electrochemical pumping of oxygen (polarisation) (Cathode:
½O2+2e′→O2- Anode: O2-→½O2+2e′) from the cathode side to the anode side increased the
water concentration slightly at the anode side as shown in Figure 6.4a. Under polarised
conditions where an electric field is established due to the potential difference between the
electrodes, the charged defects are free to migrate through the electrolyte and reach the other
electrode surface to oxidise. Oxygen pumping turns out to be an additional driving force for
water transport. However, the transport of water still relies on the ambipolar diffusion of
protonic defects and oxygen ion vacancies and independent of externally applied potential. An
explanation for the increase in water concentration might be; the removal of protons by
reacting available surface oxygen atoms at the anode side of the electrolyte surface. Pumping
oxygen to anode surface may increase the possibility of proton and oxygen recombination at
that high temperature at this surface.
Additionally, it is possible that the surface oxygen atoms may prefer to recombine with
protons (hydrogen) and form water again at the anode surface rather than leaving the
electrolyte as oxygen. This implies that protons can recombine with any available surface
oxygen and exchange partner oxygen atoms. The results also suggest that the presence of
oxygen in the feed stream may affect the diffusion of oxygen vacancy through the electrolyte
as compared with absence of oxygen in the feed stream. Similarly, Sakai et al [145] studied
the impact of water on oxygen transport for fluorite–type oxide ion conductor (YSZ) and
reported slightly lower oxygen diffusion coefficient for wet atmosphere than dry atmosphere.
Although, they have studied the effect of water on oxygen transport, the reverse effect is also
possible.
There is no significant decrease observed in oxygen evolution due to the presence of water in
air. Figure 6.4b suggests that oxygen evolution decreases slightly when water is introduced to
air at the cathode. This is possible due to a decrease in current and partial pressure of oxygen

130
(discussed later in Section 6.3.2). The concentration of oxygen in air is 20.5%, however, the
concentration of oxygen decreases to ~19.8% when 3% water is added to air.
The impact of humid atmosphere on oxygen transport was also studied for LAMOX family
oxide ion conductor La2Mo2O9 by Liu et al [95, 146, 147]. Their result exhibited a decrease in
oxygen diffusion coefficient. They explained this decrease by formation of hydroxyl groups at
the surface and capturing available oxygen vacancies, however, they did not point out whether
hydroxyl groups diffuse into the bulk or not. Therefore, it is also possible that adsorbed water
plays a role in the dissociation, reduction and incorporation of oxygen at the surface in this
study. This could be similarly because of reduction in the active sites at the electrolyte surface
for oxygen reduction reaction near the three phase boundary region or reduction available
oxygen vacancies at the surface for oxygen incorporation into the electrolyte. Further analysis
will be carried out in the next section by comparing currents that are obtained with and
without water in air at the cathode side.
6.3.2 Current –Voltage Curve
Figure 6.5 shows the current density overpotential characteristics when air (cell configuration
b in Figure 3.5) and 3%H2O in air (cell configuration c in Figure 3.5) are fed to the cathode
side and dry helium is fed to the anode side. The overpotential of the electrode is calculated
by subtracting the ohmic resistance of electrolyte from the applied potential between working
and reference electrode as described in Section 3.1.4d. The current density increases as
applied potential increases. However, Figure 6.5 demonstrates a slight decrease in current
density (maximum 50 mA/cm2) when water is introduced to air at the cathode. This is
speculated due to a decrease in oxygen partial pressure at the cathode side.
The data obtained in this study are consistent with the previously reported data by Guan et al
[148] who studied the transport properties of 5% yttrium–doped BaCeO3 with impedance
spectroscopy. Their total conductivity results in different atmospheres show that the total
conductivity decreased when 2% water is introduced to oxygen atmosphere. Additionally,
increasing electronic conductivity (hole conductivity) with increasing temperature (from 500
°C to 800 °C) and oxygen partial pressure has been reported for these types of materials in the

131
literature [10, 148-152]. This phenomenon is not studied in detail as it is beyond the scope of
the current research.
Figure 6.5: The current is presented versus overpotential. Measurements are done for two cases; only
air is present at the cathode and 3% H2O in air is present at the cathode. Helium is fed to anode.
In this study there is no significant impact observed in current and oxygen evolution due to
the presence of water in air. It has been demonstrated that BCY20 membrane allows both
water and oxygen transport under fuel cell operation conditions (i.e. under oxidising
environment and high temperature). In order to evaluate the effect of simultaneous oxygen
and water transport on the fuel cell performances, further investigation is performed by using
various fuels at the anode in the next section.
132
6.4 Fuel Cell Operations using Various Fuels with Simultaneous Water
Permeation
The operation of a SOFC with various fuels to evaluate its feasibility of hydrocarbon
reforming with the aid of water permeation from cathode side to anode side is carried out. The
performance of the fuel cell modules are evaluated by measuring the OCP and the current
associated with the application of potentials from OCP to 0 V with 1 mV/s step change. The
theoretical OCP at 700 °C with hydrogen as fuel and air as oxidant is calculated as ~999 mV,
based on the water formation reaction. This value is affected by the nature and composition of
fuel, gas leakage from the sealants and the kinetics of the electrode reactions. Figure 6.6
depicts the relationship between the overpotentials and the current density as well as I–V
curves when the fuel cell is tested using 5% H2 in helium at the anode as fuel and air and 3%
H2O in air at the cathode as oxidant.
The experimentally measured OCP value for hydrogen as fuel and air as oxidant is 948 mV
which is slightly lower, but still close to the theoretical value (~999 mV). The slight
difference may be due to gas leakage from the sealants. In the case of using 3% H2O in air at
the cathode the OCP of the cell decreased to 915 mV. Such phenomenon is observed when 5%
CO in helium or 5% CH4 in argon is used as fuel at the anode, too. This decrease may be due
to the change in oxygen partial pressure at the cathode side (Section 6.3.2). When, water is
added to anode, the partial pressure of oxygen drops.
The non–linear I–V curve indicates the existence of polarisation at the electrode/electrolyte
interface [153, 154]. Moreover, the platinum electrode polarisations are greater than the
electrolyte resistance, indicating that the performance of the cell is significantly affected by
the electrode polarisations. There is no activation losses observed in the IV curves possible
due to operating at high temperatures. The anode overpotential increases in both cases as the
current density increasing, demonstrating mass transport resistance in that region.
Akoshima et al [155] reported slow surface diffusion of adsorbed hydrogen near three phase
boundary as the rate determining step at Pt/BaCe0.95Y0.05O3-δ interface. However, they

133
observed that the overpotential of cathode decreased with the introduction of water to the
cathode side. This indicated that water can catalyse the cathode reaction kinetics and is
favourable for the cathode reactions. Similar result was obtained by Sakai et al [156] who
studied the effect of water on Pt|YSZ interface and reported an improvement on cathode
overpotential by addition of water to air, suggesting that reactions around three phase
boundary are rate determining. Therefore a similar effect of water facilitating cathode
reactions and thus decreasing the electrode resistance is observed in this study. The curvature
in the I–V curve can be attributed to adsorption or mass transport limitations.
Figure 6.6: I–V curves at 700 °C and dependence of overpotentials on current density a) Anode: 5%
H2, Cathode: Air, b) Anode: 5% H2, Cathode: 3% H2O in air

134
Depending on the composition of the gas fed to the cathode side of the cell, different OCP
values are obtained as shown in Figure 6.7. The current and power densities of the cells are
also presented in Figure 6.7. When 5% CH4 in argon is used at the anode, the OCPs obtained
for air and 3% H2O in air used at the cathode are 387 mV and 279 mV, respectively. By
replacing 5% CH4 in argon with 5% CO in helium at the anode 381 mV and 314 mV OCPs
are obtained. The lower OCPs with respect to hydrogen (when hydrogen is used as fuel) can
be explained by the decreased availability of hydrogen due to the decreased catalytic activity
of anode towards reforming of methane and water–gas shift reaction. Therefore, the low
OCPs cannot be attributed to the failure of the sealant as the OCP is restored to the value of
about 950 mV when the fuel is switched to hydrogen.
One reason for insufficient fuel reforming could be low water permeation. Similarly, carbon
monoxide poisoning of anode may be a reason for low current densities since platinum is used
as anode. Adsorption of carbon monoxide on the platinum surface can decrease active surface
area and thus cell performance as observed and explained by Mamlouk et al [157]. It is
known that platinum is not a very good catalyst for steam reforming [158, 159]. Nickel would
be a better catalyst for the anode of an SOFC and steam reforming, but a steam to carbon ratio
of greater than two is required to avoid carbon deposition [160].
The non–linearity in the I–V curves are not observed in these cases. This might be due to
lower current densities. The non–linearity in hydrogen fuel cells is observed for the current
densities of above 5 mA/ cm2. Nevertheless, the scope of this work is to investigate the
possibility of directly feeding a hydrocarbon fuel to the cell to evaluate simultaneous water
and oxygen transport from cathode side to anode side. Thus platinum electrodes are preferred
to other materials to have more easily reproducible cells. The maximum current density
obtained by using 5% CO as fuel at the anode is about two times higher than the obtained
maximum current density when 5% CH4 is used as fuel. However, the current density of the
cell is also limited due to the kinetics of anode electrode reactions. More catalytically active
anode and higher water permeation rate are required to achieve reasonable current densities.

135
Figure 6.7: I–V–P curves at 700 °C for different anode and cathode gas compositions, (▄) Anode: 5%
CO, Cathode: Air, (●) Anode: 5% CO, Cathode: 3% H2O in air, (▲) Anode: 5% CH4, Cathode: Air,
(▼) Anode: 5% CH4, Cathode: 3% H2O in air
The simultaneous transport of water and oxygen does not seem to interfere with each other.
No vital effect is observed due to addition of water to air at the cathode side. However, a
performance loss is observed in the cell, possibly due to a decrease in oxygen partial pressure.
Results suggest that water may be added and transported simultaneously with oxygen so as to
assist in–situ reforming of hydrocarbon fuels. However, the partial pressure of oxygen should
be kept the constant. Also, the water permeation capability of the membrane needs to be
optimised.

136
6.5 Summary
The impact of simultaneous water and oxygen transport from cathode side to anode side of the
cell on water and oxygen evolution under polarisation is investigated. The water evolution is
found independent of externally applied potential until a decomposition potential is reached. It
is also found that transport of oxygen and water are in the same direction and is not purely
independent. Results suggest that pumping of oxygen in the same direction as the water
concentration gradient increases water evolution slightly at the anode side. By applying the
same potential range to the cell when 3% H2O in air is present at the cathode side decreases
the current and oxygen evolution at the anode side compared with no water in air at the
cathode side. The decrease in current and oxygen evolution is due to the presence of water at
the cathode which in turn reduces oxygen partial pressure. Additionally, water may block
diffusion of adsorbed oxygen towards three phase boundary and consume oxygen vacancies at
the surface to form hydroxyl groups. This will lead to a decrease in the number available
oxygen vacancies for oxygen incorporation. Thus, the reason for decrease in oxygen evolution
could be a combination of multi–process rather than one parameter.
Finally, a single solid oxide fuel cell is prepared and tested with only air and 3% H2O in air
gas compositions at the cathode side. A range of fuels (i.e. hydrogen, carbon monoxide,
methane) is used at the anode. A decrease in cell performance is observed for all studied cells.
This may be due to slow kinetics of the anode reactions and macro scale water permeation.
The performances of fuel cells are low compared to conventional SOFCs. Moreover, the
visual post operational inspection of the cell revealed carbon deposition occurred during the
process.

137
Chapter 7
Conclusions and Suggested Future Work
7.1 Overall Conclusions
The main aim of this study is to investigate the water permeation feature of yttrium–doped
barium cerate perovskite membrane as an electrolyte material for intermediate temperature
solid oxide fuel cells to be operated with simultaneous water permeation. BCY20 perovskite
material is selected as potential electrolyte for this purpose due to its mixed ionic conductivity
along with water permeation capability. Deep understanding of mechanism will allow rational
design of cells for improved water permeation and cell performances.
A model is developed for hydration of BCY membranes and successfully applied for
calculating diffusion coefficients of protonic defects and oxygen vacancies using the Nernst–
Planck equation. The transient behaviour of electrical potential during hydration of the
membrane is obtained by changing the surrounding atmosphere. The data are in good
agreement with the model. The diffusion coefficients of protonic defects are found to be
greater than the diffusion coefficient of oxygen vacancies which is in agreement with the
literature. However, they are one order magnitude higher than the values reported in the
literature which may be attributed to grain boundary effects. The concentration distributions
of protonic defects, oxygen vacancies and electric potential are obtained as a function of time
and space. The concentration of protonic defects increased rapidly at the hydration surface
with the introduction of water into the reaction chamber indicating that formation of protonic
defects is a fast process.

138
The study continued investigating the water permeation behaviour through BCY20 membrane
modified with platinum at temperatures between 500–800 °C. Platinum is applied on one,
both or no surfaces of the membrane. Water flux across the membrane is enhanced when
platinum is applied on the feed side surface of the membrane, suggesting that platinum
increases reaction kinetics for water adsorption and/or dissociation and/or water incorporation
into the membrane. Results also indicate that protonic defects could be the minority defects on
this surface. However, it is found that the presence of platinum on the permeate side surface
decreases the water flux by about one third. This could be attributed to the fact that platinum
partially blocks water recombination by reducing the number of active sites for water
recombination via decreasing the available surface area or due to low ionic conductivity of
platinum.
In addition, similar experiments are performed using modified membranes with platinum in
order to investigate membrane based water permeation coupled with water–gas shift reaction
at a fixed temperature in one membrane reactor. The findings suggest that the presence of a
reducing gas on the permeate side increases the water flux by a factor of about 1.5. The
presence of reducing gas seems to promote the driving force for diffusion of lattice oxygen
from feed side to permeate side across the membrane.
Pt|BCY20 membrane configuration showed the best performance in terms of the rate of
product formation. While the fluxes that are obtained seem to still very low for real world
applications, it is important to prove the concept in order to improve membrane performance
in terms of water permeation for final use of this phenomenon. Post operational material
characterisation of the membranes revealed that BCY20 lost most of its crystal structure and
decomposed to BaCO3 and CeO2 when bare surface of the membrane is subjected to feed and
permeate side gas compositions. The morphology of platinum layer also changed after
reaction. The SEM images exhibited agglomeration of platinum and EDXS analysis
demonstrated carbon content on the permeate side membrane surfaces in the presence of
platinum. As a result, platinum is not suggested to be used as an electrode/catalyts on the
permeate side of the membrane.

139
The simultaneous water and oxygen transport through BCY20 membrane from cathode side
to anode side for a working solid oxide fuel cell is then carried out. Firstly, the role of oxygen
transport on water flux is investigated. The results indicate that pumping oxygen from cathode
side to anode side increases water flux slightly at 700 °C when helium is fed to anode side and
3% water in air is fed to the cathode side. Subsequently, the presence of water on oxygen
transport is studied by introducing 3% water in air to the cathode side while the anode side is
fed with helium. The results are compared with no water in air at the cathode side. It is
observed that the presence of water in air at the cathode side decreases oxygen transport from
cathode side to anode side slightly. The oxygen transport rate when only air is present at the
cathode side is greater than the oxygen transport rate when 3% water is present in air. One
possible explanation for this decrease might be a reduction in oxygen partial pressure at the
anode side. Additionally, water may reduce the active sites for oxygen incorporation into the
electrolyte. Results suggest that water incorporation and evolution are much favourable than
oxygen incorporation and evolution.
The fuel cell operations with simultaneous water permeation using various fuels, i.e.
hydrogen, carbon monoxide, methane are further carried out. The open circuit potentials of
the cells decrease when water is introduced to the cathode side for all kinds of fuels that are
used. This could be also due to the change in oxygen partial pressure at the cathode side.
Moreover, the fuel cells performances are significantly affected by the electrode polarisations.
The overall fuel cell performances are found to be limited by slow kinetics of the anode
reactions when carbon monoxide or methane is used as fuels at the anode side. This can be
explained by insufficient fuel reforming due to low water permeation from cathode side to
anode side and low catalytic activity of anode towards reforming of methane and water–gas
shift reaction.
In conclusion, in order to utilise this specific water permeable membrane in a working solid
oxide fuel cell, the electrodes should be designed to optimise water permeation. The
electrolyte thickness also needs to be minimised. Platinum would be beneficial on the water
surface, on the other hand, permeate surface should have sufficient uncovered areas for water
recombination when platinum is used on this surface. Moreover, a protective layer is required
in CO2 environment since post operation analysis suggests that the membrane decomposes in
CO2 containing environment even at ppm levels.

140
7.2 Suggested Future Work
The obtained results in this study suggest several avenues for further research. For instance,
the mathematical model can be developed further so as to obtain charge distribution within
the membranes during transient state. This might require addition of Poisson equation to the
model. Moreover, it is predicted that there is the presence of a third charge carrier in the actual
membrane system, which brings complications. This point is commonly ignored in the
literature and can be considered for better predictive modelling.
In order to compare water fluxes for Pt|BCY20|Pt and BCY20|Pt membranes and understand
the role of platinum on this surface for water recombination, the platinum layer should be well
controlled and characterised. The thickness and porosity of platinum can be controlled by
using pulsed laser deposition technique. This will allow designing electrode structures that
can provide adequate surface area available for water recombination resulting in optimised
water permeation for fuel cell applications. Also, other electrode materials can be tested that
offer better porosity and ionic conductivity on the permeate side rather than platinum for
practical applications.
X–ray photoelectron spectroscopy (XPS) may be used to analyse these platinum surfaces
before and after operation to identify oxygen on the surface (Oxygen may be the reason for
blocking mechanism, discussed in Section 5.3). Another possible study would involve using
isotopically labelled water in order to investigate whether protons exchange partner oxygen
on the permeate surface to form water.
In this study BCY20 membranes showed poor chemical stability during water permeation
coupled with water–gas shift reaction. This could be easily avoided by applying a thin
protective layer without compromising the conductivity of the electrolyte. For instance, it was
reported that application of a thin layer of barium zirconate by pulsed layer deposition on
barium cerate improved its chemical stability without compromising the its conductivity
[161]. A protective layer can be placed at the cathode side and a further water reactivity test
can be carried out.

141
Finally, in order to perform simultaneous water and oxygen transport for operation of a SOFC
coupled with water permeation platinum electrodes are used for benchmark studies to identify
the main stages of the process. However, it is found that the fuel cell performances are limited
due to slow kinetics of anode reactions. Therefore, explorations of better anode materials are
needed to improve fuel cell performance. Nickel alloys can be applied as anodes and are
expected to perform better in terms of reforming reactions. However, the impact of metal
electrode (platinum in this study) on water recombination should be taken into account as
well.

142
References
1. Larminie, J. and A. Dicks, Fuel Cell Systems Explained. 2003, West Sussex: Wiley.
2. Yamamoto, O., Solid oxide fuel cells: fundamental aspects and prospects.
Electrochimica Acta, 2000. 45(15–16): p. 2423-2435.
3. Kilner, J.A. and M. Burriel, Materials for Intermediate-Temperature Solid-Oxide Fuel
Cells. Annual Review of Materials Research, 2014. 44(1): p. 365-393.
4. Ormerod, R.M., Solid oxide fuel cells. Chemical Society Reviews, 2003. 32(1): p. 17-
28.
5. Mahato, N., et al., Progress in material selection for solid oxide fuel cell technology: A
review. Progress in Materials Science, 2015. 72: p. 141-337.
6. Yang, L., et al., Promotion of water-mediated carbon removal by nanostructured
barium oxide/nickel interfaces in solid oxide fuel cells. Nat Commun, 2011. 2: p. 357.
7. Achenbach, E., Three-dimensional and time-dependent simulation of a planar solid
oxide fuel cell stack. Journal of Power Sources, 1994. 49(1–3): p. 333-348.
8. Achenbach, E. and E. Riensche, Methane/steam reforming kinetics for solid oxide fuel
cells. Journal of Power Sources, 1994. 52(2): p. 283-288.
9. Janardhanan, V.M., V. Heuveline, and O. Deutschmann, Performance analysis of a
SOFC under direct internal reforming conditions. Journal of Power Sources, 2007.
172(1): p. 296-307.
10. Bonanos, N., et al., Ionic conductivity of gadolinium-doped barium cerate perovskites.
Solid State Ionics, 1989. 35(1–2): p. 179-188.
11. Bonanos, N., K.S. Knight, and B. Ellis, Perovskite solid electrolytes: Structure,
transport properties and fuel cell applications. Solid State Ionics, 1995. 79(0): p. 161-
170.
12. Iwahara, H., Technological challenges in the application of proton conducting
ceramics. Solid State Ionics, 1995. 77(0): p. 289-298.
13. Thursfield, A. and I.S. Metcalfe, High temperature gas separation through dual ion-
conducting membranes. Current Opinion in Chemical Engineering, 2013. 2(2): p. 217-
222.
14. Kreuer, K.D., Proton Conducting oxides. Annual Review of Materials Research, 2003.
33(1): p. 333-359.

143
15. Kreuer, K.D., et al., Water solubility, proton and oxygen diffusion in acceptor doped
BaCeO3: A single crystal analysis. Solid State Ionics, 1996. 86–88, Part 1(0): p. 613-
620.
16. Knight, K.S., Structural phase transitions in BaCeO3. Solid State Ionics, 1994. 74(3–
4): p. 109-117.
17. Takeuchi, K., et al., The crystal structures and phase transitions in Y-doped BaCeO3:
their dependence on Y concentration and hydrogen doping. Solid State Ionics, 2000.
138(1–2): p. 63-77.
18. Tong, J., et al., Proton-conducting yttrium-doped barium cerate ceramics synthesized
by a cost-effective solid-state reactive sintering method. Solid State Ionics, 2010.
181(33–34): p. 1486-1498.
19. Malavasi, L., C. Ritter, and G. Chiodelli, Correlation between Thermal Properties,
Electrical Conductivity, and Crystal Structure in the BaCe0.8Y0.2O2.9 Proton Conductor.
Chemistry of Materials, 2008. 20(6): p. 2343-2351.
20. W. Grover Coors and R. Swartzlander, Partial Conductivity Measurements in
BaCe0.9Y0.1O3−δ by Impedance Spectroscopy. Proceedings of the 26th Risø
International Symposium on Materials Science Solid State Electrochemistry,
2005(September): p. 185-196.
21. Bjorheim, T.S., T. Norby, and R. Haugsrud, Hydration and proton conductivity in
LaAsO4. Journal of Materials Chemistry, 2012. 22(4): p. 1652-1661.
22. Kjølseth, C., et al., Determination of the enthalpy of hydration of oxygen vacancies in
Y-doped BaZrO3 and BaCeO3 by TG-DSC. Solid State Ionics, 2010. 181(39–40): p.
1740-1745.
23. Hancke, R., et al., Hydration of lanthanum tungstate (La/W=5.6 and 5.3) studied by
TG and simultaneous TG–DSC. Solid State Ionics, 2013. 231: p. 25-29.
24. Guan, B., et al., A Performance Study of Solid Oxide Fuel Cells With
BaZr0.1Ce0.7Y0.2O3-δ Electrolyte Developed by Spray-Modified Pressing Method. Fuel
Cells, 2012. 12(1): p. 141-145.
25. Guo, Y., R. Ran, and Z. Shao, Optimizing the modification method of zinc-enhanced
sintering of BaZr0.4Ce0.4Y0.2O3−δ based electrolytes for application in an anode-
supported protonic solid oxide fuel cell. International Journal of Hydrogen Energy,
2010. 35(11): p. 5611-5620.
26. Sun, W., et al., Evaluation of BaZr0.1Ce0.7Y0.2O3−δ-based proton-conducting solid oxide
fuel cells fabricated by a one-step co-firing process. Electrochimica Acta, 2011. 56(3):
p. 1447-1454.

144
27. Liu, M., et al., High performance of anode supported BaZr0.1Ce0.7Y0.2O3−δ(BZCY)
electrolyte cell for IT-SOFC. International Journal of Hydrogen Energy, 2011. 36(21):
p. 13741-13745.
28. Nien, S.H., et al., Preparation of BaZr0.1Ce0.7Y0.2O3-δ based Solid Oxide Fuel Cells
with Anode Functional Layers by Tape Casting. Fuel Cells, 2011. 11(2): p. 178-183.
29. Xie, K., et al., A simple and easy one-step fabrication of thin BaZr0.1Ce0.7Y0.2O3−δ
electrolyte membrane for solid oxide fuel cells. Journal of Membrane Science, 2008.
325(1): p. 6-10.
30. Yang, L., C. Zuo, and M. Liu, High-performance anode-supported Solid Oxide Fuel
Cells based on BaZr0.1Ce0.7Y0.2O3−δ (BZCY) fabricated by a modified co-pressing
process. Journal of Power Sources, 2010. 195(7): p. 1845-1848.
31. Zhao, L., et al., High performance of proton-conducting solid oxide fuel cell with a
layered PrBaCo2O5+δ cathode. Journal of Power Sources, 2009. 194(2): p. 835-837.
32. Zhao, L., et al., Micro-tubular solid oxide fuel cells with graded anodes fabricated
with a phase inversion method. Journal of Power Sources, 2011. 196(3): p. 962-967.
33. Viswanathan, B., Aulice Scibioh, M Fuel Cells Principles and Applications. 2007,
India: CRC Press.
34. Recent Trends in Fuel Cell Science and Technology. 2007, New Delhi. India: Anamaya
Publishers.
35. Inc., P., Fuel Cell Handbook 5th Edition. 2000: EG and G Services Parsons.
36. F, B., PEM Fuel Cells: Theory and Practice. 2005, London: Elsevier Academic Press.
37. Haile, S., Fuel Cell Materials and Components. Acta Mater, 2003. 51(19): p. 5981-
6000.
38. Kawamato, H., Research and Development Trends in Solid Oxide Fuel Cell Materials.
Science and Technology Trends 2008. 26.
39. Ellamla, H.R., et al., Current status of fuel cell based combined heat and power
systems for residential sector. Journal of Power Sources, 2015. 293: p. 312-328.
40. Sammes, N., R. Bove, and K. Stahl, Phosphoric acid fuel cells: Fundamentals and
applications. Current Opinion in Solid State and Materials Science, 2004. 8(5): p. 372-
378.
41. Barbir, F., PEM Fuel Cells Theory and Practice. 2005, London: Elsevier Academic
Press.
42. Yano, S., et al., Solid Oxide Fuel Cell with Anodes using Proton Conductor (Barium-
Cerium/Yttrium Oxide). Journal of Thermal Science and Technology, 2009. 4(3): p.
431-436.

145
43. Singh, P. and N.Q. Minh, Solid Oxide Fuel Cells: Technology Status. International
Journal of Applied Ceramic Technology, 2004. 1(1): p. 5-15.
44. Rayment, C. and S. Sherwin, Introduction to Fuel Cell Technology. Vol. 2012. May
2003, Notre Dame, IN 46556, U.S.A.: Department of Aerospace and Mechanical
Engineering, University of Notre Dame.
45. Singhal, S.C. and K. Kendall, High Temperature Solid Oxide Fuel Cells:
Fundamentals, Design and Applications. 2003, Oxford: Elsevier.
46. Hoogers, G., Fuel Cell Technology Handbook. 2002, CRC Press.
47. Jacobson, A.J., Materials for Solid Oxide Fuel Cells. Chemistry of Materials, 2010.
22(3): p. 660-674.
48. Liu, Y., et al., Significant performance enhancement of yttrium-doped barium cerate
proton conductor as electrolyte for solid oxide fuel cells through a Pd ingress–egress
approach. Journal of Power Sources, 2014. 257: p. 308-318.
49. Orera, A. and P.R. Slater, New Chemical Systems for Solid Oxide Fuel Cells.
Chemistry of Materials, 2010. 22(3): p. 675-690.
50. Mogensen, M., et al., Factors controlling the oxide ion conductivity of fluorite and
perovskite structured oxides. Solid State Ionics, 2004. 174(1–4): p. 279-286.
51. Aguadero, A., et al., Materials development for intermediate-temperature solid oxide
electrochemical devices. Journal of Materials Science, 2012. 47(9): p. 3925-3948.
52. Kharton, V.V., F.M.B. Marques, and A. Atkinson, Transport properties of solid oxide
electrolyte ceramics: a brief review. Solid State Ionics, 2004. 174(1–4): p. 135-149.
53. Manthiram, A., et al., Crystal chemistry and properties of mixed ionic-electronic
conductors. Journal of Electroceramics, 2011. 27(2): p. 93-107.
54. Kharton, V., Solid State Electrochemistry I, Fundamentals, Materials and their
Applications. 2009, Weinheim: WILEY-VCH.
55. V.Thangadurai, W.H.K., B.Mirfakhraei, S.S. Bhella, and T.T. Trinh, Materials for
Proton Conducting Solid Oxide Fuel Cells. The Electrochemical Society, 2011. 35(1):
p. 483-492.
56. Sanders, M.D., The Role of Multi-Species Transport in Proton-Conducting Perovskite
Permeation Membranes, in Colorado School of Mines. 2013: Golden, Colorado.
57. The CRC Handbook of Solid State Electrochemistry, ed. P.Gellings and
H.M.Bouwmeester. 1997, New York: CRC Press.
58. Gellings, P.J. and H.J.M. Bouwmeester, Solid state aspects of oxidation catalysis.
Catalysis Today, 2000. 58(1): p. 1-53.
146
59. Fabbri, E., D. Pergolesi, and E. Traversa, Materials challenges toward proton-
conducting oxide fuel cells: a critical review. Chemical Society Reviews, 2010.
39(11): p. 4355-4369.
60. Norby, T., Protonic defects in oxides and their possible role in high temperature
oxidation. J. Phys. IV France, 1993. 03(C9): p. C9-99-C9-106.
61. Madhavan, B. and A. Ashok, Review on nanoperovskites: materials, synthesis, and
applications for proton and oxide ion conductivity. Ionics, 2015. 21(3): p. 601-610.
62. Iwahara, H., et al., Proton conduction in sintered oxides and its application to steam
electrolysis for hydrogen production. Solid State Ionics, 1981. 3–4(0): p. 359-363.
63. Liu, Y., X. Tan, and K. Li, Mixed Conducting Ceramics for Catalytic Membrane
Processing. Catalysis Reviews, 2006. 48(2): p. 145-198.
64. Babilo, P., T. Uda, and S.M. Haile, Processing of yttrium-doped barium zirconate for
high proton conductivity. Journal of Materials Research, 2007. 22(05): p. 1322-1330.
65. Jacobson, A.J., B.C. Tofield, and B.E.F. Fender, The structures of BaCeO3, BaPrO3
and BaTbO3 by neutron diffraction: lattice parameter relations and ionic radii in O-
perovskites. Acta Crystallographica Section B, 1972. 28(3): p. 956-961.
66. Bonanos, N. and F. Willy Poulsen, Considerations of defect equilibria in high
temperature proton-conducting cerates. Journal of Materials Chemistry, 1999. 9(2): p.
431-434.
67. Norby, T., Solid-state protonic conductors: principles, properties, progress and
prospects. Solid State Ionics, 1999. 125(1–4): p. 1-11.
68. Guan, J., et al., The Effects of Dopants and A:B Site Nonstoichiometry on Properties of
Perovskite‐Type Proton Conductors. Journal of The Electrochemical Society, 1998.
145(5): p. 1780-1786.
69. Tauer, T., R. O'Hayre, and J.W. Medlin, A theoretical study of the influence of dopant
concentration on the hydration properties of yttrium-doped barium cerate. Solid State
Ionics, 2011. 204–205(0): p. 27-34.
70. Sawant, P., et al., Influence of synthesis route on morphology and conduction behavior
of BaCe0.8Y0.2O3−δ. Journal of Thermal Analysis and Calorimetry, 2012. 107(1): p.
189-195.
71. Nikodemski, S., J. Tong, and R. O'Hayre, Solid-state reactive sintering mechanism for
proton conducting ceramics. Solid State Ionics, 2013. 253(0): p. 201-210.
72. Subramaniyan, A., et al., Sintering Studies on 20 mol% Yttrium-Doped Barium Cerate.
Journal of the American Ceramic Society, 2011. 94(6): p. 1800-1804.

147
73. Tomita, A., et al., Chemical and redox stabilities of a solid oxide fuel cell with
BaCe0.8Y0.2O3−α functioning as an electrolyte and as an anode. Solid State Ionics,
2006. 177(33–34): p. 2951-2956.
74. Coors, W., Protonic ceramic steam-permeable membranes. Solid State Ionics, 2007.
178(7-10): p. 481-485.
75. Coors, W.G., Protonic ceramic fuel cells for high-efficiency operation with methane.
Journal of Power Sources, 2003. 118(1-2): p. 150-156.
76. Kan, H. and H. Lee, Sn-doped Ni/YSZ anode catalysts with enhanced carbon
deposition resistance for an intermediate temperature SOFC. Applied Catalysis B:
Environmental, 2010. 97(1–2): p. 108-114.
77. Eguchi, K., Performance and Degradation of Ni-based Cermet Anode for Solid Oxide
Fuel Cells. Journal of the Japan Petroleum Institute, 2015. 58(2): p. 79-85.
78. Cui, S.-H., et al., Effects of H2S and H2O on carbon deposition over
La0.4Sr0.5Ba0.1TiO3/YSZ perovskite anodes in methane fueled SOFCs. Journal of Power
Sources, 2014. 250(0): p. 134-142.
79. Gao, J., et al., A thermodynamic analysis of methanation reactions of carbon oxides
for the production of synthetic natural gas. RSC Advances, 2012. 2(6): p. 2358-2368.
80. Dehimi, S., et al., Thermal field under the effect of the chemical reaction of a direct
internal reforming solid oxide fuel cell DIR-SOFC. International Journal of Hydrogen
Energy, 2014. 39(27): p. 15261-15265.
81. W. Grover, C., Protonic ceramic steam-permeable membranes. Solid State Ionics,
2007. 178(7-10): p. 481-485.
82. Kreuer, K.D., E. Schönherr, and J. Maier, Proton and oxygen diffusion in BaCeO3
based compounds: A combined thermal gravimetric analysis and conductivity study.
Solid State Ionics, 1994. 70–71, Part 1(0): p. 278-284.
83. Kreuer, K.D., et al., Proton conducting alkaline earth zirconates and titanates for high
drain electrochemical applications. Solid State Ionics, 2001. 145(1–4): p. 295-306.
84. Medvedev, D., et al., BaCeO3: Materials development, properties and application.
Progress in Materials Science, 2014. 60(0): p. 72-129.
85. Micheal D. Sanders, R.O.H., W.Grover Coors, Modelling of Material Parameters for
Increased Steam-Permeation in Yttrium-Doped Barium Cerate Ceramic Membranes.
Proceedings of FUELCELL2008, 6th International Fuel Cell Science, Engineering and
Technology Conference, 2008.
86. Kreuer, K.D., Aspects of the formation and mobility of protonic charge carriers and
the stability of perovskite-type oxides. Solid State Ionics, 1999. 125(1–4): p. 285-302.

148
87. Ricote, S., N. Bonanos, and G. Caboche, Water vapour solubility and conductivity
study of the proton conductor BaCe(0.9−x)ZrxY0.1O(3−δ). Solid State Ionics, 2009.
180(14-16): p. 990-997.
88. Norby, T., et al., Hydrogen in oxides. Dalton Transactions, 2004(19): p. 3012-3018.
89. Yamazaki, Y., C.-K. Yang, and S.M. Haile, Unraveling the defect chemistry and proton
uptake of yttrium-doped barium zirconate. Scripta Materialia, 2011. 65(2): p. 102-107.
90. Schober, T. and H.G. Bohn, Water vapor solubility and electrochemical
characterization of the high temperature proton conductor BaZr0.9Y0.1O2.95. Solid State
Ionics, 2000. 127(3–4): p. 351-360.
91. Oishi, M., et al., Defect structure analysis of B-site doped perovskite-type proton
conducting oxide BaCeO3: Part 2: The electrical conductivity and diffusion coefficient
of BaCe0.9Y0.1O3-δ. Solid State Ionics, 2008. 179(39): p. 2240-2247.
92. Kreuer, K.D., et al., Defect interactions in proton conducting perovskite-type oxides.
Berichte der Bunsengesellschaft/Physical Chemistry Chemical Physics, 1997. 101(9):
p. 1344-1350.
93. Grimaud, A., et al., Transport properties and in-situ Raman spectroscopy study of
BaCe0.9Y0.1O3−δ as a function of water partial pressures. Solid State Ionics, 2011.
191(1): p. 24-31.
94. Manning, P.S., J.D. Sirman, and J.A. Kilner, Oxygen self-diffusion and surface
exchange studies of oxide electrolytes having the fluorite structure. Solid State Ionics,
1996. 93(1–2): p. 125-132.
95. Liu, J., et al., Oxygen surface exchange and diffusion studies of La2Mo2O9 in different
exchange atmospheres. Solid State Ionics, 2011. 189(1): p. 39-44.
96. [cited 2016 20/1/2016]; Available from:
http://products.inficon.com/GetAttachment.axd?attaName=TSP2+TechNote+Calculati
ng+Partial+P.
97. Niemantsverdriet, J.W., Spectroscopy in Catalysis: An Introduction. 2000: John Wiley
& Sons.
98. Atkins, P.W., Physical Chemistry. 1994, Oxford: Oxford University Press.
99. Michael Dunlap, J.E.A. Introduction to the Scanning Electron Microscope, Theory,
Practice, & Procedures. 1997 08/08/2012]; Available from:
https://imf.ucmerced.edu/downloads/semmanual.pdf.
100. J. Goldstein, D.E.N., D. C. Joy, P. Echlin, C. E. Lyman, E. Lifshin, L.Sawyer, J.
Micheal, Scanning Electron Microscopy and X-ray Microanalysis. 2003, New York:
Kluwer Academic / Plenum Publishers.

149
101. Qi, X., F.T. Akin, and Y.S. Lin, Ceramic–glass composite high temperature seals for
dense ionic-conducting ceramic membranes. Journal of Membrane Science, 2001.
193(2): p. 185-193.
102. Masliyah, J.H. and S. Bhattacharjee, Fundamental Transport Equations, in
Electrokinetic and Colloid Transport Phenomena. 2005, John Wiley & Sons, Inc. p.
179-220.
103. Kuzmin, D., A Guide to Numerical Methods for Transport Equations. 2010, Erlangen-
Nürnberg: Friedrich-Alexander Universitat.
104. Shirai, T., H. Watanabe, and M. Fuji, Structural properties and surface characteristics
on aluminum oxide powders. Annual report of the Ceramics Research Laboratory,
Nagoya Institute of Technology, 2009. 9: p. 23-31.
105. Schober, T. and W.G. Coors, Entry and exit of water vapor in bulk ceramic proton
conductors. Solid State Ionics, 2005. 176(3–4): p. 357-362.
106. Yoo, H.-I., et al., Hydration and oxidation kinetics of a proton conductor oxide,
SrCe0.95Yb0.05O2.975. Physical Chemistry Chemical Physics, 2008. 10(7): p. 974-982.
107. Yoo, H.-I., J.I. Yeon, and J.-K. Kim, Mass relaxation vs. electrical conductivity
relaxation of a proton conducting oxide upon hydration and dehydration. Solid State
Ionics, 2009. 180(28–31): p. 1443-1447.
108. Yoo, H.-I. and C.-E. Lee, Conductivity relaxation patterns of mixed conductor oxides
under a chemical potential gradient. Solid State Ionics, 2009. 180(4–5): p. 326-337.
109. The KaleidaGraph Guide to Curve Fitting. 18/1/2016]; Available from:
http://www.synergy.com/Tools/curvefitting.pdf.
110. Kee, R.J., et al., Modeling the Steady-State and Transient Response of Polarized and
Non-Polarized Proton-Conducting Doped-Perovskite Membranes. Journal of The
Electrochemical Society, 2013. 160(3): p. F290-F300.
111. Vøllestad, E., H. Zhu, and R.J. Kee, Interpretation of Defect and Gas-Phase Fluxes
through Mixed-Conducting Ceramics Using Nernst–Planck–Poisson and Integral
Formulations. Journal of The Electrochemical Society, 2014. 161(1): p. F114-F124.
112. Kostøl, K.B., A. Magrasó, and T. Norby, On the hydration of grain boundaries and
bulk of proton conducting BaZr0.7Pr0.2Y0.1O3-δ. International Journal of Hydrogen
Energy, 2012. 37(9): p. 7970-7974.
113. Kreuer, K.D., On the development of proton conducting materials for technological
applications. Solid State Ionics, 1997. 97(1–4): p. 1-15.

150
114. Coors, W.G. and D.W. Readey, Proton Conductivity Measurements in Yttrium Barium
Cerate by Impedance Spectroscopy. Journal of the American Ceramic Society, 2002.
85(11): p. 2637-2640.
115. Hung, I.M., et al., Phase stability and conductivity of Ba1−ySryCe1−xYxO3−δ solid oxide
fuel cell electrolyte. Journal of Power Sources, 2009. 193(1): p. 155-159.
116. Zakowsky, N., S. Williamson, and J.T.S. Irvine, Elaboration of CO2 tolerance limits of
BaCe0.9Y0.1O3–δ electrolytes for fuel cells and other applications. Solid State Ionics,
2005. 176(39–40): p. 3019-3026.
117. Fu, X.-Z., et al., Y-doped BaCeO3−δ nanopowders as proton-conducting electrolyte
materials for ethane fuel cells to co-generate ethylene and electricity. Journal of
Power Sources, 2010. 195(9): p. 2659-2663.
118. Merkle, R. and J. Maier, How Is Oxygen Incorporated into Oxides? A Comprehensive
Kinetic Study of a Simple Solid-State Reaction with SrTiO3 as a Model Material.
Angewandte Chemie International Edition, 2008. 47(21): p. 3874-3894.
119. Leonhardt, M., et al., Surface Kinetics of Oxygen Incorporation into SrTiO3. Journal of
The Electrochemical Society, 2002. 149(2): p. J19-J26.
120. Yu, J.H., J.-S. Lee, and J. Maier, Peculiar Nonmonotonic Water Incorporation in
Oxides Detected by Local In Situ Optical Absorption Spectroscopy. Angewandte
Chemie International Edition, 2007. 46(47): p. 8992-8994.
121. Mather, G.C., et al., Hydrogen-permeation characteristics of a SrCeO3-based ceramic
separation membrane: Thermal, ageing and surface-modification effects. Solid State
Ionics, 2010. 181(3–4): p. 230-235.
122. Hancke, R., Z. Li, and R. Haugsrud, The Kinetics of Hydration and H/D Isotope
Exchange of Y-Doped Barium Cerate and Lanthanum Tungstate Studied by Transient
Thermogravimetry. Journal of The Electrochemical Society, 2013. 160(8): p. F757-
F763.
123. Fajín, J.L.C., M.N. D. S. Cordeiro, and J.R.B. Gomes, Density Functional Theory
Study of the Water Dissociation on Platinum Surfaces: General Trends. The Journal of
Physical Chemistry A, 2014. 118(31): p. 5832-5840.
124. Karlberg, G.S., et al., Water desorption from an oxygen covered Pt(111) surface:
Multichannel desorption. The Journal of Chemical Physics, 2006. 124(20): p. 204712.
125. Vøllestad, E., et al., Hydrogen permeation characteristics of La27Mo1.5W3.5O55.5.
Journal of Membrane Science, 2014. 461: p. 81-88.
126. García-García, F.R., et al., Studies on water–gas-shift enhanced by adsorption and
membrane permeation. Catalysis Today, 2014. 236, Part A(0): p. 57-63.

151
127. Murugan, A., A. Thursfield, and I.S. Metcalfe, A chemical looping process for
hydrogen production using iron-containing perovskites. Energy & Environmental
Science, 2011. 4(11): p. 4639-4649.
128. Evdou, A., L. Nalbandian, and V.T. Zaspalis, Perovskite membrane reactor for
continuous and isothermal redox hydrogen production from the dissociation of water.
Journal of Membrane Science, 2008. 325(2): p. 704-711.
129. Kim, J.-H., et al., Study on the chemical stability of Y-doped BaCeO3 − δ and BaZrO3 −
δ films deposited by aerosol deposition. Thin Solid Films, 2011. 520(3): p. 1015-1021.
130. Li, Y., et al., Chemical stability study of nanoscale thin film yttria-doped barium
cerate electrolyte for micro solid oxide fuel cells. Journal of Power Sources, 2014.
268: p. 804-809.
131. Yajima, T., et al., Protonic conduction in SrZrO3-based oxides. Solid State Ionics,
1992. 51(1–2): p. 101-107.
132. Bhide, S.V. and A.V. Virkar, Stability of BaCeO3 - based Proton Conductors in Water
‐Containing Atmospheres. Journal of The Electrochemical Society, 1999. 146(6): p.
2038-2044.
133. Tanner, C.W. and A.V. Virkar, Instability of BaCeO3 in H 2 O Containing Atmospheres.
Journal of The Electrochemical Society, 1996. 143(4): p. 1386-1389.
134. Si, Y., et al., CO Tolerance of Carbon-Supported Platinum-Ruthenium Catalyst at
Elevated Temperature and Atmospheric Pressure in a PEM Fuel Cell. Journal of The
Electrochemical Society, 2004. 151(11): p. A1820-A1824.
135. Ralph, T.R.H., M. P, Catalysis for low temperature fuel cells. Part II. The anode
challenges. Platinum Metals Review, 2002. 46(3): p. 117-135.
136. Laosiripojana, N., W. Sangtongkitcharoen, and S. Assabumrungrat, Catalytic steam
reforming of ethane and propane over CeO2-doped Ni/Al2O3 at SOFC temperature:
Improvement of resistance toward carbon formation by the redox property of doping
CeO2. Fuel, 2006. 85(3): p. 323-332.
137. Haryanto, A., et al., Hydrogen Production through the Water−Gas Shift Reaction:
Thermodynamic Equilibrium versus Experimental Results over Supported Ni
Catalysts. Energy & Fuels, 2009. 23(6): p. 3097-3102.
138. Uchida, H., N. Maeda, and H. Iwahara, Relation between proton and hole conduction
in SrCeO3-based solid electrolytes under water-containing atmospheres at high
temperatures. Solid State Ionics, 1983. 11(2): p. 117-124.
139. Li, Y., R. Gemmen, and X. Liu, Oxygen reduction and transportation mechanisms in
solid oxide fuel cell cathodes. Journal of Power Sources, 2010. 195(11): p. 3345-3358.

152
140. J. Sunarso, S.B., J.M. Serra,W.A. Meulenberg, S. Liu, Y.S. Lin, J.C. Diniz da Costa,
Mixed ionic–electronic conducting (MIEC) ceramic-based membranes for oxygen
separation. Journal of Membrane Science, 2008. 320: p. 13-41.
141. Baumann, F.S., Oxygen reduction kinetics on mixed conducting SOFC model
cathodes. 2006.
142. Opitz, A.K. and J. Fleig, Investigation of O2 reduction on Pt/YSZ by means of thin film
microelectrodes: The geometry dependence of the electrode impedance. Solid State
Ionics, 2010. 181(15–16): p. 684-693.
143. Walch, G., et al., Correlation between hydrogen production rate, current, and
electrode overpotential in a solid oxide electrolysis cell with La0.6Sr0.4FeO3−δ thin-film
cathode. Monatshefte für Chemie - Chemical Monthly, 2014. 145(7): p. 1055-1061.
144. Tanaka, M., Y. Asakura, and T. Uda, Performance of the electrochemical hydrogen
pump of a proton-conducting oxide for the tritium monitor. Fusion Engineering and
Design, 2008. 83(10–12): p. 1414-1418.
145. Sakai, N., et al., Effect of Water on Oxygen Transport Properties on Electrolyte
Surface in SOFCs: I. Surface Reaction Mechanism of Oxygen Isotope Exchange on
Solid Oxide Electrolytes. Journal of The Electrochemical Society, 2003. 150(6): p.
A689-A694.
146. Liu, J., et al., Surface enhancement of oxygen exchange and diffusion in the ionic
conductor La2Mo2O9. Solid State Ionics, 2010. 181(17–18): p. 812-818.
147. Liu, J., R.J. Chater, and S.J. Skinner, Effects of humidified atmosphere on oxygen
transport properties in La2Mo2O9. Solid State Ionics, 2011. 192(1): p. 444-447.
148. Guan, J., et al., Transport properties of BaCe0.95Y0.05O3−α mixed conductors for
hydrogen separation. Solid State Ionics, 1997. 100(1–2): p. 45-52.
149. Ma, G., T. Shimura, and H. Iwahara, Ionic conduction and nonstoichiometry in
BaxCe0.90Y0.10O3−α. Solid State Ionics, 1998. 110(1–2): p. 103-110.
150. Ma, G., T. Shimura, and H. Iwahara, Simultaneous doping with La3+ and Y3+ for Ba2+
and Ce4+ sites in BaCeO3 and the ionic conduction. Solid State Ionics, 1999. 120(1–
4): p. 51-60.
151. Bonanos, N., Transport properties and conduction mechanism in high-temperature
protonic conductors. Solid State Ionics, 1992. 53: p. 967-974.
152. Kosacki, I. and H.L. Tuller, Mixed conductivity in SrCe0.95Yb0.05O3 protonic
conductors. Solid State Ionics, 1995. 80(3–4): p. 223-229.
153. Maffei, N., L. Pelletier, and A. McFarlan, Performance characteristics of Gd-doped
barium cerate-based fuel cells. Journal of Power Sources, 2004. 136(2): p. 24-29.

153
154. Fabbri, E., et al., Tailoring the chemical stability of Ba(Ce0.8- xZrx)Y0.2O3-δ protonic
conductors for Intermediate Temperature Solid Oxide Fuel Cells (IT-SOFCs). Solid
State Ionics, 2008. 179(15–16): p. 558-564.
155. Akoshima, S., et al., Reaction kinetics on platinum electrode / yttrium-doped barium
cerate interface under H2–H2O atmosphere. Solid State Ionics, 2010. 181(3–4): p.
240-248.
156. Sakai, N., et al., Erratum to “Effect of water on electrochemical oxygen reduction at
the interface between fluorite-type oxide-ion conductors and various types of
electrodes”. Solid State Ionics, 2005. 176(29–30): p. 2327-2333.
157. Mamlouk, M., T. Sousa, and K. Scott, A High Temperature Polymer Electrolyte
Membrane Fuel Cell Model for Reformate Gas. International Journal of
Electrochemistry, 2011. 2011: p. 18.
158. Souza, M., R. Macedo Neto, and M. Schmal, Synthesis Gas Production from Natural
Gas on Supported Pt Catalysts. Journal of Natural Gas Chemistry, 2006. 15(1): p. 21-
27.
159. McMinn, T.E., F.C. Moates, and J.T. Richardson, Catalytic steam reforming of
chlorocarbons: catalyst deactivation. Applied Catalysis B: Environmental, 2001.
31(2): p. 93-105.
160. Buccheri, M.A., A. Singh, and J.M. Hill, Anode- versus electrolyte-supported Ni-
YSZ/YSZ/Pt SOFCs: Effect of cell design on OCV, performance and carbon formation
for the direct utilization of dry methane. Journal of Power Sources, 2011. 196(3): p.
968-976.
161. Fabbri, E., et al., Design and fabrication of a chemically-stable proton conductor
bilayer electrolyte for intermediate temperature solid oxide fuel cells (IT-SOFCs).
Energy & Environmental Science, 2008. 1(3): p. 355-359.
162. Fabbri, E., et al., Design and fabrication of a chemically-stable proton conductor
bilayer electrolyte for intermediate temperature solid oxide fuel cells (IT-SOFCs).
Energy & Environmental Science, 2008. 358(1): p. 355-359.
163. Tomita, A., et al., Proton conduction at the surface of Y-doped BaCeO3 and its
application to an air/fuel sensor. Journal of Materials Science, 2004. 39(7): p. 2493-
2497.
164. Suksamai, W., Intermediate Temperature Operation of a Proton Conducting Solid
Oxide Fuel Cell. 2007, Manchester University.

154
Appendix A
The electrical conductivity of BCY20 membrane was measured using a three–electrode cell
set up with a thickness of 1.55 mm BCY20 shown in Figure A.1 under single gas atmosphere
over the temperature range of 500–800 °C. The flow rates of gases were 100 ml/min. The
impedance spectra were obtained at amplitude of 100 mV with a frequency sweep from 500
KHz to 50 MHz for several times.
Figure A.1: Three electrode set up in a single chamber reactor for impedance measurements.
The electrical conductivity of BCY20 membrane was calculated using the following
equation;
σ =l
A × R 1
Where R represents bulk resistance, l represents the distance between the electrodes
(membrane thickness), A represents affective surface area of working electrode. The high
frequency region intercept with the real axis was used to obtain bulk resistance (where the
impedance plot cuts the real axis). Since the bulk resistance was used to calculate electrical
conductivity, the result may be assumed as bulk conductivity. The grain (medium frequency

155
region) and the electrodes effect (low frequency region) did not show clear division. The
obtained electrical conductivity is given in Figure A.2.
Figure A.2: The electrical conductivity of BCY20 membrane as a function of temperature. (▲) 20%
O2 balance Ar, (●) 2.3% H2O balance N2, (♦) 5% H2 + 2.3% H2O balance He.
The activation energy using the Arrhenius plot shown in Figure A.3 was calculated as ~0.35
eV for bulk conductivity (in 5% H2 + 2.3% H2O balance He) which is consistent with the
literature [72, 162, 163].

156
Figure A.3: The Arrhenius plot of bulk conductivity of BCY20.
The activation energy is given as:
k = A e−EaRT
2
ln( k) =−Ea
R (1
T) + ln(A) 3
Equation 3 shows the relationship between Arrhenius plot and y = mx + c equation. From
this relationship the activation energy can be obtained as follows;
m =−EaR
4

157
Ea = −m × R × 1000 5
Ea = −(−4.1414 K−1) × 8.314J/molK × 1000 6
Ea = ~35 kJ/mol 7
1kJ
mol= 0.01 eV
8
Ea = ~0.35 eV 9

158
Appendix B
Derivation of chemical diffusion coefficient of water
Kreuer et al . derived the chemical diffusion coefficient of water using the Fick`s law of
diffusion and assuming that the chemical diffusion of water occur by appropriate counter
diffusion of protonic defects and oxygen vacancies [82].
The relationship between water, oxygen vacancies and protonic defects flux densities are
given below:
JH2O =1
2 JOHo• = − JVo••
1
The flux density of species i can be written as a function of its conductivity (σ),
electrochemical potential (η) and electrostatic potential (Ф) as shown below [164]:
Ji = −σi
ni2F2
∇ηi 2
Where ηi is the electrochemical potential, ηi = μi + niFФ, F is the Faraday constant, ni is
the number of electrons involved in the reaction.
By substituting the electrochemical potential into Equation 1, the flux density can be obtained
as follows:
Ji = −(σi
ni2F2)∇μi − (
σiniF)∇Ф 3
Assuming that the electrostatic potential within the membrane is constant and the gradient
will become zero; the last term of Equation 2 can be eliminated.

159
The flux density can be written as a function of the diffusion coefficient and concentration
using the Nernst–Einstein relation as follows:
σi =ni2F2DiCiRT
4
At equilibrium:
H2O + Vo•• + Oo
x↔ 2OHo• 5
∇μH2O = 2∇μOHo• − ∇μVo•• 6
By substituting ∇μ of protonic defects and oxygen vacancies obtained from Equations 1, 2
and 3 into Equation 6, and converting the concentrations into the mole fractions (Ci =Xi
V , V is
the total molar volume, cm3/mol) the following equation can be obtained:
JH2O = − XOHo
• DOHo• XVo
••DVo••
XOHo• DOHo
• +4XVo••DVo
••
∇μH2O
VRT 7
In order to determine the chemical diffusion coefficient of water, an expression should be
derived for the flux density of water that relates it to the concentration gradient of water. It
may be now therefore manipulated as follows:
μH2O = μH2O⁰ − RTlnaH2O 8
∇μH2O = RT∇(lnaH2O)d(lnCH2O)
d(lnCH2O)
9
∇μH2O = WH2ORT
CH2O∇CH2O
10
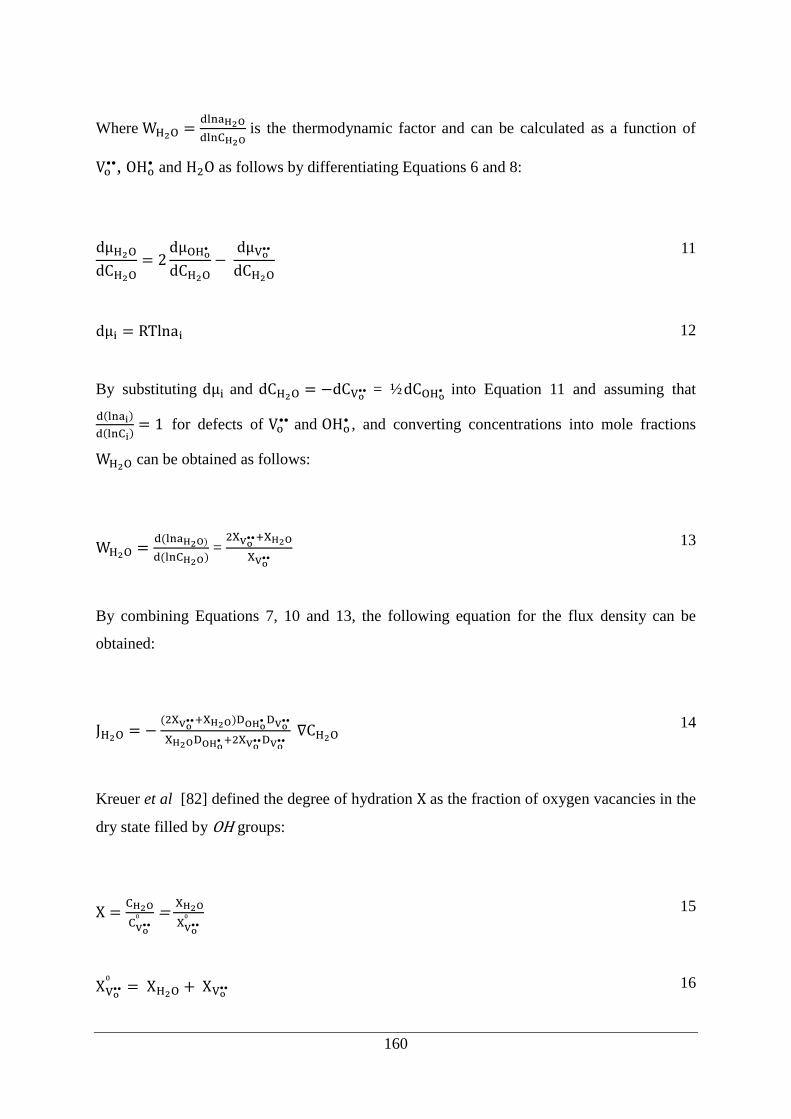
160
Where WH2O =dlnaH2O
dlnCH2O is the thermodynamic factor and can be calculated as a function of
Vo••, OHo
• and H2O as follows by differentiating Equations 6 and 8:
dμH2O
dCH2O= 2
dμOHo•
dCH2O− dμVo••
dCH2O
11
dμi = RTlnai 12
By substituting dμi and dCH2O = −dCVo•• = ½dCOHo• into Equation 11 and assuming that
d(lnai)
d(lnCi)= 1 for defects of Vo
•• and OHo• , and converting concentrations into mole fractions
WH2O can be obtained as follows:
WH2O =d(lnaH2O)
d(lnCH2O) = 2XVo
••+XH2O
XVo••
13
By combining Equations 7, 10 and 13, the following equation for the flux density can be
obtained:
JH2O = − (2XVo
••+XH2O)DOHo• DVo
••
XH2ODOHo• +2XVo
••DVo•• ∇CH2O 14
Kreuer et al [82] defined the degree of hydration X as the fraction of oxygen vacancies in the
dry state filled by OH groups:
X =CH2O
CVo••⁰
= XH2O
XVo••⁰
15
XVo••⁰ = XH2O + XVo••
16

161
XVo•• = 1 − X 17
Where, CVo••⁰ is the concentration of oxygen vacancies in the dry state.
Finally, the flux density and the chemical diffusion coefficient of water can be obtained as a
function of degree of hydration as follows:
JH2O = − (2−X)DOHo
• DVo••
XDOHo• +2(1−X)DVo
•• ∇CH2O 18
JH2O = −DH2O∇CH2O 19
DH2O = (2−X)DOHo
• DVo••
XDOHo• +2(1−X)DVo
•• 20
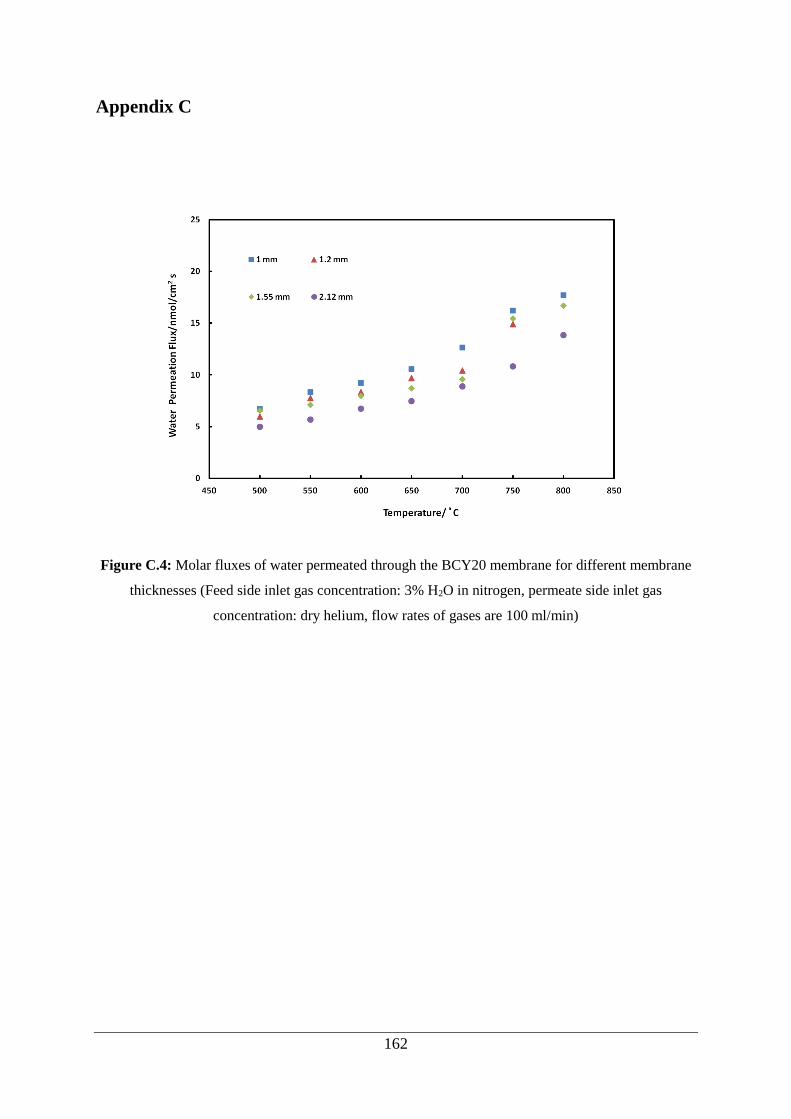
162
Appendix C
Figure C.4: Molar fluxes of water permeated through the BCY20 membrane for different membrane
thicknesses (Feed side inlet gas concentration: 3% H2O in nitrogen, permeate side inlet gas
concentration: dry helium, flow rates of gases are 100 ml/min)

163
Appendix D
Figure D.5: a) XRD patterns of BCY10 pellets. b) cross section SEM image of BCY10. The pellets
were sintered at 1450 °C for 12 hrs.

164
Appendix E
Comparison of data in hygrometer readings with theoretical values:
Figure E.6: Data comparison for the hygrometer
The minimum and maximum deviation in hygrometer readings were found as 0.8% and 3%.
Example:
Dew point temperature = 25 °C
Theoretical concentration at 25 °C = 31285 ppmV
Experimental value at 25 °C = 32201 ppmV
Referring to Equation 3.2:
%𝐸𝑟𝑟𝑜𝑟 =|31285 − 32201|
31285 × 100% ≈ 2.92 %

165
Appendix F
Calculating the rate of carbon dioxide for Water Permeation coupled with Water–Gas Shift
Reaction Experiments
The rates of carbon dioxide during simultaneous water permeation and water–gas shift
reaction experiments were determined in step there (Refer to Table 3.1). The contributions of
other reactions to rate of carbon dioxide (e.g. a reaction between carbon monoxide and
sealant) were subtracted which were determined after step three by running only argon the
feed side instead of 3% H2O in argon (we named this as blank run for the sake of
calculation).
An example of the rate of carbon dioxide calculation:
Membrane configuration: BCY20
The mole fraction of carbon dioxide in step three at t1 = 0.0368%
The mole fraction of carbon dioxide in blank run = 0.0260%
𝐽𝐶𝑂2 = [𝑥 − 𝑦]𝐹1
𝑉𝑚
1
60
1
𝑆𝐴 = [0.0368−0.0260]
100 ×100
𝑚𝑙
𝑚𝑖𝑛 ×
1
22400 ×
1
60×
1
0.5 𝑐𝑚2 × 109 = 16 𝑛𝑚𝑜𝑙/𝑐𝑚2

166
Appendix G
Calibration plots for different gases used in water permeation and water gas shifts
experiments:
Calibration plot for water permeation experiments (gas mixture: N2 (2%), O2 (2%), H2 (1%)
balance in helium, flow rate of gas is 100 ml/min):
Calibration plot for water gas shift experiments (gas mixture; CH4 (2%), CO (2%), O2 (2%),
CO2 (2%), H2 (2%) balance in helium, flow rate of gas 100 ml/min):
Figure G.7: Calibration curves for different gases employed in the experiments.
a)
b)

167
Appendix H
The initial concentrations of species for BCY20 (BaCe0.8Y0.2O2.9) are calculated as follows:
1. 1 mole of BCY20 includes 2.9 mole of OOx , 0.2 mole of YCe
′ and 0.1 mole of VO••.
Molar mass of Ba = 137.33 g/mol
Molar mass of Ce = 140.12 g/mol
Molar mass of Y = 88.906 g/mol
Molar mass of O = 15.999 g/mol
Molecular weight of BCY20: MBCY20 = 313.6 g/mol
2. Mole of BCY20:
mBCY20 = 1.4 g
n = m
M=
1.4 g
313.6 g/mol= 4.47 × 10⁻³ mol
3. Volume of BCY20:
Membrane thickness = 1.44 mm
Membrane diameter = 15.08 mm
Volume(V) = π × r2 × h = π × (15.08
2)2 × 1.44 = 257.19 mm3 = 257.19 × 10⁻⁹ m3
4. Concentration of species:
CBCY20 =n
V=
4.47 ×10⁻³ mol
257.19 × 10⁻⁹ m3= 1.7371 × 10⁴ mol/ m3
COOx = 2.9 × CBCY20 = 2.9 × 1.7371 × 104 = 5.0377 × 10⁴ mol/m3
CYCe′ = 0.2 × CBCY20 = 0.2 × 1.7371 × 104 = 3.4743 × 10³ mol/m3
CVO•• = 0.1 × CBCY20 = 0.1 × 1.7371 × 104 = 1.7371 × 10³ mol/m3
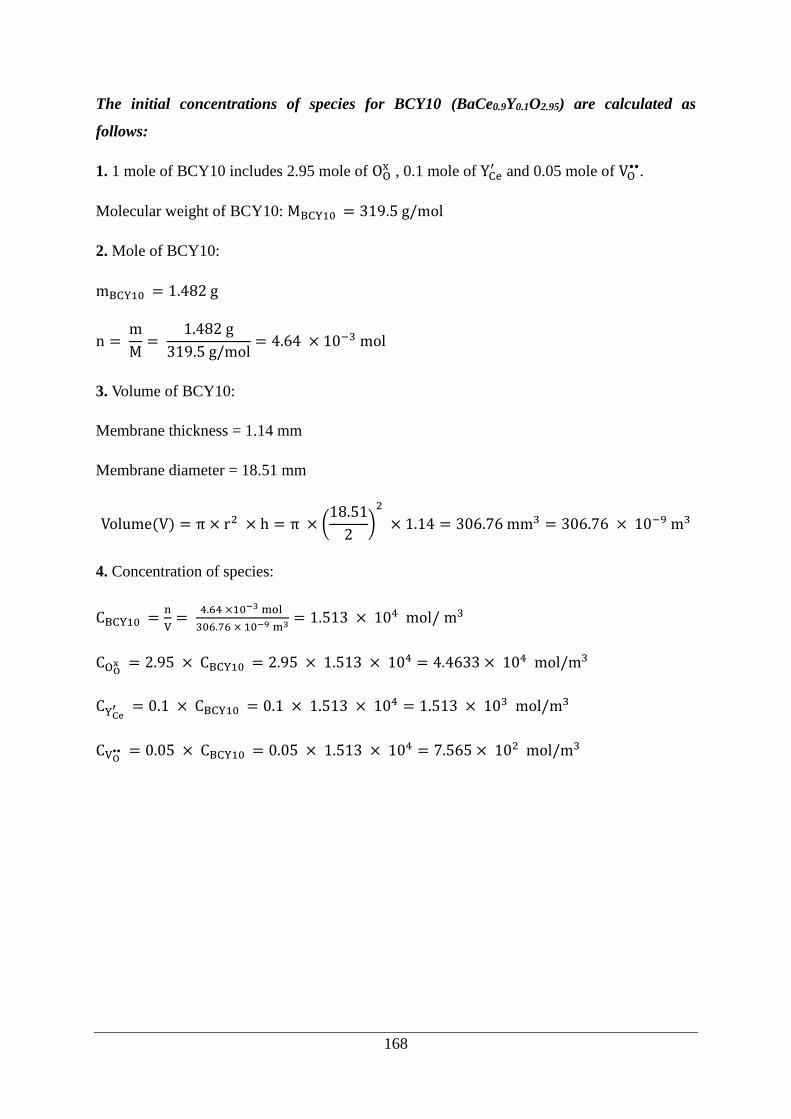
168
The initial concentrations of species for BCY10 (BaCe0.9Y0.1O2.95) are calculated as
follows:
1. 1 mole of BCY10 includes 2.95 mole of OOx , 0.1 mole of YCe
′ and 0.05 mole of VO••.
Molecular weight of BCY10: MBCY10 = 319.5 g/mol
2. Mole of BCY10:
mBCY10 = 1.482 g
n = m
M=
1.482 g
319.5 g/mol= 4.64 × 10⁻³ mol
3. Volume of BCY10:
Membrane thickness = 1.14 mm
Membrane diameter = 18.51 mm
Volume(V) = π × r2 × h = π × (18.51
2)2
× 1.14 = 306.76 mm3 = 306.76 × 10⁻⁹ m3
4. Concentration of species:
CBCY10 =n
V=
4.64 ×10⁻³ mol
306.76 × 10⁻⁹ m3= 1.513 × 10⁴ mol/ m3
COOx = 2.95 × CBCY10 = 2.95 × 1.513 × 104 = 4.4633 × 10⁴ mol/m3
CYCe′ = 0.1 × CBCY10 = 0.1 × 1.513 × 104 = 1.513 × 10³ mol/m3
CVO•• = 0.05 × CBCY10 = 0.05 × 1.513 × 10
4 = 7.565 × 10² mol/m3

169
Appendix I
Figure I.8: The repeat measurement of the electrical potential difference of BCY membranes upon
hydration and dehydration at 700 °C for Chapter 4 a) BCY20, b) BCY10.

170
Appendix J
Calculating average surface loading of platinum onto BCY20 membrane surface
The mass of platinum deposited on the BCY20 membrane surface was calculated by
measuring the mass of unmodified BCY20 membrane and modified BCY20 membrane with
platinum to find the amount of platinum deposited on the membrane surface. The samples
were weighted right after; they were taken out of the furnace.
Weight of unmodified BCY20 membrane = 1.37 g
Weight of BCY20 membrane modified with platinum (one surface) = 1.378g
Amount of platinum deposited on BCY20 membrane surface = 8 mg
Surface area of BCY20 that platinum deposited = π × r2 = π × (15.75 mm
2)2 =
195 mm2 = 1.95 cm2
The average surface loading of platinum on BCY20 surface is given as follows:
The amoun of platinum deposited on BCY20
Surface area of BCY20 that platinum deposited=
8 mg
1.95 cm2= 4.1 mg/cm2
Estimation Porosity of Platinum Layer
The porosity of a layer is defined as the ratio of the pore volume to the total volume of the
layer. Thus, the porosity of platinum layer that deposited on BCY20 membrane surface can
be estimated as follows:
Porosity =Pore volume
Total bulk volume × 100
Pore volume = Total bulk volume − Grain (platinum)volume
From the SEM analysis in Chapter 5, the thickness of platinum layer is:
Platinum layer thickness ≈ 5 μm
Platinum layer diameter = 15.75 mm

171
Density of platinum = 21.45 g/cm3
Weight of platinum layer = 8 mg
The bulk volume of platinum layer can be calculated roughly from the geometric dimensions
as follows:
Vbulk = = π × r2 × h = π × (
15.75 mm
2)2 × 5. 10−3 mm = 974 × 10−6 cm3
Vgrain = mplatinum
dplatinum= 8 × 10⁻³ g
21.45 g/cm3 = 373 × 10−6 cm3
Porosity =974 × 10−6 cm3 − 373 × 10−6 cm3
974 × 10−6 cm3 × 100 ≈ 61 %

172
Appendix K
Post Operation EDXS Results
Feed Side, Bare Surface
Table K-1: EDXS of the bare surface of BCY20 on the feed side after experiment.
Table K-2: EDXS of the bare surface of BCY20 on the feed side after experiment.

173
Permeate Side, Bare Surface
Table K-3: EDXS of the bare surface of BCY20 on the permeate side after experiment.
Table K-4: EDXS of the bare surface of BCY20 on the permeate side after experiment.

174
Permeate Side, Platinum Surface
Table K-5: EDXS of the platinum surface of BCY20 on the permeate side after experiment.
Table K-6: EDXS of the platinum surface of BCY20 on the permeate side after experiment.