Embed Size (px)
Citation preview

Investigating the Mechanism of Self-Incompatibility in Papaver rhoeas and
Functional Transfer of Papaver S-Determinants to Arabidopsis thaliana
by
SABINA VATOVEC
A thesis submitted to The University of Birmingham
for the degree of DOCTOR OF PHILOSOPHY
School of Biosciences The University of Birmingham
January 2012

University of Birmingham Research Archive
e-theses repository This unpublished thesis/dissertation is copyright of the author and/or third parties. The intellectual property rights of the author or third parties in respect of this work are as defined by The Copyright Designs and Patents Act 1988 or as modified by any successor legislation. Any use made of information contained in this thesis/dissertation must be in accordance with that legislation and must be properly acknowledged. Further distribution or reproduction in any format is prohibited without the permission of the copyright holder.

ABSTRACT
Flowering plants have evolved complex genetic mechanisms of self-incompatibility (SI) to
overcome the problem of self-fertilization. SI is a cell-cell recognition system where the
interaction of genetically linked pollen and pistil S-determinants prevents self-fertilization.
In Papaver rhoeas, the pistil S-determinant is PrsS, a secreted protein of around 15 kDa. The
pollen determinant, PrpS, encodes a novel transmembrane protein of around 20 kDa. Upon
the interaction of incompatible PrsS and PrpS variants, the SI response is triggered,
activating a signalling network. Rapid increases in cytosolic free calcium ([Ca2+]i) are
followed by changes to the actin cytoskeleton and activation of a DEVDases, resulting in
programmed cell death (PCD).
Within this thesis, three inter-related studies are described. Initially, we investigated the role
of the ubiquitin-proteasomal system during SI in Papaver, the second study focused on the
PrpS protein. Thirdly, we also created transgenic Arabidopsis thaliana lines expressing PrpS
and PrsS, in order to investigate if the Papaver SI system might be functionally transferable
to other plant species. We have demonstrated that PrpS binds the PrsS in an S-specific
manner, while the functional analysis “in vitro” revealed that PrpS expressed in A.thaliana
is functional and that just PrpS and PrsS are sufficient for a fully functional SI response in
A.thaliana pollen.

I dedicate this thesis to my dearest:
my parents Tatjana and Lojze Vatovec and to my partner Miha Zakotnik

ACKNOWLEDGEMENTS I would like to thank my supervisor Noni Franklin-Tong for the opportunity to do the PhD project and for all the guidance, support and counsel throughout my PhD. I would also like to express my gratitude to the other members, staff and PIs of the labs on the second floor, past and present, who encouraged me, helped me on many different levels, gave me the confidence and great scientific example, and provided stimulating, challenging and yet relaxed and enjoyable working environment: Barend de Graaf, Candida Nibau, Maurice Bosch, Natalie Poulter, Eugenio Sanchez-Moran, Ruth Perry, Chris Franklin, Richard Tudor, Katie Wilkins, Javier-Andres Juarez-Diaz, Karen Staples, Steve Price, Huawen Zou, Juyou Wu, Andrew Beacham, Kim Osman, Sarah Smith, Adriana Machlicova, Younosse Saidi, Laura Moody. I would also like to thank my great students Kreepa, Fuz, Tom, Sebastien and Steph, as I learned a lot through teaching. I am also thankful to other horticultural staff, past from the Elms laboratories, especially dear Bill, and new from the Winterbourne botanical gardens. I would also like to acknowledge Ari Sadanandom for providing the PUB and POB antibodies. My project was funded by the Biotechnological and Biological Sciences Research Council (BBSRC), and living expenses were covered by an Ad Futura scholarship from Slovenia. My gratitude is extended to all the good friends that I had in Birmingham, who also provided invaluable moral and social support as well as practical scientific, statistical or thesis-editing advice: Stephen Dove, Alex Bevan, Adrian Hunt, Walter del Pozzo, Stephanie Dumon, Emille Dasse, Lenka Cerna, Maria Barilla, Giacomo Volpe, Natalia Lopez, Sal Adrwish, Hiroto Kitaguchi, Antonio Perreca, Ludovico Carbone, Iryna Kepych, Elisavet Vasilopoulou, Kai Tollner, Peter Chong, Mayumi Fuchi and great divers from BSAC25. My gratitude is also extended to my dearest friend Marjetka Alfirević, for being a great friend, for giving me statistical advice, moral support through countless internet chats and for making me the happiest “adopted auntie” with her beautiful daughter Mila. Finally and most importantly, I would like to thank my love Miha and my extended family in Slovenia, who all believed in me from the start. You have been the best support throughout my thesis and a pillar on which I could lean on when I needed you the most. Thank you! Hvala!
TABLE OF CONTENTS 1 INTRODUCTION ............................................................................................................1
1.1 PLANT SEXUAL REPRODUCTION..................................................................................2 1.1.1 Pollen-pistil interactions: Pollination and fertilization......................................................3 1.1.2 Pollen tube ........................................................................................................................7
1.2 PROGRAMMED CELL DEATH (PCD)...........................................................................10 1.2.1 Plant caspase-like proteases ...........................................................................................13 1.2.2 Hypersensitive response (HR-) induced PCD .................................................................16 1.2.3 Self-incompatibility induced PCD in incompatible Papaver, Pyrus and Olea pollen....19
1.3 RECEPTORS AND CELL SIGNALLING........................................................................20 1.3.1 Plant receptors .................................................................................................................21
1.3.1.1 Plant receptor-like kinases...........................................................................................23 1.3.1.1.1 LRR-RLKs.........................................................................................................25 1.3.1.1.2 SRK-RLKs.........................................................................................................25 1.3.1.1.3 Other RLKs........................................................................................................26 1.3.1.2 G-protein coupled receptor..........................................................................................27 1.3.1.3 PrpS receptor in Papaver rhoeas.................................................................................28
1.4 SELF-INCOMPATIBILITY ...............................................................................................28 1.4.1 Sporophytic SI in the Brassicaceae .................................................................................31 1.4.2 S-RNase based gametophytic SI .....................................................................................34 1.4.3 Gametophytic SI in Papaveraceae..................................................................................37
1.4.3.1 Pistil S-determinant.....................................................................................................38 1.4.3.2 Pollen S-determinant...................................................................................................39 1.4.3.3. Mechanism of SI in Papaver......................................................................................40 1.4.3.3.1 Role of Ca2+ in the SI response...........................................................................41 1.4.3.3.2 Role of soluble inorganic pyrophosphatases in poppy SI...................................42 1.4.3.3.3 Role of MAPK in poppy SI.................................................................................43 1.4.3.3.4 Role of actin in poppy SI.....................................................................................44 1.4.3.3.5 Programmed cell death triggered by poppy SI....................................................46 1.4.3.3.6 Role of ROS in Papaver SI.................................................................................47
1.5 Arabidopsis thaliana AS A MODEL FOR SELF INCOMPATIBILITY.........................48 1.6 THE UBIQUITIN-26S PROTEASOME SYSTEM...........................................................49
1.6.1 The 26S Proteasome........................................................................................................53 1.6.2 Ubiquitination and self-incompatibility ..........................................................................55
1.7 SUMMARY AND OBJECTIVE ...........................................................................................57
2 Materials and Methods...................................................................................................59 2.1 Plant material: Papaver rhoeas ............................................................................................60
2.1.1 Papaver plant cultivation ................................................................................................60 2.1.2 Determination of Papaver S-genotype ............................................................................60 2.1.3 Collection of Papaver pollen ..........................................................................................60 2.1.4 Papaver pollen tube growth in vitro................................................................................62 2.1.5 Production of Papaver seeds...........................................................................................62
2.2 Plant material: Arabidopsis thaliana ...................................................................................63 2.2.1 A.thaliana cultivation ......................................................................................................63 2.2.2 A.thaliana plant conditions..............................................................................................64 2.2.3 Collection and germination of A.thaliana pollen ............................................................65 2.2.4 Collection of A.thaliana seeds.........................................................................................66
2.3 Experiments...........................................................................................................................66 2.3.1 Production of recombinant PrsS proteins........................................................................66
2.3.2 Treatments of pollen tubes ..............................................................................................68 2.3.3 Pollen protein extraction .................................................................................................69 2.3.4 Bradford Assay................................................................................................................70 2.3.5 SDS-Polyacrylamide gel electrophoresis (SDS-PAGE) .................................................71
2.3.5.1 Preparation of SDS-PAGE.........................................................................................71 2.3.5.2 Protein staining on the polyacrylamide gel................................................................71
2.3.6 Western blot ....................................................................................................................71 2.3.6.1 Protein transfer...........................................................................................................71 2.3.6.2. Protein immunodetection............................................................................................72 2.3.6.2.1 Enhanced chemiluminescence detection............................................................73 2.3.6.2.2 Light intensity evaluation of western blots (ECL detection)..............................74 2.3.6.2.3 Alkaline phosphatase detection..........................................................................74 2.3.6.3 Modified western blot for detection of membrane proteins.......................................74
2.3.7 Slot-blot binding assay ....................................................................................................75 2.3.8 Purification of antibodies using Immobilised E.coli lysate kit .......................................77 2.3.9 Pollen tube length measurement......................................................................................78 2.3.10 Programmed cell death – caspase-like activity assay....................................................78 2.3.11 Cell Death......................................................................................................................79
2.3.11.1 Cell death - viability test............................................................................................79 2.3.11.2 Pretreatment with tetrapeptide inhibitor Ac-DEVD-CHO........................................80
2.3.12 Actin labelling ...............................................................................................................80 2.3.13 Leaf mesophyl protoplast production............................................................................82 2.3.14 PCR screening for the presence of inserts in transgenic plants.....................................83 2.3.15 DNA analysis by agarose gel electrophoresis ...............................................................85 2.3.16 Semi-quantitative RT-PCR............................................................................................85
2.3.16.1 RNA extraction..........................................................................................................85 2.3.16.2 RNA analysis by agarose gel electrophoresis...........................................................86 2.3.16.3 DNase treatment of RNA..........................................................................................87 2.3.16.4 cDNA synthesis by RT-PCR.....................................................................................87
3 Investigation of the possible involvement of the ubiquitin-proteasomal pathway during SI in Papaver pollen..................................................................................................89
3.1 INTRODUCTION ................................................................................................................90 3.2 RESULTS ..............................................................................................................................95
3.2.1 The proteasome inhibitor MG132 affects pollen germination and tube growth .............95 3.2.2 Effect of inhibition of proteasomal activity on pollen tube growth ................................97 3.2.3 Effect of inhibition of proteasomal activity on pollen tube viability ..............................99 3.2.4 Proteasomal degradation and PCD in incompatible poppy pollen................................100 3.2.5 Effect of proteasomal inhibition by MG132 on the ubiquitination levels in incompatible pollen tubes ................................................................................................................................102 3.2.6 Proteasomal degradation acts upstream or in parallel with caspase-3-like activity ......104 3.2.7 Caspase-3 inhibitor decreases ubiquitination ................................................................105 3.2.8 Involvement of an E3 ligases in Papaver SI .................................................................107
3.3 DISCUSSION......................................................................................................................109 4 Investigation of the interaction between PrpS and PrsS...........................................124
4.1 INTRODUCTION ..............................................................................................................125 4.2 RESULTS: The S-specific interaction of PrpS and PrsS................................................127
4.2.1 Analysis of predicted structure of PrpS.........................................................................127 4.2.2 Binding assays...............................................................................................................133
4.3 DISCUSSION......................................................................................................................139
5 Functional analysis in vitro of the Arabidopsis thaliana expressing Papaver rhoeas PrpS1 and PrpS3 ..................................................................................................................141
5.1 INTRODUCTION ..............................................................................................................142 5.2 RESULTS ............................................................................................................................147
5.2.1 Characterization of A.thaliana expressing Papaver SI system .....................................147 5.2.1.1 PrpS expressing A.thaliana lines.......................................................................148 5.2.2 In vitro functional analysis of Papaver SI determinants in transgenic Arabidopsis thaliana in vitro ..................................................................................................................................158
5.2.2.1 S-specific inhibition of transgenic A.thaliana pollen tube growth...........................159 5.2.2.2 PrpS-PrsS interaction stimulates formation of punctate actin foci in transgenic A.thaliana pollen................................................................................................................................164 5.2.2.3 Evidence for PCD in the A.thaliana transgenic pollen upon SI challenge...............168 5.2.2.3.1 Pollen viability is decreased in an S-specific manner upon interaction between PrpS-GFP expressing A.thaliana pollen and recombinant stigmatic PrsS...........................168 5.2.2.3.2 Decrease of pollen viability involving DEVDase activity........................172 5.2.2.4 PCD in A.thaliana transgenic pollen expressing PrpS-GFP....................................176
5.2.3 A.thaliana mesophyll protoplasts expressing PrpS1......................................................181 5.3 DISCUSSION......................................................................................................................184
5.3.1 Alterations to the actin cytoskeleton .............................................................................184 5.3.2 Decrease of viability involving DEVDase activity .......................................................187 5.3.3 PCD in A.thaliana transgenic pollen.............................................................................189
6 Functional analysis in vivo of transgenic A.thaliana expressing Papaver S-determinants, PrsS and PrpS .........................................................................................192
6.1 INTRODUCTION ..............................................................................................................193 6.2 RESULTS ............................................................................................................................196
6.2.1 Characterization of A.thaliana expressing Papaver PrsS determinants........................197 6.2.2 S1-locus expressing A.thaliana line ...............................................................................201 6.2.3 Papaver pollen growth in the presence of stigmatic extract of A.thaliana expressing PrsS1 and PrsS3 ..........................................................................................................................204 6.2.4 Papaver SI in vivo in transgenic A.thaliana .................................................................209
6.2.4.1 Pollination assays in transgenic A.thaliana expressing Papaver PrsS and PrpS.....209 6.2.4.2 Seed set analysis in transgenic A.thaliana expressing Papaver PrsS and PrpS.......214 6.2.4.3 Seed set and silique length of F1 progeny from incompatible crosses.....................217
6.2.5 Investigating the function of the whole Papaver S1 locus in transgenic A.thaliana .....221 6.3 DISUSSION.........................................................................................................................226
7 GENERAL DISCUSSION ...........................................................................................235 7.1 Papaver S-determinant interactions..................................................................................237 7.2 Functional analysis of Papaver rhoeas self-incompatibility in transgenic Arabidopsis thaliana ..........................................................................................................................................240
8 LIST OF REFERENCES.............................................................................................244
APPENDIX I: Alignment of PrpS and Flower protein
APPENDIX II: Family trees of A.thaliana lines expressing Papaver S-determinants
APPENDIX III: Published papers

List of figures and tables
Chapter 1: Introduction
Figure 1.1. Schematic diagram of sexual reproduction in model plant A.thaliana ..................3
Figure 1.2. Reverse fountain cytoplasmic streaming ...............................................................8
Figure 1.3. Schematic representation of death receptor-mediated apoptosis signalling ........11
Figure 1.4. Subfamilies of plant RLKs ..................................................................................24
Figure 1.5. An illustration of the genetic basis of gametophytic and sporophytic SI ............29
Figure 1.6. Schematic diagram of the S-locus .......................................................................31
Figure 1.7. Schematic model of the SI response in Brassica .................................................32
Figure 1.8. Schematic model of the S-RNase based SI response ...........................................36
Figure 1.9. Schematic model of the SI response in Papaver .................................................41
Figure 1.10. The mechanism of ubiquitin-dependent proteasomal degradation ....................50
Figure 1.11. Structures of different types of E3 ligases .........................................................52
Figure 1.12. Organization and structure of 26S proteasome ..................................................53
Figure1.13. Involvement of UbP during SI ............................................................................56
Table 1.1. Caspase-like activities that exists in plants ...........................................................14
Table 1.2. Receptor-ligand pairs identified in plants .............................................................22
Chapter 2: Materials and Methods
Figure 2.1. Examples of aniline blue stained stigma squashes ..............................................61

Chapter 3: Investigation of the possible involvement of the ubiquitin-proteasomal
pathway during SI in Papaver pollen
Figure 3.1. Mean length of Papaver pollen tubes treated with different concentrations of
MG132 at two different time points .......................................................................................96
Figure 3.2. Mean length of pollen tubes pretreated with 40 µM MG132 & induced SI........98
Figure 3.3. FDA viability of pollen tubes pretreated with 40 µM MG132 & induced SI....100
Figure 3.4. Caspase activity of pollen tubes pretreated with 40 µM MG132 & induced SI.101
Figure 3.5. Ubiquitination levels of poppy pollen pre-treated with 40 µM MG132 and SI
induced .................................................................................................................................103
Figure 3.6. Caspase activity of pollen tubes with induced SI and added 40 µM MG132 in the
pollen tube extract ................................................................................................................104
Figure 3.7. Protein ubiquitination levels in poppy pollen tubes pre-treated with inhibitor of
caspase activity and SI challenged at three different time points ........................................106
Figure 3.8. Protein expression of poppy homologues of AtPUB17 and AtPOB1 E3 ligases
during SI ...............................................................................................................................108
Figure 3.9. Model of proteasomal degradation in SI-induced Papaver pollen tube.............116
Figure 3.10. Alternative model of proteasomal degradation and caspase-3-like activation
assumes that proteasome contains caspase-3-like activity....................................................118
Figure 3.11. Model that assumes the existence of negative regulator of DEVDase activity,
possibly POB1 homologue....................................................................................................121
Chapter 4: Investigation of the interaction between PrpS and PrsS
Figure 4.1. Structural prediction of PrpS1 as predicted by prediction programme
TMHMM...............................................................................................................................128

Figure 4.2. Amino acid sequence of four overlapping peptides ..........................................129
Figure 4.3. In vitro SI bioassay ............................................................................................129
Figure 4.4. Clustal W alignment of structural predictions of PrpS1, PrpS3 and PrpS8 as
predicted by TMHMM .........................................................................................................130
Figure 4.5. Structural predictions of PrpS1 using different prediction programmes.............131
Figure 4.6. Cartoon of possible structural topologies of PrpS1 as revealed by different
prediction programmes ........................................................................................................133
Figure 4.7. Binding assay with differential loading of peptides A1-A4 ..............................134
Figure 4.8. Binding assay with differential loading of peptide A3 detected with anti-PrsS1
and anti PrsS3 antibodies ......................................................................................................135
Figure 4.9. Binding assay in S-specific manner with differential loading of A3 .................136
Figure 4.10. Clustal W alignment of amino acid sequence of predicted extracellular loop.137
Figure 4.11. Alignment of peptides A1 for PrpS1 and PrpS8 and their scrambled controls.137
Figure 4.12. Binding assay between A1 peptides of PrpS1 and PrpS8 and recombinant PrsS1
and PrsS8 ..............................................................................................................................138
Chapter 5: Functional analysis in vitro of the Arabidopsis thaliana expressing Papaver
rhoeas PrpS1 and PrpS3
Figure 5.1. Schematic diagram presenting the outline of the in vitro functional analysis
experiments ..........................................................................................................................146
Figure 5.2. RT-PCR PrpS1-GFP and PrpS3-GFP expressing A.thaliana lines ....................154
Figure 5.3. Top 5 highest expressing PrpS-GFP lines .........................................................155
Figure 5.4. Western blot of PrpS1 expressing A.thaliana pollen, using two different
extraction buffers..................................................................................................................157

Figure 5.5. Schematic diagram of the SI experiment in vitro ..............................................159
Figure 5.6. A.thaliana pollen tube inhibition graph presenting pollen tube length .............161
Figure 5.7. Rhodamine Phalloidin stained actin in A.thaliana pollen .................................165
Figure 5.8. Quantification of actin foci and filaments in PrpS1-GFP expressing pollen .....167
Figure 5.9. Viability of A.thaliana transgenic pollen expressing PrpS1-GFP or PrpS3-GFP
...............................................................................................................................................169
Figure 5.10. Viability of Ac-DEVD-CHO pretreated A.thaliana transgenic pollen expressing
PrpS1-GFP or PrpS3-GFP .....................................................................................................174
Figure 5.11. DEVDase activity of protein extract from PrpS1-GFP or PrpS3-GFP expressing
A.thaliana pollen ..................................................................................................................177
Figure 5.12. DEVDase activity in A.thaliana pollen with induced SI or pre-treated with
inhibitor Ac-DEVD-CHO prior to induction of SI ..............................................................179
Figure 5.13. Effect of DEVDase inhibitor on the SI induced caspase-like activity ............180
Figure 5.14. GFP expression in Col-0 protoplasts transformed with 35S:PrpS1-GFP ........182
Figure 5.15. Viability of A.thaliana wt protoplats transfected with 35S:PrpS1-GFP ..........183
Table 5.1. The cartoon illustrations of the constructs of the poppy PrpS determinants ......144
Table 5.2. Segregation of Kan resistance and GFP expression in PrpS1-GFP expressing
transgenic A.thaliana ...........................................................................................................148
Table 5.3. Segregation of Kan resistance and GFP expression in PrpS3-GFP expressing
transgenic A.thaliana ...........................................................................................................152
Chapter 6: Functional analysis in vivo of transgenic A.thaliana expressing Papaver S-
determinants, PrsS and PrpS
Figure 6.1. Scheme of combination of crosses in transgenic A.thaliana expressing different
Papaver S-determinants .......................................................................................................195
Figure 6.2. RT-PCR of PrsS1 and PrsS3 expressing A.thaliana lines ..................................197
Figure 6.3. Top 5 highest expressing PrsS lines ..................................................................198
Figure 6.4. RT-PCR of S1-locus expressing A.thaliana lines ..............................................204
Figure 6.5. Images of Papaver pollen tubes incubated stigmatic protein extracts from
transgenic A.thaliana flowers ..............................................................................................206
Figure 6.6. Quantification of Papaver pollen tube length and tip diameter upon incubation
with A.thaliana stigmatic protein extracts ...........................................................................207
Figure 6.7. Aniline blue staining of crosses with PrsS1 expressing A.thaliana stigmas ......210
Figure 6.8. Aniline blue staining of crosses with PrsS3 expressing A.thaliana stigmas ......212
Figure 6.9. Seed set of all the incompatible crosses and controls ........................................216
Figure 6.10. Silique length and seed set of F1 seedlings ......................................................220
Figure 6.11. Analysis in vivo in S1-locus expressing transgenic A.thaliana line BG6.........222
Figure 6.12. Seed set analysis on the T3 generation of S1-locus expressing A.thaliana BG6
plants ....................................................................................................................................223
Figure 6.13. Aniline blue staining analysis of self pollination of BG6 flowers ..................225
Table 6.1. The cartoon illustrations of the constructs of the poppy PrsS determinants .......193
Table 6.2. Segregation of Kan resistance and GFP expression in PrsS1 expressing transgenic
A.thaliana .............................................................................................................................199

Table 6.3. Segregation of Kan resistance and GFP expression in PrsS3 expressing transgenic
A.thaliana .............................................................................................................................199
Table 6.4. Segregation of Kan resistance and GFP expression in S1-locus expressing
transgenic A.thaliana ...........................................................................................................202
Chapter 7: General Discussion
Figure 7.1. Schematic model of the SI response in Papaver................................................195
LIST OF ABBREVIATIONS
ABA – abscisic acid
ABP – actin binding protein
ACE-H – apical cap extension-hydrodynamics
ACR – Arabidopsis crinkly
ACRE – Avr9/Cf9 rapidly elicited
AGO7 – argonaute7
AP – alkaline phosphatase
ARC1 – Armadillo-repeat containing 1
ARF – auxin response factor
ARM – armadillo
as-ODN – antisense oligonucleotide
AtMC – Arabidopsis thaliana metacaspase
Avr – avirulence
BAK – BRI-associated receptor kinase
BCIP – 5-bromo-4-chloro-3-indolyl phosphatase
BR – brassinosteroid
BRI – brassinosteroid insensitive
BSA – bovine serum albumine
BTB – bric-a-brac-tramtrac-broad
CLE – clavata/ endosperm surrounding region
CLV – clavata
CP – 20S core protease
CRP – cysteine-rich proteins
DISC – death inducing signalling complex
DMSO – dimethyl sulfoxide
ECL – enhanced chemiluminiscence
ECM – extracellular matrix
EDTA – ethylenediamine tetraacetic acid
EGF – epidermal growth factor
ETI – effector-triggered immunity

ETS – effector-triggered susceptibility
FDA – fluorescein diacetate
Flg – flagellin
FLS – flagellin sensing
GABA – gamma-aminobutyric acid
GFP – green fluorescent protein
GM – germination medium
GPCR – G-protein coupled receptor
GSI – gametophytic self-incompatibility
HECT – homology to E6-associated protein C-terminus
HR – hypersensitive response
IDA – inflorescence deficient in abscission
IEF – isoelectric focusing
Kan – kanamycin
LRR – leucine rich repeats
MAMP – microbe associated molecular pattern
MAPK – mitogen activated protein kinase
MG132 – N-(benzyloxycarbonyl)-leucinyl-leucinyl-leucinal
MLPK – M-locus protein kinase
MOMP – mitochondrial outer membrane permeabilization
MS – Murashige and Skoog medium
MW – molecular weight
NBT – nitro blue tetrazolium
NO – nitric oxide
NS – not significant
PAGE – polyacrylamide gel electrophoresis
PAMP – pathogen-associated molecular pattern
PARP – poly-ADP-ribose polymerase
PBA – proteasome beta-subunit A
PBS – phosphate buffer saline
PCD – programmed cell death
PCR – polymerase chain reaction
PFA – paraformaldehyde
PiSBP – Petunia inflata S-RNase binding protein
PrpS – Papaver rhoeas pollen S
PRR – pathogen-recognition receptors
PrsS – Papaver rhoeas stima S
PSK – phytosulphokine
PSKR – phytosulphokine receptor
PTI – PAMP triggered immunity
PUB – plant U-box
PVDF – polyvinyl difluoride
RAR – require for Mla12 resistance1
RBX – RING-box
RLK – receptor-like kinase
ROP – Rho-related GTPase from plants
RP – 19S regulatory particle
RT – room temperature
RT-PCR – reverse transcription PCR
s-ODN – sense oligonucleotide
SA – salicylic acid
SAM – shoot apical meristem
SAR – systemic acquired resistance
SBP – S-protein binding protein
SC – self-compatibility
SCR – small cysteine-rich
SDS – sodium dodecyl sulphonate
SDW – sterile distilled water
SGT1 – suppressor of the G2 allele of skp1
SI – self-incompatibility
SKP – S-phase kinase-associated protein
SLF/SFB – S-locus F-box/ S-haplotype-specific F-box
SLG – S-locus glycoprotein
SP11 – S-protein 11
sPPase – soluble inorganic pyrophosphatases
SSI – sporophytic self-incompatibility
SSK – SLF-interacting SKP1-like
SRK – S-locus receptor kinase
SUB – strubbelig
RING – really interesting new gene
ROS – reactive oxygene species
ta-siRNA – trans-acting short interfering RNA
TBS – Tris buffer saline
TBST – TBS-Tween
TM – transmembrane
TMM – too many mouths
TNF – tumor necrosis factor
TNFR – tumor necrosis factor receptor
TPD – tapetum determinant
TRAIL – TNF related apoptosis inducing ligand
TTS – transmitting tract specific
UbP – ubiquitin-26S proteasome
UT – untreated
VPE – vacuolar processing enzyme
Y2H – yeast 2 hybrid

1
CHAPTER 1
INTRODUCTION
2
1.1 PLANT SEXUAL REPRODUCTION
Plant reproduction is widely studied due to its immense importance for biotechnology and
crop science, medicine, conservation biology and evolution. An important feature in the
subject of plant reproduction is also the pollen tube, which is used as a model system for cell
biology studies. The accessibility, easy in vitro germination and rapid growth makes it an
excellent model to study mechanical, genetic and molecular principles of polarised tip
growth, cytoskeleton organization, ion fluxes, periodic behaviour, endo- and exocytosis and
cell-cell signalling (Cheung and Wu, 2008, Feijó et al., 2001, Hepler et al., 2001, Moscatelli
and Idilli, 2009, Geitmann, 2010).
During plant sexual reproduction the parental male and female plant organs combine their
genetic material. The resulting offspring forms from a diploid embryo created when two
haploid gametes, generated by meiosis, fuse together to form a diploid zygote. Plant
reproduction starts with pollination. When a compatible pollen grain, containing the male
gamete, lands on the stigma, it adheres and hydrates. Following hydration, pollen germinates
and produces a pollen tube, which, with its strictly apical cell growth, elongates through the
tissue of pistil (see Figure 1.1) until it reaches the ovule. The pollen tube then releases its
two sperm cells to the embryo sac where a double fertilization occurs (Boavida et al., 2005,
Cheung et al., 2010, Lord and Russell, 2002).
After fertilization, embryogenesis takes place that ends with the production of seed. The seed
then germinates and new plant starts growing and developing organs. When the plant is
mature, flower development starts and within the flower, male and female gametophytes
form in spatially distinct areas of this organ via the processes of microsporogenesis and

3
megasporogenesis respectively. When these spores are fully formed, a new cycle of
pollination can occur.
Figure 1.1.: Schematic diagram of sexual reproduction in model plant Arabidopsis thaliana. Pollen adheres to stigma, germinates and produces a pollen tube, which grows through the stigmatic papillae towards the ovaries where double fertilization occurs. Main pistil organs are indicated in white boxes and biological processes are indicated in blue boxes, while red arrows indicate pollen-pistil interactions. Image adapted from Feijó, (2010).
The majority of flowering plants have, however, evolved mechanisms with which to cope
when pollinated with genetically too similar pollen, i.e. incompatible pollen. This work
focuses primarily on the pollination and prevention of self-fertilization aspect of plant
reproduction, more specifically, on the phenomena of self-incompatibility, which will be
described in greater detail in later section.
1.1.1 Pollen-pistil interactions: Pollination and fertilization
Pollen-pistil interaction involves an exchange of chemical signals between the male and
female cells in a clear physical connection. Six major pollen-pistil interactions events have

4
been identified during pollination (Heslop-Harrison, 1975): pollen capture and adhesion,
pollen hydration, germination of the pollen to produce a pollen tube, penetration of the
stigma by the pollen tube, growth of the pollen tube through the stigma/style and entry of the
pollen tube into ovule, resulting in discharge of sperm cells (Hiscock and Allen, 2008)
(Figure 1.1).
The first step of pollination is the adhesion of pollen to the stigma. Pollen is released from
the anthers in a dehydrated state and dispersed. After the initial capture of the pollen on the
stigma, the pollen and stigma proteins combine and the start the complex pollen-stigma
interactions that are under tight genetic and cellular control (Swanson et al., 2004). Adhesion
depends on the stigmatic surface (wet or dry stigmas, depending on the presence or absence
of stigmatic secretion) and on the pollen adhesion components (Zinkl et al., 1999).
It was demonstrated that in the formation of the pollen-stigma interface, pollen coat and
stigma lipids small cysteine-rich proteins (SCRs), reactive oxygen species (ROS), nitric
oxide (NO) and gamma-aminobutyric acid (GABA) are engaged (reviewed in Hiscock and
Allen, (2008), Higashiyama, (2010)).
In the compatible interaction, the pollen grain hydrates and germinates. Major factors
implicated in this process in tobacco are lipids, present on stigma and pollen coat (Wolters-
Arts et al., 2002), while in Brassica aquaporin-like protein MIP-MOD regulates the water
supply to pollen (Dixit et al., 2001). Additional proteins identified in the hydration are pollen
coat protein GRP17 in A. thaliana (Mayfield and Preuss, 2000), extracellular lipase EXL4
(Updegraff et al., 2009), water channel protein aquaporin in Brassica (Ikeda et al., 1997) and
in tomato, pollen specific secreted protein LAT52, was demonstrated to interact with
5
stigmatic LeSTIG1, via receptor kinase LePRK2, to promote pollen tube growth (Tang et al.,
2004). Pollen hydration step is important when we take into account SI mechanisms. It is
usually the step, which is severely inhibited in case of incompatible pollen-pistil reactions in
Brassicaceae (Takayama et al., 2000).
During pollen germination pollen tube penetrates from an aperture in the pollen cell wall
through a process of secretion of digestive enzymes, and enters the stigmatic tissue (see
Figure 1.1). Following germination, the pollen tube starts growing through the stigma, style
and transmitting tract of the pistil towards the ovary (see Figure 1.1), where it is mediated
mostly by the female guidance cues. Pistil influence on the pollen tube gene expression was
recently demonstrated to be much higher than previously thought. The pollen tube
transcriptome of pollen tubes growing in vivo involves ~700 genes more than pollen tubes
grown in vitro (Qin et al., 2009). Pollen absorbs nutrients from the female tissue and
interacts with the several components including pectins, stigma/stylar cysteine-rich adhesion
protein, that function in adhesion mediated pollen tube guidance, GABA, that forms a
gradient which controls pollen tube guidance to micropyle and arabinogalactan proteins
among which are best characterised transmitting tissue specific (TTS) glycoproteins that
form a glycosylation gradient that promotes pollen tube growth (Cheung and Wu, 1999, Park
et al., 2000, Palanivelu et al., 2003). In the transmitting tract of Nicotiana a thioredoxin h
was also identified and reported to interact with S-RNases and play a role in pollen-pistil
interactions during the S-RNase based SI (Juárez-Díaz et al., 2006). During the penetration
of pollen through the transmitting tract, extensin-like and expansin-like activities have been
reported, as well as pectin methylesterases, that enhance pollen tube tip dynamics (Stratford
et al., 2001, Grobe et al., 1999, Bosch et al., 2005).

6
In the final stages of pollen tube journey through the pistil, female guidance of the pollen
tube to the embryo sac is important for successful fertilization, and synergid cells play
crucial role in this step. Two synergid cells are flanking the entrance to the egg cell at the
micropylar end of the female gametophyte and are the source of the chemoattractants for the
pollen tubes. Their role was established in the past decade by studies in Torenia fournieri
(Higashiyama, 2002, Okuda et al., 2009). Mathematical model describing the dynamics of
pollen tube attraction towards the attractants released from the ovules is also established
(Stewman et al., 2010). It was recently demonstrated that two synergid cells in Torenia
secret two cysteine-rich proteins (CRPs) LURE1 and LURE2 (Okuda et al., 2009). They
were identified by expressed sequence tag analysis of the synergid cell of Torenia, 29 % of
all the clones they have sequenced encode CRPs (Okuda et al., 2009). CRPs LUREs belong
to subgroup of defensin-like proteins and are secreted toward the micropylar end of the
synergid cell. Down-regulation of the LURE1 and LURE2 protein resulted in the decreased
rates of pollen tube attraction and recombinant expression of LUREs exhibited strong
attraction of pollen tubes in vitro, suggesting that LUREs are involved in synergid cell
pollen tube attraction (Okuda et al., 2009). In Zea mays it was also reported that small
predicted transmembrane protein ZmEA1 (Zea mays Egg Apparatus 1) plays a pivotal role in
pollen tube attraction and guidance through the micropyle into the female gametophyte
(Márton et al., 2005).
After pollen tube grows into the female gametophyte, it releases its two sperm cells: one
fertilizes the haploid egg cell to form a diploid zygote and the other fuses with the diploid
central cell nuclei giving rise to the triploid endosperm. RLK FERONIA/SIRENE and
LORELEI were identified to be required for pollen tube arrest and burst in A. thaliana, and
defensin-like protein ZmES4 in Z.mays (Amien et al., 2010, Escobar-Restrepo et al., 2007,

7
Capron et al., 2008). ZmES4 activates K+ channel KZM1, localised in the plasma membrane
at the pollen tube tip. Interaction between ZmES4 ligand and KZM1 channel triggers rapid
influx of potassium ions and osmotic stress resulting in pollen tube tip burst (Amien et al.,
2010). During fertilization, each ovule is penetrated by a single pollen cell and it was
demonstrated using two-photon microscopy that late arriving pollen tubes are repelled from
the fertilized ovules or do not approach it at all (Cheung et al., 2010).
1.1.2 Pollen tube
Pollen is an organ that must survive in variety of different environments. To penetrate from
the stigma towards ovule, pollen tubes have a rapid growth rate. They are one of the fastest
growing plant cells known, reaching speeds of 200-300 nm.s-1 (Cheung and Wu, 2008). This
is an important characteristic, as the ovules are located at distances of several thousand times
the diameter of the pollen grain away from the stigma (Cheung and Wu, 2008).
There are four distinct zones or domains in highly polarised growing pollen tubes:
(1) the tip domain outlines an inverted cone and is rich in secretory vesicles
(2) the sub-apical domain, that contains metabolically active organelles, like
mitochondria and endoplasmic reticulum (ER)
(3) the nuclear zone, that contains large organelles and male germ cells
(4) vacuole domain, that contains large vacuoles and callose plugs (Aström, 1997,
Boavida et al., 2005).
The apical and sub-apical domains are jointly referred to as clear region, while nuclear and
vacuolisation zones are jointly referred to as the shank.
8
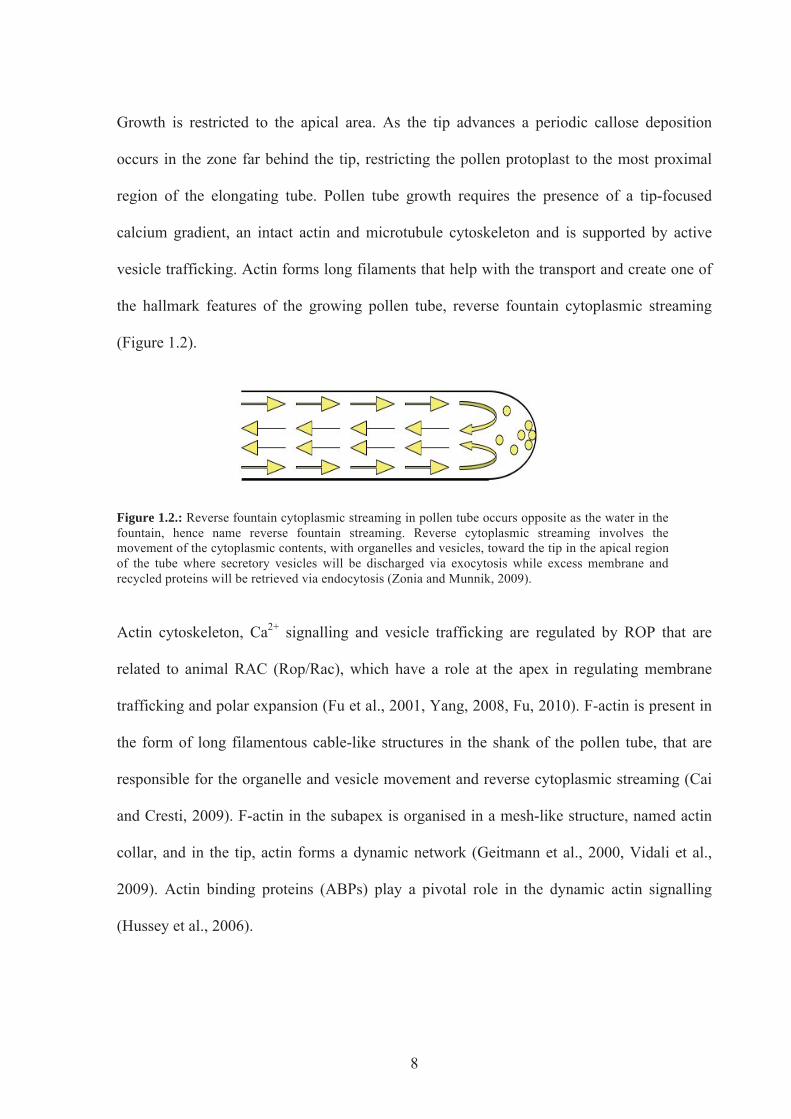
Growth is restricted to the apical area. As the tip advances a periodic callose deposition
occurs in the zone far behind the tip, restricting the pollen protoplast to the most proximal
region of the elongating tube. Pollen tube growth requires the presence of a tip-focused
calcium gradient, an intact actin and microtubule cytoskeleton and is supported by active
vesicle trafficking. Actin forms long filaments that help with the transport and create one of
the hallmark features of the growing pollen tube, reverse fountain cytoplasmic streaming
(Figure 1.2).
Figure 1.2.: Reverse fountain cytoplasmic streaming in pollen tube occurs opposite as the water in the fountain, hence name reverse fountain streaming. Reverse cytoplasmic streaming involves the movement of the cytoplasmic contents, with organelles and vesicles, toward the tip in the apical region of the tube where secretory vesicles will be discharged via exocytosis while excess membrane and recycled proteins will be retrieved via endocytosis (Zonia and Munnik, 2009).
Actin cytoskeleton, Ca2+ signalling and vesicle trafficking are regulated by ROP that are
related to animal RAC (Rop/Rac), which have a role at the apex in regulating membrane
trafficking and polar expansion (Fu et al., 2001, Yang, 2008, Fu, 2010). F-actin is present in
the form of long filamentous cable-like structures in the shank of the pollen tube, that are
responsible for the organelle and vesicle movement and reverse cytoplasmic streaming (Cai
and Cresti, 2009). F-actin in the subapex is organised in a mesh-like structure, named actin
collar, and in the tip, actin forms a dynamic network (Geitmann et al., 2000, Vidali et al.,
2009). Actin binding proteins (ABPs) play a pivotal role in the dynamic actin signalling
(Hussey et al., 2006).
9
In the recent years, ROS and phosphoinositides were demonstrated as additional pivotal
signalling factors during the pollen tube growth, both of them tightly connected with Ca2+
signalling (Fu, 2010). It was demonstrated that ROS forms a gradient in the apical domain of
the pollen tubes and by inhibiting ROS production, pollen tube growth was inhibited, while
Ca2+ stimulates ROS production in pollen tubes (Potocký et al., 2007).
Cytosolic free calcium is an essential secondary messenger in many signal transduction
processes in plants (reviewed in Dodd et al., 2010) and a tip-focused Ca2+ gradient is also
required for growing pollen tubes. This apical gradient is maintained by Ca2+ influx at the tip
via the opening of calcium channels. It has been shown to oscillate and it is thought that
these oscillations are associated with the pollen tube growth in vitro, however, it was
recently demonstrated in A. thaliana and N.tabacum, that such regular oscillations are not
essential for pollen tube growth (Iwano et al., 2009, Holdaway-Clarke et al., 1997). [Ca2+]cyt
oscillations are controlling a wide range of intracellular processes, therefore the range of the
[Ca2+]cyt must be kept low (~2x10⁴ lower than extracellular [Ca2+]), for the stable
equilibrium of Ca2+ in the pollen tube (Iwano et al., 2009). Malhó et al., (1994) and Malho
and Trewavas, (1996) have shown, that calcium is involved in the reorientation of the
growing pollen tube. They suggested that this element is part of a signal transduction system,
which allows pollen tubes to respond to directional signals in the style that guide it towards
the ovary. Mechanism of regulating Ca2+ is very complex and is interconnected also with
other signalling pathways, such as ROP, ROS and phosphoinositidide signalling and
influences many processes in the growing pollen tube; fusion of vesicles within the cell wall;
regulation of cytoplasmic streaming; controlling the direction of growth, influencing actin
cytoskeleton and mediating the SI response and programmed cell death (Malhó, 2006).

10
1.2 PROGRAMMED CELL DEATH (PCD)
PCD is an essential conserved cell death process used to remove the unwanted cells in
plants during development and in response to external stimuli. It has been defined as a
sequence of (potentially interruptible) events that lead to the controlled and organized
destruction of the cell (Lockshin and Zakeri, 2004).
In animals there are three main types of cell death distinguished: apoptosis, autophagic
cell death and necrosis (Kroemer et al., 2009). The major morphological features of
animal apoptosis are reduction of cellular volume, chromatin condensation, nuclear
fragmentation, plasma membrane blebbing, formation of apoptotic bodies, engulfment by
phagocytes and clearance of dead cell contents by lysosomal degradation. Apoptosis in
animals can be triggered by intrinsic stimuli, that can result from stress, radiation and
others, and extrinsic stimuli, that is normally caused by binding of extracellular ligands,
such as TNF-α (tumor necorsis factor), Fas ligand or TRAIL ligand (TNF related
apoptosis-inducing ligand) to TNF receptors and activates caspase-dependent pathway
(see Figure 1.3) (Spencer and Sorger, 2011). Death processes are triggered by initiator
caspases-8 and -10 at DISCs (death inducing signalling complexes), that cleave the
effector caspase’s-3 and -7 pro-domain thus forming an activated protease and
consequentially cell death occurs (Figure 1.3). However, in some cases mitochondrial
outer membrane permeabilization (MOMP) leading to diffusion of the mitochondrial
intramembrane space into the cytosol, is also required to activate effector caspases (type
II apoptotic pathway). Mitochondrial permeabilization is a well studied mechanism and
is controlled by Bcl-2 protein family (Figure 1.3): Bax and Bak (multidomain proteins
causing mitochondrial pore formation); Bcl-2, Mcl-1 and Bcl-xL (inhibitors of Bax and
11
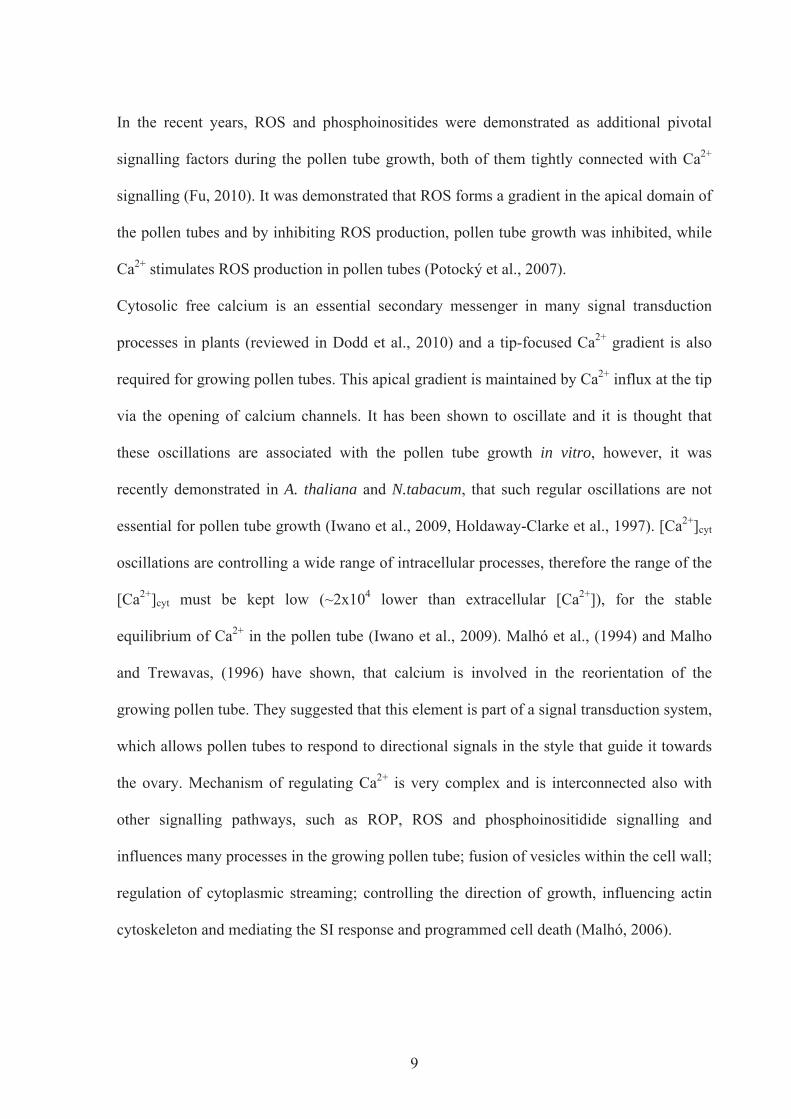
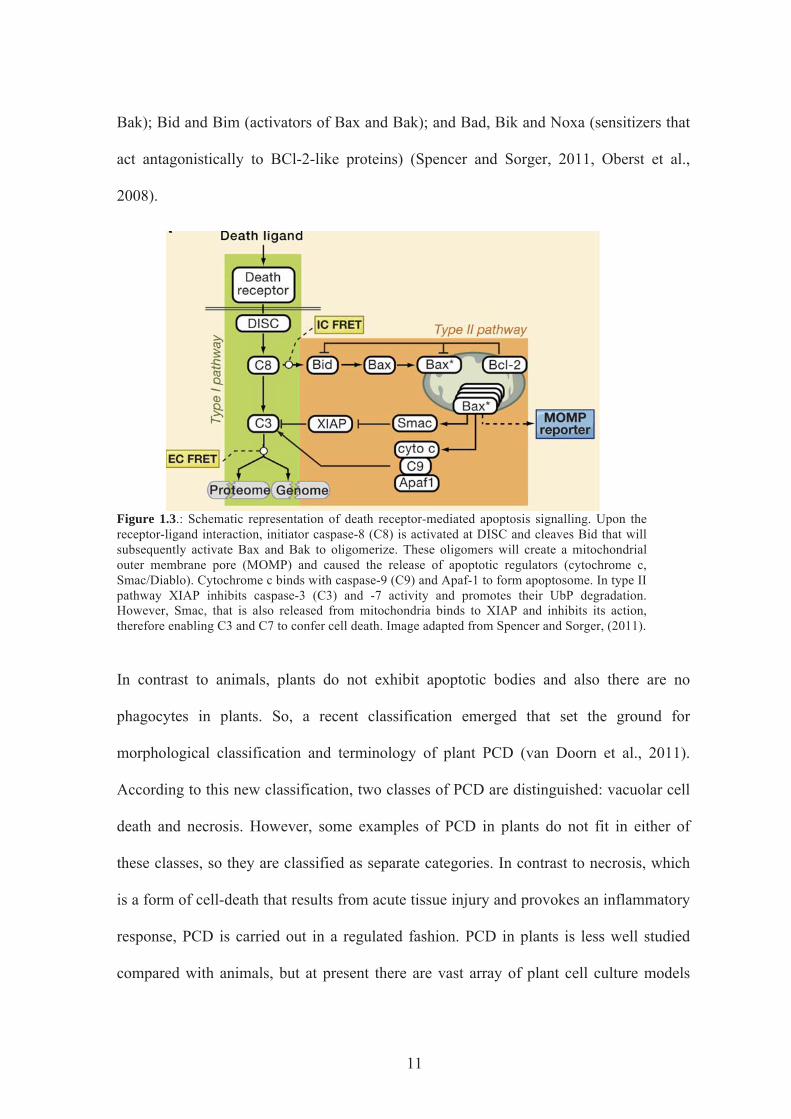
Bak); Bid and Bim (activators of Bax and Bak); and Bad, Bik and Noxa (sensitizers that
act antagonistically to BCl-2-like proteins) (Spencer and Sorger, 2011, Oberst et al.,
2008).
Figure 1.3.: Schematic representation of death receptor-mediated apoptosis signalling. Upon the receptor-ligand interaction, initiator caspase-8 (C8) is activated at DISC and cleaves Bid that will subsequently activate Bax and Bak to oligomerize. These oligomers will create a mitochondrial outer membrane pore (MOMP) and caused the release of apoptotic regulators (cytochrome c, Smac/Diablo). Cytochrome c binds with caspase-9 (C9) and Apaf-1 to form apoptosome. In type II pathway XIAP inhibits caspase-3 (C3) and -7 activity and promotes their UbP degradation. However, Smac, that is also released from mitochondria binds to XIAP and inhibits its action, therefore enabling C3 and C7 to confer cell death. Image adapted from Spencer and Sorger, (2011).
In contrast to animals, plants do not exhibit apoptotic bodies and also there are no
phagocytes in plants. So, a recent classification emerged that set the ground for
morphological classification and terminology of plant PCD (van Doorn et al., 2011).
According to this new classification, two classes of PCD are distinguished: vacuolar cell
death and necrosis. However, some examples of PCD in plants do not fit in either of
these classes, so they are classified as separate categories. In contrast to necrosis, which
is a form of cell-death that results from acute tissue injury and provokes an inflammatory
response, PCD is carried out in a regulated fashion. PCD in plants is less well studied
compared with animals, but at present there are vast array of plant cell culture models
12
and developmental systems are being researched by different research groups (Korthout
et al., 2000, Sundström et al., 2009, Hatsugai et al., 2009, Thomas and Franklin-Tong,
2004, Coll et al., 2010, Bozhkov et al., 2004, Chichkova et al., 2010, Coffeen and
Wolpert, 2004, Danon et al., 2004, Vercammen et al., 2004, Watanabe and Lam, 2011).
Plant vacuolar cell death is for example found during aerenchyma formation, xylem
differentiation in vascular plants, leaf remodelling in Monstera or during the formation of
embryo-suspensor (Gunawardena et al., 2004, Ohashi-Ito et al., 2010, Filonova et al.,
2000). It is morphologicaly noticeable due to the increase of the vacuole volume, which
contains hydrolytic enzymes that swallow up cell cytoplasm and degrade its contents.
The disassembly of nuclear envelope was also observed as well as the formation of actin
cables. Vacuolar cell death ends with the rupture of vacuole membrane or tonoplast and
release of hydrolytic enzymes destroying the protoplast, however until rupture the
organelles are intact (van Doorn et al., 2011). Biochemically, vacuolar cell death can be
detected due to its autophagic activity, acidification of vacuoles, reorganisation of
cytokeletal elements and activation of vacuolar processing enzymes (VPEs).
The second type of plant PCD is necrotic PCD, which occurs in pathogen recognition
during the hypersensitive response (HR) or in cells challenged by necrotrophic pathogens
(van Doorn et al., 2011). It is distinguished from the vacuolar type by the absence of
increasing size vacuole, mitochondrial swelling and shrinkage of protoplasts caused by
the early rupture of plasma membrane with spilled and unprocessed corpses of necrotic
cells. Biochemically, the necrosis can be detected by changes in mitochondria membrane
potential, decreased respiration, accumulation of reactive oxygen species (ROS) and
reactive nitrogen species (NO) as well as decline in ATP level (van Doorn et al., 2011,
Christofferson and Yuan, 2010).

13
However, despite these two classifications, some unique types of plant PCD exist that
cannot be attributed to either of those two groups. Such examples are HR cell death and
PCD during self-incompatibility (SI) response (Thomas and Franklin-Tong, 2004,
Hatsugai et al., 2009, Hofius et al., 2009).
1.2.1 Plant caspase-like proteases
Caspases play a critical role in animal apoptosis and are a family of cysteine proteases
with specificity for aspartic acid, hence their name (Shi, 2002). There are no homologies
to the caspases in plants, however, the caspase-like proteolytic activities have been
identified in plants. Caspase-like activities have been detected using synthetic
tetrapeptide substrates designed using the preferred cleavage site consensus of the
members of the mammalian caspase family. Therefore the synthetic substrates are not
caspase specific but they represent the optimal cleavage site of specific caspases
(Stennicke and Salvesen, 2000). Caspase activities are often referred to using the amino
acid sequence of the substrate cleaved (e.g. an activity against the substrate DEVD will
be referred to as a DEVDase activity; see Table 1.1). Good biochemical evidence exists
for the activation of plant proteases that cleave the substrates of caspases and therefore
exhibit caspase-like activity in plants during PCD (for recent reviews see (Bonneau et al.,
2008, van Doorn and Woltering, 2005, Piszczek and Wojciech, 2007, Woltering, 2010).
Table 1.1 presents caspase-like activities that have been observed in plants to date.

14
Table 1.1.: Plant caspase-like activities, plant species where they were identified and reference. Activity Species and tissue Reference
YVADase (caspase-1-like)
Tobacco leaf tissue Barley embryonic suspension cells Tobacco BY2 cells White spruce seeds Pisum sativum seedlings A. thaliana seedlings A. thaliana fumonisin B-induced leaf lesion Nicotiana TMV infected leaves Seed integumens P.rhoeas pollen
(del Pozo and Lam, 1998) (Korthout et al., 2000) (Mlejnek and Prochazka, 2002) (He and Kermode, 2003) (Belenghi et al., 2004) (Danon et al., 2004) (Kuroyanagi et al., 2005) (Hatsugai et al., 2004) (Nakaune et al., 2005) (Bosch et al., 2010)
DEVDase (caspase-3-like)
Barley embryonic suspension cells Tobacco BY2 cells White spruce seeds Pisum sativum seedlings Picea abies embryogenic cell line Avena sativa leaves A. thaliana seedlings P.rhoeas pollen A. thaliana bact. inf. leaves
(Korthout et al., 2000) (Mlejnek and Prochazka, 2002) (He and Kermode, 2003) (Belenghi et al., 2004) (Bozhkov et al., 2004) (Coffeen and Wolpert, 2004) (Danon et al., 2004) (Thomas and Franklin-Tong, 2004) (Hatsugai et al., 2009)
IETDase (saspase)
Avena sativa leaves P.rhoeas pollen
(Coffeen and Wolpert, 2004) (Bosch and Franklin-Tong, 2007)
LEHDase Nicotiana benthamiana leaves
(Kim et al., 2003)
LEVDase P.rhoeas pollen (Bosch and Franklin-Tong, 2007)
TATDase Xanthi tobacco leaves (Chichkova et al., 2004, Chichkova et al., 2008)
VEIDase P.rhoeas pollen Barley seeds Norway spruce embryogenic cell line A. thaliana seedlings
(Bosch and Franklin-Tong, 2007) (Borén et al., 2006) (Bozhkov et al., 2004) Rotari & Gallois – unpublished
VEIDase (phytaspase)
Tobacco and rice (Chichkova et al., 2010)
VKMDase (saspase)
Avena sativa leaves (Coffeen and Wolpert, 2004)
metacaspases A. thaliana seedlings Picea abies embryo
(Coll et al., 2010) (Sundström et al., 2009)

15
Metacaspases are a distant homologues of caspases that are found in plants, fungi and
protozoa, and were demonstrated to play a role in plant PCD. They are arginine/lysine
specific cysteine proteases. In A. thaliana, two types of metacaspases exist, type I and
type II metacaspases (Watanabe and Lam, 2011, Sundström et al., 2009, Vercammen et
al., 2004, Coll et al., 2010). Type II metacaspase, Tudor staphylococcal nuclease was
identified in pine that is cleaved during PCD (Sundström et al., 2009). Recently, (Coll et
al., 2010) demonstrated in A. thaliana, that type I metacaspases, AtMC1 and AtMC2
antagonistically control PCD. AtMC1 acts as a pro-death protein required for HR cell
death, while AtMC2 antagonizes it.
Vacuolar processing enzyme (VPE) is a plant legumain and it exhibits YVADase
activity. It was implicated to play its role during PCD in several different species in
various pathways. It plays a vital role in the rupture of the vacuole membrane and HR
cell death in response to plant virus infection (Hatsugai et al., 2004). VPE was also
identified in Papaver pollen, by binding to DEVD-biotin probe (Bosch et al., 2010). It
also exhibits DEVDase and IETDase activities in addition to predominant YVADase.
Although it does not play a role in the SI response it is suggested to play a role in
processing mitochondrial proteins (Bosch et al., 2010).
Another group of plant caspase-like proteins are saspases, subtilisin-like serine-dependent
aspartate-specific proteases. They are involved in victorin-induced degradation of
Rubisco during PCD in oats and exhibit VKMDase, VNLDase and VEHDase activities
(Coffeen and Wolpert, 2004).
Chichkova et al., (2010) recently reported identification of phytaspase, a plant aspartate-
specific protease, another subtilisin-like protesase from tobacco and rice. It plays an

16
important role in regulation of PCD response to TMV infection and abiotic stresses, like
oxidative and osmotic stresses. It possesses VEIDase activity and is localised in the
apoplast, however during PCD it is partly re-localized inside the cell and so it might play
a role in both positions (Chichkova et al., 2010).
There are many examples of PCD in plant development and in response to external
stimuli (reviewed in Bonneau et al., 2008), and presented in Table 1.2 on page 22). An
example of PCD in response to an external stimulus comes from the hypersensitive
response (HR) after pathogen attack (reviewed in Coll et al., 2011), that can be compared
to the SI-induced events in Papaver. So these two examples of PCD are described in
more detail in the next two sections.
1.2.2 Hypersensitive response (HR-) induced PCD
Hypersensitive response (HR) is a mechanism of cell death that exhibits features of
necrotic cell death but in addition also growth of the vacuole and rupture of the vacuole
membrane followed by the release of lytic vacuolar contents and also VPEs. HR is a
genetically controlled mechanism, based on the specific interactions between the
products of the complementary genes of plant and pathogen, resulting in shrinkage of the
cytoplasm, chromatin condensation, vacuolization and disruption of chloroplasts, all of
that leading to rapid and localized cell death at the site of infection. In this way plants
protect themselves and prevent spread of pathogens into healthy tissues (Dangl and
Jones, 2001, Coll et al., 2011). When a microbial pathogen invades the plant tissue, a
defence mechanism is initiated. Pathogens are inhibited by a combination of a layer of
17
dead cells, the local production of antimicrobial compounds, and the induction of
systemic acquired resistance in the host (Dickman et al., 2001, Lincoln et al., 2002).
In the recognition of ‘non-self’, plant immune responses are of two types: one against
general microorganisms and one against specific pathogen races (Chisholm et al., 2006,
Jones and Dangl, 2006). The general defense mechanism is known as a pathogen- or
microbe- associated molecular pattern (PAMP/MAMP) triggered immunity (Schwessinger
and Zipfel, 2008, He et al., 2007a) and is triggered by extracellular surface receptors, called
pattern-recognition receptors (PRRs). PRR recognition PAMP/MAMP results in the
activation of defense responses against the pathogenic and non-pathogenic microbes (He et
al., 2007a). In plants there are numerous PRRs, majority belonging to the receptor-like
kinase (RLK) transmembrane proteins (Shiu and Bleecker, 2001). They are very specific and
can recognize general features of microorganisms, such as bacterial flagellin (Zipfel et al.,
2004, Gómez-Gómez and Boller, 2000). As a result of the co-evolution, plant pathogens
have developed various strategies to overcome PAMP triggered immunity (PTI). One of
them is effector-triggered susceptibility (ETS), which deploys PTI-suppressing pathogen
effectors. The second and more specific defense mechanism against pathogen ETS is known
as effector-triggered immunity (ETI), which is stimulated by plant resistance proteins (R-
proteins) recognizing pathogens effector proteins, avirulence (Avr) proteins. ETI is very
rapid and overblown defense response compared to PTI (Jones and Dangl, 2006, Boller and
Felix, 2009).
One of the early actions in ETI is the oxidative burst; a generation of reactive oxygen species
(ROS), such as hydrogen peroxide (H2O2), hydroxyl radicals ( OH), superoxide anions
(O2 -) and nitric oxide (NO) and development of localized PCD of infected cells and this is

18
known as HR, the final defense mechanism in plants (Nimchuk et al., 2003). As a result of
the ETI activation, an increased accumulation of salicylic acid (SA) is also observed. SA
induces the induction of various pathogenesis-related (PR) genes and the activation of
systemic acquired resistance (SAR) (Nimchuk et al., 2003).
Few components regulating R-protein interaction and responses have been characterized.
ACRE (Avr9/Cf9 rapidly elicited) genes are such example and several of them encode
Ubiquitin E3 ligases (Craig et al., 2009). Among them is ACIF1 (Avr9/Cf-0-induced F-
box1), a positive regulator of HR against fungal, bacterial and viral pathogens (van den Burg
et al., 2008). Plant U-box proteins (PUB) have also been reported to act as a positive or
negative regulators of plant immunity. PUB17, for example, an A. thaliana homolog of
tobacco ACRE276 (also closely related to Brassica ARC1) acts as a positive regulator of HR
in a response to the infection of Cf9 expressing tobacco with Avr9 peptide (Yang et al.,
2006). The functional involvement of ACRE276 for a resistance against Cladosporium
fulvum was demonstrated by silencing experiments where the ACRE276 silencing caused a
reduced HR and breakdown of the Cf9-mediated resistance against C. fulvum, which could
complete a whole lifecycle in RNAi silenced tobacco expressing Cf9 and in VIGS silenced
tomato plants. The expression of AtPUB17 in ACRE276 RNAi plants lead to the restoration
of Cf9/Avr9 induced cell death, thus demonstrating the role of the E3 ubiquitin ligases
(Yang et al., 2006). On the other hand, PUB22, PUB23 and PUB24 act cumulatively as
negative regulators of resistance, as triple mutant pub22/pub23/pub24 displayed increased
oxidative burst and cell death (Trujillo et al., 2008).
Hatsugai et al., (2009) recently demonstrated the role of the proteasome in HR induced cell
death as a response to bacteria attack. They identified a novel plant defense strategy to
bacteria attack by membrane fusion of vacuole membrane and plasma membrane. Such a
19
fusion forms a tunnel from the inside of cell to the outside and enables the discharge of
vacuolar content and defense proteins, as they demonstrated by the use of fluorescent
proteins (Hatsugai et al., 2009). Outside the cell, plant defense proteins attack the bacterial
cells, while hydrolytic enzymes in plant cell cause HR cell death (Hatsugai et al., 2009).
Moreover, with the use of inhibitors of caspase-3 activity and proteasome inhibitors,
Hatsugai et al., (2009) also demonstrated, that such a cell death and membrane fusion are
proteasome-dependent and shown that proteasome subunit PBA1 acts as a caspase-3-like
enzyme.
1.2.3 Self-incompatibility (SI) induced PCD in incompatible Papaver, Pyrus and
Olea pollen
SI is a genetic mechanism that prevents self-fertilization by recognition and rejection of self-
pollen, thus promoting outbreeding (described in details in Section 1.4.). There are several
different mechanisms of SI in different species, like gametophytic SI in Papaver,
gametophytic S-RNase-based SI in Nicotiana, Petunia, and Pyrus, sporophytic SI in
Brassica, and some other less studied SI types, for example SI in Olea.
PCD was initially identified as a final and key downstream mechanism during SI in Papaver
rhoeas pollen tube (Thomas and Franklin-Tong, 2004). PCD in the incompatible Papaver
pollen is characterized by loss of pollen viability, depolymerization of actin cytoskeleton,
activation of ROS and NO, SI-mediated DNA fragmentation and increased caspase-3-like
activity (Bosch and Franklin-Tong, 2007, Wilkins et al., 2011). Recently, PCD was also
implicated in response to SI in Pyrus pyrifolia (pear) pollen and Olea europea (olive)
stigmatic cells (Serrano et al., 2010, Wang et al., 2009a, Wang et al., 2010). P. pyrifolia

20
from family Rosaceae is the first example of gametophytic S-RNAse based SI where nuclear
DNA degradation was demonstrated in incompatible pollen tube in vivo and in vitro, prior to
the inhibition of incompatible pollen tube (Wang et al., 2009a, Wang et al., 2010). In
addition to DNA degradation, collapse of membrane potential and cytochrome c leakage in
the cytosol were also demonstrated, indicating that SI in pear pollen could result in PCD of
incompatible pollen (Wang et al., 2009a, Wang et al., 2010).
The O. europea SI system is less well understood and studied, however it is implicated
with the stylar gametophytic SI (Serrano et al., 2010). Morphological changes with
vacuolization of the cells, chromatin condensation, plasma membrane blebbing and loss
of cell integrity were observed in the Olea stigmas. Trypan blue staining confirmed loss
of papillar and pollen cell viability in incompatible conditions, DNA degradation was
demonstrated by TUNEL and DEVDase activity were observed in both pollen and pistils
of Olea under free pollination (Serrano et al., 2010).
1.3 RECEPTORS & CELL SIGNALLING
Cells coordinate their intracellular status with the external environment by means of a large
number of clearly defined signalling pathways. The interaction of a typical cell with the
extracellular matrix and with neighbouring cells influences a variety of signalling events.
Signalling pathways can be extracellular, activated by an external stimuli or generated within
the cell. There are various signals received by the cells: chemical signals (i.e. specific
ligands, such as PrsS in case of Papaver rhoeas SI signalling, or hormones), electromagnetic
radiation (such as light) or mechanical inputs (such as touch). The purpose of signalling is to
21
encode information and convey a message about the internal or external environment into
chemical signals, to which the cell can respond. This is done through the reception of the
signal, which is then transduced intracellularly until a cellular response is activated.
Information is communicated either through direct protein-protein interactions or by
diffusible elements, usually referred to as second messengers.
Plant signalling is mediated, as in many animal systems, by hormones, steroids, sterols and
lipids, reactive oxygen species (ROS) and nitric oxide (NO), signalling peptides, and various
small proteins (Matsubayashi, 2003, Mittler et al., 2004, Wang, 2004, Vert et al., 2005).
Only some of these signalling molecules have their receptor components identified and the
next section 1.3.1 gives an overview.
1.3.1 Plant receptors
Plant receptors have been classified according to their structural characteristics. The largest
group are receptor-like kinases (RLKs), comprising a family of over 600 genes in A.
thaliana (Shiu et al., 2004). Other plant receptors include G-protein coupled receptors
(GPCRs) and other receptors for hormone signalling, some of which are components of the
ubiquitin-26s proteasome (UbP) pathway (Chow and McCourt, 2006, Spartz and Gray,
2008). Wheeler et al., (2009) reported identification of a pollen transmembrane receptor
PrpS, which was identified as the male determinant of SI in Papaver. This type of receptor
has no homology to any other known transmembrane protein and it represents a completely
new group of plant receptors. Table 1.2. summarizes the plant receptors and their
corresponding ligands in cases where they have been identified.

22
Table 1.2.: Receptor-ligand pairs identified in plants Different types of receptors are highlighted by different colours for easier overview: RLKs are in blue, GPCR is in brown, PrpS is in red and hormone receptors are in green. Ligand Receptor Type of
receptor System References
Brassinosteroids (BR) BRI1/BAK1 LRR-RLK Plant Growth control: cell expansion and division, senescence, male fertility, pollen development fruit ripening, response to environmental factors
(Ye et al., 2011, Clouse, 2011, Kinoshita et al., 2005)
CLAVATA3 (CLV3) CLV1/CLV2 LRR-RLK Growth regulation of apical shoot meristem
(Clark et al., 1997, Brand et al., 2000, Ogawa et al., 2008)
TRACHEARY ELEMENT DIFFERENTIATION INHIBITORY FACTOR (TDIF)/CLE41 & CLE44
PHLOEM INTERCALATED WITH XYLEM/TDIF RECEPTOR (PXY/TDR)
LRR-RLK Vascular cell division
(Fisher and Turner, 2007, Etchells and Turner, 2010, Ito et al., 2006, Hirakawa et al., 2008)
IINFORESCENCE DEFFICIENT IN ABSCISSION (IDA)
HAESA/HAESA-LIKE2 (HAE/HSL2)
LRR-RLK Control of floral abscission in Arabidopsis
(Cho et al., 2008, Stenvik et al., 2008)
systemin SR160 LRR-RLK Defense signalling (Scheer and Ryan, 2002)
Phytosulphokine (PSK)
PSK receptor (PSKR) LRR-RLK Cellular de-differentiation and re-differentiation
(Matsubayashi and Sakagami, 2006)
Bacterial flagellin (flg22)
FLAGELLIN SENSING2 (FLS2)
LRR-RLK Plant innate immunity; bacterial disease resistance; mediating stomatal response
(Gómez-Gómez and Boller, 2000, Zeng and He, 2010, Zipfel et al., 2004)
EPIDERMAL PATTERNING FACTOR1 (EPF1) & EPF2
ERECTA (ER) & TOO MANY MOUTHS (TMM)
LRR-RLK Stomatal initiation and development
(Hara et al., 2007, Hara et al., 2009); (Hara et al., 2009, Hunt and Gray, 2009, Shpak et al., 2005)
Not identified
STRUBBELIG (SUB)
LRR-RLK Epidermal maintenance and cell specification
(Chevalier et al., 2005, Yadav et al., 2008)

23
TAPETUM DETERMINANT1 (TPD1)
EXCESS MICROSPOROCYTES1/ EXTRASPOROGENOUS CELLS (EMS1/EXS)
LRR-RLK Anther tissue development and microsporocyte numbers
(Canales et al., 2002, Zhao et al., 2002, Yang et al., 2005, Jia et al., 2008)
CLAVATA3/ ENDOSPERM SURROUNDING REGION (CLE40)
ARABIDOPSIS CRINKLY 4 (ACR4)
TNFR-RLK Root meristem development
(Becraft et al., 1996, De Smet et al., 2008, Gifford et al., 2005, Stahl et al., 2009)
S-locus cysteine rich (SCR) also known as S-protein11 (SP11)
S-locus –RLK (SRK) SRK-RLK Self-Incompatibility in Brassica
(Kachroo et al., 2001, Takayama et al., 2001)
Abscisic acid (ABA) G-PROTEIN COUPLED RECEPTOR (GPCR)
GPCR ABA signalling in guard cells
(Liu et al., 2007b)
Papaver rhoeas stigma S (PrsS)
Papaver rhoeas pollen S (PrpS)
PrpS Self-Incompatibility in Papaver
(Wheeler et al., 2009)
Ethylene & Cytokinins ETR1, ERS1, ETR2, EIN4 & ERS2 for ethylene CRE1, AHR2 & AHR3 for cytokin
Two cmponent Histidine kinase sensors
Regulation of cell division and differentiation, promotion of fruit ripening.
(Chow and McCourt, 2006)
Auxin, Jasmonic acid (JA)
Ubiquitin protein ligase SCFTIR1, SCFCOI1,
F-box proteins
Plant growth and development
(Katsir et al., 2008, Kepinski and Leyser, 2005, Dharmasiri et al., 2005)
Gibberellins (GA) GID1 Hormone-sensitive lipases
Seed germination, stem elongation, leaf expansion, pollen maturation and induction of flowering
(Ueguchi-Tanaka et al., 2005)
1.3.1.1 Plant receptor-like kinases
RLKs represent nearly 2.5 % of the total number of proteins encoded in the genome of A.
thaliana and have diverged to perform different roles (Shiu et al., 2004). The first plant RLK
was identified in Zea mays (Walker and Zhang, 1990). Its role was determined because of

24
similarity to the Brassica S-locus glycoprotein, implicating RLKs in mediating self-
incompatibility (Walker and Zhang, 1990).
RLKs encode a typical single-pass, transmembrane-spanning domain, with an extracellular
N-terminal domain and an intracellular C-terminal serine/threonine (Ser/Thr) kinase domain.
Recently it was reported that LRR RLKs, such as brassinosteroid insensitive 1 (BRI1)
receptor and BRI1-asscoiated receptor kinase (BAK1), can autophosphorylate on tyrosine
residues in addition to Ser/Thr and are thus dual specificity kinases (Oh et al., 2009, Oh et
al., 2010, Jaillais et al., 2011).
Plant RLKs consist of several subfamilies, recognised because of their distinct extracellular
domains that display variable structural features that bind different types of ligands, like S-
domain, leucine-rich repeats (LRR), epidermal growth factor repeats (EGF) and lectins
(Figure 1.4.). These will be briefly explained in the next section.
Figure 1.4.: Subfamilies of plant RLKs, based on the structure of the extracellular domain: S-domain class RLKs based on S-receptor kinase (SRK) RLKs; leucine rich repeats (LRR) RLKs are the largest subfamily of RLKs; tumor-necrosis factor receptor (TNFR)-like class RLKs; epidermal growth factor (EGF) class RLKs; PR5 like receptor kinase (PR) class RLKs; lectin class RLKs (Adapted from the website of Torii Laboratory)

25
1.3.1.1.1 LRR-RLKs The largest subfamily of RLKs are the leucine rich repeats (LRR-RLKs) with over 200
members in A. thaliana, all containing tandem domains of approximately 24 amino acids
featuring conserved leucines (Figure 1.4). Despite the similarity of the extracellular domain
of the LRR-RLKs they bind a very diverse set of ligands, including: brassinosteroids,
peptides, such as phytosulfokine and systemin and even secreted proteins (e.g. CLV3).
Accordingly, LRR RLKs play critical roles in various stages of plant growth and
development (see Table 1.2). For example, LRR RLKs are involved in the maintenance of
the shoot apical meristem (SAM) where the CLAVATA (CLV) signalling pathway plays a
central role in the regulation of SAM by controlling the size of the stem cell population
(Fletcher and Meyerowitz, 2000, Clark et al., 1997). LRR RLKs are also involved in the
brassinosteroid signal transduction pathway, which is regulated by the BRs. BRs are growth
promoting steroid hormones (Grove et al., 1979). BR signal transduction and its mechanism
is one of the best understood among the plant RLK family. Their role is associated with wide
range of processes, such as light signalling, PCD, innate immunity response, male fertility,
pollen development, fruit ripening, regulated senescence, cell expansion and division (for
recent review see Clouse, 2011).
1.3.1.1.2 SRK RLKs
The S-locus receptor-like kinases (SRK) are described in greater detail in the section 1.4.
Highly polymorphic SRK has been identified as a female determinant of Brassica SI and is
specifically expressed in the plasma membrane of the stigmatic surface (Stein et al., 1996). It
consists of an SLG–like extracellular domain, a single transmembrane domain and a
26
cytoplasmic Ser/Thr kinase domain (Figure 1.4) (Stein et al., 1991). The ligand for SRK is a
pollen coat protein SCR/SP-11. The receptor-ligand interaction, activated in an allele-
specific manner, triggers intracellular signalling cascade resulting in the pollen tube
inhibition (Kachroo et al., 2001, Takayama et al., 2001) also reviewed in (Nasrallah, 2005,
Takayama and Isogai, 2005). SRK RLKs also have another function. It was demonstrated
that some RLKs could interact with Calmodulin (CaM), a small protein containing two
globular domains with EF hands domain that bind Ca2+ (Vanoosthuyse et al., 2003,
Charpenteau et al., 2004, Gifford et al., 2007). Recently, a protein from the SRK family, a
calmodulin-binding RLK (CBRLK1) was identified in A. thaliana and Glycine soya (Kim et
al., 2009, Yang et al., 2010). CBRLK binds specifically to a Ca2+-dependent calmodulin
binding domain (CaMBD) in the C-terminus (kinase domain), and there is a possibility that
the interaction of CaM with SRK CBRLK1 plays a role in recycling of RLKs in plants (Kim
et al., 2009).
1.3.1.1.3 Other RLKs
Among other classes of plant RLKs, illustrated in Figure 1.4. are TNFR, EGF, PR and lecitin
class of RLKs. TNFR class is best represented by the ACR4 (ARABIDOPSIS CRINKLY4).
ACR4 is involved in the maintenance of the root meristem and is expressed in differentiating
root cells. ACR4 acts together with CLE40 peptide, a CLV3 homologue, which is expressed
in fully differentiated columella cells (cell layer at the root tip, which forms the root cap
together with the lateral root cap cells), to control the expression of transcription factor
WOX5 (WUSCHEL-RELATED HOMEOBOX5) in the quiescent centre in order to
maintain distal root stem cells (De Smet et al., 2008, Stahl et al., 2009). The root meristem

27
signalling works in opposite direction to the shoot signalling. In root signalling, signals
originate from differentiated cells and determine the size and position of the root stem cell
niche. Another role implicated for ACR4 is promoting initiation of lateral roots (De Smet et
al., 2008).
1.3.1.2 G-protein coupled receptor
The GPCR family of receptors is also known as a seven transmembrane domain (7TM)
receptor and it acts as a guanine nucleotide exchange factor. G-protein signalling cascade is
composed of heterotrimeric protein complexes, which are composed of α-, β- and γ-subunits
and GPCR. These complexes link perception by GPCRs with downstream signalling cascade
(Jones and Assmann, 2004). A change in GPCR conformation upon the perception of the
signal leads to the conformational change in the α- subunit and an exchange of GDP for
GTP. This reorientation disrupts the interaction between α and β subunits and promotes
dissociation of the complex into Gα and Gβγ dimers, which can interact with an array of
downstream signalling molecules (Jones and Assmann, 2004).
The genome of A. thaliana encodes around 25 GPCR candidate proteins (Grill and
Christmann, 2007). In plants this family of receptors mediates various responses to adjust
cell growth and differentiation, metabolism, embryogenesis, abscisic acid (ABA) and
pathogen-associated molecular pattern (PAMP) regulation of guard cell ion channels and
stomatal apertures and ROS signalling (Zhang et al., 2011).

28
1.3.1.3 PrpS receptor in Papaver rhoeas
Papaver pollen S-determinant (PrpS) will be described in greater detail in the next section
1.4. PrpS is a novel transmembrane protein, localized in pollen plasma membrane. Its
structure has not yet been resolved, but it most likely contains four transmembrane domains
with an extracellular loop of 35 amino acids, which is the binding side for its cognate ligand
(Wheeler et al., 2009). The ligand for PrpS is globular stigmatic protein PrsS. The S-specific
interaction between PrpS and PrsS triggers downstream signalling cascade resulting in the
PCD of pollen tube and thus prevention of self-fertilization (Thomas and Franklin-Tong,
2004). The identification of PrpS, a predicted novel transmembrane protein is of
considerable interest, since very few plant ligand-receptor partners have been identified to
date. Given that most of the transmembrane plant receptors identified to date are plant
receptor kinases, the discovery of the PrpS could represent a novel class of receptor.
1.4 SELF-INCOMPATIBILITY
The majority of plants develop both male and the female organs on the same plant in close
proximity. For most plants, like for mammals, the problem of self-fertilization is a serious
one. In mammals inbreeding can result in genetic disease and poor health, and inbred plants
also experience decreased fitness as the benefits of out-crossing are lost and inbreeding is
encouraged with a resulting loss of genetic variability. In order to avoid self-pollination and
ensure that their offspring benefits from hybrid vigour, plants have developed a number of
different mechanisms. The most widespread mechanism for prevention of inbreeding is SI; a

29
system where self-pollen is “rejected” at the molecular level. It is estimated that some form
of SI is present in ~60 % of all flowering plants (Hiscock and Kües, 1999).
SI is genetically controlled cell-cell recognition system where self-pollen is recognised by
pistil and inhibited in an S-specific manner. There are two major mechanisms of SI:
sporophytic (SSI) and gametophytic (GSI) (see Figure 1.5.).
Figure 1.5.: An illustration of the genetic basis of gametophytic and sporophytic SI. For the sporophytic type, the SI phenotype of pollen is determined by the S-genotype of its diploid parent, thus each pollen grain carries the products of two S-genotypes. If an S1S3 pollen pollinates S1S3 or S2S3 stigma the outcome is incompatible interaction, while pollination of S2S4 stigma results in compatible pollination and fertilization. For the gametophytic type, the SI phenotype of pollen is determined by the S-genotype of its haploid genome, thus each pollen grain carries the product of one S-genotype. If S1 and S2 pollen lands on S1S2 stigma it results in self-incompatible reaction, while pollination of S1S3 stigma results in half-compatible situation where S1 pollen is inhibited and S2 allowed to grow and fertilize, and pollination of S3S4 stigma results in completely compatible situation. The spots in the pistils represent S-allelic component of the female S-determinants (i.e. in the sporophytic SI model, Brassica SRK1 is represented by blue spots, SRK3 by red spots, SRK2 by yellow spots and SRK4 by purple spots, while in gametophystic SI model spots represent S-RNases or PrsS proteins).
The pollen SI phenotype in SSI is determined by diploid genome of its parents (sporophyte),
whereas in GSI the pollen SI phenotype is determined by its own haploid (gametophytic)
genome. GSI is the most widespread SI system and has been extensively studied in the
Solanaceae (Lycopersicon (tomato), Nicotiana (tobacco), Petunia (Petunia) and Solanum
(potato)), Rosaceae (Malus (apples), Prunus (apricots, almonds, cherries) and Pyrus (pears)),
SSPOROPHYTIC SI
S3 S1 S3 S1
S3 S1
GGAMETOPHYTIC SI
S2 S2 S2 S1 S1 S1
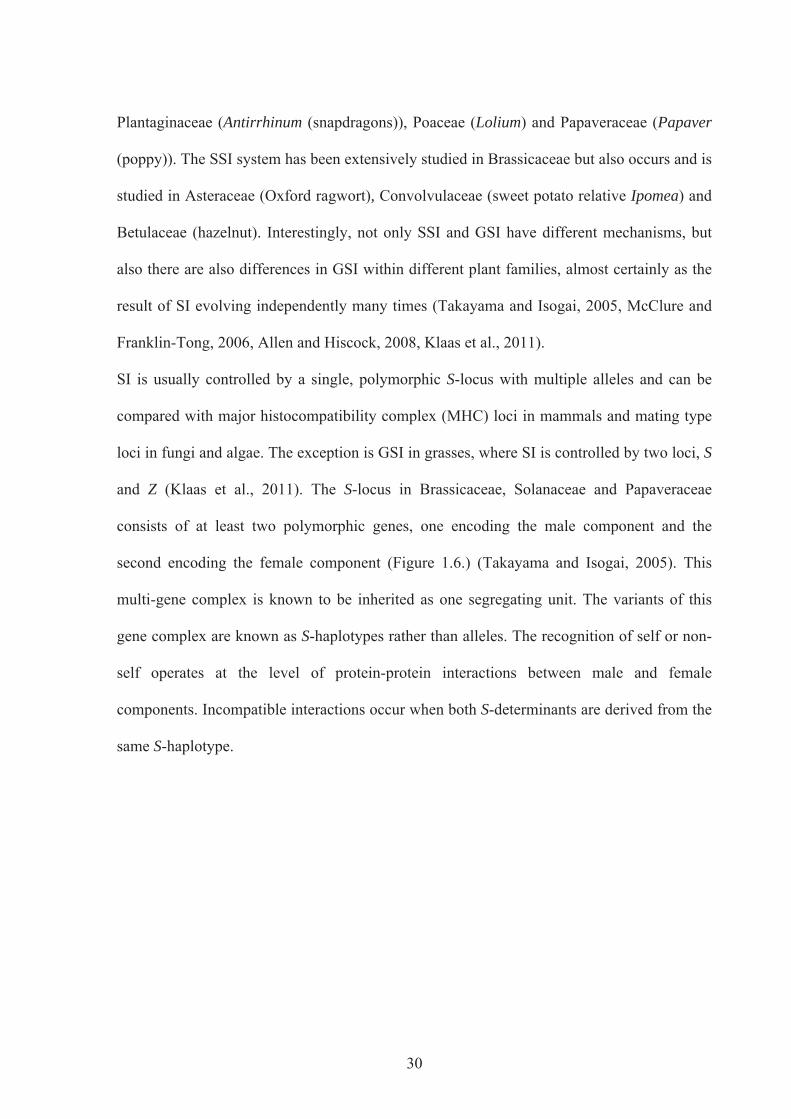
30
Plantaginaceae (Antirrhinum (snapdragons)), Poaceae (Lolium) and Papaveraceae (Papaver
(poppy)). The SSI system has been extensively studied in Brassicaceae but also occurs and is
studied in Asteraceae (Oxford ragwort), Convolvulaceae (sweet potato relative Ipomea) and
Betulaceae (hazelnut). Interestingly, not only SSI and GSI have different mechanisms, but
also there are also differences in GSI within different plant families, almost certainly as the
result of SI evolving independently many times (Takayama and Isogai, 2005, McClure and
Franklin-Tong, 2006, Allen and Hiscock, 2008, Klaas et al., 2011).
SI is usually controlled by a single, polymorphic S-locus with multiple alleles and can be
compared with major histocompatibility complex (MHC) loci in mammals and mating type
loci in fungi and algae. The exception is GSI in grasses, where SI is controlled by two loci, S
and Z (Klaas et al., 2011). The S-locus in Brassicaceae, Solanaceae and Papaveraceae
consists of at least two polymorphic genes, one encoding the male component and the
second encoding the female component (Figure 1.6.) (Takayama and Isogai, 2005). This
multi-gene complex is known to be inherited as one segregating unit. The variants of this
gene complex are known as S-haplotypes rather than alleles. The recognition of self or non-
self operates at the level of protein-protein interactions between male and female
components. Incompatible interactions occur when both S-determinants are derived from the
same S-haplotype.
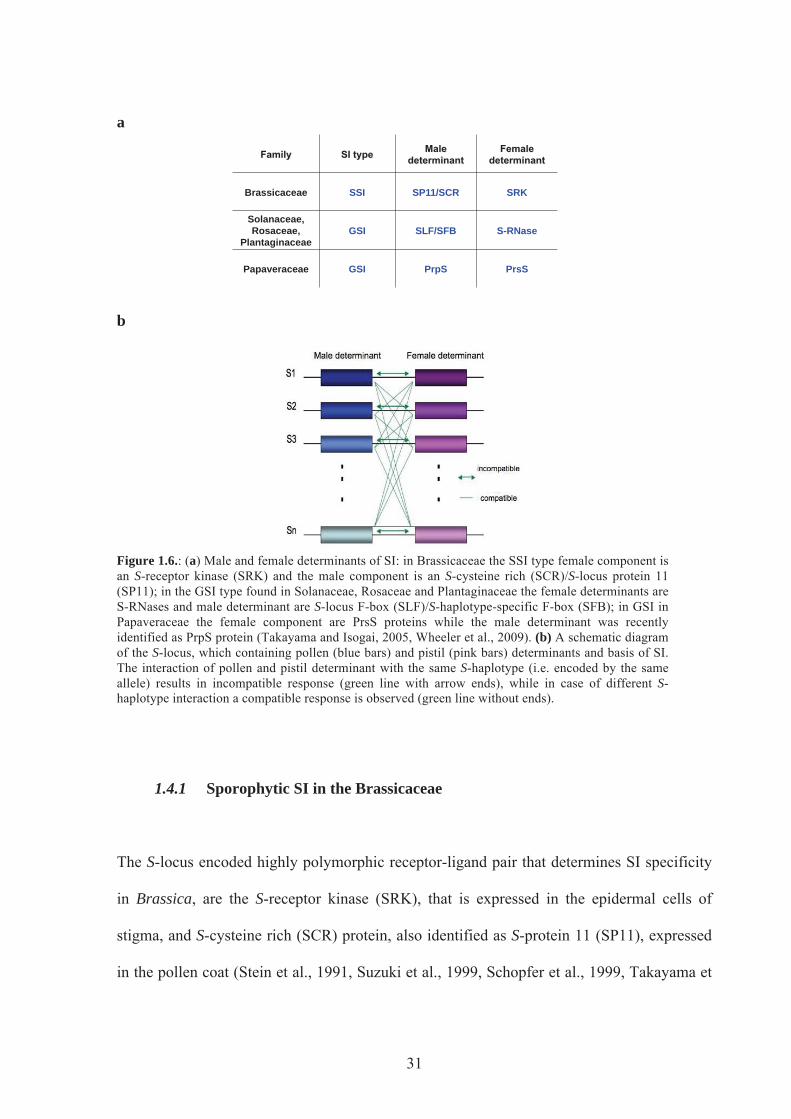
31
a
b
Figure 1.6.: (a) Male and female determinants of SI: in Brassicaceae the SSI type female component is an S-receptor kinase (SRK) and the male component is an S-cysteine rich (SCR)/S-locus protein 11 (SP11); in the GSI type found in Solanaceae, Rosaceae and Plantaginaceae the female determinants are S-RNases and male determinant are S-locus F-box (SLF)/S-haplotype-specific F-box (SFB); in GSI in Papaveraceae the female component are PrsS proteins while the male determinant was recently identified as PrpS protein (Takayama and Isogai, 2005, Wheeler et al., 2009). (b) A schematic diagram of the S-locus, which containing pollen (blue bars) and pistil (pink bars) determinants and basis of SI. The interaction of pollen and pistil determinant with the same S-haplotype (i.e. encoded by the same allele) results in incompatible response (green line with arrow ends), while in case of different S-haplotype interaction a compatible response is observed (green line without ends).
1.4.1 Sporophytic SI in the Brassicaceae
The S-locus encoded highly polymorphic receptor-ligand pair that determines SI specificity
in Brassica, are the S-receptor kinase (SRK), that is expressed in the epidermal cells of
stigma, and S-cysteine rich (SCR) protein, also identified as S-protein 11 (SP11), expressed
in the pollen coat (Stein et al., 1991, Suzuki et al., 1999, Schopfer et al., 1999, Takayama et
Brassicaceae SSI SP11/SCR SRK
Solanaceae, Rosaceae,
Plantaginaceae GSI SLF/SFB S-RNase
Papaveraceae GSI PrpS PrsS
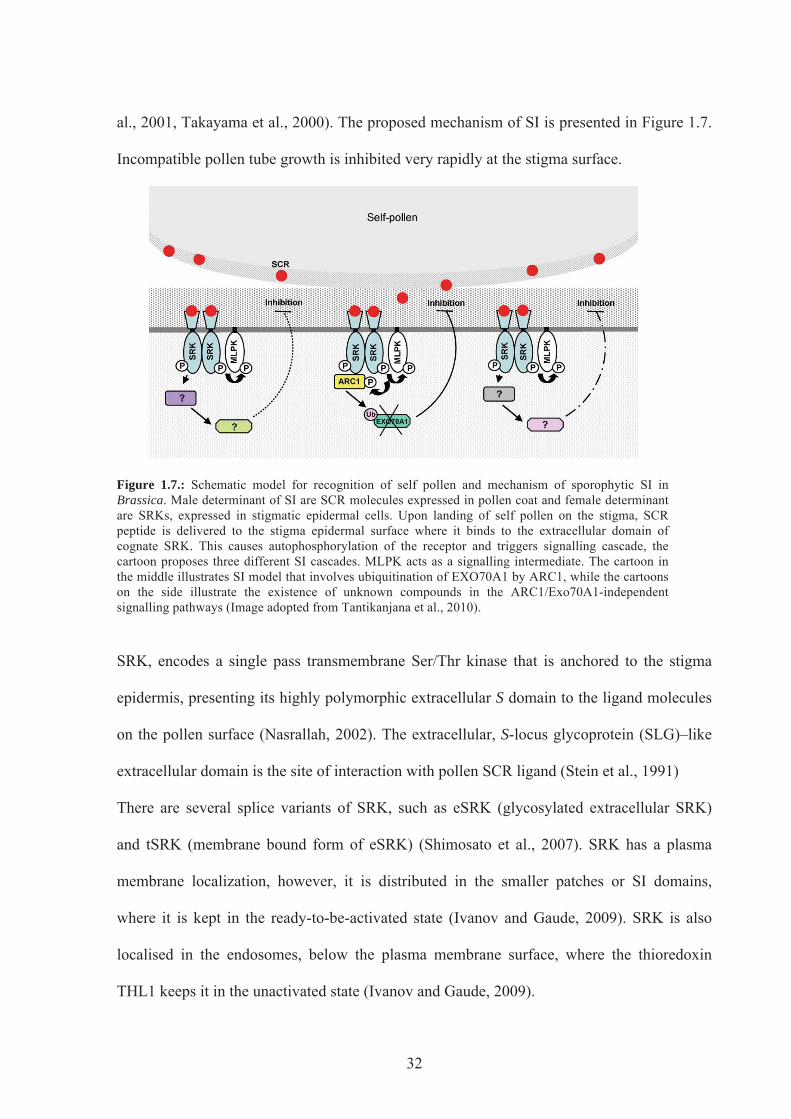
32
al., 2001, Takayama et al., 2000). The proposed mechanism of SI is presented in Figure 1.7.
Incompatible pollen tube growth is inhibited very rapidly at the stigma surface.
Figure 1.7.: Schematic model for recognition of self pollen and mechanism of sporophytic SI in Brassica. Male determinant of SI are SCR molecules expressed in pollen coat and female determinant are SRKs, expressed in stigmatic epidermal cells. Upon landing of self pollen on the stigma, SCR peptide is delivered to the stigma epidermal surface where it binds to the extracellular domain of cognate SRK. This causes autophosphorylation of the receptor and triggers signalling cascade, the cartoon proposes three different SI cascades. MLPK acts as a signalling intermediate. The cartoon in the middle illustrates SI model that involves ubiquitination of EXO70A1 by ARC1, while the cartoons on the side illustrate the existence of unknown compounds in the ARC1/Exo70A1-independent signalling pathways (Image adopted from Tantikanjana et al., 2010).
SRK, encodes a single pass transmembrane Ser/Thr kinase that is anchored to the stigma
epidermis, presenting its highly polymorphic extracellular S domain to the ligand molecules
on the pollen surface (Nasrallah, 2002). The extracellular, S-locus glycoprotein (SLG)–like
extracellular domain is the site of interaction with pollen SCR ligand (Stein et al., 1991)
There are several splice variants of SRK, such as eSRK (glycosylated extracellular SRK)
and tSRK (membrane bound form of eSRK) (Shimosato et al., 2007). SRK has a plasma
membrane localization, however, it is distributed in the smaller patches or SI domains,
where it is kept in the ready-to-be-activated state (Ivanov and Gaude, 2009). SRK is also
localised in the endosomes, below the plasma membrane surface, where the thioredoxin
THL1 keeps it in the unactivated state (Ivanov and Gaude, 2009).
33
The S-specific interaction of SP11/SCR with SRK is localised on the interacting area of the
stigmatic papillae, while the rest are ready to react on their own independent interactions.
The S-specific interaction induces the autophosphorylation of SRK, triggering a signalling
cascade that results in the rejection of self-pollen (Kachroo et al., 2001, Takayama et al.,
2001, Ivanov et al., 2010). Inhibition occurs within minutes of pollination and the papillae
cell wall may not even be penetrated. Downstream of SRK signalling were found proteins
ARC1 (Armadillo-repeat containing 1) and MLPK (M-locus protein kinase) (see Figure 1.7)
(Murase et al., 2004, Stone et al., 1999).
Membrane anchored cytoplasmic serine/threonine kinase was identified by positional
cloning of the M (modifier) locus (Murase et al., 2004) and is thought to act with
phosphorylated SRK to phosphorylate ARC1. ARC1 was identified with Y2H screening for
interactors of SRK kinase domain and it encodes a U-box E3 ligase with an arm repeat
region (Stone et al., 2003, Stone et al., 1999). ARC1 is a positive regulator of the SI because
the downregulation of ARC1 results in the partial breakdown of the SI (Stone et al., 1999).
As an ARC1 binding protein, EXO70A1, component of an exocyst complex, was recently
identified (Samuel et al., 2009). It normally promotes compatible pollinations as its reduced
expression disturbed non-self pollen tube growth, therefore ARC1 mediated ubiquitination
and proteasomal degradation of EXO70A1 is required for normal SI to occur (Samuel et al.,
2009).
However, recent re-analysis of the Brassica SI signalling network revealed that it is much
more complex then previously thought and that downstream signalling components
identified so far (MLPK, ARC1, EXO70A1) are not required for SI, at least not for a
Brassica SI in A. thaliana (see Figure 1.7) (Tantikanjana et al., 2010).

34
Tantikanjana et al., (2009) reported, that SRK also plays a role in pistil elongation. This
additional role of SRK, whose expression was detected throughout the pistil, was identified
in rdr6 mutants of transgenic Arabidopsis thaliana, expressing Arabidopsis lyrata SI genes.
RDR6 functions in production of trans-acting short interfering RNA (ta-siRNA), and was
found to enhance SI and causes stigma exsertion. In this mutant background they
demonstrated that SRK gene further enhances pistil elongation and stigma exertion, which
indicates that positive regulators of SI are regulated by ta-siRNAs and that SI trait and
physiological distance between stigma and anthers have coevolved (Tantikanjana et al.,
2009). They also identified targets of ta-siRNA as AGO7 (ARGONAUTE 7), that is an ARF
(auxin response factor) and ARF3 and ARF4 are already demonstrated regulators of pistil
development (Tantikanjana et al., 2009, Tantikanjana et al., 2010).
1.4.2 S-RNase based gametophytic SI
GSI in the Solanaceae (petunia, potato, tobacco, tomato, etc.), Rosaceae (apple, cherry,
almond, pear, etc) and Plantaginaceae (Antirrhinum) share a common pistil S-determinant,
an S-RNase. In these families inhibition of pollen tubes occurs in the transmitting tract of the
style. Incompatible pollen grains lands on the stigma, hydrates and germinates as normal.
The pollen tube grows through the stigmatic papillae and the transmitting tract of the style. It
is only once pollen tubes reach about one-third of the way through the style that growth is
arrested (Kao and Tsukamoto, 2004).
The S-RNases were identified by searching for pistil specific proteins that exhibited S-allele-
specific differences in molecular weight and isoelectric point, as the allelic variants of
protein involved in SI must be divergent in sequence in order to serve as a recognition
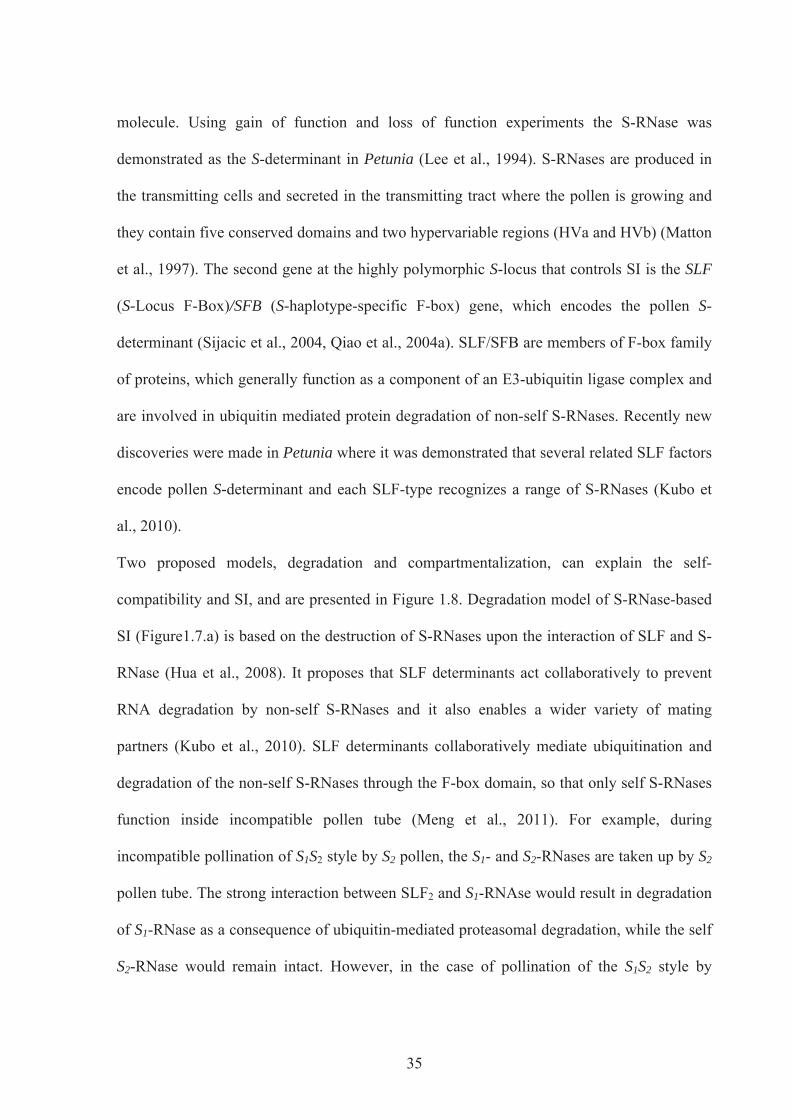
35
molecule. Using gain of function and loss of function experiments the S-RNase was
demonstrated as the S-determinant in Petunia (Lee et al., 1994). S-RNases are produced in
the transmitting cells and secreted in the transmitting tract where the pollen is growing and
they contain five conserved domains and two hypervariable regions (HVa and HVb) (Matton
et al., 1997). The second gene at the highly polymorphic S-locus that controls SI is the SLF
(S-Locus F-Box)/SFB (S-haplotype-specific F-box) gene, which encodes the pollen S-
determinant (Sijacic et al., 2004, Qiao et al., 2004a). SLF/SFB are members of F-box family
of proteins, which generally function as a component of an E3-ubiquitin ligase complex and
are involved in ubiquitin mediated protein degradation of non-self S-RNases. Recently new
discoveries were made in Petunia where it was demonstrated that several related SLF factors
encode pollen S-determinant and each SLF-type recognizes a range of S-RNases (Kubo et
al., 2010).
Two proposed models, degradation and compartmentalization, can explain the self-
compatibility and SI, and are presented in Figure 1.8. Degradation model of S-RNase-based
SI (Figure1.7.a) is based on the destruction of S-RNases upon the interaction of SLF and S-
RNase (Hua et al., 2008). It proposes that SLF determinants act collaboratively to prevent
RNA degradation by non-self S-RNases and it also enables a wider variety of mating
partners (Kubo et al., 2010). SLF determinants collaboratively mediate ubiquitination and
degradation of the non-self S-RNases through the F-box domain, so that only self S-RNases
function inside incompatible pollen tube (Meng et al., 2011). For example, during
incompatible pollination of S1S2 style by S2 pollen, the S1- and S2-RNases are taken up by S2
pollen tube. The strong interaction between SLF2 and S1-RNAse would result in degradation
of S1-RNase as a consequence of ubiquitin-mediated proteasomal degradation, while the self
S2-RNase would remain intact. However, in the case of pollination of the S1S2 style by
36
heteroallelic S1S2 pollen, SLF1 would preferentially interact with non-self S2-RNases and
SLF2 with S1-RNase, thus resulting in heteroallelic pollen compatible with S1S2 pistil (Meng
et al., 2011). Using both allelic products of SLF, produced in heteroallelic pollen together
mean that heteroallelic pollen is accepted by pistils, regardless of the S-genotype (Meng et
al., 2011). However during incompatible pollination none of the SLF varieties bind and
degrade self-S-RNases, which are therefore free to degrade the RNA of pollen tube (Kubo et
al., 2010).
Figure 1.8.: Two models for S-RNase based SI. (a) Degradation model: multiple SLF proteins are linked to certain S-RNAse and act collaboratively. In the compatible situation (top) the array of SLF proteins (for example SLF1y and SLF1x) bind to Sx-RNase thus preventing degradation of pollen RNA. During incompatible interaction (bottom) pollen SLF proteins, for example SLF1x, SLF2x and SLF3x do not bind self-S-RNase, which degrades the pollen RNA and thus inhibits pollen tube growth. (b) Compartmentalization model: during compatible pollination (top), the non-self RNase enters the pollen tube and are most likely compartmentalized into vacuoles and HT-B proteins are degraded. It is proposed that SLF promotes degradation of the non-self RNAses that are not compartmentalized by 26S proteasome. The RNA of the pollen remains intact. In incompatible pollination (bottom), the S-RNase and HT-B enter the endomembrane system by endocytosis. HT-B is required for S-RNase to exert its cytotoxic activity. When self S-RNase enters pollen tube, the conformational change occurs in SCFSLF. The self-S-RNase-SLF interaction inhibits the pollen protein responsible for HT-B degradation. Self-interaction therefore suppresses HT-B degradation. S-RNase is not degraded and its cytotoxicity results in RNA degradation and consequent pollen tube growth inhibition (Goldraij et al., 2006, Kubo et al., 2010, McClure, 2006). Image from McClure et al., (2011).
The S-RNase compartmentalisation model involves S-RNase compartmentalisation by the
pollen tube endomembrane system (Figure 1.8.b) (McClure et al., 2011, McClure, 2009,
Goldraij et al., 2006). Compartmentalisation is a common mechanism for controlling
potential cytotoxins and probably protects both transmitting tract cells and pollen tubes
a compatible
incompatible
compatible
incompatible
b

37
(McClure, 2006). S-RNases form complexes with other proteins: 120K, which is a 120 kDa
glycoprotein abundant in the stylar ECM, and HT-B, a small asparagine-rich protein
(McClure et al., 1999, Cruz-Garcia et al., 2005). S-RNase, 120K and HT-B are taken up by
endocytosis and sorted to the vacuole (Goldraij et al., 2006). In a compatible reaction, S-
RNase remains compartmentalised and HT-B levels are downregulated, so although S-
RNase is present, it is not cytotoxic because it is sequestered. In an incompatible reaction,
HT-B facilitates the S-RNase transport from endomembrane compartment to the cytoplasm
where S-RNases, bound by 120K acts cytotoxicaly and degrade self-RNA thus leading to the
inhibition of pollen tube growth (Goldraij et al., 2006, McClure, 2006).
1.4.3 Gametophytic SI in Papaveraceae
In Papaver rhoeas, the SI system is also under the control of a single, highly polymorphic,
multiallelic, S-locus with gametophytic control of pollen S-gene expression (McClure et al.,
1989). It is distinctly different to the S-RNase based SI system. In Papaver, the inhibition of
the pollen tube is extremely quick and occurs soon after polarity is established during
germination on the surface of the stigma. It has been estimated that around 66 S-alleles exist
in poppy, several of which have been cloned (Foote et al., 1994, Walker et al., 1996, Kurup
et al., 1998). The female component are small and secreted, ~15 kDa proteins, named PrsS
(Papaver rhoeas stigma S) that act as a signalling ligand (Foote et al., 1994, Wheeler et al.,
2009). S-stigma extracts and also recombinant PrsS have been shown to have S-specific
pollen inhibitory activity when tested in an in vitro SI bioassay (Kakeda et al., 1998, Jordan
et al., 1999).
38
1.4.3.1 Pistil S-determinant
The stigmatic S-alleles PrsS1, PrsS3, PrsS8 and PrsS7 from Papaver rhoeas and one from
Papaver nudicaule have been cloned and sequenced nearly 2 decades ago (Foote et al., 1994,
Walker et al., 1996, Kurup et al., 1998). The first one analysed was PrsS1 and the protein
was scraped directly from the stigmatic papillae of the flowers onto the isoelectric focusing
(IEF) gel surface and separated by polyacrylamide gel electrophoresis (PAGE)-IEF (Foote et
al., 1994). Silver staining revealed two proteins PrsS1a and PrsS1b with isoelectric points
7.55 and 6.90, while the sodium dodecyl sulphonate (SDS)-PAGE analysis showed that both
separated into two proteins with size ~16.7 and ~14.7 kDa (Foote et al., 1994). Northern
analysis showed that the gene was expressed specifically in stigmas with the expected
temporal expression, while Southern analysis indicated that it was a single copy gene (Foote
et al., 1994). PrsS1 was produced as recombinant protein in E.coli (Foote et al., 1994).
PrsS proteins are easily extracted from Papaver stigmatic surface and have predicted signal
peptide, suggesting they are secreted proteins. Secondary structure predictions suggest that
they are comprised of 6 β-strands and 2 α-helixes, joined by 7 hydrophilic loops. They are
cysteine-rich proteins with 4 identically positioned cysteine residues involved in disulphide
bridge formation (Kakeda et al., 1998). It was demonstrated using a mutagenesis approach
that residues in the hydrophilic loop number 6 are most likely to interact with the pollen S-
determinant as the mutation of Asp79 of this loop resulting in complete loss of biological
function (Kakeda et al., 1998).

39
1.4.3.2 Pollen S-determinant
Identification of pollen S-determinant has been long and difficult. A potential candidate was
identified as integral membrane glycoprotein, S-protein binding protein (SBP) (Hearn et al.,
1996). The problem was that SBP did not bind to PrsS in an S-haplotype specific manner.
The exact role and identity of SBP is yet to be found although it is thought to play an
important role in SI.
So what are exactly criteria that a putative pollen S-determinant must meet? Firstly it must
be linked to the pistil gene at the S-locus and it must have had co-evolved together with the
pistil S-alleles. It must also be sufficiently polymorphic, exhibit correct temporal and spatial
expression and it must play a functional role in the SI response.
Pollen S-determinant, PrpS, meets all of the above criteria (Wheeler et al., 2009). ORF of
PrpS1 was identified very close (475 bp) to the pistil S gene when genomic DNA library,
from the S1 containing Papaver plants, was screened using the S1 pistil gene as a probe. With
two more alleles identified (PrpS8 and PrpS3), high level of polymorphism was confirmed.
PrpS1 and PrpS8 sequences are only 59 % identical at the amino acid level (for comparison,
PrsS1 and PrsS8 have 64 % sequence identity) (Wheeler et al., 2009, Kurup et al., 1998).
PrpS1 and PrpS3 are 50 % identical and PrpS3 and PrpS8 53 % identical on amino acid level.
PrpS is a 20.5 kDa hydrophobic protein that is predicted to contain three to five membrane
spanning domains. It was determined by expression analysis using RT-PCR that it is
specifically transcribed in pollen with the highest levels of expression at the anthesis and the
western analysis showed that it was only detected in the pollen membrane-enriched fraction.
Immunolocalization analysis, using a specific PrpS1 antisera, visualized PrpS at the plasma
membrane of S1 pollen tube (Wheeler et al., 2009).
40
Functionality of PrpS involvement in SI was demonstrated by the in vitro SI bioassays where
PrpS peptide representing extracellular domain alleviated SI response, while randomised
peptide did not. Antisense oligonucleotides (as-ODNs) and sense oligonucleotides (s-ODNs)
were used in the in vitro assays to check that PrpS could function in an S-specific manner.
Plants with the S1S3 alleles were used and maximum inhibition was observed with S1 and S3
s-ODNs. S1 and S3 as-ODNs did not stop pollen tubes from growing while as-ODNs from
PrPS8 had no effect on pollen inhibition (Wheeler et al., 2009). S-specific binding between
PrpS and PrsS was detected with slot-blot peptide binding assay (Wheeler et al., 2009).
PrpS has no homology to any protein in the existing databases and it is predicted to be a
novel transmembrane protein (Wheeler et al., 2009). Due to the nature of the early poppy SI
response, which includes an instantaneous influx of external Ca2+ via channels and rise in
cytosolic Ca2+, the finding of pollen specific gene adjacent to stigma S that encodes a
putative transmembrane protein could be of great potential significance.
1.4.3.3 Mechanism of SI in Papaver
When incompatible pollen lands on a receptive stigma, secreted PrsS proteins interact with
pollen transmembrane PrpS and thus trigger a Ca2+-dependent signalling cascade, affecting
many downstream cellular components, such as pyrophosphatase activity, MAPK, actin and
tubulin cytoskeleton, ROS and NO, caspase-like activities, and ultimately leading to the
PCD of the pollen tube (for recent review see Poulter et al., 2010b). Next sections discuss
these events, which are also schematically presented in Figure 1.9.

41
Figure 1.9.: Schematic model of the SI response in Papaver. Upon interaction of secreted stigmatic PrsS proteins and pollen transmembrane protein PrpS, a downstream signalling network is triggered, starting with an increase in K+ and [Ca2+]i who is signalling to the inhibition of pyrophosphatase activity and pollen tube tip growth, activation of MAPK, depolymerization of actin and microtubule cytoskeleton and appearance of punctate actin foci, activation of ROS and NO and activation of caspase-like activities, leading to the PCD of the pollen tube.
1.4.3.3.1 Role of Ca2+ in the SI response
Calcium plays an important role in the SI-specific response in P. rhoeas pollen tubes. Ca2+
imaging studies revealed a rapid, transient increase in pollen [Ca2+]i, when pollen tubes were
treated with incompatible but not compatible PrsS (Franklin-Tong et al., 1993, Franklin-
Tong et al., 1995, Franklin-Tong et al., 1997). In the growing pollen tubes, a tip-focussed
gradient of the intracellular Ca2+ concentration [Ca2+]i can reach 1-2 µM, while in the shank
region basal levels of [Ca2+]i are low, with a mean value of ~200 nM. The SI challenge
resulted in instantaneous and dramatic increase of [Ca2+]i in the shank and sub-apical region
of pollen tubes, while tip-focused oscillating [Ca2+]i gradient rapidly disappeared (Franklin-
Tong et al., 1995, Franklin-Tong et al., 2002). The SI induced increase in [Ca2+]i was
blocked with calcium blocker La3+ and Gd3+, providing confirmation that Ca2+ influx is
required for the increase in [Ca2+]i during the incompatible reaction (Franklin-Tong et al.,
PrsS proteins
S1 pollen tube
Microtubule Cytoskeleton
Pr-p26.1 Reduced sPPase
activity
Pr-p26.1
p56 p56 P
Activated MAPK activity
sS1
DEVDase
[Ca2+]i
Caspase-like activities
P
ROS & NO
sS3
Actin Cytoskeleton
Inhibition of pollen tube tip growth
ABPs
sS3
sS1
= ?
Nonspecific cation channel

42
2002). Influx of extracellular Ca2+ in the shank of pollen tube acts as a secondary messenger
that triggers signalling cascades which results in irreversible inhibition of incompatible
pollen tubes (Figure 1.9). Recently, a nonspecific cation channel activities were identified as
being activated in incompatible Papaver pollen by using whole-cell patch clamping that are
permeable for monovalent (K+ and NH4+) and divalent (Ba2+≥Ca2+≥Mg2+) ions upon the S-
specific incubation with PrsS proteins (Wu et al., 2011). While Ca2+ ions are well
demonstrated to play an important role in pollen tube germination and growth, the role of K+
is less well documented. So far in growing pollen tubes hyperpolarization-activated Ca2+
channels, stretch activated Ca2+-permeable cation channel and Ca2+ pump ACA9 have been
identified (reviewed in Michard et al., 2009). Role of K+ was demonstrated recently in maize
pollen, where small CRP ZmES4 protein was identified to activate the potassium channel
KZM1 in the final step of fertilization and causes the K+ influx and subsequent burst of the
pollen tube that enables sperm cells to be released (Amien et al., 2010). There is a parallel
with the PrsS-activated channel activity in Papaver pollen; both pollen systems respond to a
clearly defined biological stimuli in a form of small CRP protein, that stimulates channel
activity, leading to influx of K+ ions, and in case of poppy pollen also to Ca2+ ions (Amien et
al., 2010, Wu et al., 2011).
1.4.3.3.2 Role of soluble inorganic pyrophosphatases in poppy SI
Soluble inorganic pyrophosphatases (sPPases) are enzymes that catalyse the hydrolysis of
inorganic pyrophosphate to inorganic phosphate and are Mg2+ dependent. sPPases are
regulating biosynthesis and biochemical pathways in prokaryotes and eukaryotes. They have
essential role in plant cells, driving biosynthetic reactions and generating ATP and

43
biopolymers such as pectin, hemicellulose and cellulose (Cooperman et al., 1992). Examples
of cytosolic sPPases in plants are rare because plant sPPases are localized primarily to
plastids rather than the cytosol (Gross and Ap Rees, 1986). Possible explanations for this
could be that sPPases are abundant in metabolically active cells and thus, pollen tubes may
express cytosolic sPPases because they require high metabolic activity to generate new
membrane and cell wall for pollen tube extension (de Graaf et al., 2006).
In Papaver pollen the sPPases play a crucial role, as they provide the driving force for
biosynthesis of pollen tube germination and growth. Ca2+-dependent hyperphosphorylation of
Pr-p26.1a/b (two soluble inorganic pyrophosphatases) leads to the reduced sPPase activity
and occurs at around 90 s after SI (de Graaf et al., 2006, Rudd et al., 1996). sPPases can be
inhibited by Ca2+ and by phosphorylation and this causes arrest of pollen tube growth,
highlighting the importance of this regulatory mechanism during the SI response in Papaver
pollen (Figure 1.9) (de Graaf et al., 2006).
1.4.3.3.3 Role of MAPK in poppy SI
Another target downstream of the Ca2+ signals, triggered by the SI response in poppy, is
protein p56, named after its 56 kDa size, and is identified as MAPK (Li et al., 2007, Rudd et
al., 2003). Its activation is peaking 10 min post SI implicated its role in signaling in
incompatible pollen tube and regulation of PCD (Figure 1.8) (Li et al., 2007, Rudd et al.,
2003).
MAPKs are the key elements of a of protein kinase cascade that can trigger responses to a
wide variety of signals and stimuli. Collectively, different MAPK cascades regulate
important cellular processes including gene expression, cell proliferation, cell survival and
44
death in eukaryotic cells (Chang and Karin, 2001). MAPKs were known to be functionally
involved in regulating PCD in plants (Ligterink et al., 1997, Kroj et al., 2003) and the same
was demonstrated for p56 in incompatible Papaver pollen (Li et al., 2007). The crucial role
for p56 during SI in Papaver was demonstrated using specific MAPK inhibitor U0126, by
whom the DNA fragmentation, PARP cleavage and SI-induced DEVDase activity were
inhibited and loss of pollen viability rescued. Therefore, this represented the first evidence
for MAPK signalling in pollen tubes during SI (Li et al., 2007).
1.4.3.3.4 Role of actin in poppy SI
One of the most rapid and dramatic physiological changes observed during Papaver SI
response is a dynamic rearrangement of the actin cytoskeleton in the pollen tube, within 1-2
min after a challenge with incompatible PrsS proteins (Figure 1.9) (Geitmann et al., 2000,
Snowman et al., 2002). F-actin filaments depolymerize and stable punctate actin foci are
formed, whose size increases with time and are most characteristic 3 h post SI (Poulter et al.,
2010a). Those punctate actin foci are the large aggregates of the F-actin that can reach up to
1 μm in diameter and are very resistant to high concentrations of latrunculin B, actin
depolymerising drug that prevents polymerization of F-actin (Poulter et al., 2010a).
Associated with the punctate actin foci are several ABPs, such as CAP and ADF (Poulter et
al., 2010a).
Isolation of F-actin from untreated and SI pollen protein extracts and subsequent analysis by
mass spectrometry FT-ICR-MS revealed a large amount of proteins implicated in binding
the F-actin, however, the peptides were screened against Arabidopsis database. Among most
prominent candidates that were more abundant in SI sample compared to the untreated
45
sample were: 14-3-3 proteins, Rab-like proteins, heat-shock proteins and chaperonins, and
further investigations of them would provide important information about the complex actin
signalling network in incompatible poppy pollen tube (Poulter et al., 2011, Poulter et al.,
2010a).
An additional target of SI in incompatible pollen tube is also the microtubule cytoskeleton
(Figure 1.9); cortical microtubules rapidly depolymerize upon the addition of PrsS, while the
microtubules around the generative cell are more stable, still evident 1 h post-SI, as
identified by immunolocalization studies (Poulter et al., 2008). Microtubule and actin
cytoskeleton show different and distinct temporal alterations upon SI. There is one-way
cross-talk between the two cytoskeletal elements since the actin depolymerization induced
by latrunculin B can trigger depolymerization of microtubules but not vice versa,
demonstrating that actin alterations act upstream of microtubule alterations (Poulter et al.,
2008).
F-actin depolymerization or stabilization can push the cell into PCD and a first indication of
this in Papaver pollen tubes was provided when DNA fragmentation was observed by using
latrunculin B, and by jasplakinolide that stabilizes actin filaments, but was reduced when
pollen was pretreated with the inhibitor of DEVDase activity, Ac-DEVD-CHO (Thomas et
al., 2006). It was also established that stabilization of actin filaments by jasplakinolide prior
to depolymerization of actin cytoskeleton by SI induction or latrunculin challenge could
rescue pollen DNA degradation, thus preventing PCD (Thomas et al., 2006). Despite the
evidence for the crosstalk between actin and microtubule cytoskeleton and the crucial role of
actin cytoskeleton during the PCD, microtubule depolymerization or stabilization does not
trigger PCD (Poulter et al., 2008).
46
1.4.3.3.5 Programmed cell death triggered by poppy SI
PCD was first indicated in incompatible Papaver pollen by Jordan et al., (2000) with the
identification of nuclear DNA fragmentation and inhibition of pollen viability, which was
observed in an S-specific manner. PCD was demonstrated with the rapid increase in
cytochrome c release, detected upon pollen challenge with incompatible PrsS proteins,
cleavage of bovine Poly-ADP-Ribose Polymerase (PARP), classic substrate for caspases,
that generated a 24 kDa PARP cleavage product and activation of caspase-3-like activity
(Franklin-Tong et al., 1996, Thomas and Franklin-Tong, 2004). Pretreatment of pollen tubes
with the inhibitor of caspase-3-like (or DEVDase) activity, Ac-DEVD-CHO, prior to the SI
induction resulted in a significant reduction in the amount of DNA fragmentation measured
by TUNEL, thus demonstrating DEVDase activity in the SI-mediated DNA fragmentation
(Thomas and Franklin-Tong, 2004). DEVDase activity and several other caspase-like
activities were demonstrated by caspase-like cleavage assay using tetrapeptide substrates
with fluorescent probe attached (e.g. Ac-DEVD-AMC). Live cell imaging revealed
DEVDase activity between 1-2 h post SI in the cytosol of incompatible pollen tube, which
moved to the nucleus with the progression of SI, peaking at 5 h post SI (Bosch and Franklin-
Tong, 2007). Major caspase-like activity identified was DEVDase, however, a significant
increase in VEIDase (caspase-6-like) activity was also detected and significantly lower
YVADase (caspase-1-like) and LEVDase (caspase-4-like) activities (Bosch and Franklin-
Tong, 2007).

47
1.4.3.3.6 Role of ROS in Papaver SI
ROS and NO are well established to regulate rate and orientation of pollen tube growth and
are involved in the polarized growth of pollen tubes (Prado et al., 2008, Potocký et al.,
2007). They were recently demonstrated to play an important role during S-RNase based
GSI in incompatible pear pollen, where S-RNases disrupt tip-localized ROS and arrest ROS
production in mitochondria, which subsequently decreased Ca2+ currents and induced
depolymerization of actin cytoskeleton and DNA degradation (Wang et al., 2010).
The role of ROS and NO signaling was also demonstrated in vitro in the incompatible
Papaver pollen (Wilkins et al., 2011). Upon the S-specific PrsS challenge of pollen tubes,
the increases in ROS were visualised using specific probes at around 5 min post SI, followed
by an increase in NO at around 10-20 min (Wilkins et al., 2011). The crosstalk between the
two signalling molecules was also established, using H2O2 that stimulates ROS production
and DPI, that inhibit ROS, and examined the NO production using fluorescence probes
(Wilkins et al., 2011). In incompatible poppy pollen tubes, the increases in [Ca2+]cyt
stimulated increase in ROS and NO. The connection with depolymerization of the actin
cytoskeleton and subsequent appearance of punctate actin foci and an increase in DEVDase
activity was also made, using ROS scavengers DPI (diphenyleniodonium chloride) or
TEMPOL and NO scavenger cPTIO, placing ROS and NO, demonstrating that alleviated
ROS and NO production reduced the formation of punctate actin foci and DEVDase activity.
Thus, ROS and NO production is placed to act downstream of Ca2+ signalling, but upstream
of the actin cytoskeleton alterations and DEVDase activity (Wilkins et al., 2011).
48
1.5 Arabidopsis thaliana AS A MODEL FOR SELF-INCOMPATIBILITY
Arabidopsis thaliana, also known as thale cress or mouse-ear cress is a small flowering plant
from family Brassicaceae. Its importance in plant science is not due to agronomic
significance but due to its use as a model plant organism. It has a small genome of 125 Mb
that was sequenced, which makes it extremely useful for genetic manipulations. A. thaliana
is amenable and susceptible for genetic transformation by Agrobacterium tumefaciens and
large collections of mutants exist in various ecotypes. A. thaliana’s lifecycle is very rapid,
lasting only 6 weeks and it produces large amount of self-progeny due to its self-compatible
state. That has made it an ideal plant for research as it can give results to test hypotheses
quickly and there is a large worldwide research community working with it.
A. thaliana is already well-established model for expression of Brassica-type of SI (Rea et
al., 2010, Nasrallah et al., 2002, Nasrallah et al., 2004). A. thaliana lost SI and became self-
compatible ~1 million years ago by a mutation in the SCR gene, a 213 bp inversion (Tang et
al., 2007, Tsuchimatsu et al., 2010). Studies on transgenic A. thaliana expressing A.lyrata
and C.grandiflora S-determinants revealed that transition from SI to self-fertility occurred
multiple times by independent mutations in different accessions of A. thaliana as they
identified polymorphsims at the S-locus and at the SI modifier loci (Sherman-Broyles et al.,
2007, Boggs et al., 2009c). These polymorphisms were explained by different strength of SI,
from developmentally stable SI to very transient, weak SI or no SI, in different accessions of
A. thaliana, when it was transformed with a functional SRK/SCR gene pair from A.lyrata
(Boggs et al., 2009c). The approach of transgenic A. thaliana expressing A.lyrata and
C.grandiflora SRK/SCR not only provided information on evolution of selfing but also
49
enabled new detailed studies of the basis of the SI S-specificity. Over 100 residues were
tested by mutagenesis in different regions of extracellular domain of SRK, but only six
amino acid residues clustered at the same positions within two variants tested were identified
to be responsible for SCR-specific activation of SI (Boggs et al., 2009a). The Colombia
ecotype of A. thaliana was expressing the transient SI and when it was used in mutational
analysis a mutation was revealed in RNA-dependent RNA polymerase (RDR6) functioning
as a negative regulator of SI in trans-acting siRNA (ta-siRNA) production. This mutation
caused an enhancment of SI, pistil elongation and stigma exsertion, indicating dual role for
SRK in SI and pistil development (Tantikanjana et al., 2009).
New information and questions appeared regarding the role of ARC1 and MLPK1 proteins
as well as links between SI and pathogen resistance pathway (Rea et al., 2010). They crossed
SRK/SCR expressing A. thaliana plants with plants carrying the mutations in various plant-
defense implicated loci. If either of numerous plant resistance pathways examined (such as
etr1-1, ein2-1, npr1-1, pad4-1, rar1-21, sgt1b or eds1-1) would be important for SI pathway
then the breakdown of the SI was expected, however, in neither of the analysed crosses or its
progeny the breakdown of SI was observed, indicating that these pathways are not required
for SI and also illustrating the importance of such a transgenic A. thaliana model.
1.6 THE UBIQUITIN-26S PROTEASOME SYSTEM
So far I have given the background on the plant reproduction, signaling, PCD and SI, and I
have also made comparisons between SI and HR. Ubiquitin-dependent proteasomal
degradation (UbP) plays an important part of HR as well as some SI models. Part of my
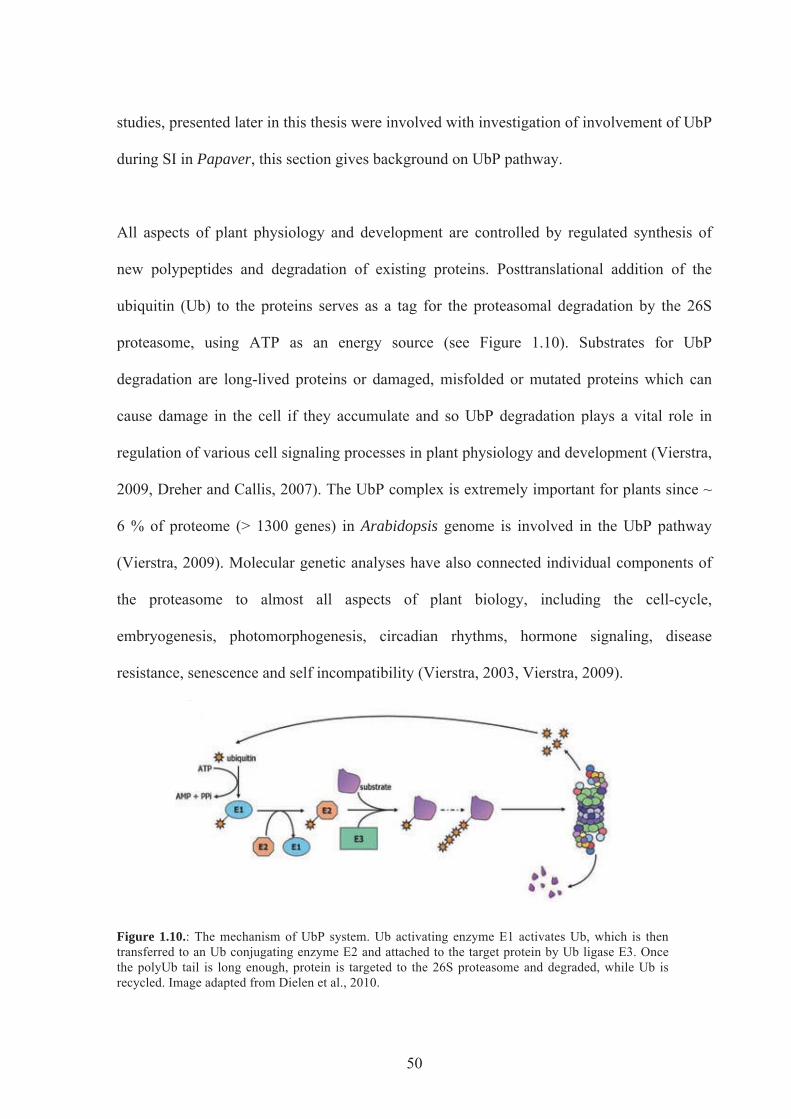
50
studies, presented later in this thesis were involved with investigation of involvement of UbP
during SI in Papaver, this section gives background on UbP pathway.
All aspects of plant physiology and development are controlled by regulated synthesis of
new polypeptides and degradation of existing proteins. Posttranslational addition of the
ubiquitin (Ub) to the proteins serves as a tag for the proteasomal degradation by the 26S
proteasome, using ATP as an energy source (see Figure 1.10). Substrates for UbP
degradation are long-lived proteins or damaged, misfolded or mutated proteins which can
cause damage in the cell if they accumulate and so UbP degradation plays a vital role in
regulation of various cell signaling processes in plant physiology and development (Vierstra,
2009, Dreher and Callis, 2007). The UbP complex is extremely important for plants since ~
6 % of proteome (> 1300 genes) in Arabidopsis genome is involved in the UbP pathway
(Vierstra, 2009). Molecular genetic analyses have also connected individual components of
the proteasome to almost all aspects of plant biology, including the cell-cycle,
embryogenesis, photomorphogenesis, circadian rhythms, hormone signaling, disease
resistance, senescence and self incompatibility (Vierstra, 2003, Vierstra, 2009).
Figure 1.10.: The mechanism of UbP system. Ub activating enzyme E1 activates Ub, which is then transferred to an Ub conjugating enzyme E2 and attached to the target protein by Ub ligase E3. Once the polyUb tail is long enough, protein is targeted to the 26S proteasome and degraded, while Ub is recycled. Image adapted from Dielen et al., 2010.
51
Ubiquitin (Ub) is a 76 amino acid globular protein that is highly conserved in all eukaryotes
(yeasts, animals, and plants). Proteins are marked for degradation when a covalent inter-Ub
linkages are made from C-terminal glycine to lysine of the previous Ub to form a poly-Ub
chain (polyubiquitination), although some proteins could also be ubiqutinated with a single
molecule (monoubiquitination) or on multiple lysine residues by single Ub molecules (multi-
monoubiquitination) (Vierstra, 2009, Komander, 2009).
Ubiquitination is a multi-step process. Ub becomes activated by attachment to the Ub-
activating enzyme, E1, in an ATP-dependent step. The Ub is then transferred to the second
enzyme, called Ub-conjugating enzyme, E2. The final transfer of Ub to the target protein is
mediated by a third enzyme, called ubiquitin-ligase, or E3, which is responsible for the
selective recognition of appropriate substrate proteins. In some cases, the Ub is first
transferred from E2 to E3 and then to the target protein. In other cases, the Ub may be
transferred directly from E2 to the target protein in a complex with E3. Most cells contain a
single E1, but have many E2s and multiple families of E3 enzymes. Different members of
the E2 and E3 families recognize different substrate proteins, and the specificity of these
enzymes is what selectively targets cellular proteins for degradation by the UbP pathway
(Vierstra, 2009).
In A.thailana genes coding for different E3 components fall into different families, based on
their domains. HECT (homology to E6-associated protein C-terminus), U-box and RING
(really interesting new gene) (Figure 1.11.a,b) are composed from a single polypeptide
which has characteristic recognition site for binding of E2 with Ub and different protein
binding sites with motifs such as Armadillo (ARM), LRR, Serine/Threonine kinases and
others (Jackson et al., 2000).

52
The largest group of E3 ligases are cullin-RING ligases (CRL), which contain subunits
cullin, RBX1 (RING-box1) and other variable target and are further divided into subtypes
(Figure 1.11.c).
Figure 1.11.: Structures of different types of E3 ligases: (a) HECT; (b) U-box/RING; (c) CRLs are divided in subtypes: SCF (SKP1 (S-phase kinase-associated protein1)-CUL1 (cullin1)-F-box) use F-box proteins for their target specificity, BTBs (bric-a-brac-tramtrac-broad complex) proteins and the third are DDB (DNA damage-binding) using WD40 domain for target recognition; (d) APC (anaphase promoting complex) E3 ligase. Image from Vierstra, 2009.
SCF ligases consist of 4 different polypeptides (SKP1 (S-phase kinase-associated protein1)-
CUL1 (cullin1)-F-box (SCF) and RBX1). Specificity of the SCF complex is conferred by the
F-Box domain, which contain on its C-terminus one of many protein interaction motifs
(ARM, LRR, WD-40, Kelch, DEAD-Box,...) and signature F-Box motif on N-terminus for
binding the SKP1, which bind CUL1 through SKP1 bridging protein (ASK1 in A. thaliana).
Fourth component is RBX1 and it contains RING domain where E2-Ub binds. This unique
organization of SCF E3s provides an effective mechanism for recognizing many substrates
simply by exchanging F-Box subunits.
Second subtypes are E3s that use BTB (bric-a-brac-tramtrac-broad) complex proteins for
target recognition and the third are DNA damage-binding E3s who use WD40 domain for
target recognition (Craig et al., 2009, Dielen et al., 2010, Vierstra, 2009).

53
1.6.1 The 26S Proteasome
The 26S proteasome is a 2 MDa complex that degrades Ub-tagged substrates (see Figure
1.12). It is divided into two particles, the 20S core protease (CP) and the 19S regulatory
particle (RP) The CP is created by the assembly of stacked heptameric rings of related α and
β subunits (see Figure 1.12). Three of the seven β subunits are responsible for the proteolytic
activity: β1 (PBA1), that has caspase-like activity, β2 (PBB1/2) that has trypsin-like activity
and β5 (PBE1/2), that has chymotrypsin-like activity (Gu et al., 2010).
Figure 1.12.: Organization and structure of 26S proteasome. It is comprised of 31 sub-units that are divided into two particles, the 20S core protease (CP) and the 19S regulatory particle (RP) (Vierstra, 2009). The CP is a broad-spectrum ATP- and Ub-independent peptidase created by the assembly of four, stacked heptameric rings of related α (outer rings) and β subunits (inner rings). The central catalytic chamber is housed by β-rings that carry proteolytic activity. Access to this proteolytic chamber is restricted by a narrow gated channel, created by the α-subunit rings that allows only unfolded proteins to enter (Glickman, 2000, Dielen et al., 2010). Each end of the CP is capped by a 19S RP, that is formed by the lid and the base complexes (Kurepa and Smalle, 2008). The RP presumably helps to identify appropriate substrates for breakdown, releases the attached Ubs, opens the α-subunit ring gate, and directs entry of unfolded proteins into the CP lumen for degradation (Vierstra, 2003). Image from Dielen et al., 2010.
Recently, a direct connection between proteasome activation and plant PCD was established
by Hatsugai et al., (2009), where they demonstrated, using genetical, biochemical an
biological approaches, that proteasome subunit PBA1 had a DEVDase activity. It acts as a
54
long sought plant caspase-3-like enzyme and is responsible for the vacuolar membrane and
plasma mebrane fusion-induced HR cell death in response to bacteria attack. By using a
proteasome inhibitors β-lactone and more specific Ac-APnLD-CHO, inhibitor of the β1
subunit, and caspase-3 inhibitor they demonstrated that the DEVDase activity and the PBA1
activity were abolished, and the HR was prevented (Hatsugai et al., 2009). In animals and
yeast, β1 subunits of the proteasomes are long known to have caspase-like sites (Kisselev et
al., 2003).
Identification of selective proteasome inhibitors has allowed a definition of the roles of the
UbP pathway in various cellular processes (Lee and Goldberg, 1998, Kisselev and Goldberg,
2001). Proteasome inhibitors represent valuable tool to enhance cell content in the protein
studies since proteins destined for rapid degradation are often hard to isolate or express. The
most widely used are the peptide aldehydes, such as Cbz-leu-leu-leucinal (MG132), acting
on a chymotrypsin-like activity, or lactacystin and β-lactone.
Recently a development of small membrane permeable fluorescent probe was presented that
interact with the plant proteasome catalytic subunit and can allow the quantification of
proteasome activities for in vitro and in vivo studies (Gu et al., 2010, Kolodziejek et al.,
2011). It was also demonstrated that plant proteasome activity was inhibited using caspase-3
inhibitor. This activity-based probe will certainly expand studies on plant proteasomes in the
future.

55
1.6.2 Ubiquitination and self-incompatibility
SI mechanisms are described in details in the section 1.4. The link between the S-RNase-
based GSI system and ubiqutination is the male S-determinant, an F-box protein (SLF/SFB)
which is part of an SCF ubiquitin ligase complex (SCFSLF/SFB) (Meng et al., 2011, McClure
et al., 2011). The compartmentalization models of SI presumes, that following pollination,
self and non-self S-RNases are localized in the pollen tube. In the compatible interaction S-
RNases are ubiquitinated by SCFSLF/SFB and afterwards degraded by the 26S proteasome,
while S-RNases in the incompatible interaction are left intact and due to their cytotoxic
activity they degrade RNA of the pollen tube and inhibit the pollen growth (Figure 1.13.b)
(Goldraij et al., 2006, Meng et al., 2011). However, the issue emerging is, that SCF E3
ligases interact with the F-box protein with Skp1 and also with the specific substrate for
degradation though the specific protein-protein interaction domain (ARM, WD40, leucine-
rich repeats, etc) and none of that domains have been identified in SLF. Additionally, in the
Antirrhinum, the SCF complex was termed a conventional SCF complex that contains novel
SSK1 protein (SLF-interacting SKP1-like1), but is not encoded by polymorphic gene, but
monomorphic and might be important for the interaction with AhSLF2 (Zhao et al., 2010).
In Petunia inflata, the SLF complex is also not as simple as initially thought but might be a
component of new E3 ligase complex, containing PiCUL1-g and PiSBP1 (P.inflata S-RNase
Binding Protein1, a RING-HC protein), and it does not contain SKP1 or RBX1 (Hua and
Kao, 2006). So in order to organise the complex, instead of Skp1, the PiSBP1 forms
complex with PiCUL1-G and PiSLF, and also interacts with E2, like RBX1 (it plays a dual
role) (Hua and Kao, 2006). It is believed they might have more general role as they are
expressed in all the tissues (Hua and Kao, 2006).
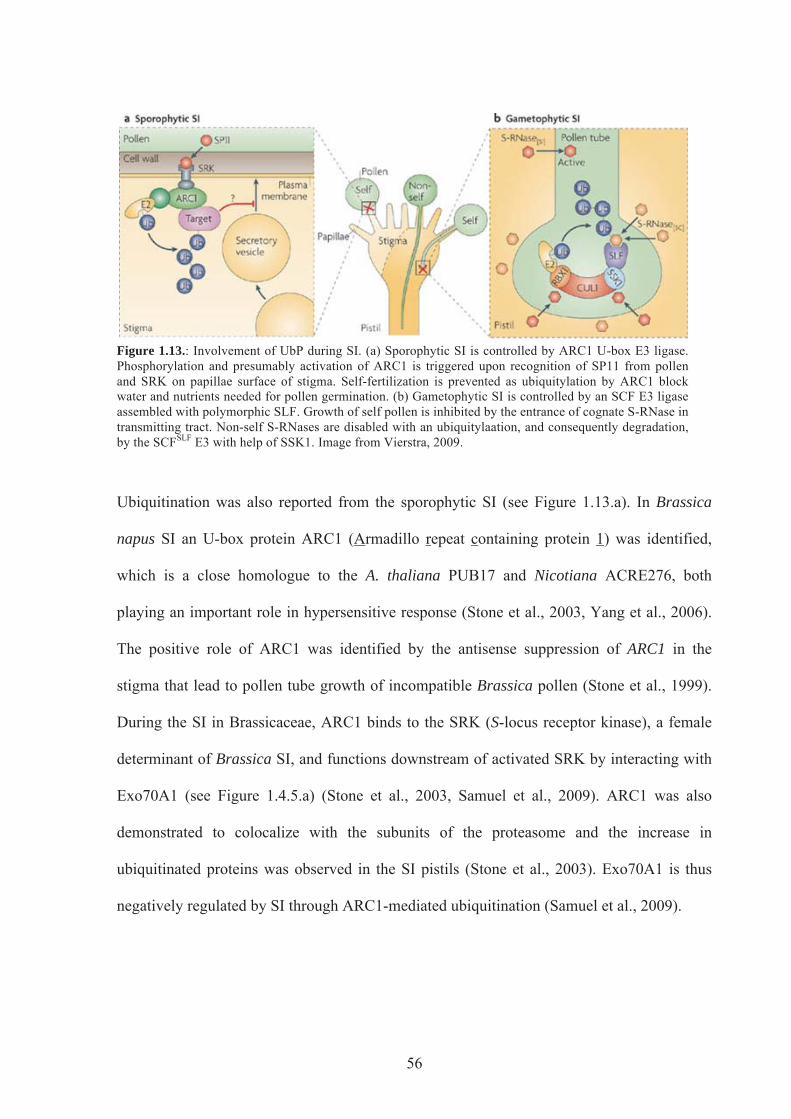
56
Figure 1.13.: Involvement of UbP during SI. (a) Sporophytic SI is controlled by ARC1 U-box E3 ligase. Phosphorylation and presumably activation of ARC1 is triggered upon recognition of SP11 from pollen and SRK on papillae surface of stigma. Self-fertilization is prevented as ubiquitylation by ARC1 block water and nutrients needed for pollen germination. (b) Gametophytic SI is controlled by an SCF E3 ligase assembled with polymorphic SLF. Growth of self pollen is inhibited by the entrance of cognate S-RNase in transmitting tract. Non-self S-RNases are disabled with an ubiquitylaation, and consequently degradation, by the SCFSLF E3 with help of SSK1. Image from Vierstra, 2009.
Ubiquitination was also reported from the sporophytic SI (see Figure 1.13.a). In Brassica
napus SI an U-box protein ARC1 (Armadillo repeat containing protein 1) was identified,
which is a close homologue to the A. thaliana PUB17 and Nicotiana ACRE276, both
playing an important role in hypersensitive response (Stone et al., 2003, Yang et al., 2006).
The positive role of ARC1 was identified by the antisense suppression of ARC1 in the
stigma that lead to pollen tube growth of incompatible Brassica pollen (Stone et al., 1999).
During the SI in Brassicaceae, ARC1 binds to the SRK (S-locus receptor kinase), a female
determinant of Brassica SI, and functions downstream of activated SRK by interacting with
Exo70A1 (see Figure 1.4.5.a) (Stone et al., 2003, Samuel et al., 2009). ARC1 was also
demonstrated to colocalize with the subunits of the proteasome and the increase in
ubiquitinated proteins was observed in the SI pistils (Stone et al., 2003). Exo70A1 is thus
negatively regulated by SI through ARC1-mediated ubiquitination (Samuel et al., 2009).

57
1.7 SUMMARY AND OBJECTIVE
To summarize, in the introduction I have presented in details the SI system, which represents
my main research. I also gave the background on plant reproduction, the role of pollen tube,
PCD, HR, plant cell-cell signalling, plant receptors, use of A. thaliana as a model system and
UbP degradation. The reason for such a broad range of topics is that this thesis presents
research on three inter-related projects, studying the mechanism of self-incompatibility (SI)
in Papaver rhoeas and Arabidopsis thaliana. My objectives were:
- Elucidating the possible involvement of ubiquitin proteasome (UbP) signalling
pathway during SI in Papaver pollen
The aim was to investigate the link between the two different mechanisms and to
establish the role of UbP degradation during Papaver SI-induced PCD. Functional
involvement of UbP pathway was investigated using inhibitors of proteasomal
degradation, MG132, measuring levels of ubiquitination, inhibition of pollen tube
growth, pollen viability and signalling to the caspase-like activity.
- Analysis of Papaver pollen S-determinant, PrpS and interaction between PrpS and
PrsS
The aim was to establish the nature of the Papaver pollen determinant and to
characterize the PrpS binding to PrsS.
- Characterization and functional analysis of Papaver S-determinants in A. thaliana.
This project was initiated in order to test whether the Papaver SI system might work
when the S-determinants were moved to another species. Several lines of
investigation were followed in order to achieve that. Initially, the segregation
analysis and the expression analysis of PrpS and PrsS was carried out. Functional

58
analysis studies were then conducted in vitro on transgenic A. thaliana pollen
expressing PrpS-GFP fusion proteins and in vivo. In vitro analysis investigated the
major characteristics of the poppy SI response, such as S-specific inhibiton of pollen
tube growth, formation of punctate actin foci and S-specific loss of viability.
Following successful in vitro analysis, in vivo analysis was attempted by performing
crosses between A. thaliana expressing PrsS protein and PrpS-GFP, respectively.

59
CHAPTER 2.
Materials and Methods
60
2.1. Plant material: Papaver rhoeas
2.1.1. Papaver plant cultivation
Seeds of Papaver rhoeas L. (Shirley) of both known and unknown pedigree were first
allowed to germinate in humidified Petri dishes for ~2 days. Germinated seeds were potted
in John Innes No. 1 potting compost and kept in a greenhouse at 15 ˚C. Resultant plants
were thinned to one per pot after growing to a height of between 5 and 10 cm. Around 8
weeks later, plants were allowed to harden outside for around 4 weeks and were then
transplanted to a field in rows with approximately 50 cm between plants and 90 cm between
rows (Wheeler, 2001)
2.1.2. Determination of Papaver S-genotype
The S-haplotype was determined by pollinating each plant with pollen of known S-genotype.
Once plants were in flower, two flowers, 1-2 days prior to anthesis, were emasculated using
forceps and covered with a cellophane bag, to prevent entrance of insect pollinators.
Emasculated flowers were pollinated the next day by application of pollen with a fine
paintbrush directly onto the stigmatic rays. After pollination, cellophane bags were replaced
over the flower and stigmas were harvested one day after pollination. The pollinated portion
of the stigma was removed with a scalpel, placed in aniline blue, and left overnight to allow
the stigmas to soften. A sample of the stigma was then placed on a microscope slide and
observed under a microscope using UV illumination (see Figure 2.1.a,b). All families grown
were two-class families and thus were pollinated with two classes of pollen, one to provide a
fully incompatible pollination and one to provide a half-compatible pollination. Those

61
stigmas exhibiting fully incompatible pollination had easily identifiable callose in the pollen
grains and few, if any, pollen tubes. Those exhibiting half-compatible pollinations had 50 %
reacting as above whilst the remainder had no callose in the grain and long pollen tubes with
callose plugs at intervals along the length of the tube.
a
b
Figure 2.1: Examples of aniline blue stained stigma squashes (a) compatible pollination and (b) incompatible pollination in poppy as visualised using UV-illumination.
2.1.3. Collection of Papaver pollen
Flowers with a long stem at 1 day prior to anthesis were harvested approximately 15 cm
below the bud. Petals and sepals were removed while buds were placed in a cellophane bag
and hung upside-down on the bench in the aerated glasshouse overnight, leaving anthers to
shed pollen. Pollen was released by vigorous shaking, and collected by tipping into gelatin
capsules. Capsules were then dried over silica gel at room temperature (RT) for about 1 h
before freezing at -20 ˚C.
62
2.1.4. Papaver pollen tube growth in vitro
Pollen was hydrated for at least 30 min in a moist chamber at 25 ˚C. The shape of pollen
grains was used to assess the state of hydration. When desiccated, pollen grains take an
elliptical form, when hydrated pollen grains appear spherical. Following hydration, pollen
was re-suspended in liquid germination medium (GM). Then pollen grains were plated on
solid GM (GM plus 1.2 % agarose) in 9 cm Petri dishes. Normally, for 10 mg of pollen, 1.0
– 1.2 mL of GM was required. Pollen was grown for at least 45 min and assessed for
percentage germination prior to experimentation. Following growth, pollen was treated as
required for the experiment.
Liquid Growth Medium (GM): 13.5 % (w/v) sucrose 0.01 % H3BO3 0.01 % KNO3 0.01 % Mg(NO3)2.6H2O 0.036 % CaCl.2H2O The solution was made as 13.5 % sucrose and then 0.5 % of GM salts stock was added to make up liquid GM.
Growth Medium Salt Stock: 2 % (w/v) H3BO3 2 % (w/v) KNO3 2 % (w/v) Mg(NO3)2
.6H2O 7.2 % (w/v) CaCl2
.H2O
Solid GM: liquid GM with addition of 1.2 % agarose
2.1.5. Production of Papaver seeds
Emasculated Papaver flowers were pollinated with pollen of known S-genotype, covered
with cellophane bag and left for approximately 6 weeks. After approximately 6 weeks seeds
were collected from seed pods and stored in paper bags at 4 °C.

63
2.2. Plant material: Arabidopsis thaliana
2.2.1. A. thaliana cultivation
Equivalent of 50 μL of seeds of transgenic A. thaliana and untransformed Col-0 were
sterilised with 500 μl of 20 % commercial bleach and continuously mixed with gentle
shaking for 20 min. Seeds were then washed 4 times with 500 μL of sterile distilled water
(SDW) and mixed by shaking for 15 min each time, then, centrifuged quickly to decant.
Finally, seeds were resuspended in 200 μL of fresh SDW. Meanwhile, plates with Murashige
and Skoog (MS) media were prepared by pouring autoclaved media with selection marker
(50 μg μL-1 Kanamycin, 25 μg μL-1 Basta) for transgenic seeds or without for untransformed
Col-0 seeds. Using a cut end sterile pipette tip seeds were plated in sterile conditions. The
plated seeds were kept at 4 oC for two days in order to break dormancy and to synchronise
seed germination before moving them to constant temperature room at 22 oC for two weeks.
The amount of grown seedlings on the plates was determined for segregation analysis.
Transgenic A. thaliana lines with poppy S-determinants and untransformed Col-0 seeds were
planted in pots labelled individually with yellow stick for genetically modified plants and
white stick for untransformed plants. Immediately after transferring seedlings to pots, the
tray was covered with cling-film for 2 days. A. thaliana plants were grown in pots,
containing Levington M2 compost with Silvapearl in the greenhouse at 20 – 22 oC and under
16/8 h photoperiod conditions. Seeds were sown every two weeks. Plants were usually
potted every two weeks and it normally took two to four weeks for the plants to flower.
When plants flowered, each pot was placed in plant sleeve to contain the pollen spreading.

64
The plants were numbered from the first generation, with the number indicating original line,
and the subsequent number of each generation after the dot. Generation numbers were
separated by dot (.) or by the hyphen (-) for easier indication.
Murashige-Skoog (MS) media: 2.2 g L-1 of MS powder pH adjusted to 5.6-5.8 1 % of agar Media was autoclaved before use.
2.2.2. A. thaliana plant conditions
A. thaliana pollen is notorious for its difficulties in germination and only recently some
detailed studies on A. thaliana pollen tube germination emerged (Fan et al., 2001, Boavida
and McCormick, 2007, Bou Daher et al., 2009, Johnson-Brousseau and Mccormick, 2004).
The difficulties regarding A. thaliana in vitro pollen germination were connected with its
tricellularity (Boavida and McCormick, 2007, Bou Daher et al., 2009), and so far, majority
of pollen being studied was from bicellular species (poppy, tobacco).
However, despite the studies performed on A. thaliana pollen germination, the work on A.
thaliana was more demanding than Papaver pollen. There were numerous differences in the
research procedures of pollen assays in A. thaliana and Papaver, the most obvious one was
pollen collection. While poppy pollen collection occured once a year in a bulk batches with
pollen being stored at -20 oC, fresh A. thaliana pollen was collected on a day of the
experiment, as it was difficult to obtain a bulk batch. A. thaliana was producing new flowers
every day and pollen was collected from day 0 flowers - stage 13 (Smyth et al., 1990). It was
observed and reported that with the older flowers and older plants pollen germination rates

65
were decreasing (Boavida and McCormick, 2007), so in order to ensure reproducibility of
results, only newly opened flowers were harvested for pollen collection.
2.2.3. Collection and germination of A. thaliana pollen
In the morning, 40 A. thaliana flowers (stage 13) were collected in a 500 μL microfuge tube
containing liquid A. thaliana pollen GM (AtGM). Pollen was harvested by vigorous shaking
and then the flowers were transferred into a second tube containing AtGM in order to obtain
maximal amount of pollen. The process was repeated once more before the flowers were
discarded. The AtGM with the pollen grains was centrifuged for 2 min at 3500 rpm and the
excess liquid medium was removed. The pollen was pooled together, and resuspended in
fresh AtGM and centrifuged again (2 min, 3500 rpm). Following centrifugation, the excess
liquid was removed so that the final volume left in the tube for pollen germination was 100
μL. Pollen was pre-germinated for at least 45 min and assessed for percentage germination
prior to experimentation. Following growth, pollen was treated as required for the
experiment.
Arabidopsis thaliana liquid germination medium (AtGM): 18 % sucrose 0.01 % H3BO3 1.0 mM CaCl2 1.0 mM Ca(NO3)2 1.0 mM MgSO4 Sucrose was dissolved prior to the addition of the other salt components. pH adjusted to 7.0 and sterilised by filtration before use.

66
2.2.4. Collection of A. thaliana seeds
Trays with A. thaliana plants, which had fully formed siliques and no more flowering buds
were lifted from the table so their water supply was disabled and plants were allowed to dry
for about two weeks. Seeds were collected by gently shaking A. thaliana plants on the paper
surface. Before placing them in a microfuge tube, seeds were sieved so as to remove
remaining plant debris. Seeds from each plant were collected in separate clearly labelled
tubes.
2.3 Experiments
2.3.1. Production of recombinant PrsS proteins
Transformant E. coli cells expressing PrsS1, PrsS3 and PrsS8, separately, were plated from a
glycerol stock, onto plates containing LB-agar medium with 50 μg mL-1 ampicilin (LB-
Amp) and incubated at 37 oC for about 16 h. The next day the colony was grown for 16 h in
a 2 L flask containing 200 mL of LB-Amp at 37 oC on a shaker (200 rpm). Half of the
culture (100 mL) was transferred into another 2 L flask with fresh 100 mL of LB-Amp.
Protein over-expression was induced with 0.5 mM IPTG and incubated for 6 h at 37 oC with
shaking at 200 rpm. A sample of the culture can be used for analysis of induction by SDS-
PAGE. Culture was centrifuged at 5000 rpm at 4 oC for 10 min in Beckman centrifuge and
pellets were stored at -20 oC until needed.
For the analysis, the pellet was resuspended in 200 mL of cold lysis buffer and centrifuged
for 10 min at 5000 rpm at 4 oC. The pellet was resuspended in 20 mL of ice-cold lysis
buffer, transferred in smaller tubes and then, lysozyme was added at a final concentration of
67
0.2 mg mL-1 and 0.25 mM PMSF. Reaction mix was incubated at 4 oC for 1.5 h before 3
mM sodium deoxycholate was added with 0.125 mM PMSF and incubated at 37 oC for 30
min, during which time the solution became very viscous. After that, samples were sonicated
on ice for at least 5 times for 30 s pulses at 10 amplitude microns with at least 30 s break in
between to allow cooling between each pulse. Following the sonication step, the solution
was centrifuged at 5000 rpm for 20 min at 4 oC. The pellet was washed with 20 mL of cold
lysozyme buffer. The whole cycle of pellet washing, sonications and centrifugation was
repeated for 5-7 times, the pellet being frozen over night at -20 oC where necessary.
Proteins in inclusion bodies in the pellet were then solubilised in 6 M guanidine
hydrochloride and 500 mM 2-mercaptoethylamine by shaking in orbital shaker for 4 h at 22
oC. In contrast with the previous protocol, which instructed to solubilize for 2 h, it was found
that protein yield was increased by solubilising for 4 h. Following solubilisation, the
suspension was centrifuged (15 min, 5000 rpm) at 20 oC and the supernatant was kept for
protein refolding in a cold refolding buffer. Refolding took place at 4 oC by adding protein
aliquots very slowly into the buffer while being stirred. The solution was incubated at 4 oC
for 16 h with constant agitation. Refolded proteins were dialysed in three exchanges of at
least 5 L of the cold dialysis buffer: in the morning, afternoon and overnight. The next day,
the last set of the dialysis buffer was discarded (except for ~100 mL). Pressure was removed
from the dialysis tubes by removing the clips. The tubes were then placed in the beaker with
~2 cm of dialysis buffer. Over that, the solid PEG6000 was generously sprinkled while the
beaker was gently shaken. More PEG6000 was regularly added during the day until protein
had concentrated to ~10 % of its original volume. When the desired volume was reached,
PEG was washed from the tubes with distilled water, and proteins were aliquoted 1 mL to
microtubes and snap-freezed in liquid nitrogen. Proteins were stored at –80 oC until required.

68
At every stage of the protocol, small samples were taken to check protein concentrations
either on a protein gel (by SDS-PAGE) or with Bradford assay (Bradford, 1976).
Lysis Buffer: 50 mM Tris.HCl; pH 8 100 mM NaCl 1 mM EDTA
Refolding Buffer: 100 mM Tris 2 mM EDTA 500 mM L-arginine hydrochloride 10 mM cystamine dihydrochloride 5 % glycerol pH 8
Dialysis Buffer: 50 mM Tris.HCl, pH 8 100 mM NaCl 2 mM EDTA
2.3.2. Treatments of pollen tubes
Following successful pollen germination, pollen tubes were treated with PrsS proteins for SI
response, incubated with various drugs or pretreated with drugs and then with PrsS proteins.
PrsS proteins:
Recombinant PrsS proteins (Kakeda et al., 1998) were dialysed over night at 4 oC from Tris
buffer into GM (for experiments with poppy pollen) or AtGM (for experiments with
Arabidopsis pollen) using dialysis tubing with 12000 – 14000 Mw cutoff. In 1 L of GM or
AtGM, 1 mL of PrsS proteins could be dialysed. After dialysis, the protein concentration
was determined by Bradford assay (Bradford, 1976) using bovine serum albumin as
standard. For an induction of the SI response, PrsS proteins were added to pollen growing in
vitro at a final concentration of 10 µg mL-1 unless stated differently.
69
Treatment with N-(benzyloxycarbonyl)-leucinyl-leucinyl-leucinal (MG132):
Pollen tubes growing in vitro were pretreated with 40 µM MG132 for 30 min prior to the
addition of recombinant PrsS proteins and left for 5 h. Controls comprised of 40 µM MG132
treatment and were left for the same time. DMSO was used as a solvent control.
Treatment with Ac-DEVD-CHO:
Tubes were pretreated with 100 µM Ac-DEVD-CHO for 60 min prior to addition of S-
proteins and left for 5 h. Controls comprised of 100 µM Ac-DEVD-CHO and were left for
the same time.
2.3.3. Pollen protein extraction
Pollen tubes grown under specified conditions were collected from the Petri dish using a
pipette with a cut tip, placed into a 1.5 mL microtubes (poppy pollen) and centrifuged (1
min, 13200 rpm) in a tabletop microcentrifuge. In the case of the Arabidopsis pollen
experiments, centrifuging was for 2 min at 4000 rpm. Then the supernatant was discarded
and an equal volume of 2X Tris extraction buffer with protease inhibitor or TM extraction
buffer was added to the volume left in the microtube to make a final 1X concentration.
Samples were roughly grounded using plastic grinders in the microtube before being snap-
frozen in liquid N2 and stored at -20 oC until required.
Sample protein extracts were prepared by sonication 5 x 5 s at 10 amplitude microns (poppy
pollen) or 5 x 2 s (Arabidopsis pollen) and kept on ice during sonication to prevent
overheating. After sonication, samples were kept on ice for 15 min and then centrifuged (30
min at 13200 rpm at 4 oC). The supernatant was recovered into a microtube and then
70
centrifuged again (10 min, 13 200 rpm at 4 °C). The pellet was frozen at -20 oC. Clear
supernatant was carefully recovered into a microtube. Samples were kept on ice during all
the steps.
The protein concentration was determined by Bradford assay (Bradford, 1976) and then
samples were used for SDS-PAGE or caspase-like activity assays.
2X Tris extraction buffer: 100 mM Tris-HCL pH 8 200 mM NaCl 2.0 mM EDTA 1.0 M sucrose 2 X final protease inhibitor cocktail
Extraction buffer for caspase assay: 50 mM NaOAc 10 mM L-cysteine 10 % glycerol 0.1 % Chaps pH 5 and pH 6
2x Tris Extraction buffer for TM proteins: 2x Tris extraction buffer 0.2 % Triton X-100
Extraction buffer for TM proteins: 30 mM Hepes 2 % Triton X-100 300 mM NaCl 30 % Glycerol 5 mM MgCl2 2 mM β-mercaptoethanol pH 7.5
2.3.4. Bradford Assay
Protein concentration was estimated through the Bradford assay (Bradford, 1976) using BSA
as standard. Protein assay reagent (BioRad, UK) (which contains Coomassie® Brilliant Blue
G-250) was added to diluted protein samples, and its absorbance measured at 595 nm with a
spectrophotometer.
For most of the experiments, protein concentration needed to be calculated as accurately as
possible, so two replicates were measured for each sample and also compared with a BSA.

71
2.3.5. SDS-Polyacrylamide gel electrophoresis (SDS-PAGE)
2.3.5.1. Preparation of SDS-PAGE
Gels were cast using the BioRad self-assembly kits using standard procedures.
2.3.5.2. Protein staining on the poliacrylamide gel
After electrophoresis, gels were soaked for 1–2 h at room temperature in a Coomassie
staining solution and then, destained by incubating the gel in a destaining solution for 2 h or
until the bands were clearly apparent. Finally, gels were dried using vacuum drier for 1.5 h at
70 oC.
Coomassie staining solution: 0.1 % Coomassie Blue R-250 45 % (v/v) methanol 10 % glacial acetic acid
Destaining solution: 30 % (v/v) methanol 10 % (v/v) glacial acetic acid
2.3.6. Western blot
2.3.6.1. Protein transfer
After protein separation by SDS-PAGE the resolving gel was then transferred onto a sponge
and two sheets of filter paper (Whatman) soaked in the protein transfer buffer. A
nitrocellulose membrane (Hybond-C extra, Amersham) was cut to size and laid over the gel.
A glass rod was used to remove any air bubbles. Two more sheets of filter paper (Whatman)
were laid on top of the membrane and finally a sponge was laid on it. The layered
arrangement was sandwiched between two electroblotting pads (BioRad). This was then
inserted into the electroblotting tank (BioRad), which was filled with protein transfer buffer.

72
An ice block was also placed in the tank to prevent a overheating due to the high voltage
used for blotting. BioRad power packs were used to blot the gel at 350 mA for 2 h.
Following transfer, the nylon membrane was removed and placed in blocking solution at
4 ˚C for 16 h.
Protein transfer buffer: 20 % (v/v) methanol 0.2 M glycine 25 mM Tris
Blocking solution: 10 % (v/v) 10x TBS 0.01 % Tween 5 % (w/v) milk powder
10 x Tris Buffered Saline (TBS): 24.22 gL-1 Tris 80 gL-1 NaCl pH 7.6
2.3.6.2. Protein immunodetection
After blocking the membrane, it was incubated with primary antibodies (diluted at varying
concentrations depending on the antibody being used), in a blocking solution for 2 h at room
temperature. Then, three washes of 10 min each blocking solution were carried out and then,
incubated with the secondary antibody. If the primary antibody was raised in mouse, an
alkaline phosphatase-conjugated anti-mouse immunoglobin was used as the secondary
antibody (alkaline phosphatase detection), while if the primary one was raised in goat, a
horse radish peroxidase-conjugated anti-goat immunoglobin was used (enhanced
chemiluminescence detection) diluted 1:5000 in blocking solution for 1 h. The blot was then
washed 1x 10 min in blocking solution and 3x 10 min in 1X TBS-Tween.

73
Primary antibodies:
Monoclonal anti-ubiquitin (Sigma); titre 1:5000
Monoclonal anti-ubiquitin (Santa Cruz); titre 1:5000
Monoclonal anti-ubiquitin (donated by Dr Ari Sadanandom); titre 1:2500
Poly-clonal anti PrpS1 C terminus (60C); titre 1:500 or 1 :1000
Secondary antibodies:
Anti-mouse HRP; titre 1:5000
Anti-mouse AP; titre 1:5000
Anti-rat AP; titre 1:5000
Anti-goat HRP; titre 1:5000
2.3.6.2.1. Enhanced chemiluminescence detection
ECL western blotting reagents were used to detect the HRP conjugated secondary antibody.
Solutions A and B (Yakunin and Hallenbeck, 1998) were mixed 1:1 and poured over the blot
for 1 min. Excess reagents were removed. Blots were analysed using FluorS Multi-imager
and Quantity One software (Biorad).
Solution A 100 mM glycine, pH 10 (with NaOH) 0.4 mM luminol 8 mM 4-iodophenol
Solution B 0.12 % (w/w) H2O2 in SDW
74
2.3.6.2.2. Light intensity evaluation of western blots (ECL detection)
Light intensity was evaluated on images taken with the Fluor-S Multiimager system using
Quantity One software. First, a rectangular volume was created around the area of interest
and then a volume analysis report was requested for this area. Results came out as Volume in
units counts per sqare milimeter (CNT*mm2) or Adjusted Volume (CNT*mm2). Adjusted
volume refers to volume minus background volume.
2.3.6.2.3. Alkaline Phosphatase detection
66 µl NBT (nitro blue tetrazolium) and 33 µl BCIP (5-bromo-4-chloro-3-indolyl-phosphate)
was added to 9.9 ml alkaline phosphatase detection buffer. The solution was poured over the
blot and left in darkness until a colour change was observed where the Alkaline phosphatase-
conjugated secondary antibody was present.
Alkaline phosphatase detection buffer: 100 mM NaCl 5 mM MgCl2 100 mM Tris pH 9.5
2.3.6.3. Modified western blot for detection of membrane proteins
Since the proteins are likely to aggregate during boiling, the protocol for protein loading on
the SDS-PAGE gel was modified so the sample was not boiled prior to loading on the gel.
Omitting the boiling step, SDS-PAGE was undertaken as described in section 2.3.5.1.
Protein transfer in western blot was done as described in section 2.3.6.1. The modification

75
was at the end of the transfer when the blot was incubated in a stripping buffer for 15 min at
55 oC with mild agitation (Kaur and Bachhawat, 2009). The stripping buffer was washed
from the blot with several washes with 1x TBST at RT until the β-mercaptoethanol smell
was no longer detected. Then, the membrane was placed in a blocking solution at 4 oC
overnight and immunodetection was undertaken as described in section 2.3.6.2.
Stripping buffer: 100 mM β-mercaptoethanol 2 % SDS 62.5 mM Tris-HCl pH 6.7
2.3.7. Slot-blot binding assay
Four overlapping 15-mer peptides, spanning the predicted 35 amino acid extracellular
domain of PrpS1 and a scrambled peptide were synthesized by Alta Bioscience (University
of Birmingham, UK). These peptides were bound to a polyvinyl difluoride (PVDF)
membrane using a slot-blotter. The membrane was properly labelled and pre-wetted with
methanol for 10 s. Then, it was incubated with MiliQ water for 10 min on a shaker and
finally incubated in PBS for 10 min with constant gentle shaking. The slot-blot filtration
manifold was attached to a vacuum pump and after the insertion of the membrane, the slot-
blot system was assembled and the vacuum pump was turned on. Different amounts of
peptides (10 μg, 1.0 μg and 0.1 μg) in the final volume of 50 μL were bound to the
membrane. The scrambled peptide control was used at the same concentrations, while the
recombinant PrsS at concentration 0.1 μg. The membrane carrying the PrpS peptides was
immediately rinsed with PBS and then incubated with 5 % skimmed milk in PBS for 1 h at
room temperature. The membrane was then incubated with 20 μg mL-1 recombinant PrsS1
76
protein previously dialysed, as described above, against PBS at room temperature for 16 h to
allow binding. Then, membrane was washed with PBS and blocked with 5 % milk in TBST
for 1 h at room temperature. The membrane was then incubated for 2 h with the primary
antibody raised against PrsS1 to detect S protein binding to PrpS. Following incubation, the
membrane was washed with 5 % skimmed milk in TBST and then incubated with anti-rabbit
antibody conjugated with alkaline phosphatase. Detection was done with NBT/BCIP in
alkaline phosphatase detection buffer as described above.
Peptides:
PrpS1 A1 - VKLLGLVLHRLSFSE
PrpS1 A2 - LHRLSFSEDQKWVVA
PrpS1 A3 - DQKWVVAFGTAAICD
PrpS1 A4 - TAAICDVLLVPKNML
PrpS1 A1 scrambled 1 - ELGVKLHSLSVLRFL
PrpS1 A3 scrambled 1 - FTVDVKDCAAAWGQI
PrpS8 A1 - LKLLGWVLQHLTVTE
PrpS8 A1 scrambled 1 – GLTWLQLKEVHLTVL
Phosphate Buffer Saline (PBS): 137 mM NaCl 2.7 mM KCl 10 mM Na2HPO4 2 mM KH2PO4

77
Primary antibodies:
Polyclonal anti-PrsS1; titre 1:6000
Polyclonal anti-PrsS3; titre 1:5000
Polyclonal anti-PrsS8; titre 1:4000
Secondary antibody:
Anti-rabbit AP; titre 1:5000
Prior to use, both antibodies were cleaned up using an Immobilised E. coli lysate kit, Pierce,
Rockford (see next chapter 2.3.8).
2.3.8. Purification of antibodies using Immobilised E.coli lysate kit
Possible non-specific antibodies contained in the primary antibody preparations were
eliminated by chromatography using a column with immobilised E. coli total proteins. The
antibody solution was passed through an E. coli protein column, previously equilibrated with
10 mL TBS buffer (BupHTM Tris buffered saline dissolved in 500 mL of SDW). After
adding a 1 mL crude antibody solution to the column, an extra 100 µL TBS was added and
fractions were collected in a 1.5 mL microtube. Protein concentration of all fractions was
determined through Bradford assay (Bradford, 1976). Fractions with the highest protein
concentration were pooled. Finally, the column was washed with at least 10 mL regeneration
buffer, followed by 10 mL TBS plus 0.02 % sodium azide for storage.

78
2.3.9. Pollen tube length measurement
Pollen tubes were grown and given the appropriate treatment and mounted on glass slides.
Pollen was observed using a Nikon Eclipse Tε300 microscope attached to a cooled coupled
device (CCD) camera supplied by Applied Imaging, UK. Capture and analysis of images
was achieved with a Nikon NIS elements 3.2 image analysis system. Images were saved as
jp2 files. Tube lengths were measured (50 tubes per treatment; N = 3) with the NIS elements
3.2 software. Measurements were exported into a Microsoft Excel file where statistical
analysis was performed.
2.3.10. Programmed cell death – caspase-like activity assay
To determine the presence of caspase-like activity, we used the fluorogenic caspase-3
substrate Ac-DEVD-AMC (Calbiochem). Pollen (Papaver or Arabidopsis) was hydrated and
grown as described in sections 2.1.4 and 2.2.3, respectively. After ~1 h of growth, pollen
tubes were treated as indicated in each experiment. Pollen was left in GM containing the
indicated treatment for 5 h at room temperature as this period gives the highest caspase
activity if PCD was occuring (Bosch and Franklin-Tong, 2007). The pollen was then
collected into 1.5 ml microtubes and the protein extracted as described in section 2.3.3 and
the protein concentration was determined as described in section 2.3.4. The protein
concentration was adjusted to 1 µg µL-1 by diluting the extract in the sodium acetate
extraction buffer (pH 6) and protein concentration was measured again.
Samples with 10 µg were extracted with pH 6 caspase extraction buffer and were loaded into
96 well plate in duplicates, incubated with 50 µM Ac-DEVD-AMC (Calbiochem),
79
fluorogenic caspase-3 substrate in caspase buffer and adjusted to pH 5, since this is the
optimum pH for caspase action in poppy pollen (Bosch and Franklin-Tong, 2007). If protein
extracts were less than 1 µg µL-1, the appropriate volume of protein extract was added into
the well of the 96 well plate to make 10 µg of protein. The other samples in that experiment
were made up to the greatest volume by adding the appropriate amount of pH 6.0 sodium
acetate buffer so that all wells had the same volume of pH 6 buffer and protein. Fluorescence
was monitored at 460 nm using a time-resolved fluorescence plate reader (FLUOstar
OPTIMA; BMG LABTECH) every 15 min over a time period of 5 h. The caspase activity
for each sample was calculated by subtracting the fluorescence reading of the first cycle
from the final (21st) cycle reading. Results are presented as percentage caspase activity
relative to the DMSO or GM control.
2.3.11 Cell Death
2.3.11.1. Cell Death – Viability test
Poppy pollen tubes were grown and treated with appropriate drugs, then incubated with 10
µg flurescein diacetate (FDA) per mL of liquid GM for 5 min at room temperature and
mounted on glass slides. Pollen was visualized under a Nikon Eclipse Tε300 microscope
attached to a cooled coupled device (CCD) camera supplied by Applied Imaging, UK.
Capture and analysis of images was achieved with a Nikon NIS elements 3.2 image analysis
system. Images were saved as jp2 and tif files. Pollen tubes were counted (30 tubes per
treatment; N=3) in the following categories: (1) total, (2) green (alive) and (3) unstained
(dead).
80
Arabidopsis pollen viability assay was based on using Evans blue dye. FDA was not an
appropriate stain as the pollen was expressing GFP and the wavelengths overlapped. Pollen
was stained with 0.05 % Evans blue for 15 minutes. After incubation, the sample was
washed four times with SDW in order to remove excess dye. Aliquots of 20 µL were
mounted on microscope slides and pollen was visualised using brightfield microscopy
(Nikon Eclipse Tε300). Scoring categories were: (1) total, (2) unstained (alive) and (3) dark
stained (dead). Each experiment was done in triplicate with 180 pollen counted each time.
Statistical analysis by Chi square was performed in Microsoft Excel.
2.3.11.2. Pretreatment with tetrapeptide inhibitor Ac-DEVD-CHO
A. thaliana pollen was pretreated with 100 µM Ac-DEVD-CHO for 1 h before SI was
induced by adding stigmatic PrsS1 or PrsS3 recombinant proteins to PrpS1-GFP and PrpS3-
GFP expressing pollen growing in vitro, respectively, at final concentration 20 μg/mL.
Negative control was comprised of pollen, incubated in Ac-DEVD-CHO only, untreated
pollen, grown in AtGM only or pollen with induced SI reaction without DEVDase inhibitor.
Pollen was incubated for 8 h and then stained as described in previous section 2.3.11.1.
2.3.12. Actin labelling
Arabidopsis pollen was collected and germinated as described in section 2.2.3. Samples were
fixed in a 1.5 microtube with 124 μg mL-1 m-Maleimidobenzoyl-N-hydroxysuccinimide
esther (MBS) for 6 min and then paraformaldehyde (PFA) was added to a final concentration
of 2 % and the samples were incubated for 1.5 h at 4 oC. After fixation, PFA was eliminated

81
with 3 washes of 1 mL TBS, removing the supernatant after each wash by centrifuging at 3
600 rpm for 2 min. After the last wash, samples were incubated with TBS plus 0.1 % Triton
for 40 min to permeabilise the pollen tubes. Tubes were stained with 66 nM Rhodamine-
Phalloidin and samples were left for 16 h at 4 oC or 2 h at room temperature. Then, 10 μL of
sample was pipetted onto a microscope slide and 5 μL of Vectashield with DAPI was added
before slides were covered with a cover slip and sealed with transparent nail polish. Samples
were visualised using epifluorescence or confocal microscopy. Epifluorescence was
performed on a Nikon Tε300 fluorescence microscope. The slides were searched for intact
pollen tubes. The nuclei were then visualised using the DAPI filter before switching to a
TRITC filter to see if there was any Rhodamine-Phalloidin labelling of F-actin. Capture and
analysis of images was achieved with a Nikon NIS elements 3.2 image analysis system.
Images were saved as jp2 and TIF files and then manipulated using Image J and Adobe
Photoshop.
Confocal laser scanning microscopy was performed by Katie Wilkins on Leica SP2 Inverted
Confocal system. Full z-series sections of the pollen tubes were taken, 0.5 µm thick.
GFP images were taken using Argon 488 nm laser, using 5 % of the power, emission
bandwidth was 500 – 530 nm using 550.1 gain. Rh-Ph images were taken using 543 nm
laser, using 100 % power, emission bandwith was 565 – 600 nm, using 550.1 gain.
Images from the confocal were saved as tiff files then viewed and manipulated using ImageJ
software.
Scannning settings: 4x average scan 400 hz scan 512 x 512 pixel frame 63x oil immersion lens
82
2.3.13. Leaf mesophyl protoplast production
Leaves from 3-4 weeks old Arabidopsis plants were cut with a surgical knife into very thin
strips on a clean paper surface and transferred to the Petri dishes containing 15-20 mL of
enzyme solution. Leaves were incubated in a Petri dish sealed with Parafilm and wrapped in
aluminium foil at 22 oC for 16 h. Care was taken to keep the Petri dish as still as possible not
moving or shaking it at any point. Then, the enzyme solution was pipetted with a sterile
Pasteur pipette very carefully to avoid disturbing the leaves, otherwise the protoplasts would
be released too early. Protoplasts were released by adding 10 mL K3 media on the plate,
which was then gently swirled. Protoplast containing medium was passed through a nylon
filter in a sterile 20 mL plastic tube with a round bottom. The tube was left to stand still for
40 – 60 min and during this time the protoplasts floated to the top of the solution. The upper
layer with protoplasts was transferred into a new round bottom tube using sterile Pasteur
pipette. Then, protoplasts were washed with 5 mL K3 medium, which was carefully pipetted
into the tube. The tube was left to stand again for ~1 h to allow protoplasts to float again. At
this stage, small aliquot was taken to assess protoplasts viability using FDA, while the main
part of protoplasts were transfected using 5 – 20 µg of plasmid pEarleyGate purified by
Midiprep kit (Qiagen). 250 µL of suspended protoplast solution was added per tube with
DNA and an equal volume of PEG solution was added to the mixture of DNA and
protoplasts and incubated for 30 min at RT. The PEG solution was diluted by adding 2 mL
K3, and tubes allowed to stand for 1 – 2 h to let the protoplasts float to the top. The solution
underneath the protoplasts was carefully withdrawn and a new aliquot of 2 mL K3 medium
was added to the protoplasts and left to incubate for 16 h in the dark at RT. The following
day transient expression of the gene of interest was verified.
83
K3 medium: Prepared from following stock solutions 10x B5 medium with vitamins 200x MES (0.1 g/mL) 500 x myo-inositol (0.05 g/mL) 100x NH4NO3 (25 mg/mL) 100x CaCl2*2H2O (75 mg/mL) 100x D-xylose (25 mg/mL) 0.4 M sucrose pH adjusted to 5.6 – 5.7 using 1.0 M KOH Solution was filter sterilized and stored at 4 oC.
“Enzyme solution”: 0.5 % cellulase (R-10) 0.2 % macerozyme (R-10) prepared in K3 medium, filter sterilized and stored at -20 oC.
Protoplasts suspension solution medium 0.4 M Mannitol 20 mM CaCl2*2H2O 5 mM MES pH 5.7 filter sterilized and stored at 4 oC.
PEG solution 40 % PEG 4000 (Fluka) 0.4 M mannitol 100 mM Ca(NO3)2 warmed in the 60 oC water bath pH 7.0 adjusted with 1.0 M KOH Filter sterilized and aliquoted, stored at -20 oC
2.3.14. PCR screening for the presence of inserts in transgenic plants
Leaf disks were obtained from Arabidopsis transgenic plants and untransformed Col-0 as a
control in small PCR microtubes. To extract DNA, 50 μL of an extraction buffer was added
and the leaf disk was grinded using a sterile filter tip, incubated at 95 oC for 10 min and
cooled on ice for 2 min. After that, 50 μL of a dilution buffer was added, and the mixture
was vortexed and centrifuged (1 min, 13200 rpm). For each PCR reaction 1 μL of DNA was
used. The presence of inserts was anlysed by electrophoresis on a 0.8 % agarose gel.
Oligonucleotide primers were supplied by MWG-Biotech.
Extraction Buffer 0.1M Tris-HCl, pH 9.5 0.25 M KCl 0.01 M EDTA
Dilution Buffer 3 % BSA
Solutions were prepared by aseptic work and filter sterilized before use.
84
PCR mix: 12.5 μL ReddyMixTM PCR Master Mix (Thermo Scientific) 1 μL forward primer 1 μL reverse primer 1 μL DNA 9.5 μL dH2O
PCR conditions:
93 oC – 3 min 1x
93 oC – 1 min 57 oC – 1 min 35x 72 oC – 1 min
72 oC – 10 min 1x
Used primers:
Forward PrsS1: 5’-GGAGCATTGGCATCCATTGCCG-3’ Tm = 64 oC
Reverse PrsS1: 5’-CCATTATCTTCCAGAGGCACTGGG-3’ Tm = 64.4 oC
Forward PrsS3: 5’-CGATCCACTGCCAATCAGAAGACG-3’ Tm = 64.4 oC
Reverse PrsS3: 5’-GTGGAGCACCTTCCGCCGTCG-3’ Tm = 67.6 oC
Forward PrsS8: 5’-GGTAATGGCCATAGCATCGGG-3’ Tm = 61.8 oC
Reverse PrsS8: 5’-CATCCGTTGTCTTCCACAGGC-3’ Tm = 61.8 oC
Forward clon. PrpS1: 5’-CCATGCCCCGAAGTGGAAGTGTTG-3’ Tm = 66.1 oC
Reverse clon. PrpS1: 5’-CCTTAAGCTTGAGTTATAAGATGAGGGGAATCC-3’ Tm =
67.0 oC
Forward PrpS3: 5’-CCATGCTCTTACGTGGAAAGACC-3’ Tm = 62.4 oC
Reverse PrpS3: 5’-GGCTGCAGAAGTGGCTTCATC-3’ Tm = 61.8 oC
Forward PrpS8: 5’-CCCTATTTGGATCCGCACTTGCC-3’ Tm = 64.2 oC
Reverse PrpS8: 5’-GAGGATTCAGAGGAGTTGCCC-3' Tm = 64.0 oC

85
2.3.15 DNA analysis by agarose gel electrophoresis
For the gel, agarose was fused in 0.5X TBE by heating the solution until it was completely
clear. Then, 0.5 µg mL-1 ethidium bromide was added to the molten agarose. Gels were
poured and electrophoresed using Hybaid or Biorad electrophoresis kits. Images of gels were
captured using a FluorS Multi-imager and analysed using Quantity One software if
necessary. An estimation of size was achieved by parallel electrophoresis of an aliquot of 1
kb ladder (Invitrogen).
10 x TBE: 0.9 M Tris 0.9 M Orthoboric acid 25 mM EDTA
DNA loading buffer: 40 % (v/v) glycerol 0.25 % (w/v) bromophenol blue
2.3.16. Semi-quantitative RT-PCR
2.3.16.1 RNA extraction
Total RNA was extracted using RNeasy Mini Kit (Qiagen). All materials and water was
pretreated with 0.05 % or 0.1 % diethylpyrocarbonate (DEPC), respectively. DEPC reacts
with histidine residues on the proteins and thus it inactivates RNases. However, it can react
with RNA as well. Therefore, it was necessary to autoclave DEPC incubated solutions
before the experiment. DEPC is heat-sensitive and is degraded by autoclaving.
For each extraction, 20 A. thaliana (transgenic or untransformed) flowers were collected.
Flowers were frozen in liquid nitrogen and grinded thoroughly in microtubes using a plastic
rod. β-mercaptoethanol was diluted 1:100 in RLT buffer and 450µl of the solution added to
the grounded flowers and mixed by vortexing. The sample was then added to a lilac
QIAshredder column spin column and centrifuged (2 min, 13200 rpm). The flow-through

86
was transferred to a new microtube, 0.5 V of 100 % ethanol was added, the solution mixed
by pipetting, then immediately transferred to a pink RNeasy column and centrifuged (15 s,
13200 rpm). The flow-through was discarded and 700 µL RWI buffer added to the new
column before centrifugation (15 s, 13,200 rpm). The flow-through was discarded and the
column transferred to a new collection tube. 500 µL RPE buffer was added to the column,
centrifuged (15 s, 13200 rpm) and the flow-through discarded. Another 500 µL of RPE
buffer was added to the column again and centrifuged (2 min, 10000 rpm) to ensure the
membrane was dry. The column was transferred into a new microtube and centrifuged (1
min, 13200 rpm). Finally, the column was transferred to a final microtube, 30 µL of RNase
free water added and centrifuged (1 min, 13200 rpm). Then, another 10 µL of RNase free
water was added to completely elute everything and centrifuged (1 min, 13200 rpm). 5 µL of
RNA was used to analyse by electrophoresis and the rest stored at -80 °C until required.
2.3.16.2. RNA analysis by agarose gel electrophoresis
Analysis of RNA samples was accomplished by electrophoresis on agarose gels using 5 µL
of RNA loading dye. No ladder was used due to the possible contamination with RNases. 1
% agarose gel was made up in 0.5x TBE using RNase free SDW and poured in RNase free
gel tank. Electrophoresis settings and gel visualisation are described in chapter 2.3.15.1.
RNA was stained with ethidium bromide, which was previously added to the agarose
solution at a final concentration of 0.5 µg mL-1.

87
2.3.16.3. DNase treatment of RNA
In order to remove contaminating DNA, 10 μL of RNA was mixed with 10 μL of DNase
solution and incubated at RT for 15 min. 2 mM EDTA was added and the mixture was
incubated at 65 oC for 10 min. Then, 80 μL of RNase free water was added and phenol
extraction proceeded by addition of equal volume of phenol. The solution was mixed and
centrifuged (5 min, 13200 rpm). The upper aqueous layer was removed and transferred to a
clean tube and an equal volume of chloroform was added. Again, the sample was vortexed
and centrifuged (5 min, 13200 rpm). The top layer with aqueous phase was removed,
transferred to the fresh tube and 1 μL of glycogen (Roche) was added, which serves as a
carrier to promote nucleic acids precipitation. RNA was precipitated by adding 2.5 V of 70
% ethanol, vortexed well, incubated at 70 oC for 30 min and centrifuged (10 min, 13200
rpm). Supernatant was carefully removed. RNA pellet was washed with 70 % ethanol. The
pellet was dried in a vacuum chamber for 15 min and resuspended in 20 μL of RNase free
water.
DNase solution: 2 μL 10x DNase I buffer 1 μL recombinant RNasin (Promega) 1 μL DNase (Invitrogen) 6 μL RNase free SDW
2.3.16.4. cDNA synthesis by RT-PCR
Isolated total RNA was used in RT-PCR reaction One-step RT-PCR kit (Qiagen). cDNA
was analysed by electrophoresis as described in section 2.3.15.1. Sample loading was

88
compared to glyceraldehyde-3-phosphate dehydrogenase C (GAPC), whose cDNA was also
amplified and used as RT-PCR standard and loaded in parallel on the same gel.
RT-PCR mix: 2 μL RNA 10 μL 5x buffer 2 μL dNTP 1 μL forward primer 1 μL reverse primer 1 μL recombinant RNasein 2 μL enzyme mix 31 μL RNase free dH2O
RT-PCR conditions:
50 oC – 30 min 1x
95 oC – 15 min 1x
94 oC – 1 min 57 oC – 1 min 30x 72 oC – 1.5 min
72 oC – 10 min 1x
Primers:
GAPC forw: 5’-CACTGACAAAGACAAGGCTGCAGC-3’ Tm = 64.4 oC
GAPC rev: 5’-CCTGTTGTCGCCAACGAAGTCAG-3’ Tm = 64.2 oC
89
CHAPTER 3
Investigation of the possible involvement of the
ubiquitin-proteasomal pathway during SI in
Papaver pollen

90
3.1. INTRODUCTION
As mentioned in the introduction (section 1.6), the Ubiquitin-mediated 26S proteasomal
(UbP) degradation of proteins is required to maintain the cellular homeostasis and regulation
of various cellular functions. Protein substrates are covalently attached to a small protein,
ubiquitin, by the sequential action of three enzymes. Ubiquitin is first activated by an
ubiquitin-activating enzyme E1 and transferred to the ubiquitin-conjugating enzyme E2. E2
binds to the ubiquitin-protein ligase E3 that catalyzes the formation of a covalent bond of
ubiquitin molecules sequentially attached through Lys-48 of the previous ubiquitin (Hershko
and Ciechanover, 1998). A chain of at least four ubiquitins is required for degradation by the
26S proteasome. Monoubiquitinated proteins or proteins tagged with the ubiquitin chain
through the Lys-63 are not targeted for degradation but they are involved in various events
such as subcellular localization or protein activation or protein-protein interaction (Dielen et
al., 2010).
The specificity of the UbP pathway is mainly determined by the wide range of diverse E3
ligases that recognise substrates through the specific protein recognition domains (see
introduction for details). In A. thaliana there are more than 1400 genes that encode different
components of the UbP pathway and among them around 1300 encode different predicted
E3 ligases (Smalle and Vierstra, 2004). There are four major groups of E3 ligases:
monomeric HECT-domain E3 ligases and three groups that contain RING domain;
monomeric RING/U-box E3 ligasess and complex Cullin RING E3 ligases and APC
E3ligases. The Cullin RING ligases are further divided based on the different subunits of
Cullin that they contain: the SCF complex contains SKP1, Cullin-1 protein F-box for protein
specificity and RBX1; the complex with Cullin-3 subunit contains RBX1 and BTB1/POZ

91
domain, and Cullin-4 based complex contains RBX1, DDB1 and WD (Vierstra, 2003,
Vierstra, 2009).
The 26S proteasome is a large cylindrical multisubunit complex, consisting of the 20S
central core domain, that is comprised of four stacked rings of α and β subunits (each ring is
composed of seven proteins), and the 19S regulatory “cap” structure, that can be divided into
lid and base components. The 19S regulatory particle recognizes polyubiquitin tags attached
to the target protein substrates, initiates the degradation process in the core and also removes
the Ub chains (Voges et al., 1999, Kurepa and Smalle, 2008).
UbP degradation was demonstrated as playing a role in plant-pathogen interactions and some
aspects of plant reproduction. The UbP pathway is involved in plant-pathogen interaction at
several different levels. Plant-pathogen interactions start with the perception of the PAMPs,
which are mediated by plasma membrane located pattern recognition receptors. This is the
first step towards PAMP-triggered immunity, achieved through the cascade of downstream
events (reviewed in Trujillo and Shirasu, 2010). The ubiquitination pathway, but not the 26S
proteasome, is involved in the basal host resistance of barley epidermis that is attacked by
powdery mildew (Dong et al., 2006). Plant pathogens developed several strategies by which
they interfered with the plant UbP pathway. They can recruit E3 ligases and target crucial
defense plant proteins for degradation by the 26S proteasome. For example P.syringae
AvrPtoB acquired E3 ligase activity through which it conjugates the Ub chain on plant Fen
or FLS2 proteins that stand guard against pathogen invasion, targets them for proteasomal
degradation, and thus creates the way to infect the plant (Göhre et al., 2008, Rosebrock et al.,
2007). Pathogens also developed a way to inhibit plant 26S proteasomal degradation, for
example the P. syringae protein SylA inhibits the β 1/2/5 subunits of the core particle of 26S
proteasome (Groll et al., 2008).

92
Yang et al., (2006) reported that the E3 ligase, PUB17 from A. thaliana and its functional
tobacco homologue ACRE276 act as positive regulators of cell death and defense responses
in Solanaceae and Brassicaceae. In addition, (Sadanandom et al., 2008) reported the
identification of the BTB/POZ domain transcriptional repressor, AtPOB1, that interacts with
the ARM repeat of PUB17 to control disease resistance in plants. Plants that were deficient
in POB1 produced spontaneous cell death, demonstrating its critical role in plant cell death.
Another important involvement of the 26S proteasome in hypersensitive response was
demonstrated by (Hatsugai et al., 2009). They demonstrated a direct link between
proteasome activity and plant PCD by identifying that the proteasomal subunit PBA1 acts as
a long sought plant caspase-3-like enzyme. Proteasome and its caspase-3-like activity are
required during bacterial infection to degrade a yet unknown negative regulator of
membrane fusion, thus enabling the fusion of the plant plasma membrane and the vacuole
membrane. In this way pores are created that enable the discharge of vacuole content and
defence proteins outside the cell, inhibiting bacteria infection and causing HR cell death.
Ubiquitination and proteasomal degradation were also demonstrated as playing a role in
some aspects of plant reproduction: free ubiquitin is required for pollen tube adhesion and
guidance in lily (Kim et al., 2006) and proteasomal degradation is necessary for normal
pollen tube development in Picea (Sheng et al., 2006) and kiwi (Speranza et al., 2001).
Moreover, ubiquitination and proteasomal degradation are essential during S-RNase based
gametophytic SI in Solanaceae, Rosaceae and Plantaginaceae, and in sporophytic SI in
Brassicaceae (for recent reviews see Meng et al., (2011), Tantikanjana et al., (2010), Yee
and Goring, (2009)). During an S-RNase-based incompatible response, self and non-self S-
RNases enter pollen tube. The hypothesis whose S-specificity was not yet demonstrated in
all GSI species is that pollen determinants recognize the non-self S-RNases and target them

93
for the proteasomal degradation while self S-RNases are not recognized and are allowed to
degrades the RNA of an incompatible pollen, therefore preventing self-fertilization (Kao and
Tsukamoto, 2004, Meng et al., 2011, Liu et al., 2009, Qiao et al., 2004b, Hua and Kao,
2006). In the S-RNase based SI system the pollen S-determinant is an S-locus F-box protein
(SLF or SFB), a component of a SKP1-Cullin1-F-box (SCF) complex (Sijacic et al., 2004,
Lai et al., 2002, Entani et al., 2003, Ushijima et al., 2003). In Antirrhinum, the SLF is
conventional SCF complex with a novel SKP1-like protein SSK1 (Huang et al., 2006), while
in Petunia the SLF is part of a novel E3 ligase complex. The other components of the PiSLF
complex in Petunia are PiCUL1-G and PiSBP1 (P. inflata S-RNase Binding Protein1), a
RING-HC protein in addition to PiSLF (Hua and Kao, 2006). However, the novel E3 ligase
identified does not contain SKP1 or RBX1.
The sporophytic SI mechanism found in Brassicaceae also involves components of UbP
pathway. The ARC1 protein, an E3 ligase that is a member of PUB family of proteins, acts
as a regulator of the Brassica SI response in the stigmatic papillae (Stone et al., 2003).
ARC1 mediates the ubiquitination of EXO70A1, a putative component of an exocyst system,
which regulates secretion (Samuel et al., 2009). In addition, an ubiquitin specific protease, a
homologue of AtUBP22, was identified in rye pistils and its role was implicated in the SI in
grasses (Hackauf and Wehling, 2005).
The self-incompatibility (SI) and hypersensitive response (HR) are important examples of
signaling pathways triggered in response to incompatible interaction between two cognate
proteins, resulting in PCD in plants. The mechanisms of HR and SI in Papaver share many
similarities, such as: increased levels of [Ca2+]i, Ca2+-dependent phosphorylation of proteins,
generation of reactive oxygen species and cessation of cytoplasmic streaming and caspase-3-
like induced PCD (Geitmann et al., 2004). Ubiquitin-dependent proteasomal (UbP)

94
degradation is an important component of PCD during HR and has also been reported to
play an important role in other SI systems, like GSI in Petunia and Pyrus, and SSI in
Brassica, but has not yet been reported during SI in Papaver.
The majority of studies on the UbP pathway use the inhibitors of the proteasome activity due
to their quick entering of cells and rapid reversibility of their action (Kisselev and Goldberg,
2001). The most desirable proteasome inhibitors are those specifically targeting the
proteasome without affecting activities of other serine or cysteine proteases. Among the
proteasome inhibitors, MG132 represents a potent cell-permeable proteasome inhibitor and
is widely used. MG132 is a peptide aldehyde Z-Leu-Leu-Leu-CHO that inhibits the
proteasome activity by covalently binding to the active site of the β-subunits in the core
particle (Zhang et al., 2009). The specificity of MG132 was demonstrated in numerous
studies on different systems, for example using a biochemical approach by tracking
degradation of several proteins known to be substrates for proteasome degradation in yeast
cells (Liu et al., 2007a). In plants, the use of the proteasome inhibitor MG132 was found to
inhibit length of tracheary elements in Zinnia cell cultures and also in A. thaliana (Zhao et
al., 2008). (Vacca et al., 2007) reported that MG132 prevented cells from PCD induced with
HS in tobacco BY2 cells. In growing pollen tubes, MG132 affects pollen tube morphology
(Sheng et al., 2006, Speranza et al., 2001), and mitochondrial dynamics and causes
vacuolization in the pollen tube (Sheng et al., 2010).
AIMS
The aim of this study was to investigate whether there is a link between Papaver SI and UbP
pathway and if so what role does the UbP degradation play during the pollen SI reaction in

95
Papaver. This work was carried out in collaboration with Dr. Ari Sadanandom from
University of Durham, whose research is focused on the role of ubiquitin-mediated
proteolysis during disease resistance in plants (Yang et al., 2006, Sadanandom et al., 2008).
We aimed to establish a link between ubiquitination and other PCD events that occur in the
pollen tube during SI reaction. This could provide an important information about cell death
signalling and might also provide further insights into two mechanistically similar cell
responses, SI and HR. In order to investigate the involvement of the UbP pathway during SI-
induced PCD pathway in Papaver pollen, the SI response was characterized in the presence
of the proteasomal degradation inhibitor MG132. Pollen viability, pollen tube growth
inhibition, and the level of protein ubiquitination during the SI reaction were determined.
3.2. RESULTS
3.2.1. The proteasome inhibitor MG132 affects pollen germination and tube growth
In order to investigate whether the UbP pathway has any role in poppy pollen germination
and growth, a pharmacological approach using the reversible proteasome inhibitor MG132
was used. Initially we wished to determine the concentration of the MG132 that would be
effective without inhibiting pollen tube growth or causing the alterations to pollen tube
morphology. The effect on normal pollen tube growth of different concentrations of MG132,
in range of 10 to 100 µM (see Figure 3.1), was determined. Different concentrations of
MG132 were applied to pre-germinated poppy pollen tubes in vitro. Pollen was left to
incubate for 30 min or 3.5 h when the pollen tube lengths of 39 tubes were measured (See

96
Figure 3.1). Figure 3.1 presents the effect of different concentrations of MG132 on the
length of pollen tubes.
Figure 3.1.: Mean length of Papaver pollen tubes treated with different concentrations of MG132 at two different time points 30 min (blue line) and 3.5 h (red line). UT-untreated pollen tubes. N=3 repeats, n=39 tubes measured. Error bars represent ± Standard Error of means.
The average pollen tube length of the untreated control after 3.5 h incubation was 461 μm
and it decreased when pollen was pretreated with MG132 (see Figure 3.1). The difference in
pollen tube length between untreated and 10 μM was not significant (P=0.085;
nonsignificant), nor was the difference in length significant between pollen that was
pretreated with 10 or 40 μM MG132 (P=0.122; nonsignificant). When comparing the pollen
tube length of pollen that was pretreated with 40 or 60 μM MG132, the difference was
highly significant (P=7.8*10-06; ***). When pollen was pretreated with 80 or 100 μM
MG132 the pollen tube growth was inhibited significantly (P=1.4*10-14 and P=5.3*10-19,
***, respectively), see Figure 3.1. Higher concentrations of MG132 (80 and 100 μM),
caused severe pollen tube swelling and balloon-like pollen tube tips. So they were not
considered further. Some signs of pollen tube tip swelling were also observed at 60 μM
0
100
200
300
400
500
600
UT 10 μM MG132
40 μM MG132
60 μM MG132
80 μM MG132
100 μM MG132
Leng
th (μ
m)
30 min
3.5 h
97
MG132 but not at 40 μM MG132. Therefore 40 μM MG132 was chosen as the most
effective concentration to inhibit proteasomal degradation without causing major
morphological changes in further experiments. This concentration is also consistent with the
reports from the literature (Wang et al., 2009b, Sheng et al., 2006, Sheng et al., 2010,
Speranza et al., 2001, Liu et al., 2007a). Reports from the other pollen tube systems like
Picea (Sheng et al., 2006) and kiwi (Speranza et al., 2001) show that MG132 alters pollen
tube morphology, causes tube tip swelling, tube branching and germination of more than one
tube per grain but the removal of inhibitor restored growth. These effects were not so
dramatic in case of poppy pollen germination, however tube swelling and branching was
detectable when pollen was pretreated with 80 or 100 μM MG132 concentrations of MG132.
3.2.2. Effect of inhibition of proteasomal activity on pollen tube growth
After establishing the optimal concentration of MG132 for these studies and the effect it had
on pollen tube growth, we examined whether the proteasomal activity was involved in poppy
SI. Pollen was pretreated with 40 µM MG132 for 30 min and then SI was induced by
incubating pollen with recombinant PrsS proteins for 3 h. The length of the pollen tubes was
measured to examine whether the inhibition of proteasomal activity by MG132 would affect
the inhibition of pollen tube growth caused by the SI response and rescue pollen from SI (see
Figure 3.2).
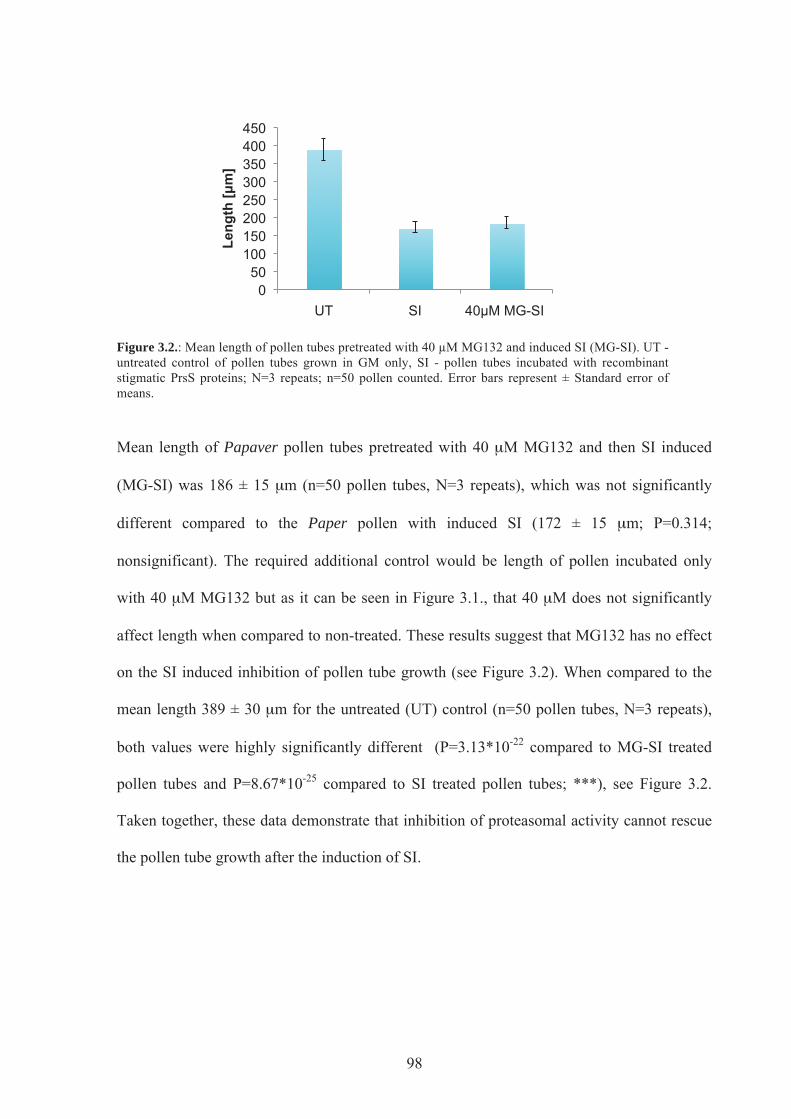
98
Figure 3.2.: Mean length of pollen tubes pretreated with 40 µM MG132 and induced SI (MG-SI). UT - untreated control of pollen tubes grown in GM only, SI - pollen tubes incubated with recombinant stigmatic PrsS proteins; N=3 repeats; n=50 pollen counted. Error bars represent ± Standard error of means.
Mean length of Papaver pollen tubes pretreated with 40 μM MG132 and then SI induced
(MG-SI) was 186 ± 15 μm (n=50 pollen tubes, N=3 repeats), which was not significantly
different compared to the Paper pollen with induced SI (172 ± 15 μm; P=0.314;
nonsignificant). The required additional control would be length of pollen incubated only
with 40 μM MG132 but as it can be seen in Figure 3.1., that 40 μM does not significantly
affect length when compared to non-treated. These results suggest that MG132 has no effect
on the SI induced inhibition of pollen tube growth (see Figure 3.2). When compared to the
mean length 389 ± 30 μm for the untreated (UT) control (n=50 pollen tubes, N=3 repeats),
both values were highly significantly different (P=3.13*10-22 compared to MG-SI treated
pollen tubes and P=8.67*10-25 compared to SI treated pollen tubes; ***), see Figure 3.2.
Taken together, these data demonstrate that inhibition of proteasomal activity cannot rescue
the pollen tube growth after the induction of SI.
0 50
100 150 200 250 300 350 400 450
UT SI 40μM MG-SI
Leng
th [μ
m]

99
3.2.3. Effect of inhibition of proteasomal activity on pollen tube viability
Since pollen tube length measurements did not give any indication of a link between SI and
proteasome inhibition, we decided to test whether MG132 treatment can rescue the viability
of pollen tubes after SI challenge. SI results in cell death, so if ubiquitination and
proteasomal degradation were involved in SI, then the inhibition of proteasomal activity by
MG132 might prevent pollen cell death and would therefore increase pollen viability
compared to SI induced pollen.
Pollen tube viability was assessed using fluorescein diacetate (FDA). FDA penetrates
through the cell membrane and inside the cell intracellular esterases cleave off the diacetate
group producing the highly fluorescent product fluorescein (Breeuwer et al., 1995). The
fluorescein will accumulate in cells which possess an intact membrane, so green
fluorescence can be used as a marker of cell viability, whereas cells that do not possess an
intact membrane or an active metabolism do not exhibit green fluorescence. Pollen tubes
were grown and treated with MG132 and incompatible PrsS-proteins as described in the
previous section. Pollen tubes were incubated with 10 µg/mL FDA in liquid GM for 5 min
and examined, as described in the materials and methods section (see Figure 3.3).
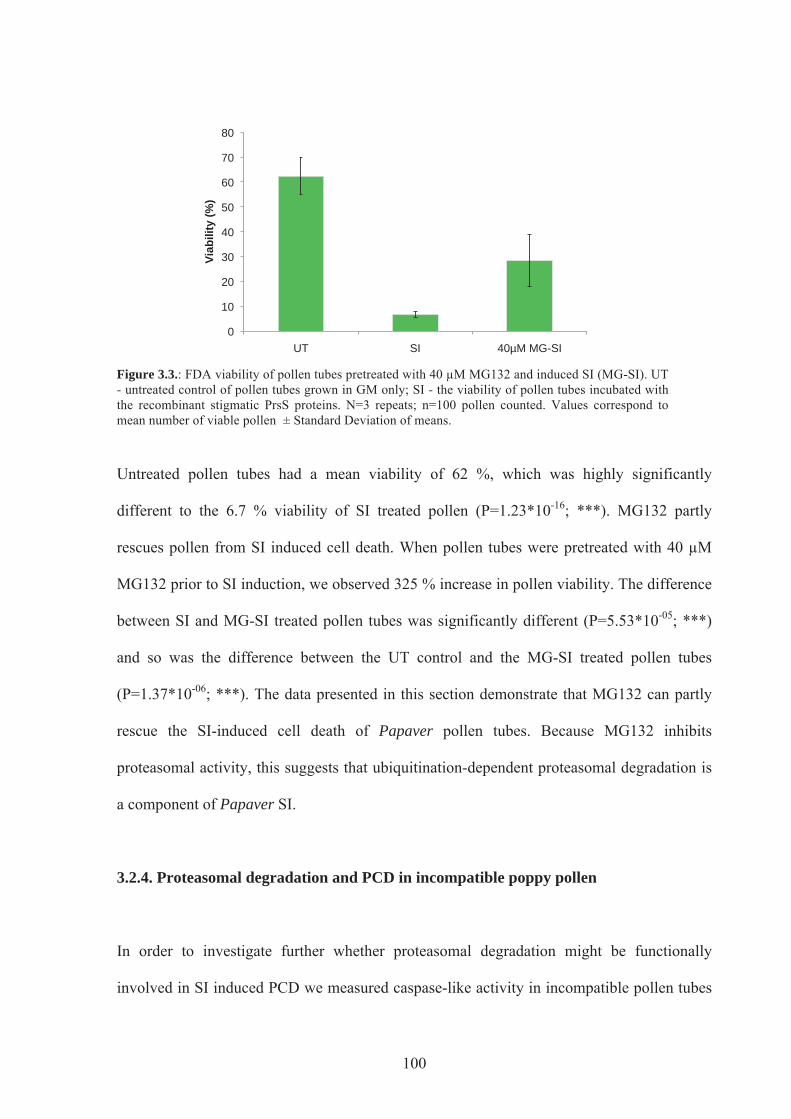
100
Figure 3.3.: FDA viability of pollen tubes pretreated with 40 µM MG132 and induced SI (MG-SI). UT - untreated control of pollen tubes grown in GM only; SI - the viability of pollen tubes incubated with the recombinant stigmatic PrsS proteins. N=3 repeats; n=100 pollen counted. Values correspond to mean number of viable pollen ± Standard Deviation of means.
Untreated pollen tubes had a mean viability of 62 %, which was highly significantly
different to the 6.7 % viability of SI treated pollen (P=1.23*10-16; ***). MG132 partly
rescues pollen from SI induced cell death. When pollen tubes were pretreated with 40 µM
MG132 prior to SI induction, we observed 325 % increase in pollen viability. The difference
between SI and MG-SI treated pollen tubes was significantly different (P=5.53*10-05; ***)
and so was the difference between the UT control and the MG-SI treated pollen tubes
(P=1.37*10-06; ***). The data presented in this section demonstrate that MG132 can partly
rescue the SI-induced cell death of Papaver pollen tubes. Because MG132 inhibits
proteasomal activity, this suggests that ubiquitination-dependent proteasomal degradation is
a component of Papaver SI.
3.2.4. Proteasomal degradation and PCD in incompatible poppy pollen
In order to investigate further whether proteasomal degradation might be functionally
involved in SI induced PCD we measured caspase-like activity in incompatible pollen tubes
0
10
20
30
40
50
60
70
80
UT SI 40µM MG-SI
Viab
ility
(%)
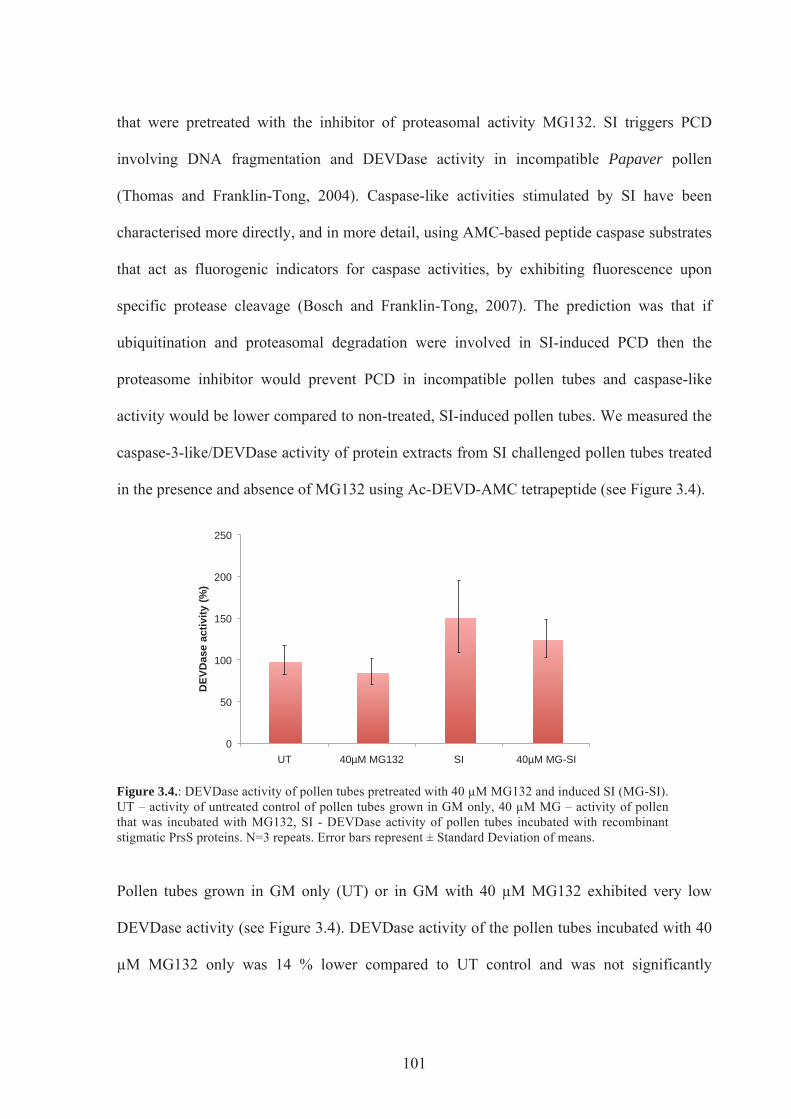
101
that were pretreated with the inhibitor of proteasomal activity MG132. SI triggers PCD
involving DNA fragmentation and DEVDase activity in incompatible Papaver pollen
(Thomas and Franklin-Tong, 2004). Caspase-like activities stimulated by SI have been
characterised more directly, and in more detail, using AMC-based peptide caspase substrates
that act as fluorogenic indicators for caspase activities, by exhibiting fluorescence upon
specific protease cleavage (Bosch and Franklin-Tong, 2007). The prediction was that if
ubiquitination and proteasomal degradation were involved in SI-induced PCD then the
proteasome inhibitor would prevent PCD in incompatible pollen tubes and caspase-like
activity would be lower compared to non-treated, SI-induced pollen tubes. We measured the
caspase-3-like/DEVDase activity of protein extracts from SI challenged pollen tubes treated
in the presence and absence of MG132 using Ac-DEVD-AMC tetrapeptide (see Figure 3.4).
Figure 3.4.: DEVDase activity of pollen tubes pretreated with 40 µM MG132 and induced SI (MG-SI). UT – activity of untreated control of pollen tubes grown in GM only, 40 µM MG – activity of pollen that was incubated with MG132, SI - DEVDase activity of pollen tubes incubated with recombinant stigmatic PrsS proteins. N=3 repeats. Error bars represent ± Standard Deviation of means.
Pollen tubes grown in GM only (UT) or in GM with 40 µM MG132 exhibited very low
DEVDase activity (see Figure 3.4). DEVDase activity of the pollen tubes incubated with 40
µM MG132 only was 14 % lower compared to UT control and was not significantly
0
50
100
150
200
250
UT 40µM MG132 SI 40µM MG-SI
DEV
Das
e ac
tivity
(%)

102
different (P=0.143; nonsignificant). DEVDase activity increased by 52 % in pollen tubes
where the SI response was induced by recombinant stigmatic PrsS proteins, and this increase
was significant compared to the UT control (P=0.021, *). Pollen tubes that were pretreated
with 40 µM MG132 before the SI was induced exhibited 26 % lower DEVDase activity
compared to the SI samples. The inhibition of proteasomal activity affected DEVDase
activity (P=0.046; *). Pollen tubes that were pretreated with 40 µM MG132 before the
incompatible response was triggered were also significantly different compared to pollen
tubes that were incubated with 40 µM MG132 only or with UT control (P=0.034 and
P=0.014, respectively; *). These data, presented in Figure 3.4., demonstrate that the
inhibition of proteasomal activity by MG132 had a small but significant effect on pollen
tubes as it partly inhibited the DEVDase activity. It suggests a potential link between
DEVDase activity and proteasomal activity in incompatible Papaver pollen tubes, even
though the DEVDase activity stimulated by SI was not very high and MG132 did not reduce
activity very much.
3.2.5. Effect of proteasomal inhibition by MG132 on the ubiquitination levels in
incompatible pollen tubes
In the previous sections we provided preliminary evidence that proteasomal degradation
might play a role during the SI reaction in poppy pollen tubes. As ubiquitination via Lys48 is
tightly connected with the proteasomal degradation we wished to determine whether the
levels of ubiquitination might change upon SI in Papaver pollen. Proteins were extracted
from poppy pollen tubes pretreated with 40 µM MG132 before the induction of SI by

103
recombinant stigmatic PrsS and controls, and run on a SDS-PAGE, blotted and then probed
with α-ubiquitin antibody. Figure 3.5.a shows the pattern of ubiquitination of total protein
extracts. Figure 3.5.b shows corresponding relative light intensity evaluation of the blot.
a
b
Figure 3.5.: Ubiquitination levels of poppy pollen pretreated with 40 µM MG132 and SI induced (a) Representative image of western blot of MG-SI protein extracts probed with ubiquitin antibody; (b) percentage of average relative light intensity of ubiquitinated protein extracts; N=4, Error bars represent ± St. Error. GM – extract from untreated pollen; 40MG GM – extract from pollen incubated in 40 µM MG132; SI – extract from pollen that had induced SI reaction; 40 MG SI – extract from pollen that was pretreated with 40 µM MG13 before the induction of SI by PrsS proteins.
The ubiquitination signal was measured on the whole band of the western blot. The
untreated pollen sample was given value 100 %. When tubes were grown in GM with the
proteasome inhibitor MG132 the level of ubiquitination increased by 133 % due to the
probable inhibition of proteasomal degradation, so more ubiquitinated proteins appeared to
be accumulated in the pollen tubes. When SI was induced, the level of ubiquitination was
more intense by 39 % compared to the control UT sample, suggesting that ubiquitination
was increased by the SI response. The strongest signal was obtained when samples were
pretreated with proteasome inhibitor before inducing SI and despite the increase in
ubiquitination by MG132 on its own, this could implicate a possible role for ubiquitin-
dependent proteasomal degradation during SI responses.
0
50
100
150
200
250
300
350
400
UT 40µM MG132 SI 40µM MG-SI
Ligh
t int
enis
ty (%
)

104
3.2.6. Proteasomal degradation acts upstream or in parallel with caspase-3-like activity
In order to determine whether proteasomal degradation of proteins acts upstream,
downstream or together with caspase-like activity, MG132 was added to the protein extracts
and DEVDase activity was measured. If proteasomal degradation acts downstream of
DEVDases, then it would be expected that there would be no changes in the level of
DEVDase activity, but if it acts upstream or in cooperation with caspase-3 like enzymes,
then we would expect to see an increase or decrease in DEVDase activity.
Proteins of pollen tubes treated with incompatible PrsS-proteins and control pollen tubes
were extracted as described in the materials and methods section. In these extracts,
DEVDase activity was already stimulated by SI before the extracts were mixed with 40 µM
MG132 and the control sample was mixed with DMSO, which was the solvent for MG132
(see Figure 3.6).
Figure 3.6.: Caspase activity of pollen tubes with induced SI and added 40 µM MG132 in the pollen tube extract (MG-SI). SI presents the DEVDase activity of pollen incubated with the recombinant stigmatic PrsS proteins; SI-DMSO presents activity of pollen that had added DMSO in the SI pollen tube extract; N=3 repeats. Error bars represent ± Standard Deviation of means.
0
20
40
60
80
100
120
140
SI SI-DMSO SI-MG
DEV
Das
e A
ctiv
ity (%
)
105
As can be seen from Figure 3.6, the DEVDase activity of SI extracts with added inhibitor of
proteasomal activity MG132 was significantly decreased by 15 % compared to SI induced
DEVDase activity (P=0.026; *). The DMSO solvent had no effect on the DEVDase activity
when added to the SI challenged pollen protein extract (P=0.963, NS), indicating that the
proteasome inhibitor MG132 reduces the DEVDase activity.
These data suggest that inhibition of proteasomal activity by MG132 in incompatible
Papaver pollen tubes has a small but significant effect on activated caspases and that it acts
upstream or alongside of caspase-3 like activation.
3.2.7. Caspase-3 inhibitor decreases ubiquitination
In order to make a firmer connection between PCD in poppy SI and ubiquitination, an
experiment using the caspase-3 inhibitor, Ac-DEVD-CHO, was performed. Pollen tubes
were pretreated for 1 h with Ac-DEVD-CHO and then challenged with incompatible
stigmatic recombinant PrsS-proteins for 3 different time points: 1 h, 2 h and 4 h. Total
protein extracts were separated by SDS-PAGE gel, and blotted and probed with an anti-
ubiquitin antibody (see Figure 3.7). Figure 3.7.a shows the ubiquitinated protein pattern in
pollen tube samples with induced SI at three different time-points. The ubiquitination levels
were higher with SI samples compared to samples that were pretreated with the inhibitor of
caspase-3-like activity, Ac-DEVD-CHO and then SI challenged.
The relative signal intensity of the ubiquitination pattern was measured using Quantity One
software (see Figure 3.7.b). Ubiquitination in the Papaver pollen that was incubated with the
incompatible stigmatic PrsS recombinant proteins increases with the time of SI challenge.

106
When caspase-3-like activity was inhibited, there was ~20 % less ubiquitination of proteins,
however, with the increasing time of SI challenge, the ubiquitination levels increased as
well.
a
b
Figure 3.7.: Protein ubiquitination levels in poppy pollen tubes pretreated with an inhibitor of caspase activity (Ac-DEVD-CHO) and SI challenged at three different time points: 1 h, 2 h and 4 h. Untreated pollen tubes germinated in GM are a negative control at t0 and 4 h (blue outline) (a) western blot probed with ubiquitin antibody, tubulin presents a control for equal loading; (b) relative light intensity of ubiquitination levels, blue outline presents untreated control, red outline presents samples with induced SI and yellow outline presents samples pretreated with Ac-DEVD-CHO and then SI induced. (N=1)
The experiment was carried out only once, so a firmer conclusion would require more
repeats. However, taken together these data indicate that during SI in incompatible Papaver
pollen tube increased ubiquitination of yet unknown protein targets occur, which are
probably targeted for degradation by the 26S proteasome. This SI-specific ubiquitination of

107
proteins is connected with the caspase-3-like activity, which, based on previous results, acts
upstream or in parallel with the UbP pathway in the incompatible Papaver pollen tube.
3.2.8. Involvement of an E3 ligases in Papaver SI
The E3 ligase AtPUB17 and its tobacco homologue NtACRE276 were demonstrated to play
a functional role in the HR cell death in tobacco and A. thaliana, mediated by the resistance
proteins (Yang et al., 2006). In a screen for interactors of the ARM domain of PUB17,
(Sadanandom et al., 2008) isolated the POB1 protein. AtPOB1 belongs to the family of
BTB/POZ transcriptional repressors and is localised in the nucleus during HR. Dr Ari
Sadanandom (University of Durham) provided antibodies against PUB17 and POB1
proteins. We wished to investigate further the involvement of UbP pathway in the SI in
Papaver. If this was the case, there might be some functional homologues of PUB17 and
POB1 activated in the Papaver pollen tube system, recognized by the antibodies. If the
proteins could be identified, we could investigate further their possible involvement in the SI
in Papaver.
While anti-PUB17 antibody (PUB17 with Mw 83 kDa) did not recognise any specific
protein (Figure 3.8.a), anti-POB1 antibody (POB1 with Mw 65 kDa) recognised distinct
proteins in poppy pollen tube extracts (Figure 3.8.b).

108
a
b
Figure 3.8: Protein expression of putative homologues of AtPUB17 and AtPOB1 E3 ligases during SI in Papaver (a) AtPUB17 antibody did not recognise any specific protein homologue at 83 kDa during SI in Papaver. (b) AtPOB1 (Mw 65 kDa) recognised a putative homologue at 63 kDa. Another two protein bands at 37 and 35 kDa were recognised by AtPOB1. Decrease of signal with time of SI suggests that SI triggered their degradation. Tubulin was used for equal loading.
PUB17 antibody resulted in a smear, with some weaker bands visible at low molecular
weights. Signal intensity of the poppy pollen extract detected with AtPUB17 decreased with
the time of SI incubation, but this was also the case with untreated pollen. However, when
testing whether the AtPOB1 antibody could recognise an equivalent protein during SI in
Papaver pollen, we observed a distinct band at 63 kDa and two lower ones at 37 and 35 kDa.
Whereas the higher molecular weight band probably corresponds to the POB1 protein (Mw
65 kDa), the lower bands might be degradation products (Figure 3.8.b), suggesting that SI
triggers its degradation.
A. thaliana AtPOB1 plants were resistant to virulent bacteria, they accumulated ROS and
exhibited HR cell death (A. Sadanandom, personal communication). AtPOB1 represses the
expression of genes that regulate defence against pathogen Pseudomonas (Sadanandom et
al., 2008). If drawing a parallel between HR and SI systems, AtPOB1 homologues
recognised by the POB1 antibody could function by repressing genes required for the SI
toGM 1hSI 2hSI 4hSI 4hGM
98 64
50
36
Mw (kDa) 98
64
50
36
Mw (kDa)
Tubulin
POB1

109
response. Upon SI, putative poppy POB1 homologues may be targeted for degradation, gene
expression is activated and functional SI can occur. Interestingly, AtPOB1 proteins are
localised in the nucleus (Sadanandom et al., 2008). Their localisation has not yet been
examined in the Papaver pollen, however if it is nuclear as well, this could explain their
slow degradation, as it is known that DEVDase activity in Papaver becomes localised in the
vegetative cell and generative nucleus at 5 h SI (Bosch and Franklin-Tong, 2007), although
it was rarely observed in the pollen at 1 or 2 h post SI. This could imply that POB1
homologues in Papaver might be responsible for repressing caspase-3-like activity in
compatible pollen and are being subsequently degraded in incompatible pollen tubes.
3.3. DISCUSSION
Ubiquitin-dependent proteasomal degradation pathway plays a role during SI in Papaver
pollen and is most likely an important component of Papaver SI. In the present study, a
pharmacological approach with the proteasome inhibitor MG132 was used to demonstrate
the role for UbP pathway. A link between PCD and the UbP pathway in incompatible
Papaver pollen was also demonstrated. MG132 is a membrane-permeable peptide aldehyde
with chymotrypsin-like inhibitory activity. The treatment of poppy pollen with the selective
proteasome inhibitor MG132 slightly altered tube morphology and decreased the length of
pollen tubes in a concentration-dependent manner.
UbP pathway is involved in kiwifruit pollen tube organization, germination and
maintanance of polarized pollen tube growth as ubiquitin and its conjugates were localized

110
mainly in the apex of pollen tubes (Scoccianti et al., 2003, Speranza et al., 2001). When
proteasomal degradation was inhibited by MG132 dramatic changes to the morphology of
pollen tube were observed, such as inhibition of pollen tube growth and pollen tube tip
swelling and branching, and germination of more than one tube per grain, which was also
observed in Picea pollen (Scoccianti et al., 2003, Sheng et al., 2006, Speranza et al., 2001).
However the effects of the inhibitor were reversible since the removal of inhibitor restored
growth. Those effects were not so dramatic in case of Antirrhinum pollen, although some
pollen tube tips appeared to be swollen (Qiao et al., 2004b). Similar response was observed
in Papaver pollen germination with severe pollen tube alterations at concentrations of
MG132 exceeding 40 μM. The alterations in pollen tube morphology suggest that UbP
activity is required for normal pollen tube growth and development in Papaver. As pollen
tube growth was affected by MG132 at higher concentrations, 40 μM concentration was
chosen for the experiments on Papaver pollen.
It is well established that the UbP pathway, and more precisely E3 ubiquitin ligases play a
role in the sporophytic SI (Yee and Goring, 2009, Tantikanjana et al., 2010) and in the S-
RNase based gamethophytic SI (Meng et al., 2011). MG132 inhibited compatible pollination
in Antirrhinum, but had little effect on incompatible pollination in vitro or in vivo (Qiao et
al., 2004b). During compatible pollination the level of ubiquitinated S-RNases was
significantly higher than during incompatible pollination in Antirrhinum and Petunia (Hua
and Kao, 2006, Qiao et al., 2004b). The S-RNase degradation model was based on these
findings. It was postulated that pollen determinant of S-RNAse based SI, SLF, specifically
detoxifies non-self S-RNases via the UbP pathway allowing compatible pollinations and
thus indicating that non-self pollen tubes might have been protected by specific degradation

111
of non-self S-RNases, while self-S-RNases remained active in self-pollen tubes (Zhang and
Xue, 2008, Takayama and Isogai, 2005). The new model of collaborative non-self
recognition in S-RNase-based SI, revealed by Kubo et al., (2010) now predicts that there are
multiple types of SLF genes in pollen and the product of each type of SLF (Sx-SLF)
interacts with a subset of non-self S-RNases.
In Papaver, the ubiquitination was implicated to play a role during the SI response, rather
than during the SC response. In incompatible pollen tube extract, an increased ubiquitination
of yet unknown proteins was detected that is connected with the caspase-3-like activity,
which acts downstream or in parallel with the UbP pathway.
The 26S proteasomal degradation was also demonstrated to play a role during SI in
Brassica, where activated SRK targeted E3 U-box ligase ARC1 to the proteasome, thus
implicated to mediate the UbP pathway (Stone et al., 2003). Suppression of ARC1 in
Brassica or incubation of Brassica stigmas with the proteasome inhibitors can lead to the
breakdown of SI response (Stone et al., 1999, Stone et al., 2003). Following incompatible
pollination, ARC1 targets substrate proteins, presumably compatibility factors, and their
degradation by the 26S proteasome results in pollen rejection (Samuel et al., 2011).
Ubiquitin-dependent protein degradation is also important during plant-pathogen interactions
and plant responses to the environmental factors (Dielen et al., 2010). Vacca et al.,(2007)
demonstrated that decreased cell viability due to heat shock (HS) in tobacco BY2 cells was
rescued by pretreatment with MG132, showing that the impairment of the proteasome
function results in the prevention of cell death. Inhibition of the proteasomal degradation by
MG132 also rescued the loss of viability in yeast cells undergoing acetic acid induced PCD
(Valenti et al., 2008), and tungsten induced loss of viability in pea root cells (Adamakis et

112
al., 2011). The inhibition of proteasomal degradation inhibited length of tracheary elements
in Zinnia cell cultures and also in A. thaliana (Zhao et al., 2008). Thus, the examples stated
above indicate that proteasomal activity is involved in and is required for cell death in plant
cells.
A similar picture was observed in Papaver SI, when the viability of incompatible pollen
tubes was significantly restored when proteasomal degradation was inhibited by MG132
confirming the involvement of proteasomal degradation in the SI response in Papaver
pollen. The use of proteasome inhibitors also allowed for the demonstration of the role of
proteasomal degradation in PCD.
A direct link between proteasome-dependent degradation and plant PCD was established by
Hatsugai et al., (2009). By using caspase-3 inhibitors, proteasome inhibitors and RNAi lines
of the proteasome β-subunits, which possess proteolytic activity β1 (PBA), β2 (PBB) and β5
(PBE), they demonstrated that the proteasome was directly involved in bacteria-induced
vacuole membrane and plasma membrane fusion and consequently hypersensitive cell death.
Moreover, they identified that the proteasomal subunit PBA1 acts as a caspase-3-like
enzyme.
The data, presented above confirm that caspase-3-like activity of SI samples was
significantly higher compared to that in the untreated control pollen, while caspase-3-like
activity of pollen tubes in which proteasomal degradation had been inhibited before
induction of SI was significantly decreased although not to same level as control. This
demonstrates that caspase-3-like activated PCD in poppy SI requires proteasome activation.
Taking into account that the proteasomal subunit PBA1 acts as a caspase-3-like enzyme in A.

113
thaliana, it is tempting to suggest that the same happens in Papaver (Hatsugai et al., 2009).
This was not tested as this work was conducted before the report by Hatsugai et al., (2009)
was published; nevertheless, some parallels can be drawn.
Molecular mechanisms of SI share similarities with the histocompatibility in animals as well
as with the hypersensitive response in plant-pathogen incompatible interaction as all these
mechanism require high degree of recognition specificity to recognise between self and non-
self. Recognition specificity during plant-pathogen response requires highly polymorphic
resistance genes, and it involves a specific interaction between receptor at the epidermal cell
surface and its cognate peptide ligands from pathogen (Coll et al., 2011). When a microbial
pathogen invades the plant tissue, a defence mechanism is initiated in the plant that triggers
signalling cascade of downstream events leading to inhibition of growth of plant cells in
order to prevent spread of the pathogens. Downstream signalling events are strikingly
similar to downstream events during Papaver SI: influx in cytosolic calcium, alterations of
the actin cytoskeleton, activation of ROS, activation of caspase-like proteins and cell death.
Some molecules were also implicated to play a role during SI and pathogen response, such
as tobacco S-like RNase NE, that share similarities with RNases determining the specificity
of the S-RNase based SI, inhibited the hyphal elongation of plant pathogens (Hugot et al.,
2002, Dodds et al., 1996). Additionally, thioredoxin, that is implicated to negatively regulate
Brassica SRK in the absence of SCR, was demonstrated to also negatively regulate
Cladosporum fulvum-9 (Cf-9) (Cabrillac et al., 2001, Rivas et al., 2004). The incompatible
interaction between Cf9, a membrane anchored glycoprotein and Avr9, a secreted protein,
elicit a hypersensitive response and cell death. The interaction between Avr9 and Cf9 was
also used when AtPUB17 protein was identified (Yang et al., 2006). PUB17 is an E3 ligase
114
that acts as positive regulator of cell death and defense responses in Solanaceae and
Brassicaceae (Yang et al., 2006). PUB17 restored functional HR in plants that had HR
impaired due to silencing of Cf9 (Yang et al., 2006).
The incompatible interaction between Cf9, a membrane anchored glycoprotein and Avr9, a
secreted protein, resulted in cell death. This is similar to the incompatible interaction
between the pollen transmembrane protein, PrpS, and secreted stigmatic protein, PrsS, which
also results in cell death in Papaver pollen. A collaboration with Dr. Ari Sadanandom,
resulted in testing anti-PUB17 antibody during SI response in Papaver, as well as another
E3 ligase, named POB1, that was identified as PUB17 interacting protein (A. Sadanandom,
personal communiacation). Using antibodies against AtPOB1 the potential poppy
homologues of POB1 were detected and their abundance changed over time, implicating a
role for POB1 homologues during Papaver SI. Nuclei localised AtPOB1 act as a negative
regulator of PCD, as plants that were deficient in POB1 produced spontaneous cell death
(Sadanandom et al., 2008). A. thaliana AtPOB1 plants were resistant to virulent bacteria,
they accumulated ROS and exhibited HR cell death (A. Sadanandom, personal
communication). AtPOB1 represses the expression of genes that regulate defence against
pathogen Pseudomonas (Sadanandom et al., 2008). If drawing a parallel between HR and SI
systems, AtPOB1 homologues in Papaver, recognised by POB1 antibody, could function by
repressing genes required for SI response. Interestingly, AtPOB1 proteins are localised in the
nucleus (Sadanandom et al., 2008). Their localization was not yet examined in the Papaver
pollen, however, if it is nuclear as well, this could explain their slow degradation, as it is
known that DEVDase activity in Papaver peaks at 5 h of SI and becomes localised in the
vegetative cell and generative nucleus (Bosch and Franklin-Tong, 2007), while it was rarely
observed in the pollen at 1 or 2 h post SI. If POB1-like proteins act as negative regulators of
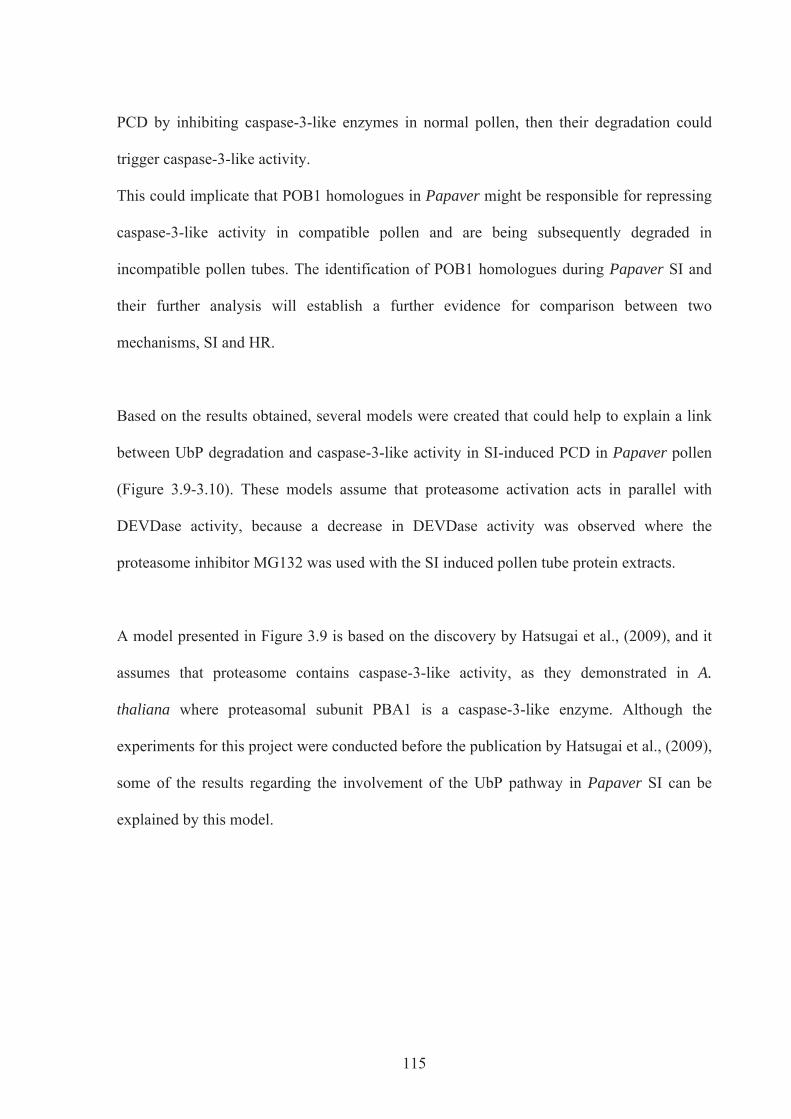
115
PCD by inhibiting caspase-3-like enzymes in normal pollen, then their degradation could
trigger caspase-3-like activity.
This could implicate that POB1 homologues in Papaver might be responsible for repressing
caspase-3-like activity in compatible pollen and are being subsequently degraded in
incompatible pollen tubes. The identification of POB1 homologues during Papaver SI and
their further analysis will establish a further evidence for comparison between two
mechanisms, SI and HR.
Based on the results obtained, several models were created that could help to explain a link
between UbP degradation and caspase-3-like activity in SI-induced PCD in Papaver pollen
(Figure 3.9-3.10). These models assume that proteasome activation acts in parallel with
DEVDase activity, because a decrease in DEVDase activity was observed where the
proteasome inhibitor MG132 was used with the SI induced pollen tube protein extracts.
A model presented in Figure 3.9 is based on the discovery by Hatsugai et al., (2009), and it
assumes that proteasome contains caspase-3-like activity, as they demonstrated in A.
thaliana where proteasomal subunit PBA1 is a caspase-3-like enzyme. Although the
experiments for this project were conducted before the publication by Hatsugai et al., (2009),
some of the results regarding the involvement of the UbP pathway in Papaver SI can be
explained by this model.

116
Figure 3.9.: Model of proteasomal degradation and caspase-3-like activation assumes that proteasome contains caspase-3-like activity. During the SI (yellow star) the proteins targeted for degradation are tagged with Ub via Lys48 residue. When the chain is long enough, proteins are degraded by the 26S proteasome and the model assumes that among them are also proteins with DEVD motif, recognised by DEVDases within the proteasome (yellow circles). During an SI we observed an increase in ubiquitinated proteins as well as increase in DEVDase activity. Substrate for caspase-3-like enzymes is represented as a fluorescent probe attached to DEVD tetrapeptide used in caspase-like assays, Ac-DEVD-AMC
The Ac-DEVD-AMC substrate (used for illustration), substrates for caspase-3-like enzymes,
and additional unknown proteins, are first tagged by ubiquitin molecules and targeted for the
proteasomal degradation. Thus we can explain the increase in ubiquitination levels observed
by western blot in SI induced pollen extracts. Once in the proteasome, the catalytic subunit
(i.e. caspase-3-like enzyme) cleaves the substrate. When the proteasomal degradation is
inhibited by MG132, the decrease in DEVDase activity is observed, which is explained by
the model (Figure 3.6. and 3.9). MG132 inhibits proteasomal degradation of short-lived
proteins, so it is assumed that proteasomal degradation is not completely inhibited, which
would explain why there is not a complete decrease in DEVDase activity (Figure 3.6). In
order to test this model we would need to use more specific inhibitors of proteasomal
activity, blocking the catalytic subunit, such as Ac-APnLD-CHO (Hatsugai et al., 2009).
However, this model cannot explain why there is less ubiquitination in pollen if we inhibit
DEVDase activity by Ac-DEVD-CHO before the SI induction (Figure 3.7). If the model is
correct, we should observe more ubiquitinated proteins as the proteasomal degradation and
Ub
SI
Ub
Lys48 Ub tagged protein
Proteasomal degradation of proteins
DEVDase activity
Ub
DE VD
Ub Ub
Ub Ub Ub Ub
Ub
Ub Ub
Ub
Ub Ub
AMC
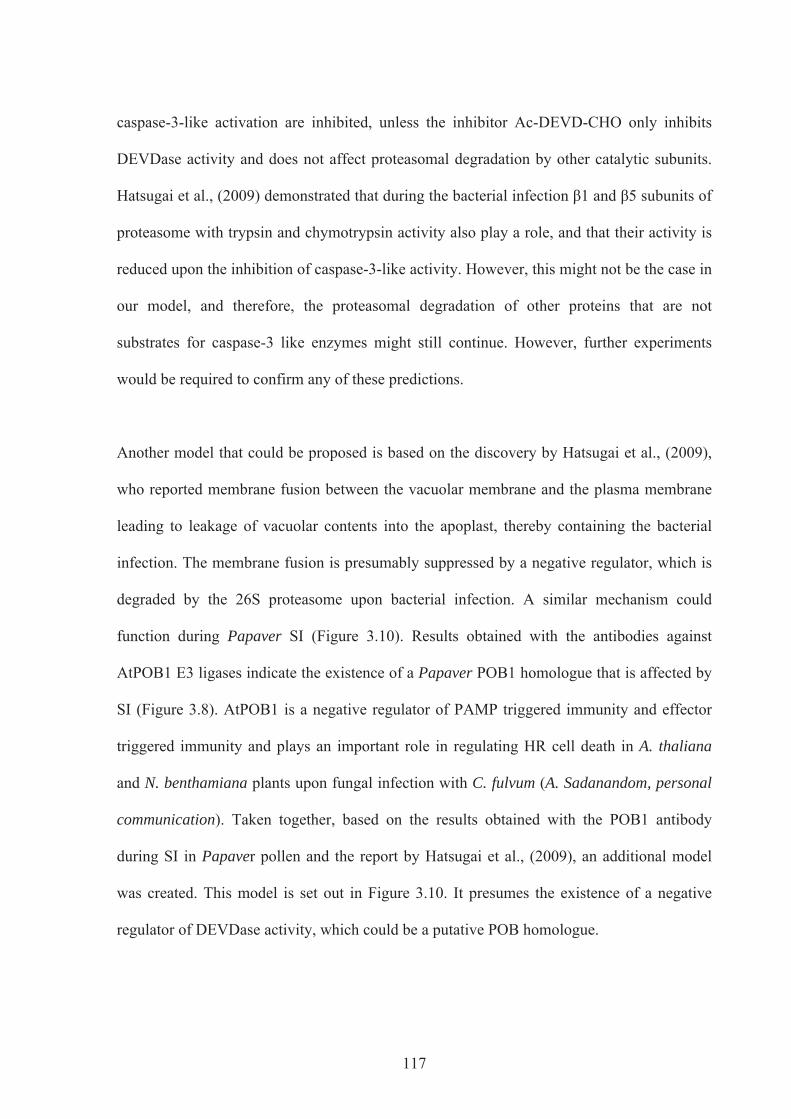
117
caspase-3-like activation are inhibited, unless the inhibitor Ac-DEVD-CHO only inhibits
DEVDase activity and does not affect proteasomal degradation by other catalytic subunits.
Hatsugai et al., (2009) demonstrated that during the bacterial infection β1 and β5 subunits of
proteasome with trypsin and chymotrypsin activity also play a role, and that their activity is
reduced upon the inhibition of caspase-3-like activity. However, this might not be the case in
our model, and therefore, the proteasomal degradation of other proteins that are not
substrates for caspase-3 like enzymes might still continue. However, further experiments
would be required to confirm any of these predictions.
Another model that could be proposed is based on the discovery by Hatsugai et al., (2009),
who reported membrane fusion between the vacuolar membrane and the plasma membrane
leading to leakage of vacuolar contents into the apoplast, thereby containing the bacterial
infection. The membrane fusion is presumably suppressed by a negative regulator, which is
degraded by the 26S proteasome upon bacterial infection. A similar mechanism could
function during Papaver SI (Figure 3.10). Results obtained with the antibodies against
AtPOB1 E3 ligases indicate the existence of a Papaver POB1 homologue that is affected by
SI (Figure 3.8). AtPOB1 is a negative regulator of PAMP triggered immunity and effector
triggered immunity and plays an important role in regulating HR cell death in A. thaliana
and N. benthamiana plants upon fungal infection with C. fulvum (A. Sadanandom, personal
communication). Taken together, based on the results obtained with the POB1 antibody
during SI in Papaver pollen and the report by Hatsugai et al., (2009), an additional model
was created. This model is set out in Figure 3.10. It presumes the existence of a negative
regulator of DEVDase activity, which could be a putative POB homologue.

118
a
b
c
(continues on the next page)
Normal pollen tube growth
POB1 homologue;
negative regulator of DEVDase
activity
POB1 homologue
Ub Ub
Ub
SI
Ub Ub Ub Ub
Ub Ub
Ub Ub
POB1 homologue
Ub Ub
Ub
SI
Ub Ub Ub Ub
MG132
Ub
Ub

119
d
Figure 3.10.: Model that assumes the existence of negative regulator of DEVDase activity, possibly POB1 homologue (a) model assumes that during Papaver pollen tube growth, the hypothetical negative regulator of DEVDase activity, possibly POB1 homologue, is regulating the inactivity of DEVDases (b) During SI, negative regulator is tagged by UB through Lys48 residue and targeted for 26S proteasomal degradation and DEVDase activity is increased. Presumably there are also feedback loops between DEVDase activity and proteasomal degradation and DEVDase activity and negative regulator, (c) upon pretreating pollen with proteasomal inhibitor MG132 before SI, the accumulation of Ub is observed as well as decrease in DEVDase activity. Negative regulator is still ubiquitinated but not degraded as proteasomal activity is inhibited (d) when pollen in pretreated with DEVDase inhibitor Ac-DEVD-CHO prior to SI, DEVDase activity is inhibited and this inhibition could feedback to negative regulator, so it is not ubiquitinated anymore. Therefore negative regulator presumes its role and act in concert with DEVDase inhibitor to downregulate DEVDases. Assuming that the proteasomal activity acts upstream of DEVDase activity it is not affected, the degradation of other ubiquitinated proteins targeted during SI is undisturbed.
The model presented in Figure 3.10.a assumes that during normal undisturbed pollen tube
growth, DEVDase activity is inhibited by a negative regulator, that could be a P. rhoeas
POB1 homologue. Upon SI (Figure 3.10.b) the negative regulator is tagged by a chain of
ubiquitins, connected by Lys48 and degraded by the 26S proteasome, thus releasing
DEVDase activity. The model also assumes a feedback loop between the negative regulator,
the 26S proteasome and DEVDase activity. If the proteasomal degradation is inhibited by
MG132, then, as known from the results, DEVDase activity is reduced and due to the
feedback loop, the ubiquitination of the negative regulator might be reduced, thus re-
activating the inhibitor of DEVDase activity (Figure 3.10.c). However, ubiquitination of
Ub Ub
Ub
SI
Ub Ub Ub Ub
POB1 homologue
Ub Ub
Ub Ub
DEVD-CHO
Ub
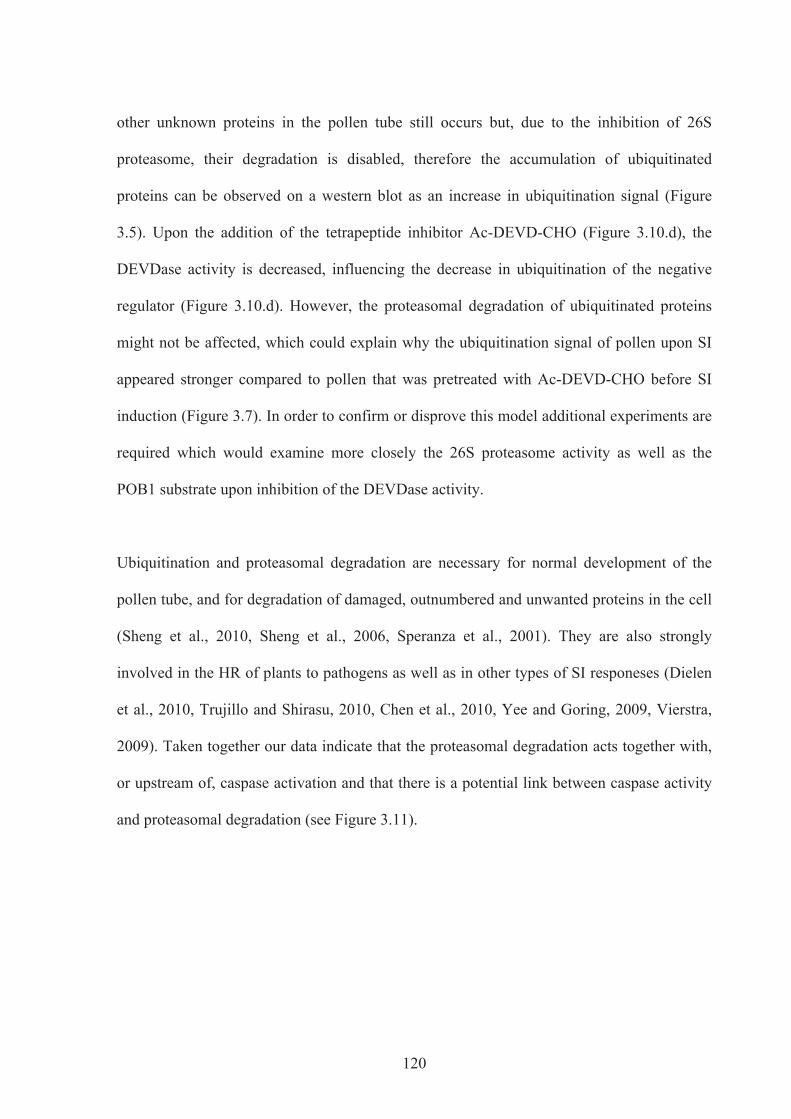
120
other unknown proteins in the pollen tube still occurs but, due to the inhibition of 26S
proteasome, their degradation is disabled, therefore the accumulation of ubiquitinated
proteins can be observed on a western blot as an increase in ubiquitination signal (Figure
3.5). Upon the addition of the tetrapeptide inhibitor Ac-DEVD-CHO (Figure 3.10.d), the
DEVDase activity is decreased, influencing the decrease in ubiquitination of the negative
regulator (Figure 3.10.d). However, the proteasomal degradation of ubiquitinated proteins
might not be affected, which could explain why the ubiquitination signal of pollen upon SI
appeared stronger compared to pollen that was pretreated with Ac-DEVD-CHO before SI
induction (Figure 3.7). In order to confirm or disprove this model additional experiments are
required which would examine more closely the 26S proteasome activity as well as the
POB1 substrate upon inhibition of the DEVDase activity.
Ubiquitination and proteasomal degradation are necessary for normal development of the
pollen tube, and for degradation of damaged, outnumbered and unwanted proteins in the cell
(Sheng et al., 2010, Sheng et al., 2006, Speranza et al., 2001). They are also strongly
involved in the HR of plants to pathogens as well as in other types of SI responeses (Dielen
et al., 2010, Trujillo and Shirasu, 2010, Chen et al., 2010, Yee and Goring, 2009, Vierstra,
2009). Taken together our data indicate that the proteasomal degradation acts together with,
or upstream of, caspase activation and that there is a potential link between caspase activity
and proteasomal degradation (see Figure 3.11).

121
Figure 3.11.: Schematic model of the SI response in Papaver. Upon the interaction of secreted stigmatic PrsS proteins and pollen transmembrane protein PrpS, a downstream signalling network is triggered, starting with an increase in K+ and [Ca2+]i who is signalling to the inhibition of pyrophosphatase activity and pollen tube tip growth, activation of MAPK, depolymerization of actin and microtubule cytoskeleton and appearance of punctate actin foci, activation of ROS and NO and activation of caspase-like activities, leading to the PCD of the pollen tube. The model presents DEVDase activity that most likely acts in parallel with proteasomal degradation. DEVDaases are presented as yellow circles within the proteasome, as identified by Hatsugai et al., (2009).
However, in order to establish a clearer position of the UbP pathway on the SI timeline in
Papaver pollen, and to draw further parallels between SI and HR, additional experiments
would be required investigating proteasome inhibition, finding targets of ubiquitination
during SI and specifying the role of the P. rhoeas POB1 homologue. In order to specifically
elucidate the relationship between proteasome and DEVDases, and to determine whether
DEVDase activity is part of the proteasome or acts separately, biochemical and imaging
assays should be performed.
Gu et al., (2010) developed a membrane permeable fluorescent probe, MV151, containing a
vinyl sulphone reactive group and Bodipy fluorescent group, that bind to the plant
proteasome in an activity-dependent manner and could be used for live cell imaging of
proteasome activities as well as quantification by protein gels during SI in Papaver pollen in
PrsS proteins
S1 pollen tube
Microtubule Cytoskeleton
Pr-p26.1 Pr-p26.1
p56 p56 P
sS1
DEVDase
[Ca2+]i
P
ROS & NO
sS3
Actin Cytoskeleton
Inhibition of pollen tube tip growth
ABPs
sS3
sS1
= ?
Nonspecific cation channel
Ub Ub Ub Ub
Ub Ub Ub
Proteasomal degradation
and DEVDAse
activity
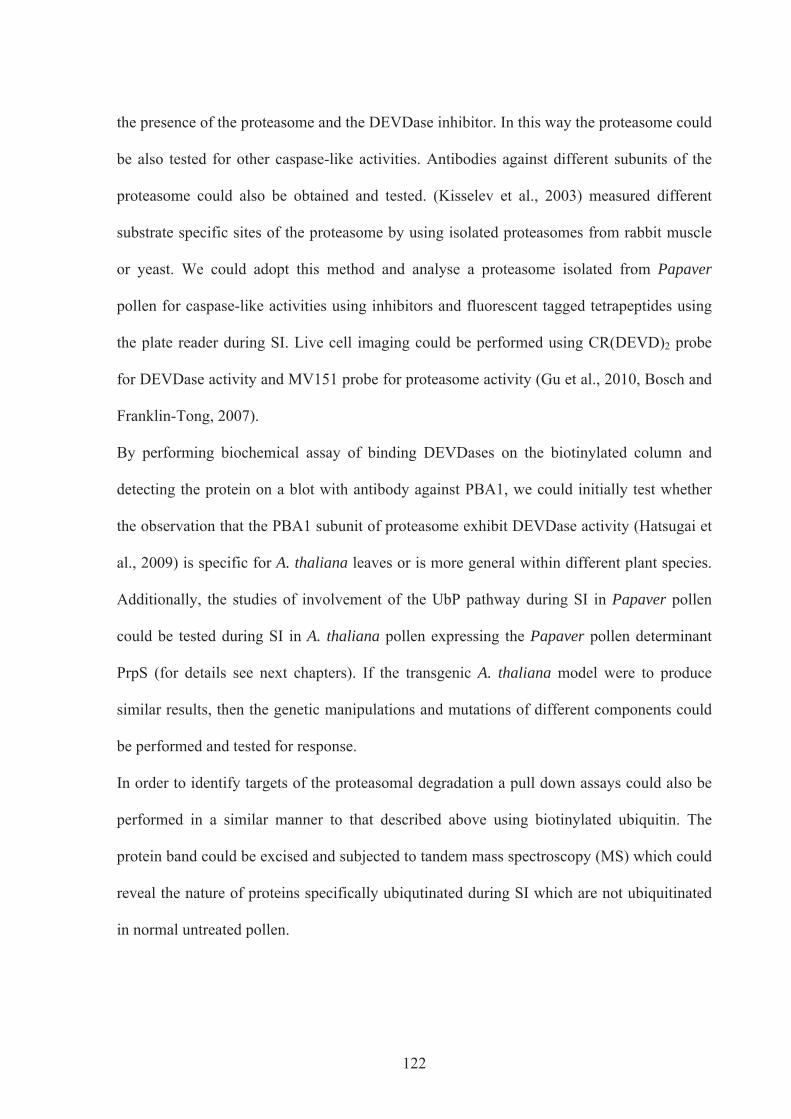
122
the presence of the proteasome and the DEVDase inhibitor. In this way the proteasome could
be also tested for other caspase-like activities. Antibodies against different subunits of the
proteasome could also be obtained and tested. (Kisselev et al., 2003) measured different
substrate specific sites of the proteasome by using isolated proteasomes from rabbit muscle
or yeast. We could adopt this method and analyse a proteasome isolated from Papaver
pollen for caspase-like activities using inhibitors and fluorescent tagged tetrapeptides using
the plate reader during SI. Live cell imaging could be performed using CR(DEVD)2 probe
for DEVDase activity and MV151 probe for proteasome activity (Gu et al., 2010, Bosch and
Franklin-Tong, 2007).
By performing biochemical assay of binding DEVDases on the biotinylated column and
detecting the protein on a blot with antibody against PBA1, we could initially test whether
the observation that the PBA1 subunit of proteasome exhibit DEVDase activity (Hatsugai et
al., 2009) is specific for A. thaliana leaves or is more general within different plant species.
Additionally, the studies of involvement of the UbP pathway during SI in Papaver pollen
could be tested during SI in A. thaliana pollen expressing the Papaver pollen determinant
PrpS (for details see next chapters). If the transgenic A. thaliana model were to produce
similar results, then the genetic manipulations and mutations of different components could
be performed and tested for response.
In order to identify targets of the proteasomal degradation a pull down assays could also be
performed in a similar manner to that described above using biotinylated ubiquitin. The
protein band could be excised and subjected to tandem mass spectroscopy (MS) which could
reveal the nature of proteins specifically ubiqutinated during SI which are not ubiquitinated
in normal untreated pollen.

123
The role of POB1 should also be analysed more closely. Western analysis using POB1
antibody should be repeated during time progression of the SI. In order to identify a link
between putative PrPOB1 and DEVDase activity, POB1 should be also tested using
inhibitors of proteasome activity and DEVDase activity. To test the model in Figure 3.10,
where POB1 is presented as a negative regulator of SI, it would be interesting to see if it
would be identified on MS. The POB1 sequence should be obtained and the protein could be
inhibited by using designed POB1 antisense oligonucleotides. If POB1 does act as a negative
regulator of SI then an increase in DEVDase activity should be observed even in untreated
Papaver pollen. It would also be interesting to establish a link between POB1, whose A.
thaliana and N. benthamiana homologues are implicated in plant pathogen responses, and
ROS during SI in Papaver pollen.
By performing some of the additional experiments, the possible role of ubiquitination and
proteasomal degradation should be more firmly linked to the SI in Papaver pollen and
further parallels should be established in molecular mechanisms of SI and HR.

124
CHAPTER 4
Investigation of the interaction between
PrpS and PrsS
125
4.1. INTRODUCTION
As mentioned in introduction (section 1.4.3), the recent discovery of PrpS, the Papaver
pollen S-determinant (Wheeler et al., 2009) has identified PrpS as a small, 20 kDa
transmembrane protein, associated with the plasma membrane . It represents a novel class of
receptor as it has no homology to any known protein in the database (Wheeler et al., 2009).
In Papaver, SI is comprised of interaction between the secreted stigmatic PrsS proteins that
act as a ligand to the receptor on the pollen tube. Identification of PrpS therefore strongly
supports the long-standing hypothesis of receptor-ligand – like interaction (Wheeler et al.,
2009).
To establish whether PrpS is functionally involved in the SI response, peptides were first
tested with in vitro SI bioassays. Pollen with the haplotype PrpS1/PrpS3 was challenged with
the incompatible recombinant stigmatic PrsS1 and PrsS3 proteins, which had been incubated
with the PrpS1 peptides. The pollen was ‘rescued’ when peptides were able to block the
receptor-ligand type interaction and so far this was the first indication that the predicted
extracellular region is involved in recognition and that PrpS might mediate pollen inhibition
(Wheeler et al., 2009).
The main aim of this part of the project was to further characterize the binding between PrpS
and PrsS in order to demonstrate that PrpS is the pollen S-determinant. There are several
approaches to characterize and identify regions and residues of protein-protein binding
interaction. Some of them, such as mutagenesis, were not possible due to difficulties to
transform Papaver plants. Other approach that is widely used for protein-protein interaction
is yeast-two-hybrid assay. Some preliminary investigations of interaction between PrpS and

126
PrsS were conducted by Natalie Hadjiosif, that identified a large number of false positive
interactions as the PrsS proteins seem to auto-activate the system, while PrpS appeared toxic
for the cells, presumably due to hydrophobicity of the protein. Considering that PrpS is a
transmembrane protein, most likely adopted yeast-two-hybrid screens would be required,
such as split-ubiquitin (Iyer et al., 2005). However, due to the time constraints we decided to
test the interaction by the slot-blot binding assay, also known as far western assay, by which
the protein of interest is bound on the membrane (on the blot) and not separated by
electrophoresis as with western blot. The membrane is then incubated with binding partner
and the potential interactions detected by specific antibody against binding partner. The far-
western technique using peptide arrays is widely used for the mapping of epitopes and for
the receptor-ligand interactions (Volkmer et al., 2011). Using peptide array and dot blot
assay, a subdomain on Brassica stigmatic SRK was identified, that has an important role in
biding of the pollen SCR (Kemp and Doughty, 2007). Furthermore, using dot blot assay,
they demonstrated an affinity for binding between Brassica SRK microsomal membrane
proteins and recombinant pollen SCR protein in an S-specific manner (Kemp and Doughty,
2007).
We wished to confirm whether one key criteria for the pollen S-determinant, which was
binding to the pistil S-determinant, and the S-specific interaction between PrpS and PrsS was
investigated. Initially, the secondary structure predictions of PrpS structure were analysed
using various transmembrane protein prediction programmes and the extracellular domain
was identified as a result of that search. By designing and synthesizing peptides that
represent parts of the potential ligand binding domains of the extracellular region of PrpS,
we wished to confirm the S-specific interaction between PrpS and PrsS in vitro.
127
This study formed a part of the publication (Wheeler et al., 2009) and the review (Wheeler et
al., 2010). My contribution was the analysis of the Papaver pollen S-determinant, PrpS. I
analysed the predicted transmembrane structure of the PrpS protein, and demonstrated using
far-western ligand-blotting that a predicted extracellular domain interacts in an S-specific
manner with the stigmatic PrsS proteins. The papers are inserted in the Appendix III.
4.2. RESULTS: The S-specific interaction of PrpS and PrsS
4.2.1. Analysis of predicted structure of PrpS
In order to test if the PrsS and PrpS interact, it was first necessary to obtain the predicted
structure of the transmembrane protein PrpS.
The majority of membrane protein prediction programmes base their searches on the fact
that transmembrane (TM) segments in proteins can be distinguished by continuous stretches
of hydrophobic amino acid residues (Krogh et al., 2001, Hirokawa et al., 1998, Tusnády and
Simon, 2001). Figure 4.1 shows the structure of the pollen PrpS1 protein as predicted by the
prediction programme TMHMM (http://www.cbs.dtu.dk/services/TMHMM/).

128
a
b MPRSGSVVTLFQFVGGLCTLLGVSVAIKAIFAQDYTLKDLIILIVLVALSIILGGPITLTCVKLLGLVLHRLSFSEDQKWVVAFGTAAICDVLLVPKNMLPMTIFSFLSSIMICVVAVGWDCDRSGMTEGFLVGFGKLLLVYLIKQDFTFSLLCGSVLCLAVVAKFTEGKAEATPNPNLAGKADSPHLITQA Figure 4.1.: Structural prediction of PrpS1 as predicted by prediction programme TMHMM (a) prediction diagram predicts N terminus to be extracellular and C terminus intracellular. Programme predicts 3 TM segments but also shows a hydrophobic tendency between amino acids 125-170, where there is potentially another TM segment. (b) amino acid sequence of PrpS1 with colour-coded amino acids to illustrate extracellular, transmembrane and intracellular regions. Amino acids are colour-coded: pink – extracellular, red – transmembrane, blue – intracellular.
As PrsS proteins are secreted by the stigma it was expected that the interaction would occur
on the extracellular part of the PrpS protein, as the extracellular part of the PrpS is exposed
to the secreted stigmatic PrsS.
According to the first TMHMM prediction, PrpS1 has 3 transmembrane domains and an
extracellular loop segment, comprised of 35 amino acids, from position 63-97, which seems
the most promising site for the interaction with the PrsS proteins (Figure 4.1.b).
The N-terminus of PrpS is possibly a signal peptide and therefore cleaved off (Petersen et
al., 2011). The significance of this part of the protein being extracellular is not discussed
further, but the work presented here discusses on the central extracellular part of the PrpS
protein (35 aa), where the interaction most likely occurs. According to the TMHMM

129
prediction, 4 overlapping peptides, covering the extracellular domain sequence of
extracellular domain, were synthesized by AltaBiosciences (Figure 4.2).
Peptide A1: VKLLGLVLHRLSFSE Peptide A2: LHRLSFSEDQKWVVA Peptide A3: DQKWVVAFGTAAICD Peptide A4: TAAICDVLLVPKNML Scrambled A3 peptide: FTVDVKDCAAAWGQI Figure 4.2.: Amino acid sequence of four overlapping peptides. Peptides represent PrpS1 extracellular 35aa domain predicted by TMHMM prediction programme and at the bottom scrambled A3 peptide.
Peptide A3 and its randomized version were already used in order to establish the
functionality of the PrpS in the SI response. They were first tested for the effect on the SI
phenotype (Figure 4.3) (Wheeler et al., 2009).
a
b
c
Figure 4.3.: In vitro SI bioassay. (a) PrsS proteins were added to pollen and SI reaction occurred – pollen was inhibited; (b) PrsS proteins were added to pollen together with A3 peptide and pollen was “rescued”; (c) when scrambled A3 peptide was added to pollen and SI reaction occurred it indicates that scrambled peptide had no effect and pollen was inhibited (Wheeler et al., 2009).
Figure 4.3.b (work conducted by Kim Osman) illustrates that the addition of the 15-mer
peptide A3, corresponding to parts of the predicted extracellular domain of the PrpS1,
rescues pollen tube growth in the competition bioassay with PrsS1, whereas randomized
version had no effect in the bioassay (Figure 4.3.c) (Wheeler et al., 2009). Since the in vitro
bioassay experiment was carried out (Figure 4.3), two more PrpS alleles had been identified:
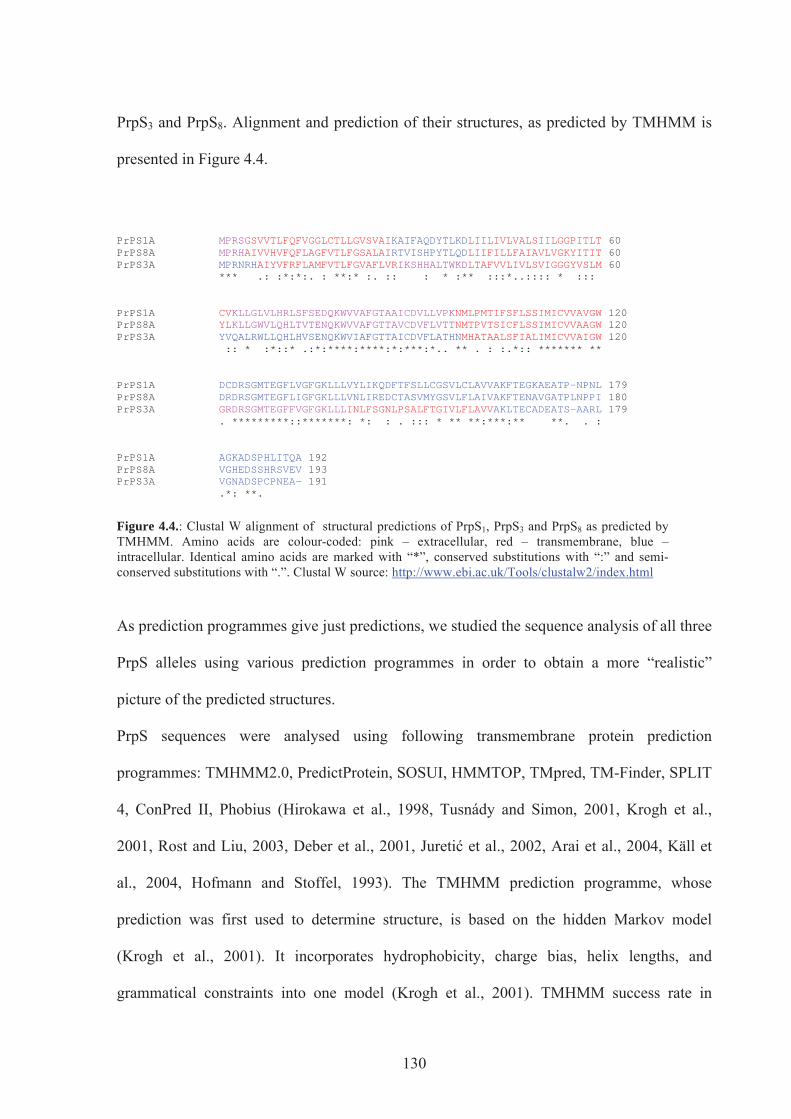
130
PrpS3 and PrpS8. Alignment and prediction of their structures, as predicted by TMHMM is
presented in Figure 4.4.
PrPS1A MPRSGSVVTLFQFVGGLCTLLGVSVAIKAIFAQDYTLKDLIILIVLVALSIILGGPITLT 60 PrPS8A MPRHAIVVHVFQFLAGFVTLFGSALAIRTVISHPYTLQDLIIFILLFAIAVLVGKYITIT 60 PrPS3A MPRNRHAIYVFRFLAMFVTLFGVAFLVRIKSHHALTWKDLTAFVVLIVLSVIGGGYVSLM 60 *** .: :*:*:. : **:* :. :: : * :** :::*..:::: * ::: PrPS1A CVKLLGLVLHRLSFSEDQKWVVAFGTAAICDVLLVPKNMLPMTIFSFLSSIMICVVAVGW 120 PrPS8A YLKLLGWVLQHLTVTENQKWVVAFGTTAVCDVFLVTTNMTPVTSICFLSSIMICVVAAGW 120 PrPS3A YVQALRWLLQHLHVSENQKWVIAFGTTAICDVFLATHNMHATAALSFIALIMICVVAIGW 120 :: * :*::* .:*:****:****:*:***:*.. ** . : :.*:: ******* ** PrPS1A DCDRSGMTEGFLVGFGKLLLVYLIKQDFTFSLLCGSVLCLAVVAKFTEGKAEATP-NPNL 179 PrPS8A DRDRSGMTEGFLIGFGKLLLVNLIREDCTASVMYGSVLFLAIVAKFTENAVGATPLNPPI 180 PrPS3A GRDRSGMTEGFFVGFGKLLLINLFSGNLPSALFTGIVLFLAVVAKLTECADEATS-AARL 179 . *********::*******: *: : . ::: * ** **:***:** **. . : PrPS1A AGKADSPHLITQA 192 PrPS8A VGHEDSSHRSVEV 193 PrPS3A VGNADSPCPNEA- 191 .*: **.
Figure 4.4.: Clustal W alignment of structural predictions of PrpS1, PrpS3 and PrpS8 as predicted by TMHMM. Amino acids are colour-coded: pink – extracellular, red – transmembrane, blue – intracellular. Identical amino acids are marked with “*”, conserved substitutions with “:” and semi-conserved substitutions with “.”. Clustal W source: http://www.ebi.ac.uk/Tools/clustalw2/index.html
As prediction programmes give just predictions, we studied the sequence analysis of all three
PrpS alleles using various prediction programmes in order to obtain a more “realistic”
picture of the predicted structures.
PrpS sequences were analysed using following transmembrane protein prediction
programmes: TMHMM2.0, PredictProtein, SOSUI, HMMTOP, TMpred, TM-Finder, SPLIT
4, ConPred II, Phobius (Hirokawa et al., 1998, Tusnády and Simon, 2001, Krogh et al.,
2001, Rost and Liu, 2003, Deber et al., 2001, Juretić et al., 2002, Arai et al., 2004, Käll et
al., 2004, Hofmann and Stoffel, 1993). The TMHMM prediction programme, whose
prediction was first used to determine structure, is based on the hidden Markov model
(Krogh et al., 2001). It incorporates hydrophobicity, charge bias, helix lengths, and
grammatical constraints into one model (Krogh et al., 2001). TMHMM success rate in

131
discriminating soluble from membrane proteins is claimed to be higher than 99 % in proteins
without a signal peptide, but it can yield false positives and false negatives (Krogh et al.,
2001). Figure 4.5 shows an alignment of PrpS1 using different prediction programmes.
Synthesized peptides that correspond to the extracellular 35 aa segment were designed
according to the TMHMM prediction. Two other programmes, SOSUI and PredictProtein
predict that part of the “35 aa region” is extracellular and part transmembrane, while the
TMPredict and HMMTOP programmes predict this part to be intracellular. All the
prediction programmes give very similar topology for PrpS8 but, surprisingly, they predict
an inverted structure with 4 TM segments for PrpS3.
TMHMM MPRSGSVVTLFQFVGGLCTLLGVSVAIKAIFAQDYTLKDLIILIVLVALS 50 SOSUI MPRSGSVVTLFQFVGGLCTLLGVSVAIKAIFAQDYTLKDLIILIVLVALS 50 PredPR MPRSGSVVTLFQFVGGLCTLLGVSVAIKAIFAQDYTLKDLIILIVLVALS 50 HMMTOP MPRSGSVVTLFQFVGGLCTLLGVSVAIKAIFAQDYTLKDLIILIVLVALS 50 TMPred MPRSGSVVTLFQFVGGLCTLLGVSVAIKAIFAQDYTLKDLIILIVLVALS 50 TMfind MPRSGSVVTLFQFVGGLCTLLGVSVAIKAIFAQDYTLKDLIILIVLVALS 50 SPLIT4 MPRSGSVVTLFQFVGGLCTLLGVSVAIKAIFAQDYTLKDLIILIVLVALS 50 TMHMM IILGGPITLTCVKLLGLVLHRLSFSEDQKWVVAFGTAAICDVLLVPKNML 100 SOSUI IILGGPITLTCVKLLGLVLHRLSFSEDQKWVVAFGTAAICDVLLVPKNML 100 PredPR IILGGPITLTCVKLLGLVLHRLSFSEDQKWVVAFGTAAICDVLLVPKNML 100 HMMTOP IILGGPITLTCVKLLGLVLHRLSFSEDQKWVVAFGTAAICDVLLVPKNML 100 TMPred IILGGPITLTCVKLLGLVLHRLSFSEDQKWVVAFGTAAICDVLLVPKNML 100 TMfind IILGGPITLTCVKLLGLVLHRLSFSEDQKWVVAFGTAAICDVLLVPKNML 100 SPLIT4 IILGGPITLTCVKLLGLVLHRLSFSEDQKWVVAFGTAAICDVLLVPKNML 100 TMHMM PMTIFSFLSSIMICVVAVGWDCDRSGMTEGFLVGFGKLLLVYLIKQDFTF 150 SOSUI PMTIFSFLSSIMICVVAVGWDCDRSGMTEGFLVGFGKLLLVYLIKQDFTF 150 PredPR PMTIFSFLSSIMICVVAVGWDCDRSGMTEGFLVGFGKLLLVYLIKQDFTF 150 HMMTOP PMTIFSFLSSIMICVVAVGWDCDRSGMTEGFLVGFGKLLLVYLIKQDFTF 150 TMPred PMTIFSFLSSIMICVVAVGWDCDRSGMTEGFLVGFGKLLLVYLIKQDFTF 150 TMfind PMTIFSFLSSIMICVVAVGWDCDRSGMTEGFLVGFGKLLLVYLIKQDFTF 150 SPLIT4 PMTIFSFLSSIMICVVAVGWDCDRSGMTEGFLVGFGKLLLVYLIKQDFTF 150 TMHMM SLLCGSVLCLAVVAKFTEGKAEATPNPNLAGKADSPHLITQA 192 SOSUI SLLCGSVLCLAVVAKFTEGKAEATPNPNLAGKADSPHLITQA 192 PredPR SLLCGSVLCLAVVAKFTEGKAEATPNPNLAGKADSPHLITQA 192 HMMTOP SLLCGSVLCLAVVAKFTEGKAEATPNPNLAGKADSPHLITQA 192 TMPred SLLCGSVLCLAVVAKFTEGKAEATPNPNLAGKADSPHLITQA 192 TMfind SLLCGSVLCLAVVAKFTEGKAEATPNPNLAGKADSPHLITQA 192 SPLIT4 SLLCGSVLCLAVVAKFTEGKAEATPNPNLAGKADSPHLITQA 192 Figure 4.5.: Structural prediction of PrpS1 using different prediction programmes: TMHMM, SOSUI, PredictProtein, HMMTOP, TMPred, TMFinder and SPLIT4. Amino acids are colour-coded: pink – extracellular, red – transmembrane, blue – intracellular, black – no orientation given.

132
Membrane-protein topology-prediction methods are typically based on sequence statistics
and contain hundreds of parameters that are optimized using known topologies of membrane
proteins (Bernsel et al., 2008). Although the predictions differ, they all predict that PrpS has
transmembrane helices and the alignment of the PrpS sequences suggests that all three
proteins share a similar topology. Predictions indicated 3, 4, 5 or 6 TM domains for PrpS1
but PrpS most likely has four transmembrane segments, as it is a good number to make a
four helix bundle in the membrane. 3 and 5 TM proteins do exist but are rarer (Dr. A.
Lovering, personal communication). Additional argument for four TM domains is the
GxxxG motif that is involved in number of helix oligomers, that is also present in the PrpS1,
PrpS3 and PrpS8 sequence toward the C-terminus, and is also aligned with Drosophilla
protein Flower, for which they demonstrated the formation of a channel (see Apendix I)
(Dawson et al., 2002, Senes et al., 2004, Yao et al., 2009). So, if this motif is to potentially
play a role in oligomerization in PrpS, then it should be within the fourth TM domain. Also
the TMHMM diagram for PrpS1 in Figure 4.1.a shows a fourth highly hydrophobic region at
the C-terminus between aa 125 and 170. At this position there is a predicted TM domain in
PrpS3 and it is highly possible that it is applicable to the other alleles as there are stretches of
hydrophobic acids in the TMHMM predicted “intracellular” domain in PrpS1 and PrpS8.
This area is 39 % identical at the aa level between the three alleles and 74 % similar for
PrpS1 and 78 % similar for PrpS8. The alignment of these 4 TM domains is such that a loop
is extracellular as we have some evidence that it is involved in binding with PrsS (Wheeler
et al., 2009), which has extracellular access to PrpS. Based on the predictions of the 4
prediction programmes, cartoon on Figure 4.6 shows 4 different topologies. Interestingly,
the PredictProtein prediction shows very similar topology of PrpS1 to what we think it might
be. Peptide A3 is located between aa 77-91. This peptide gave the strongest interaction using
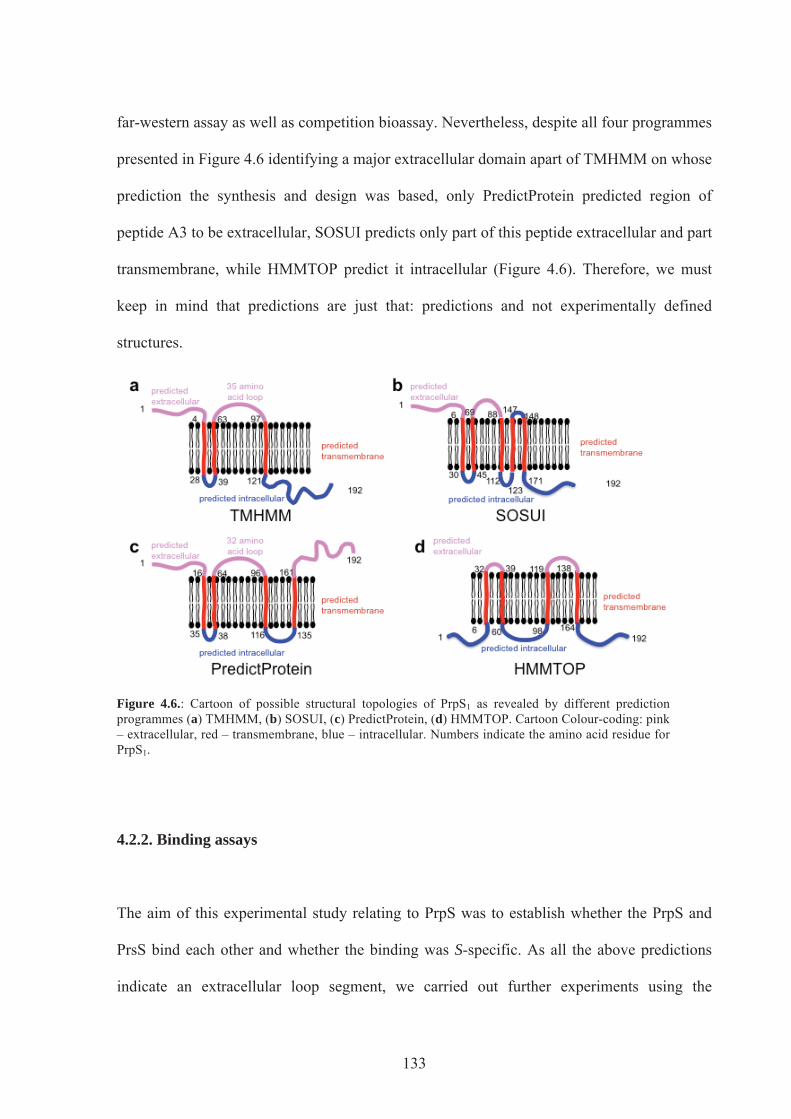
133
far-western assay as well as competition bioassay. Nevertheless, despite all four programmes
presented in Figure 4.6 identifying a major extracellular domain apart of TMHMM on whose
prediction the synthesis and design was based, only PredictProtein predicted region of
peptide A3 to be extracellular, SOSUI predicts only part of this peptide extracellular and part
transmembrane, while HMMTOP predict it intracellular (Figure 4.6). Therefore, we must
keep in mind that predictions are just that: predictions and not experimentally defined
structures.
Figure 4.6.: Cartoon of possible structural topologies of PrpS1 as revealed by different prediction programmes (a) TMHMM, (b) SOSUI, (c) PredictProtein, (d) HMMTOP. Cartoon Colour-coding: pink – extracellular, red – transmembrane, blue – intracellular. Numbers indicate the amino acid residue for PrpS1.
4.2.2. Binding assays
The aim of this experimental study relating to PrpS was to establish whether the PrpS and
PrsS bind each other and whether the binding was S-specific. As all the above predictions
indicate an extracellular loop segment, we carried out further experiments using the

134
synthesized 15-mer peptides, spanning over the extracellular domain of PrpS1. We used the
‘slot-blot’ method, a technique used in molecular biology to detect biomolecules also known
as “far western”.
The peptides representing the extracellular domain of PrpS1 were applied directly to a PVDF
membrane and the potential binding between PrpS1 peptides and recombinant PrsS1 protein
was detected with antibody raised against PrsS1.
Figure 4.7. shows a representative slot-blot with all the peptides (see also Figure 4.2). From
the figure we can see differential binding with all the peptides, except with the peptide A2,
which gave no binding. No binding was observed with the scrambled peptide.
Figure 4.7.: Binding assay with differential loading 10 μg, 1μg and 0.1 μg of peptides A1, A2, A3, A4 and scrambled A3 peptide as control. Binding was detected with anti-PrsS1 at a concentration of 1:2000.
A problem that was initially observed with the slot-blot assay was relatively high
background on the PVDF membrane. In order to reduce the background optimization was
required, such as: adding extra washes to the membrane, cleaning up the antibodies and
using higher titre of the primary antibody.

135
The peptide A3 gave positive results with in vitro bioassays so it was important to attempt to
demonstrate the differential specific binding and allelic specificity. Despite the results in
figure 4.7, the work was continued mostly with peptide A3. As the peptides synthesized
corresponded to PrpS1, we attempted to demonstrate the S-specificity of peptide A3 through
binding with PrsS3 and detection with PrsS3 antibody (see Figure 4.8).
Figure 4.8.: Binding assay with differential loading 10 μg, 1μg and 0.1 μg of A3 peptide and scrambled A3 peptide as a control. Peptide A3 designed over PrpS1 was bound on the membrane, which was then incubated with PrsS proteins. (a) membrane was incubated with PrsS1 proteins and binding was detected with anti-PrsS1, (b) membrane was incubated with PrsS3 proteins and binding detected with anti-PrsS3 (both at a concentration of 1:2000).
Figure 4.8 shows that the membrane incubated with anti-PrsS1 gave higher background than
the membrane incubated with anti-PrsS3. The PrsS1-treated membrane had a clearer signal
and differential loading was observed with peptide A3. Although there is a weak signal with
10 μg of scrambled peptide, this disappears when the background is subtracted. On the other
hand, the PrsS3 blot showed an unusual pattern. At the first glance it seems that we have
differential loading not only with peptide A3, but also with the scrambled peptide. Both blots
were processed at the same time with the same reagents and solutions. The only difference
a b

136
was in the primary antibodies. Closer inspection showed that there was also some signal in
the position of the slots that were empty (i.e. which did not have any peptide loaded).
Furthermore, the signal does not seem to be throughout the position of the slot but is
confined to the edge. These indentations could also be observed in later blots, but only when
detected with anti-PrsS3 antibody (see representative Figure 4.9).
Figure 4.9.: One of many repeated binding assays with differential loading 10 μg, 1μg and 0.1 μg of A3 peptide and scrambled A3 peptide as a control. Peptide was bound on the membrane, which was then incubated with PrsS proteins. Recombinant PrsS1 and PrsS3 were loaded as the control at a concentration of 0.1μg. (a) following binding, membrane was incubated with PrsS1 proteins and binding was detected with anti-PrsS1 (α-PrsS1; 1:6000), (b) membrane was incubated with PrsS3 proteins and binding detected with anti-PrsS3 (α-PrsS3; 1:500) antibody. E – empty slots.
The blot on Figure 4.9 shows the S-specific binding of A3 peptide with PrsS1. Differential
loading of peptide A3 is demonstrated and no signal with the scrambled peptide. The PrsS1
antibody specifically recognizes the recombinant PrsS1 protein and not the recombinant
PrsS3 protein. Several different titres were tested by western blot in order to try to get
specific signals. Antibodies were used at concentrations that give an equivalent intensity of
signal for 0.1 μg of peptides. Antibodies were also column purified to remove unspecific
interactions. The blot probed with the anti-PrsS3 antibody does not give a straightforward

137
result. If we focus only on the signals for peptide A3, then we might conclude that we have
differential loading. But we can also observe differential binding with the scrambled peptide.
Also, the recombinant PrsS3 protein is recognised specifically by the PrsS3 antibody,
whereas the recombinant PrsS1 protein gives a very weak signal that can be attributed to the
background. If we look at the blot as a whole, then we see quite strong signals in the
positions of the empty slots.
All the data so far shows that the anti-PrsS3 antibody does not bind specifically enough, as it
binds to the edges of empty wells and often gave a very high background signal.
Furthermore, alleles 1, 3 and 8 have 73 % aa identity in the area of peptide A3 (see Figure
4.10). For this reason we moved the focus of our attention to peptide A1 (Figure 4.2.) where
the aa identity between alleles is 27 %, so the region is more variable.
PrpS1 KLLGLVLHRLSFSEDQKWVVAFGTAAICDVLLVPK 35 PrpS3 QALRWLLQHLHVSENQKWVIAFGTTAICDVFLATH 35 PrpS8 KLLGWVLQHLTVTENQKWVVAFGTTAVCDVFLVTT 35 : * :*::* .:*:****:****:*:***:*.. Figure 4.10.: Clustal W alignment of amino acid sequence of predicted extracellular loop of 3 different alleles of PrpS protein. Identical amino acids are marked with “*”, conserved substitutions with “:” and semi-conserved substitutions with “.”.
In order to test for reciprocal S-specific interaction, we chose the area of peptide A1 in PrpS1
and PrpS8. Peptide A1 and its corresponding scrambled control from this less similar region
of extracellular domain were designed and synthesized by AltaBiosciences (Figure 4.11.).
PrpS1 A1 – VKLLGLVLHRLSFSE ScrPrpS1 - ELGVKLHSLSVLRFL PrpS8 A1 – LKLLGWVLQHLTVTE ScrPrpS8 – GLTWLQLKEVHLTVL Figure 4.11.: Peptides A1 for PrpS1 and PrpS8 and their scrambled versions, synthesized by AltaBiosciences
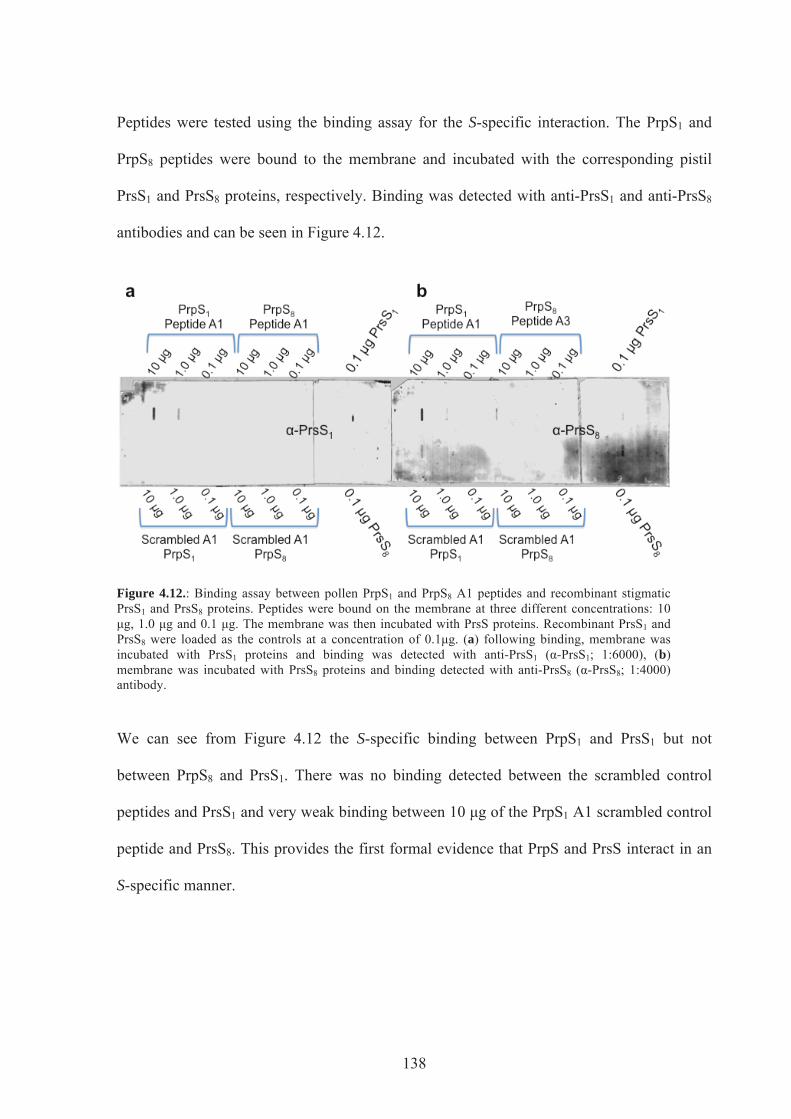
138
Peptides were tested using the binding assay for the S-specific interaction. The PrpS1 and
PrpS8 peptides were bound to the membrane and incubated with the corresponding pistil
PrsS1 and PrsS8 proteins, respectively. Binding was detected with anti-PrsS1 and anti-PrsS8
antibodies and can be seen in Figure 4.12.
Figure 4.12.: Binding assay between pollen PrpS1 and PrpS8 A1 peptides and recombinant stigmatic PrsS1 and PrsS8 proteins. Peptides were bound on the membrane at three different concentrations: 10 μg, 1.0 μg and 0.1 μg. The membrane was then incubated with PrsS proteins. Recombinant PrsS1 and PrsS8 were loaded as the controls at a concentration of 0.1μg. (a) following binding, membrane was incubated with PrsS1 proteins and binding was detected with anti-PrsS1 (α-PrsS1; 1:6000), (b) membrane was incubated with PrsS8 proteins and binding detected with anti-PrsS8 (α-PrsS8; 1:4000) antibody.
We can see from Figure 4.12 the S-specific binding between PrpS1 and PrsS1 but not
between PrpS8 and PrsS1. There was no binding detected between the scrambled control
peptides and PrsS1 and very weak binding between 10 μg of the PrpS1 A1 scrambled control
peptide and PrsS8. This provides the first formal evidence that PrpS and PrsS interact in an
S-specific manner.
139
4.3 DISCUSSION
In this chapter we demonstrated with the binding assay the S-specificity for the interaction
between PrpS and its ligand PrsS using peptides overlapping the extracellular domain of
PrpS. Slot-blot binding assay is one of the commonly used techniques to show for protein-
protein interactions (Southwick and Long, 2002). A modified version of slot-blot assay, a
dot blot was also used by Kemp and Doughty, (2007), with which they documented binding
in a haplotype-specific manner between stigmatic membrane proteins and recombinant SCR
protein. Pollen recombinant SCR29 was iodinated before incubation with a membrane with
bound stigmatic microsomal membrane proteins from stigmas S29S29 and S63S63 of Brassica.
They confirmed the S-specific binding of SCR29 to S29S29 stigmas with fivefold higher
affinity than to stigmatic membrane of different allele (Kemp and Doughty, 2007). Our
assay demonstrated in a similar manner the S-specific binding between PrsS and PrpS,
however, we demonstrated more specifically the binding between the extracellular domain
of the transmembrane protein PrpS1 and the recombinant ligand PrsS1 and not just binding of
a membrane extract with the recombinant protein (Kemp and Doughty, 2007, Wheeler et al.,
2009).
Brassica-like SI is triggered upon the interaction between pollen coat protein S-locus
Cysteine Rich (SCR), that binds to and activates S-locus Receptor Kinase (SRK),
transmembrane protein encoded in stigmatic papillae (Kachroo et al., 2001, Takayama et al.,
2001). A. thaliana is already used as a model for Brassica-like SI, expressing SRK/SCR
gene pairs from A. lyrata and C. grandiflora (Nasrallah et al., 2002, Nasrallah et al., 2004,
Boggs et al., 2009b). Use of this model system and mutagenesis enabled the identification of
the 6-7 important amino acid residues in the extracellular domain of the SRK, determining

140
the specificity of the receptor-ligand interaction (Boggs et al., 2009a). These residues occur
in two separate clusters located in the highly polymorphic sites of eSRK and were found on
the same position in two variants tested.
The PrpS-PrsS interaction could be also demonstrated using different techniques, such as
modificated yeast-two-hybrid assays: split-ubiquitin or reverse Ras recruitment system
(Stagljar and Fields, 2002). The reverse Ras recruitment system, for example, is based on
Ras pathway in yeast. Membrane protein of interest (PrpS) is expressed in the membrane,
while the interaction protein (PrsS) is fused to the mRas, that is cytoplasmic. The successful
interaction between PrpS-PrsS should then result in the growth of yeast at 36 oC, which is
otherwise too high (Stagljar and Fields, 2002). Alternative way to demonstrate PrpS-PrsS
protein interaction would be pulldown assays, where PrsS could be immobilized as a bait on
a His-column, and used to pull out the PrpS protein in the pollen extract. However, next
steps are also the analysis of the PrpS residues that are important for the interaction with
PrsS in the extracellular domain, and that are important for the intracellular interaction with
yet unknown proteins. Additionally, the detailed analysis of TM domains could provide
information’s regarding the oligomerization of the protein, or its potential to form a pore or a
channel.

141
CHAPTER 5
Functional analysis in vitro of the Arabidopsis
thaliana expressing Papaver rhoeas PrpS1 and PrpS3

142
5.1 INTRODUCTION
As described in the introduction, section 1.4.3., Papaver rhoeas avoids self-fertilization on a
molecular level by cell-cell specific self-recognition and rejection of self-pollen with
transmembrane receptor PrpS, localised in the pollen plasma membrane, that lands on the
stigma, which secretes small cysteine-rich proteins PrsS (Wheeler et al., 2009). Such SI
interaction in the incompatible Papaver pollen triggers the cascade of downstream molecular
events in pollen that ultimately lead to the inhibition of pollen tube growth and PCD of
pollen tube (Thomas and Franklin-Tong, 2004).
We wished to see if the Papaver S-determinants PrpS and PrsS could be functionally
transferred to other species, initially to Arabidopsis thaliana, triggering Papaver-like SI
response. This would provide an important model for studying Papaver SI, as genetic
manipulations are very difficult in Papaver, while A. thaliana is well amenable to the
transformation by Agrobacterium, and extensive mutant collections already exist and are
commercially available. The functionality of Papaver SI in other species could also have a
long term potential for the F1 hybrid breeding in crops. Many agriculturally important
species, such as wheat, rye, barley or rice are self-compatible (SC) and for plant breeding
and production of hybrids other ways of elimination of self-fertilization are essential, such as
manual emasculation of anthers or use of cytoplasmic male sterility (for example very
important for rice hybrid breeding) (Dwivedi et al., 2008, Cheng et al., 2007, Pelletier and
Budar, 2007). These breeding programmes can be very expensive and lengthy to reach the
end result so the stable introduction of SI that would interrupt SC might be positive and
useful for future production of F1 hybrids.

143
As mentioned above, the first step towards in the research of functionality of PrpS and PrsS
in another angiosperm was the transformation into A. thaliana, a plant model organism,
whose sequenced genome was sequenced (Initiative, 2000). A. thaliana is a SC species from
the Brasicaceae family, which lost SI through mutation in the male specificity gene SCR,
while female specificity gene SRK remained intact (Tsuchimatsu et al., 2010, Tang et al.,
2007).
A. thaliana became the transgenic model of the Brassica SI system by transformation with
SRK-SCR receptor ligand gene pair isolated from self-incompatible crucifers Arabidopsis
lyrata or Capsella grandiflora (Nasrallah et al., 2002, Boggs et al., 2009b, Rea et al., 2010,
Nasrallah et al., 2004). Their studies on transgenic A. thaliana focused on the analysis of the
natural variation for the expression of SI, the evolutionary switch between outbreeding and
inbreeding in A. thaliana, analysis of residues that determine SI specificity and identification
of genes required for SI signalling and potential overlaps with other plant signalling
pathways (reviewed in (Rea et al., 2010). Several different accessions of A. thaliana were
transformed with SRK-SCR gene pair with SI response tested and they identified that not all
accessions exhibit same degree of SI and they exhibit different levels of polymorphism at the
S-locus and the SI modifier loci, leading to conclusion that inbreeding status of A. thaliana
was probably developed multiple times by independent mutations in different accessions
(Sherman-Broyles et al., 2007, Boggs et al., 2009c). A. thaliana presents an excellent system
to study molecular mechanisms due to easy transformation using Agrobacterium, which can
be difficult or impossible in some species, for example Brassica or in our case, Papaver.
Transgenic A. thaliana expressing SRK-SCR gene pair was used for analysis of residues that
are important for SRK specificity and therefore SI response. Site-directed mutagenesis
approach was used on polymorphic amino acid residues in the extracellular domain of SRK

144
and six were identified to mediate the ligand-specific SI activation (Boggs et al., 2009a).
Mutational analysis in transgenic A. thaliana expressing SRK-SCR also enabled the
identification of mutation in RNA-dependent RNA polymerase RDR6, that acts as a
negative regulator of SI and causes stigma exsertion and simultaneous enhancement of SI,
which implicated a broader role for SRK in pistil development (Tantikanjana et al., 2009).
Further unexpected results were obtained when crossing A. thaliana plants expressing SRKb-
SCRb genes that exhibit stable SI response with A. thaliana strains that contained inactive
PUB17 or APK1b genes, which were most similar to Brassica ARC1 and MLPK. Those
crosses resulted in unabolished SI response, which means that the role of ARC1 and MLPK
might not be as crucial for SI as previously reported (Rea et al., 2010, Kitashiba et al., 2011).
Papaver-based SI A. thaliana model was generated by Agrobacterium-mediated
transformation of the Papaver S-determinants into A. thaliana. The transformations of
Papaver S-determinants into A. thaliana were carried out by Barend de Graaf (BG plant
lines) and Huawen Zou (HZ plant lines). This chapter describes in detail work with
transgenic A. thaliana lines expressing PrpS1-GFP (BG16) and PrpS3-GFP (HZ3) and to
lesser extent also 35S:PrpS1 (BG3). These were the lines that were available and chosen to
work on at the start of this project. The constructs are presented in the Table 5.1.
Table 5.1: The cartoon illustrations of the constructs of the poppy SI determinants that were used for Agrobacterium mediated transformation into A. thaliana.
Gene Resistance Marker Name Construct
PrpS1 Kan BG16
PrpS3 Kan HZ3
PrpS1 Kan BG3
PrpS1 GFP ntp303 NOS
PrpS3 GFP ntp303 NOS
PrpS1 35S NOS

145
To achieve tissue specific expression of the male S-determinants PrpS1-GFP and PrpS3-GFP
in the pollen of A. thaliana, a strong, pollen specific promoter from tobacco, ntp303, was
used (Weterings et al., 1995). For BG3 line, PrpS1 expression was cloned under the control
of the cauliflower mosaic virus 35S promoter (Hull, 1983) that has a constitutive expression
throughout the plant. In order to detect the transformed plant cells, the kanamycin (Kan)
resistance cassette was on the T-region of the construct acting as a selection marker. In all
lines except BG3, PrpS was expressed as a fusion protein with green fluorescence protein
(GFP) towards its C-termini.
The results of the study, presented in this chapter, resulted in a publication where I am joint
first author. The paper is presented in the Appendix III.
AIMS
Part of this PhD study was the functional analysis of Papaver SI in A. thaliana. Several
approaches were taken: in vitro and semi-in vitro described here, and in vivo (described later
in Chapter 6). The initial studies were the characterization and segregation analysis based on
the inheritance of the resistance markers Kan and reporter marker GFP of PrpS1-GFP and
PrpS3-GFP expressing A. thaliana lines, and identification of homozygous progenies of
transgenic lines with the highest expression of Papaver S-determinants. The use of the
homozygous lines would optimise the reproducibility of the study. Once the highest
expressing homozygous lines were identified, the functional analysis studies were
conducted. The aim was to conduct in vitro studies on transgenic A. thaliana pollen
expressing PrpS1-GFP and PrpS3-GFP fusion protein. We wished to establish whether PrpS-

146
GFP in A. thaliana pollen responded to its cognate stigmatic recombinant proteins in the
same manner as Papaver pollen. The SI response was induced in transgenic A. thaliana
pollen expressing PrpS1-GFP or PrpS3-GFP and germinating in Petri dishes, with an addition
of the cognate recombinant stigmatic PrsS1 or PrsS3 proteins. Various responses were
analysed, such as: inhibition of pollen tube growth, decrease of pollen viability and the
appearance of puncate actin foci. The outline of these experiments is presented on Figure
5.1. The S-specific response was ensured by analysing PrpS-GFP expressing A. thaliana
pollen upon incubation with biologically inactive incompatible PrsS proteins, treatment with
compatible proteins and incubation of wild type Col-0 A. thaliana pollen using Papaver
stigmatic PrsS recombinant proteins.
Figure 5.1.: Schematic diagram presenting the outline of the in vitro functional analysis experiments. In vitro SI reaction was induced in transgenic A. thaliana pollen expressing PrpS1-GFP or PrpS3-GFP and the several responses were tested, such as inhibition of pollen tube growth, decrease of viability and the appearance of punctate actin foci.
The inhibition of pollen tubes was analysed by measuring pollen tube length, analysed the
organisation of the actin cytoskeleton with the use of rhodamine phalloidin and the viability
of pollen tubes at different time points using Evans Blue dye as well as investigated pollen
cell death and DEVDase activity of transgenic A. thaliana pollen.
Induce SI “In vitro”
inhibition loss of viability
punctate actin foci S-specific
Measure tube length
viability / PCD test
Changes to actin
cytoskeleton
Change
Prediction
147
5.2 RESULTS
5.2.1. Characterization of A. thaliana expressing Papaver SI system
At the start of the project, the seeds from up to 30 independent primary transformants of
different lines were available: BG16 expressing PrpS1-GFP, HZ3 expressing PrpS3-GFP and
BG3 expressing PrpS1 using constitutive 35S promoter, whose characterisation is presented
in this chapter and lines HZ1 expressing PrsS1 and HZ2 expressing PrsS3 and BG6
expressing whole S1-locus whose characterisation is presented in the next Chapter 6.
Before carrying out the functional characterisation it was necessary to identify the highest
expressing individual lines. Although lines were pre-screened on the selection medium, there
was the possibility that they did not contain the insert corresponding to the S-genes within
their genome. Therefore we screened for the plants with inserts by PCR on genomic DNA
purified from leaf disks. The T2 generation of the transgenic A. thaliana lines were tested for
the presence of the inserts by PCR using genomic DNA as a template. Lines BG16 and HZ3
were tested for the presence of PrpS1 and PrpS3 respectively. Once having confirmed if the
insert was present, only the plants that showed the insert by PCR were tested if they were
expressing the PrpS by reverse transcription-PCR (RT-PCR).
We wished to identify at least two individuals with the highest expression of Papaver S-
determinants within each transgenic A. thaliana line, so the further functional analysis could
be accomplished.
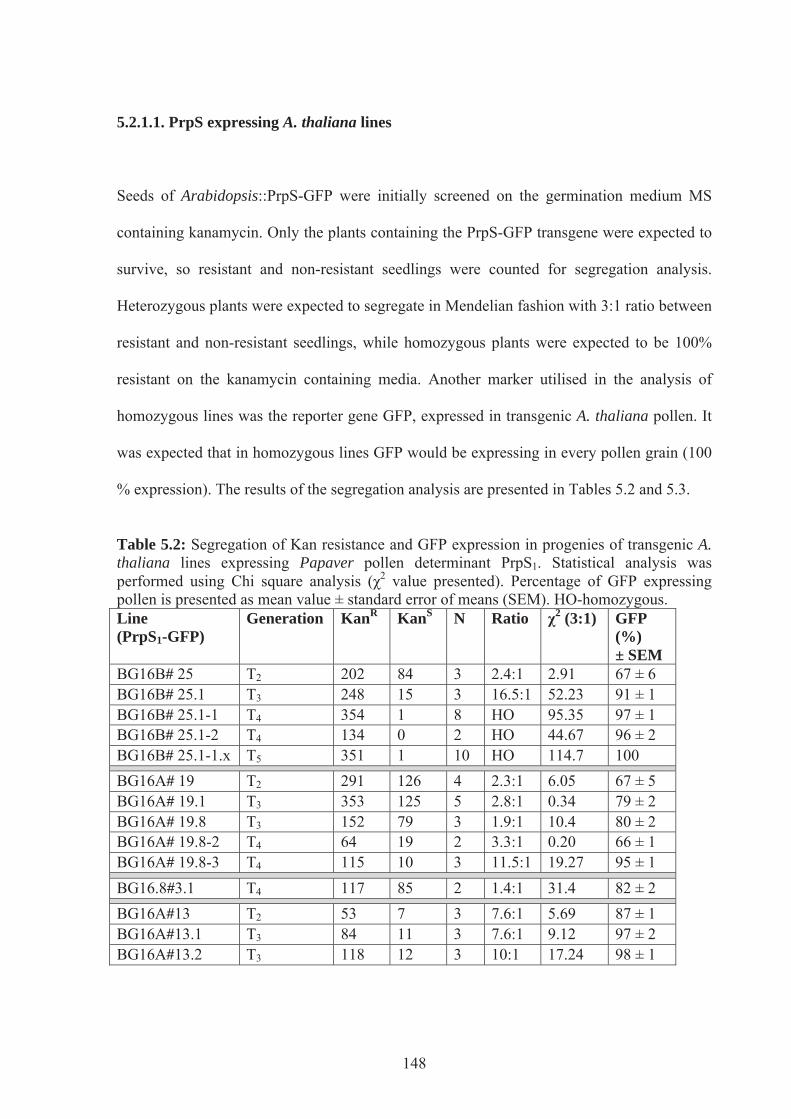
148
5.2.1.1. PrpS expressing A. thaliana lines
Seeds of Arabidopsis::PrpS-GFP were initially screened on the germination medium MS
containing kanamycin. Only the plants containing the PrpS-GFP transgene were expected to
survive, so resistant and non-resistant seedlings were counted for segregation analysis.
Heterozygous plants were expected to segregate in Mendelian fashion with 3:1 ratio between
resistant and non-resistant seedlings, while homozygous plants were expected to be 100%
resistant on the kanamycin containing media. Another marker utilised in the analysis of
homozygous lines was the reporter gene GFP, expressed in transgenic A. thaliana pollen. It
was expected that in homozygous lines GFP would be expressing in every pollen grain (100
% expression). The results of the segregation analysis are presented in Tables 5.2 and 5.3.
Table 5.2: Segregation of Kan resistance and GFP expression in progenies of transgenic A. thaliana lines expressing Papaver pollen determinant PrpS1. Statistical analysis was performed using Chi square analysis (χ2 value presented). Percentage of GFP expressing pollen is presented as mean value ± standard error of means (SEM). HO-homozygous. Line (PrpS1-GFP)
Generation KanR KanS N Ratio χ2 (3:1) GFP (%) ± SEM
BG16B# 25 T2 202 84 3 2.4:1 2.91 67 ± 6 BG16B# 25.1 T3 248 15 3 16.5:1 52.23 91 ± 1 BG16B# 25.1-1 T4 354 1 8 HO 95.35 97 ± 1 BG16B# 25.1-2 T4 134 0 2 HO 44.67 96 ± 2 BG16B# 25.1-1.x T5 351 1 10 HO 114.7 100
BG16A# 19 T2 291 126 4 2.3:1 6.05 67 ± 5 BG16A# 19.1 T3 353 125 5 2.8:1 0.34 79 ± 2 BG16A# 19.8 T3 152 79 3 1.9:1 10.4 80 ± 2 BG16A# 19.8-2 T4 64 19 2 3.3:1 0.20 66 ± 1 BG16A# 19.8-3 T4 115 10 3 11.5:1 19.27 95 ± 1
BG16.8#3.1 T4 117 85 2 1.4:1 31.4 82 ± 2
BG16A#13 T2 53 7 3 7.6:1 5.69 87 ± 1 BG16A#13.1 T3 84 11 3 7.6:1 9.12 97 ± 2 BG16A#13.2 T3 118 12 3 10:1 17.24 98 ± 1
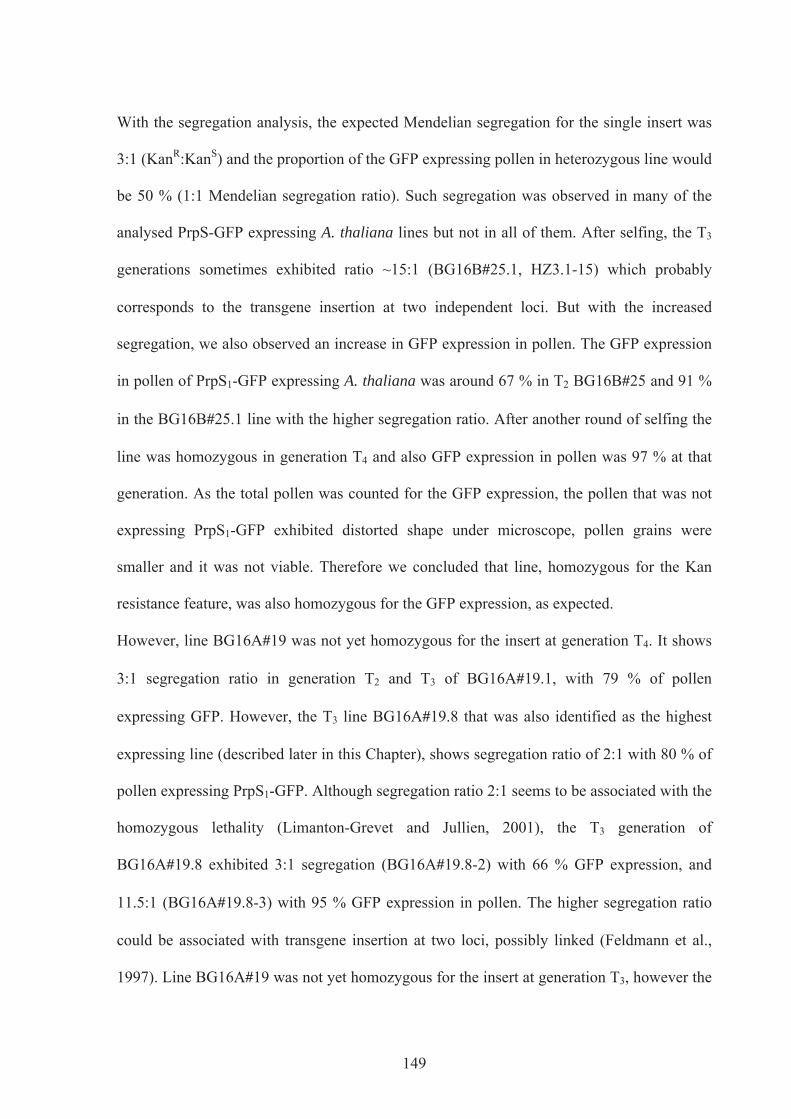
149
With the segregation analysis, the expected Mendelian segregation for the single insert was
3:1 (KanR:KanS) and the proportion of the GFP expressing pollen in heterozygous line would
be 50 % (1:1 Mendelian segregation ratio). Such segregation was observed in many of the
analysed PrpS-GFP expressing A. thaliana lines but not in all of them. After selfing, the T3
generations sometimes exhibited ratio ~15:1 (BG16B#25.1, HZ3.1-15) which probably
corresponds to the transgene insertion at two independent loci. But with the increased
segregation, we also observed an increase in GFP expression in pollen. The GFP expression
in pollen of PrpS1-GFP expressing A. thaliana was around 67 % in T2 BG16B#25 and 91 %
in the BG16B#25.1 line with the higher segregation ratio. After another round of selfing the
line was homozygous in generation T4 and also GFP expression in pollen was 97 % at that
generation. As the total pollen was counted for the GFP expression, the pollen that was not
expressing PrpS1-GFP exhibited distorted shape under microscope, pollen grains were
smaller and it was not viable. Therefore we concluded that line, homozygous for the Kan
resistance feature, was also homozygous for the GFP expression, as expected.
However, line BG16A#19 was not yet homozygous for the insert at generation T4. It shows
3:1 segregation ratio in generation T2 and T3 of BG16A#19.1, with 79 % of pollen
expressing GFP. However, the T3 line BG16A#19.8 that was also identified as the highest
expressing line (described later in this Chapter), shows segregation ratio of 2:1 with 80 % of
pollen expressing PrpS1-GFP. Although segregation ratio 2:1 seems to be associated with the
homozygous lethality (Limanton-Grevet and Jullien, 2001), the T3 generation of
BG16A#19.8 exhibited 3:1 segregation (BG16A#19.8-2) with 66 % GFP expression, and
11.5:1 (BG16A#19.8-3) with 95 % GFP expression in pollen. The higher segregation ratio
could be associated with transgene insertion at two loci, possibly linked (Feldmann et al.,
1997). Line BG16A#19 was not yet homozygous for the insert at generation T3, however the

150
T3 line BG16A#19.8 was also identified as a highest expressing line (described later in this
Chapter). Additionally, the unusual segregation ratio of 1.4:1 was also observed for the T4
generation of the line BG16.8#3.1, which was also identified to express PrpS1-GFP in high
concentrations, while the 82 % of the pollen was expressing PrpS1-GFP.
Distorted segregation ratios were observed also in the line BG16A#13, which was added to
the experiments later on, due to its very high GFP expression of more than 90 % in
generation T3. Its segregation shows 8:1 in T1 with very high PrpS1-GFP pollen expression
of 87 % and 8:1 and 10:1 in T3 with homozygous PrpS1-GFP pollen expression of 97 % and
98 %, respectively. Such distorted segregation ratios were previously associated with the
segregation at the S-locus in Petunia (Harbord et al., 2000) where distorted segregation
ratios of 8:1 or higher were anticipated due to gamethophytic selection of S-alleles.
However, in the case of Papaver S-transgenes in A. thaliana, the location of the insert was
not identified. Line BG16A#13 was having homozygous GFP expression in pollen in
generation T3, which did not show any abnormalities, but was still heterozygous for the Kan
resistance marker. The explanation for this discrepancy could be that the two markers in line
BG16A#13 follow the Mendelian segregation of independent segregation in T3 generation
because the markers are located on the opposite sides of the T-DNA construct so it could be
possible for one inserted construct to lose the Kan marker. However, pollen from
BG16A#13 exhibited normal germination rates compared to Col-0 and for that reason it was
used in some preliminary experiments, such as caspase assays.
For functional analysis the progeny of lines BG16B#25 and BG16A#19 were selected (see
also RT-PCR analysis later in this section).

151
The unusual high segregation ratios most often indicate the segregation of inserts at two
linked loci. Whereas the segregation of inserts at two unlinked loci gives 15:1 ratio, the
segregation at two linked loci could give rise to segregation ratios 3:1<x<15:1 (Feldmann et
al., 1997). If we assume multiple insertion and independent segregation of the separated
fusion construct then we would be expecting greater GFP expression than single insert,
which is what we observed. The variable transgene expression could also be due to the
position effects, meaning that the actively transcribed regions of the genome or a transgene
insertion near enhancer elements are more likely to be expressed. Therefore, a few seedlings
with the insert near the highly expressed region could give rise to the observed intense
expression of GFP (for example line BG16A#13 which exhibited very high GFP expression,
while the Kan segregation was heterozygous 8:1 and 10:1 ratios). Another possible reason
for distorted segregations of double T-DNA copy could results from epigenetic transgene
silencing, which is common for repetitive sequences, potentially as a defence response
against foreign DNA (Jorgensen et al., 1996, Muskens et al., 2000, De Buck et al., 2007,
Matzke and Matzke, 1998). Double insertion of the gene often arrange as inverted repeats of
which many are dominant silencing loci and can repress the expression of homologous
genes, associated with increase in DNA methylation (Muskens et al., 2000). The post-
trancriptional silencing of genes results from degradation of double stranded RNA (dsRNA)
directed DNA methylation and dsRNA induced degradation of homologous RNAs (Muskens
et al., 2000)
Table 5.3 presents the results of segregation analysis of PrpS3-GFP expressing A. thaliana
lines.
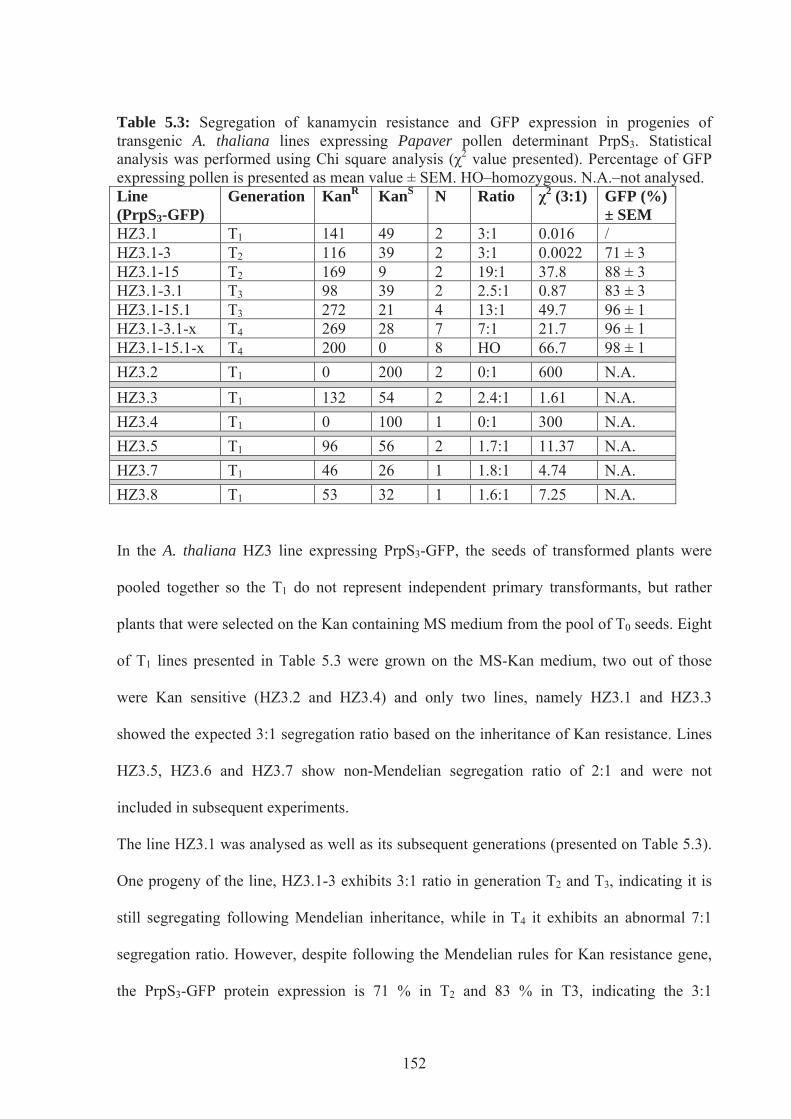
152
Table 5.3: Segregation of kanamycin resistance and GFP expression in progenies of transgenic A. thaliana lines expressing Papaver pollen determinant PrpS3. Statistical analysis was performed using Chi square analysis (χ2 value presented). Percentage of GFP expressing pollen is presented as mean value ± SEM. HO–homozygous. N.A.–not analysed. Line (PrpS3-GFP)
Generation KanR KanS N Ratio χ2 (3:1) GFP (%) ± SEM
HZ3.1 T1 141 49 2 3:1 0.016 / HZ3.1-3 T2 116 39 2 3:1 0.0022 71 ± 3 HZ3.1-15 T2 169 9 2 19:1 37.8 88 ± 3 HZ3.1-3.1 T3 98 39 2 2.5:1 0.87 83 ± 3 HZ3.1-15.1 T3 272 21 4 13:1 49.7 96 ± 1 HZ3.1-3.1-x T4 269 28 7 7:1 21.7 96 ± 1 HZ3.1-15.1-x T4 200 0 8 HO 66.7 98 ± 1
HZ3.2 T1 0 200 2 0:1 600 N.A.
HZ3.3 T1 132 54 2 2.4:1 1.61 N.A.
HZ3.4 T1 0 100 1 0:1 300 N.A.
HZ3.5 T1 96 56 2 1.7:1 11.37 N.A.
HZ3.7 T1 46 26 1 1.8:1 4.74 N.A.
HZ3.8 T1 53 32 1 1.6:1 7.25 N.A.
In the A. thaliana HZ3 line expressing PrpS3-GFP, the seeds of transformed plants were
pooled together so the T1 do not represent independent primary transformants, but rather
plants that were selected on the Kan containing MS medium from the pool of T0 seeds. Eight
of T1 lines presented in Table 5.3 were grown on the MS-Kan medium, two out of those
were Kan sensitive (HZ3.2 and HZ3.4) and only two lines, namely HZ3.1 and HZ3.3
showed the expected 3:1 segregation ratio based on the inheritance of Kan resistance. Lines
HZ3.5, HZ3.6 and HZ3.7 show non-Mendelian segregation ratio of 2:1 and were not
included in subsequent experiments.
The line HZ3.1 was analysed as well as its subsequent generations (presented on Table 5.3).
One progeny of the line, HZ3.1-3 exhibits 3:1 ratio in generation T2 and T3, indicating it is
still segregating following Mendelian inheritance, while in T4 it exhibits an abnormal 7:1
segregation ratio. However, despite following the Mendelian rules for Kan resistance gene,
the PrpS3-GFP protein expression is 71 % in T2 and 83 % in T3, indicating the 3:1

153
segregation of PrpS3-GFP pollen expression. The other progeny of the line 3.1, HZ3.1-15
shows a 19:1 segregation in T2 with 88 % pollen GFP expression. 13:1 ratio in T3, which
suggests that the PrpS3-GFP insert might be present at two loci (normally 15:1 Mendelian
segregation) and it reached homozygous state by pollen PrpS3-GFP expression of 96 %. The
HZ3.1-15 line reached homozygous state for the both markers (Kan and GFP) in generation
T4. This line was also used in the experiments testing for the functional analysis, while line
HZ3.1-3.1 was used only in preliminary tests due to its unusual segregation pattern (3:1 in
T2, 3:1 in T3, 7:1 in T4), although the GFP expression in T4 was complete.
In order to identify lines with the highest expression of the transgene the RT-PCR was used.
Initial PCR screening for the presence of PrpS1 and PrpS3 inserts was performed on the
leaves of young plants, using gene specific primers and flowers of the plants that were
positive for the insert were analysed by RT-PCR. Figure 5.2.a present the screening results
on BG16 line expressing PrpS1-GFP, while Figure 5.2.b present HZ3 line expressing PrpS3-
GFP.

154
a
b
Figure 5.2. (a) PrpS1 expressing A. thaliana plants that were positive for inserts were analysed by the RT-PCR in order to identify the highest expressors (lines BG16.8#3, BG16A#19 and BG16B#25). (b) PrpS3 expressing A. thaliana plants that were positive for inserts were analysed by RT-PCR in order to identify the highest expressors (line HZ3.1). GAPC was used as a standard and is presented at the lower part of each image. Reactions without DNA and with Col-0 DNA were used as a control.
The expression levels were analysed using RT-PCR, which was conducted on the flowers
from the same plants used for genotyping and housekeeping gene GAPC was used as a
control. Figure 5.2.a shows the results of the RT-PCR analysis on BG16 flowers. PrpS1
primers were designed to align on 5’ and 3’ ends of the insert and a size of the obtained
product was expected to be 583 bp. BG16B#25 exhibited uniform expression with all the
samples analysed, while the expression of the BG16A#19 and BG16.8#3 was less uniform.
The RT-PCR analysis was done on PrpS3 expressing flowers using HZ3.1 line only, with the
exception of the samples 7 and 13 (Figure 5.2.b). The reason for HZ3.3 not being analysed
by RT-PCR was with time and material constraints at the time. PrpS3 primers were designed
to yield a product of 436 bp. Under the same conditions, wt Col-0 was used as a control but
not yielding any product.
Size [bp] 1 3 4 6 7 8 9 10
506
506
396
396
1018 1 3 4 6 7 8 9 10
BG16B#25.
1 2 3 4 7 8 9 10 1 2 3 4 7 8 9 10BG16.8#3.
5 6 Size [bp]
506
506
1018
1018
1 2 3 4 7 8 9 10 1 2 3 4 7 8 9 10BG16A#19.
5 6 Size [bp]
506
506
1018
1018
PrpS1
GAPC
PrpS1
GAPC
PrpS1
GAPC
PrpS3
GAPC
1 2 3 4 5 HZ3.1.
1 2 3 4 5 6
298
506
1018
8 9 10 11 12 14 15 506
Size [bp]
666
8
8666
wt

155
It can be observed in Figure 5.2.b that PCR product of PrpS3 gene resulted in double band.
There could be a series of technical reasons for doublets in the gel, from the different
concentrations between the forward and reverse primers, different annealing temperatures, to
non-homogeneous distribution of the dye between molecules (Carlsson et al., 1995).
However, technical issues were taken into the account and no problems were found with
primers or melting temperatures. Primers were also used in genotyping PCR reaction where
they produce normal single band. The DNA electrophoresis was repeated using 1 % agarose
gel and running under lower currents for longer time but with the same result. In the process
of transformation cDNA of PrpS3 was used; however the PCR bands presented in the Figure
5.2.b were obtained from RNA so this could likely be a splicing variants. PrpS1 and PrpS8
were already demonstrated to produce splice variants but not PrpS3 (Hadjiosif, 2008).
The expression of PrpS3 was not uniform with all the flowers, six flowers exhibited higher
expression than the rest. Further selection of 5 samples was made initially, by quantifying
the intensity of the bands using ImageJ software (see Figure 5.3) as the highest expressing
lines were desired for the functional analysis.
a
b
Figure 5.3.: (a) Top 5 highest expressing PrpS1 and PrpS3, and the corresponding GAPC control. Legend: 1-BG16.8#3.5, 2-BG16A#19.5, 3-BG16A#19.8, 4-BG16B#25.1, 5-BG16B#25.9, 6-HZ3.1-2, 7-HZ3.1-3, 8-HZ3.1-13, 9-HZ3.1-14, 10-HZ3.1-15. (b) Column chart presenting ratio between transgene signal and GAPC signal. Quantification was performed using ImageJ software. Highest expressors outlined in red.
PrpS1 PrpS3
1 2 3 4 5 6 7 8 9 10
GAPC
0.7
0.8
0.9
1
1.1
1.2
1.3
Sign
al S
:GA
PC
156
cDNA samples of plants BG16.8#3.5, BG16A#19.5, BG16A#19.8, BG16B#25.1 and
BG16B#25.9 from PrpS1 expressing flowers, and HZ3.1.2, HZ3.1.3, HZ3.1.12, HZ3.1.14
and HZ3.1.15 from PrpS3 expressing flowers were further re-analysed on the DNA gel and
compared to GAPC control (Figure 5.3.a).
In order to get some idea of the quantification of expression of the transgene, the peak band
intensity was measured using ImageJ software for each sample and its GAPC control (Figure
5.3.b). From each transgenic line, two plants with the highest expression identified by
intensity ratio were used in subsequent functional experiments. The apparent lines with the
highest expression of the transgene were: BG16A#19.8 and BG16B#25.1 expressing PrpS1-
GFP, HZ3.1-3 and HZ3.1-15 expressing PrpS3-GFP, however lines BG16B#25.1 and
HZ3.1-15 exhibited higher and homozygous expression of GFP (see Tables 5.2 and 5.3).
The progeny of these plants were used in further experiments to determine whether the PrpS-
GFP was functional when expressed in A. thaliana pollen. Family tree of the PrpS1 and
PrpS3 expressing lines BG16 and HZ3 are presented in the Appendix II.
Since the RT-PCR results showed that mRNA was present in the pollen of transgenic A.
thaliana expressing PrpS1-GFP, we tried to confirm the PrpS1 expression at the protein level
in BG16 pollen. For this aim we extracted proteins in two different buffers suitable for the
extraction of transmembrane (TM) proteins: first buffer was 2x extraction buffer for TM
proteins and second buffer was additionally optimised for extraction of TM proteins
(personal communication with Andy Lovering). Proteins were extracted with a buffer with
high Gylcerol and Triton X-100 concentrations, and the sample was not boiled prior to
loading on SDS-PAGE, as proteins are likely to aggregate during boiling. After the transfer
of the gel onto the membrane, the blot was incubated in stripping buffer for short time before

157
detection with antibodies (see Materials and Methods). Proteins were separated by western
blotting and detected using alkaline phosphatase (Figure 5.4).
Figure 5.4.: Western blot analysis of pollen extract from BG16 pollen expressing PrpS1 and controls, using two different extraction buffers. Buffer 1 (left side) was 2x extraction buffer and buffer 2 (right side) was optimised for extraction of TM proteins (with increased Gylcerol and Triton X-100 concentrations; samples were not boiled prior to loading on a membrane; after the transfer, the blot was incubated in stripping buffer before detection with antibodies; see Materials and Methods). As controls were used A. thaliana non-transgenic Col-0 pollen extract, as positive control was used Papaver S1S3 pollen extract and as negative control Papaver S3S8 pollen extract. Samples were loaded on the membrane in duplicates, and after blotting the membrane was incubated in stripping buffer at 55 oC for 15 min before the incubation with antibodies. Primary antibody used was rat polyclonal anti-PrpS1 (60C) in 1:1000 concentration and secondary was anti-rat-AP in 1:5000 concentration. PrpS1 in Papaver extract is indicated by red star.
In Papaver S1 and S3 (S1S3) pollen extract several bands could be observed with both
extraction buffers, but extraction buffer 2 gave clearer result. PrpS1 size should be ~20 kDa
so the lower strong band correspond to it. However, bands in Papaver S1S3 pollen extract
were also detected at ~ 28 kDa mark, very strong at 30 kD and weaker at 36 kDa, The upper
band could correspond to PrpS dimer. In BG16 pollen extract, we could observe bands at
higher molecular weight ~ 28 and 30 kDa with the 28 kDa band being more intense than 30
kDa. There were also some weaker bands at ~10 kDa.
If PrpS forms multimers, this could indicate toward its potential function as a channel as
there are some reports of the small receptors that multmerize in order to form a channel, for
example small and novel transmembrane protein named Flower identified in Drosophila
nervous system (Yao et al., 2009). Flower so far offers most analogies to PrpS proteins
36 28
17
Buffer 1 1.3 3.8 BG16 Col-0 1.3 3.8 BG16 Col-0
Buffer 2
* *
158
although they do not share much sequence homology but rather a topological similarity. And
since the Flower function has been established and demonstrated to multimerize and form a
Ca2+ channel, this might be a possibility for PrpS as well. However, in order to confirm the
dimer or multimer using western blot further optimization might be required.
5.2.2. In vitro functional analysis of Papaver SI determinants in transgenic Arabidopsis
thaliana in vitro
As described earlier several PrpS1-GFP and PrpS3-GFP expressing transgenic A. thaliana
lines were selected for further functional analysis: BG16B#25.1-1 and BG16A#25.1-1.x
expressing PrpS1-GFP, and HZ3.1-3.1, HZ3.1-15.1 and HZ3.1-15.1-x expressing PrpS3-
GFP. Lines segregated 3:1 with respect for the Kan resistance marker in heterozygous state
and were expected to segregate 50 % for GFP expression. When they reached homozygous
state they were completely resistant to Kan and exhibited 100 % GFP expression. Transgene
mRNA expression was analysed using RT-PCR and the above selected lines were selected
for their high expression.
Pollen from transgenic A. thaliana expressing Papaver SI pollen S-determinant, PrpS, was
used in functional analysis. The semi-in vitro SI approach was adopted from the poppy SI
system. A. thaliana pollen expressing PrpS1-GFP or PrpS3-GFP germinated in the petri dish
to which control or SI reactions were induced by the addition of recombinant stigmatic PrsS
proteins (see Figure 5.5). Control reactions were comprised of untreated pollen, pollen that
was treated with heat denatured (i.e. biologically inactive) incompatible stigmatic proteins
and compatible stigmatic proteins, while incompatible reaction was comprised of incubating

159
PrpS1-GFP and PrpS3-GFP expressing A. thaliana pollen with PrsS1 and PrsS3 stigmatic
recombinant proteins, respectively (see Figure 5.5).
Figure 5.5.: Schematic diagram of the SI experiment in vitro. If PrsS1 or PrsS3 recombinant proteins are applied to Arabidopsis pollen expressing PrpS1-GFP or PrsS3-GFP (right side, red outline) there is the genetic match between pistil and pollen determinant and the result is incompatible interaction with inhibited pollen tube growth. Control reactions (left side, outlined with green) were comprised of untreated pollen, grown in GM only, of pollen incubated with inactivated heat denatured incompatible PrsS proteins or with compatible PrsS proteins. Compatible control reactions resulted in growth of pollen tubes.
The aim was to investigate whether characteristic features from Papaver SI could be
observed in A. thaliana pollen expressing PrpS-GFP. Therefore, following SI induction in
vitro the S-specific inhibition of pollen tube growth, the alterations of actin cytoskeleton,
pollen viability and PCD were examined in PrpS-GFP expressing A. thaliana pollen
(Geitmann et al., 2000, Thomas and Franklin-Tong, 2004, Jordan et al., 2000). A
preliminary investigation was conducted on the response of A. thaliana mesophyl protoplasts
using line BG3 expressing 35S::PrpS1 and Col-0 tansformed with 35S:: PrpS-GFP upon the
incubation with recombinant stigmatic PrsS proteins.
5.2.2.1. S-specific inhibition of transgenic A. thaliana pollen tube growth
The inhibition of transgenic pollen tubes was analysed upon the induced SI response in
pollen of transgenic A. thaliana lines BG16B#25.1-1 expressing PrpS1-GFP, and HZ3.1-15.1
expressing PrpS3-GFP. A. thaliana BG16B#25.1-1 and BG16B#25.1-2, and HZ3.1-15.1 and
Long pollen tubes (compatible reaction)
SI: PrsS1
or PrsS3
CONTROL REACTIONS:
• Untreated • Heat
Denatured PrsS1/PrsS3
& • PrsS3/PrsS1
Short pollen tubes (incompatible reaction)
PrpS1/PrpS3 pollen PrpS1/PrpS3 pollen

160
HZ3.1-3.1 pollen along with untransformed control and Papaver S1 and S3 control pollen
were pre-germinated for 1 h prior to the induction of SI and controls. Analysis was
conducted by measuring the length of pollen tubes after overnight incubation (details in
Materials and Methods section). Papaver S1S3 pollen was used as a control and was
incubated in GM only (untreated – UT) or had induced SI reaction. A. thaliana
untransformed pollen, also used as a control, was incubated in GM (UT) or with stigmatic
recombinant PrsS1 or PrsS3 proteins. A. thaliana transgenic pollen expressing PrpS1-GFP or
PrpS3-GFP was incubated in GM only (UT), had induced SI reaction by applying active
PrsS1 recombinant stigmatic proteins to PrpS1-GFP pollen or PrsS3 proteins to PrpS3-GFP
expressing pollen, while the control reactions comprised incubation with heat denatured (hd)
PrsS proteins and compatible PrsS proteins. Pollen was pre-germinated for 1 h before the SI
or controls were induced, as described above, and was then left to incubate for 20 h
(overnight). Results of pollen tube length measurements are presented in Figure 5.6.

161
Figure 5.6: A. thaliana pollen tube inhibition graph presenting pollen tube length in μm. First two bars in light gray represent Papaver pollen control untreated (UT) and treated with recombinant PrsS1/PrsS3 proteins (SI), red outline. Next three bars in dark grey represent Arabidopsis Col-0 pollen control UT, and treated recombinant PrsS1 and PrsS3, respectively. Next four bars in yellow represent BG16 pollen expressing PrpS1-GFP: BG16 –UT, treated with recombinant PrsS1 (SI), red outline. BG16 pollen was also treated with heat-denatured (hd) PrsS1 and with PrsS3 as a control. Last four bars in green represent HZ3 pollen expressing PrpS3-GFP: HZ3 – UT, and treated with recombinant PrsS3 (SI), red outline. HZ3 pollen was also treated with hd PrsS3 and PrsS1 as a control. Error bars represent ± standard deviation of mean. N=6 repeats for A. thaliana and N=3 for poppy; n=20 tubes measured.
Untreated and SI Papaver pollen were used as controls. The average length of the Papaver
pollen tubes grown in GM was 883±168 μm while the length of pollen tubes with induced SI
was 40±13 μm, which was about 96 % shorter (N=3, n=20 pollen tubes, P = 1.2x10-43,***).
The untreated A. thaliana (UT) pollen tubes reached average length of 753±263 μm and
were 15 % shorter compared to the poppy control pollen tube length (N=6; n=20 tubes;
P=5.2x10⁻³; **). However, when Col-0 pollen was treated with recombinant stigmatic PrsS1
(758±307 μm; P=0.87; N.S.) or PrsS3 (759±272 μm; P=0.89; N.S.), they had no effect
compared to the untreated pollen grown in GM only.
BG16B#25.1-1 pollen, which expresses PrpS1-GFP fusion protein, grown in GM only was
not significantly different compared to the untreated Col-0 control (737±245 μm; P=0.73;
N.S.) but when it was challenged with incompatible PrsS1 proteins (see Figure 5.6, yellow
bars outlined with red line), the pollen tube length exhibited 96 % decrease compared to the
0
200
400
600
800
1000
1200
Polle
n tu
be le
ngth
[μm
]
Poppy 1.3 Controls
Col-0 Controls BG16 HZ3
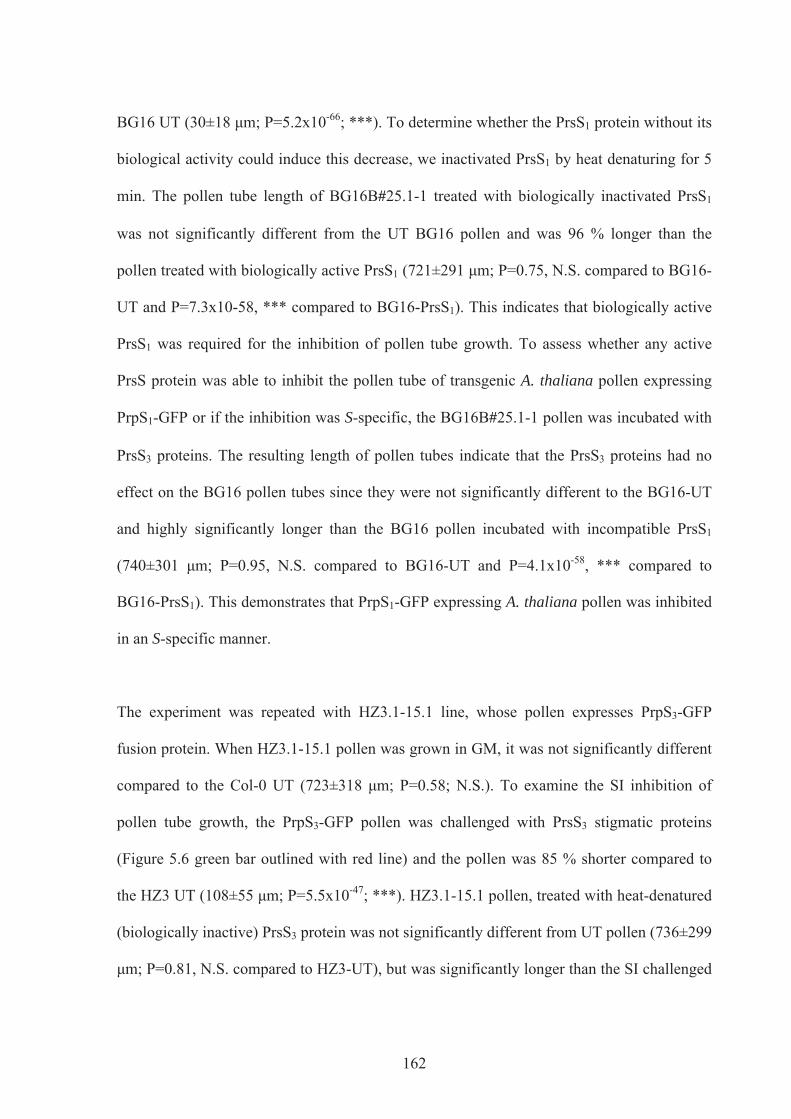
162
BG16 UT (30±18 μm; P=5.2x10-66; ***). To determine whether the PrsS1 protein without its
biological activity could induce this decrease, we inactivated PrsS1 by heat denaturing for 5
min. The pollen tube length of BG16B#25.1-1 treated with biologically inactivated PrsS1
was not significantly different from the UT BG16 pollen and was 96 % longer than the
pollen treated with biologically active PrsS1 (721±291 μm; P=0.75, N.S. compared to BG16-
UT and P=7.3x10-58, *** compared to BG16-PrsS1). This indicates that biologically active
PrsS1 was required for the inhibition of pollen tube growth. To assess whether any active
PrsS protein was able to inhibit the pollen tube of transgenic A. thaliana pollen expressing
PrpS1-GFP or if the inhibition was S-specific, the BG16B#25.1-1 pollen was incubated with
PrsS3 proteins. The resulting length of pollen tubes indicate that the PrsS3 proteins had no
effect on the BG16 pollen tubes since they were not significantly different to the BG16-UT
and highly significantly longer than the BG16 pollen incubated with incompatible PrsS1
(740±301 μm; P=0.95, N.S. compared to BG16-UT and P=4.1x10-58, *** compared to
BG16-PrsS1). This demonstrates that PrpS1-GFP expressing A. thaliana pollen was inhibited
in an S-specific manner.
The experiment was repeated with HZ3.1-15.1 line, whose pollen expresses PrpS3-GFP
fusion protein. When HZ3.1-15.1 pollen was grown in GM, it was not significantly different
compared to the Col-0 UT (723±318 μm; P=0.58; N.S.). To examine the SI inhibition of
pollen tube growth, the PrpS3-GFP pollen was challenged with PrsS3 stigmatic proteins
(Figure 5.6 green bar outlined with red line) and the pollen was 85 % shorter compared to
the HZ3 UT (108±55 μm; P=5.5x10-47; ***). HZ3.1-15.1 pollen, treated with heat-denatured
(biologically inactive) PrsS3 protein was not significantly different from UT pollen (736±299
μm; P=0.81, N.S. compared to HZ3-UT), but was significantly longer than the SI challenged

163
pollen, treated with biologically active PrsS3 (P=7.6x10-54, *** compared to HZ3+PrsS3).
The HZ3 pollen was also incubated with PrsS1 proteins and the resulting length of pollen
tubes indicates that the PrsS1 proteins had no effect on the HZ3 pollen tubes. Pollen tubes
incubated with PrsS1 were not significantly different to the HZ3-UT and highly significantly
longer to the HZ3 pollen incubated with incompatible PrsS3 (746±314 μm; P=0.66, N.S.
compared to HZ3-UT and P=4.7x10-53, *** compared to HZ3-PrsS3). This demonstrates that
PrpS3-GFP expressing A. thaliana pollen was inhibited in an S-specific manner.
Together, these data demonstrate that the inhibition of the PrpS1-GFP expressing pollen tube
growth in selected BG16 lines by recombinant PrsS1 proteins or PrpS3-GFP expressing
pollen in selected HZ3 lines by recombinant PrsS3 proteins acts in an S-specific manner and
requires biologically active PrsS1 or PrsS3 proteins, respectively. Pollen tube inhibition
assays that were carried on transgenic A. thaliana pollen expressing PrpS1-GFP or PrpS3-
GFP proteins challenged with PrsS1 or PrsS3 recombinant proteins show that inhibition
occurred very rapidly. Inhibited incompatible A. thaliana pollen tubes were very short which
was expected and pollen tube inhibition was complete. With Papaver SI the arrest of the
“incompatible” pollen tube growth is one of the first events upon the interaction of PrpS and
incompatible PrsS protein, which is crucial for successful prevention of fertilization.
This S-specific inhibition response of transgenic A. thaliana pollen expressing Papaver PrpS
proteins by PrsS proteins suggests that poppy male S-determinant, PrpS, is functional in A.
thaliana.
164
5.2.2.2. PrpS-PrsS interaction stimulates formation of punctate actin foci in transgenic
A. thaliana pollen
The results in previous section 5.4.2 confirmed that the Arabidopsis transgenic pollen
expressing Papaver PrpS-GFP was inhibited in an S-specific manner by the addition of the
recombinant stigmatic PrsS proteins. The formation of the punctate actin foci is one of the
hallmark features of SI response in Papaver as actin cytoskeleton is a very early target for
the SI signals (Snowman et al., 2002, Geitmann et al., 2000, Snowman et al., 2000, Poulter
et al., 2010a). Therefore, in order to provide further evidence that the observed inhibition of
A. thaliana pollen tube length was due to an SI response, we explored other key poppy SI-
like events in A. thaliana pollen. We investigated whether actin filament modification was
also observed in A.thailana PrpS-GFP expressing pollen when treated with PrsS
recombinant proteins.
We initiated the analysis of actin cytoskeleton in pollen of the transgenic A. thaliana lines
BG16B#25.1-1 expressing PrpS1-GFP, and HZ3.1-15.1 expressing PrpS3-GFP, after 3 h SI
challenge. BG16B#25.1-1 was incubated with recombinant stigmatic PrsS1 proteins and
HZ3.1-15.1 with PrsS3 proteins. Controls consisted of untreated (UT) Col-0 and transgenic
pollen; transgenic A. thaliana pollen treated with heat denatured (hd) recombinant proteins
or compatible recombinant proteins, as with previous assay.
Untransformed A. thaliana Col-0 pollen, grown in GM only, had a visible array of F-actin
filaments in pollen grains and pollen tubes (Figure 5.7.a) and the results also demonstrate
that actin filaments in nontransgenic Col-0 pollen were not disturbed upon the addition of
recombinant PrsS1 (Figure 5.7.b).
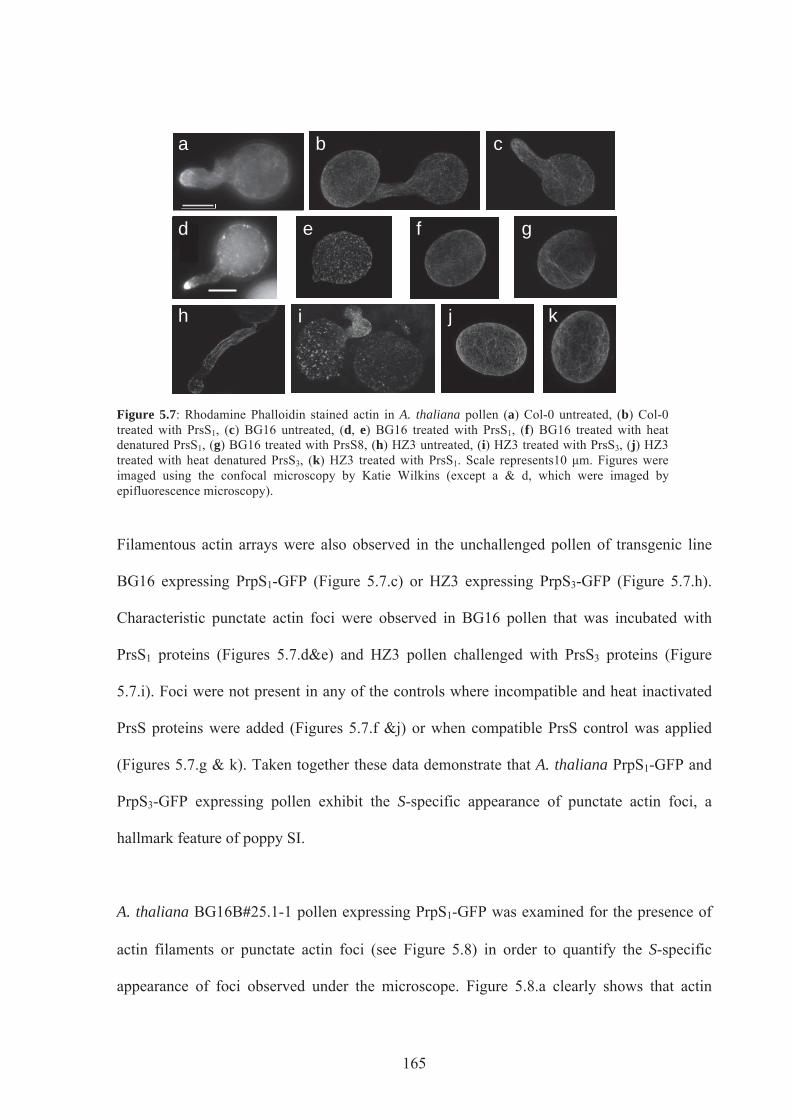
165
Figure 5.7: Rhodamine Phalloidin stained actin in A. thaliana pollen (a) Col-0 untreated, (b) Col-0 treated with PrsS1, (c) BG16 untreated, (d, e) BG16 treated with PrsS1, (f) BG16 treated with heat denatured PrsS1, (g) BG16 treated with PrsS8, (h) HZ3 untreated, (i) HZ3 treated with PrsS3, (j) HZ3 treated with heat denatured PrsS3, (k) HZ3 treated with PrsS1. Scale represents10 μm. Figures were imaged using the confocal microscopy by Katie Wilkins (except a & d, which were imaged by epifluorescence microscopy).
Filamentous actin arrays were also observed in the unchallenged pollen of transgenic line
BG16 expressing PrpS1-GFP (Figure 5.7.c) or HZ3 expressing PrpS3-GFP (Figure 5.7.h).
Characteristic punctate actin foci were observed in BG16 pollen that was incubated with
PrsS1 proteins (Figures 5.7.d&e) and HZ3 pollen challenged with PrsS3 proteins (Figure
5.7.i). Foci were not present in any of the controls where incompatible and heat inactivated
PrsS proteins were added (Figures 5.7.f &j) or when compatible PrsS control was applied
(Figures 5.7.g & k). Taken together these data demonstrate that A. thaliana PrpS1-GFP and
PrpS3-GFP expressing pollen exhibit the S-specific appearance of punctate actin foci, a
hallmark feature of poppy SI.
A. thaliana BG16B#25.1-1 pollen expressing PrpS1-GFP was examined for the presence of
actin filaments or punctate actin foci (see Figure 5.8) in order to quantify the S-specific
appearance of foci observed under the microscope. Figure 5.8.a clearly shows that actin
a b c
e f g
h i j k
d

166
filaments (blue bars) are predominant in all control treatments, while SI challenge on PrpS1-
GFP expressing pollen exhibit mostly punctate actin foci (red bars). Taking into account
only scored pollen with clearly visible actin structures, 88 % of the untreated non transgenic
Col-0 pollen samples exhibit filamentous actin, which was not affected if Col-0 pollen was
challenged with PrsS1 proteins (85 % filaments; P=0.46). Scoring filaments, BG16B#25.1-1
untreated pollen exhibited 88 % actin filaments (P=0.97 compared to Col-0 untreated;
N=250), while BG16B#25.1-1 that was incubated with biologically inactivated PrsS1 or
compatible PrsS8 exhibited 89 % actin filaments (P=0.78 and P=0.85, respectively,
compared to BG16 untreated, N=250), indicating that biologically active PrsS1 only are
required for the alterations in actin cytoskeleton. Quantification also revealed that SI
challenge of BG16 with PrsS1 resulted in 81 % of pollen exhibiting punctate actin foci
(Figure 5.8.c), which represents a highly significant 558 % increase compared to untreated
BG16 pollen (P=8.9x10-45; N=250).

167
a
b
c
Figure 5.8.: Quantification of actin foci and filaments in PrpS1-GFP expressing pollen. (a) actin foci (red bars) and filaments (blue bars) presented on the same graph; (b) quantification of actin filaments; (c) quantification of actin foci. N=5, n=50; Error bars represent ± St. Error of means.
None of the non-transgenic controls or BG16 controls with inactivated incompatible proteins
or compatible proteins showed actin foci pattern and were not significantly different from
the untreated pollen in which foci are mostly observed. Together these data demonstrate the
highly significant presence of punctate actin foci, specifically in SI challenged transgenic A.
thaliana BG16B#25.1-1 pollen, expressing PrpS1-GFP. These data demonstrate that there is
an S-specific interaction between biologically active PrsS1 and PrpS1-GFP, leading to the
alterations of actin cytoskeleton in PrpS1-GFP expressing A. thaliana pollen, that result in
the appearance of punctate actin foci. Therefore a key characteristic of poppy SI was
observed in transgenic A. thaliana pollen, indicating that PrpS1-GFP transgene is functional
in A. thaliana.
0 5
10 15 20 25 30 35 40
Filaments
Foci
0 5
10 15 20 25 30 35 40
Polle
n nu
mbe
r
0
5
10
15
20
25
30
35
Polle
n nu
mbe
r
168
5.2.2.3. Evidence for PCD in the A. thaliana transgenic pollen upon SI challenge
5.2.2.3.1. Pollen viability is decreased in an S-specific manner upon interaction between
PrpS-GFP expressing A. thaliana pollen and recombinant stigmatic PrsS
We were interested to examine whether the interaction between Papaver pollen and pistil
determinants affected Arabidopsis pollen viability. It has been shown in Papaver that the S-
specific interaction between PrpS and PrsS decreases pollen viability and triggers PCD
(Thomas and Franklin-Tong, 2004). The pollen viability in Papaver was analysed using
FDA, which becomes fluorescent when taken up by metabolically active–viable–pollen
(Breeuwer et al., 1995). However, we were unable to use the same drug in A. thaliana as it
was not possible to distinguish between FDA signal of viable pollen and GFP signal of
pollen expressing PrpS-GFP fusion protein. Therefore, we used the low toxicity non-
permeating azo-compound dye Evans Blue (Shigaki and Bhattacharyya, 1999). Dye
penetrated in non-viable cells, so they appear dark blue when inspected by the microscope,
while it was excluded from viable cells with intact membrane so they appeared colourless.
Lines of PrpS1-GFP and PrpS3-GFP expressing A. thaliana pollen (BG16B#25.1-1 and
BG16B#25.1-2, and HZ3.1-15.1 and HZ3.1-3.1) were used as for measuring pollen tube
length and pollen was collected and treated as with previous experiments. Viability of pollen
was inspected at three time points: 0 h, 8 h and 2 4h by adding 0.05 % Evans Blue to the
sample. Dye was left to incubate for 10 min and washed with GM before pollen viability
was assessed (see Figure 5.9). In poppy SI DNA fragmentation indicating PCD was
measured after 8 h (Thomas and Franklin-Tong, 2004) although the maximum DNA
fragmentation was observed at 14 h post SI (Jordan et al., 2000). A. thaliana pollen tubes

169
grew slower than Papaver with the optimized germination rates reported after 16 h, so we
chose to investigate viability at 24 h post-SI.
Figure 5.9.: Viability (%) of A. thaliana transgenic pollen BG16 (yellow bars) and HZ3 (green bars) along with Col-0 (dark gray bars) and Papaver pollen control (light gray bars) at 0 h, 8 h and 24 h. Pollen was incubated with GM only (UT), with incompatible PrsS1 proteins for BG16 pollen or PrsS3 proteins for HZ3 pollen (SI, red outline), with heat-denatured PrsS proteins and with compatible PrsS1 for BG16 pollen and PrsS3 for HZ3 pollen. Error bars represent standard deviation of mean. N=5 repeats (N=3 for poppy), n=117±21 pollen counted.
The initial viability of the untreated A. thaliana non-transgenic Col-0 pollen at t0 was 89±4
% (P=3.6x10⁻² compared to poppy UT). The viability of Col-0 pollen decreased by 17 %
after 8 h. The PrsS proteins did not have any effect on the viability of untransformed pollen,
viability of pollen treated with PrsS1 for 8 h was 76±11 % (P=0.71 compared to Col-0 t=8 h)
and viability of Col-0 treated with PrsS3 for 8 h was 77±9 % (P=0.83 compared to Col-0 t=8
h).
t0 controls
Poppy 1.3 controls
t=8h
Col-0 controls
t=8h BG16 t=8h
HZ3 t=8h
Poppy 1.3 controls
t=o/n
Col-0 controls
t=o/n HZ3 t=o/n
0
20
40
60
80
100
120
Pop
py 1
,3 U
T t0
C
ol0
UT
t0
BG
16 U
T t0
H
Z3 U
T t0
P
oppy
1,3
UT
t=8h
P
oppy
1,3
SI t
=8h
Col
0 U
T t=
8h
Col
0 S
1 t=
8h
Col
0 S
3 t=
8h
BG
16 U
T t=
8h
BG
16 S
1 t=
8h
BG
16 h
dS1
t=8h
B
G16
S3
t=8h
H
Z3 U
T t=
8h
HZ3
S3
t=8h
H
Z3 h
dS3
t=8h
H
Z3 S
1 t=
8h
Pop
py1,
3 U
T t=
o/n
Pop
py1,
3 S
I t=o
/n
Col
0 U
T t=
o/n
Col
0 S
1 t=
on
Col
0 S
3 t=
o/n
BG
16 U
T t=
o/n
BG
16 S
1 t=
o/n
BG
16 h
dS1
t=o/
n B
G16
S3
t=o/
n H
Z3 U
T t=
o/n
HZ3
S3
t=o/
n H
Z3 h
dS3
t=o/
n H
Z3 S
1 t=
o/n
Viab
ility
(%)
BG16 t=o/n
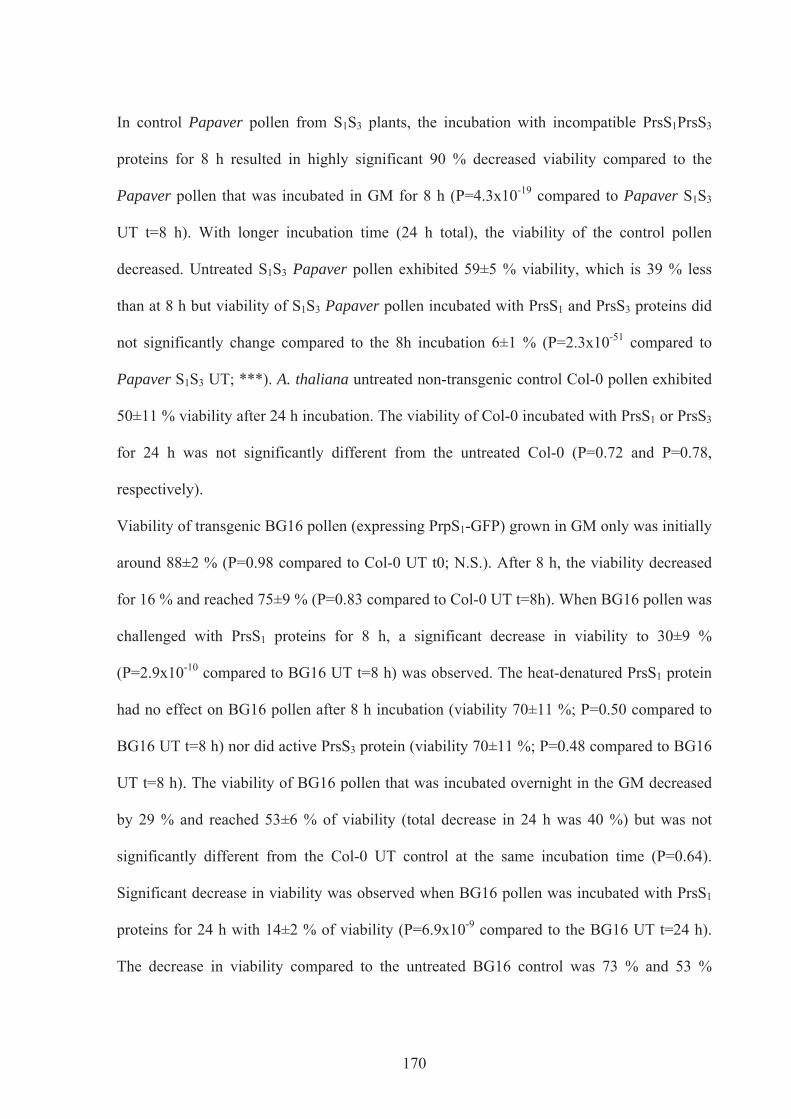
170
In control Papaver pollen from S1S3 plants, the incubation with incompatible PrsS1PrsS3
proteins for 8 h resulted in highly significant 90 % decreased viability compared to the
Papaver pollen that was incubated in GM for 8 h (P=4.3x10⁻¹⁹ compared to Papaver S1S3
UT t=8 h). With longer incubation time (24 h total), the viability of the control pollen
decreased. Untreated S1S3 Papaver pollen exhibited 59±5 % viability, which is 39 % less
than at 8 h but viability of S1S3 Papaver pollen incubated with PrsS1 and PrsS3 proteins did
not significantly change compared to the 8h incubation 6±1 % (P=2.3x10-51 compared to
Papaver S1S3 UT; ***). A. thaliana untreated non-transgenic control Col-0 pollen exhibited
50±11 % viability after 24 h incubation. The viability of Col-0 incubated with PrsS1 or PrsS3
for 24 h was not significantly different from the untreated Col-0 (P=0.72 and P=0.78,
respectively).
Viability of transgenic BG16 pollen (expressing PrpS1-GFP) grown in GM only was initially
around 88±2 % (P=0.98 compared to Col-0 UT t0; N.S.). After 8 h, the viability decreased
for 16 % and reached 75±9 % (P=0.83 compared to Col-0 UT t=8h). When BG16 pollen was
challenged with PrsS1 proteins for 8 h, a significant decrease in viability to 30±9 %
(P=2.9x10⁻¹⁰ compared to BG16 UT t=8 h) was observed. The heat-denatured PrsS1 protein
had no effect on BG16 pollen after 8 h incubation (viability 70±11 %; P=0.50 compared to
BG16 UT t=8 h) nor did active PrsS3 protein (viability 70±11 %; P=0.48 compared to BG16
UT t=8 h). The viability of BG16 pollen that was incubated overnight in the GM decreased
by 29 % and reached 53±6 % of viability (total decrease in 24 h was 40 %) but was not
significantly different from the Col-0 UT control at the same incubation time (P=0.64).
Significant decrease in viability was observed when BG16 pollen was incubated with PrsS1
proteins for 24 h with 14±2 % of viability (P=6.9x10⁻⁹ compared to the BG16 UT t=24 h).
The decrease in viability compared to the untreated BG16 control was 73 % and 53 %

171
compared to the BG16 pollen incubated with PrsS1 proteins for 8 h only. This could suggest
that the cell death response in A. thaliana pollen is somewhat slower compared to Papaver
pollen. The response was S-specific and observed only with active PrsS1 proteins as
incubation of BG16 with heat-denatured PrsS1 or PrsS3 for 24 h had no significant effect on
pollen compared to the untreated BG16 control (P=0.75 and P=0.69, respectively).
Viability of PrpS3-GFP expressing transgenic pollen HZ3 exhibited similar results to the
observed from BG16. HZ3 grown in GM exhibited an initial viability of 89±2 % (P=0.92
compared to Col-0 UT t0; N.S.). After 8 h, the viability decreased by 24 % and reached 69±7
% (P=0.40 compared to Col-0 UT t=8 h). The incubation of HZ3 pollen with recombinant
PrsS3 proteins for 8 h caused a significant decrease of viability to 36±14 % (P=6.5x10⁻⁶
compared to HZ3 UT t=8 h). Only active PrsS3 protein had an effect on the viability of HZ3
pollen. After 8 h incubation with heat-denatured PrsS3 protein, the viability was 72±9 %
(P=0.53 compared to HZ3 UT t=8 h). No effect on viability was observed when the HZ3
pollen was incubated in the presence of active PrsS1 proteins that decreased viability of
BG16 pollen (viability 69±10 %; P=0.83 compared to HZ3 UT t=8 h). After overnight
incubation in GM the viability of HZ3 pollen decreased for further 26 % and reached 50±6
% (total decrease in 24 h was 44 %) but was not significantly different from the Col-0 UT
control at t=24 h (P=0.93). With incompatible reaction between HZ3 pollen and recombinant
PrsS3 proteins, the significant decrease in viability was observed after 24 h incubation as it
reached 21±6 % (P=2.2x10⁻⁵ compared to the HZ3 UT t=24 h). The decrease in viability
compared to the untreated HZ3 pollen incubated in GM for 24 h was 57 %, while further
decrease compared to incompatible incubation of HZ3 pollen with PrsS3 for 8 h was 40 %.
As with BG16 pollen, the response was S-specific and observed only with active PrsS3
172
proteins. The incubation of HZ3 with heat inactivated PrsS3 or active PrsS1 for 24 h had no
significant effect on pollen compared to the HZ3 control grown in GM only (P=0.75 and
P=0.69, respectively).
The SI-induced decrease of viability in pollen from BG16B#25.1-1 line expressing PrpS1-
GFP and HZ3.1-15.1 line expressing PrpS3-GFP, by the addition of the recombinant
stigmatic PrsS1 or PrsS3, respectively, indicates that the S-specific interaction between PrsS
and PrpS is functional and results in cell death of transgenic pollen.
5.2.2.3.2. Decrease of pollen viability involving DEVDase activity
A key downstream event after the S-specific interaction between the stigmatic PrsS proteins
and pollen receptor PrpS in Papaver, is the activation of the caspase-like proteins ending up
with the PCD of pollen (Thomas and Franklin-Tong, 2004). The PCD in Papaver was
demonstrated with assays measuring DNA fragmentation, and with the use of caspase-3
specific tetrapeptide inhibitor Ac-DEVD-CHO, which abolished PCD (Thomas and
Franklin-Tong, 2004, Jordan et al., 2000). Hence, we investigated whether DEVD-ase
activity plays any role in the S-specific decrease of viability observed in transgenic A.
thaliana lines BG16B#25.1-1.1, BG16B#25.1-1.5 and BG16B#25.1-1.7, expressing PrpS1-
GFP and HZ3.1-15.1-1, HZ3.1-15.1-6 and HZ3.1-15.1-12, expressing PrpS3-GFP.
Transgenic A. thaliana homozygous pollen from T4 generation plant lines was used for the
experiment. A. thaliana plants from lines BG16B#25.1-1.1 and BG16B#25.1-1.7 were used
as a source for PrpS1-GFP pollen, and lines HZ3.1-15.1-1 and HZ3.1-15.1-5 for PrpS3-GFP
pollen. PrpS1-GFP and PrpS3-GFP expressing A. thaliana pollen, and controls Papaver S1S3

173
pollen and A. thaliana untransformed Col-0 pollen were pretreated with the inhibitor of
DEVDase activity, tetrapeptide Ac-DEVD-CHO, before the induction of SI by the addition
of recombinant stigmatic PrsS proteins. Additional control was comprised of pollen
incubated in GM only (untreated – UT) or pollen that had induced SI reaction. Viability of
pollen was investigated at two time points: 0h and 8h by adding 0.05 % Evans Blue solution
to the sample. The results of these assays are presented in the Figure 5.10. When comparing
percentages of viability between treatments, the control was assumed a 100 % activity.
A. thaliana non-transgenic pollen germinated in GM (UT) exhibited 90±4 % viability at t0
and was only 1 % higher than viability of untreated Papaver pollen at t0 (P=0.79 compared
to poppy UT). After 8 h incubation the viability of Col-0 pollen decreased by 28 % having
65±4 % of viable pollen. The pretreatment with tetrapeptide Ac-DEVD-CHO did not have
any effect on the non-transgenic pollen; viability was 62±6 % (P=0.66 compared to Col-0
UT pollen t=8 h). PrsS proteins did not have any effect on the viability of the Col-0 control
pollen, viability of pollen treated with PrsS1 for 8 h was 65±4 % (P=0.95 compared to Col-0
UT t=8 h) and viability of Col-0 treated with PrsS3 for 8 h was 66±6 % (P=0.98 compared to
Col-0 UT t=8 h).
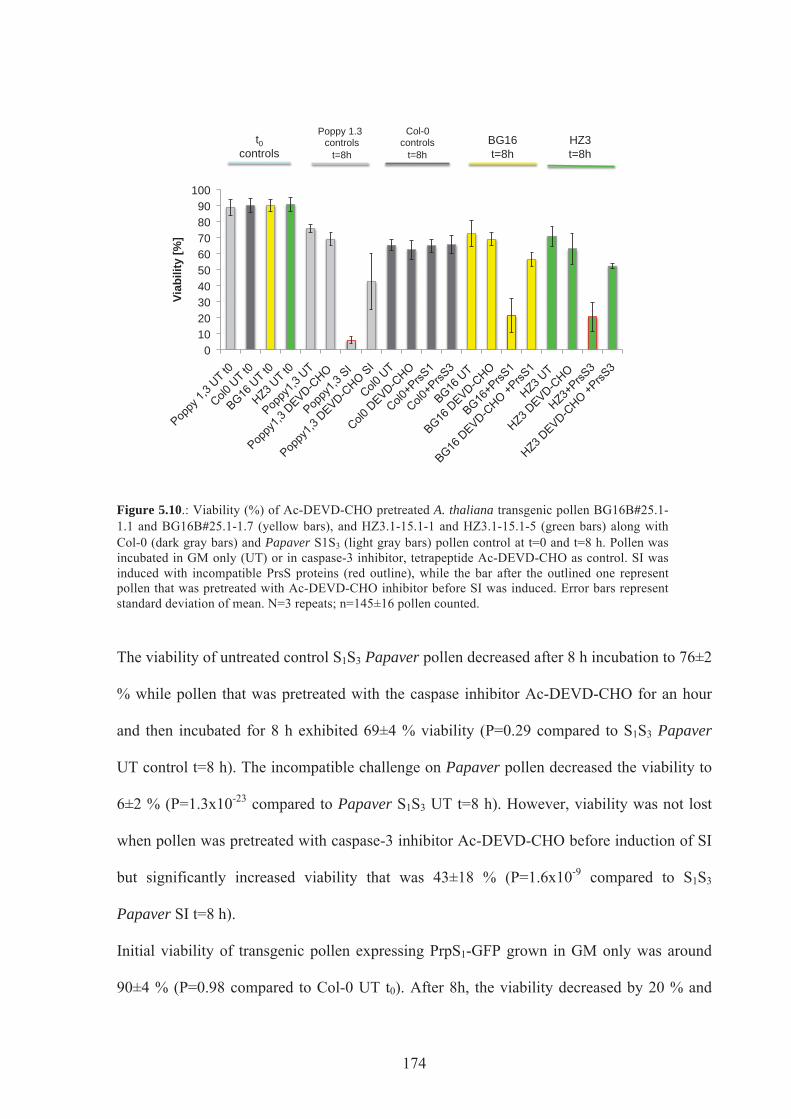
174
Figure 5.10.: Viability (%) of Ac-DEVD-CHO pretreated A. thaliana transgenic pollen BG16B#25.1-1.1 and BG16B#25.1-1.7 (yellow bars), and HZ3.1-15.1-1 and HZ3.1-15.1-5 (green bars) along with Col-0 (dark gray bars) and Papaver S1S3 (light gray bars) pollen control at t=0 and t=8 h. Pollen was incubated in GM only (UT) or in caspase-3 inhibitor, tetrapeptide Ac-DEVD-CHO as control. SI was induced with incompatible PrsS proteins (red outline), while the bar after the outlined one represent pollen that was pretreated with Ac-DEVD-CHO inhibitor before SI was induced. Error bars represent standard deviation of mean. N=3 repeats; n=145±16 pollen counted.
The viability of untreated control S1S3 Papaver pollen decreased after 8 h incubation to 76±2
% while pollen that was pretreated with the caspase inhibitor Ac-DEVD-CHO for an hour
and then incubated for 8 h exhibited 69±4 % viability (P=0.29 compared to S1S3 Papaver
UT control t=8 h). The incompatible challenge on Papaver pollen decreased the viability to
6±2 % (P=1.3x10⁻²³ compared to Papaver S1S3 UT t=8 h). However, viability was not lost
when pollen was pretreated with caspase-3 inhibitor Ac-DEVD-CHO before induction of SI
but significantly increased viability that was 43±18 % (P=1.6x10⁻⁹ compared to S1S3
Papaver SI t=8 h).
Initial viability of transgenic pollen expressing PrpS1-GFP grown in GM only was around
90±4 % (P=0.98 compared to Col-0 UT t0). After 8h, the viability decreased by 20 % and
t0 controls
Poppy 1.3 controls
t=8h
Col-0 controls
t=8h BG16 t=8h
0 10 20 30 40 50 60 70 80 90
100 Vi
abili
ty [%
]
HZ3 t=8h
175
was 72±8 % (P=0.28 compared to Col-0 UT t=8 h). The pretreatment of BG16 pollen with
tetrapeptide Ac-DEVD-CHO did not significantly affect the viability (69±4 %, P=0.60
compared to BG16 UT t=8 h). SI challenge of BG16B#25.1-1.1 and BG16B#25.1-1.7 pollen
with PrsS1 proteins for 8 h caused a significant decrease of viability to 22±11 % (P=5.3x10-
13 compared to BG16 UT t=8 h), but viability increased significantly by 162 % when PrsS1-
challenged BG16 pollen was pretreated with inhibitor Ac-DEVD-CHO (57±4 %; P=4x10⁻⁷
compared to BG16 SI t=8 h).
Similar viabilities were observed in HZ3.1-15.1-1 and HZ3.1-15.1-5 pollen expressing
PrpS3-GFP. Initial viability of HZ3 pollen was 91±4 % (P=0.88 compared to Col-0 UT t0).
After 8 h, the viability decreased for 22 % and reached 71±6 % (P=0.39 compared to Col-0
UT t=8 h). When HZ3 pollen was pretreated with tetrapeptide Ac-DEVD-CHO, the viability
was not significantly affected (63±10 %, P=0.23 compared to HZ3 UT t=8 h). Challenge of
PrpS3-GFP expressing pollen with stigmatic recombinant PrsS3 proteins for 8 h caused a
significant decrease of viability to 21±9 % (P=7.8x10⁻¹³ compared to HZ3 UT t=8 h);
however, viability increased significantly by 155 % if SI challenged HZ3 pollen was
pretreated with inhibitor Ac-DEVD-CHO (52±2 %; P=3x10⁻⁶ compared to HZ3 SI t=8 h).
Taken together, these data demonstrate that PrsS triggers cell death in PrpS-GFP expressing
pollen in an S-specific manner. Moreover, the cell death involves DEVDase activity and
indicates that PCD might be triggered in incompatible A. thaliana pollen expressing PrpS1-
GFP or PrpS3-GFP fusion protein when incubated with the cognate recombinant stigmatic
PrsS proteins.

176
5.2.2.4. PCD in A. thaliana transgenic pollen expressing PrpS-GFP
As described in previous section, the viability of transgenic A. thaliana pollen expressing
male PrpS1-GFP or PrsS3-GFP was reduced in an S-specific manner upon treatment with the
recombinant stigmatic PrsS proteins. In order to ascertain whether the poppy SI response is
fully functional in A. thaliana, analysis of PCD was addressed. Therefore, we initiated
studies to analyse SI-induced PCD in transgenic A. thaliana pollen expressing PrpS1-GFP
and PrpS3-GFP by attempting to measure caspase-3-like DEVDase activity more directly
using the caspase-3 specific fluorogenic tetrapeptide Ac-DEVD-AMC. The stimulation of
several specific caspase-like activites was demonstrated using caspase activity assays (Bosch
and Franklin-Tong, 2007). They were based on measuring the release of the fluorophore
from the specific peptide substrate tetrapeptide, e.g. caspase-3 optimal tetrapeptide
recognition motif is DEVD. Substrate used in the fluorometric assay has DEVD conjugated
to the fluorescent probe AMC (Ac-DEVD-AMC). The fluorescence can be detected upon
cleavage of the AMC from the DEVD peptide by caspase-3-like proteins. Assays measuring
caspase-like activity in Papaver pollen were optimised to use 10 μg of the total pollen
protein extract in the assay. Due to the miniature size of A. thaliana flowers which produce
less pollen compared to Papaver flowers and the fact that pollen required fresh collection
every day, preliminary experiments were carried out on A. thaliana pollen, in order to
investigate whether the caspase activity could be reliably measured with less than 10 μg of
total A. thaliana pollen protein extract. In order to use the same concentration of pollen
protein extract as it was used with Papaver pollen, the method was not suitable for A.
thaliana pollen, as the pollen collection from A. thaliana flowers was very time consuming.

177
Figure 5.11 shows initial preliminary data using 3, 4 and 5 μg protein extract that
encouraged us to pursue this assay further.
a
b
c
Figure 5.11.: DEVDase activity of protein extract from BG16B#25.1-1 and HZ3.1-15.1 pollen that was incubated with GM only (UT), or had induced SI by addition of recombinant stigmatic PrsS1 (BG16 S1) and PrsS3 (HZ3 S3) proteins, respectively. Non-transgenic Col-0 incubated in GM only (UT) was used as a control (far left bar). (a) 5 μg of pollen extract; (b) 4 μg of pollen extract and (c) 3 μg of pollen extract.
Preliminary results in Figure 5.11 suggested that DEVDase activity in SI-induced samples of
transgenic A. thaliana pollen expressing PrpS1-GFP and PrpS3-GFP was detected and
0
500
1000
1500
2000
2500
3000
3500
4000
4500
5000
Col-0 UT 5ug
BG16 UT 5ug
BG16 S1 5ug
HZ3 UT 5ug HZ3 S3 5ug
DEV
Das
e A
ctiv
ity (R
FU)
0
500
1000
1500
2000
2500
3000
3500
4000
Col-0 UT 4ug
BG16 UT 4ug
BG16 S1 4ug
HZ3 UT 4ug HZ3 S3 4ug
DEV
Das
e A
ctiv
ity (R
FU)
-500 0
500 1000 1500 2000 2500 3000 3500 4000
Col-0 UT 3ug
BG16 UT 3ug
BG16 S1 3ug
HZ3 UT 3ug
HZ3 S3 3ug DEV
Das
e A
ctiv
ity (R
FU)

178
increased compared to the control sample, even when using the substrate in concentration as
low as 3 μg. Since the protein concentration of our loaded pollen extract in the assay was on
the lower limit of detection, this means that any changes in the very sensitive A. thaliana
pollen balance appeared enhanced in the caspase assay.
In order to examine whether SI interaction in A. thaliana transgenic pollen triggered PCD,
we used another approach and pretreated pollen with the tetrapeptide inhibitor Ac-DEVD-
CHO before the induction of SI and measurement of caspase-like activity. A. thaliana
transgenic homozygous T4 generation plant lines BG16B#25.1-1.1 and BG16B#25.1-1.7
were used as a source for PrpS1-GFP pollen, and lines HZ3.1-15.1-1 and HZ3.1-15.1-5 for
PrpS3-GFP pollen; pollen from untransformed Col-0 was used as control. Pollen was
pretreated with 100 μM tetrapeptide inhibitor, Ac-DEVD-CHO and SI was induced by the
addition of incompatible recombinant stigmatic PrsS proteins: PrsS1 proteins added to PrpS1-
GFP expressing pollen and PrsS3 proteins to PrpS3-GFP expressing pollen. Controls
comprised of transgenic and untransformed pollen that was untreated, incubated with the
inhibitor Ac-DEVD-CHO only or incubated with PrsS1 or PrsS3 recombinant stigmatic
proteins.
The caspase-3-like activity measurements are presented in Figure 5.12.
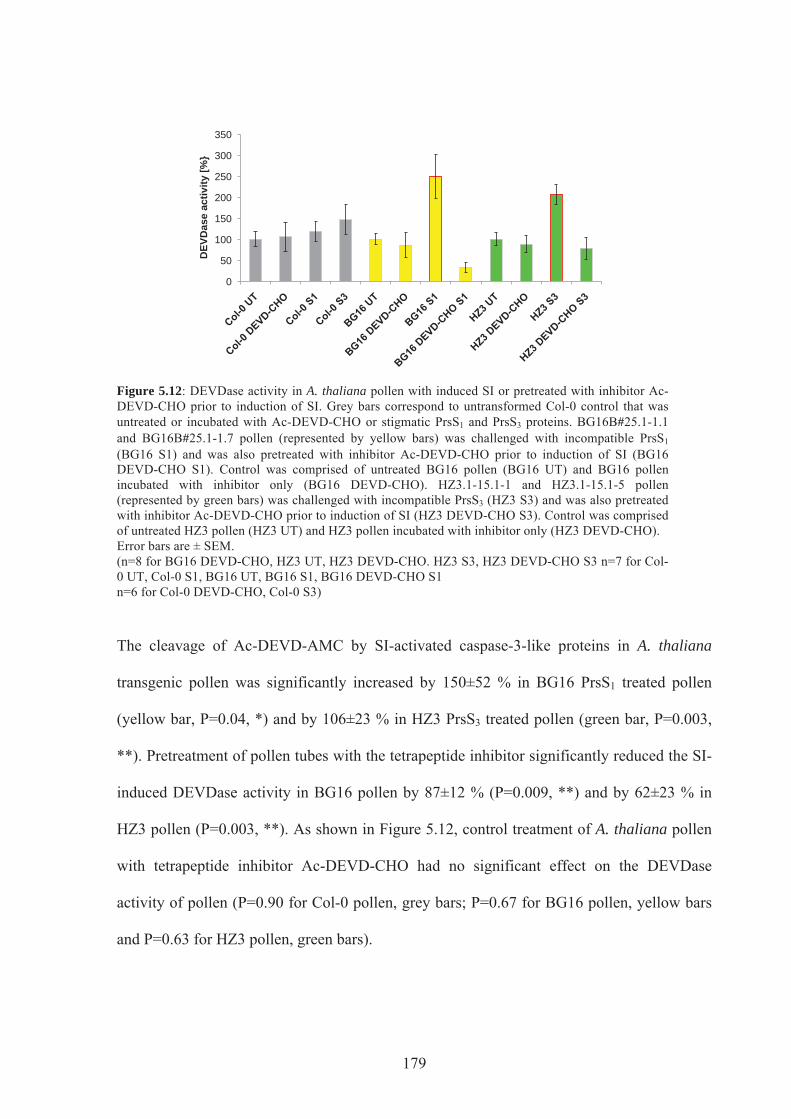
179
Figure 5.12: DEVDase activity in A. thaliana pollen with induced SI or pretreated with inhibitor Ac-DEVD-CHO prior to induction of SI. Grey bars correspond to untransformed Col-0 control that was untreated or incubated with Ac-DEVD-CHO or stigmatic PrsS1 and PrsS3 proteins. BG16B#25.1-1.1 and BG16B#25.1-1.7 pollen (represented by yellow bars) was challenged with incompatible PrsS1 (BG16 S1) and was also pretreated with inhibitor Ac-DEVD-CHO prior to induction of SI (BG16 DEVD-CHO S1). Control was comprised of untreated BG16 pollen (BG16 UT) and BG16 pollen incubated with inhibitor only (BG16 DEVD-CHO). HZ3.1-15.1-1 and HZ3.1-15.1-5 pollen (represented by green bars) was challenged with incompatible PrsS3 (HZ3 S3) and was also pretreated with inhibitor Ac-DEVD-CHO prior to induction of SI (HZ3 DEVD-CHO S3). Control was comprised of untreated HZ3 pollen (HZ3 UT) and HZ3 pollen incubated with inhibitor only (HZ3 DEVD-CHO). Error bars are ± SEM. (n=8 for BG16 DEVD-CHO, HZ3 UT, HZ3 DEVD-CHO. HZ3 S3, HZ3 DEVD-CHO S3 n=7 for Col-0 UT, Col-0 S1, BG16 UT, BG16 S1, BG16 DEVD-CHO S1 n=6 for Col-0 DEVD-CHO, Col-0 S3)
The cleavage of Ac-DEVD-AMC by SI-activated caspase-3-like proteins in A. thaliana
transgenic pollen was significantly increased by 150±52 % in BG16 PrsS1 treated pollen
(yellow bar, P=0.04, *) and by 106±23 % in HZ3 PrsS3 treated pollen (green bar, P=0.003,
**). Pretreatment of pollen tubes with the tetrapeptide inhibitor significantly reduced the SI-
induced DEVDase activity in BG16 pollen by 87±12 % (P=0.009, **) and by 62±23 % in
HZ3 pollen (P=0.003, **). As shown in Figure 5.12, control treatment of A. thaliana pollen
with tetrapeptide inhibitor Ac-DEVD-CHO had no significant effect on the DEVDase
activity of pollen (P=0.90 for Col-0 pollen, grey bars; P=0.67 for BG16 pollen, yellow bars
and P=0.63 for HZ3 pollen, green bars).
0
50
100
150
200
250
300
350
DEV
Das
e ac
tivity
[%}
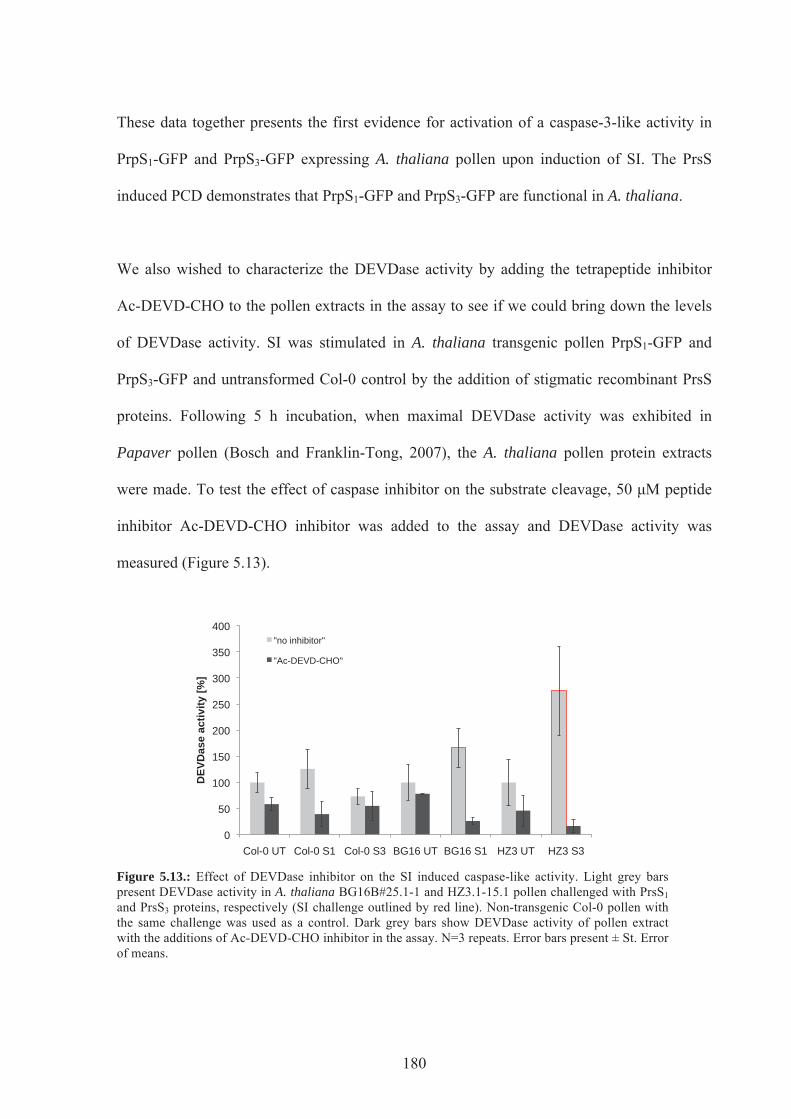
180
These data together presents the first evidence for activation of a caspase-3-like activity in
PrpS1-GFP and PrpS3-GFP expressing A. thaliana pollen upon induction of SI. The PrsS
induced PCD demonstrates that PrpS1-GFP and PrpS3-GFP are functional in A. thaliana.
We also wished to characterize the DEVDase activity by adding the tetrapeptide inhibitor
Ac-DEVD-CHO to the pollen extracts in the assay to see if we could bring down the levels
of DEVDase activity. SI was stimulated in A. thaliana transgenic pollen PrpS1-GFP and
PrpS3-GFP and untransformed Col-0 control by the addition of stigmatic recombinant PrsS
proteins. Following 5 h incubation, when maximal DEVDase activity was exhibited in
Papaver pollen (Bosch and Franklin-Tong, 2007), the A. thaliana pollen protein extracts
were made. To test the effect of caspase inhibitor on the substrate cleavage, 50 μM peptide
inhibitor Ac-DEVD-CHO inhibitor was added to the assay and DEVDase activity was
measured (Figure 5.13).
Figure 5.13.: Effect of DEVDase inhibitor on the SI induced caspase-like activity. Light grey bars present DEVDase activity in A. thaliana BG16B#25.1-1 and HZ3.1-15.1 pollen challenged with PrsS1 and PrsS3 proteins, respectively (SI challenge outlined by red line). Non-transgenic Col-0 pollen with the same challenge was used as a control. Dark grey bars show DEVDase activity of pollen extract with the additions of Ac-DEVD-CHO inhibitor in the assay. N=3 repeats. Error bars present ± St. Error of means.
0
50
100
150
200
250
300
350
400
Col-0 UT Col-0 S1 Col-0 S3 BG16 UT BG16 S1 HZ3 UT HZ3 S3
DEV
Das
e ac
tivity
[%]
"no inhibitor"
"Ac-DEVD-CHO"
181
Results in Figure 5.13 show the increase of DEVDase activity by 66 % in PrpS1-GFP
expressing pollen challenged with PrsS1 and increase by 175 % in PrpS3-GFP expressing
pollen challenged with PrsS3. Despite the increase, the results of this preliminary experiment
were not significantly different from the untreated controls (P= 0.47 for PrpS1 and 0.21 for
PrpS3). However, when the inhibitor Ac-DEVD-CHO was used in the assay, the activity was
reduced, indicating the activated caspase-3-like DEVDase activity. DEVDase activity was
decreased significantly with the addition of the inhibitor Ac-DEVD-CHO in PrpS1-GFP and
PrpS3-GFP expressing pollen that had SI induced, indicating that the PrsS-PrpS interaction
stimulates high DEVDase activity in transgenic A. thaliana pollen.
As our data indicate, DEVDase activity could be decreased, however, the results were not
significant. Experiment was repeated only three times so it might be possible that with more
repeats and higher protein concentration we could observe significant response.
5.2.3. A. thaliana mesophyll protoplasts expressing PrpS1
The previous sections demonstrated that PrpS1-GFP and PrpS3-GFP were functional in
pollen of transgenic A. thaliana. Preliminary experiments were conducted to explore whether
Papaver PrpS1 receptor could be functional in other tissues as well. This would demonstrate
that for a functional SI response, just PrpS and PrsS were required, while the downstream
components required for the characteristic SI response were already present in the host cell.
These initial preliminary studies were done using A. thaliana mesopyll protoplasts as they
offer versatile cell-based system. Initially, A. thaliana BG3, stable transformant line was
used, expressing PrpS1 under the control of 35S promoter. Using RT-PCR the presence of
PrpS1 mRNA was confirmed in three weeks old BG3 seedlings, however, the signal for

182
expression of the functional protein using western blot was not possible to detect. However,
if the protein was expressed than it should be somehow responding to the recombinant PrsS1.
We attempted a series of experiments trying to capture the response between two
determinants: immunolocalisation, viability and caspase activity assay, but no response was
detected. There could be various reasons for this:
1. PrpS1 protein might not be expressed in high enough levels in BG3 protoplasts and young
seedlings.
2. If it was expressed it might not be properly folded and therefore not functional.
3. It might be expressed in a very low concentration and it might not be expressed in all the
cells of seedlings.
Therefore we decided to use a system of transient DNA expression in A. thaliana non-
transgenic Col-0 mesophyll protoplasts. We transfected Col-0 protoplasts with 35S:PrpS1-
GFP, so the transfected protoplasts could be visualised by detecting GFP reporter gene and
the response to PrsS1 would be anticipated. Following transfection protocol (see materials
and methods) we isolated Col-0 protoplasts and transfected them with 35S:PrpS1-GFP. The
transfection rates were very low, between 10-19 %, however the GFP signal was observed
and detected (see Figure 5.14).
a
b
Figure 5.14: GFP expression in Col-0 protoplasts transformed with 35S:PrpS1-GFP. (a) protoplasts expressing GFP on the right, left is brightfield image; (b) protoplats with no GFP expression on the image on the right, left represents brightfield image of the same protoplast. The experiment was done together with Dr. Javier-Andres Juarez-Diaz.
GFP no GFP

183
Using transformed Col-0 protoplasts we measured the viability of Col-0 35S:PrpS1-GFP
protoplasts that were incubated with recombinant PrsS1 proteins at three time points: t0, 24h
and 48h. As a control we used Col-0 protoplasts transfected with H2O. The preliminary
experiment was repeated twice and viability was measured using 0.05 % Evans Blue.
Results are presented on Figure 5.15.
Figure 5.15: Viability of A. thaliana Col-0 protoplats transfected with 35S:PrpS1-GFP (red bars) and H2O control (blue bars), incubated with recombinant PrsS1 Error bars represent ± St. Deviation. N=2
At t0 the viability of Col0 - 35S:PrpS1-GFP and H2O control was around 80 %. After 24h the
average viability of the control was 60±4 % and the viability of PrpS1-GFP expressing
protoplasts was 44±6 %. The viability after 48h was 36±20 % for the control and 18±14 %
for the transfected protoplasts, which was 50 % less than the control.
The preliminary experiments indicate the S-specific reduction of the viability of PrpS1-GFP
expressing protoplasts upon PrsS1 incubation. However, for more reliable and firmer
conclusion, the experiments should be repeated several times.
The protoplasts were not difficult to produce but were extremely sensitive to any sort of
stress from the environment and often the transformation rates were not high. So in order to
0
10
20
30
40
50
60
70
80
90
t0 24h 48h
Viab
ility
(%)
Col0 H20 + S1
Col0 35S:PrpS1-GFP + S1
184
produce high quality protoplasts continuously, the protocol should be optimised further to
suit the needs of our experiment (Yoo et al., 2007, Wu et al., 2009). The preliminary work
has so far confirmed our hypothesis that PrpS1-GFP could be expressed and potentially
functional in other tissue. However, further work would be required on this area to provide
strong, conclusive evidence. Experiments for interaction between PrpS1-GFP expressed
protoplasts and recombinant PrsS1 proteins should be conducted, such as: examination of
actin stuctures (preliminary experiments pointed at the problem of overlapping red signal of
chloroplasts in protoplasts and rhodamine-phalloidin stained actin), changes in the viability,
involvement of the caspase-like activity, examination of PCD. Protoplast system could also
be used to study interaction between PrpS and PrsS.
5.3 DISCUSSION
The studies presented here demonstrate that the PrpS proteins can be functional when
expressed in A. thaliana. Experiments focused on the use of semi-in vitro system by growing
transgenic A. thaliana pollen expressing PrpS-GFP and challenging it with incompatible
stigmatic recombinant PrsS proteins. Several aspects were examined, which will be
discussed here.
5.3.1 Alterations to the actin cytoskeleton
In this study we have established the presence of the punctate actin foci in A. thaliana pollen
tube expressing PrpS-GFP after 3 h challenge with incompatible PrsS recombinant protein.

185
Actin cytoskeleton is of vital importance for normal pollen tube growth. During the SI
process in Papaver rhoeas, it undergoes through rapid and dramatic alterations (Geitmann et
al., 2000, Snowman et al., 2002, Poulter et al., 2008, Poulter et al., 2010a). First changes of
actin depolymerisation were observed as early as 1-2 min (Snowman et al., 2002) and after 3
h stable punctate actin foci were observed (Geitmann et al., 2000, Snowman et al., 2002).
Results presented in this study show that controls challenged with compatible or heat
denatured PrsS proteins resulted in the same display of bundled actin filaments as untreated
BG16 pollen or as non-transgenic pollen. It was also demonstrated that PrsS proteins, that
were added to the untransformed pollen had no effect on the actin cytoskeleton. Although
some intermediate actin structures (filaments-foci) or no structures at all were also observed,
their presence was significantly lower than the filaments. The restriction of the staining
technique was mostly in uneven staining of the large heterogeneous pollen population.
Although the sample was mixed when the staining (or permeabilization, fixative, or
treatment) was added, the pollen settled to the bottom of the tube, and consequently each of
the pollen grains and tubes were unevenly exposed to the media. Mixed pollen population
was unavoidable, as we needed to collect enough pollen to compensate for its losses during
the washing steps of the protocol. Great precaution was taken with the experimental
procedure and with collecting the same stage flowers from healthy A. thaliana plants.
The cytoskeleton in A. thaliana pollen tubes was only disturbed upon the challenge of PrpS1
or PrpS3 expressing pollen with its cognate incompatible PrsS1 or PrsS3 recombinant protein,
respectively. Foci were quantified in PrpS1 expressing BG16 pollen where they were present
in majority of all analysed pollen. This suggests that functional interaction between
biologically active PrsS protein and its cognate PrpS receptor was required for the disruption
of the actin cytoskeleton in pollen. Therefore, the punctate actin foci that we observed in the

186
transgenic A. thaliana model upon the interaction between PrpS1-GFP and PrsS1 represents
an important landmark in exploring Papaver SI system in other species.
The next step with the actin cytoskeleton would be to characterise the temporal dynamics,
composition and formation of the punctate actin foci in order to investigate how closely it
resembles the well-characterised poppy SI response, where reorganisations are observed as
early as 1-2 min post SI. Another aspect of SI induced actin cytoskeleton remodelling, that
was not investigated in this study, were the ABPs involved in regulating these modifications,
such as CAP and ADF, and were demonstrated and analysed in Papaver pollen (Poulter et
al., 2010a). It would be also interesting to know whether there was a crosstalk between
microtubules and microfilaments (Poulter et al., 2008) and also link between actin
depolymerization and PCD (Thomas et al., 2006) should be explored further in incompatible
A. thaliana pollen.
Our studies, conducted in transgenic A. thaliana, a model for Papaver SI, reported for the
first time, that reorganisations of the actin cytoskeleton occured upon PrsS interaction with
PrpS-GFP in A. thaliana and the appearance of characteristic punctate actin foci was
confirmed. In a self compatible A. thaliana, that is a more closely related to Brassicaceae
than Papaveraceae, this might seem surprising but it suggests, that just PrpS and PrsS are
required for the SI response. However, the recent advances in the research on the SI induced
actin reorganisations in different systems suggest, that there might be a parallel between the
mechanistically different SI systems and that the SI systems could be more conserved then
known so far, which would put our research of two evolutionary distant species into
perspective (Liu et al., 2007c, Iwano et al., 2007, Wang et al., 2010, Poulter et al., 2011).

187
5.3.2. Decrease of viability involving DEVDase activity
Pollen viability was examined in PrpS1 and PrpS3 expressing A. thaliana pollen, and in non-
transgenic pollen and Papaver S1 and S3 pollen that were used as a control, using Evans Blue
dye due to the overlap of the signal from FDA stain and GFP in transgenic pollen tubes.
However, many investigations on PCD processes in plants utilize Evans Blue dye as a tool to
assess cell death levels, for example, the investigation of the kiss-of-death (KOD)-induced
PCD or UV and H2O2 induced PCD in A. thaliana (He et al., 2007b, Blanvillain et al., 2011).
Evans Blue dye quenches the fluorescent GFP signal, therefore the imaging of Evans Blue
staining and corresponding GFP fluorescence of the same pollen tube was not possible. The
GFP expression would be very informative, especially initially, with the pollen from the
heterozygous lines, where we could directly compare the GFP fluorescence in PrpS-GFP
expressing pollen and how it is affected during the interaction between PrpS and PrsS.
Papaver pollen viability decreased to 7 % as previously reported by (Jordan et al., 2000),
while the viability of A. thaliana pollen decreased to 30 %, which was significant decrease.
The compatible stigmatic PrsS recombinant proteins had no effect on the integrity of
transgenic pollen membrane. We also established that only biologically active incompatible
PrsS1 (with BG16 pollen) or PrsS3 (with HZ3 pollen) proteins can trigger the decrease in the
membrane integrity as heat denatured version did not affect pollen viability, which remained
same as in untreated pollen. So, the decrease in the membrane integrity of pollen and
therefore loss of viability occurred in an S-specific manner upon the interaction between
PrpS-GFP and PrsS.
We examined viability after 24 h incubation. Control pollen viability was around 50 %,
while the viability of SI induced PrpS1-GFP or PrpS3-GFP pollen decreased for further 50

188
%. Lower viability in pollen from homozygous lines was expected earlier, considering rapid
inhibition of pollen tubes and homozygous state of pollen used. There can be several
possible explanations for this: A. thaliana pollen could retain membrane integration and
therefore viability for longer period of time, suggesting that the “SI” in A. thaliana is acting
slower. On the other hand, data, that 50 % of control pollen tubes remained viable for 24 h
was not surprising as (Fan et al., 2001) also reported that A. thaliana pollen tubes exhibit
clear cytoplasmic streaming after 24 h incubation and even 36 h, although not all pollen
tubes were healthy. In conclusion, our data presented indicate that S-specific interaction
between PrpS and PrsS results in cell death of transgenic A. thaliana pollen expressing
PrpS1-GFP and PrpS3-GFP fusion proteins, respectively.
Thomas and Franklin-Tong, (2004) reported for the first time that SI interaction in Papaver
triggers PCD. They pretreated incompatible pollen with DEVDase inhibitor and measured
pollen tube length. They demonstrated that Ac-DEVD-CHO alleviates pollen tube inhibition
that is consequence of SI response and that pollen tube growth was recovered with the use of
the caspase-3 inhibitor. Our results also indicate, that the SI induced decrease in viability
could provide a link with DEVDase activity in A. thaliana pollen. PrpS1-GFP or PrpS3-GFP
expressing A. thaliana pollen was challenged with PrsS1 or PrsS3, respectively, and
stimulated SI response, which resulted in significantly decreased pollen viability. When
pollen was pretreated with the inhibitor of the caspase-3 activity, Ac-DEVD-CHO, the
viability was significantly higher in BG16 and HZ3 A. thaliana pollen. The results
confirmed that poppy PrpS can be functional in A. thaliana pollen at least “in vitro”.

189
5.3.3. PCD in A. thaliana transgenic pollen
The data presented in the Section 5.4. indicates, that Arabidopsis transgenic pollen
expressing PrpS1-GFP or PrpS3-GFP fusion proteins triggered PCD upon SI interaction. We
analysed SI-mediated PCD in transgenic A. thaliana pollen further by investigating the role
of the caspase-3-like activity. Jordan et al., (2000) demonstrated DNA degradation in
incompatible Papaver pollen and the complete evidence for the PCD was provided by
(Thomas and Franklin-Tong, 2004) with the study utilising caspase-3 inhibitor Ac-DEVD-
CHO. In their study they also demonstrated SI-specific release of cytochrome-c into cytosol
from mitochondria and PARP cleavage activity. Bosch and Franklin-Tong, (2007) took
investigations of PCD in Papaver further. They widened their investigation by examining
the involvement of other caspase-like activities in Papaver SI. They also provided a
temporal profile on the caspase-3-like activity by imaging live cell activity with the use of
specific probe CR-(DEVD)2. The caspase-like activities in their study were measured by
ustilising a specific fluorescent probes, attached on the tetrapeptide, specific for caspase
cleavage. In addition to DEVDase activity, VEIDase, LEVDase and YVADase activities
were also identified (Bosch and Franklin-Tong, 2007, Bosch et al., 2010).
We investigated PCD in A. thaliana pollen by measuring DEVDase activity upon cleavage
of the AMC tagged tetrapeptide DEVD (Ac-DEVD-AMC) and identified caspase-3-like
activity that was highly increased when the transgenic pollen expressing PrpS1-GFP or
PrpS3-GFP was incubated with PrsS1 or PrsS3 recombinant proteins. This activity was
alleviated when pollen was pretreated with caspase-3 inhibitor Ac-DEVD-CHO prior to the
SI induction. However, the basal DEVDase activity was observed in the control pollen and

190
for firmer statistical data the experiment should be repeated with higher pollen protein
concentration.
In order to confirm that the transgenic A. thaliana system, expressing Papaver PrpS proteins,
has the same downstream elements as poppy pollen, analysis of other caspase-like activities
that were identified in Papaver would be beneficial (Bosch and Franklin-Tong, 2007, Bosch
et al., 2010). For the investigation of the detailed temporal profile of caspase-3-like activity
in incompatible transgenic A. thaliana pollen, live cell imaging could be applied using probe
CR(DEVD)2.
Characterization and functional analysis of transgenic A. thaliana, presented in this chapter,
has confirmed that Papaver S-locus determinants can be transformed into A. thaliana and
that hallmark features of Papaver SI are exhibited in A. thaliana pollen expressing fusion
proteins PrpS-GFP. The demonstrated hallmark features, that were observed upon in vitro SI
challenge of A. thaliana pollen expressing PrpS-GFP and cognate stigmatic PrsS
recombinant protein, were pollen tube growth inhibition, formation of punctate actin foci,
decrease of viability and increase in DEVDase activity.
Until recently, SI induced alterations to actin cytokeleton, production of ROS and PCD were
characteristic for SI in Papaver, but recently they were reported from another SI system – S-
RNase induced SI in Pyrus pyrifolia pollen (Liu et al., 2007c, Wang et al., 2010). The SI
induced alterations to actin cytoskeleton were not reported so far in the Brassica pollen upon
SI interaction, however the study conducted by (Iwano et al., 2007) reported the SI induced
actin alterations in the stigmatic papillae cells in Brassica. These data indicates that
downstream events of SI, such as the alterations to the actin cytoskeleton, ROS production
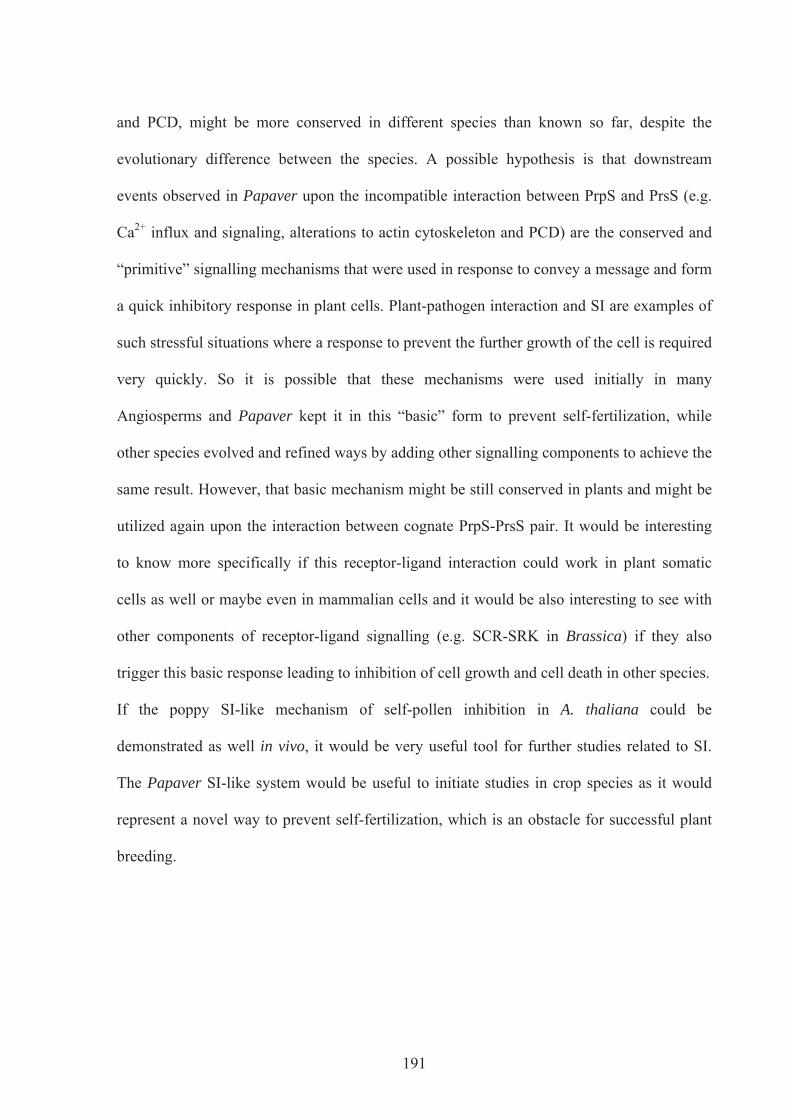
191
and PCD, might be more conserved in different species than known so far, despite the
evolutionary difference between the species. A possible hypothesis is that downstream
events observed in Papaver upon the incompatible interaction between PrpS and PrsS (e.g.
Ca2+ influx and signaling, alterations to actin cytoskeleton and PCD) are the conserved and
“primitive” signalling mechanisms that were used in response to convey a message and form
a quick inhibitory response in plant cells. Plant-pathogen interaction and SI are examples of
such stressful situations where a response to prevent the further growth of the cell is required
very quickly. So it is possible that these mechanisms were used initially in many
Angiosperms and Papaver kept it in this “basic” form to prevent self-fertilization, while
other species evolved and refined ways by adding other signalling components to achieve the
same result. However, that basic mechanism might be still conserved in plants and might be
utilized again upon the interaction between cognate PrpS-PrsS pair. It would be interesting
to know more specifically if this receptor-ligand interaction could work in plant somatic
cells as well or maybe even in mammalian cells and it would be also interesting to see with
other components of receptor-ligand signalling (e.g. SCR-SRK in Brassica) if they also
trigger this basic response leading to inhibition of cell growth and cell death in other species.
If the poppy SI-like mechanism of self-pollen inhibition in A. thaliana could be
demonstrated as well in vivo, it would be very useful tool for further studies related to SI.
The Papaver SI-like system would be useful to initiate studies in crop species as it would
represent a novel way to prevent self-fertilization, which is an obstacle for successful plant
breeding.

192
CHAPTER 6
Functional analysis in vivo of transgenic A. thaliana
expressing Papaver S-determinants, PrsS and PrpS

193
6.1 INTRODUCTION
Papaver female S-determinant PrsS gene and whole S1-locus were introduced into A.
thaliana using Agrobacterium transformation. The transformation of the S1-locus was
carried out by Barend de Graaf (line BG6) and transformation of PrsS1 and PrsS3 by Huawen
Zou (lines HZ1 and HZ2). This chapter describes the characterization of transgenic A.
thaliana lines expressing PrsS1 (HZ1), PrsS3 (HZ2) and S1-locus as well as in vivo functional
analysis using PrsS1 and PrsS3 expressing plants and pollen from transgenic A. thaliana
expressing PrpS1-GFP and PrpS3-GFP, described in previous chapter. The constructs are
presented in Table 6.1.
Table 6.1: Cartoon illustrates the constructs of the poppy SI determinants that were used for Agrobacterium mediated transformation into A. thaliana.
Gene Resistance Marker Name Construct
PrsS1 Basta HZ1
PrsS3 Basta HZ2
S1-locus Kan BG6
To achieve tissue specific expression of the female S-determinants PrsS1 and PrsS3 Stig1
promoter from N.tabacum was used and for expression of S1-locus native poppy promoter
was used. Kanamycin (Kan) resistance cassette was used as a selection marker with S1-locus
expressing transformants BG6 and Basta resistance was used for selection of the PrsS
expressing A. thaliana.
PrsS1 Stig1 NOS
PrsS3 Stig1 NOS
S1-locus PrpS1 PrsS1
NOS

194
In order to analyse PrsS expressing transgenic A. thaliana lines in vivo and semi in vitro
approaches were used. Papaver-like SI was analysed in vivo in A. thaliana in order to
determine whether Papaver S-genes can be fully functional in A. thaliana. The functionality
of the inserted PrsS and PrpS in A. thaliana were tested in vivo by pollinations assays and
crosses for seed set. For this, T3 generation of transgenic A. thaliana lines HZ1.1-3.1 and
HZ1.8-2.1 flowers expressing PrsS1, and HZ2.6-1.1 and HZ2.13-5.1 expressing PrsS3 were
used as females, and lines BG16B#25.1-1 and HZ3.1-15.1, expressing PrpS1 and PrpS3,
respectively, were used as pollen donors. Scheme of crosses can be seen on Figure 6.1.
Incompatible response was expected with PrsS1 expressing stigma that was pollinated with
PrpS1-GFP expressing pollen, and PrsS3 expressing stigma, pollinated with PrpS3-GFP
expressing pollen. Controls were comprised of compatible crosses, e.g. PrsS1 stigma
pollinated with PrpS3 pollen or PrsS3 stigma pollinated with PrpS1 pollen. Pollen
functionality was tested by using Col-0 stigma as female, and PrpS1 or PrpS3 expressing
pollen as male, while the receptiveness of the PrsS1 or PrsS3 expressing stigmas was tested
by pollinations with Col-0 pollen. Following the emasculation and pollination, stigmas were
either collected in aniline blue for the analysis of pollen tube growth or left to develop on the
plant for the analysis of the seed set.
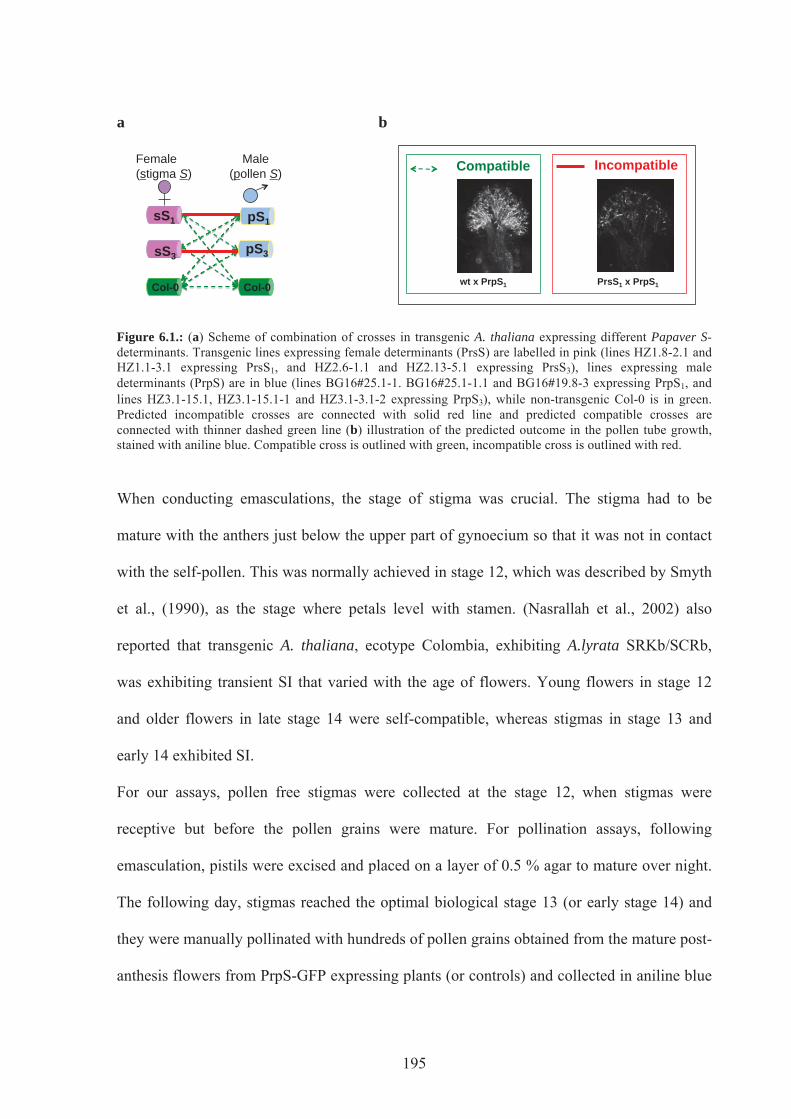
195
a
b
Figure 6.1.: (a) Scheme of combination of crosses in transgenic A. thaliana expressing different Papaver S-determinants. Transgenic lines expressing female determinants (PrsS) are labelled in pink (lines HZ1.8-2.1 and HZ1.1-3.1 expressing PrsS1, and HZ2.6-1.1 and HZ2.13-5.1 expressing PrsS3), lines expressing male determinants (PrpS) are in blue (lines BG16#25.1-1. BG16#25.1-1.1 and BG16#19.8-3 expressing PrpS1, and lines HZ3.1-15.1, HZ3.1-15.1-1 and HZ3.1-3.1-2 expressing PrpS3), while non-transgenic Col-0 is in green. Predicted incompatible crosses are connected with solid red line and predicted compatible crosses are connected with thinner dashed green line (b) illustration of the predicted outcome in the pollen tube growth, stained with aniline blue. Compatible cross is outlined with green, incompatible cross is outlined with red.
When conducting emasculations, the stage of stigma was crucial. The stigma had to be
mature with the anthers just below the upper part of gynoecium so that it was not in contact
with the self-pollen. This was normally achieved in stage 12, which was described by Smyth
et al., (1990), as the stage where petals level with stamen. (Nasrallah et al., 2002) also
reported that transgenic A. thaliana, ecotype Colombia, exhibiting A.lyrata SRKb/SCRb,
was exhibiting transient SI that varied with the age of flowers. Young flowers in stage 12
and older flowers in late stage 14 were self-compatible, whereas stigmas in stage 13 and
early 14 exhibited SI.
For our assays, pollen free stigmas were collected at the stage 12, when stigmas were
receptive but before the pollen grains were mature. For pollination assays, following
emasculation, pistils were excised and placed on a layer of 0.5 % agar to mature over night.
The following day, stigmas reached the optimal biological stage 13 (or early stage 14) and
they were manually pollinated with hundreds of pollen grains obtained from the mature post-
anthesis flowers from PrpS-GFP expressing plants (or controls) and collected in aniline blue
sS1
sS3
Col-0 Col-0
Female (stigma S)
Male (pollen S)
pS1
pS3
Compatible
wt x PrpS1
Incompatible
PrsS1 x PrpS1

196
16 h after pollination. For the seed set analysis, pistils were left on the plant to develop the
siliques, which were collected before shedding seeds.
6.2. RESULTS
6.2.1. Characterization of A. thaliana expressing Papaver PrsS determinants
The primary goal was to analyse the PrsS expression of transgenic A. thaliana lines
expressing PrsS1, PrsS3 or PrsS8 under the control of Stig1 promoter. It was expected that the
promoter would direct specific expression of PrsS at high levels in stigmatic tissue. No
reporter gene was tagged with the PrsS, so the analysis relied upon the segregation of the
resistance marker Basta and on the PCR analysis.
Seedlings of Arabidopsis::PrsS were initially screened by spraying Basta and only the plants
containing the PrsS transgene were expected to survive. For the segregation analysis,
seedlings were grown in MS medium containing Basta (see Materials & Methods) and
resistant and non-resistant seedlings were counted. Heterozygous plants were expected to
segregate in Mendelian fashion, while homozygous plants were expected to be 100 %
resistant on the Basta containing media. The aim of the analysis was to identify the
homozygous PrsS-expressing A. thaliana lines with the highest expression of the transgene.
PCR screening for the presence of inserts was performed initially on the leaves of young
plants, using gene specific primers, as described in the Materials and Methods. The plants
that were positive for the insert were selected for the analysis of the transcript by RT-PCR.

197
Figure 6.2. presents the RT-PCR results on HZ1 line expressing PrsS1 and HZ2 line
expressing PrsS3.
a
b
Figure 6.2.: (a) PrsS1-expressing plants that were positive for inserts were analysed by RT-PCR to identify the highest expressers (lines HZ1.1, HZ1.2, HZ1.3, HZ1.4, HZ1.8). (b) PrsS3-expressing plants that were positive for inserts were analysed by RT-PCR to identify the highest expressers (lines HZ2.1, HZ2.2, HZ2.3, HZ2.4, HZ2.6, HZ2.13). With the RT-PCR reactions GAPC was used as a standard (lower part of each image). Reactions with Col-0 DNA and without DNA were used as a negative control.
PrsS1 insert was detected in 55 progenies out of 65, which showed a ~6:1 segregation ratio.
The PCR product size with designed primers was 225 bp. The RT-PCR analysis was
performed on 33 progenies with the insert confirmed by PCR on genomic DNA (Figure
6.2.a). Transcription of the PrsS genes were lower compared to the GAPC used as standard,
and in the line HZ1.2.3, no band was detected, which could mean that the plant was not
expressing PrsS1 or that the expression was below the level of detection.
With the PCR genotyping of 38 plants for PrsS3 insert in transgenic A. thaliana, 33 were
found to be expressing PrsS3 transgene which resulted in a ~ 6:1 segregation ratio. The
1 2 3
GAPC
PrsS1
506 396
220
Size [bp]
HZ1.2. 1 2 3
506
1018
1 2 3 4 5 HZ1.1.
1 2 3 4 5 4 5 6 7 8 HZ1.2.
4 5 6 7 8 10 1 2 4 5 HZ1.3.
1 2 4 5
PrsS1
GAPC 506
1018
396
220
506 396
Size [bp]
506
1018
396
298
506 396
220 201
1 3 4 5 HZ1.4.
1 3 4 5 1 3 4 5 HZ1.8.
1 3 4 52 6 7 8 9 Size [bp]
PrsS1
GAPC
PrsS3
GAPC 506
1018
506
1018
300
1 2 3 4 5 HZ2.1.
1 2 3 4 5 1 2 3 4 5 HZ2.2.
1 2 3 4 5 5 6 7 8 9 HZ2.3.
5 6 7 8 9
1 2 3 4 HZ2.3.
1 2 3 4 1 2 3 4 HZ2.3.
1 2 3 4
GAPC
PrsS3
506
1018
396
220
PrsS3
GAPC
1 2 3 4 5 HZ2.4.
1 2 3 4 5 1 2 3 4 5 HZ2.6.
1 2 3 4 5 1 2 3 4 5 HZ2.13.
1 2 3 4 5 6 7 8 9 506 396 220
506
1018
396
Size [bp]
Size [bp]
Size [bp]

198
product size using primers was 196 bp, which is as expected. Flowers from all the plants
were analysed by RT-PCR for the relative expression of PrsS3 (Figure 6.2.b).
The functional analysis was only performed on the highest expressing PrsS1 and PrsS3
expressing lines HZ1 and HZ2, so the further selection of 5 samples was made initially, by
quantifying the intensity of the bands using ImageJ software (see Figure 6.3). cDNA
samples of plants HZ1.1-1, HZ1.1-2, HZ1.1-3, HZ1.3-5 and HZ1.8-2 from PrsS1 expressing
flowers, and HZ2.6-1, HZ2.6-2, HZ2.6-5, HZ2.13-5 and HZ2.13-8 from PrsS3 expressing
flowers were further re-analysed on the DNA gel and compared to the GAPC control (Figure
6.3.a).
a
b
Figure 6.3.: (a) Top 5 highest expressing PrsS1 and PrsS3 plants, and the corresponding GAPC control(bottom). Legend: 11-HZ1.1-1, 12-HZ1.1-2, 13-HZ1.1-3, 14-HZ1.3-5, 15-HZ1.8-2, 16-HZ2.6-1,17- HZ2.6-2, 18-HZ2.6-5, 19-HZ2.13-5, 20-HZ2.13-8. (b) Column chart presenting ratio between transgene signal of PrsS and GAPC signal. Quantification was performed using ImageJ software. The highest expressors outlined in red.
In order to quantify the expression of the transgene, the peak band intensity was measured
using ImageJ software for each sample and its GAPC control (Figure 6.3.b). From each
transgenic line, two plants with the highest expression identified by the intensity ratio were
used in subsequent functional experiments. The apparent highest expressing lines were:
PrsS1 PrsS3
11 12 13 14 15 16 17 18 19 20
GAPC
0.7
0.8
0.9
1
1.1
1.2
Sign
al S
:GA
PC
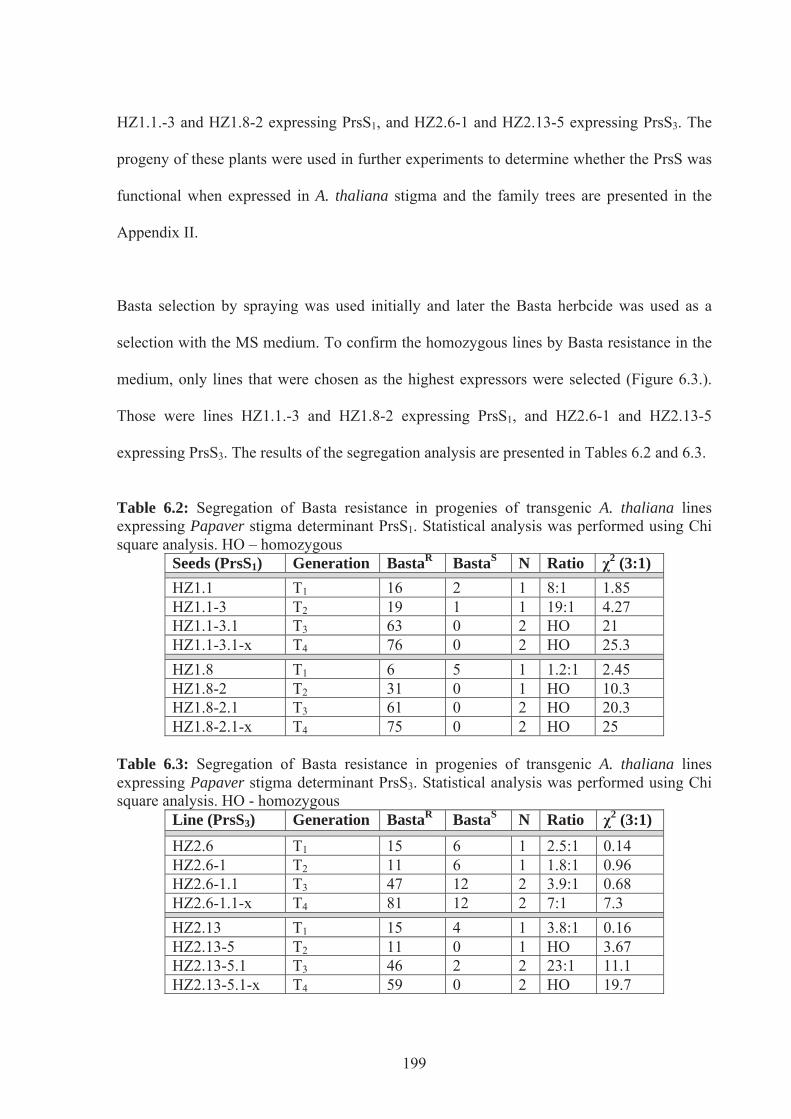
199
HZ1.1.-3 and HZ1.8-2 expressing PrsS1, and HZ2.6-1 and HZ2.13-5 expressing PrsS3. The
progeny of these plants were used in further experiments to determine whether the PrsS was
functional when expressed in A. thaliana stigma and the family trees are presented in the
Appendix II.
Basta selection by spraying was used initially and later the Basta herbcide was used as a
selection with the MS medium. To confirm the homozygous lines by Basta resistance in the
medium, only lines that were chosen as the highest expressors were selected (Figure 6.3.).
Those were lines HZ1.1.-3 and HZ1.8-2 expressing PrsS1, and HZ2.6-1 and HZ2.13-5
expressing PrsS3. The results of the segregation analysis are presented in Tables 6.2 and 6.3.
Table 6.2: Segregation of Basta resistance in progenies of transgenic A. thaliana lines expressing Papaver stigma determinant PrsS1. Statistical analysis was performed using Chi square analysis. HO – homozygous
Seeds (PrsS1) Generation BastaR BastaS N Ratio χ2 (3:1)
HZ1.1 T1 16 2 1 8:1 1.85 HZ1.1-3 T2 19 1 1 19:1 4.27 HZ1.1-3.1 T3 63 0 2 HO 21 HZ1.1-3.1-x T4 76 0 2 HO 25.3
HZ1.8 T1 6 5 1 1.2:1 2.45 HZ1.8-2 T2 31 0 1 HO 10.3 HZ1.8-2.1 T3 61 0 2 HO 20.3 HZ1.8-2.1-x T4 75 0 2 HO 25
Table 6.3: Segregation of Basta resistance in progenies of transgenic A. thaliana lines expressing Papaver stigma determinant PrsS3. Statistical analysis was performed using Chi square analysis. HO - homozygous
Line (PrsS3) Generation BastaR BastaS N Ratio χ2 (3:1)
HZ2.6 T1 15 6 1 2.5:1 0.14 HZ2.6-1 T2 11 6 1 1.8:1 0.96 HZ2.6-1.1 T3 47 12 2 3.9:1 0.68 HZ2.6-1.1-x T4 81 12 2 7:1 7.3
HZ2.13 T1 15 4 1 3.8:1 0.16 HZ2.13-5 T2 11 0 1 HO 3.67 HZ2.13-5.1 T3 46 2 2 23:1 11.1 HZ2.13-5.1-x T4 59 0 2 HO 19.7
200
The expected 3:1 segregation ratio (BastaR:BastaS) based on the inheritance of Basta
resistance was observed only in T1 (HZ2.6) and T3 (HZ2.6-1.1) generation of PrsS3
expressing A. thaliana (Table 6.3). In PrsS1 expressing A. thaliana (Table 6.2.) it was not
observed. Instead, the analysed HZ1.1 line exhibited distorted Mendelian 8:1 segregation
ratio in T1 generation (Table 6.2) and its progeny showed 19:1 ratio in T2 generation. The
line became homozygous for Basta in generation T3. Segregation ratio of 7:1 was also
observed in T4 generation of HZ2.6-1.1.
(Page and Grossniklaus, 2002) reported that 7:1 segregation ratio is expected for the
recessive mutants obtained by seed mutagenesis. However, we did not mutagenise the seeds.
Another possibility (Rudolph, 1966) could be that 7:1 segregation might result from the 15:1
ratio distorted due to the lethality dependent on PrsS expression, and in next generation of
HZ1.1-3 we observed increased segregation ratio, meaning we could have the insertion at
two loci.
The other line selected for PrsS1 expression showed 1:1 segregation ratio in T1, but
interestingly exhibited homozygous state already from generation T2 onwards. HZ2.6 and
HZ2.13 lines analysed showed the expected Mendelian segregation ratio 3:1 in T1
generation. However, line HZ2.6 exhibits non-Mendelian ratios in subsequent generations:
2:1 ratio in generation T2, 4:1 ratio in T3 and very distorted ratio 7:1 in generation T4. On the
other hand, in the line HZ2.13 the segregation of resistance seems equally unstable,
changing from generation to generation. It shows homozygous expression in T2 and T4 but
ratio 23:1 in generation T3. A. thaliana transgenic lines that were selected for further analysis
based on the expression of the transcript analysed by RT-PCR were HZ1.1-3 and HZ1.8-2
expressing PrsS1, and lines expressing PrsS3 were HZ2.6-1 and HZ2.13-5.

201
Since the RT-PCR showed that PrsS1 mRNA was specifically present in HZ1 flowers, we
wished to confirm the PrsS1 protein presence using western blot, however, it was impossible
to detect any PrsS1 signal using the 20-50 μg total protein extract and only PrsS1
recombinant protein, expressed in E. coli, resulted in a very strong band (data not shown).
Considering the RT-PCR detection of the PrsS1 mRNA transcripts in transgenic A. thaliana
flowers, the PrsS1 protein are expressed at extremely low levels that are below detection
using western blot, or the protein is not properly expressed or folded. In any case, this could
explain some of the results described later in section 6.2.4 .
6.2.2. S1-locus expressing A. thaliana line
Another important construct that was generated by Barend de Graaf included the whole S1-
locus from Papaver (both, PrpS1 and PrsS1 determinants at the same time) and was coupled
with endogenous Papaver promotors for PrpS1 and PrsS1 (see Table 6.1). Segregation of the
Kan resistance was investigated in the progeny of T1 generation of A. thaliana line BG6
expressing the whole S1-locus (Table 6.4).
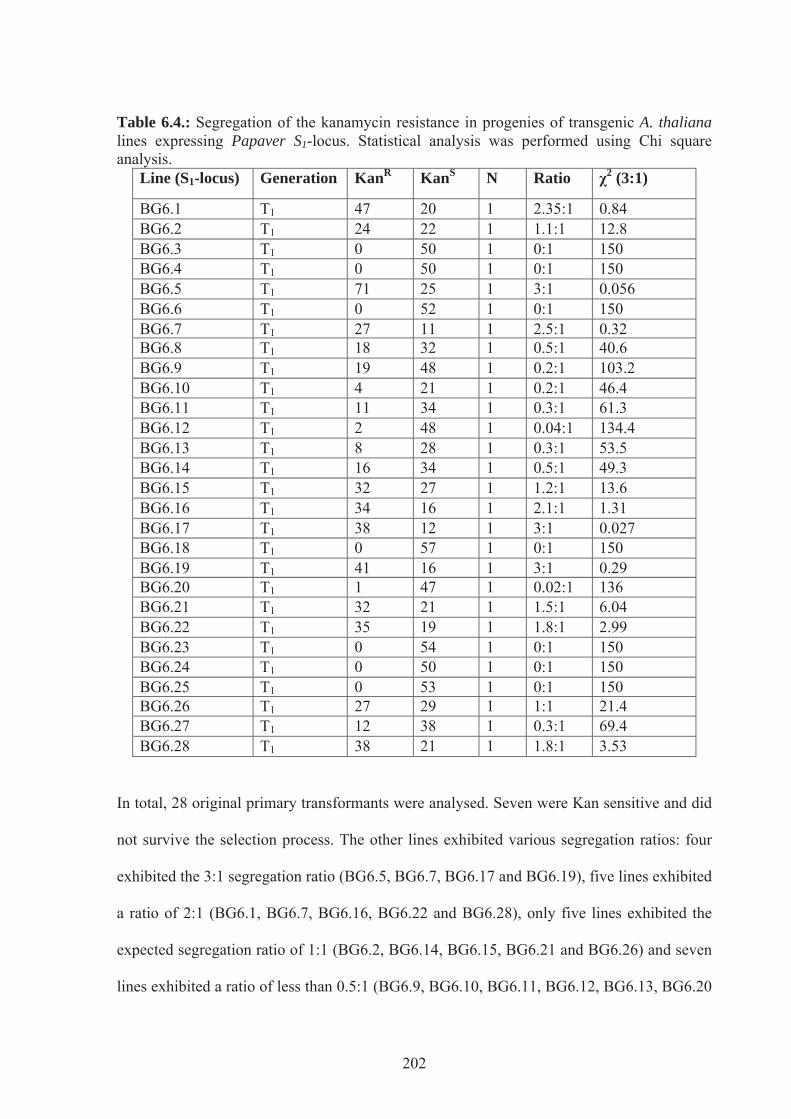
202
Table 6.4.: Segregation of the kanamycin resistance in progenies of transgenic A. thaliana lines expressing Papaver S1-locus. Statistical analysis was performed using Chi square analysis.
Line (S1-locus) Generation KanR KanS N Ratio χ2 (3:1)
BG6.1 T1 47 20 1 2.35:1 0.84 BG6.2 T1 24 22 1 1.1:1 12.8 BG6.3 T1 0 50 1 0:1 150 BG6.4 T1 0 50 1 0:1 150 BG6.5 T1 71 25 1 3:1 0.056 BG6.6 T1 0 52 1 0:1 150 BG6.7 T1 27 11 1 2.5:1 0.32 BG6.8 T1 18 32 1 0.5:1 40.6 BG6.9 T1 19 48 1 0.2:1 103.2 BG6.10 T1 4 21 1 0.2:1 46.4 BG6.11 T1 11 34 1 0.3:1 61.3 BG6.12 T1 2 48 1 0.04:1 134.4 BG6.13 T1 8 28 1 0.3:1 53.5 BG6.14 T1 16 34 1 0.5:1 49.3 BG6.15 T1 32 27 1 1.2:1 13.6 BG6.16 T1 34 16 1 2.1:1 1.31 BG6.17 T1 38 12 1 3:1 0.027 BG6.18 T1 0 57 1 0:1 150 BG6.19 T1 41 16 1 3:1 0.29 BG6.20 T1 1 47 1 0.02:1 136 BG6.21 T1 32 21 1 1.5:1 6.04 BG6.22 T1 35 19 1 1.8:1 2.99 BG6.23 T1 0 54 1 0:1 150 BG6.24 T1 0 50 1 0:1 150 BG6.25 T1 0 53 1 0:1 150 BG6.26 T1 27 29 1 1:1 21.4 BG6.27 T1 12 38 1 0.3:1 69.4 BG6.28 T1 38 21 1 1.8:1 3.53
In total, 28 original primary transformants were analysed. Seven were Kan sensitive and did
not survive the selection process. The other lines exhibited various segregation ratios: four
exhibited the 3:1 segregation ratio (BG6.5, BG6.7, BG6.17 and BG6.19), five lines exhibited
a ratio of 2:1 (BG6.1, BG6.7, BG6.16, BG6.22 and BG6.28), only five lines exhibited the
expected segregation ratio of 1:1 (BG6.2, BG6.14, BG6.15, BG6.21 and BG6.26) and seven
lines exhibited a ratio of less than 0.5:1 (BG6.9, BG6.10, BG6.11, BG6.12, BG6.13, BG6.20

203
and BG6.27). As previously mentioned, the expected segregation ratio in fully functional
BG6 line would be 1:1. If the plants were heterozygous then 50 % of pollen would be
expected to express PrpS1 and 50 % of pollen would be wt and only the wt pollen would be
allowed to grow through the stigma and successfully fertilize the ovules. The pollen
expressing PrpS1 would be expected to be inhibited upon landing on the stigma expressing
PrsS1. Therefore, the expectance of a 1:1 segregation ratio, but it was found that only ~20 %
of all BG6 plants exhibited this ratio.
Some plants expressing S1-locus were analysed by RT-PCR using PrpS1 and PrsS1 primers.
Initially, only two samples (randomly chosen showing 3:1 and 0.2:1 ratio) were analysed
using PrpS1 and PrsS1 primers in the reaction simultaneously (Figure 6.4.a). The PrsS1 band
was detected upon analysis on the DNA gel but PrpS1 product was not visualised. The RT-
PCR was repeated using more samples with different segregation ratios, including the
expected 1:1, and the primers were used in separate reactions (e.g PrsS1 primers were used
with an aliquot of RNA in one reaction, and another aliquot of RNA was used in the RT-
PCR reaction using PrpS1 primers, see Figure 6.4.b) but no PrpS1 band was visualised and
identified when analysing the PCR product by electrophoresis.
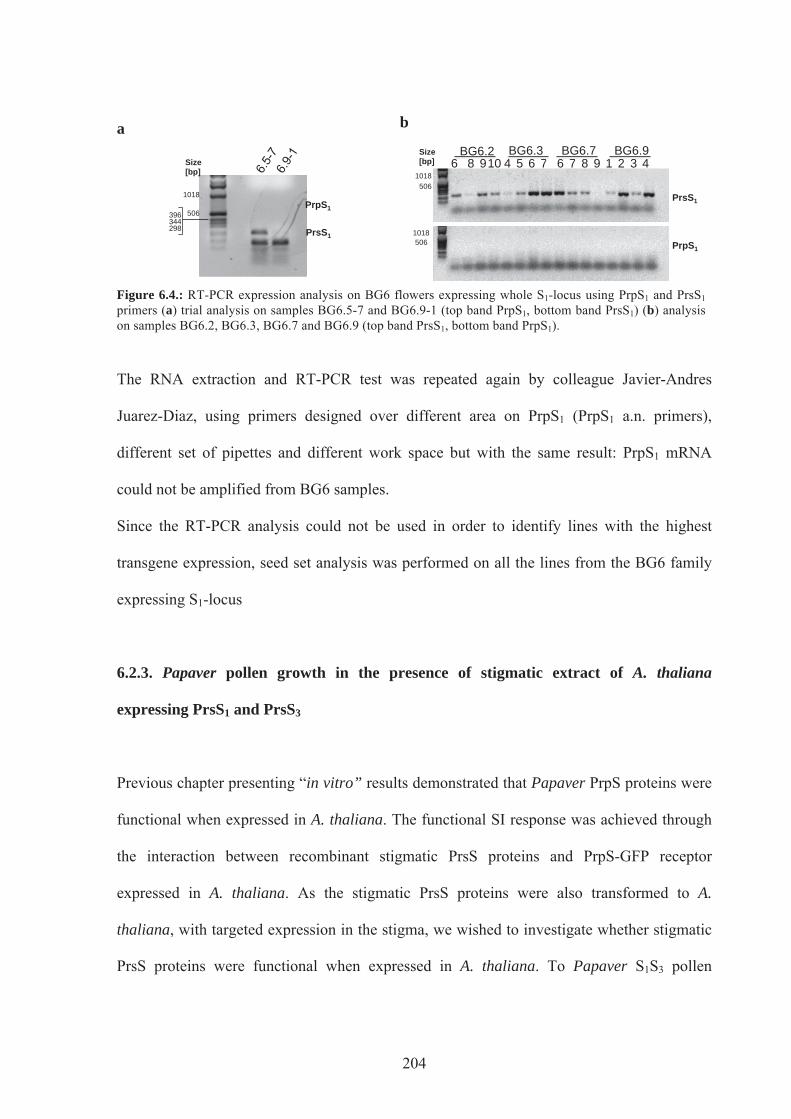
204
a
b
Figure 6.4.: RT-PCR expression analysis on BG6 flowers expressing whole S1-locus using PrpS1 and PrsS1 primers (a) trial analysis on samples BG6.5-7 and BG6.9-1 (top band PrpS1, bottom band PrsS1) (b) analysis on samples BG6.2, BG6.3, BG6.7 and BG6.9 (top band PrsS1, bottom band PrpS1).
The RNA extraction and RT-PCR test was repeated again by colleague Javier-Andres
Juarez-Diaz, using primers designed over different area on PrpS1 (PrpS1 a.n. primers),
different set of pipettes and different work space but with the same result: PrpS1 mRNA
could not be amplified from BG6 samples.
Since the RT-PCR analysis could not be used in order to identify lines with the highest
transgene expression, seed set analysis was performed on all the lines from the BG6 family
expressing S1-locus
6.2.3. Papaver pollen growth in the presence of stigmatic extract of A. thaliana
expressing PrsS1 and PrsS3
Previous chapter presenting “in vitro” results demonstrated that Papaver PrpS proteins were
functional when expressed in A. thaliana. The functional SI response was achieved through
the interaction between recombinant stigmatic PrsS proteins and PrpS-GFP receptor
expressed in A. thaliana. As the stigmatic PrsS proteins were also transformed to A.
thaliana, with targeted expression in the stigma, we wished to investigate whether stigmatic
PrsS proteins were functional when expressed in A. thaliana. To Papaver S1S3 pollen
1018
506
Size [bp]
396 344 298
PrpS1
PrsS1
PrsS1
PrpS1
1018
1018
Size [bp]
506
506
6 8 9 10 4 5 6 7 6 7 8 9 1 2 3 4 6 8 9109 BG6.2 BG6.3
4 5 6 7BG6.3
6 7 8 9 1 2 3 4 BG6.7 BG6.9

205
growing in petridishes we added the stigmatic protein extract derived from transgenic A.
thaliana flowers expressing PrsS1 and PrsS3 proteins, respectively. Transgenic A. thaliana T4
generation plant lines were characterized homozygous in previous section, and were used for
the experiment. A. thaliana plants from lines HZ1.1-3.1-x and HZ1.8-2.1-x were used as a
source for PrsS1 expressing stigmas, and lines HZ2.6-1.1-x and HZ2.13-5.1-x for PrpS3
expressing stigma.
Employing this semi-in vitro system, “incompatible” pollen (Papaver S1 and S3 pollen
incubated with stigmatic HZ1 and HZ2 extracts) should be inhibited, while pollen tube
length of the control pollen (Papaver S2 and S4 pollen incubated with HZ1 and HZ2
extracts) should not be affected by the PrsS1 and PrsS3 expressing flower extracts. HZ1 and
HZ2 stigmatic extracts were added to Papaver PrpS1/PrpS3 and PrpS2/PrpS4 pollen. As a
positive control we induced SI response in Papaver pollen with recombinant stigmatic PrsS1
and PrsS3. In order to affirm that the effect of the PrsS expressing A. thaliana stigmas was
due to PrsS proteins and not to other soluble proteins present in A. thaliana stigmatic tissue,
we also challenged Papaver PrpS1/PrpS3 pollen with A. thaliana untransformed Col-0
stigmatic extract and left them to grow in GM only (untreated, UT). Additional controls
were the heat denatured (hd) stigmatic extracts from HZ1 and HZ2 flowers and from Col-0
flower, in order to ensure that the response was due to the biologically active PrsS proteins.
The S-specificity control was comprised of Papaver PrpS2/PrpS4 pollen that was incubated
with stigmatic extracts from HZ1 expressing PrsS1 and HZ2 flowers expressing PrsS3 (i.e. a
compatible allelic combinations).
Pollen was left to incubate with proteins overnight and pollen tubes were imaged and
measured after 20 h incubation. Papaver PrsS1/PrsS3 pollen was inhibited by the addition of
A. thaliana HZ1 and HZ2 stigmatic extract (Figure 6.5.e), although not as strongly as pollen
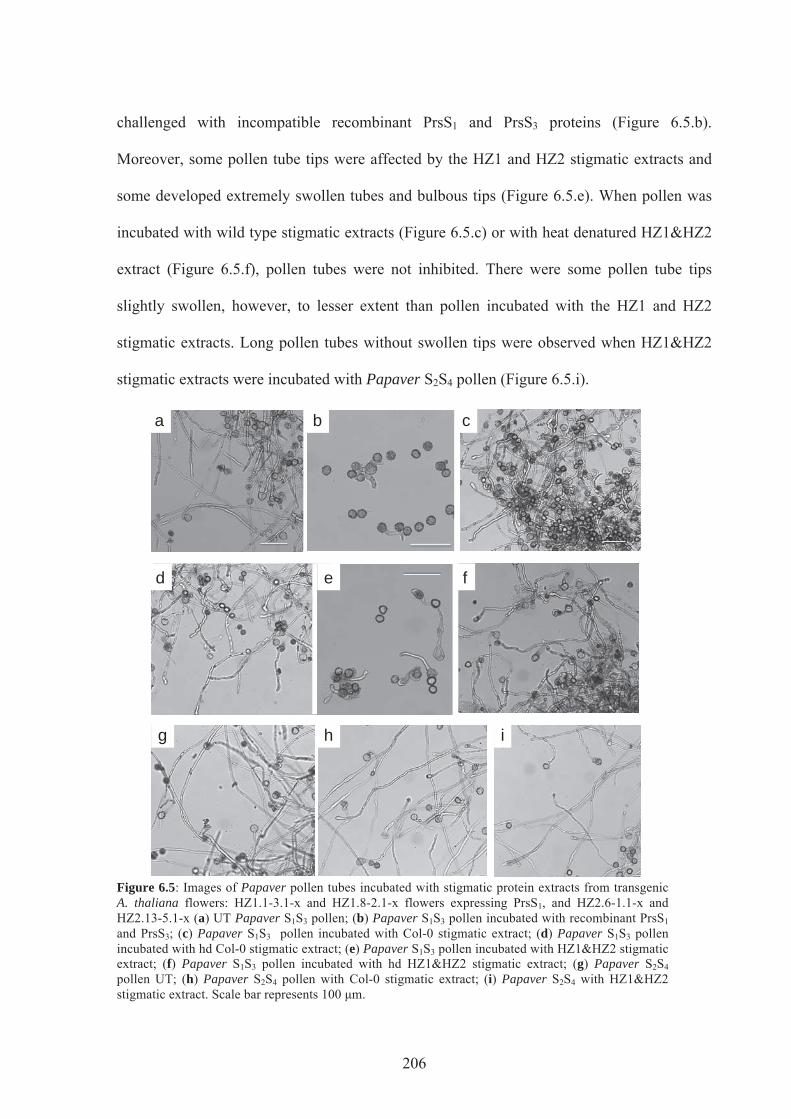
206
challenged with incompatible recombinant PrsS1 and PrsS3 proteins (Figure 6.5.b).
Moreover, some pollen tube tips were affected by the HZ1 and HZ2 stigmatic extracts and
some developed extremely swollen tubes and bulbous tips (Figure 6.5.e). When pollen was
incubated with wild type stigmatic extracts (Figure 6.5.c) or with heat denatured HZ1&HZ2
extract (Figure 6.5.f), pollen tubes were not inhibited. There were some pollen tube tips
slightly swollen, however, to lesser extent than pollen incubated with the HZ1 and HZ2
stigmatic extracts. Long pollen tubes without swollen tips were observed when HZ1&HZ2
stigmatic extracts were incubated with Papaver S2S4 pollen (Figure 6.5.i).
Figure 6.5: Images of Papaver pollen tubes incubated with stigmatic protein extracts from transgenic A. thaliana flowers: HZ1.1-3.1-x and HZ1.8-2.1-x flowers expressing PrsS1, and HZ2.6-1.1-x and HZ2.13-5.1-x (a) UT Papaver S1S3 pollen; (b) Papaver S1S3 pollen incubated with recombinant PrsS1 and PrsS3; (c) Papaver S1S3 pollen incubated with Col-0 stigmatic extract; (d) Papaver S1S3 pollen incubated with hd Col-0 stigmatic extract; (e) Papaver S1S3 pollen incubated with HZ1&HZ2 stigmatic extract; (f) Papaver S1S3 pollen incubated with hd HZ1&HZ2 stigmatic extract; (g) Papaver S2S4 pollen UT; (h) Papaver S2S4 pollen with Col-0 stigmatic extract; (i) Papaver S2S4 with HZ1&HZ2 stigmatic extract. Scale bar represents 100 μm.
a b c
d e f
g h i

207
In order to quantify the observed effects of A. thaliana stigmatic extracts on Papaver pollen
we measured pollen tube length and tip diameter (see Figure 6.6). Figure 6.6.a presents the
mean length of Papaver pollen tubes, incubated with A. thaliana stigmatic proteins.
a
b
Figure 6.6: Quantification of Papaver pollen tube length and tip diameter upon incubation with A. thaliana stigmatic protein extracts (Col-0 – untransformed A. thaliana stigmatic protein extract, HZ1HZ2 – PrsS1 and PrsS3 expressing A. thaliana stigmatic protein extracts) and controls (a) average pollen tube length and (b) average tube tip diameter. S1S3 Papaver pollen untreated and recombinant stigmatic controls are presented with light grey bars, pollen incubated with A. thaliana stigmatic proteins and controls are presented with dark grey bars, while control S2S4 pollen is presented in teal bars. Red outline indicates incompatible interaction between pollen and pistil determinant. Error bars represent ± St.Deviation. UT – untreated, rS8 – recombinant PrsS8; hd – heat denatured. Some of these experiments were conducted by Javier-Andres Juarez-Diaz.
Unchallenged PrsS1/PrsS3 Papaver pollen tube length was 958±60 μm, while length of
pollen with recombinant PrsS1 and PrsS3 proteins added was 38±6 μm (P= 2.7x10-108,
0
200
400
600
800
1000
1200
Leng
th [μ
m]
0 5
10 15 20 25 30 35
Tip
diam
eter
[μm
]

208
N=80), which is only 4 % of untreated control. The pollen tube length of Papaver incubated
with stigmatic protein extract from PrsS1 and PrsS3 expressing A. thaliana flowers, was
reduced significantly by 60 % compared to the UT control (P=1.1x10-61, N=80) or to pollen
incubated with non-transgenic stigmatic extract (945±69 μm, P=1.3x10-56, N=80), reaching
average length of 380±51 μm. The tip diameter of pollen incubated with stigmatic protein
extract from HZ1 and HZ2 A. thaliana flowers (Figure 6.6.b) was significantly increased
with 30±2 μm compared to 11±1 μm for untreated pollen (P=1.9x10-74, N=80) or 15±1 μm
for pollen incubated with Col-0 protein extract (P=7.0x10-57, N=80). Untreated compatible
poppy PrsS2/PrsS4 pollen reached the length of 925±56 μm, which was comparable to
untreated PrsS1/PrsS3 pollen (P=0.25; N=60). The length of PrsS2/PrsS4 pollen treated with
Col-0 stigmatic extract was 911±68 μm, which was not different to Col-0 treated PrsS1/PrsS3
pollen (P=0.35, N=60). However, the length of “compatible” poppy pollen incubated with
HZ1 and HZ2 stigmatic extracts was 831±54 μm, which was significantly different
compared to HZ1 and HZ2 incubation of PrsS1/PrsS3 pollen (P=1.5x10⁻³⁵, N=60).
Quantification also revealed the significant difference between tips of compatible
PrsS2/PrsS4 pollen incubated with HZ1 and HZ2 stigmatic extracts, with diameter of 16±1
μm and HZ1&HZ2 incubated S1S3 pollen (P=3.7x10-42).
These data demonstrate PrsS1 and PrsS3 stigmatic proteins that were expressed in A. thaliana
stigmas under stigma specific Stig1 promoter, had an inhibitory effect on PrsS1/PrsS3
Papaver pollen in an S-specific manner. However, the interaction causes not only Papaver
pollen tube inhibition but also some other morphological changes, like tube swelling.
209
6.2.4 Papaver SI in vivo in transgenic Arabidopsis thaliana
6.2.4.1 Pollination assays in transgenic A. thaliana expressing Papaver PrsS and PrpS
Incompatible crosses and controls were examined with a microscope. Figure 6.7 shows
analysis of the highest PrsS1 expressing A. thaliana lines HZ1.1-3.1 and HZ1.8-2.1. Crosses
for the aniline blue staining of the pollen tube growth were conducted on A. thaliana plants
fourteen times in total. Pollination tests were initially conducted on T2 plants, and after the
highest expressing lines were identified on T3 plants (see Figure 6.7).

210
Figure 6.7.: Aniline blue staining of crosses with PrsS1 expressing A. thaliana stigmas. (a) HZ1.1-3.1 x BG16#25.1-1 (PrsS1 x PrpS1), (b) HZ1.1-3.1 x HZ3.1-15.1 (PrsS1 x PrsS3), (c) HZ1.1-3.1 x HZ1.1-3.1 (PrsS1 x PrsS1); (d) HZ1.1-3.1 x Col-0 (PrsS1 x Col-0); (e) HZ1.8-2.1 x BG16#25.1-1 (PrsS1 x PrpS1); (f) HZ1.8-2.1 x Col-0 (PrsS1 x Col-0). Scale represents 500 μm.
a b
c d
e f

211
Few crosses resulted in reduced pollen tube growth but generally the incompatible crosses
resulted in long pollen tube growth through the style, which could indicate that the plants
were heterozygous. More likely, the pollen tube growth could be due to the weak or ‘leaky’
SI response. The incompatible crosses HZ1.1-3.1 x BG16#25.1-1 and HZ1.8-2.1 x
BG16#25.1-1, presented in Figures 6.7.a and 6.7.e, respectively, show long pollen tube
growth, which was comparable to the control and compatible pollinations. Control crosses
confirmed that HZ1.1-3.1 and HZ1.8-2.1 flowers were receptive and functional (Figures
6.7.c, d & f) but did not exhibit full SI.
Preliminary investigation also examined the pollination of PrsS3 expressing HZ2.13-5.1 and
HZ2.6-1.1 flowers (see Figure 6.8) by PrpS3 expressing HZ3.1-15.1 and non-transgenic or
compatible control.

212
Figure 6.8: Aniline blue staining of crosses with PrsS3 expressing A. thaliana stigmas. (a) HZ2.13-5.1 x HZ3.1-15.1 (PrsS3 x PrpS3) (b) HZ2.13-5.1 x Col-0 (PrsS3 x Col-0); (c) HZ2.6-5.1 x HZ3.1-15.1 (PrsS3 x PrpS3); (d) HZ2.6-5.1 x BG16#25.1-1 (PrsS3 x PrpS1).
a b
d c

213
Incompatible crosses of HZ2.13-5.1 x HZ3.1-5.1 and HZ2.6-5.1 x HZ3.1-15.1, presented on
figure 6.8.a and 6.8.c, respectively, exhibited compatible phenotype as there were numerous
pollen tubes growing down the style.
In order to characterize the pollinations in greater detail, more systematic and quantitative
analysis was proposed. However, the PrsS1 protein signal was not detected using western
blot analysis on the PrsS1 expressing stigmatic extracts, despite the RT-PCR analysis
confirmed the presence of PrsS1 mRNA. There could be several reasons that there was no
protein detected by western blot. It is possible that PrsS1 protein was not correctly translated,
not correctly targeted or it was expressed at very low concentration that was below the level
of detection by western blot analysis. Therefore the inhibition of PrpS1-GFP pollen in vivo
did not occur. However, the results of incubation of Papaver S1S3 pollen with HZ1 and HZ2
stigmatic protein extracts indicated, that HZ1 and HZ2 expressing PrsS1 and PrsS3,
respectively could be functional. The total protein concentration within that experiments was
100 μg mL-1 but we could not quantify what proportion (if any) of that concentration was
represented by properly folded, active PrsS proteins. The inhibition of Papaver pollen was
observed, but at the same time also pollen tube swelling which could indicate that the PrsS
proteins were possibly not properly folded or at very low concentration. There was also
possibility that the insertion of the PrsS by transformation in A. thaliana caused some other
transient stigmatic phenotype that could not be observed visually but affected the total
stigmatic protein concentration. And finally the stochiometry of the SI response, i.e. number
of molecules of receptor and ligand required for the SI response to be triggered, also remains
unknown.

214
6.2.4.2 Seed set analysis in transgenic A. thaliana expressing Papaver PrsS and PrpS
Seed set analysis was conducted in parallel on transgenic A. thaliana lines to test Papaver SI
in vivo. HZ1.1-3.1 and HZ1.8-2.1 plants expressing PrsS1 and HZ2.6-1.1 and HZ2.13-5.1
plants, expressing PrsS3 were emasculated and pollinated with selected pollen donor to
obtain: incompatible cross, reciprocal cross or other allele specific controls (see Materials
and Methods). Siliques were left on the plant to develop seeds before they were collected
and measured with the seed set counted. However, not all the crosses were successful, hence
the discrepancy in the number of fertilized siliques.
Figure 6.9.a presents the seed set from all the individual incompatible crosses (Figure 6.9.a,
red outline, yellow bars for PrsS1 x PrpS1 and light green bars for PrsS3 x PrpS3) and
controls. Certain incompatible crosses resulted in smaller silique size and lower seed set
(HZ1.8-2.1 x BG16A#19.8-3, HZ2.6-1.1 x HZ3.1-15.1 and HZ2.6-1.1 x HZ3.1-15.1-1),
however, the majority of incompatible crosses resulted in the normal seed set, compared to
compatible reciprocal crosses. Crosses were performed by Steve Price.
In order to analyze the female expressors (PrsS1 expressing lines HZ1.1-3.1 or HZ1.8-2.1
and PrsS3 expressing lines HZ2.6-1.1 or HZ2.13-5.1) as pollen acceptors and pollen donors,
the silique length and seed set data of incompatible pollinations with the same PrsS
expressing line was joined (Figure 6.9.b, red outline) and its reciprocal control for individual
PrsS expressing lines (see Figure 6.9.b).
The incompatible crosses with PrsS1 expressing A. thaliana stigma HZ1.1-3.1 and PrpS1-
GFP expressing BG16 pollen resulted in 29.1±12.9 seeds and silique length 16.3±2.1 mm
(n=14), and were 43 % compared to its reciprocal cross with 41.6±16.2 seeds and silique

215
length 17.0±2.4 mm (n=11) (see Figure 6.3.3.b, yellow bars). The seed set of this
incompatible cross (PrsS1 x PrpS1) was also 17 % when compared to the cross with Col-0
(HZ1.1-3.1 x Col-0), which resulted in 34 seeds (n=1) but 18 % higher when compared to
the compatible cross HZ1.1-3.1 x HZ3 with 23.9±8.6 seeds and silique length 14.1±1.9 mm
(n=5). PrsS1 expressing HZ1.8.2-1 plants crossed with incompatible PrpS1-GFP expressing
BG16 had on average 19 % higher seed set with 34.5±14.3 seeds and silique length 15.1±2.7
mm (n=13) when compared with HZ1.1-3.1, and as well 30 % higher seed set than its
reciprocal control BG16 x HZ1.8-2.1 with 24.7±12.1 seeds and silique length 13.1±3.8 mm
(n=5). When incompatible HZ1.8-2.1 cross (PrsS1 x PrpS1) was compared to the compatible
control HZ1.8-2.1 x HZ3, the compatible seed set was 18 % lower with 28.3±11.4 seeds and
silique length 12.8±2.8 mm (n=5). These data indicates that incompatible cross was not
completely functional, indicating that transgenic A. thaliana might not be expressing PrsS at
high enough levels.
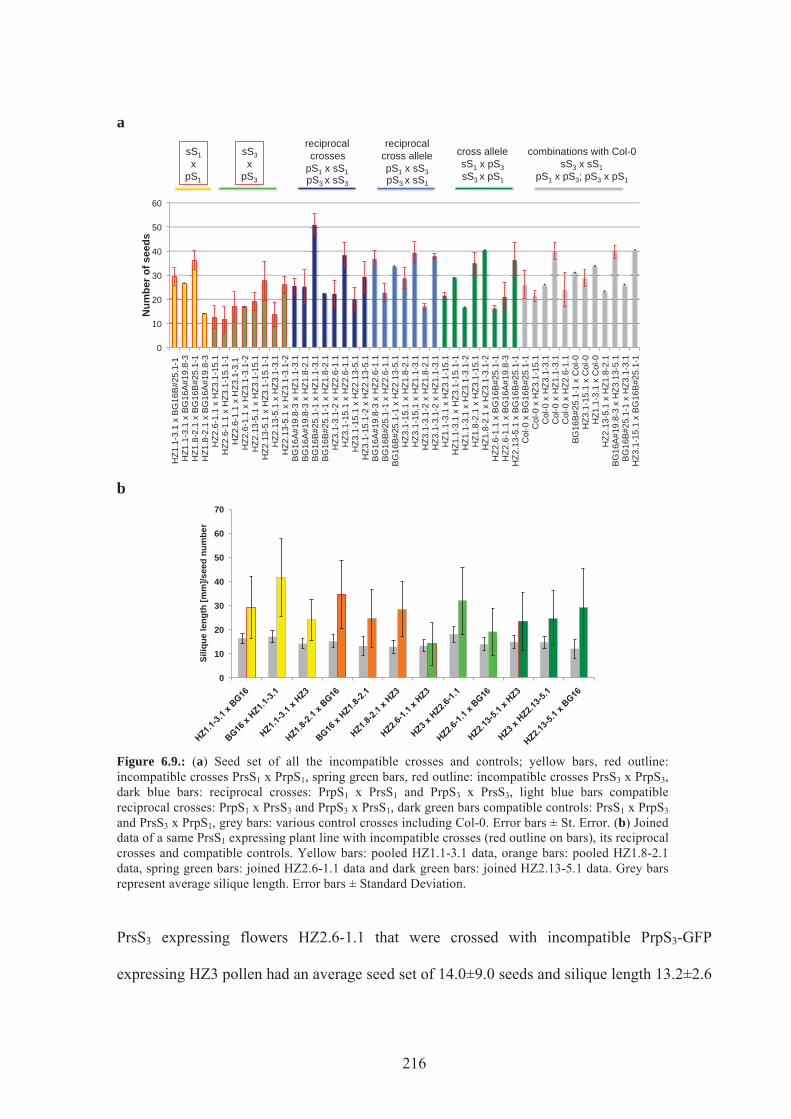
216
a
b
Figure 6.9.: (a) Seed set of all the incompatible crosses and controls; yellow bars, red outline: incompatible crosses PrsS1 x PrpS1, spring green bars, red outline: incompatible crosses PrsS3 x PrpS3, dark blue bars: reciprocal crosses: PrpS1 x PrsS1 and PrpS3 x PrsS3, light blue bars compatible reciprocal crosses: PrpS1 x PrsS3 and PrpS3 x PrsS1, dark green bars compatible controls: PrsS1 x PrpS3 and PrsS3 x PrpS1, grey bars: various control crosses including Col-0. Error bars ± St. Error. (b) Joined data of a same PrsS1 expressing plant line with incompatible crosses (red outline on bars), its reciprocal crosses and compatible controls. Yellow bars: pooled HZ1.1-3.1 data, orange bars: pooled HZ1.8-2.1 data, spring green bars: joined HZ2.6-1.1 data and dark green bars: joined HZ2.13-5.1 data. Grey bars represent average silique length. Error bars ± Standard Deviation.
PrsS3 expressing flowers HZ2.6-1.1 that were crossed with incompatible PrpS3-GFP
expressing HZ3 pollen had an average seed set of 14.0±9.0 seeds and silique length 13.2±2.6
0
10
20
30
40
50
60
HZ1
.1-3
.1 x
BG
16B
#25.
1-1
H
Z1.1
-3.1
x B
G16
A#1
9.8-
3 H
Z1.8
-2.1
x B
G16
B#2
5.1-
1 H
Z1.8
-2.1
x B
G16
A#1
9.8-
3 H
Z2.6
-1.1
x H
Z3.1
-15.
1 H
Z2.6
-1.1
x H
Z3.1
-15.
1-1
HZ2
.6-1
.1 x
HZ3
.1-3
.1
HZ2
.6-1
.1 x
HZ3
.1-3
.1-2
H
Z2.1
3-5.
1 x
HZ3
.1-1
5.1
HZ2
.13-
5.1
x H
Z3.1
-15.
1-1
HZ2
.13-
5.1
x H
Z3.1
-3.1
H
Z2.1
3-5.
1 x
HZ3
.1-3
.1-2
B
G16
A#1
9.8-
3 x
HZ1
.1-3
.1
BG
16A
#19.
8-3
x H
Z1.8
-2.1
B
G16
B#2
5.1-
1 x
HZ1
.1-3
.1
BG
16B
#25.
1-1
x H
Z1.8
-2.1
H
Z3.1
-3.1
-2 x
HZ2
.6-1
.1
HZ3
.1-1
5.1
x H
Z2.6
-1.1
H
Z3.1
-15.
1 x
HZ2
.13-
5.1
HZ3
.1-1
5.1-
2 x
HZ2
.13-
5.1
BG
16A
#19.
8-3
x H
Z2.6
-1.1
B
G16
B#2
5.1-
1 x
HZ2
.6-1
.1
BG
16B
#25.
1-1
x H
Z2.1
3-5.
1 H
Z3.1
-15.
1 x
HZ1
.8-2
.1
HZ3
.1-1
5.1
x H
Z1.1
-3.1
H
Z3.1
-3.1
-2 x
HZ1
.8-2
.1
HZ3
.1-3
.1-2
x H
Z1.1
-3.1
H
Z1.1
-3.1
x H
Z3.1
-15.
1 H
Z1.1
-3.1
x H
Z3.1
-15.
1-1
HZ1
.1-3
.1 x
HZ3
.1-3
.1-2
H
Z1.8
-2.1
x H
Z3.1
-15.
1 H
Z1.8
-2.1
x H
Z3.1
-3.1
-2
HZ2
.6-1
.1 x
BG
16B
#25.
1-1
HZ2
.6-1
.1 x
BG
16A
#19.
8-3
HZ2
.13-
5.1
x B
G16
B#2
5.1-
1 C
ol-0
x B
G16
B#2
5.1-
1 C
ol-0
x H
Z3.1
-15.
1 C
ol-0
x H
Z3.1
-3.1
C
ol-0
x H
Z1.1
-3.1
C
ol-0
x H
Z2.6
-1.1
B
G16
B#2
5.1-
1 x
Col
-0
HZ3
.1-1
5.1
x C
ol-0
H
Z1.1
-3.1
x C
ol-0
H
Z2.1
3-5.
1 x
HZ1
.8-2
.1
BG
16A
#19.
8-3
x H
Z3.1
3-5.
1 B
G16
B#2
5.1-
1 x
HZ3
.1-3
.1
HZ3
.1-1
5.1
x B
G16
B#2
5.1-
1
Num
ber o
f see
ds
sS1 x
pS1
sS3 x
pS3
reciprocal crosses
pS1 x sS1 pS3 x sS3
reciprocal cross allele pS1 x sS3 pS3 x sS1
cross allele sS1 x pS3 sS3 x pS1
combinations with Col-0 sS3 x sS1
pS1 x pS3; pS3 x pS1
0
10
20
30
40
50
60
70
Siliq
ue le
ngth
[mm
]/see
d nu
mbe
r

217
mm (n=11), which is ~130 % lower than its reciprocal crosses HZ3 x HZ2.6-1.1 with
31.9±14.0 seeds and silique length 18±3.3 mm (n=10). The seed set of compatible control
HZ2.6-1.1 x BG16 was 36 % higher with 19.1±9.7 seeds and silique length of 13.8±2.7 mm
(n=6). Another set of incompatible crosses with PrsS3 expressing flower HZ2.13-5.1 x HZ3
was 6 % lower with 23.2±12.1 and silique length 14.8±2.8 mm (n=21), compared to its
reciprocal cross HZ3 x HZ2.13-5.1 with 24.6±11.4 seeds and silique length 14.6±2.4 mm
(n=8) and 25 % lower compared to the compatible cross HZ2.12-5.1 x BG16 with 29.1±16
seeds and silique length of 12±4 mm (n=7).
Taken together, the analysed seed set data indicate that the incompatible PrpS combinations
might have and effect on the PrsS1 expressing line HZ1.1-3.1 and PrsS3 expressing line
HZ2.6-1.1. However, the incompatible pollinations should not result in any seed set, so the
result observed could be due to leaky phenotype, very weak expression as discussed above,
or does not work at all.
6.2.4.3 Seed set and silique length of the F1 progeny from incompatible crosses
Seeds from incompatible crosses of A. thaliana expressing Papaver PrsS and PrpS-GFP
genes were tested for germination and seed set after self-pollination in F1 generation. 30
seeds from each of the following crosses were selected: HZ1.1-3.1 x BG16#25.1-1 (PrsS1 x
PrpS1), HZ1.8-2.1 x BG16#25.1-1 (PrsS1 x PrpS1), reciprocal cross BG16#25.1-1 x HZ1.8-
2.1 (PrpS1 x PrsS1), HZ2.6-1.1 x HZ3.1-15.1-1 (PrsS3 x PrpS3) and HZ2.13-5.1 x HZ3.1-
15.1 (PrsS3 x PrpS3), and germinated on MS media with double selection Kan and Basta. If
the transfer of the genetic material occurred then the resulting seeds would be resistant to
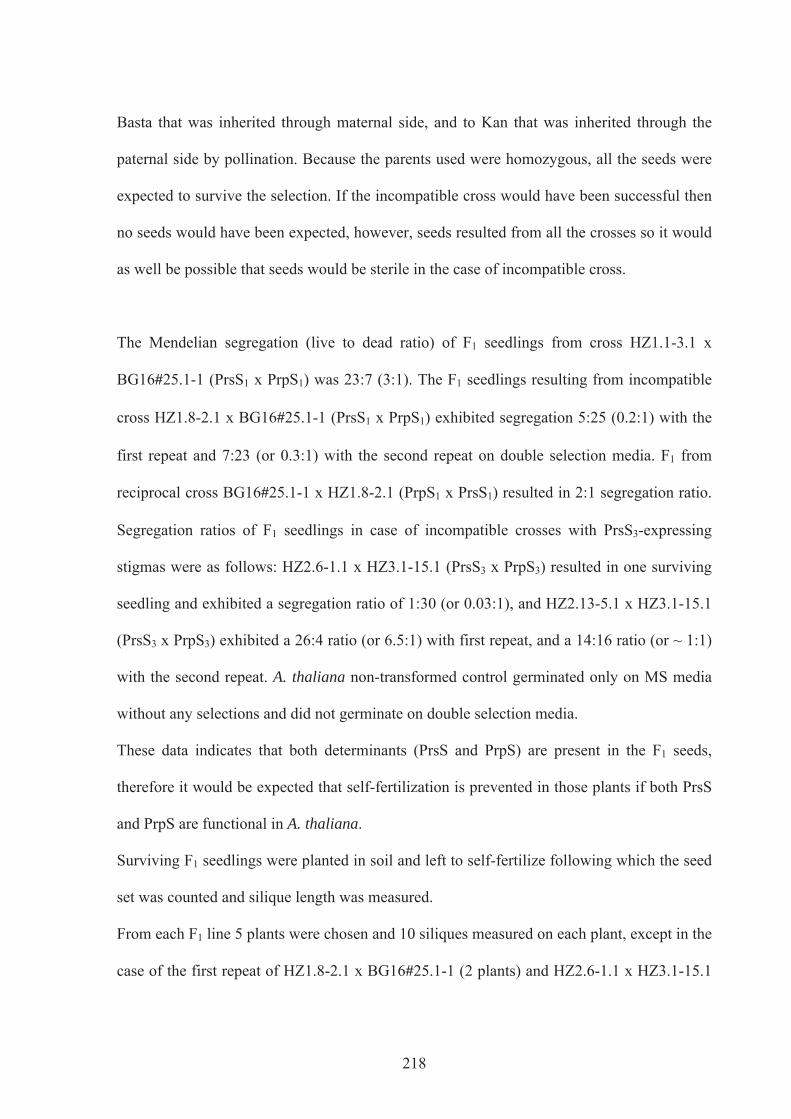
218
Basta that was inherited through maternal side, and to Kan that was inherited through the
paternal side by pollination. Because the parents used were homozygous, all the seeds were
expected to survive the selection. If the incompatible cross would have been successful then
no seeds would have been expected, however, seeds resulted from all the crosses so it would
as well be possible that seeds would be sterile in the case of incompatible cross.
The Mendelian segregation (live to dead ratio) of F1 seedlings from cross HZ1.1-3.1 x
BG16#25.1-1 (PrsS1 x PrpS1) was 23:7 (3:1). The F1 seedlings resulting from incompatible
cross HZ1.8-2.1 x BG16#25.1-1 (PrsS1 x PrpS1) exhibited segregation 5:25 (0.2:1) with the
first repeat and 7:23 (or 0.3:1) with the second repeat on double selection media. F1 from
reciprocal cross BG16#25.1-1 x HZ1.8-2.1 (PrpS1 x PrsS1) resulted in 2:1 segregation ratio.
Segregation ratios of F1 seedlings in case of incompatible crosses with PrsS3-expressing
stigmas were as follows: HZ2.6-1.1 x HZ3.1-15.1 (PrsS3 x PrpS3) resulted in one surviving
seedling and exhibited a segregation ratio of 1:30 (or 0.03:1), and HZ2.13-5.1 x HZ3.1-15.1
(PrsS3 x PrpS3) exhibited a 26:4 ratio (or 6.5:1) with first repeat, and a 14:16 ratio (or ~ 1:1)
with the second repeat. A. thaliana non-transformed control germinated only on MS media
without any selections and did not germinate on double selection media.
These data indicates that both determinants (PrsS and PrpS) are present in the F1 seeds,
therefore it would be expected that self-fertilization is prevented in those plants if both PrsS
and PrpS are functional in A. thaliana.
Surviving F1 seedlings were planted in soil and left to self-fertilize following which the seed
set was counted and silique length was measured.
From each F1 line 5 plants were chosen and 10 siliques measured on each plant, except in the
case of the first repeat of HZ1.8-2.1 x BG16#25.1-1 (2 plants) and HZ2.6-1.1 x HZ3.1-15.1

219
(1 plant only) as they were the only plants surviving after selection on plate and growth in
pots. Seed set of F1 plants derived from incompatible crosses is presented on Figure 6.10.
Self-fertilized A. thaliana Col-0 plants had 54±7.4 seeds (n=50 siliques measured in total).
F1 plants resulting from HZ1.1-3.1 x BG16#25.1-1 that exhibited 3:1 segregation ratio had
the seed set of 37.8±11.9, which is significantly lower compared to Col-0 seed set (n=50;
P=1.4*10-12). Seed set of F1 plants resulting from cross HZ1.8-2.1 x BG16#25.1-1 (PrsS1 x
PrpS1) with the segregation of 0.2:1 was 17.9±5.3 (n=20, P=7.3*10-30 compared to Col-0)
for the first repeat and 21.8±5.4 (n=50, P=4.9*10-44 compared to Col-0) for the second
repeat, both repeats were significantly lower compared to Col-0 self seed set. Reciprocal
cross BG16#25.1-1 x HZ1.8-2.1 (PrsS1 x PrpS1) with 2:1 segregation ratio gave 47.8±9
seeds, which is significantly higher compared to seed set resulting from incompatible cross
(n=50; P=3.1*10-4 compared to Col-0, P=3.8*10-21 compared to its incompatible cross,
repeat 1 and P=1.5*10-31 compared to its incompatible cross, repeat 2).
220
Figure 6.10: Silique length (grey bars) and seed set of surviving F1 seedlings. Green bars PrsS3 expressing stigmas used as females, yellow bars PrsS1 expressing stigmas used as females in original cross, teal bar, reciprocal cross with BG16#25.1-1 used as a female and light blue bar Col-0 control. n=10 siliques; N=5 plants (except in case of the first repeat of HZ1.8-2.1 x BG16#25.1-1 (N=2 plants) and HZ2.6-1.1 x HZ3.1-15.1 (N=1 plant). Error bars represent ± St. error.
Seed set from F1 plants derived from HZ2.6-1.1 x HZ3.1-15.1 (PrsS3 x PrpS3) cross was
15.9±4.2 seeds and is significantly lower compared to Col-0 self-seed set, which was 54±7.4
(n=10, P=1.2*10-16). On the other hand, seed set from F1 plants that were derived from
HZ2.13-5.1 x HZ3.1-15.1 cross was 46.4±9.7 seeds for repeat 1, (n=50) and 48.3±8.4 seeds
for the repeat 2 (n=50). Both these values were not significantly different from the Col-0. F1
with the lowest seed set number were from plant lines deriving from crosses HZ1.8-2.1 x
BG16#25.1-1 and HZ2.6-1.1 x HZ3.1-15.1.
Taken together, these data indicate that incompatible crosses HZ1.8-2.1 x BG16#25.1-1
(PrsS1 x PrpS1) and HZ2.6-1.1 x HZ3.1-15.1 (PrsS3 x PrpS3) displayed the strongest SI
phenotype. However, the F1 progeny resulting from these crosses exhibited distorted
Mendelian segregation based on the seed germination on Kan and Basta MS media.
Maternal PrsS expressing line HZ1.8-2.1 was homozygous, while the HZ2.6-1.1 line was
0
10
20
30
40
50
60
HZ2
.6-1
.1 x
H
Z3.1
-15.
1
HZ2
.13-
5.1
x H
Z3.1
-15.
1
HZ2
.13-
5.1
x H
Z3.1
-15.
1 (2
)
HZ1
.8-2
.1 x
B
G16
B25
.1-1
HZ1
.8-2
.1 x
B
G16
B25
.1-1
(2
)
HZ1
.1-3
.1 x
B
G16
B25
.1-1
BG
16B
25.1
-1 x
H
Z1.8
-2.1
Col
-0
Siliq
ue le
ngth
[mm
] / N
umbe
r of s
eeds
221
exhibiting ~4:1 segregation. The distorted and very low segregation could be due to reduced
transmission through the male or female gametes and insertional inactivation of a gene
expressed postmeiotically that is essential for the male and female gametophyic development
or to epigenetic gene silencing and DNA methylation (Howden et al., 1998, Finnegan, 2004,
Muskens et al., 2000).
In order to identify whether the PrsS was expressing correctly and to analyse the possibility
of the reduced transmission through male or female gametes, the F1 seeds should have been
plated in a double selection medium (Basta and Kan) as well as a single selection media
(Basta or Kan).
The in vivo results provided in this and previous sections lead to conclusion that PrsS was
not functional in transgenic A. thaliana lines, due to low expression of the transgene and
possible other effects that depend on the insertion of the transgene.
6.2.5. Investigating the function of the whole Papaver S1 locus in transgenic A. thaliana
Transgenic A. thaliana line BG.6 expressing whole S1-locus (described in previous section
with segregation analysis) was systematically analysed in generation T2. The in vivo analysis
measured silique length and seed set. Results, presented in Figure 6.11 (a –seed set and b –
silique length) show that majority of lines exhibit highly significantly reduced seed set,
compared to non-transformed control.
A. thaliana non-transformed control had 58.6±7.9 seeds (n=30) and 13 lines out of 18 (72 %)
exhibit lower seed set. The lines with the highest seed set reduction also exhibited decreased
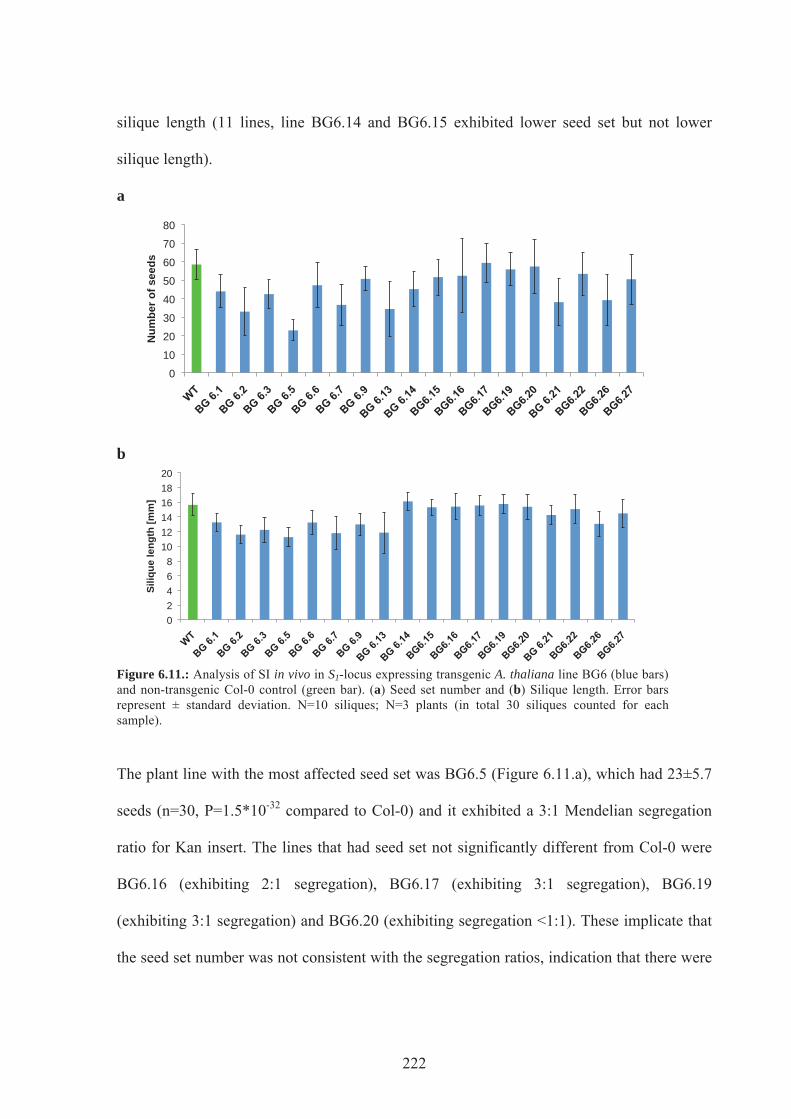
222
silique length (11 lines, line BG6.14 and BG6.15 exhibited lower seed set but not lower
silique length).
a
b
Figure 6.11.: Analysis of SI in vivo in S1-locus expressing transgenic A. thaliana line BG6 (blue bars) and non-transgenic Col-0 control (green bar). (a) Seed set number and (b) Silique length. Error bars represent ± standard deviation. N=10 siliques; N=3 plants (in total 30 siliques counted for each sample).
The plant line with the most affected seed set was BG6.5 (Figure 6.11.a), which had 23±5.7
seeds (n=30, P=1.5*10-32 compared to Col-0) and it exhibited a 3:1 Mendelian segregation
ratio for Kan insert. The lines that had seed set not significantly different from Col-0 were
BG6.16 (exhibiting 2:1 segregation), BG6.17 (exhibiting 3:1 segregation), BG6.19
(exhibiting 3:1 segregation) and BG6.20 (exhibiting segregation <1:1). These implicate that
the seed set number was not consistent with the segregation ratios, indication that there were
0
10
20
30
40
50
60
70
80
Num
ber o
f see
ds
0 2 4 6 8
10 12 14 16 18 20
Siliq
ue le
ngth
[mm
]
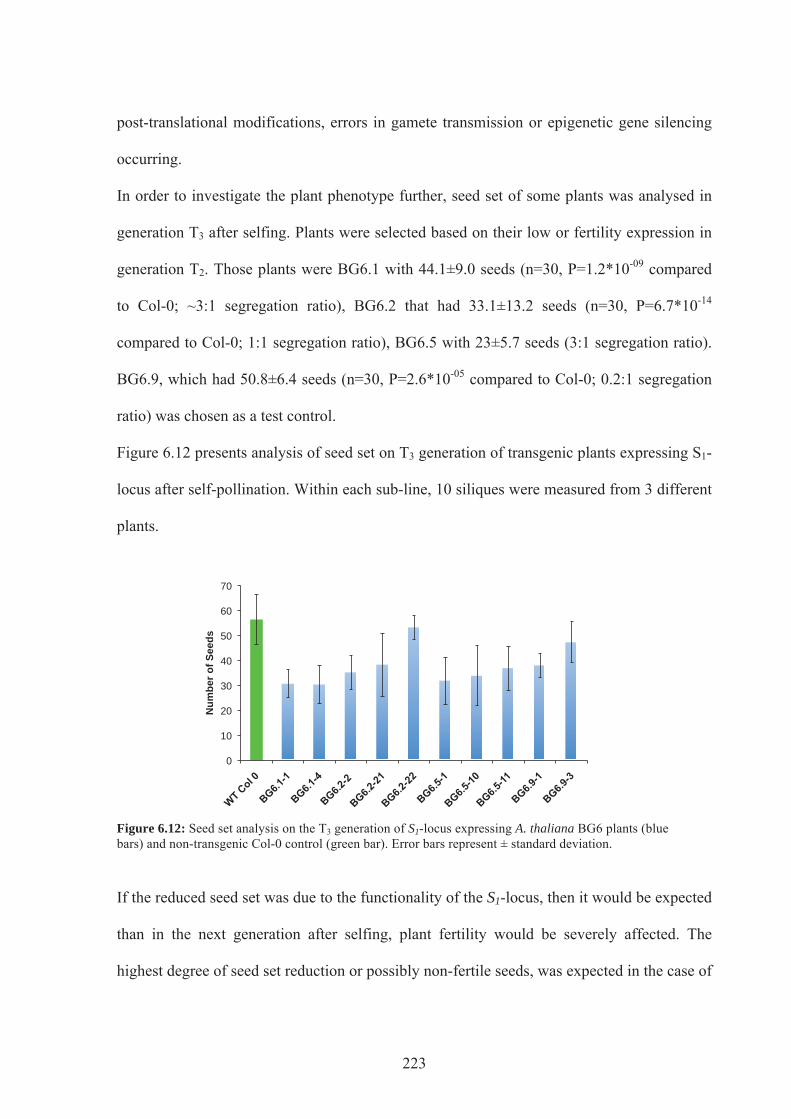
223
post-translational modifications, errors in gamete transmission or epigenetic gene silencing
occurring.
In order to investigate the plant phenotype further, seed set of some plants was analysed in
generation T3 after selfing. Plants were selected based on their low or fertility expression in
generation T2. Those plants were BG6.1 with 44.1±9.0 seeds (n=30, P=1.2*10-09 compared
to Col-0; ~3:1 segregation ratio), BG6.2 that had 33.1±13.2 seeds (n=30, P=6.7*10-14
compared to Col-0; 1:1 segregation ratio), BG6.5 with 23±5.7 seeds (3:1 segregation ratio).
BG6.9, which had 50.8±6.4 seeds (n=30, P=2.6*10-05 compared to Col-0; 0.2:1 segregation
ratio) was chosen as a test control.
Figure 6.12 presents analysis of seed set on T3 generation of transgenic plants expressing S1-
locus after self-pollination. Within each sub-line, 10 siliques were measured from 3 different
plants.
Figure 6.12: Seed set analysis on the T3 generation of S1-locus expressing A. thaliana BG6 plants (blue bars) and non-transgenic Col-0 control (green bar). Error bars represent ± standard deviation.
If the reduced seed set was due to the functionality of the S1-locus, then it would be expected
than in the next generation after selfing, plant fertility would be severely affected. The
highest degree of seed set reduction or possibly non-fertile seeds, was expected in the case of
0
10
20
30
40
50
60
70
Num
ber o
f See
ds
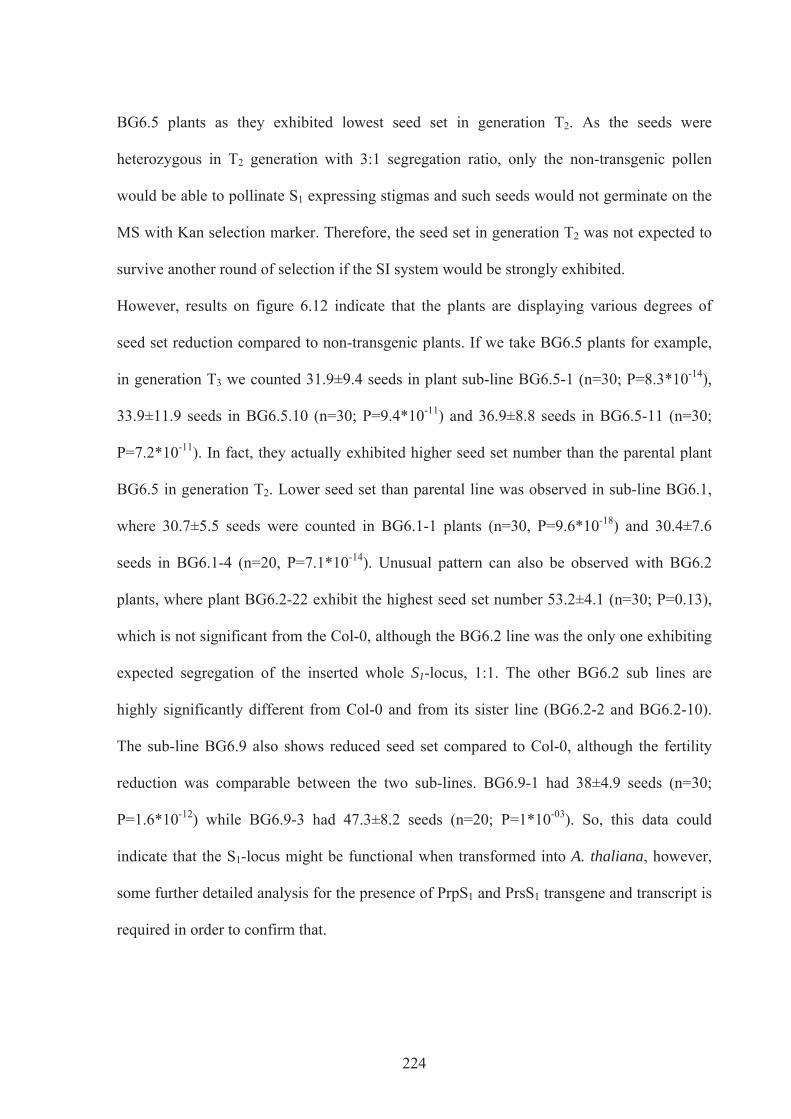
224
BG6.5 plants as they exhibited lowest seed set in generation T2. As the seeds were
heterozygous in T2 generation with 3:1 segregation ratio, only the non-transgenic pollen
would be able to pollinate S1 expressing stigmas and such seeds would not germinate on the
MS with Kan selection marker. Therefore, the seed set in generation T2 was not expected to
survive another round of selection if the SI system would be strongly exhibited.
However, results on figure 6.12 indicate that the plants are displaying various degrees of
seed set reduction compared to non-transgenic plants. If we take BG6.5 plants for example,
in generation T3 we counted 31.9±9.4 seeds in plant sub-line BG6.5-1 (n=30; P=8.3*10-14),
33.9±11.9 seeds in BG6.5.10 (n=30; P=9.4*10-11) and 36.9±8.8 seeds in BG6.5-11 (n=30;
P=7.2*10-11). In fact, they actually exhibited higher seed set number than the parental plant
BG6.5 in generation T2. Lower seed set than parental line was observed in sub-line BG6.1,
where 30.7±5.5 seeds were counted in BG6.1-1 plants (n=30, P=9.6*10-18) and 30.4±7.6
seeds in BG6.1-4 (n=20, P=7.1*10-14). Unusual pattern can also be observed with BG6.2
plants, where plant BG6.2-22 exhibit the highest seed set number 53.2±4.1 (n=30; P=0.13),
which is not significant from the Col-0, although the BG6.2 line was the only one exhibiting
expected segregation of the inserted whole S1-locus, 1:1. The other BG6.2 sub lines are
highly significantly different from Col-0 and from its sister line (BG6.2-2 and BG6.2-10).
The sub-line BG6.9 also shows reduced seed set compared to Col-0, although the fertility
reduction was comparable between the two sub-lines. BG6.9-1 had 38±4.9 seeds (n=30;
P=1.6*10-12) while BG6.9-3 had 47.3±8.2 seeds (n=20; P=1*10-03). So, this data could
indicate that the S1-locus might be functional when transformed into A. thaliana, however,
some further detailed analysis for the presence of PrpS1 and PrsS1 transgene and transcript is
required in order to confirm that.
225
In order to analyse SI on transgenic A. thaliana expressing S1-locus further, a preliminary
analysis of BG6 self-pollination was attempted and representative images presented on
figure 6.13. For representation, only two lines were chosen: BG6.2-2, which exhibited
reduced seed set and line BG6.22-2, whose seed set was not significantly different from non-
transgenic.
Figure 6.13.: Aniline blue staining analysis of self pollination and control pollination ofnon-transgenic Col-0 on BG6 flowers (a) BG6.2-2 x BG6.2-2 – brightfield image; (b) BG6.2-2 x BG6.2-2 ; (c) BG6.2-2 x Col-0; (d) BG6.2-22 x BG6.2-22; (e) BG6.2-22 x Col-0. Scale represents 100 μm.
a b
c d
e

226
Figure 6.13.b shows that the inhibition of self-pollen occurred to some degree, but was not
100 % (see figure 6.13.a). The rejection is not due to the non-receptive BG6.2-2 stigma, as
can be seen on figure 6.13.c, as the pollination with Col-0 leads to development of long
pollen tubes. On the other hand, self pollination of BG6.2-22, that exhibited normal seed set
also exhibit ‘compatible’ self-pollination (Figure 6.13.d), which is comparable to the
pollination with Col-0 pollen (Figure 6.13.e).
Due to the small size of analysed samples no firm conclusions could be made. The reduction
of the seed production and decreased self-pollination in some BG6 lines, could indicate that
the locus is functional. In order to analyse S1-locus expressing A. thaliana lines (and
therefore functionality of Papaver SI in A. thaliana) further, a more detailed analysis would
be required, including systematic RT-PCR analysis and pollination assays.
6.3 DISCUSSION
Preliminary in vivo analysis of transgenic A. thaliana expressing stigmatic PrsS1 (HZ1) and
PrsS3 (HZ2), pollen PrpS1 (BG16) and PrpS3 (HZ3) or S1-locus (BG6) revealed that
incompatible phenotype was not so easy to obtain. Some lines and crosses exhibited a
reduced pollen tube growth, especially at the beginning of investigations. However, with
time and experience it became obvious that age of plant and stage of stigma were crucial for
this analysis. If plants were too old and producing more than 50 % of their siliques, then
their stigmas, despite the right biological stage, were not fully receptive, and the pollen was
not germinating well, even on the receptive stigmas. (Nasrallah et al., 2002) illustrates the
right biological stage of stigma and also demonstrates that maturity of pollen is very
227
important. They collected stigmas from stage 12, stage 13, early stage 14 (14E) and late
stage 14 (14L) buds of transgenic A. thaliana, ecotype Colombia, expressing SRKb/SCRb.
Stigmas were then pollinated with self or cross pollen. The results show that stigmas in the
stage 12 or stage 14L allowed all the pollen to grow, regardless whether it was self (and
therefore should be incompatible) or cross (compatible) pollen. However, in stage 13 and
14E, when stigmas reached their optimal biological stage, self-pollen was rejected and it’s
growth inhibited (Nasrallah et al., 2002). As briefly described at the beginning of the result
chapter, we emasculated buds in the stage 12, excised the stigmas and place them in 0.5 %
agar where they were left to mature for 20-24 h before pollination. According to (Smyth et
al., 1990), stage 12 lasts for 12 h in total so our pollinations were done in stage 13 (which
lasts for 6 h) or early stage 14 (stage 14 lasts 18 h), when stigmas were not only receptive
but should as well have maximum expression of PrsS. This technique differs from the other
labs where they emasculated buds on plants and immediately pollinated them (Nasrallah et
al., 2002). As A. thaliana pollen germinates well on stigma, the stigmas were collected
stigmas for pollination assays after 2 h (Nasrallah et al., 2002). Despite the fast in vivo
pollen germination, that takes ~15 minutes in A. thaliana (Boavida et al., 2005), we left
pollen to germinate on stigma for 16 h, which was the optimal identified time for
germination of A. thaliana flowers in vitro (Boavida and McCormick, 2007). This time-point
was used for pollination assays in transgenic A. thaliana expressing Papaver genes as we did
not know if, and what role the temporal expression of Papaver genes plays in A. thaliana in
vivo pollen tube growth.
Nasrallah et al., (2002) demonstrated, that SI phenotype in transgenic A. thaliana expressing
Brassica S-determinants was developmentally regulated. The temporal analysis on the
expression of the Papaver female S-determinant, PrsS, was initially detected two days

228
preanthesis, increased at one day preanthesis and remained high for several days after flower
opening (Foote et al., 1994). In Papaver, inhibition of incompatible pollen occurs very
quickly on the stigmatic papillae, within minutes of pollination (Franklin-Tong et al., 2002),
so the same was expected to occur in A. thaliana expressing PrsS or whole S1-locus. In vitro
pollen tube inhibition and viability assay in transgenic A. thaliana expressing Papaver
pollen determinant PrpS demonstrated that the significant decrease of pollen viability
occurred as quick as 2 h after incompatible pollen challenge (data not shown), and
incompatible pollen tubes were inhibited and very short, comparable to the inhibited
Papaver pollen tubes. Very informative were also the results of actin analysis where PrpS-
expressing pollen was challenged with incompatible recombinant PrsS proteins. Actin foci
were present mostly in A. thaliana pollen grains or grains with very short tubes, indicating
that inhibition occurred very rapidly upon the SI interaction as no pollen tubes were
observed, which was comparable to the Papaver SI response. Therefore it was expected that
in vivo analysis of pollination of PrsS-expressing A. thaliana stigmas with its cognate PrpS-
GFP pollen expressing A. thaliana would confirm the rapid inhibition of pollen on the
stigma surface and show no or very little penetration of pollen through the stigma surface.
The results obtained in vivo showed no inhibition of the incompatible pollen tube growth
through PrsS expressing stigmas and such incompatible pollinations resulted in fertile seed
set, indicating that there is no or very low expression of PrsS. Although the mRNA for PrsS
was detected using RT-PCR on stage 13 flowers, the transcript levels of PrsS were lower
compared to PrpS, and the PrsS protein was not detected using western blotting. Very low
expression of PrsS could be explained by translation of low levels of mRNA into protein that
was expressed below critical threshold in flowers; however, it was also possible that protein
was not translated properly.

229
In vivo pollination assay and crosses for the seed set had a low reproducibility rate, as it was
very difficult to assure the same conditions. It was impossible to cross-pollinate flowers with
the same amount of pollen each time, and number of pollen was of great importance to
ensure reproducibility and accuracy for the seed set data. To ensure that comparable crosses
or repeats were pollinated with the same pollen mix of pollen from several different flowers
was used. Pistils were also very susceptible to any sort handling damage that occurred
mostly during the emasculation stage and this was the reason why there are less repeats of
certain crosses.
With pollination assays, emasculated stigmas in early stage 13 were excised and placed in
Elisa plate with 0.5 % agar, where they were left to mature, pollinated and finally collected
in aniline blue containing tube. If there was any degree of pollen rejection and inhibition on
incompatible crosses, then it was possible that inhibited pollen fell off the stigma or was
washed away when stigma was placed in an eppendorf tube with aniline blue. Masters
student Stephanie Smith, who continued with the pollination experiments, solved this issue
with a temporarily “compartmentalised” microscope slide where stigmas were loaded before
staining. With this technique, the visualisation of stigmas included total pollen used for
pollination as in incompatible situation none got washed away or was lost as it fell of the
stigma. However, no incompatible pollinations were observed due to low or no expression of
PrsS in transgenic A. thaliana.
Intriguing results were obtained when PrsS1 and PrsS3 expressing A. thaliana stigmas were
used to incubate Papaver S1 and S3 pollen. Pollen inhibition was observed in an S-specific
manner and in addition also pollen tube tip swelling. This indicates that transgenic PrsS
expressing A. thaliana stigmas are expressing PrsS protein, but most likely in low

230
concentrations as many stigmas were used for the stigmatic extract. It could also be possible
that proteins are not properly folded or some other components of the stigmatic extract
caused the Papaver pollen tube tip swelling, although the later explanation seems unlikely as
non-transgenic Col-0 stigmatic extract was used as a control and no such dramatic pollen
tube tip swelling was observed with it. Also, if the protein is not folded correctly we would
not be expecting to observe such a response, as it was demonstrated in vitro (See Chapter 5)
that heat denatured recombinant PrsS proteins had no effect on growth of pollen tubes.
Following successful in vitro analysis on PrpS expressing A. thaliana pollen, it was
anticipated that in vivo analysis, although preliminary, might indicate stronger level of
inhibition in incompatible pollinations. Most likely, the problem lies within the expression
levels of PrsS in stigma. For successful incompatible response, the expression level of
stigmatic gene is crucial and it was also demonstrated in the case of transgenic A. thaliana
expressing Brassica SRK genes in the model of transgenic SI A. thaliana (Bi et al., 2000,
Nasrallah et al., 2002, Boggs et al., 2009b). In transgenic A. thaliana expressing Brassica SI
they solved the problem by transforming the SI system from more closely related SI
Arabidopsis lyrata and Capsella grandiflora (Nasrallah et al., 2002, Boggs et al., 2009b,
Nasrallah et al., 2007). In this light, the expression of the stigmatic genes in A. thaliana
seems more problematic than expression of pollen genes. However, the proteins that are
being utilised in Papaver-like transgenic A. thaliana SI model and Brassica-like transgenic
model are completely different. In Papaver, PrsS are small globular, secreted stigmatic
proteins, while in Brassica the stigmatic S-receptor kinase, SRK, is a single-pass
transmembrane protein kinase. Structurally the proteins are very different, so the problem of
231
successful expression of foreign stigmatic genes in A. thaliana probably lies with the
incorrect processing of the stigmatic determinants or in a weak expression.
The stigmas used for the in vivo experiments were homozygous but even if diploid stigmas
would be heterozygous for PrsS, this would mean that they still contain one copy of the PrsS
gene. When such flower is crossed with pollen that is homozygous for PrpS, the outcome of
an incompatible cross should be 100 % pollen inhibited (PrsS expressing stigma x PrpS
pollen), if we assume, that pollen inhibition occurs on the stigmatic surface. The seeds of
such cross (F1 progeny) would therefore be able to survive the Basta and Kan selection. So if
incompatible crosses between PrsS and PrpS expressing A. thaliana lines (HZ1 x BG16 or
HZ2 x HZ3) would be successful, then there would be no seed produced as the pollen should
be inhibited on the surface of the stigma or at least very early as it would grew through the
style. However, our crosses between PrsS and PrpS determinant of the cognate S-haplotype
resulted in pollen tubes growing thorough the style and fertilizing the ovaries. The analysis
of F1 generation seedlings arriving from some of the incompatible crosses presented in this
section showed various segregation phenotype and seed set. The segregation was analysed
on a double selection media, using both, Kan and Basta. Only the seedlings expressing both,
PrsS and PrpS, could survive and it was therefore expected that surviving seedlings would
have reduced seed set as a result of simultaneous expression of both, PrsS and PrpS. This
was true for most of the analysed F1 lines. Significantly different seed set from Col-0 plants
were observed in F1 plants deriving from cross between HZ1.1-3.1 x BG16#25.1-1, HZ1.8-
2.1 x BG16#25.1-1 and HZ2.6-1.1 x HZ3.1-15.1 but not from two crosses of HZ2.13-5.1 x
HZ3.1-15.1, whose seed set was not significantly different from Col-0. For more complete
analysis the presence of the genes should be analysed by RT-PCR and the seeds from F1

232
progeny should be grown on individual selection media in order to give us more information
about the nature of parental expression. It would also be important to perform Southern
analysis in order to investigate number of inserts present as well as study the protein
expression by Western analysis and immunolocalization. The lowest seed set was observed
in F1 derived from HZ1.8-2.1 x BG16#25.1-1 (17.9±5 seeds) and HZ2.6-1.1 x HZ3.1-15.1
(15.9±4.2 seeds), which could indicate that these two have the highest expression of PrsS1 or
PrsS3, respectively, and those lines would therefore be the most interesting for the future in
vivo analysis of Papaver SI in transgenic A. thaliana.
Nevertheless, the in vivo data suggest that we ended with a “leaky” PrsS phenotype and
despite all the above possibilities, the PrsS expression is very low (probably below the level
required for inhibition) or the protein is not being properly folded. In order to obtain a more
complete picture of PrsS expression in A. thaliana, the repeat of transformation with highly
active stigma-specific promoter Stig1 from N.tabacum would be proposed or transformation
with another stigma-specific promoter, such as SLG promoter from Brassica (Thorsness et
al., 1993, Goldman et al., 1994).
Preliminary analysis of A. thaliana BG6 lines expressing whole S1-locus revealed that
majority of lines exhibited a significantly reduced seed set after self-pollination, while seed
set of some lines was not affected after self-pollination (BG6.16, BG6.17, BG6.19 and
BG6.20). If the transgenic BG6 A. thaliana were homozygous, then the seed set would not
be expected. Therefore the poppy SI (using the S1-locus) was probably leaky in A. thaliana.
Most probably the problem lies within the protein expression levels as the protein translation
is coupled with the endogenous promoter (the PrpS1 in BG16 is coupled with a strong
233
ntp303 promoter, hence the high and strong expression). However, the RT-PCR analysis that
was so far conducted on a limited number of BG6 samples, resulted in only PrsS mRNA
present, and not PrpS; so the pollen seed set could also indicate that pollinations are due to
the Col-0 phenotype of pollen (heterozygous) and that the reduced seed set occurred for
different reasons. The place of insertion on the genome and the number of inserted copies,
were also unknown and this might well be the contributing factor to the reduced fertility.
Transgenic BG6 lines expressing whole S1-locus require further detailed analysis. The RT-
PCR analysis should be systematically carried on all the lines from BG6 plants, screening
the PrsS and PrpS expression, as we cannot be certain whether the reduction of seeds was
due to the functional SI.
The transgenic A. thaliana model for Brassica SI did not express the whole S-locus, but the
functional SRK-SCR gene pairs (Nasrallah et al., 2004). If the whole Papaver S-locus could
be transferred to and be functional in a such an evolutionary distant species as A. thaliana, as
was demonstrated for pollen determinant PrpS, then this could provide an information into
evolution of SI. It would demonstrate a possible signalling mechanism being conserved in A.
thaliana that would probably open up a further debate not only about the evolution SI but
also about the evolution of other recognition systems, such as plant-pathogen. Furthermore,
this system could be used for plant breeding in a production of F1 hybrids where self-
compatibility poses a problem that needs to be overcome. Furthermore, this Papaver-like SI
system could potentially be also linked to different promoters for expression in somatic plant
cells or even mammalian cells in order to use it as a potential inducible switch to trigger
PCD, which would be of great interest with mammalian cancer cells. And most importantly,
the A. thaliana model exhibiting Papaver-like SI would represent a helpful and valuable tool

234
in studying the SI events on a detailed molecular level, as it would enable the crosses with
various other lines of interest or analysis by mutations of various events, from the details of
interaction between PrsS and PrpS to PCD.

235
CHAPTER 7
GENERAL DISCUSSION

236
The studies presented in this thesis cover the analysis of the initial events of SI, the
interaction between the stigmatic S-determinant, PrsS and pollen S-determinant, PrpS, the
preliminary investigation into the involvement of the ubiquitin-proteasomal pathway during
SI, and in vitro and in vivo analysis of transgenic A. thaliana, expressing Papaver S-
determinants.
Papaver SI model in Figure 7.1. summarizes the SI events including the S-specific
interaction between PrpS and PrsS (presented in Chapter 4, published in Wheeler et al.,
2009) and the model of UbP degradation pathway connected to DEVDase activity (presented
in Chapter 3). The involvement of UbP pathway in Papaver SI is discussed in details in
Chapter 3 and not dealt here.
Figure 7.1.: Schematic model of the SI response in Papaver. Upon the interaction of secreted stigmatic PrsS proteins and pollen transmembrane protein PrpS, a downstream signalling network is triggered, starting with an increase in K+ and [Ca2+]i who is signalling to the inhibition of pyrophosphatase activity and pollen tube tip growth, activation of MAPK, depolymerization of actin and microtubule cytoskeleton and appearance of punctate actin foci, activation of ROS and NO and activation of caspase-like activities, leading to the PCD of the pollen tube. The model presents DEVDase activity that most likely acts in parallel with proteasomal degradation. DEVDases are presented as yellow circles within the proteasome, as identified by Hatsugai et al., (2009).
PrsS proteins
S1 pollen tube
Microtubule Cytoskeleton
Pr-p26.1 Pr-p26.1
p56 p56 P
sS1
DEVDase
[Ca2+]i
P
ROS & NO
sS3
Actin Cytoskeleton
Inhibition of pollen tube tip growth
ABPs
sS3
sS1
= ?
Nonspecific cation channel
Ub Ub Ub Ub
Ub Ub Ub
Proteasomal degradation
and DEVDAse
activity

237
7.1. Papaver S-determinant interactions
SI in Papaver is achieved when incompatible pollen grains lands on the stigma where it is
recognized and discriminated from the genetically different pollen, and selectively inhibited.
The stigmatic secreted PrsS proteins mediate this recognition and rejection, and act as a
signalling ligand for the pollen transmembrane protein, PrpS (Foote et al., 1994, Wheeler et
al., 2009). The discovery of PrpS as the pollen determinant of the SI response in Papaver
represented a breakthrough in the SI research and the long sought missing link required for
the recognition and rejection of the incompatible pollen.
The results presented in this thesis demonstrate the S-specific binding between PrpS and
PrsS using the far western blot and the peptides designed to mimic the extracellular domain.
The extracellular domain was predicted to be positioned between TM 2 and 3 using a variety
of prediction programmes and was proposed to be the interacting region for the secreted
ligand PrsS (Wheeler et al., 2009). The binding was further indicated when the peptides
designed over the extracellular domain, alleviated the incompatible pollen inhibition when
added to the in vitro bioassay (Wheeler et al., 2009). The far western method is well
established and widely used for determining protein interaction sites in receptor-ligand
interaction as well as the use of the synthetic peptides (Volkmer et al., 2011). Far western
approach was used to confirm many protein-protein interactions, for example, to
demonstrate the interaction in plant-pathogen system between rice Pi-ta receptor and host
AVR-Pita protein (Jia et al., 2000) or to identify the S-specific interaction between stigmatic
microsomal fraction and recombinant SCR in Brassica (Kemp and Doughty, 2007).

238
The PrpS represents a novel transmembrane protein and shares no homology to any other
protein, so the exact mechanism of the perception is not yet known. PrpS could be part of a
greater multimeric complex where it could play a role of the S-specific signal perception
protein but not the downstream transduction. An example of such complex is CLV complex
where LRR RLKs CLV1 and CLV2 dimerize in order to form a receptor complex (Clark et
al., 1995, Jeong et al., 1999). CLV1 binds the CLV3 derived CLE ligand through its
extracellular domain and functions in stem cell specification (Clark et al., 1995, Clark, 2001,
Stahl and Simon, 2005, Ogawa et al., 2008). CLV1 and CLV3 are expressed only in the
central zone of SAM (Clark et al., 1997, Fletcher et al., 1999). Below the central zone a
control zone is located where another protein, implicated in SAM is expressed. Transcription
factor WUSCHEL (WUS) forms a feedback network with CLV (Schoof et al., 2000). WUS
upregulates CLV3 when the number of stem cells is low, while CLV3 binds to CLV1 and
downregulates WUS when the stem cells are in abundance (Reddy and Meyerowitz, 2005).
If PrpS forms a part of a larger protein complex, it is yet unkown. However, the S-protein
binding protein (SBP) was previously identified that apparently binds to the PrsS, but not in
the S-specific manner (Hearn et al., 1996). The connection between PrpS and SBP is not yet
analysed as no protein or gene has yet been identified for SBP. Alternatively, the PrpS could
perceive and transduct a signal on its own. Some analogies might be drawn between the
Drosophilla protein Flower (Yao et al., 2009) or the mammalian CRAC calcium channel
(Luik et al., 2008) and PrpS. Protein Flower is TM protein with 4 predicted TM domains and
is involved in the endocytosis of the synaptic vesicles. It displays properties of Ca2+ channel:
negatively charged aminoacids in the TM domains, which play a key role in the ion
selectivity. Similar to Flower, the 4 TM protein CRAC/Orai also carries negatively charged
aminoacids in the TM domains and multimerizes to form a channel. In this process each
239
monomer contributes one TM domain with the negatively charged aminoacid to the pore
(Yao et al., 2009, Prakriya et al., 2006). Flower proteins also forms multimers and is thus
able to form a calcium channel by which it controls Ca2+ influx (Yao et al., 2009). Protein
alignment of PrpS proteins revealed conserved glutamic acid residue on position 75. This
region is mostly predicted to be extracellular in PrpS1 and PrpS8, and intracellular in PrpS3,
although some prediction programmes also gave inverted prediction, but none predicted a
TM domain. Concluding from the analysis conducted, this region is involved in the PrsS
interaction (Wheeler et al., 2009). Interestingly, this glutamic acid residue is also conserved
with Flower protein, when PrpS and Flower are aligned, although in Flower the region is
predicted TM. The negatively charged aminoacids appear to be crucial in the TM domains
for the formation of the voltage gated calcium channels. Alignment of PrpS proteins
revealed in total 7 conserved negatively charged aminoacids: three glutamic acids (E75,
E129 and E168), and three aspartic acid (D39, D90, and D123) with some being the
candidates for the potential pore formation. Additional motif that is well known to be
involved in the protein oligomerization and formation of the membrane channel is the
GxxxG motif (Dawson et al., 2002, Senes et al., 2004, McClain et al., 2003). Helicobacter
pylori vacuolating toxin can form an anion-selective membrane channel as it contains three
tandem GxxxG motifs, characteristic for TM dimerization and membrane channel formation
(McClain et al., 2003). The PrpS alignment revealed two conserved tandem GxxxG motifs in
positions 126 and 130, with the first one also conserved in Flower. This region is also not
predicted to be part of TM domain but the long cytoplasmic tail. More detailed analysis of
the residues suggests fourth TM domain, so the motif is most likely part of the fourth TM
domain. The GxxxG motif in position 126 also contains conserved glutamic acid residue.
240
Taken together, PrpS S-specifically recognizes the PrsS proteins and it most likely acts as a
receptor. One of the first downstream events following the interaction is the increase in the
cytosolic calcium (Franklin-Tong et al., 1993, Franklin-Tong et al., 2002), and it was also
demonstrated that the SI activates ligand-gated nonspecific cation conductance (Wu et al.,
2011), so the PrpS might form a channel, composed of PrpS multimers or a channel complex
where it would form a subunit. This is something that is currently being investigated in the
Franklin-Tong’s lab.
7.2 Functional analysis of Papaver rhoeas self-incompatibility in transgenic Arabidopsis
thaliana
We initiated studies to see whether the Papaver SI system might be functionally transferable
to other plant species and studies in this thesis describe the successful interspecific transfer
of the Papaver pollen determinants of SI, PrpS, to SC A. thaliana. Several transgenic A.
thaliana lines were created, expressing the PrpS fused to the GFP: PrpS1-GFP and PrpS3-
GFP, and stigmatic S-determinants PrsS1 and PrsS3 under the control of pollen and stigma
specific promoters, respectively, and lines expressing whole S1 locus or PrpS1, under the
control of the native promoter and constitutive 35S promoter, respectively. Our results “in
vitro” revealed an S-specific inhibition of the PrpS-GFP expressing transgenic A. thaliana
pollen tube growth by recombinant PrsS, and key hallmark features for Papaver SI: loss of
pollen viability, appearance of actin foci and increase in DEVDase activity. These data
suggest that PrpS expressed in evolutionary very distantly related species A. thaliana, is
functional and that only PrpS and PrsS are required for a fully functional SI response in A.
thaliana pollen, where all the required components for the pollen tube inhibition are present.
241
However, preliminary in vivo assay demonstrated that PrsS exhibits weaker expression in A.
thaliana flowers. Although the full SI response was not demonstrated in vivo, we observed
significant inhibition of Papaver pollen with protein extract from PrsS expressing A.
thaliana stigmas, leading to the conclusion of low expression of PrsS in transgenic A.
thaliana.
Our study represents the first such study of transforming A. thaliana with the GSI
determinants. Transformation of A. thaliana by determinants of Brassica SI is already
developed by Nassrallah lab and studies on A. thaliana expressing functional intact or
chimeric SRK/SCR pairs are underway to identify the mechanism of SI and to elucidate
components of pollen-pistil signalling (Tantikanjana et al., 2010, Nasrallah et al., 2002, Rea
et al., 2010). SRK-SCR receptor-ligand gene pair used for the studies of Brassica SI were
isolated from the SI crucifers Arabidopsis lyrata or Capsella grandiflora, and the SI
analysed by performing crosses between them (Nasrallah et al., 2002, Boggs et al., 2009b,
Rea et al., 2010, Nasrallah et al., 2004). Although Brassica model of SI in A. thaliana took
several years to develop and optimize, it now represents invaluable system for the studies of
the mechanism of SI and pollen-pistil interactions, as well as evolutionary aspects of SI
(Nasrallah et al., 2002, Nasrallah et al., 2004, Rea et al., 2010). The transgenic A. thaliana
expressing SRK-SCR gene pair was used for example for the analysis of the residues
important for the SRK specificity and therefore the SI response. Site-directed mutagenesis
approach was used on the polymorphic aminoacid residues in the extracellular domain of
SRK and six were identified as crucial for ligand-specific SI activation (Boggs et al., 2009a).
Although in Papaver we have identified the extracellular domain of PrpS1, required for the
SI response, and 15 aa domain that is crucial for the interaction with PrsS1, it was so far
impossible to narrow down the S-specificity to the individual amino acids. The transgenic A.
242
thaliana pollen expressing PrpS is a model for Papaver-like SI that now enables the
possibility to investigate the specific residues within PrpS, determining the specificity of the
ligand binding interaction or protein multimerization.
Papaver belongs to the basal order in the lineage Ranunculales, diverged very early in the
history of eudicots (Allen and Hiscock, 2008). The evolutionary distance between
Ranunculales and Brassicales, lineage where belongs A. thaliana, is estimated to 140 million
years (Bell et al., 2010). This suggests that Papaver SI response pre-dates other SSI
mechanism as well as other GSI and it may represent the ancestral state of SI. It is also
possible that SSI system evolved from the SC species originating from the GSI ancestors
(Allen and Hiscock, 2008). Although A. thaliana operated Brassica-type of SI and it
diverged from A. lyrata ~10 million years ago (Hu et al., 2011), the transfer of the Papaver
pollen S-determinant was functional. A. thaliana pollen had the cellular machinery required
to elicit a S-specific pollen rejection upon the PrpS-PrsS interaction. This could indicate that
an ancestral SI mechanism, operating in Papaver might still be conserved in other species,
although they evolved more complex mechanisms of SI (for review see McClure et al.,
(2011), Tantikanjana et al., (2010)) but might have kept basic components and recruited this
mechanism for different purposes. The recent advances of the research on the SI induced
actin reorganisations in different SI systems suggest, that there could be a link between the
mechanistically different SI systems and the SI could be more conserved than known so far
(Liu et al., 2007c, Iwano et al., 2007, Wang et al., 2010, Poulter et al., 2010a).
The preliminary analysis to investigate whether the Papaver-like SI response could be
induced in any plant tissue was tested using A. thaliana leaf mesophyll protoplasts, and the
results so far confirmed the functionality of the PrpS-PrsS system.
243
Ca2+ is mediating downstream events of SI, observed in incompatible Papaver pollen tube,
however, it is also a well known and conserved secondary messenger in other plant species,
mammals and also bacteria, relaying the signals, perceived by the receptors on the cell
surface to target molecules in the cytosol (Shemarova and Nesterov, 2005, Ma and
Berkowitz, 2007). It is very important, for example, for the signal transduction during plant-
pathogen interactions, as Ca2+ increase is one of the first steps during plant immune response
to the PTI and ETI, signalling to the PCD. Considering many similarities between SI and HR
as well as animal histocompatibility, such as aforementioned Ca2+ signalling to
phosphorylation of target proteins, alterations to the cytoskeleton, activation of ROS and
induction of the DEVDase activities leading to PCD, might indicate that these targets are
ancient and conserved, and it would be interesting to investigate the evolutionary connection
between them.

244
CHAPTER 8
REFERENCES

245
ADAMAKIS, I.-D. S., PANTERIS, E. & ELEFTHERIOU, E. P. 2011. The fatal effect of tungsten on Pisum sativum L. root cells: indications for endoplasmic reticulum stress-induced programmed cell death. Planta, 234, 21-34.
ALLEN, A. M. & HISCOCK, S. J. 2008. Evolution and Phylogeny of Self-Incompatibility Systems in Angiosperms. In: V.E.FRANKLIN-TONG (ed.) Self-Incompatibility in Flowering Plants. Springer-Verlag Berlin Heidelberg.
AMIEN, S., KLIWER, I., MÁRTON, M. L., DEBENER, T., GEIGER, D., BECKER, D. & DRESSELHAUS, T. 2010. Defensin-Like ZmES4 Mediates Pollen Tube Burst in Maize via Opening of the Potassium Channel KZM1. PLoS Biol, 8, e1000388.
ARAI, M., MITSUKE, H., IKEDA, M., XIA, J.-X., KIKUCHI, T., SATAKE, M. & SHIMIZU, T. 2004. ConPred II: a consensus prediction method for obtaining transmembrane topology models with high reliability. Nucleic Acids Res, 32, W390-3.
ASTRÖM, H. 1997. The structure and function of Tobacco pollen tube cytoskeleton, University of Helsinki, Finland.
BECRAFT, P. W., STINARD, P. S. & MCCARTY, D. R. 1996. CRINKLY4: A TNFR-like receptor kinase involved in maize epidermal differentiation. Science, 273, 1406-9.
BELENGHI, B., SALOMON, M. & LEVINE, A. 2004. Caspase-like activity in the seedlings of Pisum sativum eliminates weaker shoots during early vegetative development by induction of cell death. J Exp Bot, 55, 889-897.
BELL, C. D., SOLTIS, D. E. & SOLTIS, P. S. 2010. The age and diversification of the angiosperms re-revisited. Am J Bot, 97, 1296-303.
BERNSEL, A., VIKLUND, H., FALK, J., LINDAHL, E., VON HEIJNE, G. & ELOFSSON, A. 2008. Prediction of membrane-protein topoloy from first principles. PNAS, 105, 7117-81.
BI, Y. M., BRUGIÈRE, N., CUI, Y., GORING, D. R. & ROTHSTEIN, S. J. 2000. Transformation of Arabidopsis with a Brassica SLG/SRK region and ARC1 gene is not sufficient to transfer the self-incompatibility phenotype. Mol Gen Genet, 263, 648-54.
BLANVILLAIN, R., YOUNG, B., CAI, Y.-M., HECHT, V., VAROQUAUX, F., DELORME, V., LANCELIN, J.-M., DELSENY, M. & GALLOIS, P. 2011. The Arabidopsis peptide kiss of death is an inducer of programmed cell death. The EMBO Journal, 30, 1173-83.
BOAVIDA, L. C. & MCCORMICK, S. 2007. TECHNICAL ADVANCE: Temperature as a determinant factor for increased and reproducible in vitro pollen germination in Arabidopsis thaliana. The Plant Journal, 52, 570-582.
BOAVIDA, L. C., VIEIRA, A. M., BECKER, J. D. & FEIJÓ, J. A. 2005. Gametophyte interaction and sexual reproduction: how plants make a zygote. Int J Dev Biol, 49, 615-32.
BOGGS, N. A., DWYER, K. G., NASRALLAH, M. E. & NASRALLAH, J. B. 2009a. In Vivo Detection of Residues Required for Ligand-Selective Activation of the S-Locus Receptor in Arabidopsis. Current Biology, 1-6.
BOGGS, N. A., DWYER, K. G., SHAH, P., MCCULLOCH, A. A., BECHSGAARD, J., SCHIERUP, M. H., NASRALLAH, M. E. & NASRALLAH, J. B. 2009b. Expression of Distinct Self-Incompatibility Specificities in Arabidopsis thaliana. Genetics, 182, 1313-1321.
BOGGS, N. A., NASRALLAH, J. B. & NASRALLAH, M. E. 2009c. Independent S-Locus Mutations Caused Self-Fertility in Arabidopsis thaliana. PLoS Genet, 5, e1000426.
246
BOLLER, T. & FELIX, G. 2009. A renaissance of elicitors: perception of microbe-associated molecular patterns and danger signals by pattern-recognition receptors. Annual review of plant biology, 60, 379-406.
BONNEAU, L., GE, Y., DRURY, G. E. & GALLOIS, P. 2008. What happened to plant caspases? J Exp Bot, 59, 491-499.
BORÉN, M., HÖGLUND, A.-S., BOZHKOV, P. & JANSSON, C. 2006. Developmental regulation of a VEIDase caspase-like proteolytic activity in barley caryopsis. Journal of Experimental Botany, 57, 3747-53.
BOSCH, M., CHEUNG, A. Y. & HEPLER, P. K. 2005. Pectin methylesterases, a regulator of pollen tube growth. Plant Physiology, 138, 1334-1346.
BOSCH, M. & FRANKLIN-TONG, V. E. 2007. Temporal and spatial activation of caspase-like enzymes induced by self-incompatibility in Papaver pollen. Proc Natl Acad Sci USA, 104, 18327-32.
BOSCH, M., POULTER, N. S., PERRY, R. M., WILKINS, K. A. & FRANKLIN-TONG, V. E. 2010. Characterization of a legumain/vacuolar processing enzyme and YVADase activity in Papaver pollen. Plant Mol Biol, 74, 381-93.
BOU DAHER, F., CHEBLI, Y. & GEITMANN, A. 2009. Optimization of conditions for germination of cold-stored Arabidopsis thaliana pollen. Plant Cell Rep, 28, 347-57.
BOZHKOV, P. V., FILONOVA, L. H., SUAREZ, M. F., HELMERSSON, A., SMERTENKO, A. P., ZHIVOTOVSKY, B. & VON ARNOLD, S. 2004. VEIDase is a principal caspase-like activity involved in plant programmed cell death and essential for embryonic pattern formation. Cell Death and Differentiation, 11, 175-182.
BRADFORD, M. 1976. A rapid and sensitive method for quantitation of microgram quantities of protein utilizing the principle of protein-dye-binding. Anal Biochem, 72, 248-254.
BRAND, U., FLETCHER, J. C., HOBE, M., MEYEROWITZ, E. M. & SIMON, R. 2000. Dependence of stem cell fate in Arabidopsis an a feedback loop regulated by CLV3 activity. Science, 289, 617-619.
BREEUWER, P., DROCOURT, J. L., BUNSCHOTEN, N., ZWIETERING, M. H., ROMBOUTS, F. M. & ABEE, T. 1995. Characterization of uptake and hydrolysis of fluorescein diacetate and carboxyfluorescein diacetate by intracellular esterases in Saccharomyces cerevisiae, which result in accumulation of fluorescent product. Applied and Environmental Microbiology, 61, 1614.
CABRILLAC, D., COCK, J. M., DUMAS, C. & GAUDE, T. 2001. The S-locus receptor kinase is inhibited by thioredoxins and activated by pollen coat proteins. Nature.
CAI, G. & CRESTI, M. 2009. Organelle motility in the pollen tube: a tale of 20 years. J Exp Bot, 60, 495-508.
CANALES, C., BHATT, A. M., SCOTT, R. & DICKINSON, H. 2002. EXS, a putative LRR receptor kinase, regulates male germline cell number and tapetal identity and promotes seed development in Arabidopsis. Curr Biol, 12, 1718-27.
CAPRON, A., GOURGUES, M., NEIVA, L. S., FAURE, J.-E., BERGER, F., PAGNUSSAT, G., KRISHNAN, A., ALVAREZ-MEJIA, C., VIELLE-CALZADA, J.-P., LEE, Y.-R., LIU, B. & SUNDARESAN, V. 2008. Maternal control of male-gamete delivery in Arabidopsis involves a putative GPI-anchored protein encoded by the LORELEI gene. Plant Cell, 20, 3038-49.
CARLSSON, C., JONSSON, M. & AKERMAN, B. 1995. Double bands in DNA gel electrophoresis caused by bis-intercalating dyes. Nucleic Acids Res, 23, 2413-20.

247
CHANG, L. F. & KARIN, M. 2001. Mammalian MAP kinase signalling cascades. Nature, 410, 37-40.
CHARPENTEAU, M., JAWORSKI, K., RAMIREZ, B. C., TRETYN, A., RANJEVA, R. & RANTY, B. 2004. A receptor-like kinase from Arabidopsis thaliana is a calmodulin-binding protein. Biochem J, 379, 841-8.
CHEN, G., ZHANG, B., ZHAO, Z., SUI, Z., ZHANG, H. & XUE, Y. 2010. 'A life or death decision' for pollen tubes in S-RNase-based self-incompatibility. J Exp Bot, 61, 2027-2037.
CHENG, S.-H., ZHUANG, J.-Y., FAN, Y.-Y., DU, J.-H. & CAO, L.-Y. 2007. Progress in research and development on hybrid rice: a super-domesticate in China. Annals of botany, 100, 959-66.
CHEUNG, A. Y., BOAVIDA, L. C., AGGARWAL, M., WU, H. M. & FEIJO, J. A. 2010. The pollen tube journey in the pistil and imaging the in vivo process by two-photon microscopy. J Exp Bot, 61, 1907-1915.
CHEUNG, A. Y. & WU, H. M. 1999. Arabinogalactan proteins in plant sexual reproduction. Protoplasma, 208, 87-98.
CHEUNG, A. Y. & WU, H. M. 2008. Structural and signaling networks for the polar cell growth machinery in pollen tubes. Annual review of plant biology, 59, 547-72.
CHEVALIER, D., BATOUX, M., FULTON, L., PFISTER, K., YADAV, R. K., SCHELLENBERG, M. & SCHNEITZ, K. 2005. STRUBBELIG defines a receptor kinase-mediated signaling pathway regulating organ development in Arabidopsis. Proc Natl Acad Sci USA, 102, 9074-9.
CHICHKOVA, N. V., GALIULLINA, R. A., TALIANSKY, M. E. & VARTAPETIAN, A. B. 2008. Tissue disruption activates a plants caspase-like protease with TATD cleavage specificity. Plant Stress, 2, 89-95.
CHICHKOVA, N. V., KIM, S. H., TITOVA, E. S., KALKUM, M., MOROZOV, V. S., RUBTSOV, Y. P., KALININA, N. O., TALIANSKY, M. E. & VARTAPETIAN, A. B. 2004. A plant caspase-like protease activated during the hypersensitive response. Plant Cell, 16, 157-71.
CHICHKOVA, N. V., SHAW, J., GALIULLINA, R. A., DRURY, G. E., TUZHIKOV, A. I., KIM, S. H., KALKUM, M., HONG, T. B., GORSHKOVA, E. N., TORRANCE, L., VARTAPETIAN, A. B. & TALIANSKY, M. 2010. Phytaspase, a relocalisable cell death promoting plant protease with caspase specificity. Embo Journal, 29, 1149-1161.
CHISHOLM, S. T., COAKER, G., DAY, B. & STASKAWICZ, B. J. 2006. Host-microbe interactions: shaping the evolution of the plant immune response. Cell, 124, 803-814.
CHO, S. K., LARUE, C. T., CHEVALIER, D., WANG, H., JINN, T.-L., ZHANG, S. & WALKER, J. C. 2008. Regulation of floral organ abscission in Arabidopsis thaliana. Proc Natl Acad Sci USA, 105, 15629-34.
CHOW, B. & MCCOURT, P. 2006. Plant hormone receptors: perception is everything. Genes & Development, 20, 1998-2008.
CHRISTOFFERSON, D. E. & YUAN, J. 2010. Necroptosis as an alternative form of programmed cell death. Current Opinion in Cell Biology, 22, 263-8.
CLARK, S. E. 2001. Cell signalling at the shoot meristem. Nat Rev Mol Cell Biol, 2, 276-84. CLARK, S. E., RUNNING, M. P. & MEYEROWITZ, E. M. 1995. CLAVATA3 is a
specific regulator of shoot and floral meristem development affecting the same processes as CLAVATA1. Development, 121, 2057-2067.

248
CLARK, S. E., WILLIAMS, R. W. & MEYEROWITZ, E. M. 1997. The CLAVATA1 gene encodes a putative receptor kinase that controls shoot and floral meristem size in Arabidopsis. Cell, 89, 575-85.
CLOUSE, S. D. 2011. Brassinosteroid Signal Transduction: From Receptor Kinase Activation to Transcriptional Networks Regulating Plant Development. Plant Cell, 23, 1219-30.
COFFEEN, W. C. & WOLPERT, T. J. 2004. Purification and characterization of serine proteases that exhibit caspase-like activity and are associated with programmed cell death in Avena sativa. Plant Cell, 16, 857-73.
COLL, N. S., EPPLE, P. & DANGL, J. L. 2011. Programmed cell death in the plant immune system. Cell Death and Differentiation, 1-10.
COLL, N. S., VERCAMMEN, D., SMIDLER, A., CLOVER, C., VAN BREUSEGEM, F., DANGL, J. L. & EPPLE, P. 2010. Arabidopsis type I metacaspases control cell death. Science, 330, 1393-7.
COOPERMAN, B., BAYKOV, A. & LAHTI, R. 1992. Evolutionary conservation of the active site of soluble inorganic pyrophosphatase. Trends in biochemical sciences, 17, 262-266.
CRAIG, A., EWAN, R., MESMAR, J., GUDIPATI, V. & SADANANDOM, A. 2009. E3 ubiquitin ligases and plant innate immunity. Journal of Experimental Botany, 60, 1123-32.
CRUZ-GARCIA, F., NATHAN HANCOCK, C., KIM, D. & MCCLURE, B. 2005. Stylar glycoproteins bind to S-RNase in vitro. The Plant journal 42, 295-304.
DANGL, J. L. & JONES, J. D. 2001. Plant pathogens and integrated defence responses to infection. Nature, 411, 826-33.
DANON, A., ROTARI, V. I., GORDON, A., MAILHAC, N. & GALLOIS, P. 2004. Ultraviolet-C overexposure induces programmed cell death in Arabidopsis, which is mediated by caspase-like activities and which can be suppressed by caspase inhibitors, p35 and Defender against Apoptotic Death. J Biol Chem, 279, 779-87.
DAWSON, J. P., WEINGER, J. S. & ENGELMAN, D. M. 2002. Motifs of serine and threonine can drive association of transmembrane helices. J Mol Biol, 316, 799-805.
DE BUCK, S., PECK, I., DE WILDE, C., MARJANAC, G., NOLF, J., DE PAEPE, A. & DEPICKER, A. 2007. Generation of Single-Copy T-DNA Transformants in Arabidopsis by the CRE/loxP Recombination-Mediated Resolution System. Plant Physiology, 145, 1171-1182.
DE GRAAF, B. H. J., RUDD, J. J., WHEELER, M. J., PERRY, R. M., BELL, E. M., OSMAN, K., FRANKLIN, F. C. H. & FRANKLIN-TONG, V. E. 2006. Self-incompatibility in Papaver targets soluble inorganic pyrophosphatases in pollen. Nature, 444, 490-3.
DE SMET, I., VASSILEVA, V., DE RYBEL, B., LEVESQUE, M. P., GRUNEWALD, W., VAN DAMME, D., VAN NOORDEN, G., NAUDTS, M., VAN ISTERDAEL, G., DE CLERCQ, R., WANG, J. Y., MEULI, N., VANNESTE, S., FRIML, J., HILSON, P., JURGENS, G., INGRAM, G. C., INZE, D., BENFEY, P. N. & BEECKMAN, T. 2008. Receptor-Like Kinase ACR4 Restricts Formative Cell Divisions in the Arabidopsis Root. Science, 322, 594-597.
DEBER, C. M., WANG, C., LIU, L. P., PRIOR, A. S., AGRAWAL, S., MUSKAT, B. L. & CUTICCHIA, A. J. 2001. TM Finder: a prediction program for transmembrane protein segments using a combination of hydrophobicity and nonpolar phase helicity scales. Protein Sci, 10, 212-9.

249
DEL POZO, O. & LAM, E. 1998. Caspases and programmed cell death in the hypersensitive response of plants to pathogens. Current Biology, 8, 1129-1132.
DHARMASIRI, N., DHARMASIRI, S. & ESTELLE, M. 2005. The F-box protein TIR1 is an auxin receptor. Nature, 435, 441-5.
DICKMAN, M. B., PARK, Y. K., OLTERSDORF, T., LI, W., CLEMENTE, T. & FRENCH, R. 2001. Abrogation of disease development in plants expressing animal antiapoptotic genes. PNAS, 98.
DIELEN, A.-S., BADAOUI, S., CANDRESSE, T. & GERMAN-RETANA, S. 2010. The ubiquitin/26S proteasome system in plant-pathogen interactions: a never-ending hide-and-seek game. Molecular Plant Pathology, 11, 293-308.
DIXIT, R., RIZZO, C., NASRALLAH, M. & NASRALLAH, J. 2001. The brassica MIP-MOD gene encodes a functional water channel that is expressed in the stigma epidermis. Plant Mol Biol, 45, 51-62.
DODD, A. N., KUDLA, J. & SANDERS, D. 2010. The language of calcium signaling. Annual review of plant biology, 61, 593-620.
DODDS, P. N., CLARKE, A. E. & NEWBIGIN, E. 1996. Molecular characterization of an S-like RNase of Nicotiana alata that is induced by phosphate starvation. Plant Mol. Biol., 31, 227-38.
DONG, W., NOWARA, D. & SCHWEIZER, P. 2006. Protein polyubiquitination plays a role in basal host resistance of barley. Plant Cell, 18, 3321-31.
DREHER, K. & CALLIS, J. 2007. Ubiquitin, hormones and biotic stress in plants. Annals of Botany, 99, 787-822.
DWIVEDI, S., PEROTTI, E. & ORTIZ, R. 2008. Towards molecular breeding of reproductive traits in cereal crops. Plant Biotechnology Journal, 6, 529-59.
ENTANI, T., IWANO, M., SHIBA, H., CHE, F. S., ISOGAI, A. & TAKAYAMA, S. 2003. Comparative analysis of the self-incompatibility (S-) locus region of Prunus mume: identification of a pollen-expressed F-box gene with allelic diveristy. Genes to Cells, 8, 203-213.
ESCOBAR-RESTREPO, J.-M., HUCK, N., KESSLER, S. A., GAGLIARDINI, V., GHEYSELINCK, J., YANG, W.-C. & GROSSNIKLAUS, U. 2007. The FERONIA receptor-like kinase mediates male-female interactions during pollen tube reception. Science, 317, 656-660.
ETCHELLS, J. P. & TURNER, S. R. 2010. The PXY-CLE41 receptor ligand pair defines a multifunctional pathway that controls the rate and orientation of vascular cell division. Development, 137, 767-74.
FAN, L. M., WANG, Y. F., WANG, H. & WU, W. H. 2001. In vitro Arabidopsis pollen germination and characterization of the inward potassium currents in Arabidopsis pollen grain protoplasts. J Exp Bot, 52, 1603-14.
FEIJÓ, J. A. 2010. The mathematics of sexual attraction. J Biol, 9, 18. FEIJÓ, J. A., SAINHAS, J., HOLDAWAY-CLARKE, T., CORDEIRO, M. S., KUNKEL, J.
G. & HEPLER, P. K. 2001. Cellular oscillations and the regulation of growth: the pollen tube paradigm. Bioessays, 23, 86-94.
FELDMANN, K. A., COURY, D. A. & CHRISTIANSON, M. L. 1997. Exceptional segregation of a selectable marker (KanR) in Arabidopsis identifies genes important for gametophytic growth and development. Genetics, 147, 1411-1422.
FILONOVA, L. H., BOZHKOV, P. V., BRUKHIN, V. B., DANIEL, G., ZHIVOTOVSKY, B. & VON ARNOLD, S. 2000. Two waves of programmed cell death occur during

250
formation and development of somatic embryos in the gymnosperm, Norway spruce. Journal of Cell Science, 113 Pt 24, 4399-411.
FINNEGAN, J. A. M., D. 2004. Transgene inactivation – plants fight back. Nature Biotechnology, 12, 883-888.
FISHER, K. & TURNER, S. 2007. PXY, a receptor-like kinase essential for maintaining polarity during plant vascular-tissue development. Curr Biol, 17, 1061-6.
FLETCHER, J. C., BRAND, U., RUNNING, M. P., SIMON, R. & MEYEROWITZ, E. M. 1999. Signaling of cell fate decisions by CLAVATA3 in Arabidopsis shoot meristems. Science, 283, 1911-4.
FLETCHER, J. C. & MEYEROWITZ, E. M. 2000. Cell signaling within the shoot meristem. Curr Opin Plant Biol, 3, 23-30.
FOOTE, H. C., RIDE, J. P., FRANKLIN-TONG, V. E., WALKER, E. A., LAWRENCE, M. J. & FRANKLIN, F. C. 1994. Cloning and expression of a distinctive class of self-incompatibility (S) gene from Papaver rhoeas L. Proc Natl Acad Sci USA, 91, 2265-9.
FRANKLIN-TONG, V. E., DROBAK, B. K., ALLAN, A. C., WATKINS, P. & TREWAVAS, A. J. 1996. Growth of pollen tubes of Papaver rhoeas is regulated by a slow-moving calcium wave propagated by inositol 1,4,5-trisphosphate. Plant Cell, 8, 1305-1321.
FRANKLIN-TONG, V. E., HACKETT, G. & HEPLER, P. K. 1997. Ratio-imaging of Ca2+ in the self-incompatibility response in pollen tubes of Papaver rhoeas. Plant Journal, 12, 1375-1386.
FRANKLIN-TONG, V. E., HOLDAWAY-CLARKE, T. L., STRAATMAN, K. R., KUNKEL, J. G. & HEPLER, P. K. 2002. Involvement of extracellular calcium influx in the self-incompatibility response of Papaver rhoeas. Plant J, 29, 333-45.
FRANKLIN-TONG, V. E., RIDE, J. P. & FRANKLIN, F. C. H. 1995. Recombinant stigmatic self-incompatibility (S-) protein elicits Ca2+ transient in pollen of Papaver rhoeas. The Plant Journal, 9, 299-307.
FRANKLIN-TONG, V. E., RIDE, J. P., READ, N. D., TREWAVAS, A. J. & FRANKLIN, F. C. H. 1993. The self-incompatibility response in Papaver rhoeas is mediated by cytosolic free calcium. The Plant Journal, 4, 163-177.
FU, Y. 2010. The actin cytoskeleton and signaling network during pollen tube tip growth. Journal of Integrative Plant Biology, 52, 131-7.
FU, Y., WU, G. & YANG, Z. 2001. Rop GTPase-dependent dynamics of tip-localized F-actin controls tip growth in pollen tubes. J Cell Biol, 152, 1019-1032.
GEITMANN, A. 2010. How to shape a cylinder: pollen tube as a model system for the generation of complex cellular geometry. Sex Plant Reprod, 23, 63-71.
GEITMANN, A., FRANKLIN-TONG, V. E. & EMONS, A. C. 2004. The self-incompatibility response in Papaver rhoeas pollen causes early and striking alterations to organelles. Cell Death Differ, 11, 812-22.
GEITMANN, A., SNOWMAN, B. N., EMONS, A. M. & FRANKLIN-TONG, V. E. 2000. Alterations in the actin cytoskeleton of pollen tubes are induced by the self-incompatibility reaction in Papaver rhoeas. Plant Cell, 12, 1239-51.
GIFFORD, J. L., WALSH, M. P. & VOGEL, H. J. 2007. Structures and metal-ion-binding properties of the Ca2+-binding helix-loop-helix EF-hand motifs. Biochem J, 405, 199-221.
251
GIFFORD, M. L., ROBERTSON, F. C., D.C., S. & INGRAM, G. C. 2005. ARABIDOPSIS CRINKLY4 Function, Internalization, and Turnover Are Dependent on the Extracellular Crinkly Repeat Domain. Plant Cell, 17, 1154-1166.
GLICKMAN, M. 2000. Getting in and out of the proteasome. Seminars in Cell and Developmental Biology, 11, 149-158.
GÖHRE, V., SPALLEK, T., HÄWEKER, H., MERSMANN, S., MENTZEL, T., BOLLER, T., DE TORRES, M., MANSFIELD, J. W. & ROBATZEK, S. 2008. Plant pattern-recognition receptor FLS2 is directed for degradation by the bacterial ubiquitin ligase AvrPtoB. Curr Biol, 18, 1824-32.
GOLDMAN, M. H., GOLDBERG, R. B. & MARIANI, C. 1994. Female sterile tobacco plants are produced by stigma-specific cell ablation. EMBO J, 13, 2976-84.
GOLDRAIJ, A., KONDO, K., LEE, C. B., HANCOCK, C. N., SIVAGURU, M., VAZQUEZ-SANTANA, S., KIM, S., PHILLIPS, T. E., CRUZ-GARCIA, F. & MCCLURE, B. 2006. Compartmentalization of S-RNase and HT-B degradation in self-incompatible Nicotiana. Nature, 439, 805-10.
GÓMEZ-GÓMEZ, L. & BOLLER, T. 2000. FLS2: An LRR Receptor-like Kinase Involved in the Perception of the Bacterial Elicitor Flagellin in Arabidopsis. Molecular cell, 5, 1003-1011.
GRILL, E. & CHRISTMANN, A. 2007. Botany. A plant receptor with a big family. Science, 315, 1676-7.
GROBE, K., BECKER, W. M., SCHLAAK, M. & PETERSEN, A. 1999. Grass group I allergens (beta expansins) are novel, papain-related proteinases. European Journal of Biochemistry, 263, 33-40.
GROLL, M., SCHELLENBERG, B., BACHMANN, A. S., ARCHER, C. R., HUBER, R., POWELL, T. K., LINDOW, S., KAISER, M. & DUDLER, R. 2008. A plant pathogen virulence factor inhibits the eukaryotic proteasome by a novel mechanism. Nature, 452, 755-8.
GROSS, P. & AP REES, T. 1986. Alkaline inorganic pyrophosphatase and starch synthesis in amyloplasts. Planta, 167, 140-145.
GROVE, M. D., SPENCER, G. F., ROHWEDDER, W. K., MANDAVA, N., WORLEY, J. F., WARTHEN, J. D., STEFFENS, G. L., FLIPPEN-ANDERSON, J. L. & COOK, J. C. 1979. Brassinolide, a plant growth-promoting steroid isolated from Brassica napus pollen. Nature, 281, 216-217.
GU, C., KOLODZIEJEK, I., MISAS-VILLAMIL, J., SHINDO, T., COLBY, T., VERDOES, M., RICHAU, K. H., SCHMIDT, J., OVERKLEEFT, H. S. & VAN DER HOORN, R. A. L. 2010. Proteasome activity profiling: a simple, robust and versatile method revealing subunit-selective inhibitors and cytoplasmic, defense-induced proteasome activities. The Plant journal : for cell and molecular biology, 62, 160-70.
GUNAWARDENA, A. H. L. A. N., GREENWOOD, J. S. & DENGLER, N. G. 2004. Programmed cell death remodels lace plant leaf shape during development. Plant Cell, 16, 60-73.
HACKAUF, B. & WEHLING, P. 2005. Approaching the self-incompatibility locus Z in rye (Secale cereale L.) via comparative genetics. Theor Appl Genet, 110, 832-45.
HADJIOSIF, N. E. 2008. Functional characterisation of PrPS, a pollen S locus specific gene that is required for the self-incompatibility reaction in Papaver rhoeas, PhD Thesis, University of Birmingham.

252
HARA, K., KAJITA, R., TORII, K. U., BERGMANN, D. C. & KAKIMOTO, T. 2007. The secretory peptide gene EPF1 enforces the stomatal one-cell-spacing rule. Genes & Development, 21, 1720-5.
HARA, K., YOKOO, T., KAJITA, R., ONISHI, T., YAHATA, S., PETERSON, K. M., TORII, K. U. & KAKIMOTO, T. 2009. Epidermal cell density is autoregulated via a secretory peptide, EPIDERMAL PATTERNING FACTOR 2 in Arabidopsis leaves. Plant Cell Physiol, 50, 1019-31.
HARBORD, R. M., NAPOLI, C. A. & ROBBINS, T. P. 2000. Segregation distortion of T-DNA markers linked to the self-incompatibility (S) locus in Petunia hybrida. Genetics, 154, 1323-1333.
HATSUGAI, N., IWASAKI, S., TAMURA, K., KONDO, M., FUJI, K., OGASAWARA, K., NISHIMURA, M. & HARA-NISHIMURA, I. 2009. A novel membrane fusion-mediated plant immunity against bacterial pathogens. Genes Dev, 23, 2496-506.
HATSUGAI, N., KUROYANAGI, M., YAMADA, K., MESHI, T., TSUDA, S., KONDO, M., NISHIMURA, M. & HARA-NISHIMURA, I. 2004. A plant vacuolar protease, VPE, mediates virus-induced hypersensitive cell death. Science, 305, 855-8.
HE, P., SHAN, L. & SHEEN, J. 2007a. Elicitation and suppression of microbe-associated molecular pattern-triggered immunity in plant-microbe interactions. Cell Microbiology, 9, 1385-1396.
HE, R., DRURY, G. E., ROTARI, V. I., GORDON, A., WILLER, M., TABASUM, F., WOLTERING, E. J. & GALLOIS, P. 2007b. Metacaspase-8 modulates programmed cell death induced by UV and H2O2 in Arabidopsis. Journal of Biological Chemistry, 283, 774-783.
HE, X. & KERMODE, A. R. 2003. Proteases associated with programmed cell death of megagametophyte cells after germination of white spruce (Picea glauca) seeds. Plant Mol. Biol., 52, 729-744.
HEARN, M. J., FRANKLIN, F. C. H. & RIDE, J. P. 1996. Identification of a membrane glycoprotein in pollen of Papaver rhoeas which binds stigmatic self incompatibility (S ) proteins. The Plant Journal, 9, 467-475.
HEPLER, P. K., VIDALI, L. & CHEUNG, A. Y. 2001. Polarized cell growth in higher plants. Annu Rev Cell Dev Biol, 17, 159-87.
HERSHKO, A. & CIECHANOVER, A. 1998. The ubiquitin system. Annu Rev Biochem, 67, 425-79.
HESLOP-HARRISON, J. 1975. Incompatibility and the pollen-stigma interaction. Ann. Rev. Plant Physiol, 26, 403-425.
HIGASHIYAMA, T. 2002. The synergid cell: attractor and acceptor of the pollen tube for double fertilization. J Plant Res, 115, 149-60.
HIGASHIYAMA, T. 2010. Peptide Signaling in Pollen-Pistil Interactions. Plant and Cell Physiology, 51, 177-189.
HIRAKAWA, Y., SHINOHARA, H., KONDO, Y., INOUE, A., NAKANOMYO, I., OGAWA, M., SAWA, S., OHASHI-ITO, K., MATSUBAYASHI, Y. & FUKUDA, H. 2008. Non-cell-autonomous control of vascular stem cell fate by a CLE peptide/receptor system. Proc Natl Acad Sci USA, 105, 15208-13.
HIROKAWA, T., BOON-CHIENG, S. & MITAKU, S. 1998. SOSUI: classification and secondary structure prediction system for membrane proteins. Bioinformatics, 14, 378-9.
HISCOCK, S. & KÜES, U. 1999. Cellular and molecular mechanisms of sexual incompatibility in plants and fungi. International review of cytology, 193, 165-295.

253
HISCOCK, S. J. & ALLEN, A. M. 2008. Diverse cell signalling pathways regulate pollen stigma interactions: the search for consensus. New Phytologist, 179, 286-317.
HOFIUS, D., SCHULTZ-LARSEN, T., JOENSEN, J., TSITSIGIANNIS, D. I., PETERSEN, N. H. T., MATTSSON, O., JORGENSEN, L. B., JONES, J. D. G., MUNDY, J. & PETERSEN, M. 2009. Autophagic components contribute to hypersensitive cell death in Arabidopsis. Cell, 137, 773-783.
HOFMANN, K. & STOFFEL, W. 1993. TMbase - A database of membrane spanning proteins segments. Biol. Chem. Hoppe-Seyler, 374, 166.
HOLDAWAY-CLARKE, T. L., FEIJÓ, J. A., HACKETT, G. R., KUNKEL, J. G. & HEPLER, P. K. 1997. Pollen tube growth and the intracellular cytosolic calcium gradient oscillate in phase while extracellular calcium influx is delayed. Plant Cell, 9, 1999-2010.
HOWDEN, R., PARK, S. K., MOORE, J. M., ORME, J., GROSSNIKLAUS, U. & TWELL, D. 1998. Selection of T-DNA-tagged male and female gametophytic mutants by segregation distortion in Arabidopsis. Genetics, 149, 621-31.
HU, T. T., PATTYN, P., BAKKER, E. G., CAO, J., CHENG, J.-F., CLARK, R. M., FAHLGREN, N., FAWCETT, J. A., GRIMWOOD, J., GUNDLACH, H., HABERER, G., HOLLISTER, J. D., OSSOWSKI, S., OTTILAR, R. P., SALAMOV, A. A., SCHNEEBERGER, K., SPANNAGL, M., WANG, X., YANG, L., NASRALLAH, M. E., BERGELSON, J., CARRINGTON, J. C., GAUT, B. S., SCHMUTZ, J., MAYER, K. F. X., VAN DE PEER, Y., GRIGORIEV, I. V., NORDBORG, M., WEIGEL, D. & GUO, Y.-L. 2011. The Arabidopsis lyrata genome sequence and the basis of rapid genome size change. Nat Genet, 43, 476-81.
HUA, Z. & KAO, T.-H. 2006. Identification and characterization of components of a putative Petunia S-locus F-box-containing E3 ligase complex involved in S-RNase-based self-incompatibility. Plant Cell, 18, 2531-53.
HUA, Z.-H., FIELDS, A. & KAO, T.-H. 2008. Biochemical models for S-RNase-based self-incompatibility. Mol Plant, 1, 575-85.
HUANG, J., ZHAO, L., YANG, Q. & XUE, Y. 2006. AhSSK1, a novel SKP1-like protein that interacts with the S-locus F-box protein SLF. Plant J, 46, 780-93.
HUGOT, K., PONCHET, M., MARAIS, A., RICCI, P. & GALIANA, E. 2002. A tobacco S-like RNase inhibits hyphal elongation of plant pathogens. Mol Plant Microbe Interact, 15, 243-50.
HULL, R. A. C., S.N. 1983. Replication of cauliflower mosaic virus DNA. Sci. Prog. Oxf., 68, 403-422.
HUNT, L. & GRAY, J. E. 2009. The signaling peptide EPF2 controls asymmetric cell divisions during stomatal development. Curr Biol, 19, 864-9.
HUSSEY, P. J., KETELAAR, T. & DEEKS, M. J. 2006. Control of the actin cytoskeleton in plant cell growth. Annual Review in Plant Biology, 57, 109-125.
IKEDA, S., NASRALLAH, J. B., DIXIT, R., PREISS, S. & NASRALLAH, M. E. 1997. An aquaporin-like gene required for the Brassica self-incompatibility response. Science, 276, 1564-1566.
INITIATIVE, A. G. 2000. Analysis of the genome sequence of the flowering plant Arabidopsis thaliana. Nature, 408, 796-815.
ITO, Y., NAKANOMYO, I., MOTOSE, H., IWAMOTO, K., SAWA, S., DOHMAE, N. & FUKUDA, H. 2006. Dodeca-CLE peptides as suppressors of plant stem cell differentiation. Science, 313, 842-5.

254
IVANOV, R., FOBIS-LOISY, I. & GAUDE, T. 2010. When no means no: guide to Brassicaceae self-incompatibility. Trends in Plant Science.
IVANOV, R. & GAUDE, T. 2009. Brassica self-incompatibility: a glimpse below the surface. Plant Signal Behav, 4, 996-8.
IWANO, M., ENTANI, T., SHIBA, H., KAKITA, M., NAGAI, T., MIZUNO, H., MIYAWAKI, A., SHOJI, T., KUBO, K., ISOGAI, A. & TAKAYAMA, S. 2009. Fine-Tuning of the Cytoplasmic Ca2+ Concentration Is Essential for Pollen Tube Growth. Plant Physiol, 150, 1322-1334.
IWANO, M., SHIBA, H., MATOBA, K., MIWA, T., FUNATO, M., ENTANI, T., NAKAYAMA, P., SHIMOSATO, H., TAKAOKA, A., ISOGAI, A. & TAKAYAMA, S. 2007. Actin Dynamics in Papilla Cells of Brassica rapa during Self- and Cross-Pollination. Plant Physiol, 144, 72-81.
IYER, K., BÜRKLE, L., AUERBACH, D., THAMINY, S., DINKEL, M., ENGELS, K. & STAGLJAR, I. 2005. Utilizing the Split-Ubiquitin Membrane Yeast Two-Hybrid System to Identify Protein-Protein Interactions of Integral Membrane Proteins Science, 2005, pl3.
JACKSON, P., ELDRIDGE, A., FREED, E., FURSTENTHAL, L., HSU, J. Y., K, K. B. & REIMANN, J. D. 2000. The lore of the RINGs: substrate recognition and catalysis by ubiquitin ligases. Trends in cell biology, 10, 429-439.
JAILLAIS, Y., HOTHORN, M., BELKHADIR, Y., DABI, T., NIMCHUK, Z. L., MEYEROWITZ, E. M. & CHORY, J. 2011. Tyrosine phosphorylation controls brassinosteroid receptor activation by triggering membrane release of its kinase inhibitor. Genes & Development, 25, 232-7.
JEONG, S., TROTOCHAUD, A. E. & CLARK, S. E. 1999. The Arabidopsis CLAVATA2 gene encodes a receptor-like protein required for the stability of the CLAVATA1 receptor-like kinase. Plant Cell, 11, 1925-34.
JIA, G., LIU, X., OWEN, H. A. & ZHAO, D. 2008. Signaling of cell fate determination by the TPD1 small protein and EMS1 receptor kinase. PNAS, 105, 2220-2225.
JIA, Y., MCADAMS, S. A., BRYAN, G. T., HERSHEY, H. P. & VALENT, B. 2000. Direct interaction of resistance gene and avirulence gene products confers rice blast resistance. The EMBO Journal, 19, 4004-14.
JOHNSON-BROUSSEAU, S. A. & MCCORMICK, S. 2004. A compendium of methods useful for characterizing Arabidopsis pollen mutants and gametophytically-expressed genes. Plant J, 39, 761-75.
JONES, A. M. & ASSMANN, S. M. 2004. Plants: the latest model system for G-protein research. EMBO Rep, 5, 572-8.
JONES, J. D. G. & DANGL, J. L. 2006. The plant immune system. Nature, 444, 323-329. JORDAN, N. D., FRANKLIN, F. C. & FRANKLIN-TONG, V. E. 2000. Evidence for DNA
fragmentation triggered in the self-incompatibility response in pollen of Papaver rhoeas. Plant J, 23, 471-9.
JORDAN, N. D., KAKEDA, K., CONNER, A., RIDE, J. P., FRANKLIN-TONG, V. E. & FRANKLIN, F. C. 1999. S-protein mutants indicate a functional role for SBP in the self-incompatibility reaction of Papaver rhoeas. Plant J, 20, 119-25.
JORGENSEN, R. A., CLUSTER, P. D., ENGLISH, J., QUE, Q. & NAPOLI, C. A. 1996. Chalcone synthase cosuppression phenotypes in Petunia flowers: comparison of sense vs. antisense constructs and single-copy vs. complex T-DNA sequences. Plant Mol. Biol., 31, 957-973.

255
JUÁREZ-DÍAZ, J. A., MCCLURE, B., VÁZQUEZ-SANTANA, S., GUEVARA-GARCÍA, A., LEÓN-MEJÍA, P., MÁRQUEZ-GUZMÁN, J. & CRUZ-GARCÍA, F. 2006. A novel thioredoxin h is secreted in Nicotiana alata and reduces S-RNase in vitro. J Biol Chem, 281, 3418-24.
JURETIĆ, D., ZORANIĆ, L. & ZUCIĆ, D. 2002. Basic charge clusters and predictions of membrane protein topology. J Chem Inf Comput Sci, 42, 620-32.
KACHROO, A., SCHOPFER, C. R., NASRALLAH, M. E. & NASRALLAH, J. B. 2001. Allele-specific receptor-ligand interactions in Brassica self-incompatibility. Science, 293, 1824-6.
KAKEDA, K., JORDAN, N. D., CONNER, A., RIDE, J. P., FRANKLIN-TONG, V. E. & FRANKLIN, F. C. 1998. Identification of residues in a hydrophilic loop of the Papaver rhoeas S protein that play a crucial role in recognition of incompatible pollen. Plant Cell, 10, 1723-32.
KÄLL, L., KROGH, A. & SONNHAMMER, E. L. L. 2004. A combined transmembrane topology and signal peptide prediction method. J Mol Biol, 338, 1027-36.
KAO, T.-H. & TSUKAMOTO, T. 2004. The molecular and genetic bases of S-RNase-based self-incompatibility. Plant Cell, 16 Suppl, S72-S83.
KATSIR, L., SCHILMILLER, A. L., STASWICK, P. E., HE, S. Y. & HOWE, G. A. 2008. COI1 is a critical component of a receptor for jasmonate and the bacterial virulence factor coronatine. Proc Natl Acad Sci USA, 105, 7100-5.
KAUR, J. & BACHHAWAT, A. K. 2009. A modified Western blot protocol for enhanced sensitivity in the detection of a membrane protein. Analytical Biochemistry, 384, 348-9.
KEMP, B. P. & DOUGHTY, J. 2007. S cysteine-rich (SCR) binding domain analysis of the Brassica self-incompatibility S-locus receptor kinase. New Phytologist, 175, 619-629.
KEPINSKI, S. & LEYSER, O. 2005. The Arabidopsis F-box protein TIR1 is an auxin receptor. Nature, 435, 446-51.
KIM, H. S., JUNG, M. S., LEE, K., KIM, K. E., YOO, J. H., KIM, M. C., KIM, D. H., CHO, M. J. & CHUNG, W. S. 2009. An S-locus receptor-like kinase in plasma membrane interacts with calmodulin in Arabidopsis. FEBS Lett, 583, 36-42.
KIM, M., AHN, J.-W., JIN, U.-H., CHOI, D., PAEK, K.-H. & PAI, H.-S. 2003. Activation of the Programmed Cell Death Pathway by Inhibition of Proteasome Function in Plants. Journal of Biological Chemistry, 278, 19406-19415.
KIM, S. T., ZHANG, K., DONG, J. & LORD, E. M. 2006. Exogenous free ubiquitin enhances lily pollen tube adhesion to an in vitro stylar matrix and may facilitate endocytosis of SCA. Plant Physiol, 142, 1397-411.
KINOSHITA, T., CAÑO-DELGADO, A., SETO, H., HIRANUMA, S., FUJIOKA, S., YOSHIDA, S. & CHORY, J. 2005. Binding of brassinosteroids to the extracellular domain of plant receptor kinase BRI1. Nature, 433, 167-71.
KISSELEV, A. F., GARCIA-CALVO, M., OVERKLEEFT, H. S., PETERSON, E., PENNINGTON, M. W., PLOEGH, H. L., THORNBERRY, N. A. & GOLDBERG, A. L. 2003. The caspase-like sites of proteasomes, their substrate specificity, new inhibitors and substrates, and allosteric interactions with the trypsin-like sites. J Biol Chem, 278, 35869-77.
KISSELEV, A. F. & GOLDBERG, A. L. 2001. Proteasome inhibitors: from research tools to drug candidates. Chem Biol, 8, 739-58.

256
KITASHIBA, H., LIU, P., NISHIO, T., NASRALLAH, J. B. & NASRALLAH, M. E. 2011. Functional test of Brassica self-incompatibility modifiers in Arabidopsis thaliana. Proceedings of the National Academy of Sciences, 108, 18173-18178.
KLAAS, M., YANG, B., BOSCH, M., THOROGOOD, D., MANZANARES, C., ARMSTEAD, I. P., FRANKLIN, F. C. H. & BARTH, S. 2011. Progress towards elucidating the mechanisms of self-incompatibility in the grasses: further insights from studies in Lolium. Annals of Botany, 108, 677-85.
KOLODZIEJEK, I., MISAS-VILLAMIL, J. C., KASCHANI, F., CLERC, J., GU, C., KRAHN, D., NIESSEN, S., VERDOES, M., WILLEMS, L. I., OVERKLEEFT, H. S., KAISER, M. & VAN DER HOORN, R. A. L. 2011. Proteasome activity imaging and profiling characterizes bacterial effector syringolin A. Plant Physiol, 155, 477-89.
KOMANDER, D. 2009. The emerging complexity of protein ubiquitination. Biochem Soc Trans, 37, 937-53.
KORTHOUT, H. A., BERECKI, G., BRUIN, W., VAN DUIJN, B. & WANG, M. 2000. The presence and subcellular localization of caspase 3-like proteinases in plant cells. FEBS Letters, 475, 139-144.
KROEMER, G., GALLUZZI, L., VANDENABEELE, P., ABRAMS, J., ALNEMRI, E. S., BAEHRECKE, E. H., BLAGOSKLONNY, M. V., EL-DEIRY, W. S., GOLSTEIN, P., GREEN, D. R., HENGARTNER, M., KNIGHT, R. A., KUMAR, S., LIPTON, S. A., MALORNI, W., NUÑEZ, G., PETER, M. E., TSCHOPP, J., YUAN, J., PIACENTINI, M., ZHIVOTOVSKY, B., MELINO, G. & 2009, N. C. O. C. D. 2009. Classification of cell death: recommendations of the Nomenclature Committee on Cell Death 2009. Cell Death and Differentiation, 16, 3-11.
KROGH, A., LARSSON, B., VON HEIJNE, G. & SONNHAMMER, E. L. 2001. Predicting transmembrane protein topology with a hidden Markov model: application to complete genomes. Journal of Molecular Biology, 305, 567-580.
KROJ, T., RUDD, J., NÜRNBERGER, T., GÄBLER, Y., LEE, J. & SCHEEL, D. 2003. Mitogen-activated protein kinases play an essential role in oxidative burst-independent expression of pathogenesis-related genes in parsley. Journal of Biological Chemistry, 278, 2256-2264.
KUBO, K., ENTANI, T., TAKARA, A., WANG, N., FIELDS, A. M., HUA, Z. H., TOYODA, M., KAWASHIMA, S., ANDO, T., ISOGAI, A., KAO, T. & TAKAYAMA, S. 2010. Collaborative Non-Self Recognition System in S-RNase-Based Self-Incompatibility. Science, 330, 796-799.
KUREPA, J. & SMALLE, J. A. 2008. Structure, function and regulation of plant proteasomes. Biochimie, 90, 324-35.
KUROYANAGI, M., YAMADA, K., HATSUGAI, N., KONDO, M., NISHIMURA, M. & HARA-NISHIMURA, I. 2005. Vacuolar processing enzyme is essential for mycotoxin-induced cell death in Arabidopsis thaliana. J Biol Chem, 280, 32914-20.
KURUP, S., RIDE, J. P., JORDAN, N. D., FLETCHER, G., FRANKLIN-TONG, V. E. & FRANKLIN, F. C. H. 1998. Identification and cloning of related self-incompatibility S-genes in Papaver rhoas and Papaver nudicaule. Sexual Plant Reproduction, 11, 192-198.
LAI, Z., MA, W. S., HAN, B., LIANG, L. Z., ZHANG, Y. S., F, H. G. & XUE, Y. B. 2002. An F-box gene linked to the self-incompatibility (S) locus of Antirrhinum is expressed specifically in pollen and tapetum. Plant Molecular Biology, 50, 29-42.

257
LEE, D. H. & GOLDBERG, A. L. 1998. Proteasome inhibitors: valuable new tools for cell biologists. Trends Cell Biol, 8, 397-403.
LEE, H. S., HUANG, S. & KAO, T. 1994. S proteins control rejection of incompatible pollen in Petunia inflata. Nature, 367, 560-3.
LI, S., SAMAJ, J. & FRANKLIN-TONG, V. E. 2007. A Mitogen-Activated Protein Kinase Signals to Programmed Cell Death Induced by Self-Incompatibility in Papaver Pollen. Plant Physiol, 145, 236-245.
LIGTERINK, W., KROJ, T., NIEDEN, U., HIRT, H. & SCHEEL, D. 1997. Receptor-mediated activation of a MAP kinase in pathogen defense of plants. Science, 276, 2054-2057.
LIMANTON-GREVET, A. & JULLIEN, M. 2001. Agrobacterium-mediated transformation of Asparagus officinalis- molecular and genetic analysis of transgenic plants. Molecular Breeding, 141-150.
LINCOLN, J. E., RICHAEL, C., OVERDUIN, B., SMITH, K., BOSTOCK, R. & GILCHRIST, D. G. 2002. Expression of the antiapoptotic baculovirus p35 gene in tomato blocks programmed cell death and provides broad-spectrum resistance to disease. PNAS, 99, 15217-15221.
LIU, B., MORSE, D. & CAPPADOCIA, M. 2009. Compatible Pollinations in Solanum chacoense Decrease Both S-RNase and S-RNase mRNA. PLoS One, 4, 5774.
LIU, C., APODACA, J., DAVIS, L. & RAO, H. 2007a. Proteasome inhibition in wild-type yeast Saccharomyces cerevisiae cells. Biotech., 42, 158-162.
LIU, X., YUE, Y., LI, B., NIE, Y., LI, W., WU, W.-H. & MA, L. 2007b. A G protein-coupled receptor is a plasma membrane receptor for the plant hormone abscisic acid. Science, 315, 1712-6.
LIU, Z.-Q., XU, G.-H. & ZHANG, S.-L. 2007c. Pyrus pyrifolia stylar S-RNase induces alterations in the actin cytoskeleton in self-pollen and tubes in vitro. Protoplasma, 232, 61-7.
LOCKSHIN, R. A. & ZAKERI, Z. 2004. John Wiley & Sons. LORD, E. M. & RUSSELL, S. D. 2002. The mechanisms of pollination and fertilization in
plants. Annu Rev Cell Dev Biol, 18, 81-105. LUIK, R. M., WANG, B., PRAKRIYA, M., WU, M. M. & LEWIS, R. S. 2008.
Oligomerization of STIM1 couples ER calcium depletion to CRAC channel activation. Nature, 454, 538-42.
MA, W. & BERKOWITZ, G. A. 2007. The grateful dead: calcium and cell death in plant innate immunity. Cell Microbiol, 9, 2571-2585.
MALHÓ, R. 2006. The pollen tube: a model system for cell and molecular biology studies. MALHÓ, R., READ, N. D., PAIS, M. S. & TREWAVAS, A. J. 1994. Role of cytosolic free
calcium in the reorientation of pollen tube growth. The Plant Journal, 5, 331-341. MALHO, R. & TREWAVAS, A. J. 1996. Localized apical increases of cytosolic free
calcium control pollen tube orientation. The Plant Cell, 8, 1935-1949. MÁRTON, M. L., CORDTS, S., BROADHVEST, J. & DRESSELHAUS, T. 2005.
Micropylar pollen tube guidance by egg apparatus 1 of maize. Science, 307, 573-576. MATSUBAYASHI, Y. 2003. Ligand-receptor pairs in plant peptide signaling. J Cell Sci,
116, 3863-70. MATSUBAYASHI, Y. & SAKAGAMI, Y. 2006. Peptide hormones in plants. Annual
review of plant biology, 57, 649-74.

258
MATTON, D. P., MAES, O., LAUBLIN, G., XIKE, Q., BERTRAND, C., MORSE, D. & CAPPADOCIA, M. 1997. Hypervariable domains of self-incompatibility RNases mediate allele-specific pollen recognition. Plant Cell, 9, 1757-1766.
MATZKE, A. J. & MATZKE, M. A. 1998. Position effects and epigenetic silencing of plant transgenes. Curr Opin Plant Biol, 1, 142-8.
MAYFIELD, J. A. & PREUSS, D. 2000. Rapid initiation of Arabidopsis pollination requires the oleosin-domain protein GRP17. Nature cell biology, 2, 128-130.
MCCLAIN, M. S., IWAMOTO, H., CAO, P., VINION-DUBIEL, A. D., LI, Y., SZABO, G., SHAO, Z. & COVER, T. L. 2003. Essential Role of a GXXXG Motif for Membrane Channel Formation by Helicobacter pylori Vacuolating Toxin. Journal of Biological Chemistry, 278, 12101-12108.
MCCLURE, B. 2006. New views of S-RNase-based self-incompatibility. Curr Opin Plant Biol, 9, 639-46.
MCCLURE, B. 2009. Darwin's foundation for investigating self-incompatibility and the progress toward a physiological model for S-RNase-based SI. Journal of Experimental Botany, 60, 1069-1081.
MCCLURE, B., CRUZ-GARCÍA, F. & ROMERO, C. 2011. Compatibility and incompatibility in S-RNase-based systems. Annals of Botany, 108, 647-58.
MCCLURE, B. A. & FRANKLIN-TONG, V. E. 2006. Gametophytic self-incompatibility: understanding the cellular mechanisms involved in "self" pollen tube inhibition. Planta, 224, 233-45.
MCCLURE, B. A., HARING, V., EBERT, P. R., ANDERSON, M. A. & SIMPSON, R. J. 1989. Style self-incompatibility gene products of Nicotiana alata are ribonucleases. Nature, 342, 955-957.
MCCLURE, B. A., MOU, B., CANEVASCINI, S. & BERNATZKY, R. 1999. A small asparagine-rich protein required for S-allele-specific pollen rejection in Nicotiana. Proc Natl Acad Sci USA, 96, 13548-13553.
MENG, X., SUN, P. & KAO, T.-H. 2011. S-RNase-based self-incompatibility in Petunia inflata. Annals of Botany, 108, 637-46.
MICHARD, E., ALVES, F. & FEIJO, J. A. 2009. The role of ion fluxes in polarized cell growth and morphogenesis: the pollen tube as an experimental paradigm. International Journal of Developmental Biology, 53, 1609-1622.
MITTLER, R., VANDERAUWERA, S., GOLLERY, M. & VAN BREUSEGEM, F. 2004. Reactive oxygen gene network of plants. Trends Plant Sci, 9, 490-8.
MLEJNEK, P. & PROCHAZKA, S. 2002. Activation of caspase-like proteases and induction of apoptosis by isopentenyladenosine tobacco BY-2 cells. Planta, 215, 158-166.
MOSCATELLI, A. & IDILLI, A. I. 2009. Pollen tube growth: a delicate equilibrium between secretory and endocytic pathways. Journal of Integrative Plant Biology, 51, 727-39.
MURASE, K., SHIBA, H., IWANO, M., CHE, F.-S., WATANABE, M., ISOGAI, A. & TAKAYAMA, S. 2004. A membrane-anchored protein kinase involved in Brassica self-incompatibility signaling. Science, 303, 1516-9.
MUSKENS, M. W., VISSERS, A. P., MOL, J. N. & KOOTER, J. M. 2000. Role of inverted DNA repeats in transcriptional and post-transcriptional gene silencing. Plant Mol Biol, 43, 243-60.
NAKAUNE, S., YAMADA, K., KONDO, M., KATO, T., TABATA, S., NISHIMURA, M. & HARA-NISHIMURA, I. 2005. A vacuolar processing enzyme, δVPE, is involved

259
in seed coat formation at the early stage of seed development. The Plant Cell 17, 876-887.
NASRALLAH, J. B. 2002. Recognition and rejection of self in plant reproduction. Science, 296, 305-8.
NASRALLAH, J. B. 2005. Recognition and rejection of self in plant self-incompatibility: comparisons to animal histocompatibility. Trends Immunol, 26, 412-8.
NASRALLAH, J. B., LIU, P., SHERMAN-BROYLES, S., SCHMIDT, R. & NASRALLAH, M. E. 2007. Epigenetic mechanisms for breakdown of self-incompatibility in interspecific hybrids. Genetics, 175, 1965-1973.
NASRALLAH, M. E., LIU, P. & NASRALLAH, J. B. 2002. Generation of Self-Incompatible Arabidopsis thaliana by Transfer of Two S Locus Genes from A. lyrata. Science, 297, 247-249.
NASRALLAH, M. E., LIU, P., SHERMAN-BROYLES, S., BOGGS, N. A. & NASRALLAH, J. B. 2004. Natural variation in expression of self-incompatibility in Arabidopsis thaliana: implications for the evolution of selfing. Proc Natl Acad Sci USA, 101, 16070-4.
NIMCHUK, Z., EULGEM, T., HOLT , B. F. & DANGL, J. L. 2003. Recognition and response in the plant immune system. Annual Review of Genetics, 37, 579-609.
OBERST, A., BENDER, C. & GREEN, D. R. 2008. Living with death: the evolution of the mitochondrial pathway of apoptosis in animals. Cell Death and Differentiation, 15, 1139-46.
OGAWA, M., SHINOHARA, H., SAKAGAMI, Y. & MATSUBAYASHI, Y. 2008. Arabidopsis CLV3 peptide directly binds CLV1 ectodomain. Science, 319, 294.
OH, M.-H., WANG, X., KOTA, U., GOSHE, M. B., CLOUSE, S. D. & HUBER, S. C. 2009. Tyrosine phosphorylation of the BRI1 receptor kinase emerges as a component of brassinosteroid signaling in Arabidopsis. Proc Natl Acad Sci USA, 106, 658-63.
OH, M.-H., WANG, X., WU, X., ZHAO, Y., CLOUSE, S. D. & HUBER, S. C. 2010. Autophosphorylation of Tyr-610 in the receptor kinase BAK1 plays a role in brassinosteroid signaling and basal defense gene expression. Proc Natl Acad Sci USA, 107, 17827-32.
OHASHI-ITO, K., ODA, Y. & FUKUDA, H. 2010. Arabidopsis VASCULAR-RELATED NAC-DOMAIN6 directly regulates the genes that govern programmed cell death and secondary wall formation during xylem differentiation. Plant Cell, 22, 3461-73.
OKUDA, S., TSUTSUI, H., SHIINA, K., SPRUNCK, S., TAKEUCHI, H., YUI, R., KASAHARA, R. D., HAMAMURA, Y., MIZUKAMI, A., SUSAKI, D., KAWANO, N., SAKAKIBARA, T., NAMIKI, S., ITOH, K., OTSUKA, K., MATSUZAKI, M., NOZAKI, H., KUROIWA, T., NAKANO, A., KANAOKA, M. M., DRESSELHAUS, T., SASAKI, N. & HIGASHIYAMA, T. 2009. Defensin-like polypeptide LUREs are pollen tube attractants secreted from synergid cells. Nature, 458, 357-61.
PAGE, D. R. & GROSSNIKLAUS, U. 2002. The art and design of genetic screens: Arabidopsis thaliana. Nat Rev Genet, 3, 124-36.
PALANIVELU, R., BRASS, L., EDLUND, A. F. & PREUSS, D. 2003. Pollen tube growth and guidance is regulated by POP2, an Arabidopsis gene that controls GABA levels. Cell, 114, 47-59.
PARK, S. Y., JAUH, G. Y., MOLLET, J. C., ECKARD, K. & M, L. E. 2000. A lipid transfer–like protein is necessary for lily pollen tube adhesion to an in vitro stylar matrix. The Plant Cell 12, 151-163.

260
PELLETIER, G. & BUDAR, F. 2007. The molecular biology of cytoplasmically inherited male sterility and prospects for its engineering. Curr Opin Biotechnol, 18, 121-5.
PETERSEN, T. N., BRUNAK, S., VON HEIJNE, G. & NIELSEN, H. 2011. SignalP 4.0: discriminating signal peptides from transmembrane regions. Nature Methods, 8, 785-786.
PISZCZEK, E. & WOJCIECH, G. 2007. Caspase-like proteases and their role in programmed cell death in plants. Acta Physiol Plant, 29, 391-398.
POTOCKÝ, M., JONES, M. A., BEZVODA, R., SMIRNOFF, N. & ŽÁRSKÝ, V. 2007. Reactive oxygen species produced by NADPH oxidase are involved in pollen tube growth. New Phytologist, 174, 742-751.
POULTER, N. S., BOSCH, M. & FRANKLIN-TONG, V. E. 2011. Proteins implicated in mediating self-incompatibility-induced alterations to the actin cytoskeleton of Papaver pollen. Annals of botany, 1-17.
POULTER, N. S., STAIGER, C. J., RAPPOPORT, J. Z. & FRANKLIN-TONG, V. E. 2010a. Actin-binding proteins implicated in the formation of the punctate actin foci stimulated by the self-incompatibility response in Papaver. Plant Physiol, 152, 1274-83.
POULTER, N. S., VATOVEC, S. & FRANKLIN-TONG, V. E. 2008. Microtubules are a target for self-incompatibility signaling in Papaver pollen. Plant Physiol, 146, 1358-67.
POULTER, N. S., WHEELER, M. J., BOSCH, M. & FRANKLIN-TONG, V. E. 2010b. Self-incompatibility in Papaver: identification of the pollen S-determinant PrpS. Biochem Soc Trans, 38, 588-92.
PRADO, A. M., COLAÇO, R., MORENO, N., SILVA, A. C. & FEIJÓ, J. A. 2008. Targeting of pollen tubes to ovules is dependent on nitric oxide (NO) signaling. Molecular Plant, 1, 703-714.
PRAKRIYA, M., FESKE, S., GWACK, Y., SRIKANTH, S., RAO, A. & HOGAN, P. G. 2006. Orai1 is an essential pore subunit of the CRAC channel. Nature, 443, 230-3.
QIAO, H., WANG, F., ZHAO, L., ZHOU, J., LAI, Z., ZHANG, Y., ROBBINS, T. P. & XUE, Y. 2004a. The F-box protein AhSLF-S2 controls the pollen function of S-RNAse based self-incompatibility. The Plant Cell, 16, 2307-2322.
QIAO, H., WANG, H., ZHAO, L., ZHOU, J., HUANG, J., ZHANG, Y. & XUE, Y. 2004b. The F-Box protein AhSLF-S2 physically interacts with S-RNases that may be inhibited by the ubiquitin/26S proteasome pathway of protein degradation during compatible pollination in Antirrhinum. The Plant Cell, 16, 582-595.
QIN, Y., LEYDON, A. R., MANZIELLO, A., PANDEY, R., MOUNT, D., DENIC, S., VASIC, B., JOHNSON, M. A. & PALANIVELU, R. 2009. Penetration of the Stigma and Style Elicits a Novel Transcriptome in Pollen Tubes, Pointing to Genes Critical for Growth in a Pistil. PLoS Genet, 5, e1000621.
REA, A. C., LIU, P. & NASRALLAH, J. B. 2010. A transgenic self-incompatible Arabidopsis thaliana model for evolutionary and mechanistic studies of crucifer self-incompatibility. Journal of Experimental Botany, 61, 1897-1906.
REDDY, G. V. & MEYEROWITZ, E. M. 2005. Stem-cell homeostasis and growth dynamics can be uncoupled in the Arabidopsis shoot apex. Science, 310, 663-7.
RIVAS, S., ROUGON-CARDOSO, A., SMOKER, M., SCHAUSER, L., YOSHIOKA, H. & JONES, J. D. G. 2004. CITRX thioredoxin interacts with the tomato Cf-9 resistance protein and negatively regulates defence. The EMBO Journal, 23, 2156-65.
261
ROSEBROCK, T. R., ZENG, L., BRADY, J. J., ABRAMOVITCH, R. B., XIAO, F. & MARTIN, G. B. 2007. A bacterial E3 ubiquitin ligase targets a host protein kinase to disrupt plant immunity. Nature, 448, 370-4.
ROST, B. & LIU, J. 2003. The PredictProtein server. Nucleic Acids Res, 31, 3300-4. RUDD, J. J., FRANKLIN, F., LORD, J. M. & FRANKLIN-TONG, V. E. 1996. Increased
phosphorylation of a 26-kD pollen protein is induced by the self-incompatibility response in Papaver rhoeas. Plant Cell, 8, 713-724.
RUDD, J. J., OSMAN, K., FRANKLIN, F. C. H. & FRANKLIN-TONG, V. E. 2003. Activation of a putative MAP kinase in pollen is stimulated by the self-incompatibility (SI) response. FEBS Lett, 547, 223-7.
RUDOLPH, T. D. Year. Segregation for chlorophyll deficiencies and other phenodeviants in the X1 and the X2 generations of irradiated jack pine. In: Joint Proceedings of the Second Genetics Workshop of the Society of American Foresters and the Seventh Lake States Forest Tree Improvement Conference, May 22 1966. 18-23.
SADANANDOM, A., MESMAR, J., YANG, C., EWAN, R., CARR, C. & O'DONNELL, E. 2008. The cell death regulator AtPUB17 directly interacts with the BTB/ POZ domain transcriptional repressor, AtBTB1 to control disease resistance in plants. Comparative Biochemistry and Physiology, Part A, 1-2.
SAMUEL, M. A., CHONG, Y. T., HAASEN, K. E., ALDEA-BRYDGES, M. G., STONE, S. L. & GORING, D. R. 2009. Cellular pathways regulating responses to compatible and self-incompatible pollen in Brassica and Arabidopsis stigmas intersect at Exo70A1, a putative component of the exocyst complex. Plant Cell, 21, 2655-71.
SAMUEL, M. A., TANG, W., JAMSHED, M., NORTHEY, J., PATEL, D., SMITH, D., SIU, M., MUENCH, D. G., WANG, Z.-Y. & GORING, D. R. 2011. Proteomic analysis of Brassica stigmatic proteins following the self-incompatibility reaction reveals a role for microtubule dynamics during pollen responses. Molecular & cellular proteomics : MCP [Online]. Available: http://www.ncbi.nlm.nih.gov/entrez/query.fcgi?db=pubmed&cmd=Retrieve&dopt=AbstractPlus&list_uids=21890472 [Accessed Sep 1].
SCHEER, J. M. & RYAN, C. A. 2002. The systemin receptor SR160 from Lycopersicon peruvianum is a member of the LRR receptor kinase family. Proc Natl Acad Sci USA, 99, 9585-90.
SCHOOF, H., LENHARD, M., HAECKER, A., MAYER, K. F., JÜRGENS, G. & LAUX, T. 2000. The stem cell population of Arabidopsis shoot meristems in maintained by a regulatory loop between the CLAVATA and WUSCHEL genes. Cell, 100, 635-44.
SCHOPFER, C. R., NASRALLAH, M. E. & NASRALLAH, J. B. 1999. The male determinant of self-incompatibility in Brassica. Science, 286, 1697-700.
SCHWESSINGER, B. & ZIPFEL, C. 2008. News from the frontline: recent insights into PAMP-triggered immunity in plants. Current Opinion in Plant Biology, 11, 389-395.
SCOCCIANTI, V., OVIDI, E., TADDEI, A. R., TIEZZI, A., CRINELLI, R., GENTILLINI, L. & SPERANZA, A. 2003. Involvement of the ubiquitin/proteasome pathway in the organisation and polarised growth of kiwifruit pollen tubes. Sex Plant Reprod, 16, 123-133.
SENES, A., ENGEL, D. E. & DEGRADO, W. F. 2004. Folding of helical membrane proteins: the role of polar, GxxxG-like and proline motifs. Curr Opin Struct Biol, 14, 465-79.
SERRANO, I., IRENE, S., PELLICCIONE, S., SALVATORE, P., OLMEDILLA, A. & ADELA, O. 2010. Programmed-cell-death hallmarks in incompatible pollen and

262
papillar stigma cells of Olea europaea L. under free pollination. Plant Cell Rep, 29, 561-72.
SHEMAROVA, I. V. & NESTEROV, V. P. 2005. Evolution of mechanisms of Calcium signaling: the role of Calcium ions in signal transduction in prokaryotes. Journal of Evolutionary Biochemistry and Physiology, 41, 12-7.
SHENG, X., HU, Z., LU, H., WANG, X., BALUSKA, F., SAMAJ, J. & LIN, J. 2006. Roles of the Ubiquitin/Proteasome Pathway in Pollen Tube Growth with Emphasis on MG132-Induced Alterations in Ultrastructure, Cytoskeleton, and Cell Wall Components. Plant Physiol, 141, 1578-1590.
SHENG, X.-Y., DONG, X.-L., ZHANG, S.-S., JIANG, L.-P., ZHU, J. & WANG, L. 2010. Mitochondrial dynamics and its responds to proteasome defection during Picea wilsonii pollen tube development. Cell Biochem. Funct., 28, 420-5.
SHERMAN-BROYLES, S., BOGGS, N., FARKAS, A., LIU, P., VREBALOV, J., NASRALLAH, M. E. & NASRALLAH, J. B. 2007. S-locus genes and the evolution of self-fertility in Arabidopsis thaliana. Plant Cell, 19, 94-106.
SHI, Y. 2002. Mechanisms of caspase activation and inhibition during apoptosis. Molecular cell, 9, 459-470.
SHIGAKI, T. & BHATTACHARYYA, M. K. 1999. Color coding the cell death status of plant suspension cells. BioTechniques, 26, 1060-2.
SHIMOSATO, H., YOKOTA, N., SHIBA, H., IWANO, M., ENTANI, T., CHE, F.-S., WATANABE, M., ISOGAI, A. & TAKAYAMA, S. 2007. Characterization of the SP11/SCR high-affinity binding site involved in self/nonself recognition in Brassica self-incompatibility. Plant Cell, 19, 107-17.
SHIU, S.-H., KARLOWSKI, W. M., PAN, R., TZENG, Y.-H., MAYER, K. F. X. & LI, W.-H. 2004. Comparative analysis of the receptor-like kinase family in Arabidopsis and rice. Plant Cell, 16, 1220-34.
SHIU, S. H. & BLEECKER, A. B. 2001. Receptor-like kinases from Arabidopsis form a monophyletic gene family related to animal receptor kinases. Proc Natl Acad Sci USA, 98, 10763-8.
SHPAK, E. D., MCABEE, J. M., PILLITTERI, L. J. & TORII, K. U. 2005. Stomatal patterning and differentiation by synergistic interactions of receptor kinases. Science, 309, 290-3.
SIJACIC, P., WANG, X., SKIRPAN, A. L., WANG, Y., DOWD, P. E., MCCUBBIN, A. G., HUANG, S. & KAO, T.-H. 2004. Identification of the pollen determinant of S-RNase-mediated self-incompatibility. Nature, 429, 302-305.
SMALLE, J. & VIERSTRA, R. D. 2004. The ubiquitin 26S proteasome proteolytic pathway. Annual review of plant biology, 55, 555-90.
SMYTH, D. R., BOWMAN, J. L. & MEYEROWITZ, E. M. 1990. Early flower development in Arabidopsis. Plant Cell, 2, 755-67.
SNOWMAN, B. N., GEITMANN, A., CLARKE, S. R., STAIGER, C. J., FRANKLIN, F. C. H., EMONS, A. M. C. & FRANKLIN-TONG, V. E. 2000. Signalling and the Cytoskeleton of Pollen Tubes of Papaver rhoeas. Annals of botany, 85, 49-57.
SNOWMAN, B. N., KOVAR, D. R., SHEVCHENKO, G., FRANKLIN-TONG, V. E. & STAIGER, C. J. 2002. Signal-mediated depolymerization of actin in pollen during the self-incompatibility response. Plant Cell, 14, 2613-26.
SOUTHWICK, A. M. & LONG, S. R. 2002. Heterologous expression to assay for plant lectins or receptors. Plant Molecular Biology Reporter, 20, 27-41.
263
SPARTZ, A. K. & GRAY, W. M. 2008. Plant hormone receptors: new perceptions. Genes & Development, 22, 2139-48.
SPENCER, S. L. & SORGER, P. K. 2011. Measuring and modeling apoptosis in single cells. Cell, 144, 926-39.
SPERANZA, A., SCOCCIANTI, V., CRINELLI, R., CALZONI, G. L. & MAGNANI, M. 2001. Inhibition of proteasome activity strongly affects kiwifruit pollen germination. Involvement of the ubiquitin/proteasome pathway as a major regulator. Plant Physiol, 126, 1150-61.
STAGLJAR, I. & FIELDS, S. 2002. Analysis of membrane protein interactions using yeast-based technologies. Trends Biochem Sci, 27, 559-63.
STAHL, Y. & SIMON, R. 2005. Plant stem cell niches. Int J Dev Biol, 49, 479-89. STAHL, Y., WINK, R. H., INGRAM, G. C. & SIMON, R. 2009. A Signaling Module
Controlling the Stem Cell Niche in Arabidopsis Root Meristems. Current Biology, 19, 909-914.
STEIN, J., HOWLETT, B., BOYES, D., NASRALLAH, M. E. & NASRALLAH, J. B. 1991. Molecular cloning of a putative receptor protein kinase gene encoded at the self-incompatibility locus of Brassica oleracea. PNAS, 88, 8816-8820.
STEIN, J. C., DIXIT, R., NASRALLAH, M. E. & NASRALLAH, J. B. 1996. SRK, the stigma-specific S locus receptor kinase of Brassica, is targeted to the plasma membrane in transgenic tobacco. Plant Cell, 8, 429-445.
STENNICKE, H. R. & SALVESEN, G. S. 2000. Caspases-controlling intracellular signals by protease zymogen activation. Biochemica et Biophysica Acta 1477, 299-306.
STENVIK, G.-E., TANDSTAD, N. M., GUO, Y., SHI, C.-L., KRISTIANSEN, W., HOLMGREN, A., CLARK, S. E., AALEN, R. B. & BUTENKO, M. A. 2008. The EPIP peptide of INFLORESCENCE DEFICIENT IN ABSCISSION is sufficient to induce abscission in arabidopsis through the receptor-like kinases HAESA and HAESA-LIKE2. Plant Cell, 20, 1805-17.
STEWMAN, S. F., JONES-RHOADES, M., BHIMALAPURAM, P., TCHERNOOKOV, M., PREUSS, D. & DINNER, A. R. 2010. Mechanistic insights from a quantitative analysis of pollen tube guidance. Bmc Plant Biology, 10, 32.
STONE, S. L., ANDERSON, E. M., MULLEN, R. T. & GORING, D. R. 2003. ARC1 Is an E3 Ubiquitin Ligase and Promotes the Ubiquitination of Proteins during the Rejection of Self-Incompatible Brassica Pollen. The Plant Cell, 15, 885-898.
STONE, S. L., ARNOLDO, M. & GORING, D. R. 1999. A breakdown of Brassica self-incompatibility in ARC1 antisense transgenic plants. Science, 286, 1729-1731.
STRATFORD, S., BARNES, W., HOHORST, D. L., SAGERT, J. G., COTTER, R., GOLUBIEWSKI, A., SHOWALTER, A. M., MCCORMICK, S. & BEDINGER, P. 2001. A leucine-rich repeat region is conserved in pollen-exensin-like (Pex) proteins in monocots and dicots. Plant Mol. Biol., 46, 43-56.
SUNDSTRÖM, J. F., VACULOVA, A., SMERTENKO, A. P., SAVENKOV, E. I., GOLOVKO, A., MININA, E., TIWARI, B. S., RODRIGUEZ-NIETO, S., ZAMYATNIN, A. A., VALINEVA, T., SAARIKETTU, J., FRILANDER, M. J., SUAREZ, M. F., ZAVIALOV, A., STAHL, U., HUSSEY, P. J., SILVENNIONEN, O., SUNDBERG, E., ZHIVOTOVSKY, B. & BOZHKOV, P. V. 2009. Tudor staphylococcal nuclease is an evolutionarily conserved component of the programmed cell death degradome. Nat Cell Biol, 11, 1347-1354.
SUZUKI, G., KAI, N., HIROSE, T., FUKUI, K., NISHIO, T., TAKAYAMA, S., ISOGAI, A., WATANABE, M. & HINATA, K. 1999. Genomic organization of the S locus:
264
identification and characterization of genes in SLG/SRK region of S9 haplotype of Brassica campestris (syn. rapa). Genetics, 153, 391.
SWANSON, R., EDLUND, A. F. & PREUSS, D. 2004. Species specificity in pollen-pistil interactions. Annu. Rev. Genet., 38, 793-818.
TAKAYAMA, S. & ISOGAI, A. 2005. Self-Incompatibility in Plants. Annu. Rev. Plant Biol., 56, 467-489.
TAKAYAMA, S., SHIBA, H., IWANO, M., SHIMOSATO, H., CHE, F. S., KAI, N., WATANABE, M., SUZUKI, G., HINATA, K. & ISOGAI, A. 2000. The pollen determinant of self-incompatibility in Brassica campestris. Proc Natl Acad Sci USA, 97, 1920-5.
TAKAYAMA, S., SHIMOSATO, H., SHIBA, H., FUNATO, M., CHE, F. S., WATANABE, M., IWANO, M. & ISOGAI, A. 2001. Direct ligand-receptor complex interaction controls Brassica self-incompatibility. Nature, 413, 534-538.
TANG, C. L., TOOMAJIAN, C., SHERMAN-BROYLES, S., PLAGNOL, V., GUO, Y. L., HU, T. T., CLARK, R. M., NASRALLAH, J. B., WEIGEL, D. & NORDBORG, M. 2007. The evolution of selfing in Arabidopsis thaliana. Science, 317, 1070-1072.
TANG, W., KELLEY, D., EZCURRA, I., COTTER, R. & MCCORMICK, S. 2004. LeSTIG1, an extracellular binding partner for the pollen receptor kinase LePRK1 and LePRK2, promotes pollen tube growth in vitro. The Plant Journal, 39, 343-353.
TANTIKANJANA, T., NASRALLAH, M. E. & NASRALLAH, J. B. 2010. Complex networks of self-incompatibility signaling in the Brassicaceae. Current Opinion in Plant Biology, 13, 520-6.
TANTIKANJANA, T., RIZVI, N., NASRALLAH, M. E. & NASRALLAH, J. B. 2009. A dual role for the S-locus receptor kinase in self-incompatibility and pistil development revealed by an Arabidopsis rdr6 mutation. Plant Cell, 21, 2642-54.
THOMAS, S. G. & FRANKLIN-TONG, V. E. 2004. Self-incompatibility triggers programmed cell death in Papaver pollen. Nature, 429, 305-309.
THOMAS, S. G., HUANG, S., LI, S., STAIGER, C. J. & FRANKLIN-TONG, V. E. 2006. Actin depolymerization is sufficient to induce programmed cell death in self-incompatible pollen. J Cell Biol, 174, 221-9.
THORSNESS, M. K., KANDASAMY, M. K., NASRALLAH, M. E. & NASRALLAH, J. B. 1993. Genetic Ablation of Floral Cells in Arabidopsis. Plant Cell, 5, 253-261.
TRUJILLO, M., ICHIMURA, K., CASAIS, C. & SHIRASU, K. 2008. Negative regulation of PAMP-triggered immunity by an E3 ubiquitin ligase triplet in Arabidopsis. Curr Biol, 18, 1396-401.
TRUJILLO, M. & SHIRASU, K. 2010. Ubiquitination in plant immunity. Curr Opin Plant Biol, 13, 402-8.
TSUCHIMATSU, T., SUWABE, K., SHIMIZU-INATSUGI, R., ISOKAWA, S., PAVLIDIS, P., STÄDLER, T., SUZUKI, G., TAKAYAMA, S., WATANABE, M. & SHIMIZU, K. K. 2010. Evolution of self-compatibility in Arabidopsis by a mutation in the male specificity gene.
Nature, 464, 1342-1346. TUSNÁDY, G. E. & SIMON, I. 2001. The HMMTOP transmembrane topology prediction
server. Bioinformatics, 17, 849-50. UEGUCHI-TANAKA, M., ASHIKARI, M., NAKAJIMA, M., ITOH, H., KATOH, E.,
KOBAYASHI, M., CHOW, T.-Y., HSING, Y.-I. C., KITANO, H., YAMAGUCHI, I. & MATSUOKA, M. 2005. GIBBERELLIN INSENSITIVE DWARF1 encodes a soluble receptor for gibberellin. Nature.

265
UPDEGRAFF, E. P., ZHAO, F. & PREUSS, D. 2009. The extracellular lipase EXL4 is required for efficient hydration of Arabidopsis pollen. Sex Plant Reprod, 22, 197-204.
USHIJIMA, K., SASSA, H., DANDEKAR, A. M., GRADZIEL, T. M., TAO, R. & HIRANO, H. 2003. Structural and transcriptional analysis of the self-incompatibility locus of almond: identification of a pollen-expressed F-box gene with haplotype-specific polymorphism. The Plant Cell, 15, 771-781.
VACCA, R. A., VALENTI, D., BOBBA, A., DE PINTO, M. C., MERAFINA, R. S., DE GARA, L., PASSARELLA, S. & MARRA, E. 2007. Proteasome function is required for activation of programmed cell death in heat shocked tobacco Bright-Yellow 2 cells. FEBS Lett, 581, 917-22.
VALENTI, D., VACCA, R. A., GUARAGNELLA, N., PASSARELLA, S., MARRA, E. & GIANNATTASIO, S. 2008. A transient proteasome activation is needed for acetic acid-induced programmed cell death to occur in Saccharomyces cerevisiae. FEMS Yeast Research, 8, 400-4.
VAN DEN BURG, H. A., TSITSIGIANNIS, D. I., ROWLAND, O., LO, J., RALLAPALLI, G., MACLEAN, D., TAKKEN, F. L. & JONES, J. D. 2008. The F-box protein ACRE189/ACIF1 regulates cell death and defense responses activated during pathogen recognition in tobacco and tomato. The Plant Cell, 20, 697-719.
VAN DOORN, W. G., BEERS, E. P., DANGL, J. L., FRANKLIN-TONG, V. E., GALLOIS, P., HARA-NISHIMURA, I., JONES, A. M., KAWAI-YAMADA, M., LAM, E., MUNDY, J., MUR, L. A. J., PETERSEN, M., SMERTENKO, A., TALIANSKY, M., VAN BREUSEGEM, F., WOLPERT, T., WOLTERING, E., ZHIVOTOVSKY, B. & BOZHKOV, P. V. 2011. Morphological classification of plant cell deaths. Cell Death and Differentiation, 18, 1241-1246.
VAN DOORN, W. G. & WOLTERING, E. J. 2005. Many ways to exit? Cell death categories in plants. Trends Plant Sci, 10, 117-22.
VANOOSTHUYSE, V., TICHTINSKY, G., DUMAS, C., GAUDE, T. & COCK, J. M. 2003. Interaction of calmodulin, a sorting nexin and kinase-associated protein phosphatase with the Brassica oleracea S locus receptor kinase. Plant Physiol, 133, 919-29.
VERCAMMEN, D., VAN DE COTTE, B., DE JAEGER, G., EECKHOUT, D., CASTEELS, P., VANDEPOELE, K., VANDENBERGHE, I., VAN BEEUMEN, J., INZÉ, D. & VAN BREUSEGEM, F. 2004. Type II metacaspases Atmc4 and Atmc9 of Arabidopsis thaliana cleave substrates after arginine and lysine. J Biol Chem, 279, 45329-36.
VERT, G., NEMHAUSER, J. L., GELDNER, N., HONG, F. & CHORY, J. 2005. Molecular mechanisms of steroid hormone signaling in plants. Annu Rev Cell Dev Biol, 21, 177-201.
VIDALI, L., ROUNDS, C. M., HEPLER, P. K. & BEZANILLA, M. 2009. Lifeact-mEGFP reveals a dynamic apical F-actin network in tip growing plant cells. PLoS One, 4, e5744.
VIERSTRA, R. D. 2003. The ubiquitin/26S proteasome pathway, the complex last chapter in the life of many plant proteins. Trends Plant Sci, 8, 135-42.
VIERSTRA, R. D. 2009. The ubiquitin-26S proteasome system at the nexus of plant biology. Nat Rev Mol Cell Biol, 10, 385-97.

266
VOGES, D., ZWICKL, P. & BAUMEISTER, W. 1999. The 26S proteasome: a molecular machine designed for controlled proteolysis. Annual Review of Biochemistry, 68, 1015-1068.
VOLKMER, R., KRETZSCHMAR, I. & TAPIA, V. 2011. Mapping receptor-ligand interactions with synthetic peptide arrays: Exploring the structure and function of membrane receptors. European Journal of Cell Biology [Online]. Available: http://www.ncbi.nlm.nih.gov/entrez/query.fcgi?db=pubmed&cmd=Retrieve&dopt=AbstractPlus&list_uids=21561681.
WALKER, E. A., RIDE, J. P., KURUP, S., FRANKLIN-TONG, V. E., LAWRENCE, M. J. & FRANKLIN, F. C. 1996. Molecular analysis of two functional homologues of the S3 allele of the Papaver rhoeas self-incompatibility gene isolated from different populations. Plant Mol Biol, 30, 983-994.
WALKER, J. C. & ZHANG, R. 1990. Relationship of a putative receptor protein kinase from maize to the S-locus glycoproteins of Brassica. Nature, 345, 743-6.
WANG, C.-L., WU, J., XU, G.-H., GAO, Y.-B., CHEN, G., WU, J.-Y., WU, H.-Q. & ZHANG, S.-L. 2010. S-RNase disrupts tip-localized reactive oxygen species and induces nuclear DNA degradation in incompatible pollen tubes of Pyrus pyrifolia. Journal of Cell Science, 123, 4301-4309.
WANG, C.-L., XU, G.-H., JIANG, X.-T., CHEN, G., WU, J., WU, H.-Q. & ZHANG, S.-L. 2009a. S-RNase triggers mitochondrial alteration and DNA degradation in the incompatible pollen tube of Pyrus pyrifolia in vitro. The Plant Journal 57, 220-229.
WANG, F., ZHU, D., HUANG, X., LI, S., GONG, Y., YAO, Q., FU, X., FAN, L.-M. & DENG, X. W. 2009b. Biochemical insights on degradation of Arabidopsis DELLA proteins gained from a cell-free assay system. Plant Cell, 21, 2378-90.
WANG, X. 2004. Lipid signaling. Curr Opin Plant Biol, 7, 329-36. WATANABE, N. & LAM, E. 2011. Arabidopsis Metacaspase 2d Is a Positive Mediator of
Cell Death Induced during Biotic and Abiotic Stresse. Plant J, 66, 969-982. WETERINGS, K., SCHRAUWEN, J., WULLEMS, G. & TWELL, D. 1995. Functional
dissection of the promoter of the pollen-specific gene NTP303 reveals a novel pollen-specific, and conserved cis-regulatory element. Plant J, 8, 55-63.
WHEELER, M. J. 2001. An investigation into the molecular genetics and cytogenetics of self-incompatibility in Papaver Rhoeas L., PhD thesis, Univeristy of Birmingham.
WHEELER, M. J., DE GRAAF, B. H. J., HADJIOSIF, N., PERRY, R. M., POULTER, N. S., OSMAN, K., VATOVEC, S., HARPER, A., FRANKLIN, F. C. H. & FRANKLIN-TONG, V. E. 2009. Identification of the pollen self-incompatibility determinant in Papaver rhoeas. Nature, 459, 992-5.
WHEELER, M. J., VATOVEC, S. & FRANKLIN-TONG, V. E. 2010. The pollen S-determinant in Papaver: comparisons with known plant receptors and protein ligand partners. J Exp Bot, 61, 2015-2025.
WILKINS, K. A., BANCROFT, J., BOSCH, M., INGS, J., SMIRNOFF, N. & FRANKLIN-TONG, V. E. 2011. Reactive oxygen species and nitric oxide mediate actin reorganization and programmed cell death in the self-incompatibility response of Papaver. Plant Physiol, 156, 404-16.
WOLTERING, E. J. 2010. Death proteases: alive and kicking. Trends in Plant Science, 15, 185-188.
WOLTERS-ARTS, M., VAN DER WEERD., L., VAN AELST, A. C., VAN AS, H. & MARIANI, C. 2002. Water-conducting properties of lipids during pollen hydration. Plant, Cell and Environment, 25, 513-519.

267
WU, F.-H., SHEN, S.-C., LEE, L.-Y., LEE, S.-H., CHAN, M.-T. & LIN, C.-S. 2009. Tape-Arabidopsis Sandwich - a simpler Arabidopsis protoplast isolation method. Plant Methods, 5, 16-26.
WU, J., WANG, S., GU, Y., ZHANG, S., PUBLICOVER, S. J. & FRANKLIN-TONG, V. E. 2011. Self-incompatibility in Papaver rhoeas activates nonspecific cation conductance permeable to Ca2+ and K+. Plant Physiol, 155, 963-73.
YADAV, R. K., FULTON, L., BATOUX, M. & SCHNEITZ, K. 2008. The Arabidopsis receptor-like kinase STRUBBELIG mediates inter-cell-layer signaling during floral development. Developmental Biology, 323, 261-70.
YAKUNIN, A. F. & HALLENBECK, P. C. 1998. A luminol/iodophenol chemiluminiscent detection system for western immunoblot. Analytical Biochemistry, 258, 146-149.
YANG, C. W., GONZÁLEZ-LAMOTHE, R., EWAN, R. A., ROWLAND, O., YOSHIOKA, H., SHENTON, M., YE, H., O'DONNELL, E., JONES, J. D. G. & SADANANDOM, A. 2006. The E3 ubiquitin ligase activity of Arabidopsis PLANT U-BOX17 and its functional tobacco homolog ACRE276 are required for cell death and defense. The Plant Cell 18, 1084-1098.
YANG, L., JI, W., ZHU, Y., GAO, P., LI, Y., CAI, H., BAI, X. & GUO, D. 2010. GsCBRLK, a calcium/calmodulin-binding receptor-like kinase, is a positive regulator of plant tolerance to salt and ABA stress. Journal of Experimental Botany, 61, 2519-33.
YANG, S.-L., JIANG, L., PUAH, C. S., XIE, L.-F., ZHANG, X.-Q., CHEN, L.-Q., YANG, W.-C. & YE, D. 2005. Overexpression of TAPETUM DETERMINANT1 alters the cell fates in the Arabidopsis carpel and tapetum via genetic interaction with excess microsporocytes1/extra sporogenous cells. Plant Physiology, 139, 186-91.
YANG, Z. 2008. Cell Polarity Signaling in Arabidopsis. Cell and Developmental Biology, 24, 551-575.
YAO, C.-K., LIN, Y. Q., LY, C. V., OHYAMA, T., HAUETER, C. M., MOISEENKOVA-BELL, V. Y., WENSEL, T. G. & BELLEN, H. J. 2009. A synaptic vesicle-associated Ca2+ channel promotes endocytosis and couples exocytosis to endocytosis. Cell, 138, 947-60.
YE, H., LI, L. & YIN, Y. 2011. Recent Advances in the Regulation of Brassinosteroid Signaling and Biosynthesis Pathways. J Integr Plant Biol, 53, 455-68.
YEE, D. & GORING, D. R. 2009. The diversity of plant U-box E3 ubiquitin ligases: from upstream activators to downstream target substrates. Journal of Experimental Botany, 60, 1109-21.
YOO, S.-D., CHO, Y.-H. & SHEEN, J. 2007. Arabidopsis mesophyll protoplasts: a versatile cell system for transient gene expression analysis. Nat Protoc, 2, 1565-1572.
ZENG, W. & HE, S. Y. 2010. A prominent role of the flagellin receptor FLAGELLIN-SENSING2 in mediating stomatal response to Pseudomonas syringae pv tomato DC3000 in Arabidopsis. Plant Physiol, 153, 1188-98.
ZHANG, S., SHI, Y., JIN, H., LIU, Z., ZHANG, L. & ZHANG, L. 2009. Covalent complexes of proteasome model with peptide aldehyde inhibitors MG132 and MG101: docking and molecular dynamics study. J Mol Model, 15, 1481-90.
ZHANG, W., JEON, B. W. & ASSMANN, S. M. 2011. Heterotrimeric G-protein regulation of ROS signalling and calcium currents in Arabidopsis guard cells J Exp Bot, 62, 2371-9.
ZHANG, Y. & XUE, Y. 2008. Molecular biology of S-RNase-based self-incompatibility. Self-Incompatibility in Flowering Plants: Evolution, Diversity, and Mechanisms.

268
ZHAO, C., AVCI, U., GRANT, E. H., HAIGLER, C. H. & BEERS, E. P. 2008. XND1, a member of the NAC domain family in Arabidopsis thaliana, negatively regulates lignocellulose synthesis and programmed cell death in xylem. The Plant Journal, 53, 425-436.
ZHAO, D.-Z., WANG, G.-F., SPEAL, B. & MA, H. 2002. The excess microsporocytes1 gene encodes a putative leucine-rich repeat receptor protein kinase that controls somatic and reproductive cell fates in the Arabidopsis anther. Genes & Development, 16, 2021-31.
ZHAO, L., HUANG, J., ZHAO, Z., LI, Q., SIMS, T. L. & XUE, Y. 2010. The Skp1-like protein SSK1 is required for cross-pollen compatibility in S-RNase-based self-incompatibility. The Plant Journal, 62, 52-63.
ZINKL, G. M., ZWIEBEL, B. I., GRIER, D. G. & PREUSS, D. 1999. Pollen-stigma adhesion in Arabidopsis: a species-specific interaction mediated by lipophilic molecules in the pollen exine. Development, 126, 5431-40.
ZIPFEL, C., ROBATZEK, S., NAVARRO, L., OAKELEY, E. J., JONES, J. D. G., FELIX, G. & BOLLER, T. 2004. Bacterial disease resistance in Arabidopsis through flagellin perception. Nature, 428, 764-7.
ZONIA, L. & MUNNIK, T. 2009. Uncovering hidden treasures in pollen tube growth mechanics. Trends Plant Sci, 14, 318-327.
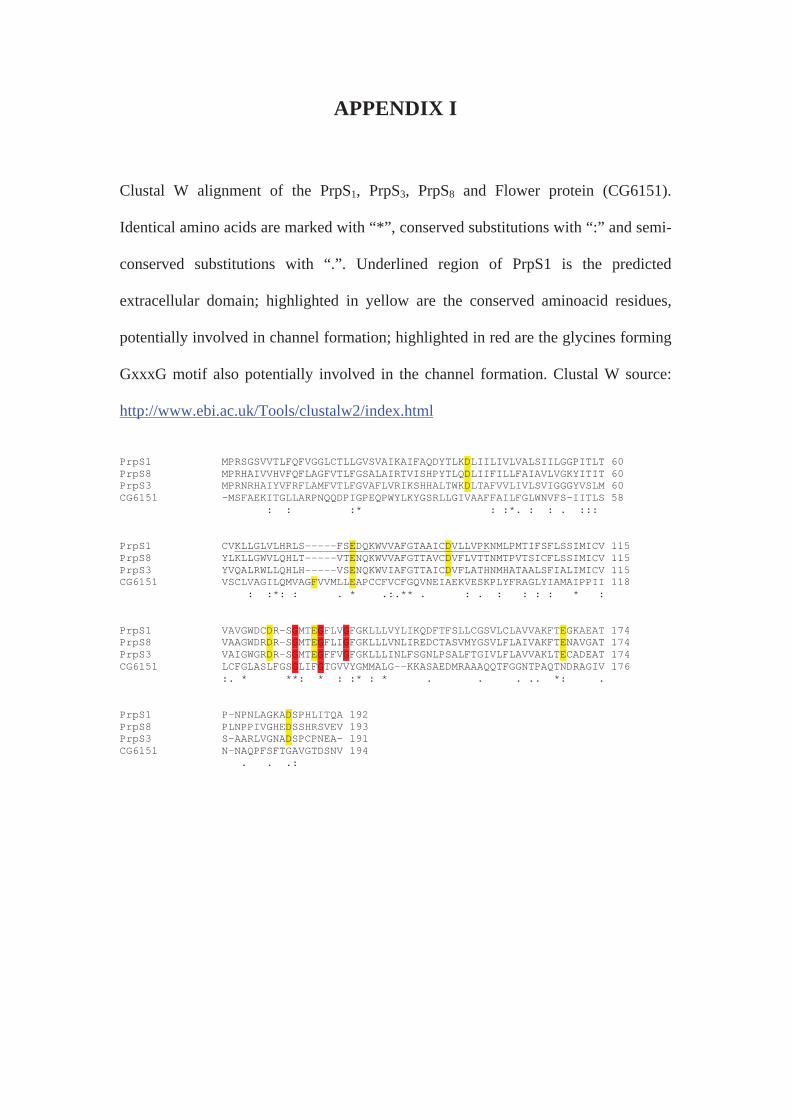
APPENDIX I
Clustal W alignment of the PrpS1, PrpS3, PrpS8 and Flower protein (CG6151).
Identical amino acids are marked with “*”, conserved substitutions with “:” and semi-
conserved substitutions with “.”. Underlined region of PrpS1 is the predicted
extracellular domain; highlighted in yellow are the conserved aminoacid residues,
potentially involved in channel formation; highlighted in red are the glycines forming
GxxxG motif also potentially involved in the channel formation. Clustal W source:
http://www.ebi.ac.uk/Tools/clustalw2/index.html
PrpS1 MPRSGSVVTLFQFVGGLCTLLGVSVAIKAIFAQDYTLKDLIILIVLVALSIILGGPITLT 60 PrpS8 MPRHAIVVHVFQFLAGFVTLFGSALAIRTVISHPYTLQDLIIFILLFAIAVLVGKYITIT 60 PrpS3 MPRNRHAIYVFRFLAMFVTLFGVAFLVRIKSHHALTWKDLTAFVVLIVLSVIGGGYVSLM 60 CG6151 -MSFAEKITGLLARPNQQDPIGPEQPWYLKYGSRLLGIVAAFFAILFGLWNVFS-IITLS 58 : : :* : :*. : : . ::: PrpS1 CVKLLGLVLHRLS-----FSEDQKWVVAFGTAAICDVLLVPKNMLPMTIFSFLSSIMICV 115 PrpS8 YLKLLGWVLQHLT-----VTENQKWVVAFGTTAVCDVFLVTTNMTPVTSICFLSSIMICV 115 PrpS3 YVQALRWLLQHLH-----VSENQKWVIAFGTTAICDVFLATHNMHATAALSFIALIMICV 115 CG6151 VSCLVAGILQMVAGFVVMLLEAPCCFVCFGQVNEIAEKVESKPLYFRAGLYIAMAIPPII 118 : :*: : . * .:.** . : . : : : : * : PrpS1 VAVGWDCDR-SGMTEGFLVGFGKLLLVYLIKQDFTFSLLCGSVLCLAVVAKFTEGKAEAT 174 PrpS8 VAAGWDRDR-SGMTEGFLIGFGKLLLVNLIREDCTASVMYGSVLFLAIVAKFTENAVGAT 174 PrpS3 VAIGWGRDR-SGMTEGFFVGFGKLLLINLFSGNLPSALFTGIVLFLAVVAKLTECADEAT 174 CG6151 LCFGLASLFGSGLIFGTGVVYGMMALG--KKASAEDMRAAAQQTFGGNTPAQTNDRAGIV 176 :. * **: * : :* : * . . . .. *: . PrpS1 P-NPNLAGKADSPHLITQA 192 PrpS8 PLNPPIVGHEDSSHRSVEV 193 PrpS3 S-AARLVGNADSPCPNEA- 191 CG6151 N-NAQPFSFTGAVGTDSNV 194 . . .:
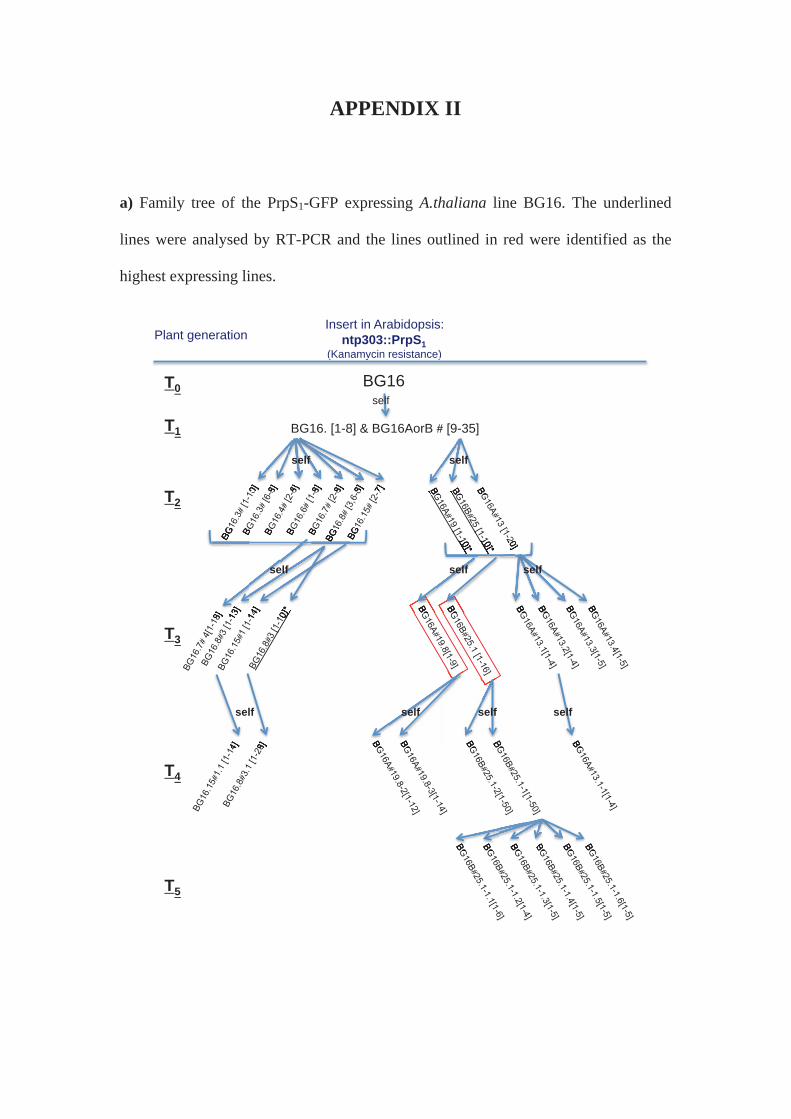
APPENDIX II
a) Family tree of the PrpS1-GFP expressing A.thaliana line BG16. The underlined
lines were analysed by RT-PCR and the lines outlined in red were identified as the
highest expressing lines.
BG16 T0
T1 BG16. [1-8] & BG16AorB # [9-35]
T2
Plant generation Insert in Arabidopsis:
ntp303::PrpS1 (Kanamycin resistance) (( yy ))
BG1
self
self
T3
self
T4
T5
self self self
self self self self

b) Family tree of the PrpS3-GFP expressing A.thaliana line HZ3. The underlined lines
were analysed by RT-PCR and the lines outlined in red were identified as the highest
expressing lines.
A.t. HZ3 T0
T1 HZ3. [1-15]
T2 HZ3.1 [1-15]*
Plant generation Insert in Arabidopsis: ntp303::PrpS3-GFP (Kanamycin resistance) ( y )
3 [1
1 [1 15]*
self
HZ3.2
Kan sensitive HZ3.3 [1-15]
HZ3.4 Kan sensitive
HZ3 2 HZ3 4
T3 HZ3.1-3 [1-10] 1
T4
self
HZ3.1-3.1 [1-26]
T5
HZ3.1-15.1 [1-41] 3 1 [ Z3 1 15 1
self self
ve HZ3 3 [1HZ
HZ3.1-15 [1-10] 1 3 [1 10]1 3 [
elf se
HZ3 1 15
self self
self

c) Family tree of the PrsS1 expressing A.thaliana line HZ1. The underlined lines were
analysed by RT-PCR and the lines outlined in red were identified as the highest
expressing lines.
A.t.HZ1 T0
T1 HZ1. [1-27]
T2
Plant generation Insert in Arabidopsis:
Stig1::PrsS1 (Basta resistance) (( ))
[1
self
self sss f elfesese
T3 HZ1.1-3 [1-16] HZ1.8-2 [1-16] HZ1 1 3 [ HZ1 8 2 [
T4
self self
HZ1.1-3.1 [1-22]
HZ1.1-3.1-1 [1-11] T5
HZ1.8-2.1 [1-20]
HZ1.8-2.1-1 [1-10]
3 1 2 1
3 1 1 2 1 1
self self
self self

d) Family tree of the PrsS3 expressing A.thaliana line HZ2. The underlined lines were
analysed by RT-PCR and the lines outlined in red were identified as the highest
expressing lines.
A.t.HZ2 T0
T1 HZ2. [1-20]
T2
Plant generation Insert in Arabidopsis:
Stig1::PrsS3 (Basta resistance) ( )
2 [1
self
T3 HZ2.6-1 [1-13] HZ2.13-5 [1-18] 6 1 [1 13] 3 5
T4
self self
HZ2.6-1.1 [1-22]
HZ2.6-1.1-1 [1-9] T5
HZ2.13-5.1 [1-17]
HZ2.13-5.1-1 [1-10]
1 1 3 5 1 [
1 1 5 1
self self
self self
self

APPENDIX III
Published papers
Poulter N. S., Vatovec S. and Franklin-Tong V. E. 2008. Microtubules are a target for
self-incompatibility signaling in Papaver pollen. Plant Physiol., 146: 1358-1367.
My contribution: Natalie Poulter carried out most of the studies. I carried out some
of the experiments in collaboration doing my final year project for University of
Ljubljana, Slovenia. I helped with caspase assays presented in the paper, tube length
studies as well as western blot (Figure 3). I proof-read the manuscript.
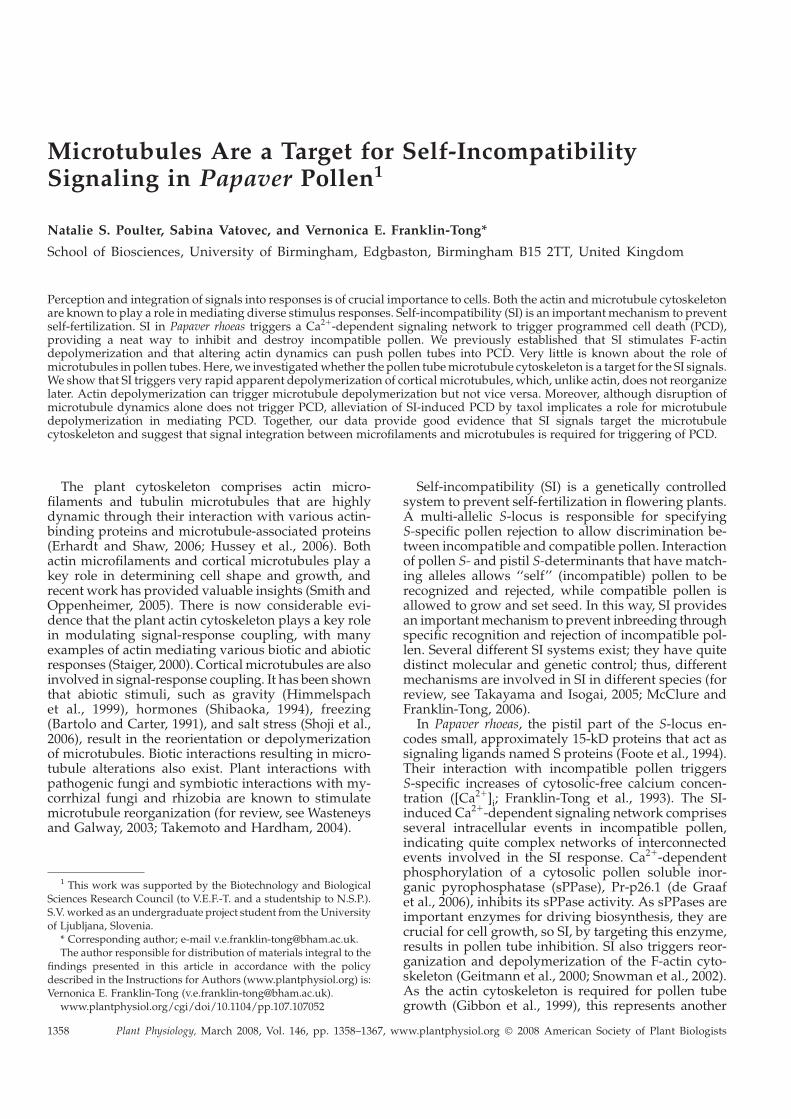
Microtubules Are a Target for Self-IncompatibilitySignaling in Papaver Pollen1
Natalie S. Poulter, Sabina Vatovec, and Vernonica E. Franklin-Tong*
School of Biosciences, University of Birmingham, Edgbaston, Birmingham B15 2TT, United Kingdom
Perception and integration of signals into responses is of crucial importance to cells. Both the actin andmicrotubule cytoskeletonare known to play a role inmediating diverse stimulus responses. Self-incompatibility (SI) is an important mechanism to preventself-fertilization. SI in Papaver rhoeas triggers a Ca21-dependent signaling network to trigger programmed cell death (PCD),providing a neat way to inhibit and destroy incompatible pollen. We previously established that SI stimulates F-actindepolymerization and that altering actin dynamics can push pollen tubes into PCD. Very little is known about the role ofmicrotubules in pollen tubes.Here,we investigatedwhether the pollen tubemicrotubule cytoskeleton is a target for the SI signals.We show that SI triggers very rapid apparent depolymerization of cortical microtubules, which, unlike actin, does not reorganizelater. Actin depolymerization can trigger microtubule depolymerization but not vice versa. Moreover, although disruption ofmicrotubule dynamics alone does not trigger PCD, alleviation of SI-induced PCD by taxol implicates a role for microtubuledepolymerization in mediating PCD. Together, our data provide good evidence that SI signals target the microtubulecytoskeleton and suggest that signal integration between microfilaments and microtubules is required for triggering of PCD.
The plant cytoskeleton comprises actin micro-filaments and tubulin microtubules that are highlydynamic through their interaction with various actin-binding proteins and microtubule-associated proteins(Erhardt and Shaw, 2006; Hussey et al., 2006). Bothactin microfilaments and cortical microtubules play akey role in determining cell shape and growth, andrecent work has provided valuable insights (Smith andOppenheimer, 2005). There is now considerable evi-dence that the plant actin cytoskeleton plays a key rolein modulating signal-response coupling, with manyexamples of actin mediating various biotic and abioticresponses (Staiger, 2000). Cortical microtubules are alsoinvolved in signal-response coupling. It has been shownthat abiotic stimuli, such as gravity (Himmelspachet al., 1999), hormones (Shibaoka, 1994), freezing(Bartolo and Carter, 1991), and salt stress (Shoji et al.,2006), result in the reorientation or depolymerizationof microtubules. Biotic interactions resulting in micro-tubule alterations also exist. Plant interactions withpathogenic fungi and symbiotic interactions with my-corrhizal fungi and rhizobia are known to stimulatemicrotubule reorganization (for review, see Wasteneysand Galway, 2003; Takemoto and Hardham, 2004).
Self-incompatibility (SI) is a genetically controlledsystem to prevent self-fertilization in flowering plants.A multi-allelic S-locus is responsible for specifyingS-specific pollen rejection to allow discrimination be-tween incompatible and compatible pollen. Interactionof pollen S- and pistil S-determinants that have match-ing alleles allows ‘‘self’’ (incompatible) pollen to berecognized and rejected, while compatible pollen isallowed to grow and set seed. In this way, SI providesan importantmechanism to prevent inbreeding throughspecific recognition and rejection of incompatible pol-len. Several different SI systems exist; they have quitedistinct molecular and genetic control; thus, differentmechanisms are involved in SI in different species (forreview, see Takayama and Isogai, 2005; McClure andFranklin-Tong, 2006).
In Papaver rhoeas, the pistil part of the S-locus en-codes small, approximately 15-kD proteins that act assignaling ligands named S proteins (Foote et al., 1994).Their interaction with incompatible pollen triggersS-specific increases of cytosolic-free calcium concen-tration ([Ca21]i; Franklin-Tong et al., 1993). The SI-induced Ca21-dependent signaling network comprisesseveral intracellular events in incompatible pollen,indicating quite complex networks of interconnectedevents involved in the SI response. Ca21-dependentphosphorylation of a cytosolic pollen soluble inor-ganic pyrophosphatase (sPPase), Pr-p26.1 (de Graafet al., 2006), inhibits its sPPase activity. As sPPases areimportant enzymes for driving biosynthesis, they arecrucial for cell growth, so SI, by targeting this enzyme,results in pollen tube inhibition. SI also triggers reor-ganization and depolymerization of the F-actin cyto-skeleton (Geitmann et al., 2000; Snowman et al., 2002).As the actin cytoskeleton is required for pollen tubegrowth (Gibbon et al., 1999), this represents another
1 This work was supported by the Biotechnology and BiologicalSciences Research Council (to V.E.F.-T. and a studentship to N.S.P.).S.V. worked as an undergraduate project student from the Universityof Ljubljana, Slovenia.
* Corresponding author; e-mail [email protected] author responsible for distribution of materials integral to the
findings presented in this article in accordance with the policydescribed in the Instructions for Authors (www.plantphysiol.org) is:Vernonica E. Franklin-Tong ([email protected]).
www.plantphysiol.org/cgi/doi/10.1104/pp.107.107052
1358 Plant Physiology, March 2008, Vol. 146, pp. 1358–1367, www.plantphysiol.org � 2008 American Society of Plant Biologists

mechanism to inhibit incompatible pollen tube growth.SI also triggers programmed cell death (PCD), involv-ing several caspase-like activities (Thomas and Franklin-Tong, 2004; Bosch and Franklin-Tong, 2007). PCD is aconserved mechanism to get rid of unwanted cells andis used to sculpt tissues during development as well asin response to abiotic stress and pathogens (van DoornandWoltering, 2005). SI activates PCD specifically in in-compatible pollen, thereby preventing self-fertilization.Recent investigations revealed that alterations in actindynamics can push pollen tubes into PCD (Thomaset al., 2006), and an SI-activated mitogen-activatedprotein kinase (Rudd et al., 1996) is implicated insignaling to PCD (Li et al., 2007). These data suggestthat in Papaver, these components contribute to anintegrated SI signaling network to achieve inhibitionand death of incompatible pollen.While the actin cytoskeleton is well established as
being essential for tip growth in plant cells (Gibbonet al., 1999; Staiger, 2000), the role of the microtubulecytoskeleton is more variable, depending to some ex-tent on the cell type. In some tip-growing plant cells,microtubule-disrupting drugs have no effect on tipgrowth; in others, they result in inhibition of growth,multiple growth initiation sites, or loss of directional-ity in root hairs (Bibikova et al., 1999) and pollen tubes(Anderhag et al., 2000; Gossot and Geitmann, 2007).However, it is well established that microtubules donot play an obvious role in regulating angiospermpollen tube growth rate (Heslop-Harrison et al., 1988;Astrom et al., 1995; Raudaskoski et al., 2001). Apartfrom data showing that they help organize the gener-ative cell (GC) and vegetative nucleus (Raudaskoskiet al., 2001; Laitiainen et al., 2002), relatively little isknown about their function (Cai and Cresti, 2006). Asthe actin cytoskeleton is known to play a role in SI, wespeculatively explored a possible role for the microtu-bule cytoskeleton in SI-induced signaling. Here, wereport that SI stimulates rapid and massive apparentmicrotubule depolymerization, demonstrating that thepollen microtubule cytoskeleton is an early target forSI signals. Our data implicate signal integration be-tween the microfilament and microtubule cytoskeletonand suggest a role for microtubules in SI-induced PCD.
RESULTS
Microtubule Cytoskeleton Organization in GrowingPapaver Pollen Tubes
The microtubule cytoskeleton organization in nor-mally growing P. rhoeas pollen tubes, using immuno-localization and probing with a-tubulin (Fig. 1), haspreviously been described (Gossot and Geitmann,2007). The microtubule arrangement is very similarto that described previously (Astrom et al., 1995; Gossotand Geitmann, 2007). The tip region is relativelymicrotubule-free; behind this region are arrays ofshort, longitudinally organized microtubule bundles
(Fig. 1A). Further back, in the shank region, there arelonger, more regularly organized longitudinal micro-tubule bundles (Fig. 1, A and B), which are mainlycortical (Fig. 1, B and C). Pollen tubes have a vegetativenucleus and a GC, which has a distinctive populationof spindle-shaped GC microtubules (Fig. 1B).
SI Triggers Microtubule Depolymerization
To establish whether microtubules are a target for SIsignaling, we examined the microtubule cytoskeletonusing immunolocalization at various time points afterincompatible SI induction (Fig. 2). Typical microtubuleand microfilament organization was seen in controlpollen tubes (Fig. 2, A and B). The microtubule cyto-skeleton was rapidly altered after SI induction. Asearly as 1 min after SI, cortical microtubule bundleswere virtually undetectable in incompatible pollentubes; much weaker staining suggested that they haddepolymerized (Fig. 2C). The GC spindle-shaped mi-crotubules remained relatively intact at this time point(Fig. 2D). F-actin also dramatically reorganized by1 min and accumulated in the tip, where it is notnormally detected; many of the filament bundles haddisappeared (Fig. 2E). At 3 min, the cortical microtu-bule bundles were virtually undetectable (Fig. 2F), andF-actin appeared disintegrated (Fig. 2G). At 30 min,cortical microtubules remained depolymerized (Fig.2H), the GC spindle-shaped microtubules were stillevident but disintegrating (Fig. 2I), and F-actin wasaggregating (Fig. 2J). These data demonstrate that SIinduces very rapid alterations to the cortical microtu-
Figure 1. Microtubule organization in untreated Papaver pollen tubes.A, The apical region is relatively microtubule free; behind this is aregion comprising shorter microtubule bundles, and behind this arelonger arrays of cortical microtubule bundles. B, In the shank region,cortical microtubules are longitudinally arranged; the GC has a dis-tinctive population of spindle-shaped microtubules. C, A single con-focal optical section (0.5 mm) shows that microtubules are primarilycortical. A and B, Full projections of confocal optical sections. Micro-tubules were detected using immunolocalization with anti-a-tubulinantibody clone B-5-1-2. Scale bar 5 10 mm.
Self-Incompatibility Signals to Microtubules
Plant Physiol. Vol. 146, 2008 1359

bule cytoskeleton of incompatible pollen tubes, whichappeared to be depolymerized. The spindle-shapedmicrotubules were much more stable and were stillapparent at 60 min post-SI but were disintegrating.These comparisons between SI-induced microtubuleand microfilament responses show that although bothrespond very rapidly, they are quite distinct responses.
Although the rapidity of the alterations to the mi-crotubules argued against degradation of total tubulinand suggested tubulin depolymerization, we wishedto establish whether this was the case. To address thisquestion, we examined the overall levels of a-tubulinin SI-induced pollen tubes at various time points, us-ing western blotting. The overall amount of a-tubulinin the pollen tubes remained virtually constant for atleast 60 min after SI induction (Fig. 3), althoughcortical microtubules detected using immunolocaliza-tion disappeared within 1 min of SI induction. Thisstrongly suggests that the SI-induced cortical micro-tubule disappearance is due to tubulin depolymeriza-tion rather than degradation.
Actin Depolymerization Results in Alterations to the
Microtubule Cytoskeleton
Because SI stimulated rapid actin depolymerization(Snowman et al., 2002), we wondered whether thismight be responsible for alterations to the microtu-bules. We used latrunculin B (LatB) to examine theeffect of F-actin depolymerization on the pollen mi-crotubule cytoskeleton. Pollen was treated with 1 mM
LatB for various time periods; we then imaged theeffect of this treatment on both F-actin and microtu-
bule populations. These relatively high concentrationswere employed, as we wished to mimic the SI effect ofrapid, complete depolymerization within a couple ofminutes as closely as possible (Thomas et al., 2006).Typical untreated control pollen tubes are shown inFigure 4, A to D. After 5 min treatment with 1 mM LatB(Fig. 4, E–H), F-actin appeared fragmented, with a fewshort actin microfilament bundles remaining (Fig. 4, Eand F). Although apical microtubule organization wasaltered by LatB treatment, the changes were not asobserved for actin. Microtubules were present in theapical region and showed a distinctive random orga-nization (Fig. 4G), but cortical microtubules in theshank appeared largely unaffected (Fig. 4H), as werethe GC spindle-shaped microtubules (data not shown).Longer treatments with 1 mM LatB (Fig. 4, I–L) resultedin depolymerized F-actin (Fig. 4, I and J) and loss ofvirtually all cortical microtubules in the apical region(Fig. 4K) and shank (Fig. 4L). These data show thatactin depolymerization results in apparent depoly-merization of cortical microtubules, confirming datafrom Gossot and Geitmann (2007). This provides ev-idence for signaling between these two cytoskeletal
Figure 2. SI stimulates rapid apparent depolymerization of cortical microtubules coinciding with actin depolymerization. A,Cortical microtubules in an untreated pollen tube. Inset, GC microtubules. B, F-actin in an untreated pollen tube. C, At 1 minafter SI induction, cortical microtubules are apparently virtually completely depolymerized. D, At 1 min after SI, GCmicrotubules are more or less intact. E, At 1 min after SI, F-actin is in the apical region; many F-actin bundles have disappeared. F,At 3 min after SI, cortical microtubules are undetectable; spindle-shaped microtubules show signs of disintegration. G, At 3 minafter SI, F-actin has formed small punctate foci. H, At 30 min after SI induction, cortical microtubules are undetectable. I, At 30min after SI induction, GC microtubules are further degraded. J, At 30 min after SI induction, F-actin comprises larger punctatefoci. Microtubules were detected using immunolocalization with anti-a-tubulin; F-actin was colocalized using rhodamine-phalloidin. Images are full projections of confocal sections. Scale bar 5 10 mm.
Figure 3. SI does not trigger tubulin degradation. Western blot ofextracts from untreated pollen tubes (UT) and extracts from SI-inducedpollen tubes at 15, 30, and 60 min after SI, probed with anti-a-tubulinantibody clone B-5-1-2. Overall a-tubulin levels (equal loading ofsamples; arrowhead) did not significantly change.
Poulter et al.
1360 Plant Physiol. Vol. 146, 2008
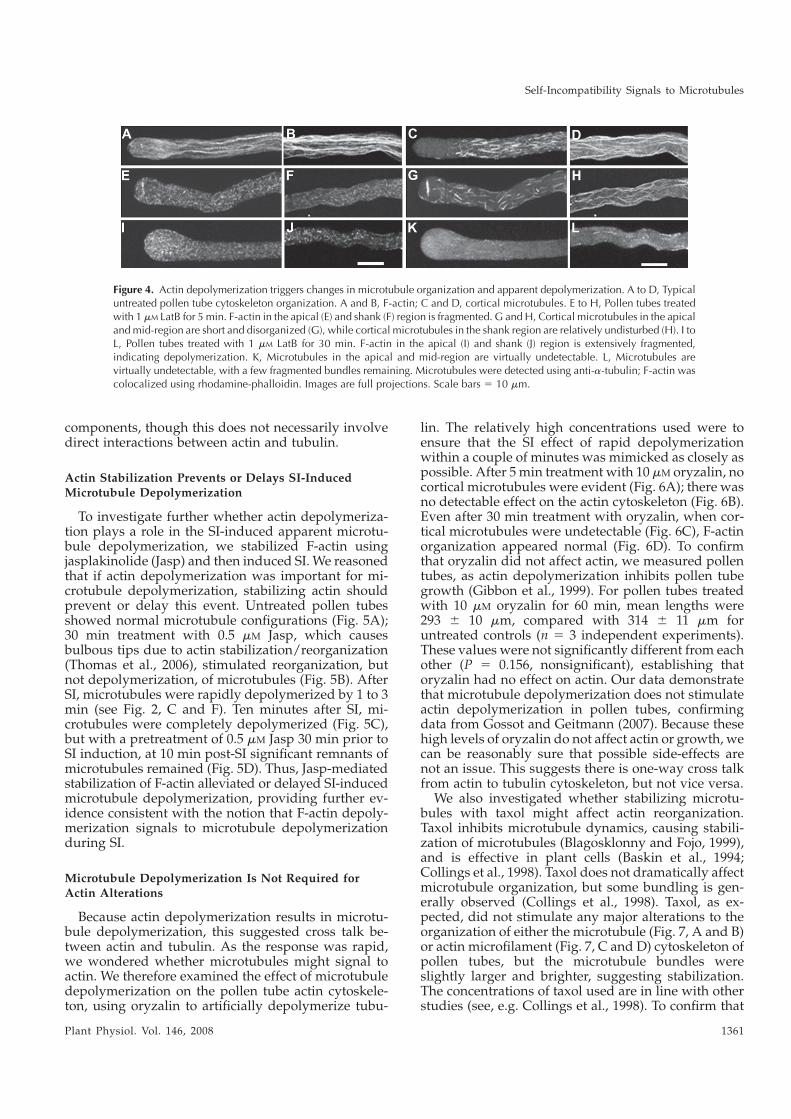
components, though this does not necessarily involvedirect interactions between actin and tubulin.
Actin Stabilization Prevents or Delays SI-InducedMicrotubule Depolymerization
To investigate further whether actin depolymeriza-tion plays a role in the SI-induced apparent microtu-bule depolymerization, we stabilized F-actin usingjasplakinolide (Jasp) and then induced SI. We reasonedthat if actin depolymerization was important for mi-crotubule depolymerization, stabilizing actin shouldprevent or delay this event. Untreated pollen tubesshowed normal microtubule configurations (Fig. 5A);30 min treatment with 0.5 mM Jasp, which causesbulbous tips due to actin stabilization/reorganization(Thomas et al., 2006), stimulated reorganization, butnot depolymerization, of microtubules (Fig. 5B). AfterSI, microtubules were rapidly depolymerized by 1 to 3min (see Fig. 2, C and F). Ten minutes after SI, mi-crotubules were completely depolymerized (Fig. 5C),but with a pretreatment of 0.5 mM Jasp 30 min prior toSI induction, at 10 min post-SI significant remnants ofmicrotubules remained (Fig. 5D). Thus, Jasp-mediatedstabilization of F-actin alleviated or delayed SI-inducedmicrotubule depolymerization, providing further ev-idence consistent with the notion that F-actin depoly-merization signals to microtubule depolymerizationduring SI.
Microtubule Depolymerization Is Not Required forActin Alterations
Because actin depolymerization results in microtu-bule depolymerization, this suggested cross talk be-tween actin and tubulin. As the response was rapid,we wondered whether microtubules might signal toactin. We therefore examined the effect of microtubuledepolymerization on the pollen tube actin cytoskele-ton, using oryzalin to artificially depolymerize tubu-
lin. The relatively high concentrations used were toensure that the SI effect of rapid depolymerizationwithin a couple of minutes was mimicked as closely aspossible. After 5min treatment with 10 mM oryzalin, nocortical microtubules were evident (Fig. 6A); there wasno detectable effect on the actin cytoskeleton (Fig. 6B).Even after 30 min treatment with oryzalin, when cor-tical microtubules were undetectable (Fig. 6C), F-actinorganization appeared normal (Fig. 6D). To confirmthat oryzalin did not affect actin, we measured pollentubes, as actin depolymerization inhibits pollen tubegrowth (Gibbon et al., 1999). For pollen tubes treatedwith 10 mM oryzalin for 60 min, mean lengths were293 6 10 mm, compared with 314 6 11 mm foruntreated controls (n 5 3 independent experiments).These values were not significantly different from eachother (P 5 0.156, nonsignificant), establishing thatoryzalin had no effect on actin. Our data demonstratethat microtubule depolymerization does not stimulateactin depolymerization in pollen tubes, confirmingdata from Gossot and Geitmann (2007). Because thesehigh levels of oryzalin do not affect actin or growth, wecan be reasonably sure that possible side-effects arenot an issue. This suggests there is one-way cross talkfrom actin to tubulin cytoskeleton, but not vice versa.
We also investigated whether stabilizing microtu-bules with taxol might affect actin reorganization.Taxol inhibits microtubule dynamics, causing stabili-zation of microtubules (Blagosklonny and Fojo, 1999),and is effective in plant cells (Baskin et al., 1994;Collings et al., 1998). Taxol does not dramatically affectmicrotubule organization, but some bundling is gen-erally observed (Collings et al., 1998). Taxol, as ex-pected, did not stimulate any major alterations to theorganization of either the microtubule (Fig. 7, A and B)or actin microfilament (Fig. 7, C and D) cytoskeleton ofpollen tubes, but the microtubule bundles wereslightly larger and brighter, suggesting stabilization.The concentrations of taxol used are in line with otherstudies (see, e.g. Collings et al., 1998). To confirm that
Figure 4. Actin depolymerization triggers changes in microtubule organization and apparent depolymerization. A to D, Typicaluntreated pollen tube cytoskeleton organization. A and B, F-actin; C and D, cortical microtubules. E to H, Pollen tubes treatedwith 1 mM LatB for 5 min. F-actin in the apical (E) and shank (F) region is fragmented. G and H, Cortical microtubules in the apicalandmid-region are short and disorganized (G), while cortical microtubules in the shank region are relatively undisturbed (H). I toL, Pollen tubes treated with 1 mM LatB for 30 min. F-actin in the apical (I) and shank (J) region is extensively fragmented,indicating depolymerization. K, Microtubules in the apical and mid-region are virtually undetectable. L, Microtubules arevirtually undetectable, with a few fragmented bundles remaining. Microtubules were detected using anti-a-tubulin; F-actin wascolocalized using rhodamine-phalloidin. Images are full projections. Scale bars 5 10 mm.
Self-Incompatibility Signals to Microtubules
Plant Physiol. Vol. 146, 2008 1361
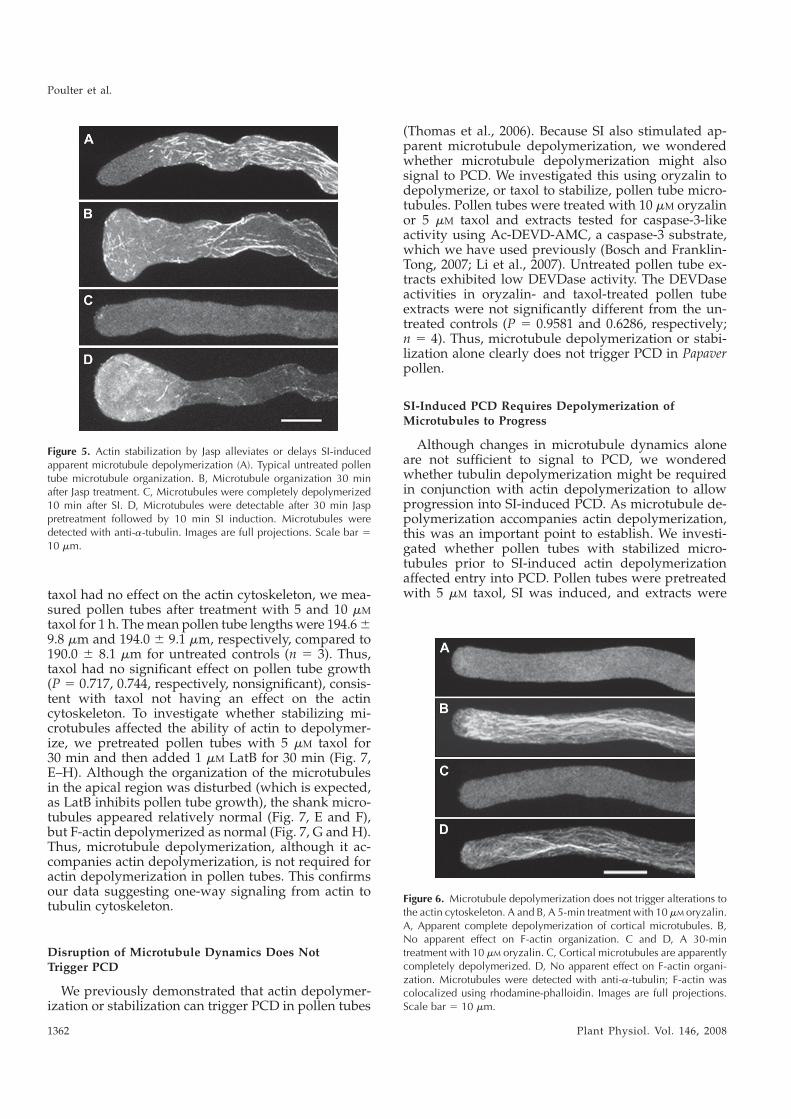
taxol had no effect on the actin cytoskeleton, we mea-sured pollen tubes after treatment with 5 and 10 mM
taxol for 1 h. Themean pollen tube lengthswere 194.669.8 mm and 194.0 6 9.1 mm, respectively, compared to190.0 6 8.1 mm for untreated controls (n 5 3). Thus,taxol had no significant effect on pollen tube growth(P 5 0.717, 0.744, respectively, nonsignificant), consis-tent with taxol not having an effect on the actincytoskeleton. To investigate whether stabilizing mi-crotubules affected the ability of actin to depolymer-ize, we pretreated pollen tubes with 5 mM taxol for30 min and then added 1 mM LatB for 30 min (Fig. 7,E–H). Although the organization of the microtubulesin the apical region was disturbed (which is expected,as LatB inhibits pollen tube growth), the shank micro-tubules appeared relatively normal (Fig. 7, E and F),but F-actin depolymerized as normal (Fig. 7, G and H).Thus, microtubule depolymerization, although it ac-companies actin depolymerization, is not required foractin depolymerization in pollen tubes. This confirmsour data suggesting one-way signaling from actin totubulin cytoskeleton.
Disruption of Microtubule Dynamics Does NotTrigger PCD
We previously demonstrated that actin depolymer-ization or stabilization can trigger PCD in pollen tubes
(Thomas et al., 2006). Because SI also stimulated ap-parent microtubule depolymerization, we wonderedwhether microtubule depolymerization might alsosignal to PCD. We investigated this using oryzalin todepolymerize, or taxol to stabilize, pollen tube micro-tubules. Pollen tubes were treated with 10 mM oryzalinor 5 mM taxol and extracts tested for caspase-3-likeactivity using Ac-DEVD-AMC, a caspase-3 substrate,which we have used previously (Bosch and Franklin-Tong, 2007; Li et al., 2007). Untreated pollen tube ex-tracts exhibited low DEVDase activity. The DEVDaseactivities in oryzalin- and taxol-treated pollen tubeextracts were not significantly different from the un-treated controls (P 5 0.9581 and 0.6286, respectively;n 5 4). Thus, microtubule depolymerization or stabi-lization alone clearly does not trigger PCD in Papaverpollen.
SI-Induced PCD Requires Depolymerization ofMicrotubules to Progress
Although changes in microtubule dynamics aloneare not sufficient to signal to PCD, we wonderedwhether tubulin depolymerization might be requiredin conjunction with actin depolymerization to allowprogression into SI-induced PCD. As microtubule de-polymerization accompanies actin depolymerization,this was an important point to establish. We investi-gated whether pollen tubes with stabilized micro-tubules prior to SI-induced actin depolymerizationaffected entry into PCD. Pollen tubes were pretreatedwith 5 mM taxol, SI was induced, and extracts were
Figure 6. Microtubule depolymerization does not trigger alterations tothe actin cytoskeleton. A and B, A 5-min treatment with 10 mM oryzalin.A, Apparent complete depolymerization of cortical microtubules. B,No apparent effect on F-actin organization. C and D, A 30-mintreatment with 10 mM oryzalin. C, Cortical microtubules are apparentlycompletely depolymerized. D, No apparent effect on F-actin organi-zation. Microtubules were detected with anti-a-tubulin; F-actin wascolocalized using rhodamine-phalloidin. Images are full projections.Scale bar 5 10 mm.
Figure 5. Actin stabilization by Jasp alleviates or delays SI-inducedapparent microtubule depolymerization (A). Typical untreated pollentube microtubule organization. B, Microtubule organization 30 minafter Jasp treatment. C, Microtubules were completely depolymerized10 min after SI. D, Microtubules were detectable after 30 min Jasppretreatment followed by 10 min SI induction. Microtubules weredetected with anti-a-tubulin. Images are full projections. Scale bar 510 mm.
Poulter et al.
1362 Plant Physiol. Vol. 146, 2008
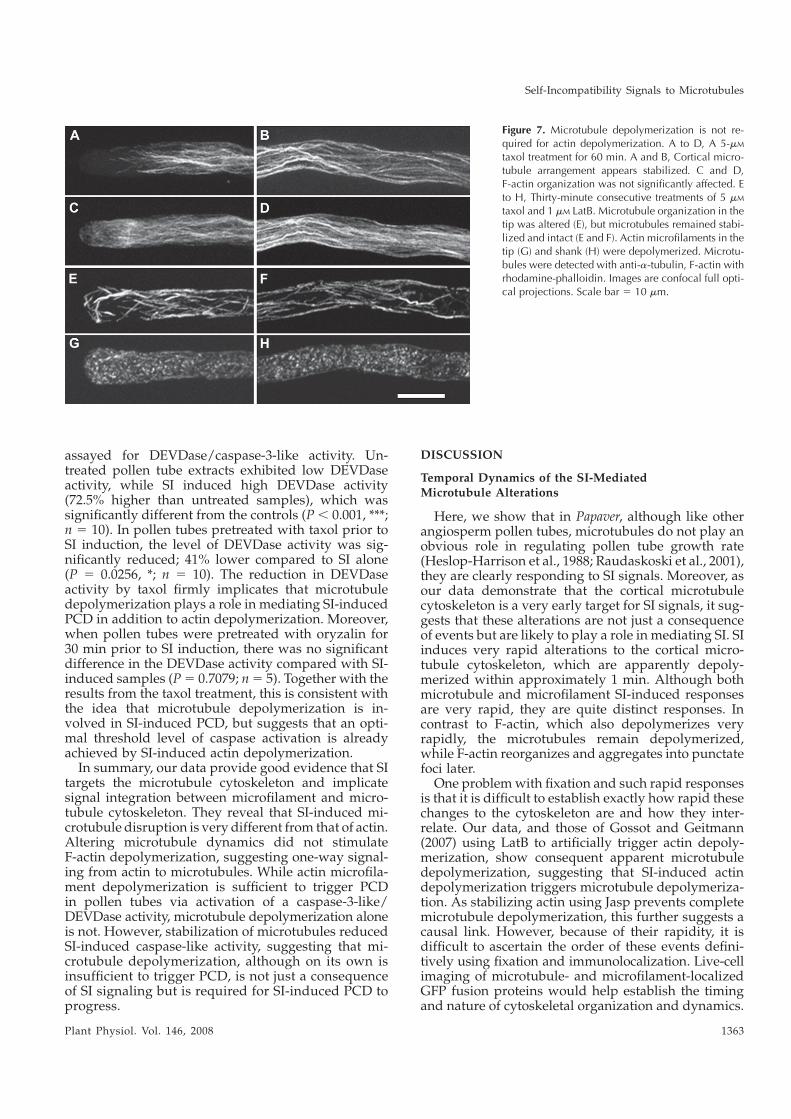
assayed for DEVDase/caspase-3-like activity. Un-treated pollen tube extracts exhibited low DEVDaseactivity, while SI induced high DEVDase activity(72.5% higher than untreated samples), which wassignificantly different from the controls (P, 0.001, ***;n 5 10). In pollen tubes pretreated with taxol prior toSI induction, the level of DEVDase activity was sig-nificantly reduced; 41% lower compared to SI alone(P 5 0.0256, *; n 5 10). The reduction in DEVDaseactivity by taxol firmly implicates that microtubuledepolymerization plays a role in mediating SI-inducedPCD in addition to actin depolymerization. Moreover,when pollen tubes were pretreated with oryzalin for30 min prior to SI induction, there was no significantdifference in the DEVDase activity compared with SI-induced samples (P5 0.7079; n5 5). Together with theresults from the taxol treatment, this is consistent withthe idea that microtubule depolymerization is in-volved in SI-induced PCD, but suggests that an opti-mal threshold level of caspase activation is alreadyachieved by SI-induced actin depolymerization.In summary, our data provide good evidence that SI
targets the microtubule cytoskeleton and implicatesignal integration between microfilament and micro-tubule cytoskeleton. They reveal that SI-induced mi-crotubule disruption is very different from that of actin.Altering microtubule dynamics did not stimulateF-actin depolymerization, suggesting one-way signal-ing from actin to microtubules. While actin microfila-ment depolymerization is sufficient to trigger PCDin pollen tubes via activation of a caspase-3-like/DEVDase activity, microtubule depolymerization aloneis not. However, stabilization of microtubules reducedSI-induced caspase-like activity, suggesting that mi-crotubule depolymerization, although on its own isinsufficient to trigger PCD, is not just a consequenceof SI signaling but is required for SI-induced PCD toprogress.
DISCUSSION
Temporal Dynamics of the SI-MediatedMicrotubule Alterations
Here, we show that in Papaver, although like otherangiosperm pollen tubes, microtubules do not play anobvious role in regulating pollen tube growth rate(Heslop-Harrison et al., 1988; Raudaskoski et al., 2001),they are clearly responding to SI signals. Moreover, asour data demonstrate that the cortical microtubulecytoskeleton is a very early target for SI signals, it sug-gests that these alterations are not just a consequenceof events but are likely to play a role in mediating SI. SIinduces very rapid alterations to the cortical micro-tubule cytoskeleton, which are apparently depoly-merized within approximately 1 min. Although bothmicrotubule and microfilament SI-induced responsesare very rapid, they are quite distinct responses. Incontrast to F-actin, which also depolymerizes veryrapidly, the microtubules remain depolymerized,while F-actin reorganizes and aggregates into punctatefoci later.
One problemwith fixation and such rapid responsesis that it is difficult to establish exactly how rapid thesechanges to the cytoskeleton are and how they inter-relate. Our data, and those of Gossot and Geitmann(2007) using LatB to artificially trigger actin depoly-merization, show consequent apparent microtubuledepolymerization, suggesting that SI-induced actindepolymerization triggers microtubule depolymeriza-tion. As stabilizing actin using Jasp prevents completemicrotubule depolymerization, this further suggests acausal link. However, because of their rapidity, it isdifficult to ascertain the order of these events defini-tively using fixation and immunolocalization. Live-cellimaging of microtubule- and microfilament-localizedGFP fusion proteins would help establish the timingand nature of cytoskeletal organization and dynamics.
Figure 7. Microtubule depolymerization is not re-quired for actin depolymerization. A to D, A 5-mM
taxol treatment for 60 min. A and B, Cortical micro-tubule arrangement appears stabilized. C and D,F-actin organization was not significantly affected. Eto H, Thirty-minute consecutive treatments of 5 mM
taxol and 1 mM LatB. Microtubule organization in thetip was altered (E), but microtubules remained stabi-lized and intact (E and F). Actin microfilaments in thetip (G) and shank (H) were depolymerized. Microtu-bules were detected with anti-a-tubulin, F-actin withrhodamine-phalloidin. Images are confocal full opti-cal projections. Scale bar 5 10 mm.
Self-Incompatibility Signals to Microtubules
Plant Physiol. Vol. 146, 2008 1363

This would aid elucidation of the relationship betweenthe actin and microtubule networks, especially duringthese early, rapid responses; we will address this infuture studies.
Signal-Mediated Cortical Microtubule
Reorganization/Depolymerization
Because cortical microtubules are intimately associ-ated with the plasma membrane, where numerousreceptors reside, they are implicated as targets of sig-naling networks (Gilroy and Trewavas, 2001;Wasteneysand Galway, 2003). Our data contribute to the evidencefor this, demonstrating that the Papaver pollen tubemicrotubules are an early target of the SI-signalingnetwork. Here, we have shown that a specific recom-binant protein stimulus, involved in a biologicallyrelevant phenomenon, has a very distinctive effect onpollen tube microtubules. The SI-induced apparentmicrotubule depolymerization response is extremelyrapid and dramatic, far more so than any physiologicalresponse previously reported in a plant cell, to ourknowledge.
Microtubule reorganization and/or apparent depo-lymerization occurs in response to specific abiotic stim-uli (Bartolo and Carter, 1991; Himmelspach et al., 1999;Shoji et al., 2006). Several examples of the microtubulecytoskeleton alterations in response to biotic stimuli,such as infection by pathogenic fungi or symbioticinteractions with mycorrhiza or rhizobia, exist (forreview, see Takemoto and Hardham, 2004). Theseinteractions generally involve reorganization and/orfocusing of the microtubule cytoskeleton around theinfecting organism. However, rapid apparent depoly-merization of microtubules has also been reported, forexample, in parsley (Petroselinum crispum)- and soy-bean (Glycine max)-Phytophthora interactions and inelicitor-treated tobacco (Nicotiana tabacum) cells (Grosset al., 1993; Binet et al., 2001; Cahill et al., 2002). Nodfactor signaling also stimulates rapid localized appar-ent depolymerization of microtubules in root hairs andlater increases in microtubule arrays (Timmers et al.,1999; Weerasinghe et al., 2003). Thus, biotic interac-tions involve specific alterations to the microtubulecytoskeleton (for review, see Takemoto and Hardham,2004). Our data provide evidence for signaling to themicrotubule cytoskeleton from another physiologi-cally relevant system.
Microtubule Depolymerization Plays a Functional Role
in SI-Mediated PCD
We previously showed that stabilizing F-actin usingJasp partially alleviates SI-induced PCD (Thomas et al.,2006) to about the same extent as taxol in this study.Although we did not know it at the time, actin depo-lymerization also stimulates microtubule depolymer-ization. Thus, our finding that stabilization of actin byJasp also partially stabilizes microtubules implicates arole for microtubule depolymerization in mediating
PCD. We provide a simple model outlining our under-standing of the cytoskeletal events triggered by SI inorder to clarify the relationship between microfila-ments and microtubules (Fig. 8). Although microtu-bules are rapidly depolymerized by SI induction,microtubule depolymerization alone does not triggerPCD in pollen tubes. This is in contrast to actin depo-lymerization, which plays a key role in initiating PCDin pollen (Thomas et al., 2006). Despite this, stabiliza-tion of microtubules using taxol alleviates SI-inducedPCD, suggesting that microtubules play a role in me-diating PCD.Microtubule depolymerization,whichweand others (Gossot and Geitmann, 2007) have shownoccurs as a consequence of actin depolymerization, iseffectively reduced by taxol.Aswe showhere that taxoldoes not inhibit pollen tube growth, SI-induced actindepolymerization should progress normally in thepresence of taxol. Thus, normal levels of SI-inducedcaspase induction should be triggered in the presenceof taxol if microtubules play no role and are depoly-merized merely as a consequence of SI-induced actindepolymerization. However, as taxol alleviates PCD,this clearly demonstrates that preventing microtubuledepolymerization is important for progression of PCD(Fig. 8). This strongly suggests that the microtubulesare not just onlookers, but that they play a role inmediating caspase activation.
Microtubule reorganization triggered by pathogeninfection hints at a possible microtubule involvementin PCD in plant cells. Our data are consistent with amodel whereby microtubules, in concert with actin,somehow play a functional role in integrating signalsinvolved in regulating PCD. However, a direct con-nection between microtubule reorganization and trig-gering of PCD remains to be elucidated.
Notably, the GC spindle-shaped microtubules werenot dramatically affected by SI and remained relativelyintact for a considerable time; these microtubulesshowed signs of disintegration but were still apparentat 60min post-SI. This suggests that either the SI signalsare specifically targeted to the cortical microtubulesand/or that the GC-associatedmicrotubule populationis protected. Thus, it is the cortical microtubule popu-lation that is primarily affected and participates in thisresponse. Interestingly, theGCappears to be a target forcaspase-3-like/DEVDase activity 2 to 3 h after SI in-duction (Bosch and Franklin-Tong, 2007).
Evidence for Cross Talk between Actin and Tubulin
It is evident from our data that there is cross talkbetween microfilaments and microtubules in pollentubes during SI. We have shown that SI triggers bothactin depolymerization (Snowman et al., 2002) andapparent microtubule depolymerization. Moreover,depolymerizing actin with LatB triggers microtubuledepolymerization,while depolymerizingmicrotubuleswith oryzalin has no effect on actin organization, as alsopreviously shownbyGossot andGeitmann (2007). Thissuggests the actin depolymerization triggers microtu-
Poulter et al.
1364 Plant Physiol. Vol. 146, 2008

bule depolymerization, but not vice versa, providingevidence for one-way signaling between these two cy-toskeletal components in pollen tubes. As actin sta-bilization by Jasp delays or prevents microtubuledepolymerization, this further suggests that actin in-fluences microtubule polymerization status (Fig. 8).Microtubules and actin microfilaments are often
closely associated; in animal and yeast cells, there isno question that actin microfilament and microtubulecytoskeletons interact, and there is substantial evi-dence that this is also the case in plant cells. Forexample, transverse cortical microtubules and micro-filaments in diffusely elongating cells can influenceeach other’s organization (Collings and Allen, 2000).Drug-induced microtubule disassembly in Characeaninternodal cells (Foissner and Wasteneys, 2000) androot hairs (Tominaga et al., 1997) exacerbate the effectsof actin-targeted drugs, suggesting that microtubuledynamics can influence actin dynamics. In fern cells(Kadota and Wada, 1992; Collings et al., 2006) andpollen tubes (Gossot and Geitmann, 2007), actin-depolymerizing drugs affect cortical microtubules.Thus, there is good evidence for signaling and inter-play between microtubules and microfilaments, butthe direction of the signaling varies. In SI, both actindepolymerization (Thomas et al., 2006) and microtu-bule depolymerization play a role in PCD, providingevidence for an integrated signaling network betweenthese components.Emerging data are beginning to provide some clues
about how interactions between actin and tubulin areachieved. Identification of proteins bridging theseinteractions has confirmed functional interactions be-tween microtubules and microfilaments in animalsand fungi (for review, see Goode et al., 2000). In plants,proteins that interact with both microtubules and actinmicrofilaments are beginning to be identified (Igarashiet al., 2000; Preuss et al., 2004; Huang et al., 2007),providing the first firm evidence for how these two
dynamic cytoskeletal components are linked in plantcells. There is clearly much remaining to be exploredin the future, and the SI-induced responses reportedhere appear to represent an excellent model system inwhich to examine interactions between microtubulesand microfilaments.
MATERIALS AND METHODS
Pollen Treatments
Pollen of Papaver rhoeas was germinated and grown in vitro in liquid
germination medium [0.01% H3BO3, 0.01% KNO3, 0.01% Mg(NO3)2.6H2O,
0.036% CaCl2-2H2O, and 13.5% Suc] as described previously (Snowman et al.,
2002) at 25�C. Pollen was grown for 1 h before any treatments were applied.
For SI treatments, recombinant proteins were produced by cloning the
nucleotide sequences specifying the mature peptide of the S1, S3, and S8 alleles
of the S gene (pPRS100, pPRS300, and pPRS800) into the expression vector
pMS119 as described previously (Foote et al., 1994). Expression and purifica-
tion of the proteins was performed as described by Kakeda et al. (1998). SI was
induced by adding recombinant S proteins (final concentration 10 mg mL21) to
pollen that had been grown for 1 h in vitro (Snowman et al., 2002).
For the cytoskeleton drug treatments, 1 mM LatB, 0.5 mM Jasp (Calbiochem),
5 or 10 mM taxol, or 10 mM oryzalin (Sigma-Aldrich) was added to pollen tubes
grown for 1 h. Controls comprised addition of dimethyl sulfoxide at a final
concentration of 0.1% (v/v). For the drug-SI experiments, pollen tubes were
subjected to a consecutive treatment of the relevant drug for 30 min, followed
by the addition of incompatible S proteins for 5 h.
Immunolocalization
Pollen tubes were prefixed using the cross-linker 3-maleimodobenzoic acid
N-hydroxysuccinimide ester (MBS; 400 mM; Pierce) for 6 min at 20oC, followed
by 2% formaldehyde (1 h, 4�C), as described by Thomas et al. (2006); we used
2% formaldehyde as a compromise. Actin preservation was indistinguishable
from what we previously obtained using 4% formaldehyde following MBS
(Geitmann et al., 2000). MBS has been reported to stop cytoplasmic streaming
within seconds (Ketelaar and Emons, 2001). The treatment times indicated in
the text are the time point after treatment that MBS was added. Cells were
washed in actin-stabilizing buffer (100 mM PIPES, pH 6.8, 1 mM MgCl2, 1 mM
CaCl2, 75 mM KCl) then in MES buffer (15 mM MES, pH 5.0), then incubated in
0.05% cellulose, 0.05% macerozyme in MES buffer containing 0.1 mM phenyl-
methylsulfonyl fluoride and 1% bovine serum albumin for 10 min. Washes in
MES, then Tris-buffered saline (TBS), were followed by permeabilization in
Figure 8. Model for integration of cytoskeletal events triggered by SI. SI triggers actin depolymerization, which is sufficient totrigger caspase activation and PCD (Thomas et al., 2006). LatB causes actin depolymerization, caspase activation, and PCD(Thomas et al., 2006). Treatment with Jasp after SI induction alleviated the extent of PCD (Thomas et al., 2006). Thus, partialprevention of actin depolymerization gives some protection from PCD. SI also triggers microtubule depolymerization (this study).Use of LatB showed that actin depolymerization also triggers microtubule depolymerization (Gossot and Geitmann, 2007; thisstudy). This suggests that during SI, microtubule depolymerization is a consequence of actin depolymerization. Use of oryzalinshowed that microtubule depolymerization on its own is not sufficient to trigger caspase activation and PCD (this study). Thisraises the question of whether microtubule depolymerization is actually required for PCD, or whether it is just a consequence ofactin depolymerization. Use of taxol, which alleviated the extent of PCD, showed that preventing microtubule depolymerizationis somehow involved in regulating PCD (this study). This implicates a functional role for both actin and tubulin in signalingto PCD.
Self-Incompatibility Signals to Microtubules
Plant Physiol. Vol. 146, 2008 1365
0.1% Triton X-100/TBS for 10 min, and blocking in TBS/1% bovine serum
albumin for 30 min.
Samples were incubated with anti-a-tubulin antibody (clone B-5-1-2;
Sigma-Aldrich; 1:1,000 dilution) overnight at 4�C. They were washed in
TBS, then incubated for 1.5 h at room temperature in anti-mouse fluorescein
isothiocyanate antibody (1:300 dilution). Following TBS washes, rhodamine-
phalloidin (66 nM) was added. Pollen tubes were mounted with 5 mL of
Vectashield (Vector Laboratories). Images were collected using a Bio-Rad
Radiance 2000 laser-scanning system (50-mW argon laser, 488-nm line, and
1.5-mW HeNe laser, 543 nm) with a 603 plan-Apo 1.4 NA oil objective
(Nikon). z-Series of 0.5-mm optical slices were captured. Images were ana-
lyzed using ImageJ and archived as TIF files.
Protein Extraction and Western Blotting
SI was induced and pollen tubes collected by centrifugation in HEPES
buffer (50 mMHEPES, pH 7.4, 10 mMNaCl, 0.1% CHAPS, 10mM dithiothreitol,
1 mM EDTA, 10% glycerol) and samples snap-frozen in liquid N2. Proteins
were extracted by sonication (2 3 10 s, 10 amps) and analyzed using SDS-
PAGE and western blotting. Samples were measured using the Bio-Rad
protein assay; equal amounts were loaded and checked by Ponceau staining of
blots. Blots were probed with a 1:4,000 dilution of the monoclonal anti-
a-tubulin antibody clone B-5-1-2 (Sigma-Aldrich), then probed with an anti-
mouse alkaline phosphatase secondary antibody and detected using alkaline
phosphatase.
Pollen Tube Length Measurements
Pollen tubes were grown for 1 h, then samples were treated as specified in
the text, and pollen tubes fixed in 2% formaldehyde for 1 h, washed in TBS,
and mounted on glass slides. Thus, before treatment, all mean pollen tube
lengths were similar. Fixed pollen tubes were imaged using a Nikon Eclipse
TE-300 microscope attached to a SenSys camera, using a Quips PathVysion
image analysis system (Applied Imaging International). Final pollen tube
lengths were measured (40 tubes for each of three independent treatments)
using IPlab software. Lengths indicated are total lengths of the pollen tubes
(i.e. 1 h pretreatment time plus treatment time with the relevant drug).
Statistical analysis comprised a t test analysis.
Caspase Assays
PCD was assessed using a fluorogenic caspase-3/7-amino-4-trifluoro-
methyl coumarin substrate, Ac-DEVD-AMC, to measure caspase-like activity.
Pollen tubes were subjected to treatments for 5 h and protein extracts made by
grinding and sonicating pollen tubes in caspase extraction buffer (50 mM
sodium acetate, 10 mM L-Cys, 10% [v/v] glycerol, and 0.1% [w/v] CHAPS, pH
6.0). Assays containing 10 mg of protein extract at 1 mg mL21 and 50 mM
substrate were performed in caspase extraction buffer, pH 5.0. Release of
fluorophore by cleavage was measured (excitation 380 nm, emission 460 nm)
using a FLUOstar OPTIMA reader (BMG Labtechnologies) at 27�C for 5 h.
Background relative fluorescent unit readings for control samples were
subtracted from test samples. All assays were performed on at least four
independent samples, each measured in duplicate. P values were calculated
using a two-way ANOVA.
ACKNOWLEDGMENTS
We thank the horticultural staff for growing the plants and helping har-
vest material. Thanks to Tobias Baskin for helpful advice on tubulin anti-
bodies, and to Harpal Pooni and Mike Kearsey for statistical advice.
Received August 8, 2007; accepted December 15, 2007; published January 11,
2008.
LITERATURE CITED
Anderhag P, Hepler PK, Lazzaro MD (2000) Microtubules and microfila-
ments are both responsible for pollen tube elongation in the conifer Picea
abies. Protoplasma 214: 141–157
Astrom H, Sorri O, Raudaskoski M (1995) Role of microtubules in the
movement of the vegetative nucleus and generative cell in tobacco
pollen tubes. Sex Plant Reprod 8: 61–69
Bartolo ME, Carter JV (1991) Microtubules in mesophyll cells of non-
acclimated and cold-acclimated spinach: visualization and responses to
freezing, low temperature, and dehydration. Plant Physiol 97: 175–181
Baskin TI, Wilson JE, Cork A, Williamson RE (1994) Morphology and
microtubule organization in Arabidopsis roots exposed to oryzalin or
taxol. Plant Cell Physiol 35: 935–942
Bibikova TN, Blancaflor EB, Gilroy S (1999) Microtubules regulate tip
growth and orientation in root hairs of Arabidopsis thaliana. Plant J 17:
657–665
Binet MN, Humbert C, Lecourieux D, Vantard M, Pugin A (2001) Dis-
ruption of microtubular cytoskeleton induced by cryptogein, an elicitor
of hypersensitive response in tobacco cells. Plant Physiol 125: 564–572
Blagosklonny MV, Fojo T (1999) Molecular effects of paclitaxel: myths and
reality (a critical review). Int J Cancer 83: 151–156
Bosch M, Franklin-Tong VE (2007) Temporal and spatial activation of
caspase-like enzymes induced by self-incompatibility in Papaver pollen.
Proc Natl Acad Sci USA 104: 18327–18332
Cahill D, Rookes J, Michalczyk A, McDonald K, Drake A (2002) Micro-
tubule dynamics in compatible and incompatible interactions of soy-
bean hypocotyl cells with Phytophthora sojae. Plant Pathol 51: 629–640
Cai G, Cresti M (2006) The microtubule cytoskeleton in pollen tubes:
structure and role in organelle trafficking. In R Malho, ed, The Pollen
Tube: A Cellular and Molecular Perspective. Plant Cell Monographs.
Springer, Berlin/Heidelberg, pp 157–175
Collings D, Allen NS (2000) Cortical actin interacts with the plasma
membrane and microtubules. In FB CJ Staiger, D Volkmann, PW Barlow,
eds, Actin: A Dynamic Framework for Multiple Plant Cell Functions.
Kluwer Academic, Dordrecht, The Netherlands, pp 145–164
Collings DA, Asada T, Allen NS, Shibaoka H (1998) Plasma membrane-
associated actin in bright yellow 2 tobacco cells. Evidence for interaction
with microtubules. Plant Physiol 118: 917–928
Collings DA, Lill AW, Himmelspach R, Wasteneys GO (2006) Hy-
persensitivity to cytoskeletal antagonists demonstrates microtubule-
microfilament cross-talk in the control of root elongation in Arabidopsis
thaliana. New Phytol 170: 275–290
de Graaf BHJ, Rudd JJ, Wheeler MJ, Perry RM, Bell EM, Osman K,
Franklin FCH, Franklin-Tong VE (2006) Self-incompatibility in Papaver
targets soluble inorganic pyrophosphatases in pollen. Nature 444:
490–493
Erhardt DW, Shaw SL (2006) Microtubule dynamics and organization in
plant cortical array. Annu Rev Plant Biol 57: 859–875
Foissner I, Wasteneys GO (2000) Microtubule disassembly enhances
reversible cytochalasin-dependent disruption of actin bundles in char-
acean internodes. Protoplasma 214: 33–44
Foote HCC, Ride JP, Franklin-Tong VE, Walker EA, Lawrence MJ,
Franklin FCH (1994) Cloning and expression of a distinctive class of
self-incompatibility (S) gene from Papaver rhoeas L. Proc Natl Acad Sci
USA 91: 2265–2269
Franklin-Tong VE, Ride JP, Read ND, Trewavas AJ, Franklin FCH (1993)
The self-incompatibility response in Papaver rhoeas is mediated by
cytosolic-free calcium. Plant J 4: 163–177
Geitmann A, Snowman BN, Emons AMC, Franklin-Tong VE (2000)
Alterations in the actin cytoskeleton of pollen tubes are induced by
the self-incompatibility reaction in Papaver rhoeas. Plant Cell 12:
1239–1251
Gibbon BC, Kovar DR, Staiger CJ (1999) Latrunculin B has different effects
on pollen germination and tube growth. Plant Cell 11: 2349–2363
Gilroy S, Trewavas A (2001) Signal processing and transduction in plant
cells: the end of the beginning? Nat Rev Mol Cell Biol 2: 307–314
Goode BL, Drubin DG, Barnes G (2000) Functional cooperation between
the microtubule and actin cytoskeletons. Curr Opin Cell Biol 12: 63–71
Gossot O, Geitmann A (2007) Pollen tube growth: coping with mechanical
obstacles involves the cytoskeleton. Planta 226: 405–416
Gross P, Julius C, Schmeltzer E, Hahlbrock K (1993) Translocation of
cytoplasm and nucleus to fungal penetration sites is associated with
depolymerisation of microtubules and defense gene activation in
infected, cultured parsley cells. EMBO J 12: 1735–1744
Heslop-Harrison J, Heslop-Harrison Y, Cresti M, Tiezzi A, Moscatelli A
(1988) Cytoskeletal elements, cell shaping and movement in the angio-
sperm pollen tube. J Cell Sci 91: 49–60
Poulter et al.
1366 Plant Physiol. Vol. 146, 2008
Himmelspach R, Wymer CL, Lloyd CW, Nick P (1999) Gravity-induced
reorientation of cortical microtubules observed in vivo. Plant J 18: 449–453
Huang S, Jin L, Du J, Li H, Zhao Q, Ou G, Ao G, Yuan M (2007) SB401, a
pollen-specific protein from Solanum berthaultii, binds to and bundles
microtubules and F-actin. Plant J 51: 406–418
Hussey PJ, Ketelaar T, Deeks MJ (2006) Control of the actin cytoskeleton in
plant cell growth. Annu Rev Plant Biol 57: 109–125
Igarashi H, Orii H, Mori H, Shimmen T, Sonobe S (2000) Isolation of a
Novel 190 kDa Protein from tobacco BY-2 cells: possible involvement in
the interaction between actin filaments and microtubules. Plant Cell
Physiol 41: 920–931
Kadota A, Wada M (1992) The circular arrangement of cortical microtubule
around the subapex of tip growing fern protonemata is sensitive to
cytochalasin B. Plant Cell Physiol 33: 99–102
Kakeda K, Jordan ND, Conner A, Ride JP, Franklin-Tong VE, Franklin
FCH (1998) Identification of residues in a hydrophilic loop of the Papaver
rhoeas S protein that play a crucial role in recognition of incompatible
pollen. Plant Cell 10: 1723–1731
Ketelaar T, Emons AMC (2001) The cytoskeleton in plant cell growth:
lessons from root hairs. New Phytol 152: 409–418
Laitiainen E, Nieminen KM, Vihinen H, Raudaskoski M (2002) Move-
ment of generative cell and vegetative nucleus in tobacco pollen tubes is
dependent on microtubule cytoskeleton but independent of the synthe-
sis of callose plugs. Sex Plant Reprod 15: 195–204
Li S, Samaj J, Franklin-Tong VE (2007) A mitogen-activated protein kinase
signals to programmed cell death induced by self-incompatibility in
Papaver pollen. Plant Physiol 145: 236–245
McClure B, Franklin-Tong V (2006) Gametophytic self-incompatibility:
understanding the cellular mechanisms involved in ‘‘self’’ pollen tube
inhibition. Planta 224: 233–245
Preuss ML, Kovar DR, Lee YRJ, Staiger CJ, Delmer DP, Liu B (2004) A
plant-specific kinesin binds to actin microfilaments and interacts with
cortical microtubules in cotton fibers. Plant Physiol 136: 3945–3955
Raudaskoski M, Astrom H, Laitiainen E (2001) Pollen tube cytoskeleton:
structure and function. J Plant Growth Regul 20: 113–130
Rudd JJ, Franklin FCH, Lord JM, Franklin-Tong VE (1996) Increased
phosphorylation of a 26-kD pollen protein is induced by the self-
incompatibility response in Papaver rhoeas. Plant Cell 8: 713–724
Shibaoka H (1994) Plant hormone-induced changes in the orientation of
cortical microtubules: alterations in the cross-linking between microtu-
bules and the plasma membrane. Annu Rev Plant Physiol Plant Mol Biol
45: 527–544
Shoji T, Suzuki K, Abe T, Kaneko Y, Shi H, Zhu JK, Rus A, Hasegawa PM,
Hashimoto T (2006) Salt stress affects cortical microtubule organization
and helical growth in Arabidopsis. Plant Cell Physiol 47: 1158–1168
Smith LG, Oppenheimer DG (2005) Spatial control of cell expansion by the
plant cytoskeleton. Annu Rev Cell Dev Biol 21: 271–295
Snowman BN, Kovar DR, Shevchenko G, Franklin-Tong VE, Staiger CJ
(2002) Signal-mediated depolymerization of actin in pollen during the
self-incompatibility response. Plant Cell 14: 2613–2626
Staiger CJ (2000) Signalling to the actin cytoskeleton in plants. Annu Rev
Plant Physiol Plant Mol Biol 51: 257–288
Takayama S, Isogai A (2005) Self-incompatibility in plants. Annu Rev Plant
Biol 56: 467–489
Takemoto D, Hardham AR (2004) The cytoskeleton as a regulator and
target of biotic interactions in plants. Plant Physiol 136: 3864–3876
Thomas SG, Franklin-Tong VE (2004) Self-incompatibility triggers
programmed cell death in Papaver pollen. Nature 429: 305–309
Thomas SG, Huang S, Li S, Staiger CJ, Franklin-Tong VE (2006) Actin
depolymerization is sufficient to induce programmed cell death in self-
incompatible pollen. J Cell Biol 174: 221–229
Timmers ACJ, Auriac MC, Truchet G (1999) Redefined analysis of early
symbiotic steps of the Rhizobium-Medicago interaction in relationship
with microtubule cytoskeleton rearrangements. Development 126:
3617–3628
Tominaga M, Morita K, Sonobe S, Yokota E, Shimmen T (1997) Microtu-
bules regulate the organization of actin filaments at the cortical region in
root hair cells of Hydrocharis. Protoplasma 199: 83–92
van Doorn WG, Woltering EJ (2005) Many ways to exit? Cell death
categories in plants. Trends Plant Sci 10: 117–122
Wasteneys GO, Galway ME (2003) Remodelling the cytoskeleton for
growth and form: an overview with some new views. Annu Rev Plant
Biol 54: 691–722
Weerasinghe RR, Collings DA, Johannes E, Allen NS (2003) The distri-
butional changes and role of microtubules in Nod factor challenged
Medicago sativa root hairs. Planta 218: 276–287
Self-Incompatibility Signals to Microtubules
Plant Physiol. Vol. 146, 2008 1367

Wheeler M. J., De Graaf B. H. J., Hadjiosif N., Perry R. M., Poulter N. S., Osman K.,
Vatovec S., Harper A., Franklin F. C. H. and Franklin-Tong V. E. (2009)
Identification of the pollen self-incompatibility determinant in Papaver rhoeas.
Nature, 459: 992-995.
My contribution: I analysed the predicted transmembrane structure of the PrpS
protein using various prediction programmes (supplementary Figure 2) and
demonstrated, using western ligand-blotting, that a predicted extracellular domain
interacts in an S-specific manner with the stigmatic PrsS protein (Figure 2e). I proof-
read the manuscript.
LETTERS
Identification of the pollen self-incompatibilitydeterminant in Papaver rhoeasMichael J. Wheeler1*{, Barend H. J. de Graaf1*{, Natalie Hadjiosif1*, Ruth M. Perry1, Natalie S. Poulter1,Kim Osman1, Sabina Vatovec1, Andrea Harper1, F. Christopher H. Franklin1 & Vernonica E. Franklin-Tong1
Higher plants produce seed through pollination, using specificinteractions between pollen and pistil. Self-incompatibility is animportantmechanismused inmany species to prevent inbreeding;it is controlled by a multi-allelic S locus1,2. ‘Self’ (incompatible)pollen is discriminated from ‘non-self’ (compatible) pollen byinteraction of pollen and pistil S locus components, and is subse-quently inhibited. In Papaver rhoeas, the pistil S locus product is a
the pollen component of the S locus on a cosmid clone comprising a42-kilobase (kb) region at the S1 locus.
Nucleotide sequencing and analysis identified a novel putativeopen reading frame (ORF) 457 base pairs (bp) from the S1 pistil gene(Fig. 1a). Expression analysis using polymerase chain reaction withreverse transcription (RT–PCR) revealed that the ORF was specifi-cally transcribed in pollen (Fig. 1b), appearing during anther
doi:10.1038/nature08027

Bosch M., Poulter N. S., Vatovec S. and Franklin-Tong V. E. 2008. Initiation of
programmed cell death in self-incompatibility: role for cytoskeleton modifications
and several caspase-like activities. Molecular Plant, 1: 879-887.
My contribution: This paper was a review. Noni Franklin-Tong, Maurice Bosch and
Natalie Poulter mainly wrote the manuscript. I proof-read the manuscript.
Molecular Plant • Volume 1 • Number 6 • Pages 879–887 • November 2008 REVIEW ARTICLE
Initiation of Programmed Cell Death inSelf-Incompatibility: Role for CytoskeletonModifications and Several Caspase-Like Activities
Maurice Boscha,b, Natalie S. Poultera, Sabina Vatoveca and Vernonica E. Franklin-Tonga,1
a School of Biosciences, University of Birmingham, Edgbaston, Birmingham. B15 2TT, UKb Present address: Institute of Biological, Environmental and Rural Sciences (IBERS), Aberystwyth University, Plas Gogerddan, Aberystwyth SY23 3EB, UK
ABSTRACT Programmed cell death (PCD) is an important and universal process regulating precise death of unwanted cells
in eukaryotes. In plants, the existence of PCD has been firmly established for about a decade, and many components
shown to be involved in apoptosis/PCD in mammalian systems are found in plant cells undergoing PCD. Here, we review
work from our lab demonstrating the involvement of PCD in the self-incompatibility response in Papaver rhoeas pollen.
This utilization of PCD as a consequence of a specific pollen–pistil interaction provides a very neat way to destroy un-
wanted ‘self’, but not ‘non-self’ pollen. We discuss recent data providing evidence for SI-induced activation of several
caspase-like activities and suggest that an acidification of the cytosol may be a key turning point in the activation of
caspase-like proteases executing PCD. We also review data showing the involvement of the actin and microtubule cytos-
keletons as well as that of a MAPK in signalling to caspase-mediated PCD. Potential links between these various compo-
nents in signalling to PCD are discussed. Together, this begins to build a picture of PCD in a single cell system, triggered by
a receptor–ligand interaction.
Wheeler M. J., Vatovec S. and Franklin-Tong V. E. (2010) The pollen S-determinant
in Papaver: comparisons with known plant receptors and protein ligand partners.
Journal of Experimental Botany, 61: 2015-2025.
My contribution: This paper was a review containing some original data. I
contributed original data demonstrating S-specific PrpS-PrsS binding using western
ligand blotting (Figure 3). I also organized data into Figure 3 and wrote the figure
legend. I did the proof-reading of the manuscript.

Journal of Experimental Botany, Vol. 61, No. 7, pp. 2015–2025, 2010doi:10.1093/jxb/erp383 Advance Access publication 22 January, 2010
REVIEW PAPER
The pollen S-determinant in Papaver: comparisons withknown plant receptors and protein ligand partners
Michael J. Wheeler†, Sabina Vatovec and Vernonica E. Franklin-Tong*
School of Biosciences, University of Birmingham, Edgbaston, Birmingham B15 2TT, UK
y Present address: Warwick HRI, Wellesbourne, Warwick CV35 9EF, UK.* To whom correspondence should be addressed: E-mail: [email protected]
Received 5 November 2009; Revised 8 December 2009; Accepted 9 December 2009
Abstract
Cell–cell communication is vital to multicellular organisms and much of it is controlled by the interactions of
secreted protein ligands (or other molecules) with cell surface receptors. In plants, receptor–ligand interactions areknown to control phenomena as diverse as floral abscission, shoot apical meristem maintenance, wound response,
and self-incompatibility (SI). SI, in which ‘self’ (incompatible) pollen is rejected, is a classic cell–cell recognition
system. Genetic control of SI is maintained by an S-locus, in which male (pollen) and female (pistil) S-determinants
are encoded. In Papaver rhoeas, PrsS proteins encoded by the pistil S-determinant interact with incompatible pollen
to effect inhibition of pollen growth via a Ca2+-dependent signalling network, resulting in programmed cell death of
‘self’ pollen. Recent studies are described here that identified and characterized the pollen S-determinant of SI in P.
rhoeas. Cloning of three alleles of a highly polymorphic pollen-expressed gene, PrpS, which is linked to pistil-
expressed PrsS revealed that PrpS encodes a novel ;20 kDa transmembrane protein. Use of antisenseoligodeoxynucleotides provided data showing that PrpS functions in SI and is the pollen S-determinant.
Identification of PrpS represents a milestone in the SI field. The nature of PrpS suggests that it belongs to a novel
class of ‘receptor’ proteins. This opens up new questions about plant ‘receptor’–ligand pairs, and PrpS-PrsS have
been examined in the light of what is known about other receptors and their protein–ligand pairs in plants.
Key words: Cell–cell recognition, Papaver rhoeas, pollen S-determinant, pollen tube inhibition, PrpS, receptor,
self-incompatibility, self-recognition.
at University of B
irmingham
on May 18, 2011
jxb.oxfordjournals.orgD
ownloaded from

De Graaf B.H.J.*, Vatovec S.*, Juárez-Díaz J.A.*, Zou H., Chai L., Kooblall K., Forbes T.,
Wilkins K.A., Franklin F.C.H. and Franklin-Tong V.E.
The Papaver self-incompatibility pollen S-determinant, PrpS, functions in Arabidopsis
thaliana.
* - these authors contributed equally to this work
My contribution:
Barend de Graaf initiated the project, contributed the original idea for the manuscript,
produced A.thaliana transgenic line expressing PrpS1-GFP, carried out the experiments
presented on Figure 1 and wrote the manuscript. Javier Juarez-Diaz helped me with the RT-
PCR experiments (Figure 1 e), helped with preparation of samples for actin confocal
imaging (Figure 3 a-j) and helped with the discussions for the manuscript. Huawen Zou
produced A.thaliana transgenic line expressing PrpS3-GFP. Katie Wilkins carried out
imaging of pollen on the confocal microscope (Figure 3 a-j) and Lijun Chai prepared
samples and analysed the actin cytoskeleton of the PrpS3 expressing pollen (Figure 3 l).
Kreepa Kooblall and Tom Forbes were the project students under my supervision. Kreepa
Kooblall started the initial pollen tube inhibition studies on transgenic A.thaliana pollen
expressing PrpS1-GFP, while Tom Forbes started the initial actin cytoskeleton analysis in
transgenic A.thaliana expressing PrpS1-GFP. Chris Franklin contributed with counsel and
discussions during the project. Noni Franklin-Tong managed the project, provided the
guidance, wrote the paper and is the corresponding author.
I carried out the RT-PCR and segregation analysis of the transgenic A.thaliana lines (Figure
1 e), I carried out the experiment and statistical analysis of pollen tube inhibition of PrpS1
and PrpS3 expressing pollen (Figure 2) and pollen viability of PrpS1 and PrpS3 expressing

pollen (Figure 4 a-e). I produced samples for the confocal imaging of the actin cytoskeleton
(Figure 3 a-j) and carried out the epifluorescence imaging, analysis and statistics of the
actin cytoskeleton of the PrpS1 expressing pollen (Figure 3 k). I proof-read the manuscript.

Current Biology 22, 154–159, January 24, 2012 ª2012 Elsevier Ltd All rights reserved DOI 10.1016/j.cub.2011.12.006
The Papaver Self-IncompatibilityPollen S-Determinant, PrpS,Functions in Arabidopsis thaliana
Barend H.J. de Graaf,1,2,5 Sabina Vatovec,1,5
Javier Andres Juarez-Dıaz,1,5 Lijun Chai,1 KreepaKooblall,1,3
Katie A. Wilkins,1 Huawen Zou,1,4 Thomas Forbes,1
F. Christopher H. Franklin,1,6
and Vernonica E. Franklin-Tong1,6,*1School of Biosciences, University of Birmingham, Edgbaston,Birmingham B15 2TT, UK
Summary
Many angiosperms use specific interactions betweenpollen and pistil proteins as ‘‘self’’ recognition and/or rejec-
tion mechanisms to prevent self-fertilization. Self-incom-patibility (SI) is encoded by a multiallelic S locus, com-
prising pollen and pistil S-determinants [1, 2]. In Papaverrhoeas, cognate pistil and pollen S-determinants, PrpS,
a pollen-expressed transmembrane protein, and PrsS,a pistil-expressed secreted protein [3, 4], interact to trig-
ger a Ca2+-dependent signaling network [5–10], resultingin inhibition of pollen tube growth, cytoskeletal alterations
[11–13], and programmed cell death (PCD) [14, 15] inincompatible pollen. We introduced the PrpS gene into
Arabidopsis thaliana, a self-compatible model plant. Expos-ing transgenic A. thaliana pollen to recombinant Papaver
PrsS protein triggered remarkably similar responses tothose observed in incompatible Papaver pollen: S-specific
inhibition and hallmark features of Papaver SI [11–15]. Our
findings demonstrate that Papaver PrpS is functional ina species with no SI system that diverged w140 million
years ago [16]. This suggests that the Papaver SI systemuses cellular targets that are, perhaps, common to all eudi-
cots and that endogenous signaling components can berecruited to elicit a response that most likely never oper-
ated in this species. This will be of interest to biologistsinterested in the evolution of signaling networks in higher
plants.
expression was observed (n = 300)vidual plants was analyzed, pollen s100% for GFP-expression (n = 2,0consistent with them being hemizythe insert; untransformed Col-0 polcence (Figure 1C). PrpS-GFP localizplasma membrane in pollen tubesshown in Papaver pollen [4]. Exprestransgenes in these lines was cotranscripts were not detected in un(Figure 1E).
Expression of PrpS-GFP Is Sufficie
Induced S-Specific Inhibition of AtPTo determine whether PrpS was funadapted the in vitro self-incompatibused for Papaver SI [3]. Transgenic pAtPpS3 was grown in vitro and recproteins added. If PrpS functionssignaling network in Arabidopsis,trigger S-specific pollen inhibition inGFP. We tested whether this was t1G). Recombinant PrsS1 did not affetion but reduced pollen germinationpollen by 42% (n = 300). When only passessed after addition of PrsS1, nogerminated (Figures 1F and 1G, ***pcorrelation of GFP expression and pdemonstrates that PrsS1 inhibits APrpS1-GFP. This suggests that eArabidopsis pollen is sufficient togermination by PrsS1. Using Papahaplotype S1S8) confirmed that Prure 1F). Addition of PrsS1 partially r0.022, n = 300), addition of both Pcomplete inhibition (p = 0.009, n = 3We next tested lines AtPpS1 and
PrpS-GFP expression for S-specific