Embed Size (px)
Citation preview
Investigating structure-function relationships of dough stickiness
within low sodium bread dough formulations
A Thesis Submitted to the College of
Graduate and Postdoctoral Studies
in Partial Fulfillment of the Requirements
for the Degree of Doctor of Philosophy
in the Department of Food and Bioproduct Sciences
University of Saskatchewan
Saskatoon
By
Nicole A. Avramenko
September 2017
© Copyright Nicole A. Avramenko, September 2017. All rights reserved.

i
PERMISSION TO USE
In presenting this thesis in partial fulfillment of the requirements for a Postgraduate
degree from the University of Saskatchewan, I agree that the Libraries of this University may
make it freely available for inspection. I further agree that permission for copying of this thesis
in any manner, in whole or in part, for scholarly purposes may be granted by the professor or
professors who supervised my thesis work or, in their absence, by the Head of the Department or
the Dean of the College in which my thesis work was done. It is understood that any copying,
publication, or use of this thesis or parts thereof for financial gain shall not be allowed without
my written permission. It is also understood that due recognition shall be given to me and to the
University of Saskatchewan in any scholarly use which may be made of any material in my
thesis.
Requests for permission to copy or to make other use of material in this thesis in whole or
part should be addressed to:
Head
Department of Food and Bioproduct Sciences
University of Saskatchewan
Saskatoon, Saskatchewan
Canada S7N 5A8

ii
ABSTRACT
The overarching goal of this research was to gain a greater understanding of the
underlying structure-function relationships leading to the sticky dough phenomenon when
sodium chloride is reduced in bread dough formulations. The primary objectives of this research
were to: a) examine the effect of flour composition (focusing on gluten content/quality) on the
dough handling properties of four flours ranging from good to poor dough handling; b) examine
the effect of NaCl level on the dough handling properties, morphology (focusing on the gluten
network formation), stickiness and water mobility with the same four flours; and c) examine the
effect of various salts from the lyotropic series on the dough handling properties, morphology,
stickiness and water mobility of a known strong/non-sticky dough producing flour and a
weak/sticky dough producing flour to achieve similar properties to that of NaCl.
Within Chapter 3, the chemical compositions of flours milled from four different Canada
Western Red Spring (CWRS) wheat cultivars (i.e., Pembina, Roblin, McKenzie and Harvest)
were investigated and then related to the rheological properties, stickiness, morphology and
water mobility of each dough with 2% NaCl. All cultivars showed similar proximate
composition, with the exception of the protein content, and were all of high quality with minimal
enzymatic activity/degradation. Major differences were noted for flour cultivars with respects to
gluten quality and damaged starch level. Pembina and Roblin, which are both known strong
dough producing flours, showed a significantly higher gluten index and gluten performance
index than both McKenzie and Harvest, which are both known to be intermediate and weak
dough producing flours, respectively. However, dough prepared with Pembina was found to have
the greatest resistance to extension relative to the other flour cultivars. Pembina was found to
have greater amounts of low molecular weight glutenin subunits (insoluble) than Roblin which
could account for Pembina’s greater resistance to extension than Roblin. McKenzie and Harvest
flours had higher levels of gliadin than Pembina and Roblin, in part accounting for the weaker
doughs. McKenzie and Harvest both had significantly higher damaged starch (~7.1%) (i.e.,
harder kernels) than Pembina and Roblin (~5.7%) which would impact the hydration of gluten
proteins and therefore would ultimately impact the formation of the gluten network.
Within Chapter 4, the dough rheological properties, stickiness, morphology and water
mobility for the four CWRS wheat cultivars were examined as a function of NaCl (0-4%). More

iii
specifically the dough rheology was investigated with respect to the oscillatory shear, creep
recovery and extensibility. The loss tangent of doughs prepared with Roblin, McKenzie and
Harvest flours had similar values and greater than that of dough prepared with Pembina flour.
This trend was similar to the strength trend seen in Chapter 3 with the examination of resistance
to extension. Rheological data indicated that with increasing NaCl levels doughs prepared with
the four cultivars increased in strength. The magnitude of changes in dough strength with
different NaCl levels tended to be cultivar specific. For dough stickiness Pembina and Roblin
showed the least stickiness when compared to McKenzie and Harvest at the 0 and 2% NaCl
levels, with the addition of 2% NaCl decreasing stickiness for all cultivars. However at the 4%
NaCl level a greater cultivar effect was observed with regard to stickiness. Water association
measurements (i.e., distribution of water as free, associated with starch or associated with gluten)
found that with the addition of NaCl there was a decrease in free water among the doughs
prepared with the different cultivars and an increase in the water associated with the starch-
fraction. Overall, Pembina and Roblin formed stronger gluten networks with lower stickiness
than McKenzie and Harvest and NaCl sensitivity was found to be cultivar dependent. Pembina
was chosen as a strong/non-sticky dough producing flour and Harvest was chosen as a
weak/sticky dough producing flour to move forward to Chapter 5 to investigate the effect of salts
from the lyotropic series.
Within Chapter 5, the impact of salts from the lyotropic series (NH4Cl, KCl, NaCl,
MgCl2, CaCl2, and MgSO4) at the 1 and 2% salt levels on the dough rheology, morphology,
stickiness and water mobility of doughs prepared using a CWRS flour producing a strong/non-
sticky dough (Pembina) and a flour producing a weak/sticky dough (Harvest), were investigated.
Overall, Pembina developed stronger gluten networks than Harvest as determined by a lower loss
tangent and reduced amount of deformation during creep recovery. However, the effect of salt-
type was dependent on the cultivar. For instance, in the case of Pembina only dough prepared
with NH4Cl was found to experience significantly reduced deformation during creep recovery
compared to NaCl, whereas all other salt-types were similar. However for Harvest, KCl, CaCl2
and MgCl2 were found to have a weakening effect on the gluten network with respect to the
higher deformation experienced when compared to NaCl; whereas NH4Cl and MgSO4 resulted in
lower deformation compared to NaCl. Overall Pembina had lower dough stickiness in all cases
when compared to Harvest. Dough stickiness saw the greatest decrease for both flour cultivars

iv
with the use of NH4Cl. Enhanced dough morphology was noticed for Pembina and Harvest in the
presence of NH4Cl. Findings from the rheology and stickiness measurements indicate NH4Cl
could serve as a replacement for NaCl in low sodium dough formulations, however future studies
are necessary to determine the impact on final loaf quality, consumer acceptability and potential
health implications.

v
ACKNOWLEDGEMENTS
I would like to convey my utmost gratitude to my supervisor Dr. Michael Nickerson for
the immense support, reinforcement and help put forth. His light heartedness and comedic
character truly made the whole experience that much more enjoyable. I would like to thank him
for providing me with great opportunities and experiences of traveling to present my work and to
be involved with novel experimental techniques. I would like to thank my Advisory Committee
members Dr. Martin Scanlon, Dr. Pierre Hucl and Dr. Ben Newling; along with my graduate
chairs Dr. Robert Tyler, Dr. Darren Korber and Dr. Takuji Tanaka, all for challenging me and for
providing constructive criticism and excellent advice enabling me to advance through my
project. I would like to thank my external examiner Dr. Yulai Jin, from Kellogg Company
(Battle Creek, MI), for all his time and vigilant review. I would like to extend a big thank you to
Connie Briggs in the Crop Development Centre for all her technical support and advice. I would
like to thank Carly Isaak and Dr. Harry Sapirstein at the University of Manitoba for carrying out
the reversed-phase high-performance liquid chromatography analysis and providing me with the
technical background and understanding. I would like to thank Dr. Aleksandar Yovchev for
providing training and technical support throughout the project. I would like to thank one of my
best friends and colleague Andrea Stone, you have gotten me through the ups and downs of this
whole experience and also provided me with assistance and training. I would also like to thank
my other lab colleagues. I would like to thank Ann Harley, Donna Selby, and Pat Olesiuk for
their administrative support. A big thank you to all my family and friends for helping me
maintain my sanity through the process. A special thanks to my loving and supportive husband
Sean McAuliffe; and my loving and supportive parents Dr. Victor Avramenko and Teresa
Avramenko for being by my side throughout this tough journey. Financial support for this
research was provided by the Saskatchewan Agricultural Development Fund, the Western Grains
Research Foundation, the Natural Sciences and Engineering Research Council (NSERC) of
Canada/Canadian Institute of Health Research Joint Collaborative Research Development
Program, and Canada Bread Corp. (Toronto, ON, Canada). As well, special thanks to NSERC’s
Alexander Graham Bell Doctoral Scholarship program for providing me with stipend support
throughout my studies.

vi
TABLE OF CONTENTS
PAGE
PERMISSION TO USE i
ABSTRACT ii
ACKNOWLEDGEMENTS v
TABLE OF CONTENTS vi
LIST OF TABLES xi
LIST OF FIGURES xiv
LIST OF SYMBOLS AND ABBREVIATIONS xviii
1. INTRODUCTION 1
1.1 Overview 1
1.2 Objectives 3
1.3 Hypotheses 4
2. LITERATURE REVIEW 5
2.1 Abstract 5
2.2 Introduction 6
2.3 Dough formulation 7
2.3.1 Role of wheat flour and its composition 8
2.3.2 Role of water 13
2.3.3 Role of salt 14
2.3.4 Role of yeast 14
2.4 Breadmaking process 15
2.4.1 Dough formation 15

vii
2.4.2 Fermentation 15
2.4.3 Baking 16
2.5 Wheat quality 17
2.5.1 Gluten proteins: glutenin & gliadin 18
2.6 Sodium reduction in dough 21
2.6.1 Dough stickiness 21
2.6.2 Stickiness component within the 1B/1R wheat cultivars 22
2.6.3 Stickiness as a result of processing parameters 23
2.6.4 Stickiness due to the level of damaged starch 24
2.6.5 Stickiness due to water mobility/protein hydration 25
2.6.6 Prevention of stickiness with sodium chloride (salt) 26
2.6.7 Effect on gluten network formation 29
2.6.8 Effect on final bread product 29
2.7 Strategies used to lower sodium 30
2.7.1 Effect of replacement of sodium with alternative salts 30
2.7.2 Enzymes as an alternative to salt 32
2.8 Conclusions 33
3. CHARACTERIZATION OF FOUR CANADA WESTERN RED SPRING (CWRS)
WHEAT FLOURS AND THEIR COMPOSITIONAL EFFECT ON DOUGH
FORMATION AND STRENGTH 34
3.1 Abstract 34
3.2 Introduction 35
3.3 Materials and methods 38
3.3.1 Materials 38
3.3.2 Characterization of the flours 39
3.3.2.1 AACCI approved flour characterization methods 39
3.3.2.2 Amino acid (AA) profiling 39
3.3.2.3 Free thiol content 40
3.3.2.4 Solvent retention capacity (SRC) 40

viii
3.3.3 Gluten protein fractionation using reversed-phase high-performance liquid
chromatography (RP-HPLC) 41
3.3.3.1 Sample preparation 41
3.3.3.2 Reverse-phase high-performance liquid chromatography 43
3.3.4 Dough extensibility 44
3.3.5 Confocal laser scanning microscopy (CLSM) 45
3.3.6 Statistical analysis 45
3.4 Results and discussion 45
3.4.1 Flour characterization 45
3.4.1.1 Amino acid profiles & free thiol content 48
3.4.1.2 Solvent retention capacity of flour components 50
3.4.1.3 Gluten protein fractionation 53
3.4.2 Rheological properties 55
3.4.2.1 Rheological properties using a farinograph 57
3.4.2.2 Rheological properties using a mixograph 58
3.4.2.3 Dough extensibility 59
3.4.3 Confocal laser scanning microscopy (CLSM) 62
3.5 Conclusions 65
3.6 Linkage to chapter 4 65
4. EFFECT OF NACL LEVEL ON THE HANDLING PROPERTIES OF DOUGH
PREPARED FROM DIFFERENT CANADA WESTERN RED SPRING WHEAT
CULTIVARS 67
4.1 Abstract 67
4.2 Introduction 68
4.3 Materials and methods 70
4.3.1 Materials 70
4.3.2 Rheological analysis 71
4.3.2.1 Dough preparation 71
4.3.2.2 Dough rheology 71
4.3.3 Dough stickiness 72

ix
4.3.4 Dough extensibility 73
4.3.5 Differential scanning calorimetry (DSC) 73
4.3.6 Thermogravimetric analysis (TGA) 74
4.3.7 Confocal laser scanning microscopy (CLSM) 74
4.3.8 Statistical analysis 75
4.4 Results and discussion 75
4.4.1 Dough rheology 75
4.4.1.1 Oscillatory shear 75
4.4.1.2 Creep recovery 79
4.4.2 Dough stickiness 79
4.4.3 Dough extensibility 82
4.4.4 Freezable water content (FWC) 84
4.4.5 Thermogravimetric analysis (TGA) 86
4.4.5.1 Thermogravimetric analysis (Deconvolution of the derivative thermogram
DTG) 92
4.4.6 Confocal laser scanning microscopy (CLSM) 98
4.5 Conclusions 104
4.6 Linkage to chapter 5 105
5. EFFECT OF SALTS FROM THE LYOTROPIC SERIES ON THE HANDLING
PROPERTIES OF DOUGH PREPARED FROM PEMBINA AND HARVEST CWRS
WHEAT CULTIVARS 106
5.1 Abstract 106
5.2 Introduction 107
5.3 Materials and methods 109
5.3.1 Materials 109
5.3.2 Rheological analysis 110
5.3.2.1 Dough preparation 110
5.3.2.2 Dough rheology 110
5.3.3 Dough stickiness 111
5.3.4 Differential scanning calorimetry (DSC) 112

x
5.3.5 Thermogravimetric analysis (TGA) 112
5.3.6 Confocal laser scanning microscopy (CLSM) 113
5.3.7 Statistical analysis 113
5.4 Results and discussion 114
5.4.1 Dough rheology 114
5.4.1.1 Oscillatory shear 114
5.4.1.2 Creep recovery 118
5.4.2 Dough stickiness 122
5.4.3 Freezable water content (FWC) 124
5.4.4 Thermogravimetric analysis (TGA) 126
5.4.4.1 Thermogravimetric analysis (Deconvolution of the derivative thermogram
[DTG]) 129
5.4.5 Confocal laser scanning microscopy 135
5.5 Conclusions 139
6. GENERAL DISCUSSION 141
6.1 Overview 141
6.2 Cultivar selection 141
6.3 Impact of different CWRS wheat cultivars and their composition on the handling of dough
with normal NaCl formulations 143
6.4 Impact of NaCl on dough handling, stickiness and water mobility on doughs prepared from
different CWRS wheat cultivars 148
6.5 Impact of salts from the lyotropic series on dough handling, stickiness and water mobility in
doughs prepared from different CWRS wheat cultivars 156
6.6 Summary 162
7. GENERAL CONCLUSIONS 163
8. FUTURE STUDIES 166
9. REFERENCES 170

xi
LIST OF TABLES
PAGE
Table 2.1 Summary of the functional role of essential and nonessential ingredients within
dough 9
Table 2.2 Factors affecting dough rheology 19
Table 3.1 Flour properties for four CWRS wheat cultivars Pembina, Roblin, McKenzie and
Harvest 46
Table 3.2 Amino acid (AA) profiles of flours from CWRS wheat cultivars Pembina, Roblin,
McKenzie and Harvest. Data represent the actual percent AA concentration within
flour; whereas numbers within the brackets have been normalized to 100% in
order to compare levels in-between cultivars 49
Table 3.3 Solvent retention capacity of flours from CWRS wheat cultivars Pembina, Roblin,
McKenzie and Harvest 52
Table 3.4 Empirical rheological characteristics of flours from CWRS wheat cultivars
Pembina, Roblin, McKenzie and Harvest 56
Table 3.5 Image analysis of confocal laser scanning microscopy of doughs prepared using
CWRS wheat cultivars (Pembina [PEM], Roblin [ROB], McKenzie [MC],
Harvest [HAR]) with 2% NaCl 64
Table 4.1 Thermogravimetric analysis values for dough prepared using CWRS wheat
cultivars Pembina, Roblin, McKenzie and Harvest as a function of NaCl level
88
Table 4.2 Peak fitting data for peak temperature and relative proportion of peak water loss
for doughs prepared using CWRS wheat cultivars (Pembina, Roblin, McKenzie,
Harvest) as a function of 0% and 2% NaCl 95

xii
Table 4.3 Probability values arising from a two-way analysis of variance for peak fitting
data for proportional area under the curve for free water peaks, starch water peaks
and gluten water peaks for doughs prepared using CWRS wheat cultivars
(Pembina, Roblin, McKenzie, Harvest) as a function of 0% and 2% NaCl 97
Table 4.4 Image analysis of confocal laser scanning microscopy of doughs prepared using
CWRS wheat cultivars (Pembina [PEM], Roblin [ROB], McKenzie [MC],
Harvest [HAR]) as a function of 0% and 2% NaCl 101
Table 5.1 Probability values arising from a three-way analysis of variance for oscillatory,
creep rheology, and stickiness data 116
Table 5.2 Thermogravimetric analysis values for dough prepared using Pembina and
Harvest in the presence of various salts from the lyotropic series (NH4Cl, NaCl,
and MgCl2) at the 1% level (based on wt. flour) 128
Table 5.3 Peak fitting data for peak temperature and relative proportion of peak water loss
for doughs prepared using Pembina and Harvest as a function of salts from the
lyotropic series (1% NH4Cl, NaCl and MgCl2) 131
Table 5.4 Probability values arising from a two-way analysis of variance for peak fitting
data for proportional area under the curve for free water peaks, starch water peaks
and gluten water peaks for doughs prepared using CWRS wheat cultivars
(Pembina [PEM] and Harvest [HAR]) as a function of salts from the lyotropic
series (1% NH4Cl, NaCl, MgCl2) 134
Table 6.1 Gives the protein and damaged starch levels, farinograph water absorption (FAB),
as well as both raw and normalized work input to peak development (mixograph
testing) and resistance to extension (extensigraph testing) data for four different
CWRS cultivars. All rheological data was normalized to the FAB value of
Pembina 144

xiii
Table 6.2 A comparison between empirical and fundamental rheological measurements on
dough prepared using different cultivars at the 2% NaCl level 150
Table 6.3 Effect of NaCl level on fundamental rheological parameters, stickiness values and
% water associated with the starch-fraction for doughs prepared from different
cultivars 151
Table 6.4 A comparison between empirical and fundamental rheology measurements, and
stickiness on dough prepared using different cultivars at the 2% NaCl level 155
Table 6.5 Fundamental rheological properties and stickiness of doughs prepared with salts
from the lyotropic series at the 1% level 159
Table 6.6 Water mobility and dough stickiness within dough prepared from Pembina and
Harvest with salts from the lyotropic series at 1% (NH4Cl, NaCl, MgCl2) 162

xiv
LIST OF FIGURES
PAGE
Figure 2.1 Depiction of the gluten network formation during mixing conditions with and
without sodium chloride. Forming a strong gluten network and non-sticky dough
in situation (A) & (B) and a weak gluten network and sticky dough in situation
(C) & (D) 27
Figure 3.1 Gluten protein preparation procedure for fractionation by reverse-phase high-
performance liquid chromatography. Adapted from Fu and Sapirstein (1998)
42
Figure 3.2 Gluten protein fractions of CWRS cultivars (Pembina [PEM], Roblin [ROB],
McKenzie [MC], and Harvest [HAR]) giving the insoluble gluten fractions (A),
soluble gluten fractions (B) and strength indices (C) 54
Figure 3.3 Resistance to extension (N) and extensibility (mm) values for dough prepared
using different CWRS wheat cultivars (Pembina [PEM], Roblin [ROB],
McKenzie [MC] and Harvest [HAR]) with 2% NaCl 60
Figure 3.4 Ratio of resistance to extension (N) [R] and extensibility (mm) [E] values for
dough prepared using different CWRS wheat cultivars (Pembina [PEM], Roblin
[ROB], McKenzie [MC] and Harvest [HAR]) with 2% NaCl 61
Figure 3.5 Confocal laser scanning microscopy images for dough prepared using different
CWRS wheat cultivars (Pembina [PEM], Roblin [ROB], McKenzie [MC] and
Harvest [HAR]) with 2% NaCl 63
Figure 4.1 Dynamic storage (G) (A) and loss (G″) (B) moduli, and tan () (C) at 1 Hz for
dough prepared using different CWRS wheat cultivars (Pembina, Roblin,
McKenzie and Harvest) as a function of NaCl level 77
xv
Figure 4.2 Complex modulus (G*) at 1 Hz for dough prepared using different CWRS wheat
cultivars (Pembina, Roblin, McKenzie and Harvest) as a function of NaCl level
78
Figure 4.3 Maximum creep compliance (Jmax) (A) and relative elasticity (Jel) (B) for dough
prepared using different CWRS wheat cultivars (Pembina, Roblin, McKenzie and
Harvest) as a function of NaCl level 80
Figure 4.4 Stickiness values for dough prepared using different CWRS wheat cultivars
(Pembina, Roblin, McKenzie and Harvest) as a function of NaCl level 81
Figure 4.5 Resistance to extension (N) [A] and extensibility (mm) [B] values for dough
prepared using different CWRS wheat cultivars (Pembina, Roblin, McKenzie and
Harvest) as a function of NaCl level 83
Figure 4.6 Freezable water content (g ice/g sample d.b.) values for dough prepared using
different CWRS wheat cultivars (Pembina [PEM], Roblin [ROB], McKenzie
[MC] and Harvest [HAR]) as a function of NaCl level 85
Figure 4.7 Derivative of the thermogram (weight change %/°C) of doughs prepared with
CWRS wheat cultivars Pembina (A), Roblin (B), McKenzie (C), and Harvest (D)
as a function of NaCl level 87
Figure 4.8 Derivative thermogram (weight change %/°C) for a dough prepared with Pembina
at 0% NaCl (A) and the deconvolution of the derivative thermogram (B). Peak 1
& 2 represents water associated with free water, peak 3 & 4 represents water
associated with starch both mobile and bound respectively, and peak 5 & 6
represent water associated with gluten both mobile and bound respectively 93

xvi
Figure 4.9 Peak fitting data representing total peak free water (A), starch-fraction (B), and
gluten-fraction (C) water loss (%) for doughs prepared using CWRS wheat
cultivars (Pembina [PEM], Roblin [ROB], McKenzie [MC], and Harvest [HAR])
as a function of 0% and 2% NaCl 96
Figure 4.10 Confocal laser scanning microscopy images for dough prepared using different
CWRS wheat cultivars (Pembina [PEM], Roblin [ROB], McKenzie [MC] and
Harvest [HAR]) with 0% and 2% NaCl 99
Figure 5.1 Complex modulus (|G*|) at 1 Hz for dough prepared using flours from Pembina
(A) and Harvest (B) in the presence various salts from the lyotropic series
(NH4Cl, KCl, NaCl, CaCl2, MgCl2 and MgSO4) at the 1% and 2% levels (based
on wt. flour) 115
Figure 5.2 The loss tangent (tan ) at 1 Hz for dough prepared using flours from Pembina
(A) and Harvest (B) in the presence various salts from the lyotropic series
(NH4Cl, KCl, NaCl, CaCl2, MgCl2 and MgSO4) at the 1% and 2% levels (based
on wt. flour) 117
Figure 5.3 The creep compliance (Jmax) for dough prepared using flours from Pembina (A)
and Harvest (B) in the presence various salts from the lyotropic series (NH4Cl,
KCl, NaCl, CaCl2, MgCl2 and MgSO4) at the 1% and 2% levels (based on wt.
flour) 119
Figure 5.4 The relative elasticity (Jel) for dough prepared using flours from Pembina (A) and
Harvest (B) in the presence of various salts from the lyotropic series (NH4Cl,
KCl, NaCl, CaCl2, MgCl2 and MgSO4) at the 1% and 2% levels (based on flour
weight) 121

xvii
Figure 5.5 Stickiness values for dough prepared using flours from Pembina (A) and Harvest
(B) in the presence of various salts from the lyotropic series (NH4Cl, KCl, NaCl,
CaCl2, MgCl2 and MgSO4) at the 1% and 2% levels (based on wt. flour) 123
Figure 5.6 Freezable water content (FWC) as determined by differential scanning
calorimetry for dough prepared using flours from Pembina (PEM) and Harvest
(HAR) in the presence of various salts from the lyotropic series (NH4Cl, KCl,
NaCl, CaCl2, MgCl2 and MgSO4) at the 1% level (based on wt. flour) 125
Figure 5.7 Derivative of the thermogram (weight change %/ °C) of doughs prepared with
Pembina (A) and Harvest (B) as a function of salt-type (NH4Cl, NaCl, and
MgCl2) 127
Figure 5.8 Derivative thermogram (weight change %/°C) for a dough prepared with Pembina
at 1% NH4Cl (A) and the deconvolution of the derivative thermogram (B). Peak 1
& 2 represents water associated with free water, peak 3 & 4 represents water
associated with starch both mobile and bound respectively, and peak 5 & 6
represent water associated with gluten both mobile and bound, respectively 130
Figure 5.9 Peak fitting data representing total peak free water (A), starch-fraction (B), and
gluten-fraction (C) water loss (%) for doughs prepared using Pembina (PEM) and
Harvest (HAR) as a function of salts from the lyotropic series (1% NH4Cl, NaCl,
MgCl2) 133
Figure 5.10 Confocal laser scanning microscopy images for dough prepared using Pembina
(PEM) in the presence of various salts from the lyotropic series (NaCl, NH4Cl,
and MgCl2) at the 1 and 2% level (based on flour weight) 136
Figure 5.11 Confocal laser scanning microscopy images for dough prepared using Harvest
(HAR) in the presence of various salts from the lyotropic series (NaCl, NH4Cl,
and MgCl2) at the 1 and 2% level (based on flour weight) 137

xviii
LIST OF SYMBOLS AND ABBREVIATIONS
AA Amino acid
ANOVA Analysis of variance
BA Baking absorption
BU Barbender units
BWBD Bandwidth breakdown 1 min after peak
BWPR Bandwidth at peak dough resistance
CLSM Confocal laser scanning microscopy
CWRS Canada Western Red Spring
Da Dalton
d.b. Dry basis
DDT Dough development time
DSC Differential scanning calorimetry
DTG Derivative thermogravimetric curve
FAB Farinograph water absorption
FD Fractal dimension
FWC Freezable water content
Gli Gliadin
Glu Glutenin
GPI Gluten performance index
Gʹ Storage modulus (elastic modulus)
Gʺ Loss modulus (viscous modulus)
|G*| Complex modulus
HAR Harvest
HI Hardness index
HMW-GS High molecular weight glutenin subunit
Jel Relative elasticity
Jmax Maximum creep compliance
LMW Low molecular weight
LMW-GS Low molecular weight glutenin subunit
xix
MC McKenzie
MDT Mixograph development time
MTI Mixing tolerance index
MW Molecular weight
NSP Non-starch polysaccharide
PDR Peak dough resistance
PEM Pembina
RBD Resistance breakdown 1 min after peak
ROB Roblin
RVU Rapid viscoanalyzer units
R/E Resistance to extension/extensibility
SKCS Single kernel characterization system
SRC Solvent retention capacity
STA Stability time
tan δ Loss tangent
TGA Thermogravimetric analysis
Tq. Torque
w.b. Wet basis
WIP Work input to PDR
α Alpha
γ Gamma
ω Omega

1
1. INTRODUCTION
1.1 Overview
Society’s consumption of NaCl is far too high; almost double the recommended intake
levels per day. The majority (~77%) of that salt intake comes from processed foods (Mattes &
Donnelly, 1991; Health Canada, 2012). This over consumption of sodium has been linked to the
presence of hypertension, which is a major contributing factor in cardiovascular disease which,
in turn, accounts for a major portion of the total global deaths (Miller & Hoseney, 2008; Lynch
et al., 2009; Belz et al., 2012). This is a preventable strain that is put on the health care system.
Therefore, to combat high sodium consumption Health Canada created the sodium reduction
strategy, recommending that the food industry decrease the use of sodium in formulations to
lower consumer consumption to ultimately reduce the number of hypertension cases (Health
Canada, 2012). Many processed foods can reduce the sodium content without loss of product
functionality; however flavour loss may occur. Whereas for some food products, such as bread,
sodium chloride is necessary for product structure and functionality (Farahnaky & Hill, 2007;
Miller & Hoseney, 2008; Lynch et al., 2009; Belz et al., 2012).
Because bread is commonly consumed within many households, Health Canada has
recommended that the sodium content in 100 g serving of bread be brought down to 330 mg
from 470 mg (Health Canada, 2012). This has proven to be a major challenge within industrial
bread production facilities because the reduction of sodium within dough formulations
compromises dough rheology and handling due to the occurrence of a sticky dough phenomenon,
resulting in poor final product quality and costly production shutdowns (Adhikari et al., 2001;
Farahnaky & Hill, 2007; Belz et al., 2012; Israr et al., 2016). It is well known that sodium
chloride is one of the key ingredients in producing dough suitable for bread production because it
impacts the development of the gluten network during the mixing stage by increasing the time
necessary for protein/starch hydration to achieve optimal dough rheological properties and a non-
sticky dough (Uthayakumaran, 2011; Belz et al., 2012). Stickiness is a property that is related to
the adhesive forces (i.e., between the dough and the mixing surface) and the cohesive forces (i.e.,

2
protein-protein interactions creating the gluten network) (Adhikari et al., 2001; van Velzen et al.,
2003) and is suggested to be dependent on the viscoelastic properties of the dough (Dobraszcyk,
1997; Hoseney & Smewing, 1999). Therefore, measurements of the rheological properties of the
dough give an indication of the cohesive properties within the dough (Dobraszcyk, 1997;
Hoseney & Smewing, 1999). Dough stickiness occurs when the adhesive forces are higher than
the cohesive forces within the dough (Hoseney & Smewing, 1999). It has been suggested that the
occurrence of dough stickiness is impacted by processing parameters such as mixing conditions
(e.g., temperature, time, shear), level of flour component hydration and formulation (e.g., flour,
salt, etc.) as all of these can impact the viscoelastic properties of the dough (Dhaliwal et al.,
1990; Dobraszczyk, 1997; van Velzen et al., 2003; Miller & Hoseney, 2008; Beck et al., 2012a).
Sodium chloride serves to reduce dough stickiness by impacting the rheological
properties of the dough through the development of the gluten network during the mixing stage
(Farahnaky & Hill; 2007; Beck et al., 2012a; Belz et al., 2012). Many reviews have stated that
salt results in increased dough stability, mixing time, resistance to extension and extensibility,
and elasticity; all of which are indications of a strong gluten network development (Miller &
Hoseney, 2008; Belz et al., 2012; Israr et al., 2016). It is the gluten network that imparts the
viscoelastic properties to the dough through the two gluten proteins, glutenin and gliadin. The
gliadins contribute to the viscous component of the dough and the extensibility and are
distributed throughout the backbone glutenin polymers; whereas the glutenins impart
cohesiveness, elasticity and strength to the dough through the creation of an interconnected
network (Wieser, 2007). The interactions that are important in the formation of the gluten
network are non-covalent (hydrogen bonding, hydrophobic, and ionic) and covalent disulphide
bonding that creates interconnections between the glutenin subunits (Wieser, 2007). During
mixing these interactions can be manipulated with the use of NaCl. The salt shields the charges
on the gluten proteins’ surface, allowing the protein polymers to come into close contact through
hydrophobic interactions, slowing the hydration of the gluten protein polymers, and allowing the
proteins to interact (i.e., through hydrogen bonds and disulphide bonds) which forms a stronger
gluten network (Preston, 1989; Butow et al., 2002; Miller & Hoseney, 2008; Uthayakumaran,
2011). By changing these interactions the formation of the gluten network is altered and with it
the strength of the dough and potentially dough stickiness.

3
The role of NaCl and other alternative salts in shaping the nature of interactions within
the dough matrix can be explored by studying the effects of salts from the lyotropic series (also
known as the Hofmeister series) on the dough rheology and handling properties (Salovaara,
1982a; Preston, 1989; Miller & Hoseney, 2008). Both anions and cations are ranked in order of
the most stabilizing to destabilizing effects on protein-water interactions (He et al., 1992; Miller
& Hoseney, 2008). Stabilizing ions lead to less protein hydration, more structure and decreased
protein solubility (i.e., ion-water interactions are favoured, leading to increased protein-protein
interactions), whereas destabilizing ions lead to greater hydration and increased protein solubility
(i.e., protein-water interactions are favoured, leading to weaker protein-protein interactions). As
a result, depending on the anions or cations present within the formulation, the level of
hydrophobic interactions and hydrogen bonding occurring in the system can be altered (Preston,
1989; Butow et al., 2002; Miller & Hoseney, 2008).
1.2 Objectives
The overall goal of this research was to gain a greater understanding of the underlying
mechanisms leading to the sticky dough phenomenon within a low sodium environment. The
effect of NaCl levels on the nature of interactions will be examined using flours known for their
weak and strong gluten network producing properties. For instance, Roblin and Pembina have
been observed to have good dough handling properties (i.e., non-sticky dough) both at high
(~470 mg/100 g bread) and low (~330 mg/100 g bread) NaCl levels, whereas both McKenzie
and Harvest have good and poor dough handling properties at high and low NaCl levels,
respectively. The composition of these flours will be characterized as it relates to their protein
and starch components. Various types of salts from the lyotropic series will be used to modify
interactions within the gluten network prepared from the different cultivars, where dough
rheology, dough stickiness, dough morphology and water mobility measurements will be used as
indicators of formulation changes. The specific objectives are as follows:
(a) To investigate the chemical composition of flours prepared from different Canada Western
Red Spring wheat cultivars (Pembina, Roblin, McKenzie and Harvest) which display good,
average and poor dough handling properties within a low sodium environment.

4
(b) To investigate the effect of NaCl level on the morphology, dough handling properties and
water mobility of dough prepared from different Canada Western Red Spring wheat
cultivars as it relates to the formation of the gluten network.
(c) To investigate the effect of different salt types from the lyotropic series on hydrophobic and
hydrogen bonding of gliadins and glutenins with both sticky and non-sticky dough as it
relates to water mobility, dough rheology, dough stickiness, and dough morphology.
1.3 Hypotheses
To achieve the overall goal of this research, the following hypotheses will be tested:
(a) Flours containing higher quality gluten (i.e., higher amounts of glutenin than gliadin, more
specifically, higher amounts of the high molecular weight glutenin subunit [HMW-GS]
fractions) will form stronger gluten networks resulting in less sticky dough. Dough
stickiness will increase as gluten protein quality decreases due to decreased protein-protein
interactions.
(b) At higher NaCl levels there will be greater protein-protein interactions facilitated through
hydrophobic and hydrogen bonding and thus a more viscoelastic and non-sticky dough. At
lower NaCl levels there will be an increase in both water mobility and gluten network
hydration resulting in an increase in dough stickiness.
(c) Water mobility will be enhanced in the presence of chaotropic cations given that chaotropic
ions weaken the gluten network and will create sticky dough, whereas the non-chaotropic
ions will strengthen the gluten network and decrease water mobility, creating non-sticky
dough.

1 Partially reproduced with permission. Avramenko, N. A., Tyler, R. T., Scanlon, M. G., Hucl, P., &
Nickerson, M. T. (2016). The chemistry of bread making: the role of salt to ensure optimal functionality
of its constituents. Food Reviews International, DOI: 10.1080/87559129.2016.1261296.
5
2. LITERATURE REVIEW1
2.1 ABSTRACT
Large consumptions of dietary sodium have been shown to lead to hypertension, one of
the main causative factors in cardiovascular disease. Bread (and other cereal products) account
for ~30% of overall sodium intake in our diet, therefore industry has been developing strategies
to significantly reduce its usage. However at reduced sodium levels, dough handling can be
affected due to a sticky dough phenomena creating major processing issues and a poor quality
final product. It is hypothesized that the formation of a strong gluten network plays a crucial role
in developing non-sticky dough, a process which is strengthened in the presence of NaCl.
However at low NaCl levels, a weaker gluten network forms resulting in the prevalence of other
wheat flours’ constituents impact on water mobility within the dough to contribute to the
stickiness phenomenon. This review discusses the underlying mechanisms that can influence the
formation of sticky dough within a low sodium environment, and discusses strategies used to
help circumvent them.

6
2.2 INTRODUCTION
High dietary sodium intake from processed foods represents a major health concern for
consumers worldwide. The consumption of large amounts of sodium has been shown to lead to
hypertension, which is one of the main causative factors in cardiovascular disease, accounting
for one third of total global deaths (Miller & Hoseney, 2008; Lynch et al., 2009). Currently
Canadians ingest ~3,400 mg of sodium per day, which is more than double the amount
recommended (1,500 mg per day) by Health Canada (Health Canada, 2012). As a result, Health
Canada developed a sodium reduction strategy that aims to achieve an average daily intake of
sodium ~2,300 mg per day by 2016 by mandating lower sodium levels across a range of foods,
including bread. Health Canada estimated that a decrease of 1,840 mg of sodium per day would
result in a 30% reduction in cases of hypertension and would result in a direct annual cost
savings of $430 million for the health care system through fewer physician visits, laboratory tests
and prescriptions (Joffres et al., 2007; Health Canada, 2012). Processed foods, such as soups,
meat/fish, bakery products, breakfast cereals and dairy products/alternatives account for ~77% of
total sodium intake (Mattes & Donnelly, 1991).
Bread (along with other cereal-based products) is one of the most widely consumed
products in the human diet, and as such accounts for ~30% of overall sodium intake (Farahnaky
& Hill, 2007; Miller & Hoseney, 2008; Lynch et al., 2009). In 2009-10, the sodium content in
100 g of bread was ~470 mg. Health Canada’s sodium reduction strategy aims to reduce sodium
levels in three phases, from 470 mg per 100 g bread to 430 mg, then to 380 mg, and then finally
to 330 mg by the end of 2016 (Health Canada, 2012). Currently the bread industry has been
effective at reducing the sodium content in white bread down to 380 mg per 100 g bread through
re-formulations and the use of sodium alternatives such as potassium chloride. However the
latter can result in unacceptable bitter/metallic tastes (Salovaara, 1982a; Miller & Hoseney,
2008; Belz et al., 2012). Upon reducing sodium levels, dough rheology and handling can be
compromised due to a sticky dough phenomenon causing major processing issues and a poor
quality final product (Farahnaky & Hill, 2007). Dough stickiness occurs when there are high
adhesive forces (interactions between the dough and mixing surfaces) and low cohesive forces
(interactions within the dough) (Adhikari et al., 2001; van Velzen et al., 2003). Sticky dough
results in low dough mixing tolerance and reduced dough strength and, if in excess, costly
disruptions in production due to adherence of dough to the processing equipment (Dobraszczyk,

7
1997; Adhikari et al., 2001; van Velzen et al., 2003). The presence of sticky dough is affected by
processing parameters such as the level of hydration, mixing conditions (e.g., temperature, time,
shear) and formulation (e.g., flour, salt, etc.) (Miller & Hoseney, 2008; Beck et al., 2012a).
Sodium chloride is necessary for strengthening the gluten network and enhancing dough
stability. NaCl serves to stabilize yeast fermentation, enhance product flavour, strengthen the
gluten network and increase the dough mixing time for increased protein-protein interactions
(Miller & Hoseney, 2008). Gluten within the wheat flour imparts dough properties such as
extensibility, viscosity, elasticity, cohesiveness and contributes to water absorption, the extent of
which is highly dependent upon the quality and ratio of the gliadin and glutenin proteins
comprising the gluten matrix (Joye et al., 2009). Gliadins are proteins contributing to the
extensibility of the gluten network (Joye et al., 2009), whereas glutenins are proteins that
contribute to the elasticity and cohesiveness of the gluten network (He et al., 1992; Joye et al.,
2009). In a flour-water system (pH ~6.0) the gluten proteins are below their isoelectric point (pH
7.5), giving them an overall net positive charge (Gennadios et al., 1993; Miller & Hoseney,
2008). Under ‘charged’ conditions, proteins repel one another and become more hydrated
resulting in shorter mixing times because interactions between the proteins are less; creating
weaker and stickier dough (Miller & Hoseney, 2008). Once NaCl is added, charged sites on the
protein’s surface become shielded allowing proteins to interact and aggregate through
hydrophobic interactions. Consequently, hydration of the gluten proteins is less and the dough
formed is stronger (Preston, 1989; Butow et al., 2002; Miller & Hoseney, 2008).
2.3 DOUGH FORMULATION
Dough is a complex, non-linear and time-dependent viscoelastic system comprised of a
multitude of ingredients and phases (liquid, solids and gases) (Scanlon & Zghal, 2001; Jekle &
Becker, 2011). Ingredients that are considered essential to the wheat breadmaking process are
flour, water, salt and yeast, whereas nonessential ingredients may include fat, sugar, dairy
products, enzymes, yeast food, emulsifying agents and improvers (Hoseney, 1998e; Collando-
Fernandez, 2003; Moore, 2004; Goesaert et al., 2005; Lai & Lin, 2006). The latter are
incorporated to enhance the dough-bread machinability, palatability and shelf life. Dough
viscoelasticity arises from quality attributes of the flour, the level of water absorption/hydration,
amount of entrapped gases, and mixing/kneading conditions (Salvador et al., 2006). A summary

8
of the functional role of both essential and nonessential ingredients is given in Table 2.1;
however flour, water, salt and yeast will be discussed in greater depth.
2.3.1 Role of wheat flour and its composition
Wheat flour is the major ingredient in dough, and is unique relative to other cereal flours
(barley, oat, rice and corn) since it forms strong viscoelastic networks upon hydration with water
(Lai & Lin, 2006). For good breadmaking purposes, flours typically come from hard spring
wheats such as the Canada Western Red Spring wheat (CWRS) class of cultivars because of the
medium to strong dough handling properties of their flours. Hard wheat classes tend to have
higher protein contents (~10-14%), making them more applicable for pan breads, whereas soft
wheat classes have lower protein levels (~8-10%) making them unsuitable for
breadmaking(Hoseney, 1998e; Lai & Lin, 2006; Delcour et al., 2012). The quality of flour and
composition can vary with cultivar, the environment, agricultural (e.g., fertilizing, harvesting,
etc.) and milling practices (Collando-Fernandez, 2003). Starch represents the major component
in wheat flour (~70-75%) followed by water (~14%), protein (~10-12%), non-starch
polysaccharides (NSP) (e.g., arabinoxylans) (~2-3%) and lipids (~2%) (Goesaert et al., 2005).
Starch
Amylopectin and amylose are two distinct polysaccharide molecules which make up
starch, differing in both shape and size (Oates, 2001). Amylopectin (69-73%) is highly branched
and large in size (107 to 109 Da), whereas amylose (27-31%) has minimal branching and is
smaller (105 to 106 Da) in nature (Oates, 2001). Native wheat starch granules are water-insoluble
with a bimodal size distribution, meaning that there are both small spherical granules (average
diameter of ~5 µm) and large granules that are lenticular in shape (i.e., having the shape of a
double convex lens) (average diameter ~20 µm) (Oates, 2001; Goesaert et al., 2005). Starch
granules are inert entities and are structurally stable with a semi-crystalline structure making
them birefringent (Oates, 2001; Goesaert et al., 2005). Starch is structurally complex with
several levels of organization, where precise modeling of its complete structure is still under
investigation. Damage can occur during the milling process resulting in a loss of birefringence to
the damaged starch, increased water absorption and greater susceptibility to enzymatic

9
Table 2.1 Summary of the functional role of essential and nonessential ingredients within
dough.
Ingredient Functional role
Flour
(Wheat)
Structure
- Major ingredient consisting mainly of starch, water and
protein which imparts structure and body (1-5).
- Minor components important for quality are non-starch
polysaccharides and lipids (2).
- Gluten proteins are crucial for structure formation (1-3).
- Starch is important for heat induced crumb formation (1,2).
Water Hydration
- Hydrates the gluten proteins, starch and the non-starch
polysaccharides and damaged starch and allows for the
formation of a viscoelastic dough (3,5).
- Is a solvent for the other ingredients, medium for chemical
and biochemical reactions, and aids in dough mobility (3,5).
- Has an effect on bread shelf life (3).
Yeast (Saccharomyces
cerevisae, fresh or dried) (5).
Leavening
- Converts simple sugars into CO2 and ethanol, the
fermentation products also impart flavour (1,3,4,5).
- Factors controlling rate of fermentation: temperature, nutrient
supply, water content, pH, sugar content, salt content and
type of yeast (5).
Salt
(NaCl)
Flavour/structure
- Controls fermentation by inhibiting yeast activity to control
bread expansion (1,3,4,5).
- Inhibits the hydration of gluten, thus strengthening the gluten
network (1,3,4,5).
- Prolongs shelf life and imparts flavour (1,3,5).
Shortening/fat
(soft fats such as hydrogenated
vegetable fats or surface active
materials like
mono/diglycerides or lecithin) (1).
Lubricant/softener
- Increases the shelf life, produces a finer grain, makes crust
more elastic and softer through the formation of a film
between the starch and protein layers (1,3,5).
- Creates easier slicing (5).
- Increases dough plasticity, resulting in less water necessary
in the formulation (1).

10
Sugars
(sugar (sucrose) or invert
sugar: liquid sucrose broken
down to monomers fructose
and glucose) (5).
Energy source for yeast
- Promotes fermentation, browning of the crust and imparts
flavour (1,3,4,5).
- Tenderizes bread (1,3).
Dairy products (skim milk
powder & whey containing
lactose protein concentrate) (1,5).
Nutrition/color
- Enhances nutritional profile of bread (high in lysine and
calcium), imparts flavour, contributes to crust colour and
softness, and provides buffering for dough (1,3,5).
Enzymes
(α-amylase, protease, glucose
oxidase, xylanase) (1,3).
Bread quality
- Amylase serves to convert starches into fermentable sugars
as well as extend the shelf life of bread (3).
- Protease acts on the protein to decrease dough mixing time (3).
- Glucose oxidase and xylanase function to strengthen the
dough (3).
- Fungal amylase and xylanase increase baked loaf volume (3).
Yeast food
(either mineral yeast food or
fermentable sugars: malted
flour, malt extract) (1).
Controls fermentation (mineral yeast food)
- Through the use of water conditioners (calcium salts), yeast
conditioners (ammonium salts), and dough conditioners
(oxidizing agents, e.g., ascorbic acid (E300)) (1,3,5).
- Can enhance yeast activity through addition of malt
flour/malt extract, or other enzyme active preparations that
produce fermentable sugars (1,5).
Emulsifying agents
(monoglycerides (E471),
esters from monoglycerides
and diacetyltartaric acid
(DATA esters; E472e), sodium
or calcium stearoyl-2-
lactylate (SSL, E481 or E482),
lecithin (E322)) (1).
Lubricant/softener
- Influence is based on interactions with the starch-protein-fat-
water components (1).
- It can improve the strength of the gluten network, rate of
hydration, crumb structure, dough handling, slicing
characteristics and gas retention and delay staling (1,4).
Preservatives (calcium
propionate
(E282), sorbic acid (E200),
and vinegar)) (1).
Shelf life
- Helps delay bread staling, control water activity and retard
mold growth (1,3,4).
- Can affect yeast fermentation (1).
*Adapted from: Collando-Fernandez , 2003 (1); Goesaert et al, 2005 (2); Moore, 2004 (3); Mondal & Datta,
2008 (4); Lai & Lin, 2006 (5).

11
hydrolysis (Hoseney, 1998a). Starch, through its degradation products/sugars, also plays a role in
the final crust colour of the bread through the Maillard reaction and its products. When alpha-
amylase (i.e., endo-amylase) is added to the flour this causes the breakdown of damaged starch
which generates low molecular weight dextrins and some maltose, which is a reducing sugar. In
addition to the endo-amylase, endogenous beta-amylase produces maltose from low molecular
weight dextrins, which then reacts with amino acids and results in a browning of the crust
(Goesaert et al., 2005).
Proteins
Proteins contained within the wheat flour include both non-gluten (~15-20 %) and gluten
proteins (~80-85 %) (Hoseney, 1998d; Goesaert et al., 2005). The non-gluten proteins fall under
the albumin and globulin classification as these are soluble in water and dilute salt solutions,
respectively (Hoseney, 1998d; Goesaert et al., 2005). These proteins, which include enzymes and
structural proteins, are located in the outer layer of the wheat kernel, and are lower in glutamic
acid/glutamine and proline and are much higher in aspartic acid, arginine and lysine than the
gluten proteins (Hoseney, 1998d; Goesaert et al., 2005). The gluten proteins (alcohol soluble
prolamins) are the major storage proteins in wheat (Hoseney, 1998d; Goesaert et al., 2005;
Wieser, 2007). Gluten proteins are high in glutamine (~35%), proline (14%) and hydrophobic
amino acids (35%) (Hoseney, 1998b; Wieser, 2007). However, gluten has low levels of acidic
and basic amino acids (Hoseney, 1998b; Wieser, 2007). Gluten is also low in cysteine (~2%)
which is important for intra and inter-molecular disulphide bond formation (Wieser, 2007).
Gluten is a complex quaternary structure comprised of two protein classes: gliadins and
glutenins. The latter are also delineated as high molecular weight glutenin subunits (HMW-GS)
and low molecular weight glutenin subunits (LMW-GS) (Hoseney, 1998b; Goesaert et al., 2005;
Wieser, 2007). Gliadins are thought to contribute to dough viscosity/plasticity, whereas glutenins
are cross-linked by disulphide bonds and contribute to dough elasticity (Butow et al., 2002;
Goesaert et al., 2005; Wieser, 2007).
Non-starch polysaccharides (NSP)
Non-starch polysaccharides (NSP) include cellulose, β-glucans and pentosans, which are
found within the cell wall matrix (Eliasson & Larsson, 1993b). The dry matter weight of the

12
wheat endosperm cell wall is comprised of 75% NSP, with pentosans contributing ~85%
(Goesaert et al., 2005). Pentosans are comprised of polymers of pentoses (mainly arabinose and
xylose from arabinoxylans), which are five carbon monosaccharides (Eliasson & Larsson,
1993b). There are water soluble and water insoluble pentosans; water insoluble account for more
than 60% of the total pentosans (Eliasson & Larsson, 1993b). Pentosans influence the water
distribution in dough because of their strong water-holding capacity and are known to increase
dough viscosity (Eliasson & Larsson, 1993b).
Lipids
The lipids within wheat flour are classified by their association with the starch granule or
not: starch lipids and non-starch lipids (Hoseney, 1998c). Non-starch lipids are further classified
as nonpolar lipids (~60%), glycolipids (25%), or phospholipids (15%) (Hoseney, 1998c). The
starch lipids are grouped into nonpolar (9%), glycolipid (5%), or phospholipid (86%) categories
(Hoseney, 1998c). Nonpolar non-starch lipids have a detrimental effect on bread loaf volume;
however, the polar lipids and glycolipids have been found to increase the loaf volume capacity at
high concentrations, but decrease loaf volume at lower concentrations (Goesaert et al., 2005;
Lasztity & Abonyi, 2009). It is postulated that polar lipids, mainly galactose-containing
glycolipids, reinforce the gluten network through lipid-protein interactions (Lasztity & Abonyi,
2009).
Role of flour components in processing
During dough development, gluten proteins are responsible for forming a continuous
multiphasic viscoelastic network. Gluten makes up the network through disulphide bonding, and
non-covalent interactions (i.e., hydrogen and ionic bonding, van der Waals, and hydrophobic
interactions) (Salvador et al., 2006). During mixing, protein polymers become hydrated and
randomly oriented. Continued mixing causes the polymers to re-orient within the directional
shear, fostering increased protein-protein interactions to form a continuous gluten network
leading to the dough’s desired elasticity and extensibility (Lai & Lin, 2006; Salvador et al.,
2006). This gluten network represents an insoluble protein phase within the dough.
Embedded within the gluten matrix is another phase comprised of intact and damaged
starch granules, water, and water-soluble components such as pentosans (Jekle & Becker, 2011).
13
Lipid-gluten interactions form upon kneading to help stabilize the gas bubbles for greater gas
retention within the gluten matrix (Jekle & Becker, 2011). Starch’s role in dough formation is
not entirely clear, but it is capable of absorbing large amounts of water (~46%), and upon heating
the starch granules swell and gelatinize, reinforcing the gluten network (Petrofsky & Hoseney,
1995; Goesaert et al., 2005). During gelatinization, heat causes the starch granules to experience
irreversible changes to their ordered molecular structure, resulting in loss of birefringence, loss
of X-ray diffraction pattern, absorption of water and swelling, and change in both shape and size
(Eliasson & Larsson, 1993b; Goesaert et al., 2005). Then following gelatinization, leaching of
amylose molecules from the starch granules occurs. Although the starch-protein interactions are
still not fully understood, it is widely believed that they influence the rheological behaviour of
the dough (Petrofsky & Hoseney, 1995). Starches also contribute to crumb formation, colour,
flavour and texture upon baking the dough into bread.
There is also a third phase within the dough, entrapped air and CO2. The CO2 generated
by yeast provides the leavening capacity that gives bread products their characteristic crumb
structure (Campbell et al., 1998; Scanlon & Zghal, 2001). Doughs that have excellent gas
retention properties result in breads with acceptable heights and textures and appealing structure
(Stauffer, 2007).
2.3.2 Role of water
Hydration of the wheat flour is a prerequisite to dough formation. Water plays an
important role within the complex dough system and in its conversion into bread. Water hydrates
gluten proteins, starch and NSP within the flour and dissolves and disperses sugar and salt
(Collando-Fernandez, 2003; Lai & Lin, 2006). Water also serves as a medium for both
biochemical and chemical reactions, affecting the shelf life of the final baked product (Moore,
2004; Lai & Lin, 2006). The amount of water necessary for optimum dough formation is referred
to as the flour’s water absorption level, and depends on the quality and amount of protein,
amount of starch and damaged starch, and NSP levels (Eliasson & Larsson, 1993a; Collando-
Fernandez, 2003). Water absorption of flour can be measured using a farinograph. Water levels
in the dough formulations can be adjusted depending on the flour to give consistent dough
properties, hydration time and energy input needed for mixing (Farahnaky & Hill, 2007).

14
2.3.3 Role of salt
Salt (e.g., NaCl) plays a critical role during dough and bread formation (Farahnaky &
Hill, 2007; Miller & Hoseney, 2008). Salt modulates yeast fermentation, enhances product
flavour, strengthens the gluten network (as measured by an increase in the storage modulus),
increases the dough mixing time for increased protein-protein interactions, and acts as a
preservative by decreasing water activity and prolonging shelf life (Moore, 2004; Miller &
Hoseney, 2008; Belz et al., 2012). Altering the salt content in dough can impact the level of
protein-protein interactions and the strength of the gluten network by changing the level of
gluten hydration. Salt shields charged amino acids on the protein’s surface reducing the thickness
of the electric double layer, strengthening gluten interactions, and yielding a stronger network
capable of retaining gas bubbles (Collando-Fernandez, 2003). Decreased levels of salt in the
dough result in the protein becoming less shielded to enable a greater amount of protein-water
interactions and, thus a weaker gluten network. Without adequate levels of salt, there will be
insufficient formation of the gluten network (dough structure), and increased activity of the
yeast, which leads to poor bread quality in terms of texture, volume, flavour and colour
(Farahnaky & Hill, 2007). The range of salt used within the bread formulation is ~1-2% on a
flour weight basis (Collando-Fernandez, 2003).
2.3.4 Role of yeast
Yeast (Saccharomyces cerevisae) is a leavening agent that converts simple fermentable
carbohydrates to CO2 and alcohol; it is the release of CO2 that produces the leavening action in
bread (Lai & Lin, 2006). These simple carbohydrates can either be added to the formulation, or
formed through the hydrolysis of starch using enzymes (Lai & Lin, 2006). Yeast is only active
in the temperature range of 0-55°C; however, the most favourable temperature for fermentation
is between 27-38°C, with the greatest activity occurring at 35°C (Lai & Lin, 2006). During the
fermentation process, the activity of the yeast expands the bubbles in the dough and also creates
fermented yeast flavours (Lai & Lin, 2006). Specific compounds formed during yeast
fermentation are organic acids, alcohols, aldehydes, esters, and ketones; some of these
compounds are volatized when the bread is baking, some lead to further reactions, but most add
to the flavour and odour of the product (Lai & Lin, 2006). Some of the compounds created can

15
act as dough conditioners and serve to increase the dough’s extensibility by relaxing the gluten
(Lai & Lin, 2006).
2.4 BREADMAKING PROCESS
The breadmaking process typically follows three major operations: dough formation,
fermentation and baking (Hoseney, 1998e).
2.4.1 Dough formation
The formation of dough begins with the mixing process, which combines all the
ingredients into a more uniform dough, encourages dissolution and hydration of ingredients,
distributes the yeast evenly throughout the dough, incorporates air bubbles within the dough to
provide gas nuclei for CO2, develops the gluten network, and ultimately forms a viscoelastic
dough suitable for further production (Autio & Laurikainen, 1997; Hoseney, 1998e, Lai & Lin,
2006; Marsh & Cauvain, 2007). During mixing, proteins become hydrated, partially unravel and
re-orient within the direction of shear to develop strong protein-protein interactions stabilized by
disulphide bonds, hydrogen bonding, and hydrophobic interactions to form a viscoelastic
network (Hoseney, 1998e; Letang et al., 1999; Lai & Lin, 2006; Belz et al., 2012). Parameters
such as the mechanical energy applied during the stretching and shearing process, mixing time,
shear rate, temperature and flour:water ratio are all essential to develop the optimum gluten
network while avoiding the occurrence of sticky dough (Letang et al., 1999). When over-mixing
occurs, the gluten polymers over extend causing loss in elasticity and depolymerize by breaking
disulphide bonds (Autio & Laurikainen, 1997; Letang et al., 1999; Lai & Lin, 2006). Under-
mixing of the dough results in an uneven distribution of the proteins and starches to give a poorly
developed gluten network.
2.4.2 Fermentation
Fermentation is the next stage in the breadmaking process, and can be divided into
additional sub-steps: fermentation, punching, dividing, molding, panning and proofing
(Collando-Fernandez, 2003). Initially yeast cells (Saccharomyces cerevisae) adapt to the dough,
and switch from aerobic fermentation to anaerobic when O2 becomes depleted (Elmehdi et al.,
2003). The change in fermentation leads to the production of CO2 and ethanol, which causes

16
changes to the physical properties of the dough (Hoseney, 1998e; Collando-Fernandez, 2003).
The latter involves the gluten matrix becoming more elastic, allowing it to withstand the
expansion of gas cells (Collando-Fernandez, 2003; Lai & Lin, 2006; Belz et al., 2012). If under-
fermentation of the dough occurs, then the resulting texture of the loaf will be coarse and if over-
fermented, the texture will become sticky (Lai & Lin, 2006). Next the dough undergoes
punching, which is a process of deflating the dough to allow for the expulsion of the CO2,
redistribution of the yeast and relaxation of the gluten (Hoseney, 1998e; Lai & Lin, 2006).
During punching, the dough is pulled up on all sides, then folded over the center, and then finally
pressed down (Lai & Lin, 2006). The dough is then divided, rounded, molded/sheeted and
panned before entering the proofer. Dividing involves the creation of dough pieces of similar
weight, whereas rounding involves shaping these pieces into smooth balls (Collando-Fernandez,
2003; Lai & Lin, 2006). During the rounding stage, an intermediate proofing step may be used
(10-20 min) to allow for relaxation of the gluten polymers to make shaping of the dough easier
(Hoseney, 1998e; Collando-Fernandez, 2003; Moore, 2004; Lai & Lin, 2006). Sheeting and
molding involves the expulsion of gas and flattening of the dough balls, then curling the dough
into cylinders, and seam sealing the dough with sheeting rollers (Hoseney, 1998e; Moore, 2004).
The process of sheeting has an effect on reducing the amount of gas and reorganizing the protein
network within the dough (Autio & Laurikainen, 1997). Panning involves the dropping of the
dough into the pans on a conveyor (Moore, 2004). Proofing is considered the final fermentation
step, which involves a resting period to allow the yeast to generate more CO2 and ethanol to
cause the dough to rise (Moore, 2004; Lai & Lin, 2006). Proofing is usually carried out at a
temperature of 30-35°C at a relative humidity of 85% for 55-65 min (Hoseney, 1998e). The
amount of CO2 retained in the proofed loaf is highly dependent on the quality of the gluten
network that has been formed during dough formation and fermentation.
2.4.3 Baking
The final stage in the breadmaking process is baking, which transforms the viscoelastic
dough into a solid springy loaf with an outer crust and internal porous crumb structure. During
baking, a) dough volume rapidly rises as gas bubbles expand, b) starch partially gelatinizes, a
process whereby starch granules swell and lose birefringence; c) proteins denature, cross-link
and aggregate together to form a solid structure; d) fat crystals (if added to the dough) melt and

17
become incorporated into the bubble interface to prevent rupturing; and e) crust colour and
flavours develop due to Maillard browning (i.e., non-enzymatic browning involving a chemical
reaction between an amino acid and a reducing sugar when exposed to a sufficiently high
temperature) (Autio & Laurikainen, 1997; Hoseney, 1998e; Lai & Lin, 2006; Belz et al., 2012).
Once the dough has been transformed into a springy loaf the bread is then cooled, sliced and
packaged (Collando-Fernandez, 2003; Moore, 2004).
2.5 WHEAT QUALITY
The characteristics that determine whether a wheat flour is suitable for breadmaking
depend on the cultivar of the wheat, the location where the wheat is grown, the growing
conditions, and the type and extent of milling of the wheat; all these factors have an impact on
the composition of the flour (Lai & Lin, 2006; Lasztity & Abonyi, 2009). The cultivars of
Triticum aestivum L. are divided into either soft or hard wheat cultivars (Veraverbeke & Delcour,
2002; Lai & Lin, 2006; Wheat Marketing Center, 2008; Delcour et al., 2012). Hard and soft
wheat cultivars are classified based on kernel strength and the amount of force necessary to crush
the kernels (Delcour et al., 2012). The hard wheat cultivars, having a higher protein content
(~10-14%), are capable of producing highly elastic dough with extensibility and are typically
utilized for yeast leavened products such as breads (Payne, 1987; Lai & Lin, 2006; Wheat
Marketing Center, 2008; Delcour et al., 2012). In contrast, the soft wheat cultivars, having a
lower protein content (~8-10%), create more extensible doughs and are typically utilized for
producing cookies and pastries (Payne, 1987; Lai & Lin, 2006; Wheat Marketing Center, 2008;
Delcour et al., 2012). The balance between elasticity and extensibility is controlled by genetics
and can differ greatly between wheat cultivars, influencing which wheat cultivars can be used for
certain food products (Payne, 1987).
Breadmaking performance and dough rheology is highly dependent on the differences in
the protein quantity and composition/quality. The quantity and composition/quality of flour
protein gives an indication of whether the flour will be strong enough to create an elastic dough
translating into a low density loaf with a fine and uniform crumb structure (Sliwinski et al., 2004;
Goesaert et al., 2005; Lai & Lin, 2006). To determine wheat quality, a number of protein
characteristics are investigated: total protein, gliadin-to-glutenin ratio, and glutenin content
(especially with respect to the amount of low molecular weight and high molecular weight

18
glutenins and their molecular size distributions) (Sliwinski et al., 2004). A breakdown of some of
the factors that affect dough rheological properties is represented in Table 2.2.
2.5.1 Gluten proteins: glutenin & gliadin
Making up ~80-85% of the total wheat proteins, the gluten proteins are categorized under
the prolamin class in the Osborne classification scheme (Veraverbeke & Delcour, 2002; Goesaert
et al., 2005). The gluten proteins are insoluble in both water and dilute salt solutions; however,
they are partially soluble in alcohol or dilute acidic or alkaline solutions (Goesaert et al., 2005).
Gliadins are a heterogeneous mixture of non-cross-linked proteins soluble in aqueous alcohols
(70% ethanol) with molecular weights varying between 30,000 - 80,000 Da and can occur
biochemically in three types (α, γ, and ω) (Veraverbeke & Delcour, 2002; Sliwinski et al., 2004;
Goesaert et al., 2005). A comparison of the α- and γ-type gliadins to the low molecular weight
glutenin subunits show that they are related through the amino acid sequences classification of
being ‘sulphur-rich prolamins’ (Veraverbeke & Delcour, 2002). There are six cysteine residues
in the α-type gliadins and eight cysteine residues in the γ-type gliadins; these cysteine residues
result in the intra-chain disulphide bonds within these types of gliadins (Veraverbeke & Delcour,
2002). On the other hand, the ω-type lack cysteine residues and are low in methionine, giving
them the classification of ‘sulphur-poor prolamins’ (Veraverbeke & Delcour, 2002).
The glutenins are made up of a heterogeneous mixture of polymers with molecular
weights ranging from 80,000 Da to several millions. These large sizes are the reason that
glutenins are deemed unextractable; however, the glutenin subunits can be extracted upon the
breaking of inter-chain disulphide bonds (Veraverbeke & Delcour, 2002; Sliwinski et al., 2004;
Goesaert et al., 2005). Once the glutenin polymers have been treated with a reducing agent such
as β-mercaptoethanol or dithiothreitol, the smaller polymers are extractable in aqueous alcohol
and the larger polymers are extractable in dilute acid or alkali solutions (Veraverbeke & Delcour,
2002; Sliwinski et al., 2004; Goesaert et al., 2005). It is difficult to determine the
structure/function relationships in gluten because extraction of glutenin polymers alters structure
(Goesaert et al., 2005). The glutenins can be sub-divided into high molecular weight glutenin
subunits (HMW-GS) and low molecular weight glutenin subunits (LMW-GS). The HMW-GS
have molecular weights ranging from 65,000 - 90,000 Da. The LMW-GS can further be broken
down into three types (B-, C-, and D-type) and have molecular weights ranging from 30, 000 -

19
Table 2.2 Factors affecting dough rheology.
Dough rheological properties
Composition of dough Gluten quantity and quality Processing parameters
• Flour
• Damaged starch
• Pentosans
• Yeast
• Water
• Salt (NaCl)
• Shortening/fat
• Sugars
• Emulsifiers
• Preservatives
• Yeast food
• Glutenin
• HMW-GS
• LMW-GS
• HMW-GS/LMW-GS
ratio
• Gliadin
• Gliadin/glutenin ratio
• Size distribution
• Structure
• Type of mixer
• Mixing speed
• Mixing time
*Abbreviations: HMW-GS (High molecular weight glutenin subunits), LMW-GS (Low molecular weight
glutenin subunits).
60,000 Da (Goesaert et al., 2005). The LMW-GS are similar to the gliadins in that they are
‘sulphur rich’, and capable of forming intra-chain disulphide bonds (Veraverbeke & Delcour,
2002). However, the LMW-GS differ from the gliadins in their capability to also form inter-
chain disulphide bonds with the HMW-GS (Veraverbeke & Delcour, 2002). Both the gliadins
and glutenin subunits are high in glutamine and proline (Veraverbeke & Delcour, 2002). The
HMW-GS tend to have higher amounts of glycine than the gliadins and the LMW-GS
(Veraverbeke & Delcour, 2002).
A high quantity and good quality of gluten proteins making up the total protein content of
the wheat flour is important for the manufacture of high quality bread. Numerous researchers
have found that wheat flour performance for breadmaking is linearly related to flour protein
content, and ultimately the gluten fraction, because gluten increases more than the non-gluten
protein fraction with increasing total protein (Finney & Barmore, 1948; Veraverbeke & Delcour,
2002). This linear relationship, however, was found to be dependent on wheat cultivar, which
reveals that the quality of the gluten protein is also a factor (Finney & Barmore, 1948;
Veraverbeke & Delcour, 2002). Gluten imparts dough properties of extensibility, viscosity,
20
elasticity and cohesiveness, as well as contributing to water absorption; the extent of these
characteristics highly depends upon the quality and ratio of the gliadins and glutenins that make
up gluten as each serve a different purpose (Goesaert et al., 2005; Joye et al., 2009).
Gliadins play a role in viscosity and extensibility, and as such act as a plasticizer within
the dough system (Oates, 2001; Goesaert et al., 2005; Joye et al., 2009; Delcour et al., 2012).
Glutenin proteins form a continuous network through inter-molecular disulphide bonding, giving
the gluten network elasticity and cohesiveness (He et al., 1992; Joye et al., 2009). The ratio of
gliadins to glutenins (Gli/Glu ratio) has a significant effect on dough formation properties (dough
stability, development time, viscosity) as well as the final bread product (bread volume and
crumb firmness) (Barak et al., 2013). When there is a high ratio of Gli/Glu, then the dough’s
resistance to extension decreases and extensibility increases to create a weak dough because of
the larger amount of gliadins weakening the interactions between the glutenin chains; when the
ratio is low, increased elasticity is imparted to the dough from the glutenin polymers, allowing
for greater loaf volume upon expansion of the gas (Khatkar et al., 1995; Sliwinski et al., 2004).
Therefore, a necessity for the production of quality bread requires a balance between dough
extensibility from the gliadins and elasticity/strength from the glutenins (Veraverbeke &
Delcour, 2002; Goesaert et al., 2005).
The glutenin fraction plays a larger role, when compared to the gliadin fraction, in
determining the quality differences in bread (Khatkar et al., 1995; Janssen et al., 1996;
Veraverbeke & Delcour, 2002; Sliwinski et al., 2004; Goesaert et al., 2005; Lasztity & Abonyi,
2009). In addition to a higher quantity of glutenins than gliadins being important for the proper
dough formation, composition of the glutenin subunits is also highly important. The differences
in functionality arising from the glutenin fractions comes from differences in the composition
(i.e., amino acids), structure, and/or size distribution of the polymers (Goesaert et al., 2005). Any
differences in the amino acid composition of the glutenin subunits cause changes in the potential
for non-covalent interactions, both between and within the glutenin subunits, and this influences
the elasticity of the glutenin polymer network (Goesaert et al., 2005). All wheat cultivars contain
from 3 to 5 different HMW-GS and between 7 and 16 LMW-GS (Payne, 1987; Oates, 2001;
Goesaert et al., 2005). In general, wheat flours that form strong doughs with long mixing times
contain relatively large amounts of glutenins of large size (Sliwinski et al., 2004).

21
2.6 SODIUM REDUCTION IN DOUGH
Beyond NaCl’s many roles during the baking process and its relationship with wheat
flour quality, salt reduction can have a major impact on the handling of dough (stickiness) and
the final loaf attributes.
2.6.1 Dough stickiness
Dough stickiness is an extremely complex issue and the lack of objective methods to
measure this phenomenon has hindered advances in this research area (Chen & Hoseney, 1995a;
Hoseney & Smewing, 1999; Adhikari et al., 2001). Dough stickiness results when the adhesive
forces (interactions between the dough and mixing surfaces) are high and cohesive forces
(interactions within the dough) are low (Adhikari et al., 2001; van Velzen et al., 2003).
Occurrence of sticky dough is affected by processing parameters such as level of hydration,
mixing conditions (temperature, time, procedure) and formulation (e.g., flour, salt, etc.), which
all affect gluten network formation (Miller & Hoseney, 2008; Beck et al., 2012a). The use of the
1B/1R chromosome translocation to confer disease resistance in wheat breeding programs
resulted in sticky dough problems in industrial bakeries. Reduced dough strength, increased
water absorption and intolerance to over mixing were also seen in these cultivars, pointing to
issues in dough handling performance (Dhaliwal et al., 1990; Hoseney & Smewing, 1999;
Adhikari et al., 2001). Other factors such as wheat flour extraction process (e.g., milling),
amount of water-soluble pentosans, differences in protein composition and quality, -amylase
and proteolytic enzyme activities, also have an effect on dough stickiness making the solution to
the problem highly complex (Chen & Hoseney, 1995a; Hoseney & Smewing, 1999). A means to
overcome sticky dough is through the use of NaCl at ~1.8-2.1% on a flour weight basis
(Farahnaky & Hill, 2007). It is still not fully understood whether the root cause of sticky dough
is a single factor or multiple factors acting in combination. When reducing NaCl levels in bread
dough formulations, the factors described above can play an increasing role in causing dough
stickiness since the presence of a weak gluten network can no longer compensate for the
increased water mobility within the dough.

22
2.6.2 Stickiness component within the 1B/1R wheat cultivars
Gore (1991) found flour extraction affected dough stickiness through its effect on flour
quality. Flour extraction would affect the quality of the wheat flour through the quantity/quality
of the protein as well as the amount of damaged starch present. Much of the research done on
sticky dough has been carried out as the result of the use of the 1B/1R translocation wheat
cultivars. These cultivars have the short arm of the 1B chromosome for wheat replaced by the
short arm of the 1R chromosome from rye, this results in higher yields and good resistance to
stem, leaf, and stripe rusts (Dhaliwal et al., 1988). Although dough stickiness has been found in
wheat cultivars containing the 1B/1R translocation, a strong cause-and-effect relationship is
complicated by numerous other factors that can influence dough handling/stickiness (Dhaliwal et
al., 1988; Barbeau et al., 2003). Different hypotheses have been proposed as to the cause of the
sticky dough in some of the wheat cultivars containing the 1B/1R translocation. For instance,
Zeller et al. (1982) implicated water soluble pentosans as they affect the amount of water that is
absorbed by the dough because of their ability to bind water through hydrogen bonding.
However, Dhaliwal et al. (1988) found that there was a high pentosan content in certain wheat
flours exhibiting no stickiness and flour with a low content of pentosans exhibiting high
stickiness, suggesting that pentosans are not a primary cause of stickiness. Henry et al. (1989)
stated that in translocated wheat cultivars there were higher amounts of β-glucan in the
endosperm of those cultivars producing sticky dough, and therefore β-glucan may be a
contributing factor in dough stickiness.
In a review on dough stickiness in the 1B/1R wheat cultivars, Barbeau et al. (2003)
provided a summary of three potential hypotheses that have the greatest support based on prior
research for the cause of dough stickiness. First, rye secalin proteins coded on the short arm of
the 1R chromosome replace the LMW-GS 1B chromosome, resulting in the loss of the LMW-GS
and the formation of a weaker gluten network (Graybosch et al., 1993; Barbeau et al., 2003). The
second hypothesis attributes the stickiness to the higher content of the cell wall polysaccharides
(pentosans and β-glucans) because of their effect on water absorption (Henry et al., 1989;
Eliasson & Larsson, 1993a; Barbeau et al., 2003). The third hypothesis, presented by Chen and
Hoseney, (1995b) was based on the finding that in some of the 1B/1R translocation cultivars
with optimal mixing and appropriate water absorption dough stickiness was still evident.
Therefore, they stated there may be a water-soluble compound causing sticky dough, which they

23
identified as a ferulic acid ester of hexose-containing polysaccharide (Chen & Hoseney, 1995b;
Barbeau et al., 2003).
The proper formation of an evenly dispersed gluten network is a crucial element in
forming the structure of bread and the rheological properties of the dough. In the literature, it is
agreed that anything that affects the rheological properties of the dough can have an effect on
dough stickiness, therefore making the gluten network a primary factor to examine when
studying dough stickiness. Factors (i.e., mixing conditions, water mobility, and temperature) that
affect the bonding between the gluten proteins through non-covalent bonds (hydrogen bonds,
ionic bonds and hydrophobic interactions) affect the formation of the gluten network because
those bonds are necessary for aggregation of the gliadins and glutenins, which determine the
structure and physical properties of dough (Wieser, 2007).
2.6.3 Stickiness as a result of processing parameters
Mixing conditions and water content play a major role in determining the quality of the
protein-protein interactions which occur. Mixing conditions (i.e., mixer type, rotation speed,
mixing time and water content) affect the gluten network by either: a) increasing the level of
protein alignment which leads to a greater amount of protein-protein interactions, bonding and
structure development within the dough; or b) disrupting the bonds between the proteins (over-
mixing), which results in structure breakdown and a sticky dough (Singh et al., 2002). An
optimal mixing time is related to optimum baking performance and good crumb structure (Zghal
et al., 1999). Mixing time is also considered to be positively correlated with the polymeric
protein composition, the ratio between glutenins and gliadins, flour quality and amount of other
ingredients (e.g., salt) (Letang et al., 1999; Dobraszczyk & Morgenstern, 2003; Angioloni &
Rosa, 2005). As previously discussed, initial mixing serves to hydrate the flour components and
at this point the glutenin proteins are folded with random orientation of the protein chains. As
mixing time is increased, the glutenin polymers align with the shear and stretching forces of the
mixer, followed by the formation of cross-links between the proteins (Letang et al., 1999). A
large number of protein-protein interactions ensues to create a gluten network that increases
dough strength. A strong dough is a non-sticky dough (Letang et al., 1999). Once the dough has
been mixed beyond its optimum mixing time (determined by the maximum Barbender
consistency of the dough measured by either a mixograph or farinograph), the disulphide bonds

24
that hold the glutenin polymers together can be broken leading to depolymerization and the
creation of lower molecular weight glutenin subunits. The latter leads to a decrease in Barbender
consistency and thus a sticky dough because of the presence of smaller protein chains (Letang et
al., 1999).
2.6.4 Stickiness due to level of damaged starch
Another factor that can influence the hydration of the gluten network is the level of
damaged starch within the flour. Native starch granules are thought to not contribute to dough
stickiness during the dough formation stage; however, damaged starch does contribute to dough
stickiness. Starch granules become damaged during milling of wheat into flour. Typically, ~5-
8% of starch is physically damaged during the milling process; although minor in quantity, this
level of damaged starch can play a significant role in water mobility (Van Der Borght et al.,
2005). The amount of damaged starch is dependent upon the degree of grinding and the hardness
of the wheat (Van Der Borght et al., 2005). Damaged starch’s contribution to dough stickiness is
not fully understood. Within the literature, it is hypothesized that during the mixing stage the
protein and the starch compete for water, and this competition is dependent upon the level of
damaged starch present (Eliasson & Larsson, 1993a; Butow et al., 2002). Damaged starch has
lost its birefringence because of the physical changes to the crystalline structured region; because
of the latter, damaged starch absorbs more water than native starch (Goesaert et al., 2005; Van
Der Borght et al., 2005). Starch provides support to the dough structure, whereas damaged starch
is more susceptible to enzymatic hydrolysis; which can lead to some loss of structure as the
starch is converted to sugars resulting in the dough becoming sticky (Goesaert et al., 2005; Van
Der Borght et al., 2005; Wheat Marketing Center, 2008). Jekle and Becker (2011) proposed that
when there is excess water present within the dough, the hydration of starch granules may
increase causing the granules to expand or congregate. This increase in starch granule size and
aggregation would impede the gluten network development due to the barriers created by starch
granules. The increase in water uptake by the starch granules will also create a protein dilution
effect according to Jekle and Becker (2011).

25
2.6.5 Stickiness due to water mobility/protein hydration
When Chen and Hoseney (1995a) used flour that had a propensity to form sticky dough
and decreased the amount of water added, a less sticky dough was created. Jekle and Becker
(2011) found that with increased water content, dough stickiness significantly increased and the
storage modulus decreased indicating that there was a loss in structure. They concluded that the
excess water created an increased contact area between the dough and the stickiness fixture and
thus increased the adhesion force between surfaces. van Velzen and others (2003) explained
increased adhesion as the increased stickiness resulting from the degree of hydration of the
gluten protein. As the hydration increases the mobility of the proteins increases and thus gluten
proteins migrate to the upper dough layers from the bulk. This then decreases the starch content
at the upper layers of the dough and the starch may be pushed to deeper layers where the starch
absorbs the excess water and swells. Movement of the gluten proteins to the surface and the
decrease in the starch content at the surface of the dough led van Velzen and others (2003) to
conclude that it is the gluten protein hydration that plays an important role in dough stickiness.
This explanation was reached through the use of attenuated total reflectance and Fourier
transform infrared spectroscopy of the dough’s surface. They found that at higher hydration
states of the gluten protein there were higher amide intensities at the surface as opposed to the
starch and water. Jekle and Becker (2011) noted that when there is a greater amount of water in
the dough, the excess hydration will increase the inter-molecular space between the protein phase
and the starch phase. Jekle and Becker (2011) examined the effect of water addition on the
dough structure through the use of confocal laser scanning microscopy and showed a transition
from a gluten network that is not fully formed/ uniformly distributed with the lowest water
addition to a gluten network that becomes uniformly distributed and properly formed with more
of an optimal water addition (water level necessary for maximum dough consistency – near the
500 Barbender Unit line) to a gluten network that becomes disrupted and unevenly distributed
(the proteins become more aggregated and space is taken up by the water, starch granules and air
bubbles) with the addition of excess water. Despite this, it is not fully understood whether it is
the effect of the water’s interaction with the protein phase or the starch phase or both that results
in dough stickiness, but it is generally agreed upon that water and the mobility of water affects
dough stickiness. This effect of water on dough stickiness can be overcome, to an extent, by the
addition of salt.

26
2.6.6 Prevention of stickiness with sodium chloride (salt)
Among its multiple roles in the breadmaking, salt is important for prevention of dough
stickiness. Salt is used within the dough formulation to induce protein-protein interactions to aid
in the creation of a strong gluten network. Salt increases the dough development time, dough
stability, mixing tolerance, resistance to extension, extensibility, gelatinization temperature, and
peak viscosity; on the other hand, it decreases water absorption as determined by farinograph
measurements (Hlynka, 1962; Linko et al., 1984; Butow et al., 2002; Farahnaky & Hill, 2007).
The increase in the aforementioned dough characteristics indicates that the salt creates stronger
dough and therefore a well-structured gluten network, which will not be sticky. In the flour-water
system (pH of ~6.0), the gluten proteins are below their isoelectric point, which is ~ pH 7.5, and
hence they carry a net positive charge (Gennadios et al., 1993; Miller & Hoseney, 2008). This
results in repulsion between the gluten proteins and faster protein hydration, resulting in shorter
mixing time because proteins are kept from interacting, creating a weaker sticky dough (Miller &
Hoseney, 2008). Because gluten proteins contain 35% hydrophobic amino acids, 35%
hydrophilic, and 7% charged amino acids it is apparent that hydrophobic interactions between
the proteins play a major role in the formation of the gluten network (Preston, 1989; He et al.,
1992; Butow et al., 2002; Miller & Hoseney, 2008).
Once salt is added, it acts to shield the charges on the protein enabling the proteins to
interact/aggregate through hydrophobic interactions leading to a decrease in the level of
hydration of gluten proteins and a strengthening of the gluten network (Figure 2.1A, B) (Preston,
1989; Butow et al., 2002; Miller & Hoseney, 2008). This charge shielding increases the amount
of protein-protein interactions through hydrophobic interactions, and decreases the amount of
water-protein interactions. Salt occupies the sites originally taken up by the water hydrating the
gluten proteins creating a more structured and less soluble protein network (Butow et al., 2002;
Miller & Hoseney, 2008). Therefore, this results in an increase of unabsorbed water present as a
result of increased protein-protein interactions within the gluten structure (Hlynka, 1962; Butow
et al., 2002). Removing salt from the dough formulation results in weak and sticky dough as a
result of poor gluten network formation caused by increased water-protein interactions and
decreased protein-protein interactions (Figure 2.1C, D).

27

28
Figure 2.1 Depiction of the gluten network formation during mixing conditions with and
without sodium chloride. Forming a strong gluten network and non-sticky dough
in situation (A) & (B) and a weak gluten network and sticky dough in situation
(C) & (D).

29
2.6.7 Effect on gluten network formation
Salt influences the physical requirements needed for proper dough development. When
salt is removed from the formulation, the processing parameters must be altered because salt
affects the water absorption of the flour, the mixing time, the mixing intensity, and the relaxation
time needed (Belz et al., 2012). As discussed above, salt enhances the interaction between the
gluten proteins creating a uniformly structured network as seen in Figure 2.1 (A & B). When the
salt is removed, there is an increase in water-protein interactions and fewer protein-protein
interactions resulting in the formation of a weak network as seen in Figure 2.1 (C & D). Through
the use of confocal laser scanning microscopy, Beck et al. (2012a) were able to see that with a
reduction in salt the gluten protein network changed from a structure with elongated protein
strands to a network with less connected protein particles. Similar visual results of a decrease in
the structured protein network with sodium reduction were also seen by Lynch et al. (2009) and
McCann and Day (2013). The reduced protein-protein interactions are in part due to the loss of
the electrostatic shielding effect of the salt inducing increased charge repulsion within the gluten
network, and in part to increased protein hydration (McCann & Day, 2013).
For a stable dough with a strong gluten network, experimental results indicate a
decreased water absorption (as measured with a farinograph), increased peak time/dough
development time, decreased mixing tolerance index (MTI) value, increased dough stability
time, increased resistance to extension, and increased extensibility; all are indicative of greater
amounts of protein-protein interactions (Hlynka, 1962; Salovaara, 1982a; Linko et al., 1984;
Letang et al., 1999; Kaur et al., 2011; Belz et al., 2012). In contrast, salt reduction within the
dough formulations had been shown to lead to a weaker gluten network being formed. This weak
network is evident by an increase in water absorption of the dough, decreased peak time/dough
development time, increased mixing tolerance index or dough breakdown, decreased dough
stability, decreased resistance to extension, and decreased extensibility, all of which translate
into a sticky dough (Lynch et al., 2009; Belz et al., 2012; McCann & Day, 2013).
2.6.8 Effect on final bread product
The removal/reduction of salt from the dough formulation also has a negative impact on
the bread’s final quality from the visual appearance to the flavour and shelf life. Because salt
impacts the formation of the gluten network and the activity of yeast, it also influences the crust

30
texture, colour, and flavour (Belz et al., 2012). With less salt there is more yeast activity, which
results in decreased levels of free reducing sugars for the Maillard reaction to create the desired
crust colour and flavour (Belz et al., 2012). Czuchajowska et al. (1989) reported that bread made
without salt had a lighter crust colour due to the decreased Maillard reaction products resulting
from the salt reduction. Lynch et al. (2009) found that bread without salt staled quicker than
bread containing salt, and they concluded that because salt plays a role in controlling water
mobility (through increased ordering of the gluten network) and reducing the rate of water
migration from the crumb to the crust, there is greater water migration and thus staling. They
also found that bread prepared without salt had an uneven crumb structure due to a weaker and
less structured gluten network (Lynch et al., 2009). In regard to sensory attributes, Lynch et al.
(2009) found that bread without salt was described as having a high “sour/acidic”, “sour dough”,
and “yeasty” flavour. McCann and Day (2013), Czuchajowska et al. (1989), and He et al. (1992)
found that loaf volume decreased with decreasing salt content. In contrast, Lynch et al. (2009)
and Beck et al. (2012b) found an increase or no change in loaf volume with the reduction of salt.
The differences between these studies could be due to differences in the processing parameters
(i.e. mixing conditions: speed, time, energy input, temperature; mixer style;
fermentation/proofing time; baking temperature and time) of the bread, the formulation (i.e.,
amount of yeast used, use of shortening or not) and protein quantity/quality of the flour.
2.7 STRATEGIES USED TO LOWER SODIUM
To combat the effects of sodium reduction on dough handling and stickiness, various
approaches have been investigated to improve gluten network formation.
2.7.1 Effect of replacement of sodium with alternative salts
Research has examined methods to overcome sticky dough with the removal/reduction of
salt. The most researched strategy examines the replacement of the sodium ion (Na+) with
potassium (K+), calcium (Ca2+), and magnesium (Mg2+) (to name a few) to remediate the
problem of sticky dough and maintain ideal dough rheology, while at the same time reducing the
levels of sodium within the bread. The effect of different cations is related to their position in the
lyotropic series, also known as the Hofmeister series, which ranks ions based on ability to cause
protein aggregation or dissociation (Salovaara, 1982a; Preston, 1989; Miller & Hoseney, 2008).

31
Within the series, both anions and cations are ranked in order of most stabilizing to destabilizing
(He et al., 1992; Miller & Hoseney, 2008). Stabilizing ions lead to less hydration, more structure
and decreased protein solubility, whereas destabilizing ions lead to more hydration and increased
protein solubility, thus affecting both hydrophobic interactions and hydrogen bonding (Preston,
1989; Butow et al., 2002; Miller & Hoseney, 2008). The ranking of most to least stabilizing
cations are: NH4+
> Cs+ > Rb+ > K+ = Na+ > H+ > Ca2+ > Mg2+ > Al3+ (He et al., 1992; Miller &
Hoseney, 2008). Therefore, it would be expected that with the use of a stabilizing cation there
would be increased protein-protein interactions to promote the formation of a stronger gluten
network and thus a non-sticky dough. It appears from the literature that K+ is the best option for
maintaining similar dough rheology to doughs containing sodium chloride since K+ is equivalent
to Na+ in the lyotropic series. However, this replacement comes with the significant challenge of
a metallic/bitter flavour (Salovaara, 1982a; Miller & Hoseney, 2008; Belz et al., 2012).
The farinograph is the most common analytical technique used to examine dough
rheology as it provides information on dough water absorption, dough development time/peak
time (amount of time required for dough to reach maximum consistency), mixing tolerance index
(measure of gluten breakdown leading to dough softening) and dough stability (Salovaara,
1982a; Letang et al., 1999; Kaur et al., 2011). These results indicate whether a specific dough
formulation will result in a sticky dough (a weak gluten network), or stable dough (strong gluten
network). For a stable dough with a strong gluten network, farinograph results indicated
increased peak time, a decreased mixing tolerance index (MTI) value and an increased dough
stability time, illustrating more protein-protein interactions (Salovaara, 1982a; Letang et al.,
1999; Kaur et al., 2011). Both Salovaara (1982a) and Kaur et al. (2011) examined partial NaCl
replacement with potassium chloride (KCl), calcium chloride (CaCl2) and magnesium chloride
(MgCl2). Kaur et al. (2011) reported that 100% replacement of NaCl with KCl and CaCl2 caused
a significant increase in water absorption showing that 100% replacement of NaCl is not feasible
as this could lead to stickier dough because there would be more unabsorbed water available at
the dough’s surface to participate in adhesive forces. This increased hydration of the gluten
proteins would cause a decrease in cohesive forces within the dough. Kaur et al. (2011) also
found that with lower levels (~25%) of substitution, water absorption decreased slightly, which
is beneficial because more protein-protein interactions occurred so as to create a stronger gluten
network and stronger dough through increased cohesive forces. Therefore, lower levels of

32
replacement may be feasible in decreasing the amount of NaCl used. Salovaara (1982a) found
that with the addition of CaCl2 and MgCl2 peak times were significantly shorter than with 100%
NaCl. This is not ideal because longer peak times are desired for the creation of a stronger gluten
network to prevent potential over-mixing. However, Salovaara (1982a) found that by replacing
NaCl with KCl, no significant changes in peak time were observed. Kaur et al. (2011) found that
replacing NaCl with both 25% and 50% KCl led to a slight increase in peak time, which is
beneficial for creating a strong gluten network.
Based on these studies, it can be suggested that KCl at a NaCl replacement concentration
of ~25-50% would maintain dough rheology while achieving a significant reduction in sodium in
the final product. This partial replacement formulation also prevents sticky dough in a similar
manner as 100% NaCl by shielding protein charges resulting in protein aggregation so as to
create a stronger gluten network with greater cohesive forces. The mechanism is based on the
fact that K+ is a monovalent ion similar to Na+ both chemically and physically. Potassium has
been ranked equivalent to Na+ in the lyotropic series meaning that they would have similar
abilities to cause protein aggregation and have a similar strengthening effect on the gluten
network. They are considered stabilizing cations that cause less hydration of the proteins and
increased protein structure formation. Although KCl is a possible option for Na+ reduction in
bakery products, a significant drawback is the metallic off-flavor imparted by this compound.
Further research is required to discover an alternative ingredient that will combat both the sticky
dough and off-flavor, whilst taking into account all the other factors that may interact to cause
sticky dough.
2.7.2 Enzymes as an alternative to salt
Enzymes have demonstrated the potential to overcome the sticky dough problem;
however, studies to date have not been conducted under low sodium conditions. The components
of the flour that can be modified by enzymes include: proteins (therefore the gluten network),
lipids, pentosans, and starch, which ultimately would modify the dough rheology and impact the
dough stickiness (Steffolani et al., 2012). Steffolani et al. (2012) examined a combination of
enzymes (glucose oxidase [promotes protein cross-linking], -amylase [hydrolyzes starch into
-dextrins], and xylanase [hydrolyzes water insoluble arabinoxylans into LMW water soluble
arabinoxylans]) and their effect on dough stickiness/hardness. Glucose oxidase was found to
33
decrease dough stickiness with increasing concentrations of enzyme since it led to the formation
of a stronger gluten network. In contrast, xylanase was found to increase dough stickiness with
increasing concentrations of enzyme as a result of excessive pentosan hydrolysis and thus, higher
water absorption. Alpha-amylase however, was found to have little effect on dough stickiness.
With an optimum combination of the glucose oxidase, xylanase, and -amylase it was found that
the effects of each enzyme could be balanced to create dough with low stickiness (Steffolani et
al., 2012). Other enzymes (i.e., transglutaminase, glucose oxidase, hexose oxidase, laccase),
directly or indirectly, can also be used to enhance the formation of the gluten network by
promoting the formation of covalent bonds between polypeptide chains through oxidative cross-
linking of SH groups, cross-linking tyrosine residues, or acyl-transfer reactions between amino
acid residues (Joye et al., 2009). With low levels of transglutaminase, the dough development
time, dough stability, and resistance to extension increased and water absorption, extensibility,
and stickiness decreased (Basman et al., 2002; Tseng et al., 2002; Caballero et al., 2005; Joye et
al., 2009). Therefore, enzymes with the ability to alter dough properties may be a prospective
alternative to salt replacers in the battle against sticky dough.
2.8 CONCLUSIONS
Although the ultimate goal of governmental regulators (e.g., Health Canada) is to
increase the health and well-being of its population and to decrease stress on the health care
system, sodium reduction policies can create significant techno-functional issues for large scale
bakeries. The challenge of decreasing or removing salt from bread formulations, when compared
to other processed foods, is not only about the loss of flavour, but also about the loss of dough
handling properties and final bread product quality. However, a greater understanding of the
stickiness phenomenon is needed in order to help develop strategies to mediate the effect of salt
reduction on dough handling.

34
3. CHARACTERIZATION OF FOUR CANADA WESTERN RED SPRING (CWRS)
WHEAT FLOURS AND THEIR COMPOSITIONAL EFFECT ON DOUGH
FORMATION AND STRENGTH
3.1 ABSTRACT
The chemical composition of flours milled from four different CWRS wheat cultivars
(Pembina, Roblin, McKenzie and Harvest) were analyzed, and then related to the rheological
properties and morphology of their doughs prepared with 2% NaCl. All cultivars showed similar
proximate composition and were all of high quality with minimal enzymatic activity/degradation.
McKenzie and Harvest cultivars had significantly higher levels of damaged starch (~7.1%) than
Pembina and Roblin (~5.7%), which would have an impact on the hydration of the gluten
proteins and thus the formation of the gluten network. The amino acid profiles and free thiol
content were similar among the flours, however major differences were noted with respect to
gluten quality. Both Pembina and Roblin showed a significantly higher gluten index and gluten
performance index, as it relates to solvent retention capacity, than both McKenzie and Harvest.
However, dough prepared using Pembina flour showed the greatest resistance to extension
relative to the dough prepared with Roblin, McKenzie and Harvest cultivars. Pembina was found
to have a higher amount of low molecular weight glutenin (insoluble) proteins relative to Roblin,
which had higher amounts of high molecular weight glutenin (insoluble) proteins, possibly
accounting for the differences in dough strength. McKenzie and Harvest flours were higher in
gliadin contents than Pembina and Roblin. All flours formed a unidirectional gluten network
within the dough, with the exception of Harvest which was more porous in nature.

35
3.2 INTRODUCTION
Wheat flour is the main ingredient in bread and is comprised of starch (~70-75%), water
(~14%), protein (~10-12%), non-starch polysaccharides [arabinoxylans] (~2-3%), and lipids
(~2%) (Goesaert et al., 2005). These major and minor components are all relevant in determining
flour quality, which plays a vital role in determining functionality and end product uses. For
different bakery products wheat quality is defined differently. For breadmaking, good quality
flour generally requires high water absorption, good gluten strength and relatively high damaged
starch and arabinoxylans (pentosans) (Kweon et al., 2011). A dough with good handling
properties is one that is stable and has a strong gluten network. Research indicates that an
increased peak time/dough development time, decreased mixing tolerance index value, increased
dough stability time, increased resistance to extension, and increased extensibility all indicate a
greater amount of protein-protein interactions and thus a stronger gluten network (Hlynka, 1962;
Salovaara, 1982a; Linko et al., 1984; Letang et al., 1999; Kaur et al., 2011; Belz et al., 2012).
These qualities along with the balance of resistance to extension and extensibility result in a high
quality final bread product with good loaf volume and a uniform crumb structure (Barak et al.,
2013; Delcour & Hoseney, 2013b). Structurally, in the dough, the main elements are the starch
(native and damaged), non-starch polysaccharides, water and air which are all embedded in the
water-soluble and insoluble gluten proteins (Jekle & Becker, 2011). Therefore the gluten proteins
and starch play a major role in determining dough handling properties.
During the mixing stage of dough formation, the gluten proteins become hydrated,
aligned and interconnected due to shear and form a continuous viscoelastic gluten network (Jekle
& Becker, 2011). This network is comprised of the glutenins and gliadins, and together they
impart dough properties of strength, elasticity, cohesiveness, viscosity, extensibility and
contribute to water absorption (Wieser, 2007; Joye et al., 2009). The extent of each
characteristic is highly dependent on the quality and ratio of gliadins and glutenins as each serve
a different role (Goesaert et al., 2005; Joye et al., 2009). Viscosity and extensibility are imparted
to the dough through the gliadins, which are monomeric proteins with molecular weights ranging
from 30,000 - 80,000 Da, and thus act as plasticizers within the dough system (Oates, 2001;
Goesaert et al., 2005; Joye et al., 2009; Delcour et al., 2012). They are soluble in aqueous
alcohol. The glutenins however are a heterogeneous mixture of polymeric proteins with
molecular weights ranging from 80,000 - several million Da and form a continuous network
36
through inter-molecular disulphide bonding which gives the gluten network its elasticity,
cohesiveness and strength (Veraverbeke & Delcour, 2002; Joye et al., 2009; Delcour et al.,
2012). They are highly insoluble due to their very large size, however, with the use of a reducing
agent the disulphide bonds within the glutenin network are broken and result in high molecular
weight and low molecular weight glutenin subunits (HMW-GS, LMW-GS) which are soluble in
aqueous alcohol (Delcour et al., 2012). There are generally two parameters that define gluten
protein quality: the ratio of glutenin to gliadin, and the composition of the glutenins (HMW-GS
vs LMW-GS) (Janssen et al., 1996; Goesaert et al., 2005).
The ratio of glutenin to gliadin has a significant effect on the dough handling properties
with respects to development time, stability and viscosity; as well as the final bread product with
respects to bread loaf volume and crumb texture and structure (Barak et al., 2013). When a wheat
cultivar has a lower ratio of glutenins to gliadins it results in dough with decreased resistance to
extension and increased extensibility. This is due to the formation of a weaker gluten network
because the higher amount of gliadins weaken the interactions between the glutenin chains and
can act as chain terminators. However, when there is a higher ratio of glutenins to gliadins it
results in increased dough elasticity because of the increase in glutenin polymers present to form
the continuous network. This allows for better dough handling properties and an increase in loaf
volume as a result of gas expansion (Khatkar et al., 1995; Janssen et al., 1996; Uthayakumaran et
al., 2000; Sliwinski et al., 2004). A balance between the dough properties exhibited from the
glutenins and the gliadins is necessary for quality bread production.
Differences in the quality of the glutenin fraction arises from the composition (number
and position of cysteine residues), secondary structure with respect to non-covalent interactions
between glutenin chains, and size distribution (Veraverbeke & Delcour, 2002; Goesaert et al.,
2005). The glutenin macropolymer is made up of HMW-GS and LMW-GS. The HMW-GS have
molecular weights ranging from ~70,000 - 90,000 Da and the LMW-GS have molecular weights
ranging from ~30,000 - 60,000 Da (Oates, 2001; Veraverbeke & Delcour, 2002; Goesaert et al.,
2005; Delcour et al., 2012). In the research it is the HMW-GS polymers that are considered the
most important for the formation of a continuous gluten network and good dough handling
properties as they are believed to form the backbone of the network with the LMW-GS polymers
branching off from the main HMW-GS chain (Wieser, 2007). The HMW and LMW-GS have
repetitive regions of glutamine, glycine and proline with N and C-terminals which contain the

37
cysteine amino acids. Through these regions of repetition non-covalent bonds are capable of
being formed to serve for increased protein-protein interaction through hydrogen bonding with
the high level of glutamine, ionic bonds with the low levels of charged amino acids (between
acidic and basic groups) and hydrophobic bonds formed through the interaction of the aromatic
amino acids (Hoseney, 1998d; Wieser, 2007). Although there are only a few cysteine amino
acids in the ends of the glutenin subunit N and C terminals, they are crucial for forming the
disulphide bonds which strengthen the gluten network. All these types of bonds are responsible
for the structural and handling properties of the dough (Wieser, 2007).
The starch (both native and damaged) and non-starch polysaccharides (pentosans) also
have an effect on dough handling properties as they are capable of absorbing large amounts of
water and thus effect gluten protein hydration and the rheological properties of the dough with
respect to the viscous properties (Oates, 2001; Goesaert, 2005; Bekes et al., 2006). In the mixing
stage, the native starch granules are capable of absorbing 46% of the water and are believed to
act as fillers within the continuous gluten network and reinforce the gluten network upon baking
(Goesaert et al., 2005). A limited amount of damaged starch is considered desirable for
breadmaking as it is able to absorb more water than native starch and it is susceptible to
enzymatic hydrolysis, thus it supports the fermentation stage (Goesaert, 2005; Delcour et al.,
2010). However, flour that has too much damaged starch is detrimental to the dough
functionality as it can negatively impact the handling properties and the final baking
performance (Delcour et al., 2010). Petrofsky and Hoseney (1995) found that starch added at
different levels but constant gluten levels gave large rheological differences which led them to
conclude that starch plays an active role in determining dough rheological characteristics.
Therefore, it is important to understand the connection between changes of the microstructure of
the gluten network and starch (damaged vs native) as it relates to the macroscopic properties of
the dough (Jekle & Becker, 2011).
The overall goal of this research was to characterize the composition of four Canada
Western Red Spring (CWRS) wheat flours, and then relate their chemistry to the rheological
properties of the dough.

38
3.3 MATERIALS AND METHODS
3.3.1 Materials
Four CWRS flour cultivars (Pembina, Roblin, McKenzie, and Harvest) were kindly
provided by the Crop Development Center at the University of Saskatchewan (Saskatoon, SK).
The four cultivars were grown in plots at the University of Saskatchewan’s Kemen Crop
Research Farm under rain-fed conditions on fallowed land. The previous crops in the rotation
were canola, pea and barley. All cultivars were seeded May 21, 2013 and each cultivar was
grown in a 2.4 m wide by 15.2 m long plot with row spacing of 17.8 cm. The herbicide,
fungicide and fertilizer used were: Buctril M (1.0 L/ha) [applied June 11, 2013], Headline (0.4
L/ha) [applied June 28, 2013], and 56.0 kg/ha 23-23-0-10 [applied with seed], respectively. For
seed conditioning: 13/64 round holed screen to scalp, 5.5 X ¾ slotted and 12 triangle buckwheat
screens to sift were used. The cleaned amounts for each cultivar were: Pembina-40 kg, Roblin-48
kg, McKenzie-42 kg and Harvest-60 kg. Pembina was developed at the Canada Department of
Agriculture Research Station (Winnipeg, MB, Canada) by the Rust Area Project Group; it is
unlikely to be grown outside of the rust area and is best suited to the Red River Valley
(Campbell, 1963). Pembina is a cultivar that has an excellent baking quality, a yield comparable
to that of Selkirk grown in the Red River Valley, slightly more rust resistance than Selkirk and
has a one day earlier maturation than Selkirk (Campbell, 1963). Roblin is a cultivar for the
eastern prairies of Canada that was developed at the Agriculture Canada Research Station
(Winnipeg, MB, Canada) it has a similar quality to Marquis, and is a high-protein, early-
maturing and rust-resistant cultivar (Campbell & Czarnecki, 1987). McKenzie was developed by
the Saskatchewan Wheat Pool (Agricultural Research and Development, Saskatoon, SK,
Canada) and has a high grain yield; early maturity; high test weight; high falling number;
resistance to stem rust, leaf rust, and common bunt; and has intermediate resistance to Fusarium
head blight (Graf et al., 2003). McKenzie is a cultivar suited to all areas of the Canadian Prairies
(Graf et al., 2003). Harvest is a cultivar that was developed by Agriculture and Agri-Food
Canada (Cereal Research Centre, Winnipeg, MB, Canada) that is suitable to the wheat-producing
regions of the Prairies (Fox et al., 2010). Harvest has the qualities of high-yield, high test weight
and preharvest sprouting resistance (Fox et al., 2010). Milling of the four selected wheat
cultivars was done on a Buhler MLU202 Experimental Mill according to the American

39
Association of Cereal Chemists International approved method 26-21.02. Prior to milling the
grain was tempered to a moisture of 15.5% for ~ 16 hrs.
The following chemicals were purchased from VWR (Mississauga, ON, Canada): 5,5'-
dithiobis-2-nitrobenzoic acid (DTNB) [Ellman’s reagent], hydrochloric acid (HCl), lactic acid
(C3H6O3), sodium carbonate (Na2CO3), sodium chloride (NaCl) and sodium dodecyl sulfate
(SDS). The following chemicals were purchased from Sigma Aldrich (Oakville, ON, Canada):
Ethylenediaminetetraacetic acid (EDTA), rhodamine B, sucrose (C12H22O11), Tris-hydrochloride
(Tris-HCl), urea (CH4N2O), Cleland’s reagent (dithiothreitol [DTT]) high purity, ribonuclease A
from bovine pancreas, trifluoroacetic acid, trizma-base, trizma-HCl and vinyl pyridine. The
following chemicals were purchased from Fischer Scientific (Toronto, ON, Canada): acetonitrile
HPLC grade and 1-propanol HPLC grade. Nitrogen gas (N2) was purchased from Praxair Canada
Inc. (Saskatoon, SK, Canada). All chemical reagents were of ACS reagent grade except for SDS
which was ultrapure. The water used in this research was produced from a Millipore Milli-QTM
water purification system (Millipore Corp., Milford, MA, USA).
3.3.2 Characterization of the flours
3.3.2.1 AACCI approved flour characterization methods
The protein, ash, moisture and lipid contents within the flours were determined using the
American Association of Cereal Chemists International (AACCI) approved methods 46-30.01,
08-03.01, 44-15.02 and 30-25.01, respectively. Rapid viscoanalysis (RVA) (Std. method 2), the
gluten index (GI), the falling number, the damaged starch content and single kernel
characterization (SKCS) were also performed according to AACCI methods 76-21.01, 38-12.02,
56-81.03, 76-31.01 and 55-31.01, respectively. Farinograph and mixograph analysis were
performed according to AACCI methods 54-21.02 and 54-40.02, respectively. Doughs for
mixograph analysis were mixed to a total time of 10 min in order to achieve a full analysis of
dough development and breakdown. Measurements were performed in duplicate.
3.3.2.2 Amino acid (AA) profiling
Amino acid analysis was performed on each flour at POS BioSciences Corp. (Saskatoon,
SK, Canada) utilizing acid/heat hydrolysis followed by quantification using chromatographic
techniques. In brief, ~20 mg of each flour was weighed into separate 20 x 150 mm screw cap

40
Pyrex tubes containing 15 mL of 6 N HCl. Each tube was then flushed with N2 gas. The tubes
were then capped and placed into an oven at 110°C for 20 h. After acid hydrolysis, the individual
amino acids were quantified by high pressure liquid chromatography using the pico-tag amino
acid analysis system (Waters Corporation, Milford, MA, USA) (White et al., 1986; Landry &
Delhaye, 1993; AOAC Official Method 985.28, 1995; AOAC Official Method 988.15, 1995).
3.3.2.3 Free thiol content
Free thiol contents were determined on each flour based on the combined methods of
Anderson and Ng (2000), Puppo et al. (2005) and Steffolani et al. (2010). All measurements
were performed on flour samples in triplicate. For free thiol content determination, 2 mL
Eppendorf tubes were prepared with 1.5 mL reaction buffer [8 M urea, 3 mM EDTA, 1% SDS
and 0.2 Tris-HCl at pH 8], 50 µL of Ellman’s reagent [8 M urea, 3 mM EDTA, 1% SDS, 0.2
Tris-HCl and 10 mM DTNB at pH 8]. Then ~30 mg of flour was added to each tube and
vortexed for 30 s on speed 8 (VWR analog vortex mixer 120V, Mississauga, ON, Canada). The
samples were then placed on an agitation shaker (VWR® Standard Orbital Shaker, Model 3500,
Mississauga, ON, Canada) at speed 4 for 1 h in the dark. Samples were then placed in a
microcentrifuge (Eppendorf® Microcentrifuges, 5424/5424R, Mississauga, ON, Canada) for 10
min at 13,600 x g at room temperature (21-23°C). The absorbance of the supernatants was read
at 412 nm using a UV-VIS spectrophotometer (Genesys 10uv Scanning Thermo Scientific,
Waltham, MA, USA). An extinction coefficient of 13,600 M-1cm-1 and a microcuvette with a
path length of 1 cm was used. A blank was prepared for each flour (~ 30 mg) and contained 1.55
mL of the reaction buffer (i.e., 1.55 mL of reaction buffer to get a total volume of 1.55 mL
instead of 1.5 mL and 50 µL of colour reagent).
3.3.2.4 Solvent retention capacity (SRC)
A solvent retention test was carried out on each of the four flours (Pembina, Roblin,
McKenzie, and Harvest) utilizing the AACCI method 56-11.02 (2009) with a slight
modification, to establish the gluten protein characteristics, levels of damaged starch, sucrose
and pentosan components. Four solvents were prepared and used on each flour: (1) deionized
and distilled water (DDH2O) (associated with all water absorbing components in flour); (2) 50%
sucrose in DDH2O (w/w) (associated with pentosan components); (3) 5% sodium carbonate in

41
DDH2O (w/w) (associated with levels of damaged starch); and (4) 5% lactic acid in DDH2O
(w/w) (associated with glutenin proteins). First, the weight of a 50 mL conical bottom
polypropylene centrifuge tube (with lid) was recorded and then 5 g of a flour sample was
weighed into the tube to enable for mixing with the solvent. Then 20 g of one of the solvents
(i.e., solvent 1, 2, 3 or 4) was added to the tube and vortexed at setting at speed 10 (VWR analog
vortex mixer 120V, Mississauga, ON, Canada) for 5 s at 5, 10, 15, and 20 min. The sample was
then centrifuged for 15 min at 1000 x g (VWR Clinical 200, Mississauga, ON, Canada). Then the
tube was inverted and drained for 10 min and the remaining residue weighed. These steps were
repeated with each of the solvents on the same flour sample and then repeated for the 3 other
flour samples. Measurements were performed on triplicate flour samples. To calculate the
percent SRC, equation 3.1 below was used. Then from the calculated SRC for each component
the gluten performance index (GPI) was calculated using the formula in equation 3.2 (Kweon et
al., 2011).
% 𝑆𝑅𝐶 = [𝑔𝑒𝑙 𝑤𝑒𝑖𝑔ℎ𝑡
𝑓𝑙𝑜𝑢𝑟 𝑤𝑒𝑖𝑔ℎ𝑡− 1] ∗ [
86
100−% 𝑓𝑙𝑜𝑢𝑟 𝑚𝑜𝑖𝑠𝑡𝑢𝑟𝑒] ∗ 100 (Eq. 3.1)
𝐺𝑃𝐼 =𝐿𝑎𝑐𝑡𝑖𝑐 𝑎𝑐𝑖𝑑 𝑆𝑅𝐶
(𝑠𝑜𝑑𝑖𝑢𝑚 𝑐𝑎𝑟𝑏𝑜𝑛𝑎𝑡𝑒 𝑆𝑅𝐶+𝑠𝑢𝑐𝑟𝑜𝑠𝑒 𝑆𝑅𝐶) (Eq. 3.2)
The GPI, which is a new predictive parameter, is used to describe the overall performance of
glutenin while in the network system of the other wheat flour polymers (Kweon et al., 2011;
Hammed et al., 2015).
3.3.3 Gluten protein fractionation using reversed-phase high-performance liquid
chromatography (RP-HPLC)
3.3.3.1 Sample preparation
Gluten protein fractionation was carried out based on a modified version of Fu and
Sapirstein (1996), Sapirstein and Fu (1998), and Naeem and Sapirstein (2007). A flow chart
summarizing the extraction procedure is given in Figure 3.1. For each flour cultivar, 50 mg was
weighed into 2 mL microcentrifuge tubes in triplicate. The flour was then extracted for 15 min
with 1 mL of 50% (v/v) 1-propanol with intermittent vortexing (~ every 5 min) (Thermolyne,
Maxi Mix II Type 37600 Mixer, TX, USA). Samples were then centrifuged (Thermo Scientific,

42
Figure 3.1 Gluten protein preparation procedure for fractionation by reverse-phase high-
performance liquid chromatography. Adapted from Fu and Sapirstein (1998).
Sorvall Legend Micro 21R Centrifuge, ON, Canada) (3 min, 15,000 x g) and the resulting
supernatant was decanted into a 2 mL microcentrifuge tube. This extraction was then repeated a
second time with pellet disruption, using a small glass rod, before extraction to increase
extraction efficiency. The supernatant was then pooled with the first supernatant, and represents
the 50% 1-propanol soluble protein fraction in Figure 3.1. The pellet was then rinsed with ~ 500
µL of 50% 1-propanol, the liquid drained and then the microcentrifuge tube was inverted over a
paper towel to allow the residue to air dry (representing 50% 1-propanol insoluble fraction in
Figure 3.1).

43
One hundred microliters of a reducing solution (0.08 M Tris-HCl pH 7.5 buffer
containing 50% 1-propanol and 1% dithiothreitol [DTT]) was added to the 50% 1-propanol
insoluble protein fraction and the residue was then disrupted using a small glass rod. The sample
was then heated in a heating block (55°C, 30 min) (VWR Scientific, Heat Block, Canada, ON)
and vortexed intermittently (~every 10 min). Then 100 µL of an alkylating solution (0.08 M
Tris-HCl pH 7.5 containing 50% 1-propoanol and 4% (v/v) 4-vinylpyridine) was added, and then
the sample was placed in the heating block again (55°C, 30 min) and vortexed intermittently
(~every 10 min). The sample was then centrifuged (Thermo Scientific, Sorvall Legend Micro
21R Centrifuge, ON, Canada) for 5 min at 15,000 x g and the supernatant was decanted and
syringe filtered (0.45 µm Millex HV) into HPLC vials. This fraction contains the insoluble
HMW and LMW glutenin subunits (Figure 3.1). The residue protein remaining after this
extraction was discarded.
The concentration of 1-propanol for the 50% 1-propanol soluble protein fraction was
increased to 70% (v/v), vortexed, and then allowed to sit for 1 hr. The sample was centrifuged
for 10 min at 20,000 x g (Thermo Scientific, Sorvall Legend Micro 21R Centrifuge, ON,
Canada). The resulting supernatant (containing the gliadin rich fraction) was decanted as waste
and the residue in the microcentrifuge tube was inverted on paper towel and allowed to dry.
Using the residue obtained from the 70% 1-propanol extraction, the soluble HMW and LMW
glutenin subunits were obtained using the same process described above for 50% 1-propanol
insoluble HMW and LMW glutenin subunits starting with the reducing solution (Figure 3.1),
alkylating solution, centrifugation and syringe filtration into HPLC vials.
3.3.3.2 Reverse-phase high-performance liquid chromatography
Reverse-phase high-performance liquid chromatography was carried out according to Fu
and Sapirstein (1996) and, Naeem and Sapirstein (2007). Supernatant fractions containing the
insoluble and the soluble glutenins were analyzed using an Agilent HPLC 1100 system
containing a binary solvent delivery system, auto-sampler, online vacuum degasser and diode
array detector with a 6 mm path length, and 1.7 mL flow cell. Depending on whether stainless
steel or not, tubing that was critical from the injector inlet to the column inlet, as well as from the
column outlet to the flow cell, had an internal diameter of 0.12 and 0.13 mm, respectively. The
small tubing diameter was utilized to minimize peak elution times and maximize peak resolution.

44
Eluents utilized were solvent A, comprised of DDH2O and 0.1% (v/v) trifluoroacetic acid (TFA),
and solvent B comprised of acetonitrile and 0.1% (v/v) TFA. The elution of glutenin subunits
was monitored at a wavelength of 206 nm. Injection volume was 1 μL for the 50% 1-propanol
insoluble fraction and 3 μL for the 70% 1-propanol insoluble fraction. Glutenin subunit
separation was obtained with a flow rate of 0.2 mL/min at 60°C with an elution gradient as
follows (time, % solvent B): 0 min, 23% B; 3 min, 23% B; 54 min, 44% B; 55 min 23% B, and a
post run time of 10 min. For integration and quantitative analysis of the resulting
chromatographs, Agilent ChemStation software (version 10.01) was used with a 0.05 min peak
width response time. The column utilized was a Zorbax 300 SB-C8 (Rockland Technologies,
Inc., Newport, DE) with a 300 Å pore size, 3.5 µm particle size, 2.1 mm diameter and a length of
100 mm. The quantification of the integrated peak areas was done by using a pure protein
standard (ribonuclease A from bovine pancreas). Utilizing the conditions described above, a
dilution series of ribonuclease A in 0.08 M Tris-HCl pH 7.5 buffer with 50% 1-propanol was
run. This was then used to determine the protein contents corresponding to milli-Absorbance
Units.
3.3.4 Dough extensibility
All dough was prepared using a 10 g mixograph (TMCO National Mfg., Lincoln, NE)
utilizing a formulation comprised of flour (weight on a 14% moisture basis), water (weight based
on farinograph absorption results) and NaCl salt (2% on flour weight basis), in triplicate. All
doughs were mixed until just after reaching peak time. Dough extensibility was measured
utilizing a stable microsystems (SMS) TA.XTplus Texture profile analyzer equipped with a 5 kg
load cell and an SMS/Kieffer rig with modifications to the procedure (Stable Micro Systems,
2005). Settings for the test were as follows: pretest speed of 2.0 mm/s, test speed of 3.3 mm/s,
posttest speed of 10.0 mm/s, distance of 100.0 mm and a trigger force of 5.0 g. The dough was
not rested before loading into the oiled form. Once the dough was in the dough clamp the dough
was rested for 10 min at room temperature (21-23°C). After the resting period, the dough strips
were then loaded onto the platform and measurements were taken. The measurements taken were
dough resistance to extension (N), which is the force at the maximum height of the curve and
dough extensibility (mm) which is the length of the curve upon dough breaking.

45
3.3.5 Confocal laser scanning microscopy (CLSM)
CLSM was utilized to visualize the gluten network formation of the four different wheat
flours with 2% NaCl and was based off of the method by Jekle and Becker (2011). The doughs
were prepared as described above. The fluorescent dye rhodamine B was prepared at a
concentration of 0.001% (w/v) in DDH2O and was then utilized as the stock water addition to
each dough formulation to ensure that the dye was distributed homogeneously throughout the
dough during the mixing process. A small sample was then taken from the dough with two
plastic spatulas to try to prevent stretching of the dough, the sample was about 4-5 mm in
diameter. The dough sample was then loaded on the slide and flattened with the cover slip by
placing the cover slip overtop and then turning the slide over and lightly pushing it down on the
table. All samples were loaded this way. The dough was analyzed by a Nikon C2 CLSM
microscope (Nikon, Mississauga, ON, Canada) using 20x Plan Fluor (numerical aperture 0.75,
Nikon) objective lens. The excitation and emission wavelengths were 543 nm and 625 nm
(rhodamine B), respectively. A total of 10 images with 512 x 512 µm pixel resolution were taken
for each dough sample from different positions on the xy-axis. Each dough sample was analyzed
in duplicate. Six images of each dough were accessed for particle count, total particle area,
average particle size, circularity and fractal dimension using Image J software (National
Institutes of Health, Bethesda, MD, USA) based on Jekle and Becker (2011).
3.3.6 Statistical analysis
A one way analysis of variance (ANOVA) using a Scheffe Post-hoc test was used to
show statistical differences for flour cultivars for parameters used to characterize the flours and
for dough extensibility and confocal image analysis experiments. The statistical analysis program
SPSS (Armonk, NY, USA) was utilized.
3.4 RESULTS AND DISCUSSION
3.4.1 Flour characterization
Analysis of a wide range of standard flour properties are given in Table 3.1. The CWRS
flours tested ranged in protein levels from 14.7% to 16.2% (d.b.), which were similar in
magnitude to other CWRS (Edwards et al., 2012) and hard wheat classes (Delcour et al., 2012).
In the present study, Roblin flour contained the highest protein content (~16.2% d.b.), followed

46
Table 3.1 Flour properties for four CWRS wheat cultivars Pembina, Roblin, McKenzie and
Harvest. Data represents the mean ± one standard deviation (n = 2).
Characteristics1 Flours2
Pembina Roblin McKenzie Harvest
Proximate analysis
a. Protein (% on 14% w.b.) 12.6 ± 0.0a 13.9 ± 0.0c 13.0 ± 0.0b 13.0 ± 0.1b
b. Protein (% d.b.) 14.7 ± 0.0a 16.2 ± 0.0c 15.1 ± 0.0b 15.1 ± 0.1b
c. Lipid (% d.b.) 1.13 ± 0.01b 1.08 ± 0.00b 0.93 ± 0.03a 1.03 ± 0.04ab
d. Ash (% d.b.) 0.52 ± 0.00b 0.46 ± 0.01a 0.53 ± 0.01b 0.53 ± 0.0b
Falling number (s) 475 ± 16a 470 ± 17a 483 ± 17a 486 ± 21a
SKCS - HI 67.43 ± 0.67a 65.59 ± 1.34a 77.82 ± 0.55c 73.53 ± 0.97b
Damaged starch (%) 5.97 ± 0.26a 5.45 ± 0.10a 7.06 ± 0.20b 7.06 ± 0.22b
Gluten Index (%) 84.3 ± 2.9c 88.1 ± 1.5c 66.3 ± 1.8b 48.6 ± 0.8a
a. Wet Gluten (%) 36.0 ± 0.6a 42.4 ± 0.1c 40.1 ± 0.4b 42.1 ± 0.3c
b. Dry Gluten (%) 12.2 ± 0.3a 14.8 ± 0.1c 13.7 ± 0.3b 13.8 ± 0.1b
Rapid visco-analysis (RVU)
a. Peak viscosity 123.3 ± 2.1a 141.9 ± 0.3b 129.3 ± 0.8a 140.1 ± 1.6b
b. Breakdown viscosity 35.3 ± 2.5a 42.6 ± 0.4b 36.0 ± 0.4a 36.4 ± 0.1a
c. Trough viscosity 87.0 ± 1.0a 99.3 ± 0.1c 93.3 ± 0.5b 103.7 ± 1.5d
d. Setback viscosity 102.3 ± 1.5a 108.4 ± 0.1b 108.5 ± 1.2b 119.6 ± 0.8c
e. Final viscosity 189.3 ± 2.5a 207.6 ± 0.2b 201.8 ± 1.7b 223.3 ± 0.8c
1Abbreviations: wet basis (w.b.); dry basis (d.b.); single kernel characterization system (SKCS); hardness
index (HI); and rapid viscoanalyzer units (RVU). 2Different letters represent significantly different values (p<0.05) within a row.

47
by McKenzie and Harvest (~15.1% d.b.), which were similar, and then Pembina (14.7% d.b.).
Pembina had the lowest protein among the cultivars (p<0.01). The lipid contents in all flours
ranged between 0.93% (d.b.) for McKenzie to ~1.1% (d.b.) for Roblin/Pembina, with Harvest
more mid-range (1.0%, d.b.) (Table 3.1). Values were also within a similar range of others found
in the literature, which ranged between ~1.1 and 2.0% (d.b.) (Goesaert et al., 2005; Mak, 2009;
Delcour & Hoseney, 2013a). Ash levels found in Pembina, McKenzie and Harvest flours were
found to be similar (~0.53%, d.b.) (p<0.05), and significantly higher than that of Roblin (0.46%
d.b.) (p<0.05). Similar values have been reported in the literature of other CWRS wheat flours by
Edwards et al. (2012) and Zghal et al. (2001).
Falling number gives an indication of the degree of enzymatic activity occurring within
the wheat; where a high falling number (> 300 s) indicates minimal activity, whereas values <
250 s indicates extensive activity and possible sprout damage to the flour (Wheat Marketing
Centre, 2008). In the present study, all flours were found to have similar falling numbers of
~479 s indicating that the flours were of high quality with minimal enzymatic activity or
degradation (p>0.05) (Table 3.1). When considering the single kernel characterization system, it
can be observed that the two stronger wheat cultivars, Pembina and Roblin have similar hardness
indices of ~66 (p<0.05), which were significantly lower than Harvest (~74) and McKenzie (~78)
(p<0.05) (Table 3.1). The higher the hardness index is, the harder the kernels are. Damaged
starch levels were found to be higher in the cultivars having the harder kernels relative to those
with lower hardness indices. For instance, McKenzie/Harvest had significantly greater levels of
damaged starch (~7.1%) than that of Pembina/Roblin (~5.7%) (p>0.05) (Table 3.1). Using the
roller mill, it would take more force or a greater number of passes through the roller mill to crush
the harder kernels which would result in a greater amount of damaged starch.
The gluten index is an indicator of the relative gluten strength of the flour; it is the ratio
of wet gluten remaining on the sieve (after centrifuging) to the total wet gluten (AACC
International, 2000). The index for Pembina/Roblin flours (~86%) were significantly greater than
that of McKenzie (~66%) and Harvest (~47%) (p<0.05) (Table 3.1) indicating that
Pembina/Roblin have much stronger gluten networks. Wet gluten gives an indication of the
water binding capabilities of the gluten, with Roblin/Harvest having similar values (~42%),
which were significantly greater than both McKenzie (~40%) and Pembina (~36%) flours
(p<0.05) (Table 3.1). Dry gluten content tends to correlate to protein content of the flour, the

48
higher the protein content of a flour generally means a higher dry gluten content. It can be seen
that the dry gluten content follows the trend for the total protein levels with each flour (Table
3.1); with Roblin having the highest (16.2% d.b.), followed by McKenzie/Harvest (15.1% d.b.)
and then Pembina (14.7% d.b.).
In examining the starch properties of the different flours using a rapid visco-analyzer no
evidence of sprout damage as the result of high enzymatic activity was observed, which could
lead to poor dough handling (Wheat Marketing Centre, 2008). Flours that have sprout damage
tend to have low peak viscosities within their curves. All flours studied appeared to be of high
quality. Peak viscosity for Pembina/McKenzie (~125 RVU) were found to be significantly lower
than that of Roblin/Harvest (~141 RVU) (p<0.05) (Table 3.1).The breakdown viscosity was
found to be similar for Pembina, McKenzie and Harvest (~36 RVU), which was significantly
lower than that of Roblin (~43 RVU) (p<0.05) (Table 3.1). Trough viscosity found to be
significantly different for all flours, where viscosity increased from ~87 RVU (Pembina), to ~93
RVU (McKenzie), to ~99 RVU (Roblin) and to ~104 RVU (Harvest) (p<0.05) (Table 3.1). Set
back viscosity found to be lowest for Pembina (~102 RVU), and then increased to ~108 RVU for
Roblin/McKenzie, and then again to ~120 RVU for Harvest (p<0.05) (Table 3.1). The final
viscosity was found to be lowest for Pembina (~189 RVU), and then increased to ~204 RVU for
Roblin/McKenzie, and then again to ~223 RVU for Harvest (p<0.05) (Table 3.1).
3.4.1.1 Amino acid profiles & free thiol content
The amino acid (AA) profile of each flour was examined and given in Table 3.2. Based
on the total AAs, Pembina contained the lowest amount AAs (~15.9 %), followed by
McKenzie/Harvest (~16.5%) and then Roblin (~18.2%) (Table 3.2). Results follow a similar
trend as those shown in Table 3.1 determined by the Leco combustion method. Reactive sites on
the various AAs can have a big impact on the nature of interactions within the dough, such as
disulphide, hydrophobic, hydrogen, and ionic bonding. For instance, an amino acid primarily
involved in covalent bonding is cysteine, whereas polar/charged AAs (e.g., glutamine/glutamic
acid) partake in hydrogen and ionic bonding, and the charged AA can be shielded by salts
present within the formulations. Furthermore, bulky aromatic side groups from tryptophan,
tyrosine and phenylalanine lead to hydrophobic interactions to help form the gluten network. AA
profiles for all flours in the present study were similar in magnitude to other wheat flours found

49
Table 3.2 Amino acid (AA) profiles of flours from CWRS wheat cultivars Pembina, Roblin,
McKenzie and Harvest. Data represent the actual percent AA concentration
within flour; whereas numbers within the brackets have been normalized to 100%
in order to compare levels in-between cultivars.
Amino Acid
(%)
Flours
Pembina Roblin McKenzie Harvest
Glycine 0.53 (3.3) 0.61 (3.3) 0.53 (3.2) 0.54 (3.3)
Alanine 0.50 (3.2) 0.55 (3.0) 0.51 (3.1) 0.52 (3.1)
Serine 0.70 (4.4) 0.81 (4.4) 0.72 (4.4) 0.71 (4.3)
Threonine 0.43 (2.7) 0.48 (2.6) 0.44 (2.7) 0.42 (2.5)
Cysteine 0.33 (2.1) 0.35 (1.9) 0.33 (2.0) 0.32 (1.9)
Aspartic acid
(+ Asparagine) 0.62 (3.9) 0.71 (3.9) 0.65 (3.9) 0.65 (3.9)
Glutamic acid
(+ Glutamine) 5.44 (34.3) 6.54 (35.9) 5.76 (35.0) 5.75 (34.8)
Histidine 0.47 (3.0) 0.55 (3.0) 0.49 (3.0) 0.52 (3.1)
Arginine 0.60 (3.8) 0.71 (3.9) 0.62 (3.8) 0.60 (3.6)
Lysine 0.36 (2.3) 0.33 (1.8) 0.34 (2.1) 0.36 (2.2)
Valine 0.66 (4.2) 0.70 (3.8) 0.67 (4.1) 0.68 (4.1)
Leucine 1.15 (7.3) 1.20 (6.6) 1.15 (7.0) 1.19 (7.2)
Isoleucine 0.63 (4.0) 0.65 (3.6) 0.63 (3.8) 0.65 (3.9)
Methionine 0.25 (1.6) 0.26 (1.4) 0.26 (1.6) 0.24 (1.5)
Proline 1.85 (11.7) 2.18 (12.0) 1.98 (12.0) 1.95 (11.8)
Phenylalanine 0.89 (5.6) 0.94 (5.2) 0.91 (5.5) 0.94 (5.7)
Tyrosine 0.30 (1.9) 0.48 (2.6) 0.34 (2.1) 0.32 (1.9)
Tryptophan 0.15 (0.9) 0.16 (0.9) 0.15 (0.9) 0.15 (0.9)
Total 15.86 (100) 18.21 (100) 16.48 (100) 16.51(100)

50
in the literature, with slight differences based on flour cultivar and growing
conditions/environment the crops experienced (Cornell, 2012; Delcour & Hoseney, 2013a).
Gluten proteins are known for being rich in glutamine, proline and hydrophobic AAs (Delcour &
Hoseney, 2013a). In Table 3.2, glutamic acid (+ Glutamine), proline and hydrophobic AAs
accounted for ~35%, ~12% and ~37% of the total AAs, respectively regardless of the flour
cultivar, which is typical for wheat flours.
Cysteine residues were shown to represent ~1.9-2.1% of the total AAs, regardless of the
flour (Table 3.2). These values for total cysteine (based on the total AAs) are similar to those
found in literature for wheat flours ~1.9-2.5% (Cornell, 2012; Delcour & Hoseney, 2013a).
Cysteine AA residues are extremely important in the development of the gluten network as they
participate in covalent disulphide bonding. An analysis of variance found the effect of flour
cultivar on the free thiol content not to be significant (p>0.05). The CWRS flours were found to
have an average free thiol content of 1.00 µmol/g flour d.b. Specifically, Pembina, Roblin,
McKenzie and Harvest had values of 0.97 ± 0.10, 1.09 ± 0.08, 0.92 ± 0.05 and 1.04 ± 0.08
µmol/g flour d.b, respectively. These values for free thiol content are also similar to those found
in literature. For instance, Steffolani et al. (2010) reported a value of 0.53 µmol/g flour d.b.
(based on flour with 10.9% protein), Puppo et al. (2005) found values of 1.42 and 2.43 µmol/g
flour d.b. (based on flours with 11.7% and 10.9% protein, respectively) and, Anderson and Ng
(2000) found values of 1.05 µmol/g flour d.b. (based on a flour with 9% protein).
3.4.1.2 Solvent retention capacity of flour components
Solvent retention capacity (SRC) measures the compatibility of three flour components
(gluten, damaged starch and pentosans) in different solvents to give a prediction of each
components’ contribution to the flour’s overall quality (with respects to the level of water
absorption, gluten strength, damaged starch level and level of pentosans) and finished product
quality (for breads, cookies, crackers, cakes, and noodles as each of these products require
different flour functionality) (Kweon et al., 2011; Švec et al., 2012). Empirical rheological and
baking tests measure the combined contributions of these flour components to flour
functionality/ quality whereas, SRC enables for a measurement of the individual functional flour
components contribution separately (Kweon et al., 2011). For bread production a good quality
flour generally requires a high water absorption, good gluten strength and relatively high

51
damaged starch and arabinoxylans (pentosans), whereas for cookie production a good quality
flour generally requires a low water absorption, very little gluten strength, and a low amount of
damaged starch and arabinoxylans (Kweon et al., 2011). In Table 3.3, the SRC of flours within
water (associated with contributions from all flour components) indicated that McKenzie
retained the highest amount of water (~78%) (p<0.05), followed by Roblin (~76%), and then
Harvest (~74%) and Pembina (~72%), which were similar in magnitude (p>0.05) (Table 3.3).
Contributions to water retention relating to pentosans appeared to be greatest for Roblin and
Pembina flours (p<0.05), followed by McKenzie and Harvest flours which were similar
(p>0.05). This may give an indication that the level of pentosans within these flour cultivars may
not be responsible for dough stickiness within reduced sodium dough formulations given that the
two stronger cultivars that produce non-sticky doughs have higher water retentions as a result of
the pentosans. However, further testing would be necessary to rule out the contributions of the
pentosans. Contributions associated with the gluten proteins was significantly greater in flours
from Roblin (p<0.05), followed by Pembina (p<0.05), and then McKenzie and Harvest which
were similar (p>0.05) which may reflect the trend in total protein levels within McKenzie and
Harvest (Table 3.1). The gluten performance index, predicting the overall performance of
glutenin in the presence of the network of other flour polymers, shows more powerful
differences between the flour cultivars with Roblin having the highest GPI (p<0.01) followed by
Pembina (p<0.01) with McKenzie and Harvest being similar but having the lowest GPI
(p<0.001). And finally, the contributions to water retention from damaged starch within the
flours was greatest for McKenzie, followed by Pembina, Harvest and then Roblin (p<0.05).
McKenzie also had the highest damaged starch level in Table 3.1. It was reported by Hammed et
al. (2015) that the sodium carbonate SRC correlated well with damaged starch levels. However,
in the current study Pembina showed a higher sodium carbonate SRC than Harvest, despite
exhibiting a lower level of starch damage. This finding could be impacted by the vortexing
process used in this analysis, which could contribute to slightly different water uptake by
damaged starch as compared to the mixing action of dough. Findings for SRC values were
similar in magnitude to Hammed et al. (2015) who examined a number of hard red spring wheat
flours.

52
Table 3.3 Solvent retention capacity of flours from CWRS wheat cultivars Pembina, Roblin, McKenzie and Harvest. Data
represent the mean ± one standard deviation (n = 3).
Flour Solvent retention capacity, %
50% Sucrose
(Pentosans)
5% Lactic acid
(Gluten proteins)
5% Sodium
carbonate
(Damage starch)
DDH2O
(all components)
Gluten
performance index
Pembina 128.20 ± 1.90bc 142.61 ± 1.02b 95.66 ± 0.24c 72.28 ± 0.77a 0.64 ± 0.01b
Roblin 130.91 ± 3.34c 151.71 ± 2.37c 91.19 ± 0.15a 75.96 ± 1.26bc 0.68 ± 0.01c
McKenzie 123.71 ± 1.84ab 127.28 ± 1.90a 99.61 ± 0.23d 77.96 ± 1.35c 0.57 ± 0.01a
Harvest 120.03 ± 0.79a 123.27 ± 0.14a 94.35 ± 0.22b 73.68 ± 0.24ab 0.58 ± 0.00a
Target ranges* 105-115 >140 80-90 65-70 0.75
Different letters in the same column are significantly different (p<0.05). *Targeted ranges given were provided from www.uswheat.org.
52

53
3.4.1.3 Gluten protein fractionation
Protein composition plays an important role in determining wheat quality for dough
handling and baking performance. The presence or absence of certain HMW glutenin subunits,
LMW glutenin subunits, and gliadins are determinants in protein quality (Suchy et al., 2003),
along with the ratio of the glutenins to gliadins (Southan & MacRitchie, 1999). In Figure 3.2, the
insoluble (A) and soluble (B) gluten fractions are given, along with their ratio (C) to give an
indication of gluten strength. The insoluble glutenin proteins have a strengthening effect on the
gluten network as the HMW and LMW glutenin subunits form disulphide bonds to create a more
continuous elastic network. Pembina and Roblin, which are known to be strong dough producing
flours, have a greater amount of total glutenins (~29%) when compared to McKenzie and
Harvest (p<0.05) (~25%) which are the weaker dough producing flours.
In Figure 3.2A, it can be seen that the HMW insoluble glutenin fraction was similar
between Pembina and Harvest cultivars despite forming strong and weak doughs, respectively.
Barak et al. (2013) examined the protein composition in multiple flour cultivars to show no
differences within the total HMW insoluble glutenin levels, despite differences in baking
performance. The authors attributed the latter to differences in the composition of subunits
within the HMW glutenin fraction. For instance, 2*, 5+10 and 7+9 HMW subunits impart
increased dough development and stability, whereas subunits containing N, 2+12 and 20 result in
a weakening effect on the dough. Suchy et al. (2003) found something similar where there were
significantly different dough properties among cultivars, despite having similar levels of the total
insoluble HMW glutenin fraction. The authors attributed the differences observed in the dough
properties to differences in LMW glutenin and gliadin composition. In the present study, it is
believed that differences in dough properties between the cultivars is attributed to differences in
subunit composition within the HMW insoluble glutenin fraction, and also differences in the
levels of LMW gluteinin and gliadin fractions. For instance, LMW insoluble glutenins level in
Pembina was higher (20%) than Harvest (~17%) (p<0.05) (Figure 3.2A), and the total gliadins in
Pembina were lower (~63%) than Harvest (~66%) (Figure 3.2B). It could possibly be the
insoluble LMW glutenin subunits that play a larger role than originally hypothesized in
maintaining the gluten network formation and strength in reduced sodium enviroments

54
Figure 3.2 Gluten protein fractions of CWRS cultivars (Pembina [PEM], Roblin [ROB],
McKenzie [MC], and Harvest [HAR]) giving the insoluble gluten fractions (A),
soluble gluten fractions (B) and strength indices (C). Data represents mean values
± one standard deviation (n=3). Different letters represent significant differences
(p<0.05) within each fraction.

55
given that Pembina proves to be the strongest dough producing flour cultivar in low sodium
environments and has the lowest dough stickiness.
The soluble protein fractions given in Figure 3.2B have a weakening effect on the gluten
network as it is dominated by gliadins, which are known to impart plasticity in the dough, as well
as the soluble glutenins (HMW and LMW), which are of lower molecular weight than the HMW
and LMW glutenins found in the insoluble fraction. It can be seen that the weaker flour cultivars
of McKenzie and Harvest contain a higher amount of total soluble proteins as well as gliadins
(~75% & ~66% respectively), whereas the stronger cultivars of Pembina and Roblin have a
lower amount of total soluble proteins as well as gliadins (~ 71% & ~62% respectively).
In Figure 3.2C it can be seen that Pembina and Roblin contain a higher ratio of insoluble
glutenin/gliadin and insoluble glutenin/soluble protein than McKenzie and Harvest which results
in these flours being weaker than Pembina and Roblin. The ratio of the insoluble glutenin to total
soluble protein includes the weakening effect of all the soluble proteins (gliadins, soluble HMW
& LMW glutenin subunits, albumins and globulins). In general, with a greater amount of
insoluble glutenin subunits the stronger the dough, inversely the greater amount of soluble
protein the weaker the dough. The ratio of insoluble glutenin/gliadin displays the ratio of the
strengthening insoluble glutenin subunits vs the monomeric gliadins which impart a weakening
effect; it is a more specific look at the effect of the protein fractions. These ratios describe well
the gluten index for all flour cultivars (Table 3.1), the solvent retention capacity data (associated
with lactic acid) (Table 3.3) and gluten performance index (Table 3.3) where again Pembina and
Roblin have higher gluten indices, protein solvent retention and gluten performance indices than
McKenzie and Harvest.
3.4.2 Rheological properties
The empirical rheological characteristics for each CWRS flour were examined and given
in Table 3.4. It should be noted, that although both farinographs and mixographs were used to
measure dough development, it is virtually impossible to directly compare the findings due to
differences in sample geometry and the inability to replicate the same stress-strain relationship
between instruments (Dobraszczyk & Morgenstern, 2003). However, the two techniques are still
widely considered to provide useful information concerning the mixing and baking quality of

56
Table 3.4 Empirical rheological characteristics of flours from CWRS wheat cultivars
Pembina, Roblin, McKenzie and Harvest. Data represents the mean values ± one
standard deviation (n = 2).
Empirical
Rheology1
Flours
Pembina Roblin McKenzie Harvest
Farinograph
FAB (% to 14%
w.b.)
61.5 ± 0.3a 65.3 ± 0.1c 63.3 ± 0.7b 64.9 ± 0.1bc
DDT (min) 6.3 ± 0.4b 7.7 ± 0.2c 4.6 ± 0.1a 5.2 ± 0.3ab
MTI (BU) 20.5 ± 2.1a 14.5 ± 2.1a 31.0 ± 9.9a 33.0 ± 5.7a
STA (min) 8.9 ± 0.9a 16.9 ± 1.3b 6.1 ± 0.9a 5.3 ± 0.9a
Mixograph
BA (%) 62.5 64.3 63.4 63.4
MDT (min) 3.23 ± 0.02c 2.73 ± 0.05a 3.01 ± 0.00b 2.68 ± 0.06a
PDR (%) 51.12 ± 2.02ab 56.68 ± 4.02b 45.34 ± 0.26a 47.41 ± 0.20a
BWPR (%) 27.65 ± 1.41a 33.87 ± 10.38a 21.31 ± 0.76a 19.99 ± 0.79a
RBD (%) 1.50 ± 0.82a 1.83 ± 0.67a 1.96 ± 0.49a 1.97 ± 0.43a
BWBD (%) 7.89 ± 4.07a 11.01 ± 6.58a 3.71 ± 0.21a 3.25 ± 0.00a
WIP (%tq. min) 117.90 ± 6.68c 103.67 ± 2.40bc 97.40 ± 2.72ab 85.37 ± 5.62a
1Abbreviations: Farinograph water absorption (FAB); dough development time (DDT); mixing tolerance
index (MTI); stability time (STA); Barbender units (BU); baking absorption (BA); mixograph
development time (MDT); peak dough resistance (PDR); bandwidth at peak dough resistance
(BWPR); bandwidth breakdown 1 min after peak (BWBD); resistance breakdown 1 min after
peak (RBD); work input to PDR (WIP); and torque (tq). 2Different letters represent significantly different values (p<0.05) within a row.

57
flours and can be used as a tool to screen flours for their dough forming qualities (Dobraszczyk
& Morgenstern, 2003).
3.4.2.1 Rheological properties using a farinograph
Overall, the effect of flour cultivar on farinograph water absorption was found to be
significant (p<0.01). Pembina showed the lowest FAB (~61%) of the four flour cultivars
(p<0.05) most likely due to its lower protein content relative to the other flours. In general, flours
with higher amounts of gluten proteins tend to have higher FAB values. In the present study,
McKenzie/Harvest (FAB = ~64%) were found to have higher values than Pembina, but
significantly lower values than Roblin (65%) (p<0.05) (Table 3.4); following a similar pattern as
the total protein levels found within the flours (Table 3.1). The dough development time (DDT)
gives an indication of optimum mixing time to reach maximum consistency of 500 BU (Wheat
Marketing Centre, 2008). Findings indicate that Roblin had this highest DDT (~7.7 min), which
was significantly higher than Pembina/Harvest (DDT = ~5.7 min), and that of McKenzie (4.6
min) (p<0.05) (Table 3.4). Roblin exhibiting the longest DDT is most likely explained by Roblin
having the highest protein content and high quality gluten, as indicated by the gluten index and
gluten performance index. Pembina having a shorter mixing time than Roblin even though both
are strong cultivars could be due to its lower protein content, however it exhibits high gluten
quality. The mixing tolerance index (MTI) gives an indication of degree of dough softening
during mixing (Wheat Marketing Centre, 2008); dough with lower MTI values indicate stronger
doughs. However, MTI in the current experiments showed high variability among the samples,
leading to no significant difference between flours (p>0.05) (Table 3.4). Furthermore, the
stability time (STA) gives an indication of dough strength by measuring the time the dough
maintains its maximum consistency of 500 BU (Wheat Marketing Centre, 2008). Roblin was
found to show the greatest STA (~17 min), which was significantly higher than the other three
flours which had a STA similar in magnitude (~7 min) (p<0.05) (Table 3.4). Based on the
farinograph results, dough prepared from the stronger flour (e.g., Roblin) would require a greater
amount of work energy (i.e., longer mixing and development times) than a weaker flour (e.g.,
Harvest) and would be less sensitive to over-mixing.

58
3.4.2.2 Rheological properties using a mixograph
The rheological properties of dough prepared from the four different flours using a
mixograph are given in Table 3.4. Baking absorption was calculated based on the formula for
optimum absorption (AACC International, 1999). BA values for all flours ranged between 62.5
and 64.3%. The mixograph development time (MDT) gives an indication of the optimum mixing
time which is the time it takes for the dough to reach maximum consistency (Wheat Marketing
Center, 2008). Weak gluten flour has shorter peak times than strong gluten flour (Wheat
Marketing Centre, 2008). MDT values were found to be significantly influenced by flour cultivar
(p<0.001); where MDT values increased from ~2.7 min for Harvest/Roblin, to 3.01 min for
McKenzie, and then again to 3.23 min for Pembina (Table 3.4). The peak dough resistance
(PDR) refers to the percentage of torque at peak development, greater torque is usually indicative
of a stronger flour. Overall, PDR values were found not to be influenced by flour cultivar
(~50%) (Table 3.4). The values for PDR in the present study were higher than those found by
Zghal et al. (2001) for two CWRS flours which were closer to ~35% and 39%, which may be
reflective of the fact that Zghal et al. used a 2 g mixograph in their study versus a 10 g in the
present study. The bandwidth at the peak dough resistance (BWPR) refers to percent of the full
scale torque at peak dough resistance and wider more wild looking bandwidths show the torque
spikes, the greater amount of torque necessary to mix the dough the stronger the dough (Hazelton
& Walker, 1997). Bandwidth breakdown 1 min after peak (BWBD) gives an indication of dough
weakening or the doughs stability (rate of dough breakdown) with respect to the change in the
bandwidth from PDR (Hazelton & Walker, 1997; Walker & Walker, 2004). The resistance
breakdown 1 min after the peak (RBD) is also an indication of dough weakening or stability with
respect to the change of the curve’s height (amount of torque) from PDR (Hazelton & Walker,
1997; Walker & Walker, 2004). For the BWPR, BWBD and RBD values, no significant effect of
flour cultivar was observed (p>0.05) (Table 3.2). In the case of the work input (WIP), it was
observed that WIP for Pembina was higher than Harvest, ~118% vs. ~85% respectively (p<0.05),
whereas Roblin (~104%) and McKenzie (~97%) were more intermediate, indicating that
Pembina requires a greater amount of energy to bring the dough to its optimum dough
development (Table 3.4).

59
3.4.2.3 Dough extensibility
Extensigraphs are used for classifying flour strength, as weak, medium, strong or very
strong dough based on the dough’s resistance to extension and extensibility, both of which can
influence the final loaf volume of the bread (Delcour & Hoseney, 2013b). Resistance to
extension provides a measurement of the dough strength with a higher resistance to extension
indicating a greater amount of force needed to stretch the dough, which is typically associated
with the glutenin proteins (Delcour & Hoseney, 2013b). In contrast, the dough’s extensibility
gives an indication of the dough’s ability to stretch without breaking, which is typically
associated with the gliadin proteins and their ability to induce plasticity to the dough (Delcour &
Hoseney, 2013b). In Figure 3.3A it can be seen that the effect of flour cultivar on the resistance
to extension is highly significant (p<0.001). The overall trend is that Pembina has the highest
resistance to extension (0.31 N) followed by Roblin/McKenzie (~0.24 N) and then Harvest (0.18
N). This trend is similar to that found for work input to peak development (Table 3.4). In Figure
3.3B the effect of flour cultivar on the extensibility was also found to be weakly significant
(p<0.05). For extensibility data, only Roblin and Harvest were found to be significantly different
from each other (p<0.05), with dough prepared from Roblin (49.7 mm) showing greater
extensibility than those prepared with Harvest (44.1 mm).
The ratio of the resistance to extension (R) to extensibility (E) of the dough can be a good
indicator of final loaf volume. Higher ratios tend to lead to very elastic dough (i.e., strong gluten
network), whereas lower ratios typically lead to more viscous doughs (i.e., weak gluten network)
(Delcour & Hoseney, 2013b). In Figure 3.4, the effect of flour cultivar on the R/E ratio was
found to be highly significant (p<0.001). Pembina showed the highest ratio of R/E of the four
flours (0.0069 N/mm), followed by Roblin (0.0051 N/mm), and then McKenzie (0.0049 N/mm)
and Harvest (0.0041 N/mm). However, Roblin, McKenzie and Harvest were not statistically
different (p>0.05). Findings suggest that Pembina has strong gluten networks, whereas Roblin,
McKenzie and Harvest form comparably weaker ones. However, Roblin is most likely the
stronger of the three.

60
Figure 3.3 Resistance to extension (N) and extensibility (mm) values for dough prepared
using different CWRS wheat cultivars (Pembina [PEM], Roblin [ROB],
McKenzie [MC] and Harvest [HAR]) with 2% NaCl. Data represents the mean ±
one standard deviation (n = 3).

61
Figure 3.4 Ratio of resistance to extension (N) [R] and extensibility (mm) [E] values for
dough prepared using different CWRS wheat cultivars (Pembina [PEM], Roblin
[ROB], McKenzie [MC] and Harvest [HAR]) with 2% NaCl. Data represents the
mean ± one standard deviation (n = 3).

62
3.4.3 Confocal laser scanning microscopy (CLSM)
Confocal laser scanning micrographs were taken to better understand how the structure of
the gluten network relates to dough strength. From the micrographs (Figure 3.5), it appears that
doughs prepared with Pembina, Roblin and McKenzie flours all formed elongated gluten
polymeric strands to create a more continuous network with directional organization. In contrast,
doughs prepared using Harvest flours formed shorter gluten strands with a porous structure with
random orientation. CLSM images were assessed in order to quantify differences in dough
morphology among the different cultivars, and are reported in Table 3.5. Particle count in the
present study was equated to the size of the gluten aggregates, where larger aggregates would
have a corresponding lower particle count. In the present study, dough prepared using Pembina
was found to have a significantly higher particle count (5051) and lower average particle size
(~31 µm2) than those prepared with Harvest flour (3783, ~44 µm2) indicating that there are fewer
large gluten aggregates and more individual defined gluten polymers with directional orientation
(Table 3.5). Doughs formed with Harvest are presumed to have larger, more randomly oriented
aggregates, and hence a more porous structure. Particle count and average particle sizes in
doughs prepared from Roblin and McKenzie were similar, and in-between that of Pembina and
Harvest.
The total particle area, circularity and fractal dimension did not provide good indicators
of structural differences within the dough. Jekle and Becker (2011) reported that the parameters
of particle count and circularity showed low significance; however they found that total particle
area, average size and fractal dimension showed significant differences within their samples.
Differences in reliability of image analysis parameters could be due to the difference in dough
samples. Samples presented here were examined utilizing different wheat cultivars however
Jekle and Becker were testing the effect of different water additions, which, based on their
results appears to have a greater effect on the image analysis results of the microstructure and
thus greater detectability. Peighambardoust and others (2006) determined that the image analysis
utilized for their dough samples was not sufficient to explain the differences in dough
development despite reported correlations by two other studies. Jekle and Becker reported that a
decrease in total particle area in samples with greater water addition was associated with a less
developed gluten network due to the hindrance of the expanded and congregated starch granules

63
A) PEM B) ROB
C) MC D) HAR
Figure 3.5 Confocal laser scanning microscopy images for dough prepared using different
CWRS wheat cultivars (Pembina [PEM], Roblin [ROB], McKenzie [MC] and
Harvest [HAR]) with 2% NaCl.

64
Table 3.5 Image analysis of confocal laser scanning microscopy of doughs prepared using
CWRS wheat cultivars (Pembina [PEM], Roblin [ROB], McKenzie [MC],
Harvest [HAR]) with 2% NaCl. Values represent mean of 6 images ± one
standard deviations.
Flour Cultivar
1Particle
Count
2Total
Particle Area
(104 µm2)
3Average
Particle Size
(µm2)
4Circularity
5Fractal
Dimension
PEM
5071 ± 548b
15.57 ± 1.68b
31.19 ± 5.94ab
0.90 ± 0.02a
1.90 ± 0.01a
ROB
4387 ± 645ab 15.92 ± 1.95b 37.29 ± 8.78bc 0.89 ± 0.01a 1.90 ± 0.02a
MC
4828 ± 384b 11.88 ± 2.27a 38.95 ± 3.06a 0.89 ± 0.01a 1.91 ± 0.10a
HAR
3783 ± 402a 16.64 ± 0.52b 44.50 ± 5.74c 0.88 ± 0.01a 1.92 ± 0.01a
NOTES: 1Particle count is associated with degree of protein aggregation. 2Total particle area is
associated with total area covered by the particles counted. 3Average particle size is associated
with the average size of all the particles counted. 4Circularity is associated with the shape of the
particles counted (value closer to 1 = more circular and value closer to 0 = more elongated). 5Fractal dimension is associated with the degree of pattern or complexity. Parameters were
defined based on the Image J analysis guide. Different letters within a column represents
significantly different values p<0.05.
due to the excess water added. From their findings it would have been expected that in the
present study Pembina would have a greater total area than Harvest given that Pembina appears
to form a more continuous gluten network than Harvest and thus a more developed gluten
network. However this was not the case, Pembina, Roblin and Harvest all had similar total areas.
The reason for this could be that although Pembina had a more developed network than Harvest,
both the more structured gluten polymers within Pembina and the aggregated gluten polymers
within Harvest cover the same area in a different manner. Therefore this would explain the lack
of differences for the fractal dimension measurements and the fact that Harvest has the greatest
average particle size. The findings within the CLSM micrographs follow the results for the
resistance to extension in Figure 3.3A where the effect of flour cultivar was highly significant

65
with Pembina showing the highest resistance to extension followed by Roblin/McKenzie and
then Harvest having the lowest indicating the weakest gluten network formation.
3.5 CONCLUSIONS
Although the majority of the compositional data was similar among the different CWRS
cultivars examined, the most notable differences were with the gluten quantity/quality (subunit
composition) and damaged starch content. Pembina flour was found to have the lowest protein
content of the four flour cultivars but had the greatest resistance to extension and the most
elongated gluten protein polymers with unidirectional organization. These findings suggest that
gluten content plays less of a role in gluten strength relative to gluten quality. Examination of
gluten quality using the gluten index and analysis of the gluten composition with respects to the
insoluble glutenins vs the gliadins revealed that the two stronger dough producing flours of
Pembina and Roblin had higher gluten indices than those of McKenzie and Harvest. Pembina
was found to have a higher amount of low molecular weight glutenin (insoluble) proteins relative
to Roblin, which had higher amounts of high molecular weight glutenin (insoluble) proteins,
possibly accounting for the differences in dough strength in the present study. McKenzie and
Harvest flours were higher in gliadin contents than Pembina and Roblin. Furthermore, the level
of damaged starch was presumed to have played a role in the gluten network formation and
strength given that it competes with the gluten proteins for hydration. With extensive damaged
starch there can be a detrimental impact on the gluten network formation as is seen with
McKenzie and Harvest which had higher damaged starch quantities and gluten that is of lower
quality than that of Pembina and Roblin and thus are presumed to be unable to overcome the
weakening impact of the higher level of damaged starch.
3.6 LINKAGE TO CHAPTER 4
Findings from this study will help provide foundational knowledge and determine the
effect of differences in flour composition and gluten protein composition/quality on dough
stickiness and handling within low sodium formulations. The differences in the insoluble HMW
and LMW glutenin subunits and amount of gliadins within the flour may provide the explanation
as to what is occurring in the gluten network formation with the decrease in sodium chloride and

66
why there are differences in stickiness between the flour cultivars with reduced sodium
formulations.

67
4. EFFECT OF NACL LEVEL ON THE HANDLING PROPERTIES OF DOUGH
PREPARED FROM DIFFERENT CANADA WESTERN RED SPRING WHEAT
CULTIVARS
4.1 ABSTRACT
The dough handling properties for four CWRS wheat cultivars (Pembina, Roblin,
McKenzie and Harvest) were investigated as a function of NaCl (0-4%) level. Specifically, the
dough rheology (oscillatory and creep recovery), extensibility, stickiness and water mobility
were studied. In terms of dough rheology, the loss tangent was found to be similar for doughs
prepared with Roblin, McKenzie and Harvest, and weaker than that of Pembina. In all cases,
dough became stronger in a curvilinear fashion as the NaCl levels increased from 0 to 4%.
Further, the amount of deformation in the dough decreased with increasing NaCl levels
indicating that the gluten network became stronger as it was able to resist the imposed stress. For
extensibility, increasing the levels of NaCl resulted in an increase in resistance to extension for
all flour cultivars. For stickiness at the 0 and 2% NaCl, doughs prepared with Pembina and
Roblin showed the least stickiness relative to McKenzie and Harvest. Water association as a
function of NaCl level was determined within the doughs of the four different cultivars as being
either free water or associated with the starch-fraction or gluten-fraction. Findings indicated that
with the addition of NaCl there was a decrease of free water among the different cultivars and an
increase in the water associated with the starch-fraction. Dough morphology followed along with
the trends of rheology with the stronger dough producing cultivars creating more elongated
protein polymers with a unidirectional network whereas the weaker cultivars created porous
multidirectional networks. Overall, Pembina and Roblin formed stronger gluten networks than
McKenzie and Harvest, where the sensitivity of NaCl was found to be cultivar dependent.
Stickiness was more notable in the weaker cultivars than the stronger.

68
4.2 INTRODUCTION
Sodium chloride is a common additive to processed foods for flavour, functionality, and
preservation. Its reduction in food products is now being either mandated or voluntarily
recommended by governments due to the adverse health effects of high sodium diets. However,
in some foods sodium reduction is less about the negative effect of loss of flavour and more
about the loss of functionality. Bread (and other cereal products) account for ~30% of sodium
intake and is commonly consumed daily (Farahnaky & Hill, 2007; Miller & Hoseney, 2008;
Lynch et al., 2009; Belz et al., 2012). Sodium chloride plays a number of roles aside from
providing flavour to a loaf of bread; it is necessary for enhancing the functional properties of
strength and handling of the dough (Miller & Hoseney, 2008; Uthayakumaran, et al., 2011). Salt
achieves this through its impact on the gluten protein network formation during mixing; it
increases dough development through increased mixing time allowing for increased protein-
protein interaction and therefore increased strength; it controls the rate of yeast fermentation,
therefore affecting the rate of gas production (Uthayakumaran et al., 2011; Belz et al., 2012).
Through its impact on dough handling properties salt leads to an improvement in loaf volume
and crumb grain quality. With the reduction of sodium chloride there are detrimental effects on
bread loaf quality. More specifically, sodium reduction negatively impacts dough rheology and
handling properties in the mixing stage due to a sticky dough phenomenon causing major
processing issues as well as a poor quality final product (Farahnaky & Hill, 2007).
Dough stickiness occurs when the adhesive forces (interactions between the dough
surface and the mixing surface) are high and the cohesive forces (interactions within the dough
i.e., protein-protein interactions) are low (Adhikari et al., 2001; van Velzen et al., 2003).
Previous studies have determined the following factors are linked to the phenomenon of dough
stickiness: flour extraction, amount of water soluble pentosans, protein composition, α-amylase
activity, and proteolytic activity (Chen & Hoseney, 1995a; Hoseney & Smewing, 1999; van
Velzen et al., 2003). Along with these factors, processing (i.e., mixing time/speed, energy input,
temperature, relaxation time) and formulation (i.e., level of hydration, ingredients, quality of
flour) factors can contribute to dough stickiness (van Velzen et al., 2003, Belz et al., 2012).
Bread dough is comprised of three phases; the first being the viscoelastic gluten network, the
second being the embedded starch granules, free water and other water soluble flour
components; and the third being the entrapped air and CO2 (Jekle & Becker, 2011). All of these

69
phases have the ability to affect the microstructure formation and therefore ultimately impact the
dough handling properties and dough stickiness.
The viscoelastic gluten network formation is of the utmost importance in producing
strong dough with good handling properties and determining final bread quality. Without the
addition of salt the gluten proteins carry an overall net positive charge as they are below their
isoelectric point (pH 7.5) within the flour-water system (pH ~6.0) (Gennadios et al., 1993; Miller
& Hoseney, 2008). Due to the net positive charge the proteins repel one another and become
more hydrated in the flour water-system causing decreased mixing times due to decreased
protein-protein interactions which results in a weaker and stickier dough (Miller & Hoseney,
2008). However when salt is added to the flour-water system it serves to shield the charged sites
on the protein’s surface enabling the proteins to interact and aggregate through hydrophobic
interactions and hydrogen bonds. Increased protein-protein interactions occur, due to a slower,
and therefore decreased protein hydration which results in a dough formation that is stronger and
non-sticky (Preston, 1989; Butow et al., 2002; Miller & Hoseney, 2008; Uthayakumaran et al.,
2011).
Dobraszcyk (1997) studied the rheological basis of dough stickiness to find that the
storage modulus was negatively correlated with stickiness and sticky doughs had faster
relaxation times over non-sticky doughs. This led to the conclusion that stickiness is a process
controlled by rheology. Correlations between sensory stickiness and rheological properties of
compression, relaxation and tension of doughs were also reported by Wang and others (1996).
Measuring the rheological properties of the dough gives an indication of the cohesive forces
within the dough and thus if cohesive forces are low it results in sticky dough (Hoseney &
Smewing, 1999). Hoseney and Smewing also stated that factors which affect the surface tension
of water also have an effect on stickiness. In previous studies utilizing similar small deformation
rheological measurements there have been conflicting results on the effect of NaCl on the storage
modulus (G′) (Lynch et al., 2009; Beck et al., 2012a; McCann & Day, 2013; Tuhumury et al.,
2014). Some found that that the Gʹ increased with decreasing NaCl (Salvador et al., 2006; Lynch
et al., 2009; McCann & Day, 2013; Tuhumury et al., 2014) whereas others found the G′ to
decrease with decreasing NaCl (Larsson, 2002; Beck et al., 2012a). Within these studies it is
stated that differences in the findings may stem from differences in protein content and quality.
Different wheat cultivars, with different protein quantity/quality, interact differently with regard

70
to sensitivity to NaCl (Butow et al., 2002; Lynch et al., 2009; Tuhumury et al., 2014). These
differing effects of NaCl on different protein qualities would also have differing effects on
protein hydration and therefore other flour component hydration, all of which could affect dough
stickiness.
The overall goal of this research was to examine the relationship between dough rheology
and stickiness, and bound vs unbound water within the doughs prepared from four different
CWRS wheat cultivars under reduced sodium conditions.
4.3 MATERIALS AND METHODS
4.3.1 Materials
Four CWRS wheat flour cultivars (Pembina, Roblin, McKenzie, and Harvest) were
kindly provided the Crop Development Centre at the University of Saskatchewan (Saskatoon,
SK). The four cultivars were grown in plots at the University of Saskatchewan’s Kemen Crop
Research Farm under rain-fed conditions on fallowed land. The previous crops in the rotation
were canola, pea, and barley. All cultivars were seeded May 21, 2013 and each cultivar was
grown in a 2.4 m wide by 15.2 m long plot with row spacing of 17.8 cm. The herbicide,
fungicide and fertilizer used were: BuctrilM (1.0 L/ha) [applied June 11, 2013], Headline (0.4
L/ha) [applied June 28, 2013], and 56.0 kg/ha 23-23-0-10 [applied with seed], respectively. For
seed conditioning: 13/64 round holed screen to scalp, 5.5 X ¾ slotted and 12 triangle buckwheat
screens to sift were used. The cleaned amounts for each cultivar were: Pembina-40 kg, Roblin-48
kg, McKenzie-42 kg and Harvest-60 kg. Pembina was developed at the Canada Department of
Agriculture Research Station (Winnipeg, MB, Canada) by the Rust Area Project Group; it is
unlikely to be grown outside of the rust area and is best suited to the Red River Valley
(Campbell, 1963). Pembina is a cultivar that has an excellent baking quality, a yield comparable
to that of Selkirk grown in the Red River Valley, slightly more rust resistance than Selkirk and
has a one day earlier maturation than Selkirk (Campbell, 1963). Roblin is a cultivar for the
eastern prairies of Canada that was developed at the Agriculture Canada Research Station
(Winnipeg, MB, Canada) it has a similar quality to Marquis, and is a high-protein, early-
maturing and rust-resistant cultivar (Campbell & Czarnecki, 1987). McKenzie was developed by
the Saskatchewan Wheat Pool (Agricultural Research and Development, Saskatoon, SK,
Canada) and has a high grain yield; early maturity; high test weight; high falling number;

71
resistance to stem rust, leaf rust, and common bunt; and has intermediate resistance to Fusarium
head blight (Graf et al., 2003). McKenzie is a cultivar suited to all areas of the Canadian Prairies
(Graf et al., 2003). Harvest is a cultivar that was developed by Agriculture and Agri-Food
Canada (Cereal Research Centre, Winnipeg, MB, Canada) that is suitable to the wheat-producing
regions of the Prairies (Fox et al., 2010). Harvest has the qualities of high-yield, high test weight
and preharvest sprouting resistance (Fox et al., 2010). Milling of the four selected wheat
cultivars was done on a Buhler MLU202 Experimental Mill according to the American
Association of Cereal Chemists International approved method 26-21.02. Prior to milling the
grain was tempered to a moisture of 15.5% for ~ 16 hrs.
Deionized and distilled water (DDH2O) was used in all dough formulations. Rhodamine
B was purchased from Sigma Aldrich (Oakville, ON, Canada). Sodium chloride (NaCl) and
paraffin oil were purchased from VWR (Mississauga, ON, Canada) and were ACS reagent grade.
The water used in this research was produced from a Millipore Milli-QTM water purification
system (Millipore Corp., Milford, MA, USA).
4.3.2 Rheological analysis
4.3.2.1 Dough preparation
All dough was prepared using a 10 g mixograph (TMCO National Mfg., Lincoln, NE)
utilizing a dough formulation comprised of flour (weight on a 14% moisture basis), water
(weight based on farinograph absorption results) and NaCl salt (0-4% on flour weight basis). All
doughs were mixed until just after reaching peak time. All doughs were prepared in triplicate.
4.3.2.2 Dough rheology
Dough rheology was performed according to Jekle & Becker (2011) using an AR-1000
rheometer (TA Instruments, New Castle, USA) equipped with a 40 mm parallel plate fixture (2
mm gap). The temperature was kept constant at 30°C using a Peltier plate temperature system.
Dough (~5 g) was weighed out and then placed in-between the two plates. The excess dough that
resulted once the parallel plate fixture was lowered was trimmed away using a plastic spatula and
paraffin oil was applied to the free surface of the dough to prevent the dough from drying out. A
resting period of 10 min was utilized for the dough prior to any measurements being taken. The
first test that was run was the oscillatory frequency sweep followed by the creep recovery test.
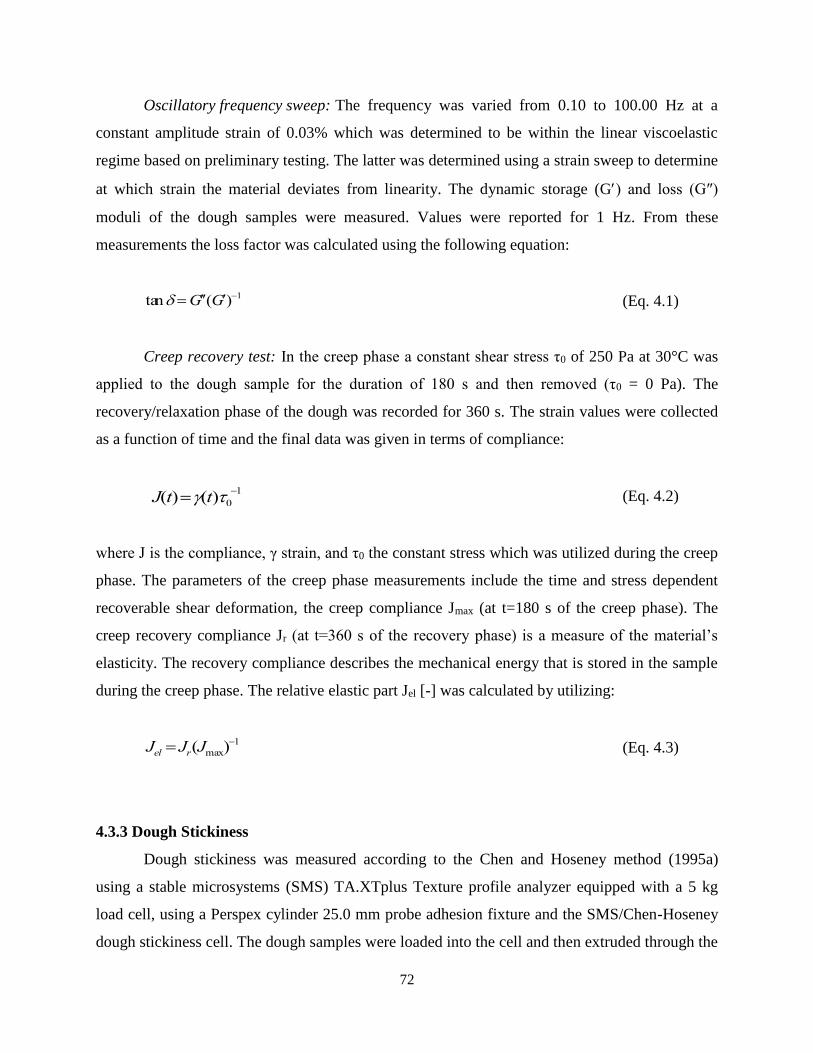
72
Oscillatory frequency sweep: The frequency was varied from 0.10 to 100.00 Hz at a
constant amplitude strain of 0.03% which was determined to be within the linear viscoelastic
regime based on preliminary testing. The latter was determined using a strain sweep to determine
at which strain the material deviates from linearity. The dynamic storage (G) and loss (G″)
moduli of the dough samples were measured. Values were reported for 1 Hz. From these
measurements the loss factor was calculated using the following equation:
(Eq. 4.1)
Creep recovery test: In the creep phase a constant shear stress τ0 of 250 Pa at 30°C was
applied to the dough sample for the duration of 180 s and then removed (τ0 = 0 Pa). The
recovery/relaxation phase of the dough was recorded for 360 s. The strain values were collected
as a function of time and the final data was given in terms of compliance:
(Eq. 4.2)
where J is the compliance, γ strain, and τ0 the constant stress which was utilized during the creep
phase. The parameters of the creep phase measurements include the time and stress dependent
recoverable shear deformation, the creep compliance Jmax (at t=180 s of the creep phase). The
creep recovery compliance Jr (at t=360 s of the recovery phase) is a measure of the material’s
elasticity. The recovery compliance describes the mechanical energy that is stored in the sample
during the creep phase. The relative elastic part Jel [-] was calculated by utilizing:
(Eq. 4.3)
4.3.3 Dough Stickiness
Dough stickiness was measured according to the Chen and Hoseney method (1995a)
using a stable microsystems (SMS) TA.XTplus Texture profile analyzer equipped with a 5 kg
load cell, using a Perspex cylinder 25.0 mm probe adhesion fixture and the SMS/Chen-Hoseney
dough stickiness cell. The dough samples were loaded into the cell and then extruded through the
tan G ( G )1
J(t)(t)01
Jel Jr(Jmax)1

73
openings of the mesh screen by turning the dial on the bottom of the cell. A plastic spatula was
then utilized to clean the initial extruded dough from the screen surface. To keep the dough
height as consistent as possible, the dial was turned two thirds of the way, giving ~ 1 mm of
dough height. After extrusion a plastic cover was placed over top of the dough, to reduce
moisture loss, as it rested for 30 s. The cover was then removed and the probe was brought down
to about 1 mm above the dough surface and then the test was run using a pre-test speed of 0.5
mm/s, test speed of 0.5 mm/s, post speed 10.0 mm/s, distance 15.0 mm, force 40.0 g, time 0.1 s,
and trigger force 10.0 g. The force required by the Perspex probe to separate from the dough’s
surface was recorded as the dough stickiness measurement. Doughs were run in triplicate with
each trial containing approximately six runs from one loading of the cell.
4.3.4 Dough extensibility
Dough extensibility was measured utilizing a stable microsystems (SMS) TA.XTplus
Texture profile analyzer equipped with a 5 kg load cell and an SMS/Kieffer rig with
modifications to the procedure (Stable Micro Systems, 2005). Settings for the test were as
follows: pretest speed of 2.0 mm/s, test speed of 3.3 mm/s, posttest speed of 10.0 mm/s, distance
of 100.0 mm and a trigger force of 5.0 g. The dough was not rested before loading into the oiled
form. Once the dough was in the dough clamp the dough was rested for 10 min at room
temperature (21-23°C). After the resting period the dough strips were then loaded onto the
platform and measurements were taken. The measurements taken were dough resistance to
extension (N), which is the force at the maximum height of the curve and dough extensibility
(mm) which is the length of the curve upon dough breaking.
4.3.5 Differential scanning calorimetry (DSC)
Freezable water content was determined according to Lu and Seetharaman (2013)
utilizing a Q series DSC Q2000 (TA Instruments, New Castle, DE, USA) equipped with a
refrigerated cooling system and nitrogen as the purge gas. Briefly, dough samples of ~ 10-20 mg
were weighed into aluminum DSC pans which were then hermetically sealed before analysis and
an empty pan was used as the reference. The reference pan and sample pan were then loaded and
equilibrated at 30°C for 5 min. The pans were cooled from 30°C to -40°C at a rate of 10°C/min,
held at -40°C for 5 min, followed by heating from to -40°C to 40°C at a rate of 10°C/min. The

74
melting peak enthalpy (∆H) was obtained using the Universal Analysis 2000 version 4.5A
software (TA instruments, New Castle, DE, USA). The freezable water content was calculated
from the melting enthalpy peak divided by the enthalpy of pure water (333.55 J/g) and reported
on a dry weight basis. Moisture determination was done on each dough in triplicate using a NaCl
range of 0-4%, and each flour cultivar (Pembina, Roblin, McKenzie, and Harvest).
4.3.6 Thermogravimetric analysis (TGA)
Thermogravimetric analysis was performed on dough using TGA Q500 apparatus (TA
Instruments, New Castle, DE, USA). Dough samples were prepared using Pembina, Roblin,
McKenzie and Harvest flours with NaCl levels ranging from 0-4% on weight/weight basis.
Dough samples (~70 mg) were placed on platinum pans and scanned from 25 to 200°C at a rate
of 5°C/min. The weight change (which was attributed to moisture loss) and derivative of weight
loss as a function of temperature were obtained. The derivative thermogravimetric (DTG) curve
was used to differentiate between diffusive water (weakly absorbed free water entrapped near the
surface of the dough; more mobile) and more tightly entrapped (more strongly absorbed
multilayer water; less mobile) or bound water within the dough as done by Fessas and Schiraldi
(2001), Crockett et al. (2011) and Roozendaal et al. (2012). The DTG traces were deconvoluted
into Gaussian distributions using PeakFit software (Systat Software, Inc., San Jose, CA, USA)
based on the method of Roozendaal et al. (2012) to give an indication of water’s association with
dough components of starch and gluten.
4.3.7 Confocal laser scanning microscopy (CLSM)
Confocal laser scanning microscopy was utilized to visualize the gluten network
formation of the four different wheat flour cultivars both with (2% NaCl) and without sodium
chloride (0% NaCl) and was based off of the method by Jekle and Becker (2011). The doughs
were prepared as described above. The fluorescent dye rhodamine B was prepared at a
concentration of 0.001% (w/v) in DDH2O and was then utilized as the stock water addition to
each dough formulation to ensure that the dye was distributed homogeneously throughout the
dough during the mixing process. A small sample was then taken from the dough with two
plastic spatulas to try to prevent stretching of the dough, the sample was about 4-5 mm in
diameter. The dough sample was then loaded on the slide and flattened with the cover slip by

75
placing the cover slip overtop and then turning the slide over and lightly pushing it down on the
table. All samples were loaded this way. The dough was analyzed by a Nikon C2 CLSM
microscope (Nikon, Mississauga, ON, Canada) using 20x Plan Fluor (numerical aperture 0.75,
Nikon) objective lens. The excitation and emission wavelengths were 543 nm and 625 nm
(rhodamine B), respectively. A total of 10 images with 512 x 512 µm pixel resolution were taken
for each dough sample from different positions on the xy-axis. Each dough sample was analyzed
in duplicate. Three images of each dough were assessed for particle count, total particle area,
average particle size, circularity and fractal dimension using Image J software (National
Institutes of Health, Bethesda, MD, USA) based off of Jekle and Becker (2011).
4.3.8 Statistical analysis
A two-way analysis of variance (ANOVA) was used to show statistical differences for all
parameters (e.g., G, G, tan , G*, Jmax, Jel, stickiness, resistance to extension, extensibility,
freezable water content, max. peak height temp., peak weight loss, total weight loss, relative
proportion of peak water loss, peak temp., particle count, total particle area, average particle size,
circularity, fractal dimension) as a function of flour cultivar and NaCl level. Since all parameters
showed a significant two-way interaction, a subsequent one-way ANOVA using a Scheffe Post-
hoc test was performed to test for differences in behaviour with the level of salt within each
cultivar. The statistical analysis program IBM SPSS (Armonk, NY, USA) was utilized.
4.4 RESULTS AND DISCUSSION
4.4.1 Dough rheology
4.4.1.1 Oscillatory shear
Oscillatory shear rheometry was used to assess the handling properties of dough prepared
from the four CWRS wheat cultivars as a function of NaCl levels. Small deformation rheology
allows for the examination of the elastic and viscous properties of the dough to be examined in a
non-destructive manner, maintaining the internal microstructure of the dough. For all sample
treatments the storage modulus (or G) (describing the elastic component of the dough) was
greater than the loss modulus (or G) (describing the viscous component of the dough) (Figure
4.1A,B) indicating a highly structured gluten network within the dough. The loss tangent (or tan
) represents the ratio of G over G, where values <1 indicate the material is behaving as an

76
elastic solid, whereas values >1 indicate the material is behaving more as a liquid. A two-way
analysis of variance of G, G, tan and complex modulus (G*) found that both the effect of
NaCl and flour cultivar, along with their interaction made a significant difference (p<0.05).
Overall the magnitude of both G and G was greatest for Pembina followed by McKenzie,
Roblin and then Harvest regardless of the NaCl content (Figure 4.1A,B). In the case of G, all
flour cultivars saw an increase in dough strength as the levels of NaCl were raised from 0 to 4%
(Figure 4.1A), although at different rates. Pembina and McKenzie seemed to be more sensitive to
changes in NaCl levels than Roblin and Harvest as evident by their steeper slopes. In contrast,
G was less sensitive to the effect of NaCl level where the magnitudes were found to be constant
for all flour cultivars between 0 and 2%, and then increased slightly at 4% NaCl (Figure 4.1B).
However, the ratio of the two (i.e., tan ) suggests that the dough properties of Roblin, McKenzie
and Harvest were similar, and formed weaker gluten networks than that of Pembina. In all cases,
dough became stronger in a curvilinear fashion as the NaCl levels increased from 0 to 4%
(Figure 4.1C). The addition of NaCl is believed to shield charges on the amino groups on the
gluten proteins, effectively reducing its electric double layer to promote protein-protein
aggregation and hydrophobic interactions, and then ultimately a stronger more structured gluten
network.
The complex modulus (G*) describes the overall resistance to flow of the material in
response to imposed oscillatory strain, and is a direct measure of the rigidity or stiffness of the
dough. Overall, dough prepared by Pembina displayed the greatest dough rigidity of all the flour
cultivars examined, followed by McKenzie and Roblin which were similar, and then Harvest
(Figure 4.2). In all cases, G* was relatively independent of NaCl between 0 and 2%, although
both Pembina and McKenzie saw a slight increasing trend over the NaCl level. (Figure 4.2). All
dough, regardless of the cultivar, saw an increase in dough rigidity as NaCl increased from 2% to
4% (Figure 4.2).

77
Figure 4.1 Dynamic storage (G) (A) and loss (G″) (B) moduli, and tan () (C) at 1 Hz for dough prepared using different CWRS
wheat cultivars (Pembina, Roblin, McKenzie and Harvest) as a function of NaCl level. Data represents the mean ± one
standard deviation (n = 3).
77
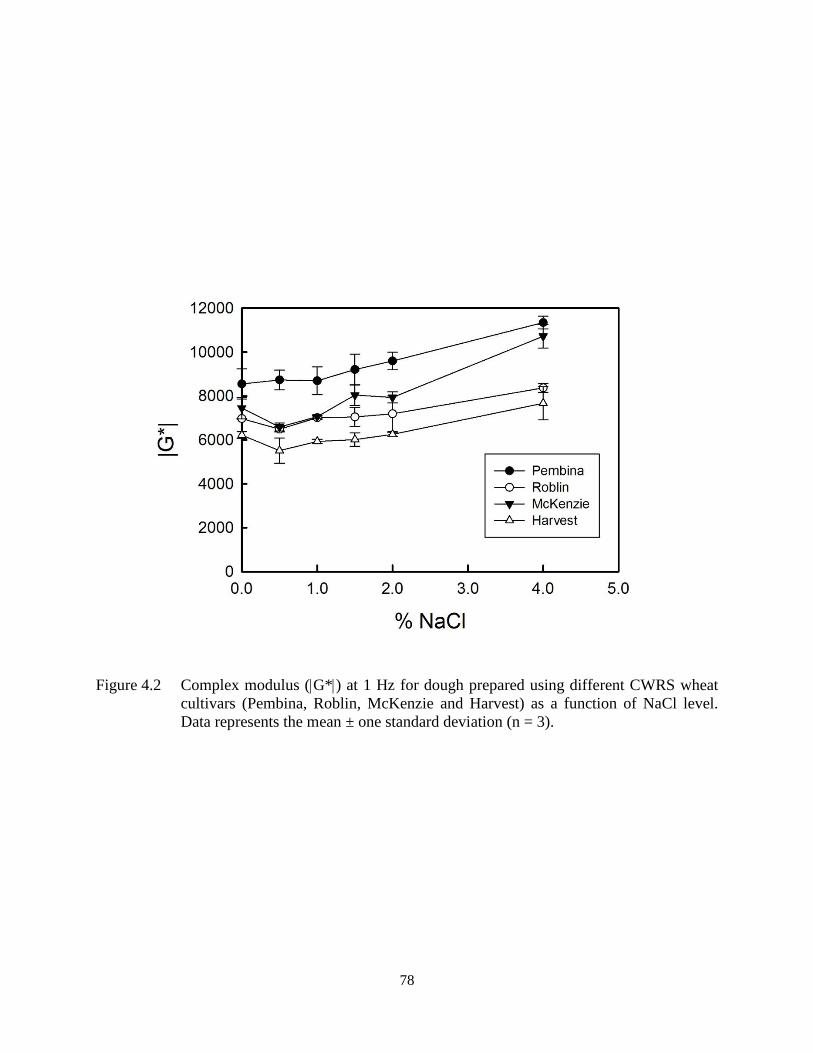
78
Figure 4.2 Complex modulus (G*) at 1 Hz for dough prepared using different CWRS wheat
cultivars (Pembina, Roblin, McKenzie and Harvest) as a function of NaCl level.
Data represents the mean ± one standard deviation (n = 3).

79
4.4.1.2 Creep recovery
Creep recovery measurements were taken to examine the amount of deformation given a
constant applied stress that the dough would experience, and then the level of recovery, to give an
indication of dough elasticity. Dough with longer relaxation times have been found to correlate
with good baking properties since the dough is stronger (Dobraszyck & Morgenstern, 2003). Creep
recovery experiments were carried out on dough prepared using the four cultivars and as a function
of NaCl levels. A two-way analysis of variance of Jmax and of Jel found that both flour cultivar and
NaCl level, along with their associated interaction were significant (p<0.001). Overall, during the
creep phase, the amount of deformation of the dough (Jmax) decreased with increasing NaCl
levels indicating that the gluten network is becoming stronger as it is able to resist the imposed
stress (Figure 4.3A). Harvest was observed to show the greatest Jmax suggesting that the dough
was most susceptible to the imposed stress, followed by Roblin and McKenzie which were
similar, and then Pembina. Dough prepared using Pembina showed the least amount of NaCl
sensitivity, especially between the 1% and 2% levels (Figure 4.3A). With respect to the recovery
phase, the relative elasticity of the doughs was found to increase with increasing NaCl levels for all
flour cultivars. The magnitude of Jel was found to be greatest for Pembina, which had the strongest
more elastic networks, followed by Roblin, McKenzie and then Harvest, which had the weakest
gluten network (Figure 4.3B).
4.4.2 Dough stickiness
Dough stickiness measurements are utilized to examine the adhesive forces (interactions
between the dough and mixing surface) and the cohesive forces (interactions within the dough).
Dough with high stickiness values indicates higher adhesive forces and lower cohesive forces (i.e.,
weak dough) whereas low stickiness values indicate lower adhesive forces and higher cohesive
forces (i.e., strong dough). A two-way analysis of variance on dough stickiness values found the
main effects of NaCl level and flour cultivar, along with their interaction were statistically
significant (p<0.001). Overall between the 0 and 2% NaCl levels, Pembina and Roblin had the
least stickiness relative to McKenzie and Harvest (Figure 4.4). Both Pembina and Roblin are
considered to form strong gluten network, whereas McKenzie and Harvest have more
intermediate and weak gluten strengths, respectively. In the case of Harvest, dough stickiness
increased from 0.570 N at 2% NaCl to 0.689 N at 0% NaCl in relatively a linear fashion

80
Figure 4.3 Maximum creep compliance (Jmax) (A) and relative elasticity (Jel) (B) for dough
prepared using different CWRS wheat cultivars (Pembina, Roblin, McKenzie and
Harvest) as a function of NaCl level. Data represents the mean ± one standard
deviation (n = 3).

81
Figure 4.4 Stickiness values for dough prepared using different CWRS wheat cultivars
(Pembina, Roblin, McKenzie and Harvest) as a function of NaCl level. Data
represents the mean ± one standard deviation (n = 3).
(p<0.001) (Figure 4.4). In contrast, McKenzie remained relatively constant with NaCl level
between 0 and 2% NaCl with average stickiness values of 0.646 N and 0.639 N (p<0.05) (Figure
4.4). Pembina on the other hand was found to have similar stickiness values at the 1 and 2%
NaCl (p>0.05), and then experienced an increase at the 0% NaCl (p<0.001). Stickiness for
Roblin was found to decrease slightly from 0.550 N to 0.520 N as NaCl levels were lowered
from 2% to 1% (p<0.05), and then increased to 0.564 N at the 0% NaCl (p<0.01) (Figure 4.4).
Harvest, Roblin and Pembina saw an increase in stickiness values as NaCl levels were raised
from 2% to 4%, where values increased from 0.570 N to 0.649 N (p<0.001), 0.550 N to 0.619 N
(p<0.001), and 0.472 N to 0.506 (p<0.05), respectively. In contrast, for McKenzie a slight
decrease in stickiness was observed where values were reduced from 0.639 N to 0.586 N as NaCl
levels increased from 2% to 4% (p<0.001). From the stickiness results it can be seen that the
degree to which each cultivar is impacted by NaCl reduction is cultivar dependent which most
likely arises from differences in flour composition (gluten content/composition, starch

82
content/composition and non-starch polysaccharide content/composition) and quality as these
compositional components have an impact on level of gluten protein hydration which impacts
the level of protein-protein interactions.
4.4.3 Dough extensibility
Measuring the dough’s resistance to extension and extensibility gives another indication
of dough strength. There needs to be a balance between the dough’s resistance to extension and
extensibility, as this dictates gas pore expansion, for CO2 retention to achieve the appropriate
final loaf volume (Khatkar et al., 1995; Beck et al., 2012a; Delcour & Hoseney, 2013b). A two-
way analysis of variance on dough resistance to extension values found the main effects of NaCl
level and flour cultivar, along with their interaction were statistically significant (p<0.001).
Overall, in Figure 4.5A, the trend was that with increasing NaCl levels there was an increase in
resistance to extension although for Pembina this increase was more drastic at the 4% NaCl
level. Pembina and Harvest were more affected by the 1% NaCl addition as their resistance to
extension significantly increased for 0-1% NaCl whereas McKenzie and Roblin were not
significantly affected by the 1% NaCl addition. All flour cultivars noticed a significant increase
in their resistance to extension with the addition of 2-4% when compared to the 0% NaCl level
(p<0.01). This increase in resistance to extension with the addition of NaCl is an indication of
greater protein-protein interactions occurring as the NaCl shields the charges on the proteins and
allows them to form a stronger gluten network through hydrophobic and hydrogen bonding to
build up the gluten network. Pembina and Roblin consistently formed stronger gluten networks
with greater resistance to extension followed by McKenzie and Harvest with the weakest gluten
network formation at all NaCl levels.
A two-way analysis of variance on dough extensibility values found the main effects of
NaCl level and flour cultivar, along with their interaction were statistically significant (p<0.01).
In Figure 4.5B it can be seen that when comparing the doughs at the 0% NaCl level, Pembina
appears to have the highest extensibility followed by Roblin and then Harvest however they are
not significantly different (p>0.05). McKenzie has the lowest extensibility of all the dough
cultivars at 0% NaCl (p<0.05). At 1% NaCl addition all flour cultivars except Harvest noticed a
significant increase in extensibility (p<0.001) with the magnitude being cultivar dependent.
Harvest didn’t exhibit a significant increase in extensibility until the 2% NaCl addition (p<0.001)
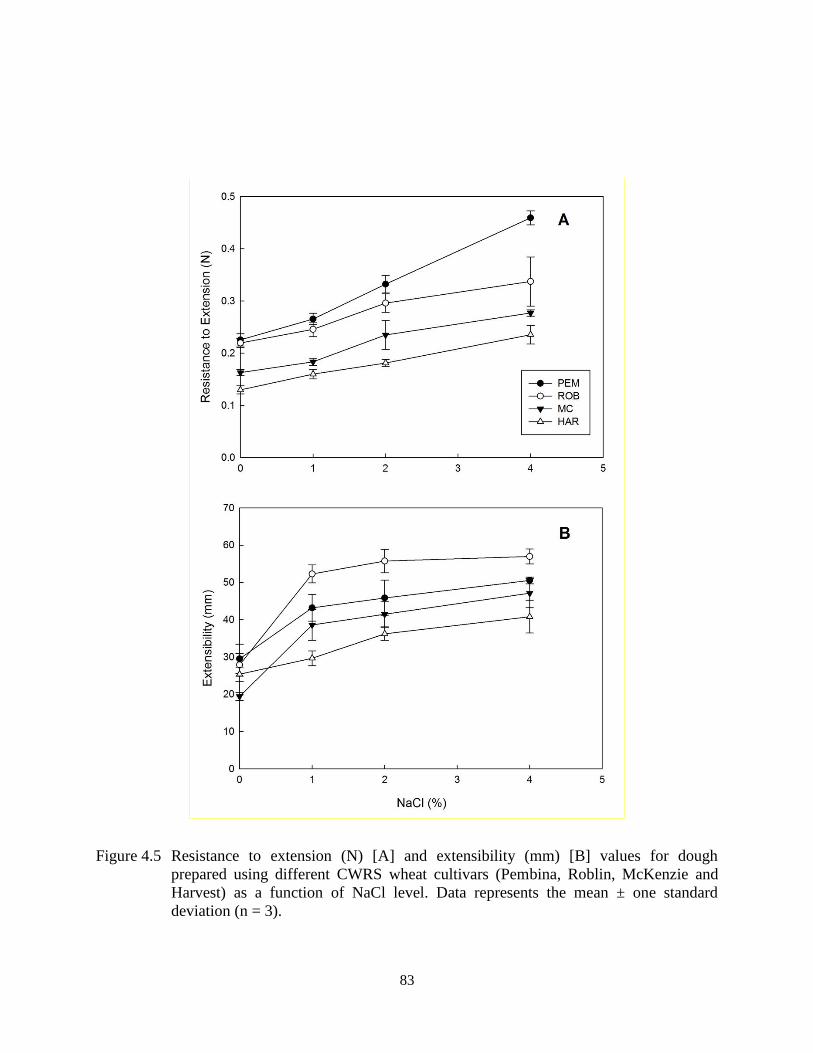
83
Figure 4.5 Resistance to extension (N) [A] and extensibility (mm) [B] values for dough
prepared using different CWRS wheat cultivars (Pembina, Roblin, McKenzie and
Harvest) as a function of NaCl level. Data represents the mean ± one standard
deviation (n = 3).

84
further indicating a weaker flour that requires greater NaCl to induce strengthening effects. At
the 2-4% level the extensibilities continued to increase only slightly from the 1% level.
4.4.4 Freezable water content (FWC)
Differential scanning calorimetry is commonly used to give an indication of how water is
distributed in foods by distinguishing water that is freezable (free/unbound water) and water that
is unfreezable (bound water) (Mak, 2009). A two-way analysis of variance of the freezable water
content (FWC) of doughs and the main effects of flour cultivar and NaCl level were significant
along with their two-way interaction (p<0.001). Overall, in Figure 4.6, Pembina was found to
have the lowest freezable water content of all the cultivars. It should be noted that the doughs for
each cultivar are made with different optimal water additions with Pembina having farinograph
absorption of 61.9%, Roblin 65.0%, McKenzie 64.1% and Harvest having 65.5%. By adding the
specific optimal water amounts to each flour cultivar it was believed that this would be a means
of standardizing the doughs’ performance. However in doing so, some of the observed
differences within the FWC data may be attributed to this practice. That said, it was presumed to
only have a minor effect on the FWC data and was more related to the strength of the gluten
network, which is related to the gluten proteins within each flour cultivar and the NaCl levels.
For instance, Roblin and Harvest both had similar amounts of water added during dough
formation; however the FWC in dough prepared with Roblin flour was significantly lower than
that of Harvest at the 1% NaCl level. In contrast at the 0% NaCl level, Roblin, McKenzie, and
Harvest all have similar FWC whereas they all have slightly different water additions. Although,
overall, there were slight differences found in response to the NaCl for all flours for FWC, no
discernible trends were identified (Figure 4.6).
Since the effect of flour cultivar seems to dominate, the freezing effects of free and
unbound water will be discussed for flour cultivar only. It was hypothesized that the stronger
gluten network formed with Pembina would result in a greater amount of entrapped water (more
strongly absorbed multilayer water) within the dough that would be less mobile (or free). In
contrast, the weaker gluten network formed with Harvest is presumed to have a greater amount
of mobile water that is freezable. In considering dough stickiness, this effect would cause the
dough prepared with Harvest to become sticky, and Pembina not. It is interesting to note that at

85
Figure 4.6 Freezable water content (g ice/g sample d.b.) values for dough prepared using
different CWRS wheat cultivars (Pembina [PEM], Roblin [ROB], McKenzie [MC]
and Harvest [HAR]) as a function of NaCl level. Data represents the mean ± one
standard deviation (n = 3). Upper case letters represent comparisons within a flour
cultivar at each NaCl level. Lower case letters represent comparisons between flour
cultivars at the same NaCl level. Different letters represent significant differences
(p<0.05).
the 1% NaCl level for Roblin that it has the highest amount of FWC of the cultivars, however
when looking at the stickiness results in Figure 4.4, it has the second lowest stickiness, with
McKenzie and Harvest having higher stickiness values however they have lower FWC values.
This may further point towards the hypothesis that there is a difference in the FWC location
within the doughs and whether the water is entrapped (more strongly absorbed multilayer water,
less mobile) within the gluten network formation (as it most likely is within the stronger cultivar
of Roblin versus being near the surface of the dough in the diffusive water layer (weakly
absorbed free water entrapped near the surface of the dough; more mobile) as it most likely is
with McKenzie and Harvest which would most likely lead to the greater adhesive forces between
the dough’s surface and the stickiness probe). It is also interesting to note that in all cultivars
except for Pembina, at the 4% NaCl level there is the lowest FWC when comparing NaCl levels

86
within each separate flour cultivar. And at the 1% NaCl level, a decrease in the FWC was
observed for Pembina compared to the 0% level. In the case of Roblin, an increase in FWC was
observed at the 1%NaCl level relative to the 0% level. McKenzie and Harvest have similar FWC
for both 0% and 1% which are both weaker flours than Pembina and Roblin which may again
further point to the dominance of effect of flour cultivar versus the effect of NaCl level.
4.4.5 Thermogravimetric analysis (TGA)
In a previous work by Fessas and Schiraldi (2001), thermogravimetric analysis (TGA)
was utilized as an indicator of water being released from dough in two processes: the first
through a diffusion process and second, by the desorption of the water that was more tightly
bound to the gluten network. Therefore, TGA was applied in the present study to describe the
different water associations with respect to either being near the surface of the dough existing as
diffusive water (which would relate more to the diffusion process) or entrapped within the gluten
network (which would relate more to the more strongly absorbed multilayer and bound water).
Figure 4.7 gives a typical TGA scan seen for the dough samples used in this study. The first peak
of the derivative gives an indication of water that is weakly interacting with the gluten network
and is considered a part of the diffusive water layer. The second peak is in accordance with the
water that is more strongly associated with the gluten network either entrapped within the
network or bound by the gluten proteins. The effects of flour cultivar and NaCl level on weight
loss and maximum peak height temperature for peak one and two are presented in Table 4.1. A
two-way ANOVA found the effect of flour cultivar (p<0.001) and NaCl level (p<0.01) on weight
loss of the first peak to be significant, along with their interaction (p<0.001). Overall, in relation
to the first peak weight loss when compared to other flour cultivars (regardless of NaCl level),
Harvest (13.8%) showed the greatest amount of water loss (p<0.001) followed by Roblin
(10.5%), Pembina (9.7%) and McKenzie (8.4%). However, Pembina was not significantly
different than Roblin and McKenzie (p>0.05) but Roblin lost significantly more water than
McKenzie (p<0.01). These results are presumed to occur given that Harvest forms the weakest
gluten network resulting in a greater amount of water near the surface of the dough (weakly
absorbed free water near the surface; more mobile) instead of being entrapped (strongly
absorbed) within the network whereas in the other flour cultivars, which form stronger gluten

87
Figure 4.7 Derivative of the thermogram (weight change %/°C) of doughs prepared with CWRS
wheat cultivars Pembina (A), Roblin (B), McKenzie (C), and Harvest (D) as a
function of NaCl level.

88
Table 4.1 Thermogravimetric analysis values for dough prepared using CWRS wheat cultivars Pembina, Roblin, McKenzie and
Harvest as a function of NaCl level. Data represents the mean ± one standard deviation (n = 2).
Flour cultivar NaCl (%) 1st peak 2nd peak Total weight loss (%)2
Max. peak height
temp (°C)
Percent of total
weight loss (%)1
Max. peak height
temp (°C)
Percent of total
weight loss (%)1
Pembina 0 48.18 ± 3.01a,A 9.49 ± 1.30a,A 146.02 ± 1.05c,C 63.97 ± 2.14ab,AB 43.69 ± 0.05bc,A
1 50.80 ± 0.24a,A 10.51 ± 0.66a,B 144.54 ± 0.99bc,C 61.89 ± 0.02a,A 44.65 ± 0.12c,AB
2 49.18 ± 1.65a,A 8.32 ± 0.04a,A 139.91 ± 1.17a,B 65.65 ± 1.99b,B 42.61 ± 0.96a,A
4 50.97 ± 0.01a,A 10.50 ± 0.88a,A 142.51 ± 0.73ab,B 66.94 ± 0.44b,C 42.80 ± 0.14ab,A
Roblin 0 51.4 ± 2.7a,AB 10.5 ± 1.7ab,A 142.5 ± 0.9b,B 66.5 ± 2.8b,B 44.0 ± 0.1b,A
1 49.6 ± 0.5a,A 10.3 ± 0.5ab,B 138.2 ± 0.8a,AB 66.5 ± 0.2b,BC 43.8 ± 0.2ab,A
2 55.2 ± 0.4b,B 12.2 ± 1.1b,B 137.7 ± 0.9a,AB 61.5 ± 0.9a,A 43.4 ± 0.3ab,AB
4 52.2 ± 3.8ab,A 9.1 ± 2.0a,A 140.1 ± 1.3ab,AB 64.6 ± 0.5ab,BC 43.0 ± 0.3a,A
McKenzie 0 52.4 ± 1.9b,B 9.0 ± 0.6a,A 136.9 ± 3.2ab,A 64.1 ± 0.9a,B 43.8 ± 1.0a,A
1 47.8 ± 0.0a,A 7.0 ± 0.2a,A 135.4 ± 0.3a,A 65.6 ± 0.0a,AB 43.9 ± 0.3a,A
2 50.0 ± 0.5ab,A 8.7 ± 0.9a,A 137.2 ± 2.0ab,AB 64.4 ± 0.6a,AB 43.7 ± 0.2a,B
4 50.7 ± 0.5ab,A 9.0 ± 0.1a,A 138.7± 0.7b,A 63.1 ± 2.5a,B 43.1 ± 0.1a,A
88

89
Table 4.1 (cont.)
Flour cultivar NaCl (%) 1st peak 2nd peak Total weight loss (%)2
Max. peak height
temp (°C)
Percent of total
weight loss (%)1
Max. peak height
temp (°C)
Percent of total
weight loss (%)1
Harvest 0 56.75 ± 0.49b,C 19.80 ± 2.19c,B 141.35 ± 2.80b,B 62.23 ± 0.11b,A 46.68 ± 0.91c,B
1 48.56 ± 0.63a,A 9.07 ± 1.55a,AB 138.99 ± 0.31ab,B 69.31 ± 4.29c,C 45.40 ± 0.22b,B
2 49.05 ± 2.35a,A 9.68 ± 1.61a,AB 136.21 ± 1.35a,A 68.00 ± 1.35c,B 45.00 ± 0.00b,C
4 54.08 ± 2.39b,A 16.80 ± 1.56b,B 140.54 ± 1.42b,AB 58.26 ± 1.52a,A 43.75 ± 0.30a,A
Different letters for each flour cultivar in each column are significantly different (p<0.05). The lower case letters are comparisons within a cultivar
and upper case letters are comparisons between cultivars at each NaCl level.
1Percent of total weight loss % at the first and second peak was calculated by over laying the thermogram of weight % curve over the derivative
weight change (weight change % /°C) curve and subtracting the end limit of the peak by the onset limit of the peak to obtain weight loss % over
the peak interval. This value was then divided by the total weight loss % and multiplied by 100 to get the percent of total weight loss.
2Total weight loss (%) was calculated by: [(initial weight mg – final weight mg)/ initial weight mg] x 100.
89

90
networks are believed to entrap more water within the gluten network and contain less weakly
absorbed free water near the surface of the dough.
The effect of NaCl was different in the case of each flour cultivar. In the case of Pembina
there appears to be no apparent trend with increasing NaCl level with weight loss ranging from
(8.3-10.5%). In the case of Roblin there again doesn’t appear to be an apparent trend except for
the fact that 2% NaCl lost a greater amount of weight (12.2%) than the 4% NaCl level (9.1%).
This result is similar to the findings for Roblin in the FWC with 2% having a greater level of
FWC than 4% (Figure 4.6). However, this does not coincide with the findings from dough
stickiness where stickiness is seen to increase when going from 2-4% (Figure 4.4). In the case of
McKenzie again there appears to be no apparent trend with weight loss ranging from (7.0-9.0%)
which lost the least amount of water at the first peak relating to the diffusive water layer. In the
case of Harvest, it appears to be the most affected by the changing NaCl levels, losing the
greatest amount of water at 0% (19.8%) and 4% (16.8%) whereas the amount of water lost at the
1 and 2% NaCl level was more similar to that of the other flours. This could be an indication of a
change in the water’s spatial distribution within the dough from near the surface or free water
weakly absorbed to having a greater amount becoming entrapped (more strongly absorbed) as a
result of the NaCl resulting in a greater formed gluten network. In contrast, for Harvest, weight
loss at the first peak declined from ~20% with 0% NaCl to ~11% in the presence of NaCl (in the
range of 1-2%), however at the 4% level Harvest exhibited an increase ~17% (Table 4.1). The
greater loss at the 0% NaCl level is thought to be associated with a weaker gluten network being
formed than in the presence of NaCl, allowing for greater free water weakly absorbed near the
surface. This hypothesis is supported by the stickiness results, where stickiness was greatest at
the 0 and 4% NaCl level and lower from 1 to 2%.
A two-way ANOVA found the first peak temperature to be impacted by flour cultivar
(p<0.05) and NaCl level (p<0.05) along with their interaction (p<0.01). Overall, regardless of
NaCl level, Pembina experienced a lower temperature (49.8°C) required to release the diffusive
water than Roblin (52.1°C) and Harvest (52.1°C) (p<0.05) however it was similar to McKenzie
(50.2°C) (p>0.05). The temperatures required to release the diffusive water from Roblin,
McKenzie and Harvest were found to be similar as well (p>0.05). This was supported by DSC
data (Figure 4.6), it can be seen that Pembina (Figure 4.7A), was less affected by NaCl levels
than the other flours (Figure 4.7B-D).

91
A two-way ANOVA of the second peak weight loss found the effect of NaCl level and
flour cultivar to not be significant (p>0.05), however their interaction was highly significant
(p<0.001). Table 4.1 shows no obvious trends in NaCl levels within each flour cultivar, with the
exception of Harvest where at the 1 and 2% NaCl levels the greatest amount of weight is lost in
the second peak and the least amount is lost in the first peak and vice versa for the 0 and 4%
NaCl levels. This again follows along with the stickiness trend seen for the stickiness data. When
comparing the different flour cultivars at each NaCl level, at the 0% level only Roblin and
Harvest were significantly different with Roblin losing a greater amount (66.5%) than Harvest
(62.2%).
A two-way ANOVA found the second max peak height temperature to show significant
effects of flour cultivar (p<0.001) and NaCl level (p<0.001), however, their interaction was not
significant (p>0.05). Overall when comparing flour cultivars, regardless of NaCl level, Pembina
had the highest second peak max temperature (143.2°C) (p<0.001) followed by Roblin (139.6°C)
and Harvest (139.3°C) which were similar (p>0.05), and McKenzie which has the lowest
temperature (137.0°C) (p<0.01). Overall when comparing NaCl level regardless of flour cultivar,
the trend seems to be that at the 2% NaCl level there is a decrease in the peak temperature
(137.8°C) whereas at 0, 1 and 4% NaCl they have fairly similar but slightly higher temperatures
of 141.7°C, 139.3°C, and 140.5°C respectively. Peak temperature for 2% NaCl is significantly
lower than both 0% and 4% (p<0.01), however it is similar to the 1% temperature (p>0.05). The
second peak temperature for no salt addition is significantly higher than that of 1 and 2% NaCl.
It was hypothesized this was occurring because at 0% NaCl level, more of the water is hydrating
the gluten proteins and therefore it takes more energy to pull off, whereas with the inclusion of
NaCl there is less hydration of the proteins due to increased protein-protein interaction and
increased water-ion interaction.
With respect to total weight loss a two-way ANOVA shows that the main effects of NaCl
(p<0.001) and flour cultivar (p<0.001) are significant as well as their interaction (p<0.05). The
overall trend when considering the effect of NaCl, regardless of flour cultivar, is with increasing
amounts of NaCl there is a slight decrease in the amount of water lost with each level of NaCl
(p<0.05) (Table 4.1). However, 0% and 1% NaCl total weight loss is not significantly different
(p>0.05). When considering the effect of flour cultivar, regardless of NaCl level, the trend is that
Harvest loses the greatest amount of water at 45.2% (p<0.001) whereas Pembina, Roblin and
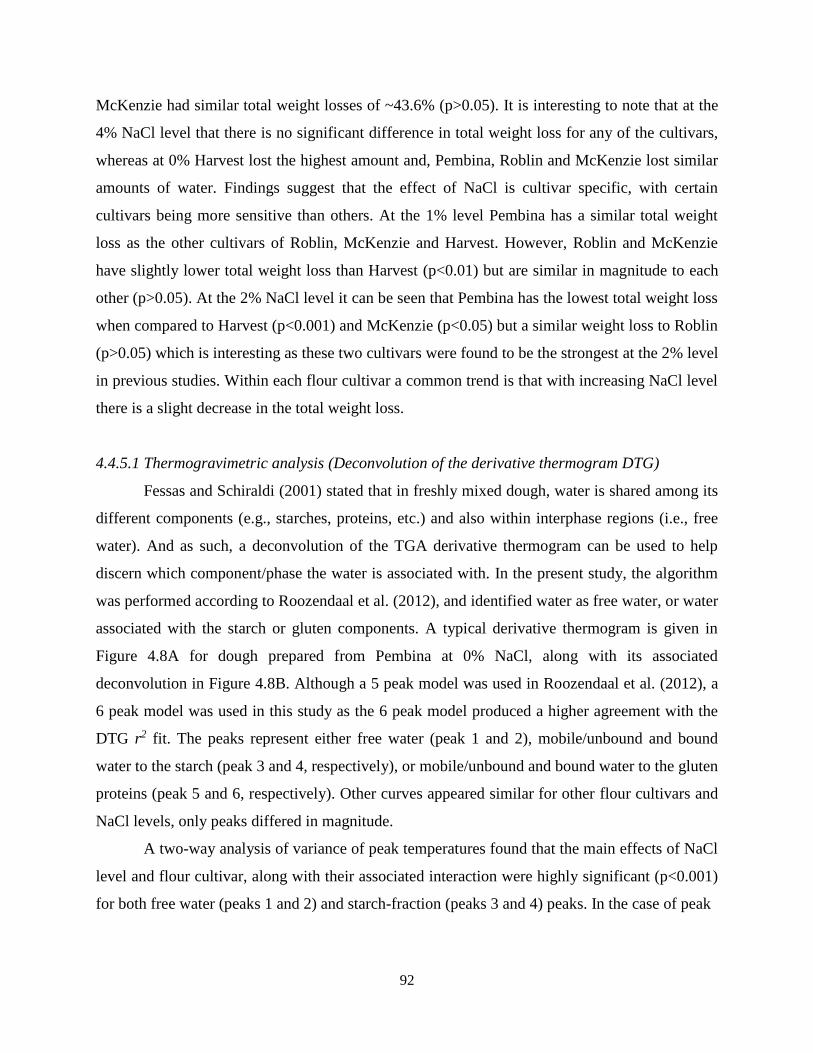
92
McKenzie had similar total weight losses of ~43.6% (p>0.05). It is interesting to note that at the
4% NaCl level that there is no significant difference in total weight loss for any of the cultivars,
whereas at 0% Harvest lost the highest amount and, Pembina, Roblin and McKenzie lost similar
amounts of water. Findings suggest that the effect of NaCl is cultivar specific, with certain
cultivars being more sensitive than others. At the 1% level Pembina has a similar total weight
loss as the other cultivars of Roblin, McKenzie and Harvest. However, Roblin and McKenzie
have slightly lower total weight loss than Harvest (p<0.01) but are similar in magnitude to each
other (p>0.05). At the 2% NaCl level it can be seen that Pembina has the lowest total weight loss
when compared to Harvest (p<0.001) and McKenzie (p<0.05) but a similar weight loss to Roblin
(p>0.05) which is interesting as these two cultivars were found to be the strongest at the 2% level
in previous studies. Within each flour cultivar a common trend is that with increasing NaCl level
there is a slight decrease in the total weight loss.
4.4.5.1 Thermogravimetric analysis (Deconvolution of the derivative thermogram DTG)
Fessas and Schiraldi (2001) stated that in freshly mixed dough, water is shared among its
different components (e.g., starches, proteins, etc.) and also within interphase regions (i.e., free
water). And as such, a deconvolution of the TGA derivative thermogram can be used to help
discern which component/phase the water is associated with. In the present study, the algorithm
was performed according to Roozendaal et al. (2012), and identified water as free water, or water
associated with the starch or gluten components. A typical derivative thermogram is given in
Figure 4.8A for dough prepared from Pembina at 0% NaCl, along with its associated
deconvolution in Figure 4.8B. Although a 5 peak model was used in Roozendaal et al. (2012), a
6 peak model was used in this study as the 6 peak model produced a higher agreement with the
DTG r2 fit. The peaks represent either free water (peak 1 and 2), mobile/unbound and bound
water to the starch (peak 3 and 4, respectively), or mobile/unbound and bound water to the gluten
proteins (peak 5 and 6, respectively). Other curves appeared similar for other flour cultivars and
NaCl levels, only peaks differed in magnitude.
A two-way analysis of variance of peak temperatures found that the main effects of NaCl
level and flour cultivar, along with their associated interaction were highly significant (p<0.001)
for both free water (peaks 1 and 2) and starch-fraction (peaks 3 and 4) peaks. In the case of peak

93
Figure 4.8 Derivative thermogram (weight change %/°C) for a dough prepared with Pembina
at 0% NaCl (A) and the deconvolution of the derivative thermogram (B). Peak 1
& 2 represents water associated with free water, peak 3 & 4 represents water
associated with starch both mobile and bound respectively, and peak 5 & 6
represent water associated with gluten both mobile and bound respectively.
94
temperature associated with the gluten-fraction, the effect of NaCl level and flour cultivar were
significant (p <0.01), whereas the interaction between the main effects was not (p>0.05). Within
Table 4.2 the overall trend for peak temperatures, when comparing between NaCl levels within
flour cultivar, showed a decrease in temperatures required to remove the water for each peak
with the addition of NaCl. It is interesting to note that Pembina requires the highest temperature
(~149 °C) to pull the water from the bound gluten peak (peak 6) at the 0% NaCl relative to
Roblin, McKenzie and Harvest which were all fairly similar. This may correspond to a more
ordered gluten network that is able to entrap water better (absorb more strongly), resulting in a
stronger and non-sticky dough. With the addition of 2% NaCl it can be seen that the peak
temperature for water loss of bound gluten water (peak 6) is similar among the flour cultivars
(~140 °C). The latter, may suggest why flours perform well at the 2% level in terms of dough
handling.
Overall, when comparing the 0% to 2% NaCl within each flour cultivar, the water loss
for the unbound and bound starch (peaks 3 and 4) and gluten (peaks 5 and 6) do not differ
greatly. However there is a notable change in the water loss for the free water peaks (peaks 1 and
2). The greatest changes are seen within Pembina and Harvest, with both experiencing a decrease
in the amount of free water lost in peaks 1 and 2 with the addition of 2% NaCl. Based on these
findings further discussions regarding water loss will be discussed as it relates to free water
(peak 1 + 2), the starch-fraction (peak 3 + 4) and the gluten-fraction (peak 5 + 6), as shown in
Figure 4.9. The corresponding two-way ANOVA results are given in Table 4.3. For free water,
the main effects of NaCl level (p<0.001) and flour cultivar (p < 0.01) were significant, along
with their associated interaction (p<0.01). The overall trend when comparing NaCl level,
regardless of flour cultivar, was that with the removal of NaCl there was an increase in the
amount of free water loss from ~15% with 2% NaCl to ~ 21% with 0% NaCl (p<0.001). At the
0% NaCl level, Pembina and McKenzie showed the lowest amount of free water loss (~18%)
followed by Roblin (~22%) and Harvest (~28%) with the highest. However, at the 2% NaCl
there was no significant difference between the free water loss between each flour cultivar.
A two-way ANOVA of the peak water loss associated with the starch-fraction found that
the main effects of NaCl level (p<0.01) and flour cultivar (p<0.05) were significant, along with
their associated interaction (p<0.05). The overall trend, when comparing NaCl level regardless of
flour cultivar, is that more water was lost from the starch-fraction at the 2% NaCl level (~22%)

95
Table 4.2 Peak fitting data for peak temperature and relative proportion of peak water loss for doughs prepared using CWRS wheat
cultivars (Pembina, Roblin, McKenzie, Harvest) as a function of 0% and 2% NaCl. Values represent mean samples ± one
standard deviation (n=2).
Peak Temperature (°C) Relative Proportion of Peak
Water Loss (%)
Flour
Cultivar
Water’s
Association Peak Number 0% NaCl 2% NaCl 0% NaCl 2% NaCl
Pembina Free 1 41.1 ± 0.6 42.4 ± 0.3 8.7 ± 0.4 7.4 ± 0.1
2 61.7 ± 0.2 58.8 ± 0.2 9.4 ± 0.8 6.9 ± 0.3
Starch 3 84.2 ± 0.2 81.4 ± 0.6 8.9 ± 0.1 12.7 ± 0.2
4 105.5 ± 0.3 102.4 ± 0.3 10.4 ± 2.0 8.9 ± 1.3
Gluten 5 131.5 ± 1.3 124.8 ± 0.7 25.8 ± 0.8 22.2 ± 2.7
6 149.2 ± 0.5 141.8 ± 0.2 36.8 ± 4.2 41.8 ± 1.9
Roblin Free 1 46.5 ± 0.3 41.9 ± 0.3 11.3 ± 1.1 7.6 ± 2.3
2 68.9 ± 0.2 53.7 ± 0.9 10.4 ± 0.0 7.7 ± 0.4
Starch 3 90.1 ± 1.1 74.4 ± 0.9 10.5 ± 0.9 12.4 ± 0.5
4 103.4 ± 0.6 96.5 ± 0.2 6.4 ± 1.9 13.0 ± 1.7
Gluten 5 124.1 ± 0.7 122.2 ± 2.1 23.0 ± 0.2 24.3 ± 1.1
6 144.2 ± 0.2 140.4 ± 1.4 38.4 ± 2.4 35.1 ± 0.4
McKenzie Free 1 42.5 ± 0.4 39.5 ± 0.2 8.5 ± 1.3 7.4 ± 0.7
2 61.2 ± 0.7 57.1 ± 0.2 9.5 ± 0.7 9.0 ± 0.0
Starch 3 80.4 ± 0.1 77.5 ± 0.3 8.8 ± 0.5 10.4 ± 1.4
4 98.8 ± 0.3 100.2 ± 0.9 9.5 ± 0.8 12.3 ± 1.6
Gluten 5 121.8 ± 0.9 122.4 ± 2.9 23.2 ± 2.9 17.7 ± 3.8
6 139.0 ± 2.2 138.9 ± 1.8 40.5 ± 5.2 43.2 ± 4.4
Harvest Free 1 49.2 ± 0.8 41.5 ± 0.4 16.0 ± 2.0 6.5 ± 0.2
2 72.9 ± 0.0 54.6 ± 0.7 11.6 ± 2.8 8.0 ± 0.1
Starch 3 88.8 ± 0.3 74.6 ± 0.0 4.4 ± 2.4 9.2 ± 0.1
4 102.9 ± 0.1 96.1 ± 0.4 10.8 ± 1.1 11.1 ± 1.3
Gluten 5 126.2 ± 2.1 121.4 ± 0.3 22.6 ± 4.2 25.3 ± 1.1
6 144.0 ± 2.8 139.0 ± 0.7 34.7 ± 3.7 39.9 ± 2.5
95

96
Figure 4.9 Peak fitting data representing total peak free water (A), starch-fraction (B), and
gluten-fraction (C) water loss (%) for doughs prepared using CWRS wheat
cultivars (Pembina [PEM], Roblin [ROB], McKenzie [MC], and Harvest [HAR])
as a function of 0% and 2% NaCl. Values represent means ± sd. (n=2). Lower
case letters represent comparisons within a flour cultivar between NaCl level.
Upper case letters represent comparisons between flour cultivars at each NaCl
level. Different levels are significantly different p<0.05.

97
Table 4.3 Probability values arising from a two-way analysis of variance for peak fitting data
for proportional area under the curve for free water peaks, starch water peaks and
gluten water peaks for doughs prepared using CWRS wheat cultivars (Pembina,
Roblin, McKenzie, Harvest) as a function of 0% and 2% NaCl.
Peak area
Free water
(Peaks 1 + 2)
Starch-fraction
(Peaks 3 + 4)
Gluten-fraction
(Peaks 5 + 6)
Main effects
NaCl level p < 0.001 p < 0.001 NS
Flour cultivar p < 0.01 p < 0.05 NS
Interaction
NaCl level*flour cultivar p < 0.01 p < 0.05 p < 0.05
versus the 0% NaCl level (~17%). This trend is opposite to that of the free water loss where there
was a decrease in water loss when going from 0% NaCl to 2% NaCl (p<0.001). It is
hypothesized that at the 0% NaCl the doughs had more water present as free water than in the
starch fraction, whereas at the 2% NaCl level water is more associated with the starch, and less
so in free water form. When comparing flour cultivar, regardless of NaCl level, water loss for
Pembina, Roblin and McKenzie are all similar (~21%) (p>0.05), whereas Harvest lost the least
amount of water from the starch-fraction (~18%) (p<0.05). At the 0% NaCl level Harvest lost the
least amount of water (~15%) compared to Pembina and McKenzie (~19%) (p<0.05). Roblin’s
water loss for the starch fraction was not significantly different from the other flours at 0% NaCl.
When comparing flour cultivars at the 2% NaCl level there is a shift in amount of water lost.
Harvest has an increase in water loss but still has the lowest amount of water lost (~20%),
however is similar to Pembina (~22%) and McKenzie (~23%) (p>0.05) whereas Roblin has the
highest amount of water lost (~25%) (p<0.05) but it is not significantly different from McKenzie.
A two-way ANOVA of the water loss associated with the gluten-fraction found that the
main effects of NaCl level and flour cultivar were not significant (p>0.05), however their
associated interaction was significant (p<0.05). When comparing flour cultivar at the 0% NaCl

98
level, Harvest had the lowest amount of water lost from the gluten-fraction (~57%) (p<0.05)
followed by Roblin (~61%), Pembina (~63%) and McKenzie (~64%), which were not
significantly different (p>0.05). For the 2% NaCl level there was no apparent trend observed
between the different cultivars; Roblin lost the least amount of water (~59%) (p<0.05) followed
by McKenzie (~61%) and Pembina (~64%), which were not significantly different, and Harvest
lost the greatest amount for water from the gluten-fraction (p<0.05) however it is not
significantly different from Pembina.
Based on the TGA findings, it was hypothesized that the gluten network may not be the
only factor governing dough stickiness in reduced sodium environments, but rather the
relationship between free water and that associated with the starch-fraction. The amount of water
associated with the starch fraction increases at the 2% NaCl level whereas the amount of water
associated with free water decreases. In contrast, at the 0% NaCl level the amount of water
associated with the starch-fraction is decreased and the amount of free water is increased.
Therefore, if the amount of water associated or absorbed by the starch at low NaCl levels could
be increased this may reduce the dough stickiness problem in low sodium environments. A
potential way to increase starch water absorption at low sodium levels would be to increase the
damaged starch. It is further proposed that the strength of the gluten network would mask the
change in water’s association with the starch, which is why Pembina shows less stickiness at
reduced sodium levels than Harvest which has a weaker gluten network formed.
4.4.6 Confocal laser scanning microscopy (CLSM)
Confocal laser scanning micrographs for doughs prepared from Pembina, Roblin,
McKenzie and Harvest flours in the absence and presence of 2% NaCl are given in Figure 4.10.
It was observed that doughs prepared in the absence of NaCl, for all cultivars, were more porous
than those prepared at the 2% NaCl level. For doughs prepared from Pembina, Roblin and
McKenzie flours, gluten proteins showed more directional orientation than without NaCl,
hypothesized to lead to greater elastic properties. However, in the case of doughs prepared with
Harvest flour (the weakest cultivar examined), less differences were observed between the 0 and
2% NaCl levels, with both displaying porous multi-directional orientation of the gluten
polymers.

99
A) PEM, 0% NaCl B) PEM, 2% NaCl
C) ROB, 0% NaCl D) ROB, 2% NaCl
E) MC, 0% NaCl F) MC, 2% NaCl
G) HAR, 0% NaCl H) HAR, 2% NaCl
Figure 4.10 Confocal laser scanning microscopy images for dough prepared using different
CWRS wheat cultivars (Pembina [PEM], Roblin [ROB], McKenzie [MC] and
Harvest [HAR]) with 0% and 2% NaCl.

100
Doughs prepared with Pembina were found to be more elastic than the other doughs,
hypothesized due to the greater organization of gluten polymers. Furthermore, stickiness was
found to be reduced as NaCl levels increased between 0% and 2% for all flours (Figure 4.4),
which is presumed to correlate with the transition from a porous, multi-directional oriented
network of gluten polymers to one that is less porous, with longer unidirectional fibres. The less
ordered porous network is thought to have a greater amount of adhesive forces present than
cohesive forces leading to the higher stickiness values. Jekle and Becker (2011) noted that fewer
protein interactions would lead to more mobile proteins resulting in a weakening effect on the
dough and thus greater stickiness. In the current study, it is presumed that the doughs with more
ordered morphology have a greater amount of protein-protein interactions and cohesive forces
present leading to less sticky dough.
To give a quantitative analysis of the dough morphologies for doughs prepared with
different flour cultivars without and with NaCl, image analysis was evaluated similar to Jekle
and Becker (2011) and given in Table 4.4. In the present study particle count is associated with
degree of protein aggregation. A lower particle count indicates a higher level of gluten protein
aggregation and a weaker gluten network formation due to decreased gluten polymer interaction.
On the other hand a higher particle count would indicate less gluten protein aggregation and an
increased gluten network formation through increased gluten polymer strand interactions which
are identifiable as separate particles from one another. A two-way analysis of variance was run
on all image analysis parameters. For particle count the main effect of both flour cultivar and
NaCl level were significant (p<0.001) however their interaction was not (p>0.05). When
comparing particle count of the doughs prepared with different cultivars and NaCl level it can be
seen that in all cultivars, except for Harvest, the particle counts significantly increase from 0% to
2% NaCl addition indicating a decrease in gluten protein aggregation and an increase in gluten
polymer interaction/organization building up the gluten network. Findings suggest that Pembina
continues to have the highest particle counts (least protein aggregation and thus greater gluten
network formation) at both the 0% and 2% NaCl level; however results do overlap with
McKenzie. Roblin and Harvest particle count are however significantly similar which is
interesting given that Roblin appears to have a more directional gluten network formation as
opposed to Harvest.

101
Table 4.4 Image analysis of confocal laser scanning microscopy of doughs prepared using CWRS wheat cultivars (Pembina [PEM],
Roblin [ROB], McKenzie [MC], Harvest [HAR]) as a function of 0% and 2% NaCl. Values represent mean of 3 images ±
one standard deviations.
Flour
cultivar
NaCl
(%)
Particle Count
Total Particle
Area (104 µm2)
Average Particle
Size
(µm2)
Circularity
Fractal Dimension
PEM
0
4290 ± 745b,A
12.80 ± 2.94a,A
31.21 ± 11.85a,A
0.89 ± 0.01
1.85 ± 0.05a,A
2 5203 ± 354c,B 15.83 ± 1.80b,B 30.60 ± 4.78ab,A 0.91 ± 0.02 1.89 ± 0.01a,A
ROB
0
2878 ± 228a,A
19.53 ± 0.73c,A
68.06 ± 4.75b,B
0.89 ± 0.01
1.93 ± 0.01b,A
2 4267 ± 756ab,B 15.34 ± 1.87b,B 37.23 ± 10.90bc,A 0.89 ± 0.01 1.90 ± 0.02a,A
MC
0
3879 ± 72b,A
16.25 ± 0.40b,A
41.91 ± 1.43a,B
0.89 ± 0.01
1.91 ± 0.01b,A
2 4728 ± 290bc,B
10.72 ± 0.28a,B 22.72 ± 1.33a,A 0.90 ± 0.01 1.92 ± 0.00a,A
HAR
0 2892 ± 418a,A 18.07 ± 0.63bc,A 63.51 ± 10.52b,B 0.90 ± 0.01 1.94 ± 0.00b,A
2
3670 ± 287a,A 16.84 ± 0.50b,A 46.14 ± 4.72c,A 0.88 ± 0.01 1.93 ± 0.01a,A
Different lowercase letters represent significantly different values within a column within a NaCl level between each flour cultivar p<0.05.
Different uppercase letters represent significantly different values within a column within a single flour cultivar comparing NaCl levels p<0.05.
NOTE: for circularity there are no significant differences p>0.05.
101

102
Total particle area is associated with the total area covered by the particles counted. For
total particle area the main effects of flour cultivar (p<0.001) and NaCl level (p<0.01) were both
significant along with their interaction (p<0.01). There appears to be no trend among the
cultivars when comparing 0% NaCl to 2% NaCl. Pembina has an increase in total area whereas,
Roblin, McKenzie and Harvest have a decrease in total area, however Harvest’s decrease is not
significant (p>0.05). With that said, Pembina and Roblin approach a similar total particle area
with the inclusion of 2% NaCl. Increase in total particle area could be a result of decreased
gluten protein hydration and greater protein-protein interaction for Pembina forming a stronger
gluten network, which is apparent by rheological findings. Jekle and Becker (2011) reported a
decrease in total particle area with the increase in water addition to doughs and they explained
this by a dilution effect on the gluten proteins due to increased hydration and increased water
uptake by the starch granules which would hinder the gluten network formation. This is a similar
explanation for Pembina with an increasing total particle area with the addition of salt due to
charge shielding on the proteins and thus greater gluten protein interaction due to a decrease in
protein hydration and thus an increase in gluten network formation covering a greater area.
However the significant decrease in McKenzie’s total particle area with the inclusion of NaCl
down to a value lower than that of Pembina with no salt is opposite of what would be expected
given that salt creates less protein hydration through charge shielding, causing increased protein-
protein interaction, which visually it appears to do. It is also interesting to note that at the 2%
NaCl level Pembina, Roblin and Harvest do not have significantly different total particle areas,
however visually their microstructures appear different with Pembina and Roblin having a
unidirectional organized gluten network, whereas Harvest appears to have a more porous and
multidirectional gluten network. Therefore, the total particle area may not be a good indicator of
gluten network formation within the present study.
Average particle size is the average size of all the particles counted. For average particle
size the main effects of flour cultivar and NaCl level are highly significant (p<0.001) along with
their interaction (p<0.05). The overall trend for doughs prepared with the different flour cultivars
when comparing 0% NaCl to 2% NaCl is that the average particle size decreases with the
inclusion of salt for each flour cultivar except Pembina, which has an average particle size that
remains similar. The decrease in particle size with the inclusion of salt is indicative of less

103
aggregation of the gluten proteins and the creation of more gluten protein polymer strands
unraveling and interacting to form the gluten network due to charge shielding.
Circularity is a descriptive parameter of the shape of the particles counted. A value closer
to 1 indicates a more circular particle with a value of 1 being completely circular, whereas a
value closer to 0 indicates a more elongated shape. The main effects of flour cultivar and NaCl
level were not significant and neither was their interaction (p>0.05). All the values for doughs
prepared with the four different cultivars at the 0% and 2% NaCl level had values around 0.9
which indicated particles that were close to perfect circles, thus this parameter does not appear to
give a good distinction between gluten microstructure as it was expected that those particles that
formed longer gluten polymers would give more elongated shapes with values closer to 0 and
those gluten protein particles that were aggregated, forming a weak gluten network would have
given values closure to a circular shape. Jekle and Becker (2011) reported circularity values
ranging from ~0.77 to 0.83 for doughs with increasing water additions. They concluded that the
parameter of circularity showed a high fluctuation and therefore a low significance.
According to image j analysis fractal dimension is a measure of the degree of an image’s
pattern or complexity. The main effect of flour cultivar was significant (p<0.01), however NaCl
level was not (p>0.05) but their interaction was significant (p<0.05). Within papers by Jekle and
Becker (2011) and Bigne et al. (2016) fractal dimension (FD) relates to complexity of images
and a higher FD indicates a higher complexity or a more developed and filamentous network.
However within the present study, a higher FD value did not translate into a more complex or
developed gluten network formation when compared to the visual appearance of the
micrographs. When comparing images of 2% NaCl Pembina to 2% Harvest it was expected that
Pembina would have the higher FD value given a more formed gluten network and Harvest
would have a lower value given the high aggregation of gluten proteins and porous structure. The
overall trend for doughs prepared at 0% NaCl with the different flour cultivars all had similar FD
values (~1.93) (p>0.05) expect for Pembina which had the lowest FD (1.85) (p<0.05). Dough
prepared with 2% NaCl with the different cultivars were found to have significantly similar FD
values (~1.91) (p>0.05). From these results it is presumed that Harvest has the significantly
higher FD value (1.93) than Pembina (1.87) when comparing the main effect of flour cultivar,
regardless of NaCl level, because it fills the space more with the larger aggregates (as apparent in
the micrograph with a very dense/ porous structure). Whereas, Pembina, has a smaller FD given

104
that it is more organized and has more empty space in between the protein polymer strands
creating the network. The FD values relate to the total particle area with respect to space filling.
If there is a higher total particle area then the FD would also be higher which helps explain why
Harvest would have the higher value than Pembina when comparing flour cultivars, regardless of
NaCl level, given that Harvest also has a significantly higher total particle area than Pembina.
4.5 CONCLUSIONS
Consistently throughout the analysis, the magnitude of the effect of NaCl level was
determined by the effect of flour cultivar with regard to the dough rheological properties, dough
stickiness, dough morphology and water mobility. Pembina had the lowest protein content,
however consistently produced dough with the greatest dough strength/gluten network with the
lowest dough stickiness in the reduced sodium formulations. Whereas the flour cultivar of
Harvest, which has the second highest protein content, consistently produced dough with the
weakest dough strength/gluten network with the greatest dough stickiness in the low sodium
formulations. Therefore, it was concluded that quality of gluten plays a greater role in mitigating
dough stickiness as opposed to gluten content. It was also seen that some flour cultivars were
more sensitive to changes in sodium chloride levels with Harvest appearing to be more affected
by the NaCl level changes and Pembina appearing to be the least sensitive.
With respect to water mobility although the freezable water content for each of the flour
cultivars did not see major changes at the different NaCl levels it did point to the conclusion that
there are changes in the free water’s location within the dough when viewed in combination with
the dough stickiness results and the TGA curve fitting results. Without the addition of NaCl to
the formulation, the water’s location is near the surface of the dough in the diffusive layer (free
and weakly absorbed water) which would increase the adhesive forces between the dough
surface and the mixing surface, resulting in an increase in dough stickiness. However, with the
addition of NaCl the water’s location changes from being associated near the surface/weakly
absorbed and becomes more strongly entrapped multilayer water within the stronger formed
gluten network. The greater gluten-gluten polymer interactions, as a result of NaCl, increase
cohesive forces within the dough and the change in the water’s location decreases the adhesive
forces, decreasing the dough stickiness. Therefore when looking at the TGA results in
combination with the DSC results it is concluded that although the water that is changing

105
location or association with the dough components it still remains as unbound water that is
freezable, but it is the change from being near the surface and weakly absorbed to either being
associated with the starch or gluten fraction as unbound water (more strongly absorbed
multilayer water, less mobile), when NaCl is added, that impacts dough stickiness. Based on the
TGA deconvolution findings it was concluded that the gluten network may not be the sole factor
governing dough stickiness in low sodium environments and instead stickiness is governed by
the relationship between free water and water associated with the starch-fraction. With that said
the strength of gluten network may mask the changes in the water’s association which is why the
cultivar Pembina results in less stickiness in low sodium environments. This leads to the
conclusion that increased screening and greater attention to flour blending may be necessary
when facing sodium reduction in the bread industry.
4.6 LINKAGE TO CHAPTER 5
Findings from this study gave foundational knowledge of the importance in gluten
protein quality when mitigating the effects of sodium reduction in dough formulations. The high
relevance of flour cultivar in relation to NaCl reduction effects on dough strength and water
mobility indicates the need for further examination to consider the impact of the nature of
interactions occurring within the gluten network. As such, the impact of alternative salts to NaCl
on dough rheology, stickiness and water mobility within the dough was investigated to shed
greater insight into the gluten properties under a low sodium environment.

106
5. EFFECT OF SALTS FROM THE LYOTROPIC SERIES ON THE HANDLING
PROPERTIES OF DOUGH PREPARED FROM PEMBINA AND HARVEST CWRS
WHEAT CULTIVARS
5.1 ABSTRACT
The influence of select salts from the lyotropic series (NH4Cl, KCl, NaCl, MgCl2, CaCl2,
and MgSO4) on the rheology, stickiness, morphology and water mobility of dough prepared from
a strong (Pembina) and weak (Harvest) dough producing CWRS flour were examined at a 1 and
2% level. Overall, Pembina was found to develop stronger gluten networks that were more
resistant to imposed stress than Harvest as evident by a lower tan delta and reduced amount of
deformation (creep compliance [Jmax]) during creep recovery. However the effect of salt-type
was different depending on the cultivar. In the case of Pembina, MgCl2 and MgSO4 resulted in
lower complex moduli values relative to those with NaCl, whereas all other salt-types were
similar to dough containing NaCl. In the case of Harvest, greater salt sensitivity was observed
where the addition of KCl, CaCl2 and MgCl2 resulted in a weaker gluten network (lower
complex modulus [|G*|]) associated with increased hydration of the gluten. In the case of
Pembina, only dough prepared with NH4Cl was found to have significantly reduced Jmax relative
to those with NaCl, whereas all other salt-types were similar. For Harvest, KCl, CaCl2, and
MgCl2 all showed a weakening effect on the gluten network as indicated by higher Jmax values
relative to NaCl. In contrast, NH4Cl and MgSO4 resulted in lower Jmax values relative to NaCl.
Overall Pembina showed lower dough stickiness than Harvest in all cases. For both Pembina and
Harvest, dough stickiness was found to show the greatest decrease with the addition of NH4Cl.
Interestingly, in the case of water mobility the alternative salts seemed to have a cultivar
dependent effect with respect to a change of free water to either the starch-fraction or the gluten-
fraction. Enhanced dough morphology was noticed for Pembina and Harvest in the presence of
NH4Cl, whereas MgCl2 resulted in a detrimental effect for Pembina but a positive effect on
Harvest which could be due to the effect of the alternative salts effect on water movement
between the dough components.

107
5.2 INTRODUCTION
The need to decrease sodium chloride within food products due to adverse health effects
of high sodium diets has left the food industry looking to alternatives to achieve the same
functionality that sodium chloride imparts to food products. For bread, the biggest problem for
industrial bread producers is the phenomenon of sticky dough with the reduction of NaCl in
dough formulations. The presence of dough stickiness occurs when adhesive forces (i.e., between
the dough surface and the mixing surface) are greater than the cohesive forces (i.e., protein-
protein interactions within the dough) (Hoseney & Smewing, 1999; Adhikari et al., 2001; van
Velzen et al., 2003). Sodium chloride works in bread dough to enhance flavour, lengthen shelf
life, form a stronger gluten network, control yeast fermentation, therefore controlling the rate of
gas production, and ultimately enhances the final bread loaf quality to produce high loaf volume
with a uniform and fine crumb grain (Miller & Hoseney, 2008; Belz et al., 2012). A reduction in
NaCl decreases the quality of the final bread product in terms of texture, volume, flavour and
colour. The poor quality texture and volume results because of the negative impact salt reduction
has on dough rheology and handling properties as a consequence of the dough sticking to mixing
surfaces and other processing equipment (Farahnaky & Hill, 2007). Alternative salts from the
lyotropic series (also known as the Hofmeister series) have been examined to replace either the
cation (sodium) or anion (chloride) in hopes of producing the same effects as NaCl on dough
handling properties and final loaf volume and quality (Salovaara, 1982ab; Kinsella & Hale,
1984; Preston, 1989; He et al., 1992; Butow et al., 2002; Charlton et al., 2007; Braschi et al.,
2009; Kaur et al., 2011; Uthayakumaran, 2011; Tuhumury et al., 2016ab). If similar dough
rheology in terms of gluten network strength and dough handling properties could be achieved
this would mitigate the issue of dough stickiness with the reduction or removal of NaCl in dough
formulations.
Examining the effects that salts from the lyotropic series have on the dough rheology and
dough handling properties could lead to a greater understanding of the nature of interactions (i.e.,
hydrogen and hydrophobic bonding) occurring within the dough matrix under low sodium
conditions (Salovaara, 1982a; Preston, 1989; Miller & Hoseney, 2008). The lyotropic series
ranks ions based on their ability to cause protein aggregation (precipitation) or disassociation
(solubility) within solution (Salovaara, 1982a; Preston, 1989; Miller & Hoseney, 2008;
Tuhumury et al., 2016a). The anions and cations are ranked from most stabilizing to most
108
destabilizing, with respect to their effect on protein-protein and protein-water interactions, and
are classified as non-chaotropic and chaotropic (He et al., 1992; Miller & Hoseney, 2008). Non-
chaotropic ions are stabilizing ions which cause a decrease in protein hydration, an increase in
structure and a decrease in solubility (i.e., ion-water interactions are favoured thus protein-
protein interactions are increased). Chaotropic ions are destabilizing ions which cause an
increased hydration and an increase in protein solubility (i.e., protein-water interactions are
favoured, thus protein-protein interactions are decreased). Therefore, the level of hydrophobic
interactions and hydrogen bonding within the dough matrix can be altered depending on which
anions or cations are present (Preston, 1989; Butow et al., 2002; Miller & Hoseney, 2008). Given
that the non-chaotropic ions promote protein-protein interactions and water structuring these
cations may be useful in maintaining the gluten network and thus dough strength, therefore
decreasing the occurrence of stickiness with the removal of NaCl.
However, it is the cation sodium that is linked to adverse health effects; therefore, the
focus will be on examining the effect of the cation not the anion. Salovaara et al. (1982a), Kaur
et al. (2011), Uthayakumaran (2011), and Tuhumury et al. (2016a) all examined the effect of
replacement of sodium with other cations from the lyotropic series on the dough strength and
rheology. All seemed to find that the effect of the cations followed the ranking of the lyotropic
series NH4+>K+=Na+>Ca2+>Mg2+. They all also found that KCl had the most similar effect to
NaCl, however in these studies dough stickiness was not analyzed and there was also the
drawback of the metallic flavour reported with KCl. The aim of this research was to examine the
effect of salts from the lyotropic series, compared to NaCl, on the prevention of dough stickiness
utilizing a flour cultivar known to form non-sticky doughs at decreased sodium chloride levels
compared to a flour cultivar known to form sticky doughs at reduced sodium chloride levels. The
impact of salt replacement on the dough rheology, morphology and water mobility was also to be
examined to give a link between stickiness and the gluten network formation and water
movement within the dough.

109
5.3 MATERIALS AND METHODS
5.3.1 Materials
Pembina and Harvest CWRS wheat cultivars (were kindly provided the Crop Development
Centre at the University of Saskatchewan (Saskatoon, SK). The two cultivars were grown in
plots at the University of Saskatchewan’s Kemen Crop Research Farm under rain-fed conditions
on fallowed land. The previous crops in the rotation were canola, pea, and barley. Cultivars were
seeded May 21, 2013 and each cultivar was grown in a 2.4 m wide by 15.2 m long plot with row
spacing of 17.8 cm. The herbicide, fungicide and fertilizer used were: BuctrilM (1.0 L/ha)
[applied June 11, 2013], Headline (0.4 L/ha) [applied June 28, 2013], and 56.0 kg/ha 23-23-0-10
[applied with seed], respectively. For seed conditioning: 13/64 round holed screen to scalp, 5.5 X
¾ slotted and 12 triangle buckwheat screens to sift were used. The cleaned amounts for each
cultivar were: Pembina-40 kg and Harvest-60 kg. Pembina was developed at the Canada
Department of Agriculture Research Station (Winnipeg, MB, Canada) by the Rust Area Project
Group; it is unlikely to be grown outside of the rust area and is best suited to the Red River
Valley (Campbell, 1963). Pembina is a cultivar that has an excellent baking quality, a yield
comparable to that of Selkirk grown in the Red River Valley, slightly more rust resistance than
Selkirk and has a one day earlier maturation than Selkirk (Campbell, 1963). Harvest is a cultivar
that was developed by Agriculture and Agri-Food Canada (Cereal Research Centre, Winnipeg,
MB, Canada) that is suitable to the wheat-producing regions of the Prairies (Fox et al., 2010).
Harvest has the qualities of high-yield, high test weight and preharvest sprouting resistance (Fox
et al., 2010). Milling of the four selected wheat cultivars was done on a Buhler MLU202
Experimental Mill according to the American Association of Cereal Chemists International
approved method 26-21.02. Prior to milling the grain was tempered to a moisture of 15.5% for ~
16 hrs.
Deionized and distilled water (DDH2O) was used in all dough formulations. Salts (NH4Cl,
KCl, NaCl, CaCl2, MgCl2 and MgSO4) and paraffin oil were of ACS reagent grade and were
purchased from VWR (Edmonton, AB, Canada). Rhodamine B was purchased from Sigma
Aldrich (Oakville, ON, Canada). The water used in this research was produced from a Millipore
Milli-QTM water purification system (Millipore Corp., Milford, MA, USA).
110
5.3.2 Rheological analysis
5.3.2.1 Dough preparation
All dough was prepared using a 10 g mixograph (TMCO National Mfg., Lincoln, NE)
utilizing a dough formulation comprised of flour (weight on a 14% moisture basis), water
(weight based on farinograph absorption results) and salts from the lyotropic series (NH4Cl, KCl,
NaCl, CaCl2, MgCl2 and MgSO4) at 1 and 2% level (on flour weight basis). All doughs were
mixed until just after reaching peak time. All doughs were prepared in triplicate.
5.3.2.2 Dough rheology
Dough rheology testing was performed according to Jekle and Becker (2011) using an
AR-1000 rheometer (TA Instruments, New Castle, USA) equipped with a 40 mm parallel plate
fixture (2 mm gap). The temperature was kept constant at 30°C using a Peltier plate temperature
system. Dough (~5 g) was weighed out and then placed in-between the two plates. The excess
dough that resulted once the parallel plate fixture was lowered was trimmed away using a plastic
spatula and paraffin oil was applied to the free surface of the dough to prevent the dough from
drying out. A resting period of 10 min was utilized for the dough prior to any measurements
taken. The first test that was run was the oscillatory frequency sweep followed by the creep
recovery test.
Oscillatory frequency sweep: The frequency was varied from 0.10 to 100.00 Hz at a
constant amplitude strain of 0.03% which was determined to be within the linear viscoelastic
regime based on preliminary testing. The latter was determined using a strain sweep to determine
at which strain the material deviates from linearity. The dynamic storage (G) and loss (G″)
moduli of the dough samples were measured. Values were reported for 1 Hz. From these
measurements the loss factor was calculated using the following equation:
(Eq. 5.1)
Creep recovery test: In the creep phase a constant shear stress τ0 of 250 Pa at 30°C was
applied to the dough sample for the duration of 180 s and then removed (τ0 = 0 Pa). The
tan G ( G )1

111
recovery/relaxation phase of the dough it was recorded for 360 s. The strain values were
collected as a function of time and the final data was given in terms of compliance:
(Eq. 5.2)
where J is the compliance, γ strain, and τ0 the constant stress which was utilized during the creep
phase. The parameters of the creep phase measurements include the time and stress dependent
recoverable shear deformation, the creep compliance Jmax (at t=180 s of the creep phase). The
creep recovery compliance Jr (at t=360 s of the recovery phase) is a measure of the material’s
elasticity. The recovery compliance describes the mechanical energy that is stored in the sample
during the creep phase. The relative elastic part Jel [-] was calculated by utilizing:
(Eq. 5.3)
5.3.3 Dough Stickiness
Dough stickiness was measured according to the Chen and Hoseney method (1995a)
using a stable microsystems (SMS) TA.XTplus Texture profile analyzer equipped with a 5 kg
load cell, using a Perspex cylinder 25.0 mm probe adhesion fixture and the SMS/Chen-Hoseney
dough stickiness cell. The dough samples were loaded into the cell and then extruded through the
openings of the mesh screen by turning the dial on the bottom of the cell. A plastic spatula was
then utilized to clean the initial extruded dough from the screen surface. To keep the dough
height as consistent as possible, the dial was turned two thirds of the way, giving ~ 1 mm of
dough height. After extrusion a plastic cover was placed over top of the dough, to reduce
moisture loss, as it rested for 30 s. The cover was then removed and the probe was brought down
to about 1 mm above the dough surface and then the test was run using a pre-test speed of 0.5
mm/s, test speed of 0.5 mm/s, post speed 10.0 mm/s, distance 15.0 mm, force 40.0 g, time 0.1 s,
and trigger force 10.0 g. The force required by the Perspex probe to separate from the dough’s
surface was recorded as the dough stickiness measurement. Doughs were run in triplicate with
each trial containing approximately six runs from one loading of the cell.
J(t)(t)01
Jel Jr(Jmax)1
112
5.3.4 Differential scanning calorimetry (DSC)
Freezable water content was determined according to Lu and Seetharaman (2013)
utilizing a Q series DSC Q2000 (TA Instruments, New Castle, DE, USA) equipped with a
refrigerated cooling system and nitrogen as the purge gas. Dough samples were prepared using
Pembina and Harvest cultivars with a 1% salt level using salts from the lyotropic series (NH4Cl,
KCl, NaCl, CaCl2, MgCl2 and MgSO4). Briefly, dough samples of ~ 10-20 mg were weighed into
aluminum DSC pans which were then hermetically sealed before analysis and an empty pan was
used as the reference. The reference pan and sample pan were then loaded and equilibrated at
30°C for 5 min. The pans were cooled from 30°C to -40°C at a rate of 10°C/min, held at -40°C
for 5 min, followed by heating from to -40°C to 40°C at a rate of 10°C/min. The melting peak
enthalpy (∆H) was obtained using the Universal Analysis 2000 version 4.5A software (TA
instruments, New Castle, DE, USA). The freezable water content was calculated from the
melting enthalpy peak divided by the enthalpy of pure water (333.55 J/g) and reported on a dry
weight basis. Moisture determination was done on each dough in triplicate using 1% range of
salts from the lyotropic series and Pembina and Harvest cultivars only (representing a strong and
weak gluten network, respectively).
5.3.5 Thermogravimetric analysis (TGA)
Thermogravimetric analysis was performed on dough using TGA Q500 apparatus (TA
Instruments, New Castle, DE, USA). Dough samples were prepared using Pembina and Harvest
flours with 1% NH4Cl, NaCl, and MgCl2 on weight/weight basis. Dough samples (~70 mg) were
placed on platinum pans and scanned from 25 to 200 °C at a rate of 5 °C/min. The weight change
(which was attributed to moisture loss) and derivative of weight loss as a function of temperature
were obtained. The derivative thermogravimetric (DTG) curve was used to differentiate between
diffusive water (weakly absorbed free water entrapped near the surface of the dough; more
mobile) and more tightly entrapped (more strongly absorbed multilayer water; less mobile) or
bound water within the dough as done by Fessas and Schiraldi (2001), Crockett et al. (2011) and
Roozendaal et al. (20012). The DTG traces were deconvoluted into Gaussian distributions using
PeakFit software (Systat Software, Inc., San Jose, CA, USA) based on the method of Roozendaal
et al. (2012) to give an indication of water’s association with dough components of starch and
gluten.
113
5.3.6 Confocal laser scanning microscopy (CLSM)
Confocal laser scanning microscopy was utilized to visualize the gluten network
formation of dough samples prepared using Pembina and Harvest flours with 1% and 2% NH4Cl,
NaCl, and MgCl2 on weight/weight basis and was based off of the method by Jekle and Becker
(2011). The doughs were prepared as described above. The fluorescent dye rhodamine B was
prepared at a concentration of 0.001% (w/v) in DDH2O and was then utilized as the stock water
addition to each dough formulation to ensure that the dye was distributed homogeneously
throughout the dough during the mixing process. A small sample was then taken from the dough
with two plastic spatulas to try to prevent stretching of the dough, the sample was about 4-5 mm
in diameter. The dough sample was then loaded on the slide and flattened with the cover slip by
placing the cover slip overtop and then turning the slide over and lightly pushing it down on the
table. All samples were loaded this way. The dough was analyzed by a Nikon C2 CLSM
microscope (Nikon, Mississauga, ON, Canada) using 20x Plan Fluor (numerical aperture 0.75,
Nikon) objective lens. The excitation and emission wavelengths were 543 nm and 625 nm
(rhodamine B), respectively. A total of 10 images with 512 x 512 µm pixel resolution were taken
for each dough sample from different positions on the xy-axis. Each dough sample was analyzed
in duplicate.
5.3.7 Statistical analysis
A three-way analysis of variance (ANOVA) was used to evaluate the effect of flour
cultivar, salt-type and salt level for most of the parameters studied (|G*|, tan , Jmax, Jel and
stickiness). A two-way ANOVA was used to test the effect of flour cultivar and salt-type on the
amount of freezable water content and TGA parameters. Since all parameters showed a
significant two-way interaction between flour cultivar and salt-type, a subsequent one-way
ANOVA using a Scheffe Post-hoc test was performed to test for differences. The statistical
analysis program IBM SPSS (Armonk, NY, USA) was utilized.

114
5.4 RESULTS AND DISCUSSION
5.4.1 Dough rheology
5.4.1.1 Oscillatory shear
Dough was prepared using Pembina and Harvest in the presence of various salts from the
lyotropic series at the 1 and 2% (by flour weight) level, and examined using dynamic oscillatory
shear rheology. Although the dynamic storage and loss moduli were measured, data was reported
in the form of the |G*| (complex modulus) (Figure 5.1) and tan parameters to give a combined
analysis of the elastic and viscous components of the doughs. An analysis of variance of |G*|
(complex modulus) values found that the main effects of salt-type (p<0.001), salt level (p<0.05)
and flour cultivar (p<0.001) were all significant, along with the two-way interaction of salt-
type*flour cultivar (p<0.01) (Table 5.1). All other interactions were not significant (p>0.05).
Overall, doughs prepared with 2% salts (regardless of its type and flour) resulted in greater |G*|
(7182.50 Pa) relative to the 1% salt level (|G*| = 6961.75 Pa). Furthermore, overall doughs’
prepared from the Pembina (|G*| = 8867.03 Pa) formed stronger gluten networks as indicated by
the higher |G*| values than for dough prepared from Harvest (|G*| = 5277.22 Pa), however the
effects of salt-type was different depending on the flour used. For Pembina, the addition of
MgCl2 (|G*| = 8028.67 Pa; p<0.001) and MgSO4 (|G*| = 8357.67 Pa; p<0.01) resulted in lower
|G*| values relative to those with NaCl (|G*| = 9144.50 Pa) which present a weakening effect on
the gluten network, whereas all other salt-types were similar in magnitude as the dough
containing NaCl. In the case of Harvest, greater salt sensitivity was observed where the addition
of KCl (|G*| = 5318.50 Pa; p<0.01), CaCl2 (|G*| = 4496.83 Pa; p<0.001) and MgCl2 (|G*| =
4321.17 Pa; p<0.001) resulted in a decrease in the magnitude of |G*| relative to dough prepared
with NaCl (|G*| = 6092.00 Pa). All other salt-types were similar in magnitude as doughs with
NaCl (p >0.05).
The loss tangent for doughs prepared as a function of salt-type, flour cultivar and salt
levels are shown in Figure 5.2. An analysis of variance of tan values found that the main
effects of salt-type (p<0.001), salt level (p<0.001) and flour cultivar (p<0.001) were all
significant, along with the two-way and three-way interactions of salt-type*flour cultivar
(p<0.001) and salt-type*salt level*flour cultivar (p<0.05), respectively (Table 5.1). Overall,
doughs prepared with Pembina were more rigid (tan = 0.360) than when prepared using
Harvest (tan = 0.392), however effects were different depending on the salt-type and salt level.

115
Figure 5.1 Complex modulus (|G*|) at 1 Hz for dough prepared using flours from Pembina (A)
and Harvest (B) in the presence various salts from the lyotropic series (NH4Cl, KCl,
NaCl, CaCl2, MgCl2 and MgSO4) at the 1% and 2% levels (based on wt. flour).
Data represent the mean ± one standard deviation (n = 3).

116
Table 5.1 Probability values arising from a three-way analysis of variance for oscillatory, creep rheology, and stickiness data.
|G*| tan Jmax Jel Stickiness
Main effects
Salt-type p < 0.001 p < 0.001 p < 0.001 p < 0.001 p < 0.001
Salt level p < 0.05 p < 0.001 p < 0.001 p < 0.001 p < 0.001
Flour cultivar p < 0.001 p < 0.001 p < 0.001 p < 0.001 p < 0.001
Interactions
Salt-type*salt level NS NS NS NS p < 0.001
Salt level*flour cultivar NS NS NS NS p < 0.05
Salt-type*flour cultivar p < 0.001 p < 0.001 p < 0.001 p < 0.01 p < 0.001
Salt-type*salt
level*flour cultivar
NS p < 0.05 NS p < 0.05 p < 0.001
116

117
Figure 5.2 The loss tangent (tan ) at 1 Hz for dough prepared using flours from Pembina (A)
and Harvest (B) in the presence various salts from the lyotropic series (NH4Cl, KCl,
NaCl, CaCl2, MgCl2 and MgSO4) at the 1% and 2% levels (based on wt. flour). Data
represent the mean ± one standard deviation (n = 3).

118
In the case of doughs prepared by the Pembina, higher tan values were found at the 1%
levels for KCl (p<0.001), CaCl2 (p<0.001), and MgCl2 (p<0.05) relative to the 2% salt levels
suggesting that the doughs were becoming more viscous with a decrease in salt level, whereas
tan values were similar in magnitude for doughs prepared with NH4Cl, NaCl and MgSO4
regardless of the salt level added (p>0.05) (Figure 5.2A). When comparing different salt-types to
NaCl, at the 1% level, only doughs prepared with NH4Cl (p<0.001) gave lower tan values
indicating increased protein-protein interactions and gluten strength. Whereas at the 2% salt
level, doughs prepared with CaCl2 (p<0.001) and NH4Cl (p<0.001) were the only ones to give
lower tan values than NaCl.
In contrast, doughs prepared by the Harvest, higher tan values were found at the 1%
levels for NaCl (p<0.01), KCl (p<0.001), MgCl2 (p<0.05) and NH4Cl (p<0.001) relative to the
2% salt levels suggesting that the dough were becoming more viscous and weaker in nature at
the lower salt levels (Figure 5.2B). Relative to the Pembina, dough prepared with the Harvest are
much more sensitive to salt levels. When comparing different salt-types to NaCl at the 1% level,
only doughs prepared with KCl (p<0.05) and MgCl2 (p<0.001) gave higher tan values
indicating a weakening of the gluten network, whereas all others were similar in magnitude. At
the 2% salt level, dough prepared with NH4Cl (p<0.01) was the only salt-type to give lower tan
values than NaCl, whereas MgCl2 gave higher (p<0.001).
5.4.1.2 Creep recovery
Maximum deformation (Jmax) of the dough during a creep-recovery experiment as a
function of salt-type, salt level and flour cultivar is given in Figure 5.3. An analysis of variance
of Jmax values found that the main effects of salt-type (p<0.001), salt level (p<0.001) and flour
cultivar (p<0.001) were all significant, along with the two-way interaction between salt-
type*flour cultivar (p<0.001) (Table 5.1). Overall, doughs prepared with 2% salts (regardless of
its type and flour) resulted in lower Jmax values (3.23 mPa-1) relative to the 1% salt level (Jmax =
4.31 mPa-1). The greater amount of NaCl would result in greater charge shielding and increased
protein-protein interactions which would enable for a stronger formed network capable of
resisting the deformation imposed. Furthermore, overall doughs’ prepared from Pembina (Jmax =
1.89 mPa-1) formed stronger gluten networks as indicated by the lower Jmax values than for dough

119
Figure 5.3 The creep compliance (Jmax) for dough prepared using flours from Pembina (A) and
Harvest (B) in the presence various salts from the lyotropic series (NH4Cl, KCl,
NaCl, CaCl2, MgCl2 and MgSO4) at the 1% and 2% levels (based on wt. flour). Data
represent the mean ± one standard deviation (n = 3).

120
prepared from Harvest (Jmax = 7.36 mPa-1), however the effects of salt-type was different
depending on the flour used. In the case of Pembina, only doughs prepared with NH4Cl were
found to have significantly reduced Jmax values (p<0.01) relative to those with NaCl, whereas all
other salt-types were similar in magnitude (p>0.05). For Harvest, KCl (p<0.01), CaCl2 (p<0.01),
and MgCl2 (p<0.001) all showed a weakening effect on the gluten network as indicated by higher
Jmax values relative to NaCl. In contrast, NH4Cl and MgSO4 resulted in a similar Jmax values
relative to NaCl indicating a similar strengthening effect.
The relative elasticity (Jel) for doughs prepared as a function of salt-type, flour cultivar
and salt levels is shown in Figure 5.4. An analysis of variance of Jel values found that the main
effects of salt-type (p<0.001), salt level (p<0.001) and flour cultivar (p<0.001) were all
significant, along with the two-way and three-way interactions of salt-type*flour cultivar
(p<0.01) and salt-type*salt level*flour cultivar (p<0.05), respectively (Table 5.1). Overall,
doughs prepared with Pembina were more rigid (Jel = 0.594) showing greater creep recovery than
those prepared using Harvest (Jel = 0.311), however effects were different depending on the salt-
type and salt level.
In the case of doughs prepared with Pembina, higher Jel values were found at the 2%
levels for KCl (p<0.001), CaCl2 (p<0.01), MgCl2 (p<0.05), MgSO4 (p<0.01) and NH4Cl
(p<0.05) relative to the 1% salt levels suggesting that the dough were more elastic and showed
greater recovery, whereas Jel values were similar in magnitude for doughs prepared with NaCl
regardless of the salt level added (p>0.05) (Figure 5.4A). This displays the effect of greater salt
concentration on charge shielding to induce greater elasticity through increased protein-protein
polymer interactions. When comparing different salt-types to NaCl, at the 1% level, only doughs
prepared with NH4Cl (p<0.05) gave higher Jel values indicating increased network elasticity. In
contrast, KCl (p<0.05) and MgCl2 (p<0.05) showed reduced Jel values relative to NaCl
suggesting that those salts caused a decrease in network recovery. At the 2% salt level, doughs
prepared with MgSO4 (p<0.01) and NH4Cl (p<0.05) were the only salts to give greater Jel values
than NaCl, indicating an increased recovery of the network, whereas all other salt-types were
similar in magnitude (p>0.05). This result displays the non-chaotropic effect of the SO42- anion
and the NH4+ cation.

121
Figure 5.4 The relative elasticity (Jel) for dough prepared using flours from Pembina (A) and
Harvest (B) in the presence of various salts from the lyotropic series (NH4Cl, KCl,
NaCl, CaCl2, MgCl2 and MgSO4) at the 1% and 2% levels (based on flour weight).
Data represent the mean ± one standard deviation (n = 3).

122
For doughs prepared by the Harvest, higher Jel values were found at the 2% levels for
NaCl (p<0.001), KCl (p<0.01), and NH4Cl (p<0.001) relative to the 1% salt levels suggesting
that doughs were becoming more viscous and weaker in nature at the lower salt levels (Figure
5.4B). All other salt-types were not influenced by the salt levels (p>0.05). Relative to Pembina,
doughs prepared with Harvest are much more sensitive to salt levels. When comparing different
salt-types to NaCl, at the 1% level, only doughs prepared with KCl (p<0.01) and MgCl2
(p<0.001) gave lower Jel values indicating a weakening of the gluten network, whereas all others
were similar in magnitude with the exception of MgSO4 (p<0.01) which showed higher Jel values
than NaCl. At the 2% salt level, dough prepared with MgSO4 (p>0.05) had a similar effect on Jel
compared to NaCl whereas those with KCl (p<0.01), CaCl2 (p<0.01) and MgCl2 (p<0.001) led to
dough with reduced Jel values relative to NaCl. Doughs prepared with NH4Cl at the 2% levels
were the only ones to experience an increase in Jel values (p<0.001) when compared to NaCl,
indicating an increasing dough elasticity and strength, displaying the non-chaotropic effect to
induce greater protein-protein interactions through hydrophobic and hydrogen bonding.
5.4.2 Dough stickiness
The stickiness of doughs prepared as a function of salt-type, flour cultivar and salt level
are shown in Figure 5.5. An analysis of variance of stickiness values found that the main effects
of salt-type (p<0.001), salt level (p<0.001) and flour cultivar (p<0.001) were all significant,
along with the two-way and three-way interactions of salt-type*flour cultivar (p<0.001), salt
level*salt-type (p<0.001), flour cultivar*salt level (p<0.05) and salt-type*salt level*flour cultivar
(p<0.001), respectively (Table 5.1). Overall, doughs prepared with Pembina created doughs with
less stickiness (0.364 N) than when prepared using Harvest (0.532 N), however effects were
different depending on the salt-type and salt level. This is a continuing trend throughout the
current research, with the rheological and stickiness results of Pembina, with higher gluten
quality, exhibiting better dough handling properties than Harvest. Overall, when comparing salt
level (regardless of flour cultivar and salt-type) doughs prepared with 1% salt (0.465 N)
compared to the 2% level (0.431 N) noticed an increase in stickiness with the decrease in the
amount of salt (p<0.001) indicating a formation of a weaker gluten network at the lower salt
level. When comparing salt-type to NaCl, regardless of salt level and flour cultivar, all

123
Figure 5.5 Stickiness values for dough prepared using flours from Pembina (A) and Harvest (B)
in the presence of various salts from the lyotropic series (NH4Cl, KCl, NaCl, CaCl2,
MgCl2 and MgSO4) at the 1% and 2% levels (based on wt. flour). Data represent the
mean ± one standard deviation (n = 3).

124
alternative salts decreased dough stickiness compared to NaCl (0.533 N), with NH4Cl (0.332 N)
decreasing stickiness the most (p<0.001).
For doughs prepared with Pembina, higher stickiness values were found at the 1% levels
for NH4Cl (p<0.01) and MgCl2 (p<0.001) when compared to the 2% level, whereas decreased
stickiness was found for MgSO4 (p<0.01) and no difference was noted for NaCl, KCl, and CaCl2
between the levels (p>0.05). When comparing different salt-types to NaCl at the 1% level only
MgCl2 was not significantly different from NaCl (p>0.05) and all other salt-types significantly
decreased dough stickiness (p<0.001). Whereas at the 2% level all alternative salts significantly
decreased dough stickiness when compared to NaCl (p<0.01).
In contrast, for doughs prepared by Harvest, higher dough stickiness was found at the 1%
levels for NaCl (p<0.05), KCl (p<0.001), MgCl2 (p<0.001), and MgSO4 (p<0.05) relative to the
2% salt levels whereas CaCl2 and NH4Cl did not significantly differ between 1 and 2% levels
(p>0.05). This shows that stickiness for Harvest is more sensitive to the decrease in salt level
compared to Pembina, which is presumed to be due to the differences in flour composition and
quality with Harvest having lower quality gluten which requires greater salt to induce increased
dough handling. When comparing different salt-types to NaCl at the 1% level, only CaCl2 (p<
0.001) and NH4Cl (p<0.001) significantly decreased dough stickiness, whereas all other salt-
types had similar stickiness to NaCl prepared doughs at the 1% level. For doughs prepared at the
2% level, only MgCl2 (p<0.001) and NH4Cl (p<0.001) significantly decreased dough stickiness
when compared to NaCl.
5.4.3 Freezable water content (FWC)
The amount of freezable water content (FWC) within the dough as a function of flour
cultivar and salt-type was examined by differential scanning calorimetry at the 1% salt level, and
given in Figure 5.6. An analysis of variance of the amount of FWC found the main effects of
salt-type (p<0.001) and flour cultivar (p<0.001), along with their interaction (p<0.01) to be
significant. Overall, doughs prepared with Pembina (FWC = 0.426 g ice/g d.b) were found to
have lower FWC than those prepared with Harvest (FWC = 0.472 g ice/g d.b). It is noteworthy to
report that Pembina and Harvest doughs were prepared with their optimal FABs and therefore
had different water additions (61.9 % and 65.5% respectively). Overall, when comparing all salt-
types to NaCl (regardless of flour cultivar) it was found that all salt-types (FWC = NH4Cl, 0.440

125
Figure 5.6 Freezable water content (FWC) as determined by differential scanning calorimetry
for dough prepared using flours from Pembina (PEM) and Harvest (HAR) in the
presence of various salts from the lyotropic series (NH4Cl, KCl, NaCl, CaCl2, MgCl2
and MgSO4) at the 1% level (based on wt. flour). Data represent the mean ± one
standard deviation (n = 3).
g ice/ g d.b; KCl 0.446 g ice/ g d.b; MgCl2 0.460 g ice/ g d.b; CaCl2 0.453 g ice/ g d.b; and
MgSO4 0.463 g ice/ g d.b) resulted in a significant increase in FWC (p<0.05) when compared to
NaCl (FWC = 0.429 g ice/g d.b). It is hypothesized that this increase in FWC relative to NaCl is
due to stronger water-ion interactions.
In the case of doughs prepared with the Pembina, the FWC was found to be more
sensitive to the alternative salt-types relative to NaCl than those prepared with Harvest (Figure
5.6). Pembina showed an increase in the FWC for all salt-types relative to NaCl (p<0.01),
whereas this was not the case for Harvest. For doughs prepared with Harvest only MgCl2
(p<0.05) and MgSO4 (p<0.01) significantly increased in the amount of FWC relative to NaCl,

126
whereas all other alternative salts had similar FWC compared to NaCl (p>0.05). However the
effect of salt-type was less dramatic than that seen for cultivar differences. The difference in
FWC between the stronger cultivar Pembina and the weaker cultivar Harvest is presumed to be
associated with a weaker gluten network leaving more water available for freezing (i.e., Harvest
is thought to have less bound water than Pembina).
5.4.4 Thermogravimetric analysis (TGA)
Thermogravimetric analysis was used to examine if there was an effect of salts from the
lyotropic series on water’s association with being either near the surface of the dough existing as
diffusive water (relating to free water that can easily diffuse out of the dough) or entrapped water
within the gluten network (relating to water that is more strongly absorbed multilayer and bound
water) as compared to NaCl. The first peak of the derivative thermogram gives an indication of
water that is weakly interacting with the gluten network and is considered a part of the diffusive
water layer. The second peak of the derivative thermogram is in accordance with the water that is
more tightly associated with the gluten network either entrapped within the network as absorbed
multilayer water or bound by the gluten proteins. Typical curves of the derivative thermogram
for the dough samples used in this study can be seen in Figure 5.7A and 5.7B. A two-way
analysis of variance found no significant effect of salt-type, flour cultivar, or the interaction salt-
type and flour cultivar (p>0.05) on weight loss of the first peak (Table 5.2). A two-way analysis
of variance revealed that there was no significant effect of flour cultivar or salt-type (p>0.05) on
the first peak maximum temperature upon which the diffusive water layer was released (Table
5.2). Curve fitting was utilized to try to explain these unexpected results.
When examining the second peak maximum weight loss which relates to entrapped (more
strongly absorbed multilayer water ) and bound water, a two-way analysis of variance was run
and showed the main effects of salt and flour cultivar to not be significant (p>0.05). However,
there was one difference between the flour cultivars for NaCl, Harvest experienced a greater
water loss at the second peak (~69%) than Pembina (~62%) (p<0.05) (Table 5.2). This was
unexpected given that Pembina forms a stronger gluten network than Harvest, however it is
presumed to be due to Harvest containing more water in the dough formulation.
For the second peak maximum temperature at which the entrapped (more strongly
absorbed multilayer water) and bound water was released, a two-way analysis of variance

127
Figure 5.7 Derivative of the thermogram (weight change %/ °C) of doughs prepared with
Pembina (A) and Harvest (B) as a function of salt-type (NH4Cl, NaCl, and MgCl2).

128
Table 5.2 Thermogravimetric analysis values for dough prepared using Pembina and Harvest in the presence of various salts from the
lyotropic series (NH4Cl, NaCl, and MgCl2) at the 1% level (based on wt. flour). Data represents the mean ± one standard
deviation (n = 2).
Flour cultivar Salt-type 1st peak 2nd peak Total
weight loss
(%)2
Max. peak height
temp (°C)
Percent of total
weight loss (%)1
Max. peak height
temp (°C)
Percent of total
weight loss (%)1
Pembina NH4Cl 49.66 ± 1.51a 9.96 ± 0.20a 144.50 ± 0.83a 63.41 ± 3.26a 45.15 ± 0.02a
NaCl 50.80 ± 0.24a 10.51 ± 0.66a 144.54 ± 0.99a 61.89 ± 0.02a 44.65 ± 0.12a
MgCl2 48.83 ± 0.04a 10.05 ± 0.36a 139.42 ± 0.38b 64.68 ± 1.54a 45.26 ± 0.05a
Harvest NH4Cl 50.22 ± 0.60a 9.27 ± 0.08a 136.82 ± 0.11a 63.99 ± 1.06a 45.66 ± 0.54a
NaCl 48.56 ± 0.63a 9.07 ± 1.55a 138.99 ± 0.31b 69.31 ± 4.29a 45.40 ± 0.22a
MgCl2 51.50 ± 2.57a 11.11 ± 0.57a 135.71 ± 0.52a 66.03 ± 2.01a 45.75 ± 0.13a
Different letters for each flour cultivar in each column are significantly different (p<0.05). 1Percent of total weight loss % at the first and second peak was calculated by over laying the thermogram of weight % curve over the derivative
weight change (weight change % /°C) curve and subtracting the end limit of the peak by the onset limit of the peak to obtain weight loss % over
the peak interval. This value was then divided by the total weight loss % and multiplied by 100 to get the percent of total weight loss. 2Total weight loss (%) was calculated by: [(initial weight mg – final weight mg)/ initial weight mg] x 100.
128

129
showed that the main effects of flour cultivar and salt-type were significant (p<0.001), along
with their two-way interaction (p<0.05). When examining the effect of salt-type (independent of
flour cultivar), doughs prepared with NaCl required a slightly higher temperature (~142°C) than
NH4Cl (~ 141°C) meaning NaCl required slightly more energy necessary to release the
entrapped and bound water, whereas MgCl2 required less energy (~138°C p<0.001) (Table 5.2).
Therefore, MgCl2 takes less energy to release that water, therefore it is not as strongly absorbed
or bound as it is with NH4Cl and NaCl. Overall when comparing flour cultivars (independent of
salt-type) Pembina required a greater temperature (~143°C) than Harvest (~137°C) (p<0.001),
this is potentially indicative of Pembina forming a stronger gluten network than Harvest and
therefore requiring more energy to release the water from the stronger formed gluten network.
For every salt-type, Pembina required a greater temperature than Harvest to release the entrapped
and bound water (p<0.01).
When examining the total amount of water lost, a two-way analysis of variance revealed that
only the main effect of flour cultivar was significant (p<0.01) and the main effect of salt-type
and their interaction was not significant (p>0.05). Pembina experienced less total water loss
(45.02%) than Harvest (45.60%) (p<0.01). It is believed that the greater total water lost by
Harvest than Pembina is due to the fact that Harvest doughs are prepared with greater water
addition than Pembina.
5.4.4.1 Thermogravimetric analysis (Deconvolution of the derivative thermogram [DTG])
A deconvolution algorithm of the derivative of the TGA thermogram was performed
similar to Roozendaal et al. (2012) for all doughs prepared with Pembina and Harvest at the 1%
salt level using salts from the lyotropic series representing two stabilizing salts and one
destabilizing salt (NH4Cl, NaCl, and MgCl2) to give an indication of the different water states
within the doughs. Roozendaal et al. (2012) used a 5 peak model to indicate free water (peak 1),
starch (mobile and bound water [peak 2 & 3]), and gluten (mobile and bound water [peak 4 &
5]); however, it was found for our samples that a 6 peak model produced a higher agreement
with the DTG r2 fit. The peaks represent the water associated with either free water (peak 1 and
2), starch unbound and bound water (peak 3 and 4, respectively), and gluten unbound and bound
water (peak 5 and 6, respectively) which can be observed in Figure 5.8A & B. Water loss for
each peak and peak temperature for water are given in Table 5.3. In Table 5.3 it appears that for

130
Figure 5.8 Derivative thermogram (weight change %/°C) for a dough prepared with Pembina at
1% NH4Cl (A) and the deconvolution of the derivative thermogram (B). Peak 1 & 2
represents water associated with free water, peak 3 & 4 represents water associated
with starch both mobile and bound respectively, and peak 5 & 6 represent water
associated with gluten both mobile and bound respectively.

131
Table 5.3 Peak fitting data for peak temperature and relative proportion of peak water loss for doughs prepared using Pembina and
Harvest as a function of salts from the lyotropic series (1% NH4Cl, NaCl and MgCl2). Values represent means samples ±
one standard deviation (n=2).
Peak Temperature (°C)
Relative Proportion of Peak Water
Loss (%)
Flour
Cultivar
Water’s
Association
Peak
Number NH4Cl NaCl MgCl2 NH4Cl NaCl MgCl2
Pembina Free 1 44.3 ± 0.0 45.6 ± 0.4 41.6 ± 0.4 10.2 ± 0.4 10.1 ± 1.3 6.2 ± 0.1
2 62.9 ± 0.4 66.0 ± 0.3 56.3 ± 0.5 7.3 ± 0.6 10.4 ± 1.5 9.1 ± 0.4
Starch 3 83.3 ± 0.2 89.8 ± 0.2 78.5 ± 0.5 10.2 ± 0.2 11.2 ± 0.1 10.8 ± 1.9
4 104.2 ± 0.1 112.1 ± 2.2 102.5 ± 0.7 8.9 ± 1.3 10.9 ± 1.9 10.4 ± 0.9
Gluten 5 128.8 ± 0.5 134.1 ± 2.2 126.8 ± 0.1 24.2 ± 1.4 26.8 ± 1.5 26.7 ± 0.2
6 147.0 ± 0.5 148.7 ± 1.0 142.8 ± 0.7 39.2 ± 0.6 30.6 ± 3.5 36.8 ± 0.7
Harvest Free 1 41.8 ± 0.5 39.8 ± 0.1 40.4 ± 0.5 8.8 ± 0.8 7.2 ± 0.5 7.4 ± 0.1
2 60.4 ± 0.5 55.3 ± 0.3 56.4 ± 0.4 10.6 ± 0.9 6.7 ± 0.2 8.9 ± 2.1
Starch 3 80.6 ± 0.1 72.3 ± 0.2 73.7 ± 2.3 8.2 ± 0.3 6.7 ± 0.3 7.5 ± 0.8
4 100.4 ± 0.6 97.0 ± 0.0 96.5 ± 0.9 10.4 ± 1.5 17.0 ± 1.3 16.6 ± 2.2
Gluten 5 122.6 ± 2.6 127.3 ± 0.8 124.0 ± 0.0 24.1 ± 7.3 28.5 ± 2.9 29.0 ± 0.3
6 139.2 ± 1.4 143.1 ± 1.1 140.2 ± 0.5 37.8 ± 7.8 33.9 ± 0.6 30.6 ± 0.3
131

132
Pembina, NH4Cl has the closest effect to NaCl when comparing peak temperatures whereas
MgCl2 appears to result in a decrease of peak temperature, presumably due to the destabilizing
effect of MgCl2 on the gluten network and thus resulting in less energy needed to remove the
water. There does not appear to be a clear trend when comparing peak water loss of NH4Cl and
MgCl2 to NaCl. However, it is interesting to note that for the gluten peak 6 (bound water) there
was an increase in bound water with NH4Cl and MgCl2 when compared to NaCl. Water loss for
the doughs prepared with NH4Cl and MgCl2 compared to NaCl seem to be fairly similar for each
peak except for the free water peaks and the gluten peak 6 (bound water). It appears that with the
alternative salts that there is less water lost from the free water peaks and more for the gluten
network when compared to NaCl.
When examining the peak temperatures for free water and starch for doughs prepared
with Harvest, it can be seen that the alternative salt NH4Cl increases the temperature compared
with NaCl, whereas the alternative salt of MgCl2 has similar temperatures to NaCl. However, for
peak temperatures for the gluten peaks it appears that NH4Cl and MgCl2 decreased the peak
temperature at which water was lost from the gluten when compared to NaCl. When looking at
water loss for the alternative salts compared to NaCl it appears that the greatest difference in
water loss is for the starch peak 4 where NH4Cl is lower than that of both NaCl and MgCl2
whereas all other peak water loss fractions appear to be fairly similar.
A two-way ANOVA was carried out on water loss for the free water (peak 1) to find that
the main effects of salt-type (p<0.01) and flour cultivar (p<0.05), along with their associated
interaction (p<0.05) to be significant, however, for free water from peak 2 only the interaction
term was significant (p<0.05). For the starch-fraction peaks, it found that for peak 3, the main
effect of salt-type and interaction term was not significant (p>0.05), however flour cultivar was
significant (p<0.01). For peak 4 of the starch-fraction, the main effects of salt-type (p<0.05) and
flour cultivar (p<0.01) were significant, however their interaction was not (p>0.05). For both
gluten-fraction peaks (peaks 5 and 6), both main effects and their interaction were not significant
(p>0.05). It appears that the addition of alternative salts had a similar effect as NaCl in study 2,
where the greatest effect was found on the free water and starch peaks for water loss.
For purposes of simplification, discussions will focus on differences after adding the two
peaks associated with free water (peaks 1+2), the starch-fraction (peaks 3+4), and the gluten-
fraction (peaks 5+6), as shown in Figure 5.9A-C for doughs prepared with Pembina and Harvest

133
Figure 5.9 Peak fitting data representing total peak free water (A), starch-fraction (B), and
gluten-fraction (C) water loss (%) for doughs prepared using Pembina (PEM) and
Harvest (HAR) as a function of salts from the lyotropic series (1% NH4Cl, NaCl,
MgCl2). Values represent means ± sd. (n=2). Lower case letters represent
comparisons within a flour cultivar between salt-type. Upper case letters represent
comparisons between flour cultivars for each salt-type. Different levels are
significantly different p<0.05. *NOTE: Figure B uppercase letters represent
comparison between the main effect of salt-type regardless of flour cultivar.

134
Table 5.4 Probability values arising from a two-way analysis of variance for peak fitting data
for proportional area under the curve for free water peaks, starch water peaks and
gluten water peaks for doughs prepared using CWRS wheat cultivars (Pembina
[PEM] and Harvest [HAR]) as a function of salts from the lyotropic series (1%
NH4Cl, NaCl, MgCl2).
Peak area
Free water
(Peaks 1 + 2)
Starch-fraction
(Peaks 3 + 4)
Gluten-fraction
(Peaks 5 + 6)
Main effects
Salt-type NS p < 0.01 NS
Flour cultivar NS NS NS
Interaction
Salt-type*flour cultivar p < 0.01 NS p < 0.05
flours. A two-way ANOVA of this data is given in Table 5.4. For free water, the main effects of
salt-type and flour cultivar were not significant (p>0.05), however their interaction was (p<0.01).
For doughs prepared with Pembina it was observed that the loss of free water was similar
regardless of the alternative salt-type. However, in the case of Harvest, the presence of NH4Cl
resulted in a higher amount of water loss, whereas doughs with NaCl and MgCl2 were similar
(Figure 5.9A).
In Figure 5.9B water association with the starch-fraction is presented and a two-way
ANOVA found only salt-type to be significant (p<0.01), whereas flour cultivar and their
interaction was not (p>0.05). It can be seen that doughs prepared with the alternative salt NH4Cl
have less water associated with the starch-fraction (~19%) relative to doughs prepared with NaCl
and MgCl2 which have significantly more (~23%). In the case of the gluten-fraction, its water
association is shown in Figure 5.9C. A two-way ANOVA found only the interaction term
between salt-type and flour cultivar to be weakly significant (p<0.05), however the main effects

135
alone were not significant (p>0.05). For Harvest, the amount of water associated with the gluten-
fraction was similar regardless of the salt, whereas in the case of doughs prepared with Pembina,
NH4Cl and MgCl2 resulted in an increase in the amount of water associated with the gluten
relative to NaCl. Which is opposite of the effect of the alternative salts on Pembina’s free water
when comparing to NaCl. The free water appears to migrate to the gluten-fraction with the
addition of the alternative salts NH4Cl and MgCl2 when compared to NaCl for Pembina. This
trend was not noticed for doughs prepared with Harvest, where the free water increased with
NH4Cl relative to NaCl and MgCl2, which were similar. This resulted in a decrease in water
associated with the starch-fraction whereas NaCl and MgCl2 resulted in an increase. It appears
that the alternative salts for the Pembina have an effect of water movement between free and
gluten-fraction whereas alternative salts for Harvest have an effect of water movement between
free and starch-fraction. The differences in the effect of salt-type on water migration in the two
cultivars could be partly explained by differences in flour composition and quality, more
specifically the differences in gluten protein quality and the amount of damaged starch.
5.4.5 Confocal laser scanning microscopy (CLSM)
Confocal laser scanning micrographs of doughs prepared with both Pembina and Harvest
flours as a function of salt-type and level (1 vs 2%) are given in Figures 5.10 and 5.11,
respectively. In the case of doughs prepared with Pembina, no substantial differences were
observed in the morphologies of the dough regardless of the salt-type (Figure 5.10). However,
micrographs hint at some slight differences with the addition of NH4Cl resulting in a more
continuous and extended fibril gluten network structure than those with the addition of NaCl
(Figure 5.10C-D & 5.10A-B). In contrast dough prepared with MgCl2, had gluten networks with
fewer fibres that appeared discontinuous with more aggregates than those prepared with NaCl
(Figure 5.10E-F & 5.10A-B). It is presumed that the more ordered gluten network (i.e., with
NH4Cl present) resulted from higher amounts of cohesive forces, leading to less sticky dough
(Figure 5.5). The amount of cohesive forces is then hypothesized to decrease creating a network
with less ordered gluten polymers (i.e., with MgCl2) leading to increased stickiness (Figure 5.5).
All doughs showed unidirectional ordering of the gluten polymers.
In the case of doughs prepared with Harvest, no substantial differences were observed in
the morphologies of the dough regardless of the salt level within each salt-type (Figure 5.11).

136
A) PEM, 1% NaCl B) PEM, 2% NaCl
C) PEM, 1% NH4Cl D) PEM, 2% NH4Cl
E) PEM, 1% MgCl2 F) PEM, 2% MgCl2
Figure 5.10 Confocal laser scanning microscopy images for dough prepared using Pembina
(PEM) in the presence of various salts from the lyotropic series (NaCl, NH4Cl,
and MgCl2) at the 1 and 2% level (based on flour weight).

137
A) HAR, 1% NaCl B) HAR, 2% NaCl
C) HAR, 1% NH4Cl D) HAR, 2% NH4Cl
E) HAR, 1% MgCl2 F) HAR, 2% MgCl2
Figure 5.11 Confocal laser scanning microscopy images for dough prepared using Harvest
(HAR) in the presence of various salts from the lyotropic series (NaCl, NH4Cl,
and MgCl2) at the 1 and 2% level (based on flour weight).

138
However, micrographs hint at some slight differences with dough prepared in the presence of
NH4Cl showing greater ordering of extended fibril gluten polymers relative to doughs prepared
with NaCl. In the case of the latter, the morphology appeared more porous with multi-
directional ordering of shorter polymers and aggregates. The difference in morphology between
doughs prepared with NaCl relative to NH4Cl also corresponded to a decrease in stickiness
(Figure 5.5). However in contrast to Pembina, the addition of MgCl2 to dough prepared with
Harvest showed improved directional ordering of the gluten polymers relative to doughs
prepared with NaCl. The increased ordering with MgCl2, combined with the similar migration of
water as NaCl to the starch-fraction from free water (Figure 5.9), was postulated to have
contributed to the decreased stickiness within the dough relative to those with NaCl (Figure 5.5).
Tuhumury and others (2016a) also examined the effect of salts from the lyotropic series
on the gluten network formation using confocal laser scanning microscopy. They stated that a
fibrous strand-like interconnected gluten microstructure was formed with the use of the non-
chaotropic cations (NH4+, Na+), whereas the chaotropic cation (Mg2+) resulted in the formation
of a honeycomb like gluten microstructure. They described doughs with NaCl as more fibrous
and extended, whereas doughs prepared with NH4Cl were described as having fewer observable
fibrous structures. This observation was the opposite of what was seen in the current study,
where NH4Cl at the 2% level was found to improve the gluten network microstructure for both
flour cultivars (Pembina and Harvest). The differences in findings between this study and
Tuhumury and others, with the use of NH4Cl, could be due to the use of different mixer types,
mixing times, method of salt addition, and different flour cultivars. The use of different flour
cultivars with differing compositions are believed to have an impact as it was found in research
done by Butow and others (2002) that different flour cultivars with differing glutenin
compositions had differing degrees of sensitivity to changes in salts with regard to their dough
handling properties. However, similar findings between Tuhurmury and others (2016a) and the
current study, with the use of the flour cultivar Pembina, were found with the use of MgCl2.
Tuhurmury described the effect of MgCl2 on the gluten network formation as creating gluten that
formed large aggregates that appeared homogeneous and continuous. However, it appeared that
the network formation found in Tuhumury was more negatively impacted by the use of MgCl2
than in the present study for doughs prepared with Pembina. On the other hand, in the current
study the flour cultivar Harvest noticed an improvement in the gluten network at the 2% level,

139
which was postulated to be due to the effect of different flour cultivars’ glutenin compositions
and thus sensitivity to salts (Butow et al., 2002). Tuhumury and others (2016a) state that the
formation of the more fibrous stranded gluten networks for doughs prepared with monovalent
cation salts (NH4Cl and NaCl) is believed to be due to enhanced hydrogen bonding within the
glutenin molecules as a result of the competition of monovalent cations with water.
5.5 CONCLUSIONS
Throughout the analysis, regardless of salt-types, doughs prepared with Pembina formed
stronger gluten networks than doughs prepared with Harvest as indicated by the rheological
results. Between the two flour cultivars, doughs prepared with Harvest appeared to be more
sensitive to the salt-type used as indicated by the variability in strength of the gluten network. It
was expected that if a salt-type increased the dough strength then dough stickiness would
decrease; on the other hand if the salt-type decreased the dough strength then dough stickiness
would increase. Pembina consistently had lower dough stickiness than Harvest in all cases
because it consistently formed a stronger gluten network, however the extent of the
change in dough stickiness was influenced by the different salt-types. Interestingly the trend in
dough stickiness did not necessarily follow the trend seen in the rheological results with the
effect of the salt-type on the gluten network strength. Magnesium chloride which was found to
have a weakening effect on both flour cultivars’ gluten network strength, actually resulted in a
decrease or no significant difference in the dough stickiness depending on the level when
compared to the NaCl whereas the opposite result was expected. Ammonium chloride was found
to increase the gluten network strength for both flour cultivars, with the effect being greater for
Harvest, NH4Cl also resulted in a decrease in the dough stickiness.
The stronger gluten network of Pembina was found to mitigate some of the effects of
reducing salt levels compared to Harvest. In all cases, NH4Cl was found to be most effective at
reduced salt levels at strengthening the gluten-gluten interactions, most likely through
hydrophobic interactions as protein-protein interactions become favoured over protein-water.
Ammonium chloride was found to decrease dough stickiness the most compared to NaCl at the
low level for both the strong and weaker dough producing flours and it also showed the greatest
strengthening effects, showing that NH4Cl could be a potential replacement for NaCl at the low
level of 1% inclusion. Less may even be needed to provide a similar effect as NaCl in the

140
stronger dough producing flour cultivars. However baking trials and sensory analysis would be
necessary to examine loaf volume, crumb structure and texture and loaf colour and flavor.
Further analysis on partial replacement of NaCl with NH4Cl should be examined as well.
The differing effect of the salt-types on dough strength and stickiness for the flour
cultivars points to another factor affecting the occurrence of stickiness with the use of salt
replacements at both the low and high level. This could be due to the effect of the salt-types on
the water association within the dough being either with the starch or the gluten as opposed to
free. For the stronger dough producing flour cultivar of Pembina the alternative salts had more of
an effect on the water’s movement between free and the gluten-fraction. For Harvest the
alternative salts have more of an effect on water movement between free water and the starch-
fraction. These findings lead to the conclusion that the gluten network may not be the only
determinant in dough stickiness in weaker flour cultivars; instead it may also be the movement of
water between the free water and the starch-fraction. Further support for this conclusion comes
from the fact that for the weaker flour cultivar of Harvest both the stabilizing and destabilizing
salts improved the gluten network formation seen in the confocal laser scanning microscopy
images compared to NaCl. Dough stickiness was also decreased comparatively whereas the
rheological results relating to dough strength indicate a weakening effect of the destabilizing salt.
Future studies should be done using both NMR and attenuated total reflectance and Fourier
transform infrared spectroscopy method to examine alternative salts that will achieve the same
movement of water from free to the starch-fraction as NaCl in weaker flour cultivars to allow for
replacement and prevent dough stickiness. In other studies researchers have found that up to 50%
replacement of NaCl with KCl has been done with fair results, however flavour was still an
issue. Thus in future studies 50% NH4Cl could be used to replace 50% of NaCl and flavour
tested because some of the ammonium would be given off as volatiles during baking and thus the
flavour of the bread may not be affected.

141
6. GENERAL DISCUSSION
6.1 Overview
Sodium reduction for dough formulations can result in a significant increase in stickiness,
which causes costly processing delays and quality issues within the dough and the final loaf
quality. As such, the overall goal of this research was to gain a better understanding of the role of
sodium in controlling dough handling properties at normal and reduced salt (NaCl) levels, and
then to develop strategies to help combat the occurrence of dough stickiness. The research was
divided into three main studies that focus on: a) the impact of cultivar composition on dough
rheology; b) the impact of NaCl reduction in controlling dough rheology, stickiness and water
mobility; and c) the role of alternative salts in controlling dough rheology, stickiness and water
mobility.
6.2 Cultivar selection
For this research, flour cultivars were chosen based on a historical trial involving 37
different cultivars that spanned 69 years of development and registrations, all within the wheat
class: Canada Western Red Spring (CWRS) (Yovchev et al., 2017). CWRS wheat is described as
hard wheat having superior milling and baking qualities, primarily used in pan bread production,
but also in hearth bread, steamed bread, noodles, flat bread and common wheat pasta (Edwards et
al., 2012). Overall, in a span of 69 years, breeding programs have bred for increased yield and
disease resistance, while maintaining good dough handling properties and bread quality at the
industry standard NaCl level of 2%. Recently though, increased awareness of linkages between
dietary sodium consumption and the risk for hypertension, cardiovascular disease and stroke has
driven governmental regulators and the baking industry to look at low salt formulations.
However, within the low sodium environment, cultivars that performed well in terms of yield
and disease resistance now are unable to maintain quality standards in terms of dough handling
and bread quality. The study by Yovchev et al. (2017) was aimed at re-evaluating 37 different
cultivars along the breeding history for dough handling and baking quality within a normal and

142
low salt environment. The four cultivars chosen in this present study reflect dough that displayed
good handling properties under normal NaCl conditions (2%), however under reduced salt
conditions (1.1%), cultivars displayed good (Pembina, Roblin), intermediate (McKenzie) and
poor (Harvest) handling. Stickiness was also found to increase with salt reduction for all
cultivars, however in a greater extent with the dough displaying intermediate and poor handling
properties (Yovchev et al., 2017). A greater understanding of the compositional differences
between the selected cultivars may shed light into mechanisms governing differences in their
dough handling and stickiness. Results from this work may help breeders make linkages to past
breeding practices during new cultivar development that may have resulted in these
compositional changes.
Pembina was developed in 1948 involving a cross between three wheat cultivars (Thatcher
x McMurachy-Exchange x Redman), and then was later registered in 1959 (Campbell, 1963).
Pembina showed exceptional baking quality and gluten strength in comparison to other cultivars
at the time (Campbell, 1963). Its properties weren’t surpassed until the registration of Roblin
~30 y later. Roblin is high in protein, and was developed in 1976 by wheat cultivars from four
pedigrees: RL4302, RL4356, RL4359 and RL4353 (Campbell & Czarnecki, 1987). McKenzie
was the first doubled haploid wheat cultivar developed in Canada from the first generation
offspring from the parent cultivars Columbus and Amidon in 1989, and later registered in 1997
(Graf et al., 2003). McKenzie has been shown to meet the protein content, milling properties,
dough functionality and baking performance of check cultivars, such as Roblin. However,
McKenzie has harder kernels and therefore higher damaged starch than the check cultivars (Graf
et al., 2003). Harvest was produced from the cross between AC Domain*2/ND640 in 1991 and
then later given registration in 2002 (Fox et al., 2010). Harvest has similar milling and baking
performance to the check cultivars, and has similar grain hardness and starch damage as
McKenzie (Fox et al., 2010).
An understanding of the structure-function relationships controlling dough rheology and
stickiness involving flours with inherent compositional and quality differences will help to
develop strategies for combating dough stickiness within a reduced sodium environment.

143
6.3 Impact of different CWRS wheat cultivars and their composition on the handling of
dough with normal NaCl formulations
Lasztity and Abonyi (2009) and Goesaert et al. (2005) indicated differences among
cultivars in terms of their elasticity and extensibility are related to their chemical composition
[gluten proteins (quantity/quality, ratio of glutenins to gliadins, ratio of high to low molecular
weight glutenins, and amino acid content)], starch (damaged/native), non-starch polysaccharides,
and other ingredients within the dough formulation (water, salt, yeast, sugar, etc.).
a) Impact of protein content and quality on dough rheology
The protein content, on a 14% moisture basis, within the flour plays an important role in
water absorption and gluten strength within in the dough, which in turn impacts its ability to
form a low density loaf of bread with a fine and uniform crumb (Lai & Li, 2006). Dobraszczyk
and Salmonowicz (2008) found that protein content and protein quality work independently of
each other, and gluten content alone as predictor of baking quality would not give adequate
results. Uthayakumaran and Lukow (2003) examined the rheological properties (e.g., mixograph
and extensigraph) of doughs prepared using flours from a range of wheat cultivars grown in
Canada. The authors found that cultivars with higher protein levels did not necessarily show the
greatest dough strength, where it was concluded that strength was related to both the protein
content, and differences in the glutenin: gliadin ratios and the LMW-glutenin composition.
Others have also suggested a link between dough strength and both protein content and quality
(Gupta et al., 1992; Khatkar et al., 1995, 1996; Wang & Sun, 2002; Sliwinski et al., 2004;
Dobraszczyk & Salmonowicz, 2008; Barak et al., 2013; McCann & Day, 2013).
In the present study, Roblin contained the highest protein content (~16.2% d.b.), followed
by McKenzie and Harvest (~15.1% d.b.), which were similar, and then Pembina (14.7% d.b.)
(Table 6.1). However, an examination of the empirical rheological properties of the dough
indicated that strength followed a different trend suggesting that protein content alone was not
governing dough strength. For example, both resistance to extension (measured by large
deformation testing – extensigraph) and work input to peak development (measured using the
mixograph) data for each cultivar showed a similar trend, where Pembina formed the strongest
dough, followed by Roblin and McKenzie, which were similar and then Harvest.

144
Table 6.1. Gives the protein and damaged starch levels, farinograph water absorption (FAB), as
well as both raw and normalized work input to peak development (mixograph
testing) and resistance to extension (extensigraph testing) data for four different
CWRS cultivars. All rheological data was normalized to the FAB value of Pembina.
Cultivar Protein
content
(% d.b.)
Damaged
starch
(%)
FAB
(% to 14%
w.b.)
Work input to peak
development
(% tq. min)
Resistance to extension
(N)
Raw data Normalized
Raw data Normalized
Pembina 14.7 ± 0.0 6.0 ± 0.3 61.5 ± 0.3 117.9 ± 6.7 117.9 ± 6.7 0.31 ± 0.02 0.31 ± 0.02
Roblin 16.2 ± 0.0 5.5 ± 0.1 65.3 ± 0.1 103.7 ± 2.4 110.1 ± 2.6 0.25 ± 0.01 0.27 ± 0.01
McKenzie 15.1 ± 0.0 7.1 ± 0.2 63.3 ± 0.7 97.4 ± 2.7 100.3 ± 2.8 0.23 ± 0.00 0.23 ± 0.00
Harvest 15.1 ± 0.1 7.1 ± 0.2 64.9 ± 0.1 85.4 ± 5.6 90.1 ± 5.9 0.18 ± 0.01 0.19 ± 0.01
In terms of wheat quality data, both Pembina and Roblin showed similarly high gluten
indices, whereas Roblin showed a greater gluten performance index than Pembina, both of which
are related to the strength of the gluten network. In contrast, both gluten indices were lower for
McKenzie and Harvest indicating that they would form weaker doughs. This supports the
rheological results, where it was found the Pembina and Roblin formed stronger doughs. To
probe the complexity of the inter-relationships between protein content, wheat quality and dough
rheology further between cultivars, an examination of the protein composition was performed to
help give greater insight to differences in the macroscopic viscoelastic behaviour of the dough
prepared from different cultivars.
In general, studies in the literature have indicated that wheat cultivars with high glutenin:
gliadin ratios lead to stronger gluten networks (Khatkar et al., 1995; Janssen et al., 1996; Barak
et al., 2013). In the present study, Pembina and Roblin were found to have similarly high
glutenin: gliadin ratios relative to McKenzie and Harvest helping to explain why Pembina and
Roblin formed strong dough and, McKenzie and Harvest resulted in weaker dough. Differences
within dough strength between the stronger cultivars, Pembina and Roblin are less clear, since
Pembina formed stronger dough. Literature studies have also shown that cultivars with higher
ratios of high (HMW): low (LMW) molecular weight glutenin subunits form stronger gluten

145
networks (Gupta et al., 1992; Sliwinski et al., 2004), since the larger polymers forms loops (β-
turns) and trains (β-sheets) within the gluten network creating a large interconnected network
with the ability to store elastic energy within the dough (Belton, 1999; Singh & MacRitchie,
2001; Belton, 2012). However, in the literature the role of LMW-GS’s is poorly understood. In
the present study, Roblin was found to have a higher HMW: LMW glutenin subunit (GS) ratio
than Pembina, but had lower dough strength. As a result, the reasons why Pembina formed a
stronger dough than Roblin still remains unclear, but are hypothesized to be caused by: a)
differences in composition of the HMW-GS, which could lead to differences in the amount of
loops and trains present and the subsequent physical entanglement within the gluten network (not
evaluated in this research); and b) higher levels of LMW-GS proteins present in the Pembina
flour which may act as cross-links, extenders or branch points to connect more of the HMW-GS
polymers together to form a stronger more connected network.
McLeish and Larson (1998) developed a model to describe the non-linear extensional
rheology of polymer melts (low density polyethylene) with long-chain branches and multiple
junction zones that shows both strain hardening and shear thinning properties. The model
describe a long chain branched polymer melt as having a single backbone with branches arising
from each end. These branches (termed the pom poms) are entangled with surrounding polymers
to form a large macrostructure. Under conditions of extensional flow, the backbones become
stretched and display first strain hardening (e.g., rapid non-linear increase of viscosity with
imposed strain), and then later strain softening (e.g., decrease in viscosity in response to imposed
strain – shear thinning) as alignment of the polymer backbones increases. In 2003, Dobraszczyk
& Morgenstern applied this model to high molecular weight branched gluten polymers (glutenin)
within a dough system, whose branch points lead to entangled high ordered structures (gluten
network) that would lead to strain hardening in doughs which would resist extension. Building
off this model in the current study, it is hypothesized that the LMW-GS could act as: a) the ‘pom
poms’ or chain terminators, which could lead to additional branch points; b) as chain extenders
by having cysteines present in both the N and C terminal ends of its structure, enabling it to form
inter-molecular cross-links within the gluten network to elongate HMW-GS or connect parallel
glutenin polymers; and increased physical entanglement. These effects are thought to give rise to
greater strain hardening within the dough, to increase its resistance to extension and strength.

146
b) Impact of water content, protein content and damaged starch on dough strength
Water within dough acts to hydrate the gluten proteins and acts as a plasticizer to increase
mobility of the gluten network (Jekle & Becker, 2011). During dough mixing, each flour is
mixed based on its farinograph water absorption until it reaches optimal dough development.
Depending on the flour’s composition (i.e., protein content and quality, starch and pentosans),
the amount of water added to the dough formulation can vary (Eliasson & Larsson, 1993a; Tsilo
et al., 2013; Meerts et al., 2017). If too little water is added to the flour the dough formed will
lack cohesion, whereas flour with too much water will have a dough softening effect and will
become weaker (Bloksma & Bushuk, 1988). The majority of studies in the literature either
prepare dough using a range of water level additions such that FAB is adjusted to be below, at
and above the optimal FAB for dough development. This approach is typically done when
researchers are using one cultivar. For comparing multiple cultivars, typically researchers
prepare dough to the FAB where optimal dough development occurs, as was the case in the
present study. Even though there may be different water levels present, all doughs were mixed to
their optimal dough development for comparative purposes. In order to display, the effect of
different amounts of water added to the dough formulations in the present study, resistance to
extension (from large deformation testing – extensigraph) and work input to peak dough
development (WIP) (from mixograph testing) were normalized to the FAB content of Pembina
(Table 6.1.). In doing so, WIP and resistance to extension values increased, closer to that of
Pembina, since Pembina had the lowest FAB values, however the trend in the data remained
unchanged relative to the un-normalized data (Table 6.1). Findings from the normalization
procedure indicate that the different water levels added did not play a significant role at
impacting dough strength, most likely since all doughs were mixed to the optimal development.
It was seen in Wang and Sun (2002) that in some cases, cultivars having higher FAB values, did
not result in a decrease in their resistance to extension data, relative to cultivars that had lower
FAB values. Jekle and Becker (2011) reported if too much water is added to the flour beyond the
optimal FAB amount for a given cultivar, that a dough weakening effect is observed as evident
by a decrease in resistance to extension and an increase in extensibility. In this case, water would
be having a larger plasticizing effect.
In the literature, damaged starch is known to have higher water absorption capabilities
than native starch, and to compete with gluten proteins for water within the dough (Goesaert et

147
al., 2005; Mak, 2009; Barak et al., 2013). This competition can lead to water mobility within the
dough, which can impact both the structure of the gluten network and the handling properties of
the dough. In the solvent retention capacity tests, results indicated that the higher amounts of
damaged starch within McKenzie and Harvest led to a lower gluten performance index than that
of Pembina and Roblin. Within the current study it is postulated that the level of damaged starch
played a role in the gluten network formation and strength given that it competes with the gluten
proteins for hydration. It was concluded that a greater amount of damaged starch can have a
detrimental impact on the gluten network. This was observed in dough prepared with McKenzie
and Harvest which had higher levels of damaged starch and lower quality gluten than that of
Pembina. As such, McKenzie and Harvest were unable to overcome the weakening impact of the
higher level of damaged starch.
In conclusion of study 1, having high protein content is important and inter-related to
dough handling properties and strength, however it’s not the driving factor. This was displayed
with Pembina having the lowest protein content of the four cultivars but showing greater strength
than the higher protein cultivars of Roblin, McKenzie and Harvest. The higher gluten quality (in
regard to the higher gluten index, gluten performance index and glutenin: gliadin ratio) and
lower damaged starch levels of Pembina/Roblin cultivars allowed for the formation of stronger
gluten networks and thus formed stronger dough than McKenzie and Harvest. Reasons why
Pembina was stronger than Roblin are less clear. However, this may be attributed to
compositional differences within the HMW-GS fractions; and/or the higher levels of LMW-GS
proteins in Pembina that may act as chain extenders, cross-linkers, or branch points all of which
create a buildup of the gluten network and enhance interactions within the gluten network
polymers. Aside from gluten protein quality accounting for the differences between the cultivars
strength, damaged starch and water addition (below or above the FAB needed for optimal dough
development) would also have an impact on the dough strength. Since all cultivars were mixed
with optimal water additions to their optimal dough development, differing water additions were
not considered to have a significant impact relative to the strength and dough handling
properties.
148
6.4 Impact of NaCl on dough handling, stickiness and water mobility on doughs prepared
from different CWRS wheat cultivars
It is well documented that NaCl is necessary for enhancing the viscoelastic properties of
dough by increasing the level of gluten protein interactions via charge shielding on the proteins
(Miller & Hoseney, 2008; Uthayakumaran et al., 2011; Belz et al., 2012). However, within the
literature there have been contradictory findings among researchers as to the effect of salt
reduction on empirical vs fundamental dough rheology and stickiness (Larsson, 2002; Lynch et
al., 2009; Beck et al., 2012a; McCann & Day, 2013; Tuhumury et al., 2014). Because of the lack
of clarity, the purpose of the second study was to gain a better understanding of dough rheology
(small strain large deformation rheology), dough stickiness and water mobility within dough
prepared from different cultivars over a range of NaCl levels (0-4%), and their inter-relationship
with the gluten network. It was hypothesized that with higher NaCl levels there would be an
increase in protein-protein interactions as the result of increased charge shielding leading to a
more organized gluten network and a more viscoelastic non-sticky dough. Whereas, at lower
NaCl levels it was hypothesized that dough stickiness would increase as the result of decreased
protein-protein interactions resulting in an unorganized multidirectional gluten network which
displayed increased viscous properties and decreased dough strength.
a) Comparison of empirical and fundamental rheological data for dough prepared at the 2%
NaCl level for different wheat cultivars
Rheological analysis obtained from large deformation (e.g., farinograph, mixograph,
extensigraph and creep recovery) often show different responses than when small oscillatory
shear rheometry is used, an observation that is more often seen when materials contain HMW
polymers (Dobraszczyk & Morgenstern, 2003). Differences observed between the rheological
techniques of dough are thought to be caused by: a) insensitivities within the linear viscoelastic
regime of the fundamental rheology, to be able to differentiate responses of gluten polymers
having a wide molecular weight distribution (MW) (Dobraszczyk & Morgestern, 2003); b)
differences in water content, where its addition above or below the optimal FAB amount can
result in softening or stiffening of the dough, respectively; c) the starch content, where starch-
starch interactions have been hypothesized to overshadow rheological responses of the gluten
polymers at low strains (McCann & Day, 2013; Meerts et al., 2017). This has been seen in

149
multiple studies examining different cultivars with varying strengths where the weaker flour out
performs the stronger flour in the oscillatory shear, however when the larger strains of creep
recovery or uniaxial/biaxial extension are used the stronger flour performs better than the weaker
(Dobraszczyk & Salmonowicz, 2008; McCann & Day, 2013; Tuhumury et al., 2014; Meerts et
al., 2017). In Table 6.2, data from empirical (e.g., resistance to extension) and fundamental (e.g.,
tan - oscillatory; and Jmax - creep recovery) rheology measurements at the 2% NaCl level were
contrasted using data reported from study 1 and 2 where dough prepared with each cultivar was
mixed with the optimal FAB. Similar trends in the data were found for all four cultivars using all
measurement techniques when mixed with the optimal FAB, where Pembina was found to form
the strongest dough, followed by Roblin and McKenzie, and then Harvest (Table 6.2). Findings
suggest that both empirical and fundamental techniques provide complementary information,
where water addition or starch-starch interactions (as described above) did not seem to
overshadow the sensitivities of the small and large strain measurements (tan and Jmax
respectively).
b) Effects of varying levels of NaCl on dough prepared by the different wheat cultivars on dough
strength and stickiness
As discussed earlier, the strength of the gluten network is impacted by the protein content
and composition, pentosans, starch-starch interactions and water addition. Because of this,
depending on the cultivar (i.e., flour composition and quality) and its preparation (i.e., water
addition and mixing) contradictory findings have been reported in studies examining NaCl levels
and dough rheology using small strain oscillatory deformation. For instance, some studies have
reported that increasing the levels of NaCl resulted in an increase in G (Larsson, 2002; Beck et
al., 2012a) and a decrease in tan (Beck et al., 2012a) both of which indicates an increase in the
gluten polymer network’s strength and ability to store energy. Whereas others have found that
increasing NaCl appeared to cause a decrease in the G and either no change or an increase in tan
, both of which indicates a decrease in the elastic characteristics of the gluten network (Lynch et
al., 2009; McCann & Day, 2013; Tuhumury et al., 2014). However overwhelmingly within the
literature studies, it is known that NaCl has a strengthening effect on doughs prepared from
wheat flours (Larsson, 2002; Uthayakumaran, 2011; Beck et al., 2012a; Belz et al., 2012). In
contrast; Lynch et al. (2009), McCann and Day (2013) and Tuhumury et al. (2014) also reported

150
Table 6.2. A comparison between empirical and fundamental rheological measurements on
dough prepared using different cultivars at the 2% NaCl level. Data represent the
mean ± one standard deviation.
Notes: (1) Data taken from study 1; (2) Data taken from study 2.
a strengthening trend with increasing NaCl levels when using large deformation testing (uniaxial
extension). The weakening of dough in response to added NaCl in some studies is most likely
associated with increased sensitivity of the small strain testing to changes in water mobility and
increased starch-starch interactions. Within the present study it is believed that the migration of
water, with the addition of salt, from free water to the starch-fraction contributes to the
contradictory findings in oscillatory shear examining the effect of sodium chloride. For instance,
in the present study the tan δ value indicates that the weakest cultivar of Harvest has a similar tan
δ (elastic behaviour) as the stronger dough producing cultivar of Roblin. However, given the
creep recovery and extensigraph findings Roblin is stronger than Harvest. In contrast, Pembina
does not have the same significant migration of water to the starch and therefore showed similar
strength trends in the oscillatory shear, creep recovery and extensigraph.
In the present study, all cultivars showed a strengthening effect with increasing levels of
NaCl as measured by oscillatory shear and creep recovery rheology, as evident by lower tan
and Jmax values at higher NaCl levels (Table 6.3). Stickiness values were also found to increase
with the reduction in NaCl for all cultivars examined, however Pembina was least impacted by
NaCl level and did not change between the 1 and 2% NaCl level (Table 6.3). It was believed that
the greater number of gluten-gluten interactions between the polymers within Pembina led to
Cultivar 1Resistance to
extension (N)
2tan 2Maximum creep
compliance (Jmax)
(1/mPa)
Pembina 0.31 ± 0.02 0.361 ± 0.004 1.84 ± 0.13
Roblin 0.25 ± 0.01 0.386 ± 0.004 3.06 ± 0.59
McKenzie 0.23 ± 0.00 0.387 ± 0.002 3.07 ± 0.18
Harvest 0.18 ± 0.01 0.383 ± 0.003 4.99 ± 0.55

151
Table 6.3. Effect of NaCl level on fundamental rheological parameters, stickiness values and %
water associated with the starch-fraction for doughs prepared from different
cultivars. Data represent the mean ± one standard deviation.
Cultivar NaCl (%) tan δ Jmax (1/mPa) Stickiness (N) Water associated
with the starch-
fraction (%)
Pembina 0 0.397 ± 0.001 3.47 ± 0.13 0.55 ± 0.03 19.3 ± 2.17
1 0.368 ± 0.006 2.42 ± 0.47 0.47 ± 0.03 -
2 0.361 ± 0.004 1.84 ± 0.13 0.47 ± 0.01 21.6 ± 1.07
4 0.354 ± 0.004 1.24 ± 0.05 0.51 ± 0.01 -
Roblin 0 0.422 ± 0.008 5.38 ± 0.99 0.56 ± 0.02 16.9 ± 1.04
1 0.393 ± 0.004 3.71 ± 0.32 0.52 ± 0.02 -
2 0.386 ± 0.004 3.06 ± 0.59 0.55 ± 0.01 25.3 ± 1.20
4 0.378 ± 0.001 1.98 ± 0.11 0.62 ± 0.00 -
McKenzie 0 0.434 ± 0.005 7.25 ± 1.45 0.65 ± 0.01 18.4 ± 0.33
1 0.397 ± 0.001 4.36 ± 0.18 0.61 ± 0.02 -
2 0.387 ± 0.002 3.07 ± 0.18 0.64 ± 0.02 22.7 ± 0.21
4 0.360 ± 0.005 1.35 ± 0.31 0.59 ± 0.00
Harvest 0 0.431 ± 0.003 11.08 ± 0.91 0.69 ± 0.02 15.2 ± 1.24
1 0.397 ± 0.003 7.01 ± 0.91 0.62 ± 0.02 -
2 0.383 ± 0.003 4.99 ± 0.55 0.57 ± 0.01 20.3 ± 1.14
4 0.371 ± 0.006 2.77 ± 0.47 0.65 ± 0.02 -
Note: hyphen (-) indicates not measured.
a more structured dough where water was adsorbed to the glutens surface and also trapped within
pores within the gluten network.
It is postulated that the differences seen within the dough rheology and stickiness data as
a function of NaCl level reflects differences in protein composition between cultivars,
particularly the HMW and LMW-GS fractions. Butow et al. (2002) found that different
sensitivities to NaCl addition among cultivars could be explained by grouping flour cultivars
based on their HMW-GS make-up. The authors also showed that cultivars that had an over

152
expression of the HMW-GS of Bx7 resulted in significantly greater increases in dough strength
parameters with the addition of salt than cultivars without the over expressed gene. Indicating
that less salt may be necessary to provide strength to the dough within the HMW-GS Bx7 over
expression cultivars. In the first study of this research Pembina, for instance, had a higher
glutenin: gliadin ratio than Harvest but similar to that of Roblin, and had a lower HMW: LMW-
GS ratio than Roblin. Pembina also had a similar HMW-GS amount to that of the weaker
cultivar Harvest thus pointing to the role of HMW-GS composition and the combined role of
LMW-GS in the reduced sodium environments in maintaining dough strength and decreased
dough stickiness. With regard to HMW-GS composition it has been indicated that within the
repeat regions, of the HMW-GS, certain amino acid arrangements result in loops and others in
trains, therefore some subunits will create more elasticity or resistance within the dough (Belton,
2012). Experiments presented in Belton (2012) also indicated that greater resistance to extension
resulted from perfect repeat regions that lead to higher levels of beta sheets. The role of LMW-
GS in Pembina are proposed to act as chain extenders (lengthening the glutenin polymers), cross-
linkers (interconnecting the aligned HMW-GS polymers) and chain terminators (with the
potential to create physical entanglements between the glutenin polymer proteins upon
deformation of the dough). The role of NaCl in dough is to shield the charges on the gluten
polymers to promote closer gluten-gluten interactions facilitated by hydrophobic interactions.
As NaCl is decreased, the numbers of these interactions also decrease and leads to a weaker less
interconnected network. Differences in composition of the HMW-GS proteins is thought to lead
to differences in available charges to be shielded by the NaCl leading to some NaCl sensitivities
in some cultivars and not others. This was reflected in the rheological data associated with a
reduction in strength with decreasing levels of NaCl, and differences in strength among the
different cultivars (Table 6.3).
In the present study, Pembina formed a strong dough capable of storing elastic energy
within the gluten network as evident by oscillatory and creep recovery rheology (e.g., highest Gʹ,
lowest tan , lowest Jmax, highest Jel and greatest resistance to extension) and also formed a non-
sticky dough. In contrast, Harvest formed a weaker dough, less capable of storing/ transferring
energy throughout the gluten network, that was sticky. Relationships between dough stickiness
and dough rheology have been reported by Dobraszczyk (1997). The level of ordering within the
gluten network and charge shielding occurring is postulated to impact stickiness, where a less

153
ordered (and weaker) gluten network would have more unbound water (weakly absorbed free
water that is more mobile near the surface) and less water strongly absorbed entrapped within the
gluten network resulting in stickier dough. Based on the correlations found by Dobraszczyk
(1997) between dough rheology and stickiness and the findings in the current study, dough
rheology may be a good indicator of whether a sticky dough is formed, although the use of
fundamental rheology as the only predictor may be pre-mature, as other factors (e.g., water
mobility and distribution) complicate the picture.
c) Effects of varying levels of NaCl on water mobility within dough prepared by the different
wheat cultivars and the impact on dough strength and stickiness
The migration of water in dough prepared from different cultivars, with differing NaCl
levels, has an impact on dough strength. Based on the TGA curve fitting, it is hypothesized that
the gluten network is not the only factor determining the presence of dough stickiness in reduced
sodium environments. Rather, there is also the impact of the relationship between the free water
(from the diffuse layer near the dough’s surface that is weakly absorbed, more mobile) and water
associated with the starch-fraction (as either unbound or bound water). For instance, at the 0%
NaCl level the percentage of water associated with the starch-fraction was less than at the 2%
NaCl level for Roblin, McKenzie and Harvest (Table 6.3). This trend was also observed for
Pembina, however the change was not significant. This movement was also associated with
decrease in dough stickiness (Table 6.3). Beck et al. (2012a) suggested that the unbound water
within dough might be responsible for dough stickiness. In other works, it has been shown that
doughs’ excess in water resulted in increased stickiness (Dhaliwal et al., 1990; Chen & Hoseney,
1995a; Jekle & Becker, 2011). Larsson (2002) also showed a change in the water’s association
with the starch-fraction with the addition of NaCl as determined by ultracentrifugation of the
dough. These findings along with the findings in the present study indicate an interaction of both
the gluten network formation and strength and the migration of water in the presence of dough
stickiness with changes in NaCl levels.

154
d) Impact of a constant water addition on rheological properties and stickiness of dough
prepared with different wheat cultivars at the 2% NaCl level
All doughs prepared in this research were mixed using the optimal FAB water content in
order to ensure each dough was mixed to its optimal development. However in doing so, each
dough contained different levels of water. For comparative purposes, rheological data (e.g.,
resistance to extension, tan and Jmax) and stickiness values were all normalized to the same
FAB water content as Pembina. The normalization procedure was not applied to data as a
function of NaCl content (for each cultivar), since differences were considered minor relative to
differences between cultivars. Normalization of the data revealed differences between the
rheological techniques in terms of trends observed with dough strength, however by normalizing
the water addition to that of Pembina this meant a decrease in water for the other flour cultivars
and it can be seen in Table 6.4 that this results in both an increase in the dough strength
parameters (or a stiffening of the dough) and a decrease in dough stickiness. For instance,
resistance to extension (empirical rheology) data found Pembina to offer the greatest resistance
(i.e., stronger dough), followed by Roblin and McKenzie, and then Harvest, which was the same
trend as the normalized data. However, the different cultivars did notice an increase in resistance
to extension which was expected given that when water is decreased in a dough below the FAB
value the dough gets stiffer. Normalization of the tan δ (fundamental rheology) data in Table 6.4
exhibited a change in the trend from that of the raw data (given in Table 6.2). Pembina no longer
exhibited the greatest elastic behaviour where Roblin and Harvest (which have the highest water
additions) were found to have an increase in elasticity similar to that of Pembina by decreasing
the amount of water. Other researchers have also found that with less water there was an
decrease in tan δ (Khatkar et al., 1995; Jekle & Becker, 2011), however others found that there
was no change in tan δ with a decrease or increase in water as the G' and G" changed in the same
order of magnitude (Navickis et al., 1982; Berland & Launay, 1995; Letang et al., 1999). From
this, it is noteworthy to mention that the normalization of the data in the present study is a very
simplistic look at the impact of water addition on dough rheology and strength/stickiness. Water
addition is not the sole determinant of dough rheology, and other factors such as dough
formulation (flour composition and quality, salt level, etc.) and mixing conditions impact dough
rheology as well. For the maximum creep compliance (fundamental rheology) the trend stayed
the same with Pembina experiencing the least deformation followed by Roblin and McKenzie

155
Table 6.4. A comparison between empirical and fundamental rheology measurements, and
stickiness on dough prepared using different cultivars at the 2% NaCl level. Data
represent the mean ± one standard deviation. All data is normalized to the FAB of
Pembina.
Notes: (1) Data taken from study 1; (2) Data taken from study 2. FABS values were slightly different
between studies 1 and 2, since the research studies 2 and 3 were completed first, followed by the
compositional analysis (in which the FAB were repeated).
which were similar, and then Harvest which experienced the highest amount of deformation.
Wang and Sun (2002) found that doughs at both their optimal and a fixed water level did not
notice major changes to their creep recovery parameters. Findings suggest that small strain
fundamental rheology (tan ) is more sensitive to water addition than the larger fundamental
rheology (Jmax) and empirical techniques. In all cases, normalization to Pembina would result in
the amounts of water added being below each cultivars’ FAB optimal value, which would cause
a stiffening of the dough network and give rise to higher resistance to extension. In the case of
dough stickiness all flour cultivars exhibit a decrease in stickiness with normalization of water
levels to that of Pembina. However, the trend still remained the same with Pembina still showing
the lowest dough stickiness. The decrease in dough stickiness with a reduction in the water added
to the dough was expected with normalization of the data due to the findings of Chen and
Hoseney (1995a) and Jekle and Becker (2011) where doughs mixed with water addition both
above and below the FAB resulted in an increase and decrease in stickiness respectively.
Cultivar FAB
(% to 14%
w.b)
(Studies 1/2)
1Resistance to
extension (N)
2tan 2Maximum
creep
compliance
(Jmax) (1/mPa)
2Stickiness
(N)
Pembina 61.5/61.9 0.31 ± 0.02 0.361 ± 0.004 1.84 ± 0.13 0.47 ± 0.01
Roblin 65.3/65.0 0.27 ± 0.01 0.368 ± 0.004 2.91 ± 0.56 0.52 ± 0.01
McKenzie 63.3/64.1 0.23 ± 0.00 0.374 ± 0.002 2.97 ± 0.17 0.62 ± 0.01
Harvest 64.9/65.5 0.19 ± 0.01 0.362 ± 0.003 4.72 ± 0.52 0.54 ± 0.01

156
In summary, based on study 1 and 2 together, it is concluded that dough stickiness in
reduced sodium formulations is governed by a combination of the gluten network formation as
dictated by protein quality (i.e., glutenin: gliadin ratio, HMW-GS: LMW-GS ratio and greater
presence of high quality LMW-GS), the level of damaged starch, and the changes in water
mobility. It is postulated that the formation of a strong gluten network made up of high quality
HMW-GS and LMW-GS is capable of mitigating the effects of dough stickiness in reduced
sodium environments. However, in weaker gluten networks with higher damaged starch the
occurrence of dough stickiness becomes more apparent through the change in water’s mobility
between water associated with the starch-fraction and that of free water (which is not entrapped
within the gluten network). Therefore, it is concluded that cultivar selection is of the utmost
importance when preparing low sodium dough formulations in the prevention of a sticky dough.
6.5 Impact of salts from the lyotropic series on dough handling, stickiness and water
mobility in doughs prepared from different CWRS wheat cultivars
The use of alternative salts from the lyotropic series has been investigated by a number of
researchers as a means to achieving NaCl reduction while still maintaining dough handling
properties and final bread quality (Salovaara, 1982ab; Kinsella & Hale, 1984; Preston, 1989; He
et al., 1992; Butow et al., 2002; Charlton et al., 2007; Braschi et al., 2009; Kaur et al., 2011;
Uthayakumaran, 2011; Tuhumury et al., 2016ab). Within these studies the replacement of either
the cation (Na+) or anion (Cl-) or both have been examined, however within the current study
only the replacement of the cation was studied. Within aforementioned studies, there was no
examination of the effect on dough stickiness which is a major problem within reduced NaCl
formulations. Therefore, the purpose of the final part of the research was to gain a greater
understanding of the influence that the replacement of NaCl with salts from the lyotrpoic series
(NH4Cl, KCl, MgCl2, CaCl2, and MgSO4) would have on the rheology, stickiness, morphology
and water mobility within dough prepared from a strong/non-sticky (Pembina) and weak/sticky
(Harvest) dough producing CWRS flour at both the 1% level and 2% level. It was hypothesized
that those salts with cations that are non-chaotropic (NH4+, K+, Na+) in nature would result in a
strengthening of the gluten network and therefore a non-sticky dough with decreased water
mobility because non-chaotropic cations tend to induce a greater amount of protein-protein
interactions. On the other hand, the chaotropic cations (Ca2+, Mg2+) are hypothesized to result in

157
a weakening effect on the gluten network and therefore an increase in dough stickiness and an
increase in water mobility because the chaotropic ions result in greater protein hydration.
a) The impact of concentration of salts from the lyotropic series on the dough handling
properties of dough prepared from Pembina (strong/non-sticky) and Harvest (weak/sticky) wheat
cultivars
Overall, for doughs produced with both flour cultivars using salts from the lyotropic
series, an increase in strength was observed at the 2% level relative to the 1% level, for each
given salt-type. However, a greater distinction between the dough strengthening effects of the
more non-chaotropic cations as compared to the weakening effects of the more chaotropic
cations was observed at the 2% level vs the 1% level. It has been reported that higher
concentrations, above ~ 0.3-0.5 M, for both the cations and anions of salts from the lyotropic
series exhibit a greater influence on the level of protein aggregation in conformity to their
ranking in the series, with chaotropic effects becoming more pronounced (Kinsella & Hale,
1984; Preston, 1989; He et al., 1992; Melnyk et al., 2011; Tuhumury et al., 2016b). In contrast, at
lower salt concentrations ~0.1-0.3 M a similar effect is seen on protein aggregation due to the
similarities in electrostatic charge shielding of all ions. It is presumed that the more ionic
environment would offer greater charge shielding to the glutenin and gliadin proteins present,
enabling a greater amount of hydrophobic protein-protein interactions (and ordering within the
gluten network) to occur (Preston, 1989; Melnyk et al., 2011).
In combination to the effect of the salt-type concentration, there is also the effect of ion
charge as well. The present research focuses on removing the cation (Na+) as part of an overall
sodium reduction approach. However, in the literature, it has been shown that replacing NaCl
with anions from the lyotropic series has a much greater influence on dough handling due to
greater ability of the anion to induce conformational changes on the gluten proteins (Kunz, 2010;
Melnyk et al., 2011; Tuhumury et al., 2016a,b). In the mentioned studies, it has been indicated
that anions are more effective at shielding the charge on the gluten proteins to induce greater
protein-protein interactions than cations do. As such, our approach to use cations may also have
lead to reduced differences between the salt-types given that the anion chloride (which would
provide a greater influence over the cations) remains constant.

158
In addition, greater dough strength was exhibited for doughs produced using salts from
the lyotropic series with Pembina relative to Harvest, regardless of the salt-type. This finding
was proposed to stem back to differences in protein composition/quality (higher glutenin: gliadin
of Pembina relative to Harvest) (study 1). This would lead to increased dough strength and
reduced stickiness because the flour has a greater amount of HMW glutenin polymers that
interact more strongly via hydrophobic interactions with less gliadins disrupting the formation of
a more ordered gluten network. It was also suggested by Melnyk et al. (2011) that the effect of
the salts on the gluten protein aggregation within the dough may be influenced by differences in
flour composition (i.e., protein content and composition/quality). The cultivar dependence for the
effect of salt-type observed is also thought to stem from the higher quality HMW-GS and LMW-
GS of Pembina relative to Harvest (given that they have equal amounts of HMW-GS); He et al.
(1992) also reported that higher quality flour (i.e., higher glutenin: gliadin ratio) outperformed
the weaker cultivar with the differing salts from the lyotropic series. The rational for these
findings are that the higher quality glutenin in the stronger dough producing flour have greater
surface hydrophobicity than those of the weaker quality gluten (He et al., 1992). Their
conclusion was based off of the findings of Chung and Pomeranz (1979) who found that the
glutenin from the poor flour was less hydrophobic than that of the good flour through the use of
hydrophobic gel separation. From this it is hypothesized that there is similarly a higher surface
hydrophobicity of Pembina HMW-GS (high quality) than Harvest HMW-GS (lower quality)
which would help account for why higher salt levels are necessary to strengthen Harvest and
promote good dough handling properties. He et al. (1992) also reported that more salt was
needed to maintain good proof height and loaf volume if the flour used was of poor quality.
b) The impact of salt-type from the lyotropic series at the 1% salt levels on the dough handling
properties of dough prepared from Pembina and Harvest
Based on the overall goal of the research a more detailed examination on the dough
handling properties at the 1% salt level will be given. In general, when examining the
replacement of cations in NaCl and the impact on fundamental rheological properties of Pembina
and Harvest (Table 6.5) it can be seen that the overall trends tend to follow the lyotropic series in
regard to providing a strengthening (non-chaotropic) or weakening (chaotropic) effect relative to
NaCl. However, these differences relative to NaCl tended not to be significant with the use of

159
Table 6.5 Fundamental rheological properties and stickiness of doughs prepared with salts
from the lyotropic series at the 1% level.
Flour
Cultivar
Salt (1% on
flour weight
basis)
Salt
(mol/L)
Tan δ Jel Stickiness (N)
Pembina NH4Cl 0.30 0.353 ± 0.002 0.62 ± 0.01 0.31 ± 0.02
KCl 0.22 0.372 ± 0.006 0.51 ± 0.04 0.32 ± 0.02
NaCl 0.28 0.368 ± 0.006 0.57 ± 0.05 0.47 ± 0.03
CaCl2 0.15 0.367 ± 0.006 0.54 ± 0.03 0.36 ± 0.01
MgCl2 0.17 0.372 ± 0.003 0.51 ± 0.02 0.44 ± 0.02
MgSO4 0.13 0.362 ± 0.004 0.61 ± 0.01 0.34 ± 0.03
Harvest NH4Cl 0.29 0.390 ± 0.006 0.33 ± 0.02 0.39 ± 0.01
KCl 0.20 0.405 ± 0.004 0.22 ± 0.02 0.63 ± 0.01
NaCl 0.26 0.397 ± 0.003 0.29 ± 0.03 0.62 ± 0.02
CaCl2 0.14 0.397 ± 0.009 0.26 ± 0.06 0.52 ± 0.03
MgCl2 0.16 0.413 ± 0.005 0.19 ± 0.02 0.60 ± 0.02
MgSO4 0.13 0.388 ± 0.004 0.35 ± 0.04 0.60 ± 0.02
oscillatory shear, but became slightly more apparent with the use of the larger deformation of
creep recovery (although still no major differences). When examining the results from the creep
recovery (Table 6.5), doughs prepared with Harvest in the presence of KCl and MgCl2 gave
lower Jel values indicating a weakening of the gluten network, whereas all others were similar in
magnitude with the exception of MgSO4 which showed higher Jel values than NaCl. This similar
strengthening effect of MgSO4 on dough strength/stability was found by Salovaara (1982a) and
Kaur and others (2011). They postulated that the stabilizing effect of the sulfate (non-chaotropic
anion) relative to the chloride anion outweighed the destabilizing effect of the magnesium cation
(chaotropic). For doughs prepared with Pembina only those prepared with NH4Cl gave higher Jel
values indicating increased dough elasticity. In contrast, KCl and MgCl2 showed reduced Jel
values relative to NaCl suggesting that those salts caused a decrease in network recovery.
Uthayakumaran (2011) also found increased dough strength with the use of NH4Cl. Tuhumury
and others (2016a) reported for gluten washed dough samples that the non-chaotropic cations

160
resulted in similar but higher G and G values than those of the chaotropic cations. However, the
authors did not find differences between the strong and weak cultivars they used with each salt
type. The lack of major significant differences within the present study and that by Tuhumury et
al. (2016a) is most likely due to the insensitivities of the small strain oscillatory shear to detect
the small changes within the ordering of the gluten network based off differences in MW
distributions, water mobility and starch-starch interactions in response to the different salt types.
Thus, when examining the impact of salts from the lyotropic series within a given flour cultivar
on the dough handling properties, the larger strain of creep recovery or extensional rheology may
be more beneficial. It is also interesting to note that other studies have found that KCl often
provides similar effects on dough handling properties as NaCl (Salovaara, 1982a; Kaur et al.,
2011; Tuhumury et al., 2016a) given that they are ranked close/equivalent in the lyotropic series;
however in the present study this similar effect is not consistently seen, which might be
explained by the differences in molarity (Table 6.5). Within the present study, addition of salt
was done on a flour weight basis not on an equivalent molarity basis to NaCl. It can be seen that
the cations of larger size have lower concentrations than the smaller cations when added at the
1% level of salt on a flour weight basis. If the same molarity was used, as in Butow et al. (2002),
then greater differences may have been seen between the different cations and KCl may have
performed similar to NaCl.
With regards to the impact of the alternative salts on dough stickiness, dough prepared
with Pembina showed lower dough stickiness than Harvest in all cases. For doughs prepared
with both Pembina and Harvest, stickiness was found to show the greatest reduction with the use
of NH4Cl. There have been no studies, to our knowledge investigating the effect of alternative
salts on dough stickiness, however it was concluded from the current results that NH4Cl
decreases dough stickiness for both flour cultivars due to the increase in dough handling
properties, dough strength and microstructure formation/organization. However, dough strength
and stickiness did not seem to be as strongly associated in this study involving lyotropic series,
as compared to the second study with only NaCl at different levels. It was hypothesized that
chaotropic cationic salts from the lyotropic series would cause a decrease in strength which
would then translate into an increase in stickiness and vice versa with the use of non-chaotropic
cationic salts. However, all alternative salts resulted in either a decrease or no change in dough
stickiness relative to NaCl despite changes in dough strength parameters. For instance, generally

161
when comparing the NH4Cl and MgCl2 relative to NaCl, NH4Cl resulted in a strengthening effect
whereas MgCl2 resulted in a weakening effect. However, NH4Cl significantly reduced stickiness
in both Pembina and Harvest, but instead of increasing stickiness MgCl2 resulted in a decrease in
both. It is also interesting to note that only NH4Cl reduced dough stickiness in Harvest to values
closer to that of Pembina.
When examining the effect of the NH4Cl and MgCl2 (only) on water mobility (i.e.,
unbound [freezable] vs bound [un-freezable]) it was found that Pembina showed an increase in
the amount of freezable water relative to NaCl (Table 6.6). This is believed to occur because of
different cation-water interactions occurring related to differences in different cation sizes, their
hydration radii charge density, and molarity (Butow et al., 2002). For Pembina, alternative salts
resulted in an increase in water associated with gluten relative to the NaCl which may be the
reason why both salt-types decreased stickiness relative to NaCl at the 1% level. In the case of
Harvest, NH4Cl had similar FWC to NaCl, whereas the presence of MgCl2 increased it (Table
6.6). However, NH4Cl decreased stickiness and MgCl2 resulted in similar stickiness to NaCl.
When looking at association of water it can be seen that MgCl2 resulted in similar starch water
association as NaCl whereas NH4Cl resulted in less water associated with the starch. Based on
these findings, stickiness seems to be more related to changes in water distribution within the
dough, along with the strength of the gluten network.
In conclusion of study 3, NH4Cl is the most effective at enhancing dough strength and
decreasing dough stickiness in the reduced salt formulations of salts from the lyotropic series in
both the strong dough producing cultivar Pembina and the weaker dough producing cultivar
Harvest. In the presence of both the non-chaotropic and chaotropic salts of the lyotropic series,
the higher quality gluten in Pembina is postulated to result in greater strength and reduced
stickiness as compared to Harvest. The higher quality also helps account for the decreased
sensitivity of Pembina to the chaotropic effects of the salts as compared to Harvest. The
combined analysis of the effect of salts from the lyotropic series on dough strength/rheology,
stickiness, and water mobility in two cultivars showed that the dough stickiness phenomenon is
an increasingly complicated issue as all alternative salts resulted in decreased stickiness,
however had differing effects on water association and dough strength which was cultivar
dependant. In the future, investigation of replacement with cations and anions from the lyotropic
series on a % flour weight basis and an equimolar basis should be studied to better understand
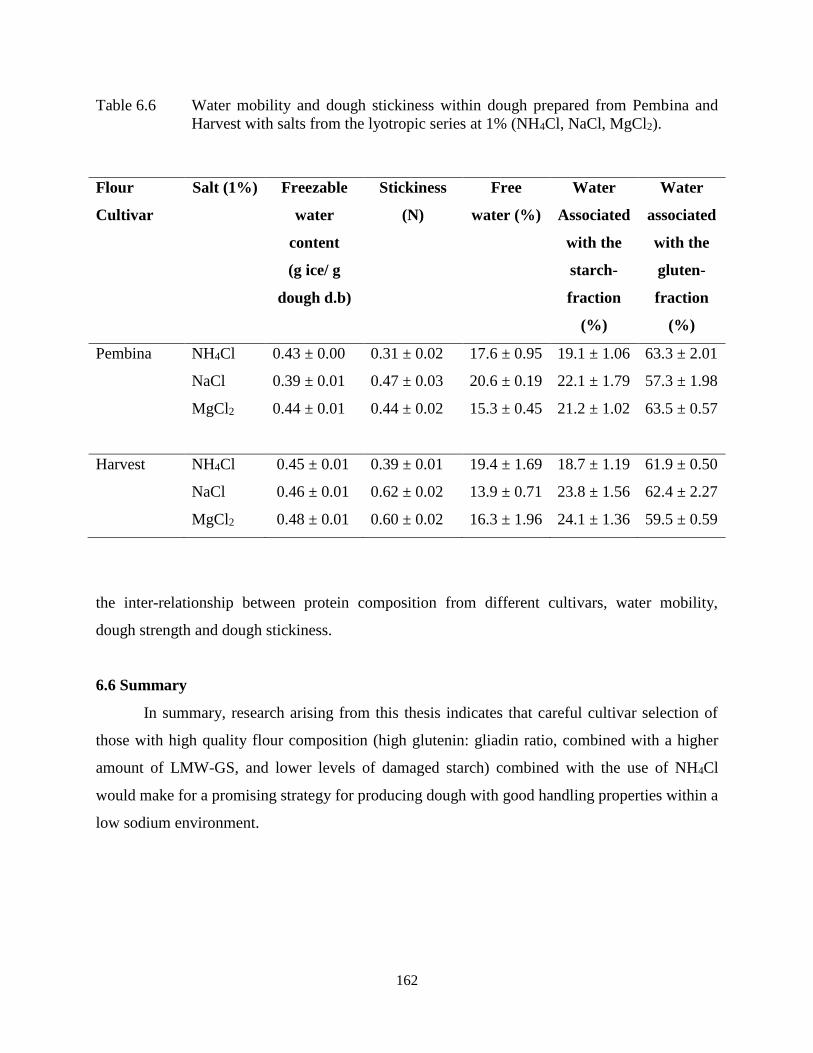
162
Table 6.6 Water mobility and dough stickiness within dough prepared from Pembina and
Harvest with salts from the lyotropic series at 1% (NH4Cl, NaCl, MgCl2).
Flour
Cultivar
Salt (1%) Freezable
water
content
(g ice/ g
dough d.b)
Stickiness
(N)
Free
water (%)
Water
Associated
with the
starch-
fraction
(%)
Water
associated
with the
gluten-
fraction
(%)
Pembina NH4Cl 0.43 ± 0.00 0.31 ± 0.02 17.6 ± 0.95 19.1 ± 1.06 63.3 ± 2.01
NaCl 0.39 ± 0.01 0.47 ± 0.03 20.6 ± 0.19 22.1 ± 1.79 57.3 ± 1.98
MgCl2 0.44 ± 0.01 0.44 ± 0.02 15.3 ± 0.45 21.2 ± 1.02 63.5 ± 0.57
Harvest NH4Cl 0.45 ± 0.01 0.39 ± 0.01 19.4 ± 1.69 18.7 ± 1.19 61.9 ± 0.50
NaCl 0.46 ± 0.01 0.62 ± 0.02 13.9 ± 0.71 23.8 ± 1.56 62.4 ± 2.27
MgCl2 0.48 ± 0.01 0.60 ± 0.02 16.3 ± 1.96 24.1 ± 1.36 59.5 ± 0.59
the inter-relationship between protein composition from different cultivars, water mobility,
dough strength and dough stickiness.
6.6 Summary
In summary, research arising from this thesis indicates that careful cultivar selection of
those with high quality flour composition (high glutenin: gliadin ratio, combined with a higher
amount of LMW-GS, and lower levels of damaged starch) combined with the use of NH4Cl
would make for a promising strategy for producing dough with good handling properties within a
low sodium environment.

163
7. GENERAL CONCLUSIONS
The overall aim of this research was to investigate the underlying mechanisms leading to
the sticky dough phenomenon within reduced sodium dough formulations by focusing on gluten
network strength and formation as it relates to dough handling properties. To achieve this, four
different Canada Western Red Spring (CWRS) wheat flour cultivars known to have good,
average and poor dough handling properties in low sodium environments were examined. First
the compositional characteristics were analyzed and related to dough strength in a standard NaCl
formulation. Dough rheology, dough morphology, dough stickiness and water mobility were
utilized as indicators of formulation changes with a range of NaCl levels and alternative salts
from the lyotropic series.
The first stage of this research (Chapter 3) analyzed the effects of compositional
characteristics of four different CWRS wheat cultivars on dough formation and strength. Overall
the flour cultivar Pembina proved to form doughs with the best handling properties with respect
to having the highest ratio of resistance to extension to extensibility, which gives an indication of
a gluten network’s elasticity. Pembina also appears to form more directionally oriented gluten
network in the CLSM micrographs, having the highest particle count indicating the formation of
an organized and continuous gluten network. On the other hand, the flour cultivar Harvest had
the worst dough handling properties with the lowest resistance to extension indicating a weaker
gluten network. Harvest also had the most porous and multidirectional oriented gluten network
with the lowest particle count (greatest amount of gluten protein aggregation) as indicated by the
CLSM micrographs and image analysis. The differences in the dough strength and gluten
network formation/structure are postulated to be attributed to the gluten quality index, ratio of
glutenin: gliadin proteins, and differing levels of damaged starch. More specifically, differences
in dough properties between the cultivars was attributed to differences in subunit composition
within the HMW insoluble glutenin subunit fraction, and also differences in the levels of LMW
glutenin subunit and gliadin fractions. Findings from this study indicate that gluten network
formation and strength is dependent upon gluten quality over quantity given Pembina has the

164
lowest protein content of all the cultivars and forms the strongest gluten network. Findings from
this study give rise to the hypothesis that the insoluble LMW glutenin subunits play a greater
role, than originally hypothesized, in maintaining the gluten network formation and strength in
reduced sodium environments.
The second stage of this research (Chapter 4) examined the effect of NaCl (0-4%) levels
on the handling properties of doughs prepared from different CWRS wheat cultivars. Overall,
rheological results indicated that the strength of the gluten network increased with increasing
levels of NaCl; however the magnitude was cultivar dependent. The two stronger cultivars of
Pembina and Roblin had the lowest dough stickiness relative to the weaker cultivars of
McKenzie and Harvest at both the 0% NaCl and 2% NaCl levels. Findings from the
thermogravimetric analysis, with subsequent curve fitting, indicated a movement of water’s
association within the dough from being present as free water to being associated with the starch-
fraction with the addition of 2% NaCl. Based on these findings it was postulated that the gluten
network is not the only factor governing dough stickiness in reduced sodium formulations.
Instead, the relationship between free water and that associated with the starch-fraction may also
be another key factor governing dough stickiness. Based on the results two cultivars were chosen
to move forward with to analyze the effect of alternative salts from the lyotropic series; one
cultivar that had the best dough handling properties and low stickiness in reduced NaCl
formulations (Pembina) and one cultivar showing the worst dough handling properties and high
stickiness (Harvest).
In the third stage of this research (Chapter 5) the effect of salts from the lyotropic series
(NH4Cl, KCl, NaCl, CaCl2, MgCl2, MgSO4) on the handling properties of doughs prepared from
a strong wheat flour cultivar (Pembina) and a weak wheat flour cultivar (Harvest) were
investigated. Overall, Pembina developed a stronger gluten network than Harvest with the
addition of all salt-types as indicated by the rheological results. Harvest’s dough rheology
appeared to be more sensitive to salt-type as indicated by the variability in the strength of the
gluten network given the salt-type used. In all cases, Pembina had a lower dough stickiness than
Harvest with each salt-type, however the extent of the change on dough stickiness was
influenced by the different salt-types. Findings from the thermogravimetric analysis, and curve
fitting, appear to indicate a difference in water’s movement with the use of alternative salts
dependent on the specific cultivar. Alternative salts for the cultivar Pembina had an effect of

165
water movement between free and gluten-fraction whereas alternative salts for Harvest had an
effect of water movement between free and starch-fraction. This further points to the hypothesis
that the gluten network is not the only governing factor in dough stickiness, but instead the
strength of the gluten network masks water’s change in association with the starch. This
hypothesis would explain why Pembina exhibits lower stickiness at reduced sodium levels than
Harvest which has a weaker gluten network formed. Based on the results NH4Cl appears to
improve dough handling properties and decrease stickiness in both flour cultivars and maintain
the gluten network formation as seen in CLSM micrographs. Based on the results and literature it
is concluded that NH4Cl results in an increase in hydrophobic and hydrogen bonding between the
glutenin polymers because of the competition of NH4Cl with water. Therefore, there is a greater
promotion of water-ion interactions over protein-water interactions resulting in greater protein-
protein interactions capable to form the gluten network.
From this research it was concluded that the gluten network was not the only factor
governing dough stickiness, where the starch-fraction was thought to also play an important role.
The formation of a strong gluten network is thought to mask the presence of dough stickiness at
reduced NaCl levels. It is hypothesized that in low NaCl dough formulations if the amount of
water associated or absorbed by the starch-fraction could be increased, the dough stickiness
problem in low sodium environments could be reduced. The reasoning behind this is because
movement of water from the starch-fraction to the free water fraction with a decrease in NaCl
was observed. Therefore if this movement of water can be prevented dough stickiness could be
reduced. An increase in the amount of damaged starch is a potential way to increase the starch-
fraction water absorption at low sodium levels. However further investigation into water
mobility (using FTIR or NMR) in a range of NaCl levels is required before concrete conclusions
can be made. There must also be an investigation into the impact of increasing damaged starch
on the strength of the gluten network/dough given the present research indicates an inter-
relationship of gluten network formation/strength and water mobility in the presence of dough
stickiness. Ammonium chloride represents a promising alternative salt to NaCl in the prevention
of dough stickiness. With that said, further studies on the effect of NH4Cl on final bread quality
needs to be investigated as well as the health implications of increased intake of NH4Cl prior to
use in bread formulations.

166
8. FUTURE STUDIES
Dough is a complex multi-phasic system, and the handling properties become drastically
altered as sodium levels are reduced. Although the focus of this research was the gluten proteins,
a further understanding of the influence of the starch-fraction, levels of starch damage and non-
starch polysaccharides on dough stickiness is of importance for understanding the dough
stickiness phenomena. Having a complete understanding will enable the baking industry to
develop formulation strategies for mediating effects of reduced salt in relation to the wheat
quality and cultivars present. The approach will help reduce costs associated with equipment
cleaning, maintenance or purchasing overhauls.
In the future, a more in-depth look at the impact of starch composition and structure on
dough handling, stickiness and water mobility should be explored. For instance, a further
investigation of the ratio of amylose to amylopectin should be examined as each have different
physiochemical properties which could impact the dough strength and stability (Ramachandran
et al., 2016). Wheat flours containing mutant genotypes for starch can result in either increased
amylose (amylostarch) or increased amylopectin content (waxy starch containing up to 99-100%
amylopectin) (Goesaert et al., 2005; Ramachandran et al., 2016). Ramachandran and others
(2016) found that wheat flours containing greater amounts of waxy starch (with lower amylose
and higher amylopectin) resulted in increased farinograph water absorptions which they related
to both the ability of amylopectin to trap and hold water better than amylose and the increased
susceptibility of waxy wheat to starch damage. Yi and others (2009) found that with increasing
contents of waxy wheat flour added into dough formulations that there was an increase in dough
stickiness, a decrease in resistance to extension, and an increase in extensibility. Thus the
presence of waxy starch has an effect on water absorption, dough stickiness and dough strength
and therefore it may be possible that some of the flour cultivars in this study contain the mutation
for different levels of waxy wheat starch to differing degrees. The presence of this mutation
would impact the results of differing levels of dough strength and stickiness among the four flour

167
cultivars. The strongest wheat flour with the lowest stickiness being Pembina may not have the
starch mutation for waxy starch whereas the much weaker and stickier flour cultivar of Harvest
may have a greater presence of this mutation thus increasing its level of dough stickiness and
decreasing its strength. The presence or lack of this starch mutation could help explain the
findings in the second section of this study with the movement of water association from free
water to starch associated water, with the inclusion of NaCl, in all cultivars except for Pembina.
A further investigation into the specific subunit composition of the HMW and LMW
insoluble glutenins within the four flour cultivars would also be important to explore, in relation
to its impact on dough handling and stickiness. It has been discussed in the literature that the
presence of certain subunits impart a strengthening effect and better dough handling properties
whereas the presence of others have a weakening effect (Butow et al., 2002; Suchy et al., 2003;
Barak et al., 2013). Barak and others found that cultivars with HMW-GS 2*, 5+10 and 7+9
created doughs with higher development times and stability, whilst cultivars with HMW-GS N,
2+12 and 20 created doughs with lower stability and higher dough weakening. Butow and others
found that different HMW-GS were more sensitive to changes in salt with those cultivars
containing the over expression of the Bx7 HMW-GS gene being the most sensitive and also
creating over-strong doughs. They concluded that the over expression of the Bx7 gene could
compensate for the reduction in salt levels and achieve optimal dough handling properties as it
would require less salt to achieve the same dough strength. Based on the findings in the current
study, Pembina was the least impacted by the sodium reduction with regards to dough stickiness
and dough strength, which could point to Pembina containing the over expression of the Bx7
HMW-GS gene.
A further examination of the effect of sodium chloride reduction on dough handling
properties and water mobility in cultivars containing differing levels of damaged starch and
LMW-GS should be undertaken. For instance, examining the effect of increased levels of
damaged starch in low sodium formulations may be beneficial, since in Chapter 4 it was found
that the movement of water’s association was from free to starch with the addition of NaCl.
Therefore if that water movement could be mimicked in a low sodium formulation by increasing
the damaged starch this may help mitigate the occurrence of dough stickiness. However, the
impact on the gluten network formation and strength must also be examined with differing levels
of damaged starch. Another area of examination could be looking at the effect of increasing

168
LMW-GS concentrations within the flour in low sodium formulations to examine the role that
LMW-GS may play in low sodium formulations and the occurrence of dough stickiness. It was
found by Suchy and others (2003) that cultivars exhibiting similar HMW-GS subunit
compositions had significant differences in dough quality properties and stated that differences in
dough properties may be due to differences in LMW-GS and gliadin composition. D’Ovidio and
Masci (2004) and Bonafede et al. (2015) discuss how the optimal HMW-GS alleles are
becoming fixed in wheat breeding, leading researchers to investigate the contributions of both
the LMW-GS and gliadins to certain cultivars’ breadmaking quality. Bonafede and others (2015)
found that certain LMW-GS coded for on the Glu-3 loci (i.e., Glu-A3f, Glu-B3b, Glu-B3g and
Glu-B3iMan) were associated with the highest values when examining gluten strength parameters
whereas other LMW-GS (i.e., Glu-A3e, GluB3a, and Glu-B3iChu) were associated with low
quality and weak gluten. This may be a useful avenue of insight given the findings in the gluten
fractionation of Pembina having the greatest amount LMW-GS and having the best dough
handling properties and lowest stickiness in the low sodium formulations. In the examination of
dough stickiness, based on the reproducibility of the Chen and Hoseney (1995a) method within
this study and comparing it to other studies using the same method, a further examination into
dough stickiness testing techniques should be undertaken.
The knowledge gained in Chapter 5 on the effect of alternative salts compared to sodium
chloride on the dough rheology, morphology, stickiness, and water mobility could be expanded
by changing the method of salt addition to the formulation. For instance, within the current study
the salts were added on a flour weight basis as this is what would be done in industry. However,
the alternative salts have different ion sizes and thus may have different hygroscopic capacities
and therefore could have different effects on water’s association given their ion concentrations.
Within the research by Butow and others (2002) they utilized an equimolar cation concentration
as they stated that ions differ in their ability to bind water and thus may alter the hydration of
each flour component. Therefore further analysis could be done using similar ion concentrations
(the same molarities) for each of the salt-types within the dough formulations to remove the
factor of different ion concentrations being the explanation for the differences observed in the
dough rheology, morphology, stickiness and water association within the different flour
cultivars. Ratios of substitution with sodium chloride in the total molarities could also be tested
by using the alternative salts which gave similar properties to sodium chloride. For instance,

169
Salovaara (1982a) investigated the substitution of NaCl at 20 and 40% replacement levels with
alternative salts based on sodium ion equivalents, whereas Kaur and others (2011) appear to have
done a substitution of 25 and 50% on a flour weight basis in the similar manner they added
NaCl, however it is unclear.
Furthermore, an examination should be done on how the changes in salt levels, salt-types,
and flour cultivars translate into final loaf quality and shelf life. Therefore baking trials would be
an important aspect to the analysis to ensure that changes translate into a high quality final
product. For instance, within the thermogravimetric analysis in Chapter 5 with the alternative
salts (NH4Cl, NaCl, and MgCl2), after the application of the final 200°C (which is similar to the
temperature that a loaf of bread would be baked at) the colour of the little dough balls were
different for each salt-type. The ammonium chloride resulted in a baked colour of dark brown,
similar to that of pumpernickel bread, sodium chloride resulted in a golden brown colour and
magnesium chloride resulted in a slightly darker caramel colour. Butow and others (2002)
investigated the use of alternative salts and different cultivars but did not do baking tests and
stated that studies done by Holmes and Hoseney (1987) and He and others (1992) found that
although certain salts increased dough strength, they did not improve loaf volume. Therefore it
would be interesting to do baking trials with the alternative salts to examine the effect on loaf
colour, volume, crumb texture and crumb grain. This addition of baking trials would bring the
analysis of preventing dough stickiness within low sodium formulations full circle to the effect
on the most important aspect, the final bread product for the consumer.

170
9. REFERENCES
AACC International. Approved Methods of Analysis, 11th Ed. Method 08-03.01. Ash-Rapid (2-
Hour, 600 °) Method. Reapproved (November) (03), (1999). AACC International, St. Paul,
MN, U.S.A.
AACC International. Approved Methods of Analysis, 11th Ed. Method 26-21.02. Experimental
Milling-Buhler Method for Hard Wheat. Reapproved (November) (03), (1999). AACC
International, St. Paul, MN, U.S.A.
AACC International. Approved Methods of Analysis, 11th Ed. Method 30-25.01. Crude Fat in
Wheat, Corn, and Soy Flour, Feeds, and Mixed Feeds. Reapproved (November) (03),
(1999). AACC International, St. Paul, MN, U.S.A.
AACC International. Approved Methods of Analysis, 11th Ed. Method 38-12.02. Wet Gluten,
Dry Gluten, Water-Binding Capacity, and Gluten Index. Approved (November) (08),
(2000). AACC International, St. Paul, MN, U.S.A.
AACC International. Approved Methods of Analysis, 11th Ed. Method 44-15.02. Moisture-Air-
Oven Methods. Reapproved (November) (03), (1999). AACC International, St. Paul, MN,
U.S.A.
AACC International. Approved Methods of Analysis, 11th Ed. Method 46-30.01. Crude Protein-
Combustion Method. Reapproved (November) (03), (1999). AACC International, St. Paul,
MN, U.S.A.
AACC International Approved Methods of Analysis, 11th Ed. Method 54-21.02. Rheological
Behavior of Flour by Farinograph: Constant Flour Weight Procedure. Revised approval
(January) (6), (2011). AACC International, St. Paul, MN. U. S. A.
AACC International Approved Methods of Analysis, 11th Ed. Method 54-40.02. Mixograph
Method. Approved (November) (8), (1995). AACC International, St. Paul, MN. U. S. A.
AACC International. Approved Methods of Analysis, 11th Ed. Method 55-31.01. Single-Kernel
Characterization System for Wheat Kernel Texture. Reapproved (November) (03), (1999).
AACC International, St. Paul, MN, U.S.A.
AACC International. Approved Methods of Analysis, 11th Ed. Method 56-11.02. Solvent
Retention Capacity Profile. Approved (June) (03), (2009). AACC International, St. Paul,
MN, U.S.A.

171
AACC International. Approved Methods of Analysis, 11th Ed. Method 56-81.03. Determination
of Falling Number. Reapproved (November) (03), (1999). AACC International, St. Paul,
MN, U.S.A.
AACC International. Approved Methods of Analysis, 11th Ed. Method 76-21.01.General Pasting
Method for Wheat or Rye Flour or Starch Using the Rapid Visco Analyser. Reapproved
(November) (03), (1999). ). AACC International, St. Paul, MN, U.S.A.
AACC International Approved Methods of Analysis, 11th Ed. Method 76-31.01. Determination
of Damaged Starch Spectrophotometric Method. Edited (January) (10), (2014). AACC
International, St. Paul, MN. U. S. A.
Adhikari, B., Howes, T., Bhandari, B. R., & Truong, V. (2001). Stickiness in foods: a review of
mechanisms and test methods. International Journal of Food Properties, 4, 1-33.
Anderson, A. K., & Ng, P. K. W. (2000). Changes in disulfide and sulfhydryl contents and
electrophoretic patterns of extruded wheat flour proteins. Cereal Chemistry, 77, 354-359.
Angioloni, A., & Rosa, M. D. (2005). Dough thermo-mechanical properties: influence of sodium
chloride, mixing time and equipment. Journal of Cereal Science, 41, 327-331.
AOAC Official Method 985.28. (1995). Association of Analytical Communities Official Methods
of Analysis.Ch. 45, 67.
AOAC Official Method 988.15. (1995). Association of Analytical Communities Official Methods
of Analysis. Ch. 45, 66.
Autio, K., & Laurikainen, T. (1997). Relationships between flour/dough microstructure and
dough handling and baking properties. Trends in Food Science & Technology, 8, 181-185.
Barak, S., Mudgil, D., & Khatkar, B. S. (2013). Relationship of gliadin and glutenin proteins
with dough rheology, flour pasting and bread making performance of wheat varieties.
LWT-Food Science and Technology, 51, 211-217.
Barbeau, W. E., Schwarzlaff, S. S., Uriyo, M. G., Johnson, J. M., Harris, C. H., & Griffey, C. A.
(2003). Review: origin and practical significance of the sticky dough factor in 1BL/1RS
wheats. Journal of the Science of Food and Agriculture, 83, 29-38.
Basman, A., Koksel, H., & Ng, P. K. W. (2002). Effects of increasing levels of translgutaminase
on the properties and bread quality characteristics of two wheat flours. European Food
Research and Technology, 215, 419-424.
Beck, M., Jekle, M., & Becker, T. (2012a). Impact of sodium chloride on wheat flour dough for
yeast-leavened products. I. Rheological attributes. Journal of the Science of Food and
Agriculture, 92, 585-592.
Beck, M., Jekle, M., & Becker, T. (2012b). Impact of sodium chloride on wheat flour dough for
yeast-leavened products. II. Baking quality parameters and their relationship. Journal of
the Science of Food and Agriculture, 92, 299-306.
172
Bekes, F., Kemeny, S., & Morell, M. (2006). An integrated approach to predicting end-product
quality of wheat. European Journal of Agronomy, 25, 155-162.
Belton, P. S. (1999). On the elasticity of wheat gluten. Journal of Cereal Science, 29, 103-107.
Belton, P. S. (2012). The molecular basis of dough rheology. In S. P. Cauvain (Ed.),
Breadmaking: Improving Quality, Second Edition (pp. 337-351). Cambridge, UK:
Woodhead Publishing Ltd.
Belz, M. C. E., Ryan, L. A. M., & Arendt, E. K. (2012). The impact of salt reduction in bread: a
review. Critical Reviews in Food Science and Nutrition, 52, 514-524.
Berland, S., & Launay, B. (1995). Rheological properties of wheat flour doughs in steady and
dynamic shear: effect of water content and some additives. Cereal Chemistry, 72, 48-52.
Bigne, F., Puppo, M. C., & Ferrero, C. (2016). Rheological and microstructure characterization
of composite dough with wheat and mesquite (Prosopis spp) flours. International Journal
of Food Properties, 19, 243-256.
Bloksma, A. H., & Bushuk, W. (1988). Rheology and chemistry of dough. In Y. Pomeranz (Ed.),
Wheat: Chemistry and Technology, Third Edition Volume Two (pp. 131-218.). St. Paul,
MN: American Association of Cereal Chemists.
Bonafede, M. D., Tranquilli, G., Pflüger, L. A., Peña, R. J., & Dubcovsky, J. (2015). Effect of
allelic variation at the Glu-3/Gli-1 loci on breadmaking quality parameters in hexaploid
wheat (Triticum aestivum L.). Journal of Cereal Science, 62, 143-150.
Braschi, A., Gill, L., & Naismith, D. J. (2009). Partial substitution of sodium with potassium in
white bread: feasibility and bioavailability. International Journal of Food Science and
Nutrition, 60, 507-521.
Butow, B. J., Gras, P. W., Haraszi, R., & Bekes, F. (2002). Effects of different salts on mixing
and extension parameters on a diverse group of wheat cultivars using 2-g mixograph and
extensigraph methods. Cereal Chemistry, 79, 826-833.
Caballero, P. A., Bonet, A., Rosell, C. M., & Gomez, M. (2005). Effect of microbial
transglutaminase on the rheological and thermal properties of insect damaged wheat flour.
Journal of Cereal Science, 42, 93-100.
Campbell, A. B. (1963). Registration of Pembina and Canthatch Wheats1 Reg. Nos. 422 and
423. Crop Science, 3, 457-458.
Campbell, A. B., & Czarnecki, E. (1987). Roblin hard red spring wheat. Canadian Journal of
Plant Science, 67, 803-804.
Campbell, G. M., Rielly, C. D., Fryer, P. J., & Sadd, P. A. (1998). Aeration of bread dough
during mixing: Effect of mixing dough at reduced pressure. Cereal Foods World, 43, 163-
167.

173
Charlton, K. E., Macgregor, E., Vorster, N. H., Levitt, N. S., & Steyn, K. (2007). Partial
replacement of NaCl can be achieved with potassium, magnesium and calcium salts in
brown bread. International Journal of Food Science and Nutrition, 58, 508-521.
Chen, W. Z., & Hoseney, R. C. (1995a). Development of an objective method for dough
stickiness. Lebensmittel-Wissenschaft und- Technologie, 28, 467-473.
Chen, W. Z., & Hoseney, R. C. (1995b). Wheat flour compound that produces sticky dough:
isolation and identification. Journal of Food Science, 60, 434-437.
Chung, K. H., & Pomeranz, Y. (1979). Acid-soluble proteins of wheat flours. II. Binding to
hydrophobic gels. Cereal Chemistry, 56, 196-201.
Collando-Fernandez, M. (2003). Breadmaking processes. In B. Caballero, L. C. Trugo, & P. M.
Finglas (Eds.), Encyclopedia of Food Science and Nutrition Second Edition (pp. 627-634).
San Diego, CA: Academic Press.
Cornell, H. J. (2012). The chemistry and biochemistry of wheat. In S. P. Cauvain (Ed.),
Breadmaking: Improving Quality, Second Edition (pp. 35-76). Cambridge, UK: Woodhead
Publishing Ltd.
Crockett, R., Ie, P., & Vodovotz, Y. (2011). How do xanthan and hydroxypropyl methylcellulose
individually affect the physicochemical properties in a model gluten-free dough. Journal of
Food Science, 76, 274-282.
Czuchajowska, Z., Pomeranz, Y., & Jeffers, H. C. (1989). Water activity and moisture-content of
dough and bread. Cereal Chemistry, 66, 128-132.
Delcour, J. A., Bruneel, C., Derde, L.J., Gomand, S.V., Pareyt, B., Putseys, J.A., Wilderjans, E.,
& Lamberts, L. (2010). Fate of starch in food processing: from raw materials to final food
products. Annual Review of Food Science and Technology, 1, 87-111.
Delcour, J. A., & Hoseney, R. C. (2013a). Proteins of Cereals. In J. A. Delcour and R. C.
Hoseney (Eds.), Principles of Cereal Science and Technology, Third Edition (pp. 53-70).
St. Paul, MN: American Association of Cereal Chemists, Inc.
Delcour, J. A., & Hoseney, R. C. (2013b). Rheology of Dough Batters. In J. A. Delcour and R.
C. Hoseney (Eds.), Principles of Cereal Science and Technology, Third Edition (pp. 87-
96). St. Paul, MN: American Association of Cereal Chemists, Inc.
Delcour, J. A., Joye, I. J., Pareyt, B., Wilderjans, E., Brijs, K., & Lagrain, B. (2012). Wheat
gluten functionality as a quality determinant in cereal-based food products. Annual Review
of Food Science and Technology, 3, 469-492.
Dhaliwal, A. S., Mares, D. J., Marshall, D. R., & Skerritt, J. H. (1988). Protein composition and
pentosan content in relation to dough stickiness of 1B/1R translocation wheats. Cereal
Chemistry, 65, 143-149.

174
Dhaliwal, A. S., Markes, D. J., & Marshall, D. R. (1990). Measurement of dough surface
stickiness associated with the 1B/1R chromosome translocation in bread wheats. Journal of
Cereal Science, 12, 165-175.
Dobraszczyk, B. J. (1997). The rheological basis of dough stickiness. Journal of Texture Studies.
28, 139-162.
Dobraszczyk, B. J., & Morgenstern, M. P. (2003). Rheology and the breadmaking process.
Journal of Cereal Science, 38, 229-245.
Dobraszczyk, B. J., & Salmanowicz, B. P. (2008). Comparison of predictions of baking volume
using large deformation rheological properties. Journal of Cereal Science, 47, 292-301.
D’Ovidio, R., & Masci, S. (2004). The low-molecular-weight glutenin subunits of wheat gluten.
Journal of Cereal Science, 39, 321-339.
Edwards, N. M., Fu, B. X., & Hatcher, D. W. (2012). Quality of western Canadian wheat 2012.
Accessed November 2015. <https://www.grainscanada.gc.ca/wheat-ble/harvest-
recolte/2012/hqww/hqww12-qrbo12-eng.pdf >
Eliasson, A., & Larsson, K. (1993a). Dough. In O. R. Fennema, M. Karel, G. W. Sanderson, S.
R. Tannenbaum, P. Walstra, & J. R. Whitaker (Eds.), Cereals in Breadmaking: a
Molecular Colloidal-Approach (pp. 261-324). New York, NY: Marcel Dekker, Inc.
Eliasson, A., & Larsson, K. (1993b). Physicochemical behavior of the components of wheat
flour. In O. R. Fennema, M. Karel, G. W. Sanderson, S. R. Tannenbaum, P. Walstra, & J.
R. Whitaker (Eds.), Cereals in Breadmaking: a Molecular Colloidal-Approach (pp. 129-
159). New York, NY: Marcel Dekker, Inc.
Elmehdi, H. M., Page, J. H., Scanlon, M. G. (2003). Monitoring dough fermentation using
acoustic waves. Food and Bioproducts Processing, 81, 217-223.
Farahnaky, A., & Hill, S. E. (2007). The effect of salt, water and temperature on wheat dough
rheology. Journal of Texture Studies, 38, 499-510.
Fessas, D., & Schiraldi, A. (2001). Water properties in wheat flour dough. I: Classical
thermogravimetric approach. Food Chemistry, 72, 237-244.
Finney, K. F., & Barmore, M. D. (1948). Loaf volume and protein content of hard winter and
spring wheats. Cereal Chemistry, 25, 291-312.
Fox, S. L., Townley-Smith, T. F., Thomas, J. B., Humphreys, D. G., Brown, P. D., McCallum,
B. D., Fetch, T. G., Menzies, J.G., Gilbert, J. A., Fernandez, M. R., Gaudet, D. A., & Noll,
J. S. (2010). Harvest hard red spring wheat. Canadian Journal of Plant Science, 90, 503-
509.
Fu, B. X, & Sapirstein, H. D. (1996). Procedure for isolating monomeric proteins and polymeric
glutenin of wheat flour. Cereal Chemistry, 73, 143-152.

175
Gennadios, A., Weller, C. L., & Testin, R. F. (1993). Modification of physical and barrier
properties of edible wheat gluten-based films. Cereal Chemistry, 70, 426-429.
Goesaert, H., Brijs, W.S., Veraverbeke, C. M., Gerbruers, K., & Delcour, J. A. (2005). Wheat
flour constituents: how they impact quality, and how to impact their functionality. Trends
in Food Science & Technology, 16, 12-30.
Gore, P. J. (1991). An update on sticky doughs. In D. J. Martin & C. W. Wrigley (Eds.), Cereals
International Proceedings (pp. 228-230). Brisbane, Australia.
Graf, R. J., Hucl, P., Orshinsky, B. R., & Kartha, K. K. (2003). McKenzie hard red spring wheat.
Canadian Journal of Plant Science, 83, 565-569.
Graybosch, R. A., Peterson, C. J., Hansen, L. E., Worrall, D., Shelton, D. R., & Lukaszewski, A.
(1993). Comparative flour quality and protein characteristics of 1BL/1RS and 1AL/1RS
wheat-rye translocation lines. Journal of Cereal Science, 17, 95-106.
Gupta, R. B., Batey, I. L., & MacRitchie, F. (1992). Relationships between protein composition
and functional properties of wheat flours. Cereal Chemistry, 69, 125-131.
Hammed, A. M., Ozsisli, B., Ohm, J. B., & Simsek, S. (2015). Relationship between solvent
retention capacity and protein molecular weight distribution, quality characteristics, and
breadmaking functionality of hard red spring wheat flour. Cereal Chemistry, 92, 466-474.
Hazelton, J. L., & Walker, C. E. (1997). Mixograph measurements and objective absorption
determination. In C. E. Walker, J. L. Hazelton, & M. D. Shorgen (Eds.) Mixograph
Handbook, First Edition (pp. 27-28). Lincoln, NE, USA: National Manufacturing Division,
TMCO.
He, H., Roach, R. R., & Hoseney, R. C. (1992). Effect of nonchaotropic salts on flour bread-
making properties. Cereal Chemistry, 69, 366-371.
Health Canada. (2012). Guidance for the food industry on reducing sodium in processed foods.
Bureau of Nutritional Sciences, Food Directorate, Health Products and Food Branch. Pp 1-
63 <www.hc-sc.gc.ca/fn-an/alt_formats/pdf/legislation/guide-ld/2012-sodium-reduction-
indust-eng.pdf>
Henry, R. J., Martin, D. J., & Stewart, B. G. (1989). Cell-wall polysaccharides of rye-derived
wheats: investigations of the biochemical causes of dough stickiness. Food Chemistry, 34,
309-316.
Hlynka, I. (1962). Influence of temperature, speed of mixing, and salt on some rheological
properties of dough in the farinograph. Cereal Chemistry, 39, 286-303.
Holmes, J. T., & Hoseney, R. C. (1987). Chemical leavening: effect of pH and certain ions on
breadmaking properties. Cereal Chemistry, 64, 343-348.
Hoseney, R. C. (1998a). Drying milling of cereals. In R. C. Hoseney (Ed.), Principles of Cereal
Science and Technology, Second Edition (pp. 125-145). St. Paul, MN: American
Association of Cereal Chemists, Inc.

176
Hoseney, R. C. (1998b). Gluten proteins. In R. C. Hoseney (Ed.), Principles of Cereal Science
and Technology, Second Edition (pp. 197-211). St. Paul, MN: American Association of
Cereal Chemists, Inc.
Hoseney, R. C. (1998c). Minor constituents of cereals. In R. C. Hoseney (Ed.), Principles of
Cereal Science and Technology, Second Edition (pp. 81-101). St. Paul, MN: American
Association of Cereal Chemists, Inc.
Hoseney, R. C. (1998d). Proteins of cereals. In R. C. Hoseney (Ed.), Principles of Cereal Science
and Technology, Second Edition (pp. 65-79). St. Paul, MN: American Association of
Cereal Chemists, Inc.
Hoseney, R. C. (1998e). Yeast-leavened products . In R. C. Hoseney (Ed.), Principles of Cereal
Science and Technology, Second Edition (pp. 229-273). St. Paul, MN: American
Association of Cereal Chemists, Inc.
Hoseney, R. C., & Smewing, J. (1999). Instrumental measurement of stickiness of doughs and
other foods. Journal of Texture Studies, 30, 123-136.
Israr, T., Rakha, A., Sohail, M., Rashid, S., Shehzad, A. (2016). Salt reduction in baked products:
strategies and constraints. Trends in Food Science & Technology, 51, 98-105.
Janssen, A. M., van Vliet, T., & Vereijken, J. M. (1996). Rheological behaviour of wheat glutens
at small deformations. Effect of gluten composition. Journal of Cereal Science, 23, 33-42.
Jekle, M., & Becker, T. (2011). Dough microstructure: novel analysis by quantification using
confocal laser scanning microscopy. Food Research International, 44, 984-991.
Joffres, M. R., Campbell, N. R., Manns, B., & Tu, K. (2007). Estimate of the benefits of a
population-based reduction in dietary sodium additives on hypertension and its related
health care costs in Canada. Canadian Journal of Cardiology, 23, 437-43.
Joye, I. J., Lagrain, B., & Delcour, J. A. (2009).Use of chemical redox agents and exogenous
enzymes to modify the protein network during breadmaking-a review. Journal of Cereal
Science, 50, 11-21.
Kaur, A., Bala, R., Singh, B., & Rehal, J. (2011). Effect of replacement of sodium chloride with
mineral salts on rheological characteristics of wheat flour. American Journal of Food
Technology, 6, 674-684.
Khatkar, B. S., Bell, A. E., & Schofield. (1995). The dynamic rheological properties of glutens
and gluten sub-fractions from wheats of good and poor bread making quality. Journal of
Cereal Science, 22, 29-44.
Khatkar, B. S., Bell, A. E., & Schofield, J. D. (1996). A comparative study of the inter-
relationships between mixograph parameters and bread-making qualities of wheat flours
and glutens. Journal of the Science of Food and Agriculture, 72, 71-85.
Kinsella, J. E., & Hale, M. L. (1984). Hydrophobic associations of gluten consistency: effects of
specific anions. Journal of Agricultural and Food Chemistry, 32: 1054-1056.

177
Kunz, W. (2010). Specific ion effects in colloidal and biological systems. Current Opinion in
Colloid & Interface Science, 15, 34-39.
Kweon, M., Slade, L., & Levine, H. (2011). Solvent retention capacity (SRC) testing of wheat
flour: principles and value in predicting flour functionality in different wheat-based food
processes and in wheat breeding- a review. Cereal Chemistry, 88, 537-552.
Lai, H., & Lin, T. (2006). Bakery products. In Y. H. Hui (Ed), Handbook of Food Science,
Technology, and Engineering, Volume Four (Ch. 148, pp.1-52). Boca Ranton, FL: CRC
Press.
Landry, J., & Delhaye, S. (1993). Determination of tryptophan in feedstuffs: comparison of
sodium hydroxide and barium hydroxide as hydrolysing agents. Food Chemistry, 49, 95.
Larsson, H. (2002). Effect of pH and sodium chloride on wheat flour dough properties:
ultracentrifugation and rheological measurements. Cereal Chemistry, 79, 544-545.
Lasztity, R., & Abonyi, T. (2009). Prediction of wheat quality-past, present, future. A review.
Food Reviews International, 25, 126-141.
Letang, C., Piau, M., & Verdier, C. (1999). Characterization of wheat flour-water doughs. Part I:
rheometry and microstructure. Journal of Food Engineering, 41, 121-132.
Linko, P., Harkonen, H., & Linko, Y. -Y. (1984). Effects of sodium chloride in the processing of
bread baked from wheat, rye and barley flours. Journal of Cereal Science, 2, 53-62.
Lu, Z., & Seetharaman, K. (2013). 1H Nuclear magnetic resonance (NMR) and differential
scanning calorimetry (DSC) studies of water mobility in dough systems containing barley
flour. Cereal Chemistry, 90, 120-126.
Lynch, E. J., Dal Bello, F., Sheehan, E. M., Cashman, K. D., & Arendt, E. K. (2009).
Fundamental studies on the reduction of salt on dough and bread characteristics. Food
Research International. 42, 885-891.
Mak, S. P. C. (2009). Impact of sodium chloride on wheat doughs. (Doctoral dissertation).
University of Nottingham, Sutton Bonington Campus Loughborough, UK.
Marsh, D., & Cauvain, S. P. (2007). Mixing and dough processing. In S. P. Cauvain & L. S.
Young (Eds.), Technology of Breadmaking, Second Edition (pp. 93-140). New York, NY:
Springer.
Mattes, R. D., & Donnelly, D. (1991). Relative contributions of dietary sodium sources. Journal
of the American College of Nutrition, 10, 383-93.
McCann, T. H., & Day, Li. (2013). Effect of sodium chloride on gluten network formation,
dough microstructure and rheology in relation to breadmaking. Journal of Cereal Science,
57, 444-452.
McLeish, T. C. B., & Larson, R. G. (1998). Molecular constitutive equations for a class of
branched polymers: The pom-pom polymer. Journal of Rheology, 42, 81-110.

178
Meerts, M., Cardinaels, R., Oosterlink, F., Courtin, C. M., & Moldenaers, P. (2017). The
interplay between the main flour constituents in the rheological behaviour of wheat flour
dough. Food and Bioprocess Technology, 10, 249-265.
Melnyk, J. P., Dreisoerner, J., Bonomi, F., Marcone, M. F., & Seetharaman, K. (2011). Effect of
the Hofmeister series on gluten aggregation measured using a high shear-based technique.
Food Research International, 44, 893-896.
Miller, R. A., & Hoseney, R. C. (2008). Role of salt in baking. Cereal Foods World, 53, 4-6.
Mondal, A., & Datta, A. K. (2008). Bread baking-a review. Journal of Food Engineering, 86,
465-474.
Moore, T. R. (2004). Breads. In C. Wrigley, H. Corke, C. E. Walker (Eds.), Encyclopedia of
Grain Science (pp. 108-119). New York, NY, Academic Press.
Naeem, H. A., & Sapirstein, H. D. (2007). Ultra-fast separation of wheat glutenin subunits by
reversed-phase HPLC using a superficially porous silica-based column. Journal of Cereal
Science, 46, 157-168.
Navickis, L. L., Anderson, R. A., Bagley, E. B., & Jasberg, B. K. (1982). Viscoelastic properties
of wheat flour doughs: variation of dynamic moduli with water and protein content.
Journal of Texture Studies, 13, 249-264.
Oates, C. G. (2001). Bread microstructure. In P. Chinachoti & Y. Vodovotz (Eds.), Bread Staling
(pp. 149-162). Boca Raton, FL: CRC Press LLC.
Payne, P. I. (1987). Genetics of wheat storage proteins and the effect of allelic variation on
bread-making quality. Annual Review of Plant Physiology, 38, 141-153.
Peighambardoust, S. H., van der Goot, A. J., van Vliet, T., Hamer, R. J., & Boom, R. M. (2006).
Microstructure formation and rheological behaviour of dough under simple shear flow.
Journal of Cereal Science, 43, 183-197.
Petrofsky, K. E., & Hoseney, R. C. (1995). Rheological properties of dough made with starch
and gluten from several cereal sources. Cereal Chemistry, 72, 53-58.
Preston, K. R. (1989). Effects of neutral salts of the lyotropic series on the physical dough
properties of a Canadian red spring wheat flour. Cereal Chemistry, 66, 144-148.
Puppo, M. C., Calvelo, A., & Añón, M. C. (2005). Physicochemical and rheological
characterization of wheat flour dough. Cereal Chemistry, 82, 173-181.
Ramachandran, A., Hucl, P., & Briggs, C. (2016). Functional characteristics of bread wheat
(Triticum aestivum L.) near-isogenic lines differing at the Waxy (Wx) locus. Cereal
Chemistry, 93, 77-85.
Roozendaal, H., Abu-hardan, M., & Frazier, R. A. (2012). Thermogravimetric analysis of water
release from wheat flour and wheat bran suspensions. Journal of Food Engineering, 111,
606-611.

179
Salovaara, H. (1982a). Effect of partial sodium chloride replacement by other salts on wheat
dough rheology and breadmaking. Cereal Chemistry, 59, 422-426.
Salovaara, H. (1982b). Sensory limitations to replacement of sodium with potassium and
magnesium in bread. Cereal Chemistry, 59, 427-430.
Salvador, A., Sanz, T., & Fiszman, S. M. (2006). Dynamic rheological characteristics of wheat
flour-water doughs. Effect of adding NaCl, sucrose and yeast. Food Hydrocolloids, 20,
780-786.
Sapirstein, H. D., & Fu, B. X. (1998). Intercultivar variation in the quantity of monomeric
proteins, soluble and insoluble glutenin, and residue protein in wheat flour and
relationships to breadmaking quality. Cereal Chemistry, 75, 500-507.
Scanlon, M. G., & Zghal, M. C. (2001). Bread properties and crumb structure. Food Research
International, 34, 841-864.
Singh, N., Gujral, H. S., & Singh. J. (2002). Effect of baking ingredients and mixing duration on
dough development, gas release and bread making properties. Journal of Food Quality, 25,
305-315.
Singh, H., & MacRitchie, F. (2001). Application of polymer science to properties of gluten.
Journal of Cereal Science, 33, 231-243.
Sliwinski, E. L., Kolster, P., Prins, A., & van Vliet, T. (2004). On the relationship between
gluten protein composition of wheat flours and large-deformation properties of their
doughs. Journal of Cereal Science, 39, 247-264.
Southan, M., & MacRitchie, F. (1999). Molecular weight distribution of wheat proteins. Cereal
Chemistry, 76, 827-836.
Stable Micro Systems. (2005). Methodology for dough and gluten extensibility measurement
using the Kieffer rig. In Kieffer dough & gluten extensibility rig user guide (pp. 13-19).
Stable Micro Systems.
Stauffer, C. E. (2007). Principles of dough formation. In S. P. Cauvain & L. S. Young (Eds.),
Technology of Breadmaking, Second Edition (pp. 299-332). New York, NY: Springer. 55
Steffolani, M. E., Ribotta, P. D., Pérez, G. T., & Léon, A. E. (2010). Effect of glucose oxidase,
transglutaminase, and pentosanase on wheat proteins: relationship with dough properties
and bread-making quality. Journal of Cereal Science, 51, 366-373.
Steffolani, M. E., Ribotta, P. D., Perez, G. T., & Leon, A. E. (2012).Combinations of glucose
oxidase, α-amylase and xylanase affect dough properties and bread quality. International
Journal of Food Science & Technology, 47, 525-534.
Suchy, J., Lukow, O. M., & Fu, B. X. (2003). Quantification of monomeric and polymeric wheat
proteins and the relationship of protein fractions to wheat quality. Journal of the Science of
Food and Agriculture, 83, 1083-1090.

180
Švec, I., Hrušková, M., Karas, J., & Hofmanová, T. (2012). Solvent retention capacity for
different wheats and flours evaluation. Czech Journal of Food Sciences, 30, 429-437.
Tseng, C. S., & Lai, H. -M. (2002). Physicochemical properties of wheat flour dough modified
by microbial transglutaminase. Journal of Food Science: Food Engineering and Physical
Properties, 67, 750-755.
Tsilo, T. J., Nygard, G., Khan, K., Simsek, S., & Hareland, G. A. (2013). Molecular genetic
mapping of QTL associated with flour water absorption and farinograph related traits in
bread wheat. Euphytica, 194, 293-302.
Tuhumury, H. C. D., Small, D. M., & Day, L. (2014). The effect of sodium chloride on gluten
network formation and rheology. Journal of Cereal Science, 60, 229-237.
Tuhumury, H. C. D., Small, D. M., & Day, L. (2016a). Effects of Hofmeister salt series on
gluten network formation: part I. cation series. Food Chemistry, 212, 789-797.
Tuhumury, H. C. D., Small, D. M., & Day, L. (2016b). Effects of Hofmeister salt series on
gluten network formation: part II. anion series. Food Chemistry, 212, 798-806.
Uthayakumaran, S. (2011). Salt reduction in wheat-based foods-technical challenges and
opportunities. Food Australia, 63, 137-140.
Uthayakumaran, S., & Lukow, O. M. (2003). Functional and multiple end-use characterisation of
Canadian wheat using a reconstituted dough system. Journal of the Science of Food and
Agriculture, 83, 889-898.
Uthayakumaran, S., Newberry, M., Keentok, M., Stoddard, F. L., & Bekes, F. (2000). Basic
rheology of bread dough with modified protein content and glutenin-to-gliadin ratios.
Cereal Chemistry, 77, 744-749.
Van Der Borght, A., Goesaert, H., Veraverbeke, W. S., & Delcour, J. A. (2005). Fractionation of
wheat and wheat flour into starch and gluten: overview of the main processes and the
factors involved. Journal of Cereal Science, 41, 221-237.
van Velzen, E. J. J., van Duynhoven, J. P. M., Pudney, P., Weegels, P. L., & van der Maas, J. H.
(2003). Factors associated with dough stickiness as sensed by attenuated total reflectance
infrared spectroscopy. Cereal Chemistry, 80, 378-382.
Veraverbeke, W. S., & Delcour, J. A. (2002). Wheat protein composition and properties of wheat
glutenin in relation to breakmaking functionality. Critical Reviews in Food Science and
Nutrition, 42, 179-208.
Walker, A. E., & Walker, C. E. (2004). MIXSMART® for Windows computerized data
acquisition and analysis for the mixograph. Lincoln, NE, USA: National Manufacturing
Division.
Wang, F. C., & Sun, X. S. (2002). Creep-recovery of wheat flour doughs and relationship to
other physical dough tests and breadmaking performance. Cereal Chemistry, 79, 567-571.

181
Wang, S. M., Watts, B. M., Lukow, O. M., Schlichting, L., & Bushuk, W. (1996). Dough
profiling: an instrumental method for dough stickiness measurement. Cereal Chemistry,
73, 445-451.
Wheat Marketing Center. (2008). Wheat and Flour Testing Methods: A Guide to Understanding
Wheat and Flour Quality, Version two, Kansas State University.
White, J. A., Hart, R. J., & Fry, J. C. (1986). An evaluation of the waters pico-tag system for the
amino-acid analysis of food materials. Journal of Automatic Chemistry, 8, 170-177.
Wieser, H. (2007). Chemistry of gluten proteins. Food Microbiology, 24, 115-119.
Yi, J., Kerr, W. L., & Johnson, J. W. (2009). Effects of waxy wheat flour and water on frozen
dough and bread properties. Journal of Food Science, 74, E278-E284.
Yovchev, A. G., Briggs, C., Stone, A. K., Hucl, P., Nickerson, M. T., & Scanlon, M. G. (2017).
Effect of salt reduction on dough handling and the bread making quality of Canadian
Western Red Spring wheat varieties. Cereal Chemistry. https://doi.org/10.1094/CCHEM-
02-17-0026-R
Zeller, F. J., Gunzel, G., Fischbeck, G., Gerstenkorn, P., & Weipert, D. (1982). Alterations to
baking of wheat caused by the 1B/1R wheat-rye chromosome translocation. Getreide, Mehl
und Brot, 36, 141-143.
Zghal, M. C., Scanlon, M. G., & Sapirstein, H. D. (1999). Prediction of bread crumb density by
digital image analysis. Cereal Chemistry, 76, 734-742.
Zghal, M. C., Scanlon, M. G., & Sapirstein, H. D. (2001). Effects of flour strength, baking
absorption, and processing conditions on the structure and mechanical properties of bread
crumb. Cereal Chemistry, 78, 1-7.