Embed Size (px)
Citation preview
Investigating shopping choice preferences in Helsinki and Tampere urban regions
Ari HyvönenJames CulleySimo Syrman
Aims of the research
• Investigating specialty shopping preferences• The goal is to study the spatial dependencies of the
choice orientation
Research outline
• Choice orientations– Principal component analysis (PCA) for questionnaire data
• Choice orientation and socio-economic variables– MANOVA to study the relationship
• Spatial dependency– PCA and cluster analysis to classify urban structure
Choice orientation - PCA
• Data from ”Shopping centers as a part of sustainable consumption and urban structure” –project– Total of 24 000 questionnaires were send out to a random
sample of house holds in Helsinki metropolitan area (HMA) and Tampere region in 2009
• Total response rate was 26,2 % (6294)– HMA 4582 and Tampere 1712
• PCA for the 28 questions concerning choice orientation– 7 orthogonally rotated components– Explains 64.7 % of the variance
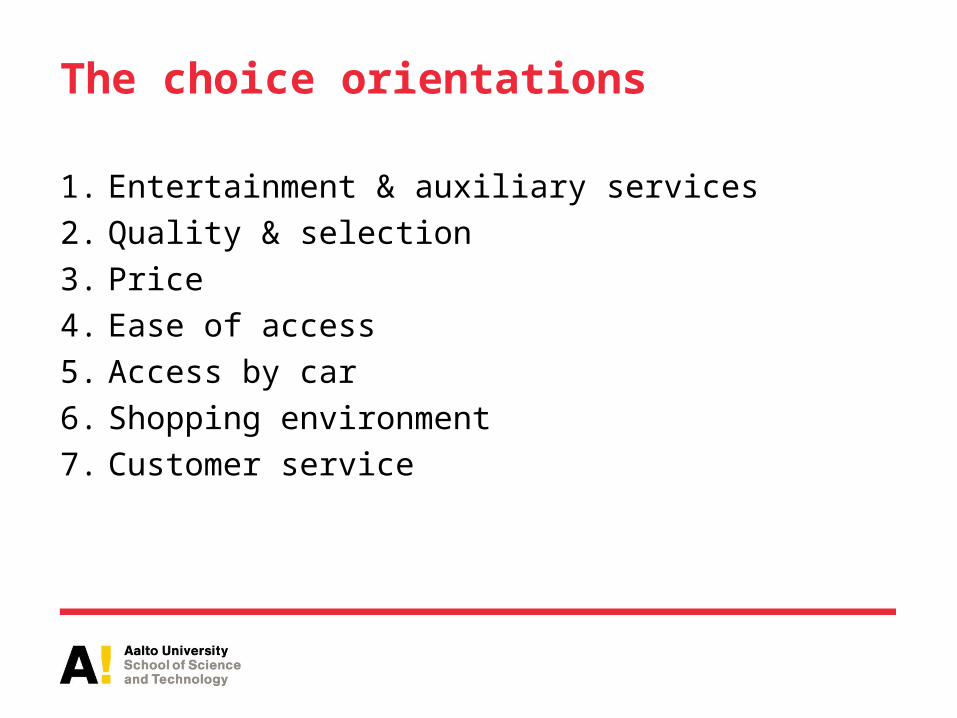
The choice orientations
1. Entertainment & auxiliary services
2. Quality & selection
3. Price
4. Ease of access
5. Access by car
6. Shopping environment
7. Customer service
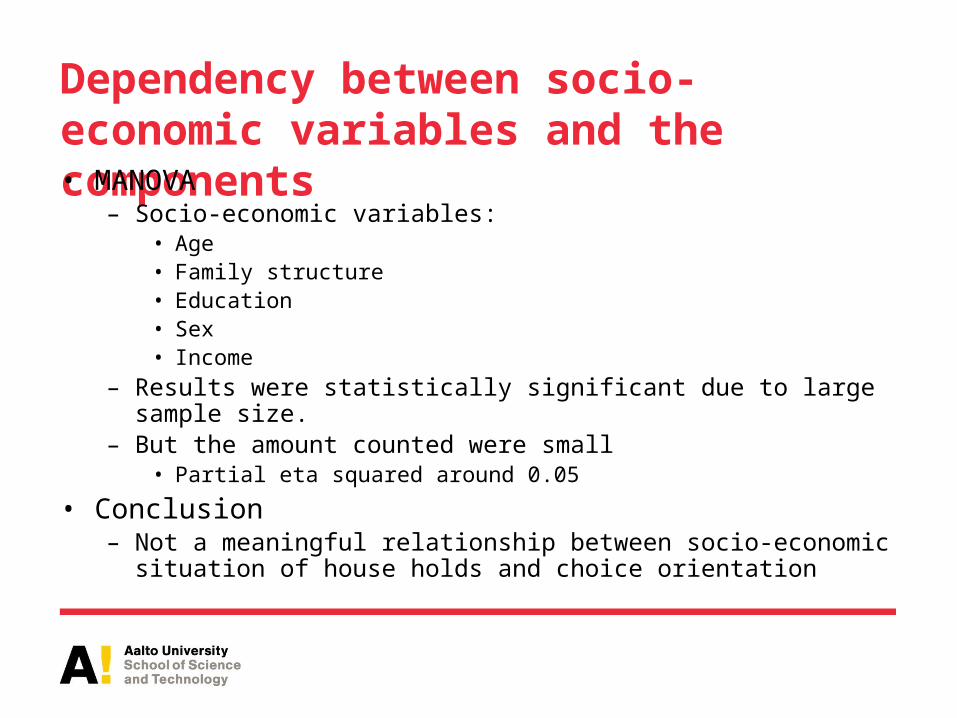
Dependency between socio-economic variables and the components• MANOVA
– Socio-economic variables:• Age• Family structure• Education• Sex• Income
– Results were statistically significant due to large sample size.– But the amount counted were small
• Partial eta squared around 0.05
• Conclusion– Not a meaningful relationship between socio-economic situation of
house holds and choice orientation
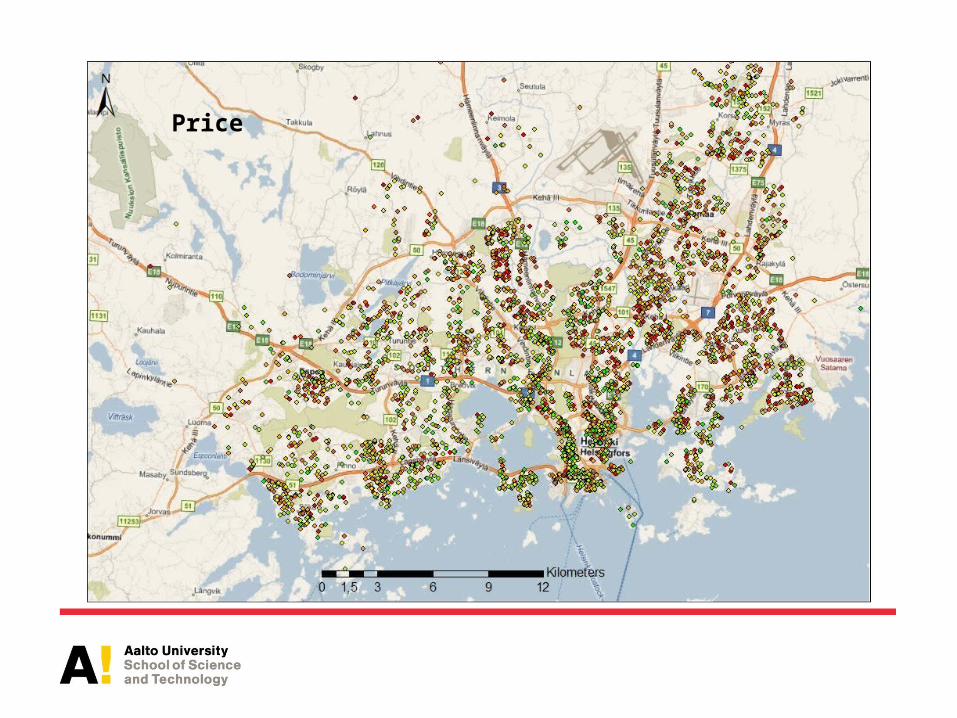
Price
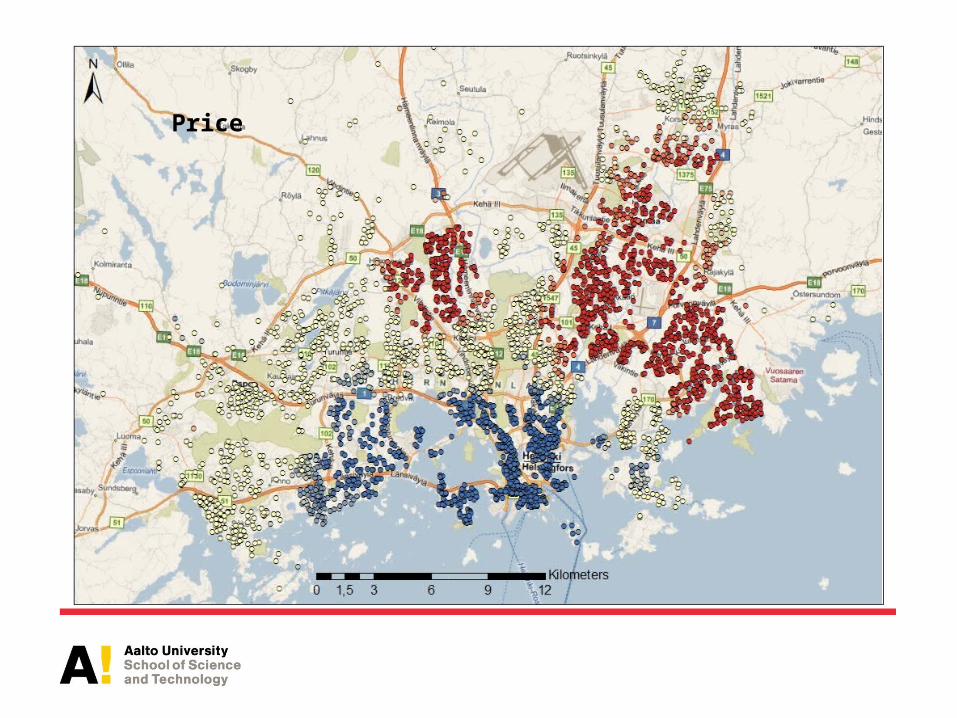
Price
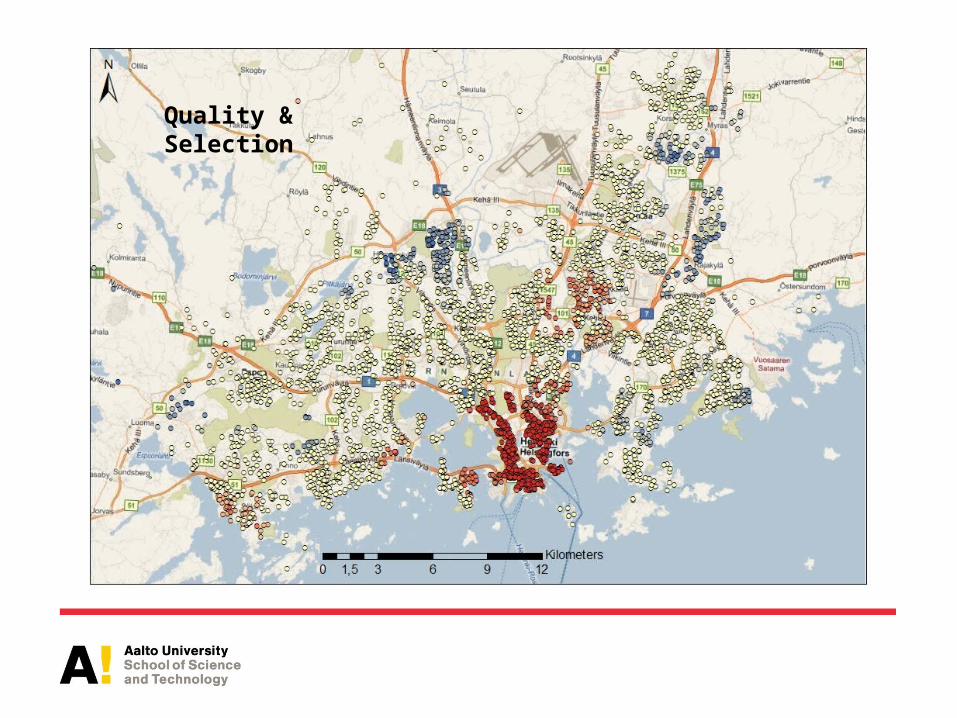
Quality & Selection
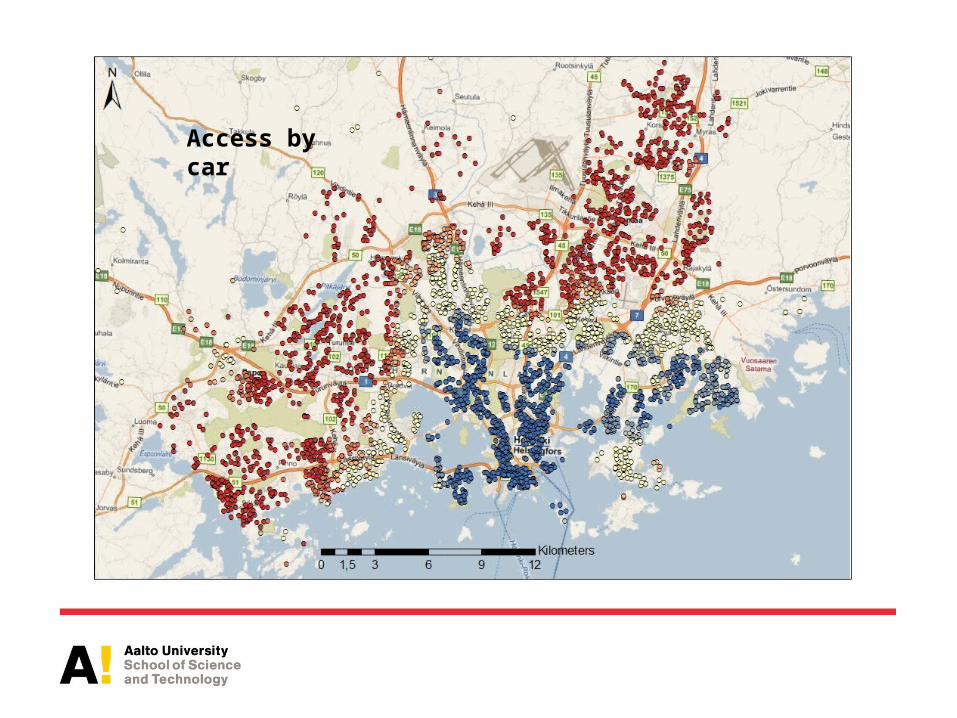
Access by car
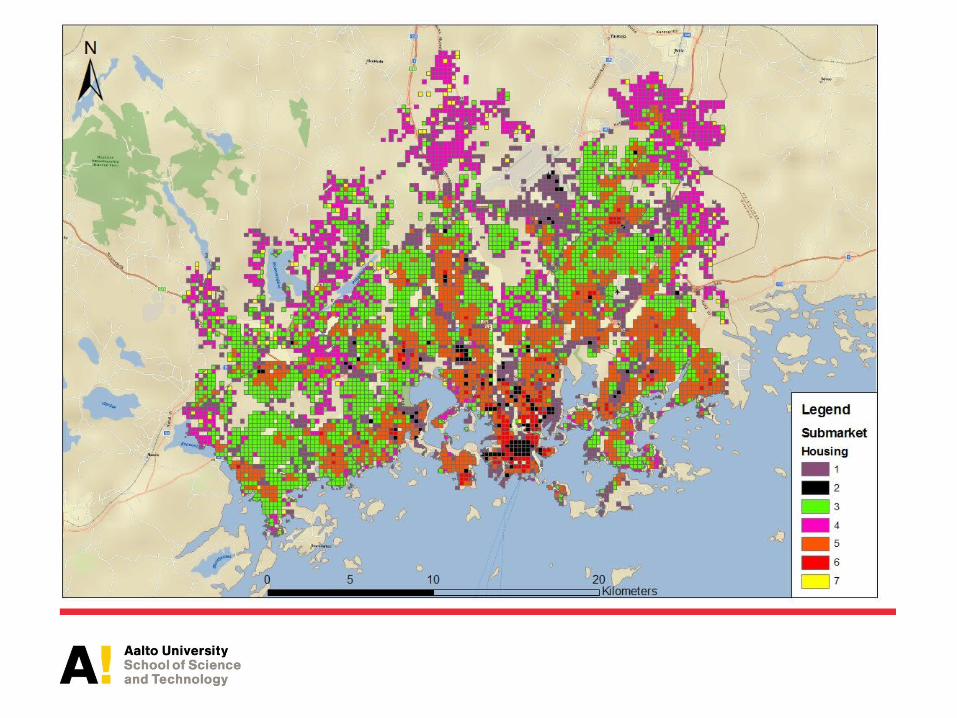
Urban segments
• Grid data (250 x 250 m)– Distance to nearest shopping center – Population density– Number of flats– Square meters per person– Number of workplaces
• PCA with Varimax -rotation– 3 components
• Cluster analysis– CLARA– Silhouette value
• Result: 7 clusters
Depedency
• Discriminant analysis (DA)– Responders were classified by the basis of the urban
segmentation grid– The aim of DA was to verify and study the classification of the
responders– Results:
• The most significant component was the access by car– Price and Entertainment & auxiliary service were also significant
• But in practice not meaningful
Tampere region
• Same analysis as for HMA– Discovered choice orientations were slightly different
• Latent structure of the PCA
– Most likely cause is the differences in public transportation network
• Discriminant analysis revealed only one statistically significant component– The public transportation component
Conclusion
• There is a dependency between choice orientation and urban structure in specialty shopping– The house holds which are located in densely populated areas
households prefer accessibility by public transportation when choosing the area for specialty shopping.
– And vice versa