Embed Size (px)
Citation preview
Investigating Error Metrics for Satellite Rainfall Data at HydrologicallyRelevant Scales
FAISAL HOSSAIN
Department of Civil and Environmental Engineering, Tennessee Technological University, Cookeville, Tennessee
GEORGE J. HUFFMAN
Science Systems and Applications, Inc., and Laboratory for Atmospheres, NASA Goddard Space Flight Center, Greenbelt, Maryland
(Manuscript received 25 April 2007, in final form 29 October 2007)
ABSTRACT
This paper addresses the following open question: What set of error metrics for satellite rainfall data canadvance the hydrologic application of new-generation, high-resolution rainfall products over land? Theauthors’ primary aim is to initiate a framework for building metrics that are mutually interpretable byhydrologists (users) and algorithm developers (data producers) and to provide more insightful informationon the quality of the satellite estimates. In addition, hydrologists can use the framework to develop aspace–time error model for simulating stochastic realizations of satellite estimates for quantification of theimplication on hydrologic simulation uncertainty. First, the authors conceptualize the error metrics in threegeneral dimensions: 1) spatial (how does the error vary in space?); 2) retrieval (how “off” is each rainfallestimate from the true value over rainy areas?); and 3) temporal (how does the error vary in time?). Theysuggest formulations for error metrics specific to each dimension, in addition to ones that are already widelyused by the community. They then investigate the behavior of these metrics as a function of spatial scaleranging from 0.04° to 1.0° for the Precipitation Estimation from Remotely Sensed Information UsingArtificial Neural Networks (PERSIANN) geostationary infrared-based algorithm. It is observed that mov-ing to finer space–time scales for satellite rainfall estimation requires explicitly probabilistic measures thatare mathematically amenable to space–time stochastic simulation of satellite rainfall data. The probabilityof detection of rain as a function of ground validation rainfall magnitude is found to be most sensitive toscale followed by the correlation length for detection of rain. Conventional metrics such as the correlationcoefficient, frequency bias, false alarm ratio, and equitable threat score are found to be modestly sensitiveto scales smaller than 0.24° latitude/longitude. Error metrics that account for an algorithm’s ability tocapture rainfall intermittency as a function of space appear useful in identifying the useful spatial scales ofapplication for the hydrologist. It is shown that metrics evolving from the proposed conceptual frameworkcan identify seasonal and regional differences in reliability of four global satellite rainfall products over theUnited States more clearly than conventional metrics. The proposed framework for building such errormetrics can lay a foundation for better interaction between the data-producing community and hydrologistsin shaping the new generation of satellite-based, high-resolution rainfall products, including those beingdeveloped for the planned Global Precipitation Measurement (GPM) mission.
1. Introduction
Rainfall is a critical input for hydrologic models thatpredict the makeup of the hydrologic state over land.Because rainfall is intermittent, accurate modeling ofthe dynamic surface hydrologic state requires accurate
rainfall data at the highest possible resolution. How-ever, as in situ networks for rainfall measurements con-tinue to decline worldwide (Stokstad 1999; Shiklo-manov et al. 2002), spaceborne global observations arethe only viable means to promote our understanding ofterrestrial hydrology over the vast regions that are un-gauged (Hossain and Lettenmaier 2006).
The global importance of satellite-derived rainfallhas led to the development and accuracy assessment ofan increasing number of satellite-based rainfall prod-ucts to meet the needs of various users. Anagnostou
Corresponding author address: Faisal Hossain, Department ofCivil and Environmental Engineering, Tennessee TechnologicalUniversity, 1020 Stadium Drive, Cookeville, TN 38505-0001.E-mail: [email protected]
JUNE 2008 H O S S A I N A N D H U F F M A N 563
DOI: 10.1175/2007JHM925.1
© 2008 American Meteorological Society
JHM925

(2004) provides a detailed synopsis of the evolution ofcurrent satellite-estimation techniques over land, whileEbert et al. (2007) summarize several “high-resolutionrainfall products” that are currently available via theInternet. Generally, the satellite data and hydrologiccommunities tend to characterize the accuracy of rain-fall data using metrics such as bias, correlation coeffi-cient, and standard deviation of “error.” Additionalmeasures, such as critical success index (CSI), Heidkeskill score (HSS; Heidke 1926), equitable threat score(ETS), and false alarm ratio (FAR; Ebert et al. 2007)have seen use in the meteorological community en-gaged in forecasting (e.g., the National Weather Serviceor the European Centre for Medium-Range WeatherForecasts). These measures have proved useful in as-sessing satellite rainfall algorithms at scales pertinentfor climate modeling, weather prediction, or even large-scale water management studies. However, with theplanned Global Precipitation Measurement (GPM)mission (Smith et al. 2007) and the continued shift to-ward hydrologically more relevant scales (5–10 km andhourly), there is an urgent need to investigate metricsthat can more effectively advance the use of satellitealgorithms for hydrology over land, among other uses(Huffman et al. 2004; Lee and Anagnostou 2004). Hos-sain and Lettenmaier (2006) have argued that a shift inparadigm is needed to properly assess estimates of rain-fall from satellite sensors for modeling of dynamic hy-drologic phenomenon such as flood prediction. Amongthe many issues that require the exercise of caution, onethat bears critical importance is the uncertainties in sat-ellite-estimated rainfall that cascade nonlinearlythrough the simulation of the terrestrial hydrologic pro-cesses (Nijssen and Lettenmaier 2004). This nonlineareffect is difficult to model because of the prominentdiscontinuities of the rainfall process in space and timethat are observed as scales become smaller.
Recognizing the need for assessment of uncertaintyfor the new generation of high-resolution precipitationproducts (HRPP), several recent studies have com-pared the accuracy of various satellite rainfall productsover land. For example, Ebert et al. (2007), as a con-tribution to the International Precipitation WorkingGroup (IPWG), assessed six widely available HRPPusing an array of error metrics currently used by thecommunity. Hong et al. (2006) have evaluated an infra-red satellite-estimation technique for hydrologic appli-cations using error conceptualizations initiated byNorth and Nakamoto (1989) and subsequently formal-ized by Steiner et al. (2003). Other examples of evalu-ating satellite rainfall uncertainty include McCollum etal. (2002) on the assessment of bias, Gebremichael andKrajewski (2005, 2004) on sampling errors, and Ali et
al. (2005) on satellite error functions for the Sahel re-gion.
While these and other studies of satellite rainfall un-certainty have advanced the application of HRPP interrestrial hydrology to some extent, some issues con-tinue to remain open. For example, many studies treaterror as a unidimensional measure and use power-law-type relationships or models for estimating this aggre-gate error as a function of spatial and temporal sam-pling parameters (Moradkhani et al. 2006; Hong et al.2006; Steiner et al. 2003). Such frameworks are accept-able for estimating the average error over an areal do-main, but they do not have explicit representation ofthe space–time covariance structure of the estimationerror, which can have significant implications in thesimulation of the terrestrial hydrologic processes (Hos-sain and Anagnostou 2005). Also, most studies, such asthat of Ebert et al. (2007), have typically addresseduncertainty at daily or larger time scales, which aresomewhat coarse for resolving the evolution of the dy-namic hydrologic state over land (e.g., for floods andsoil moisture).
In this paper, we address the following open ques-tion: What set of error metrics for satellite rainfall datacan advance the hydrologic application of new-generation HRPP over land? The satellite rainfall dataproducing community have long recognized that infor-mation on the reliability of satellite rainfall estimates isvaluable to a wide range of users. Yet the definition ofacceptable skill in the satellite data is relative to thenature of the application. Ebert et al. (2007, p. 49) pro-vide a lucid perspective on the diverse accuracy re-quirements. Our initial question leads us to pose a set ofadditional questions: What should be the characteristicsof error metrics at hydrologically relevant scales? Howshould they be designed so that they are convenientlyinterpretable by both data producing and hydrologiccommunities? How should these metrics be packagedinto standard satellite data products for best use in hy-drologic modeling and decision making?
Clearly, these questions require error expressionsthat capture mean behavior accounting for space–timecorrelations and intermittency in the estimated rainfallfields. Hence, for the hydrologist, error should be de-fined in terms of the rainfall and tagged to a given spaceand time scale. We therefore conceptualize that theerror metrics should be associated, at a minimum, withthree general dimensions: 1) spatial (how does the errorvary in space?); 2) retrieval (how “off” is the rainfallestimate from the true value over rainy areas?); and 3)temporal (how does the error vary in time?).
As with any modeling exercise, there is probably nounique way of representing error completely. But, we
564 J O U R N A L O F H Y D R O M E T E O R O L O G Y VOLUME 9
note that studies of uncertainty in hydrologic predictionhave usually evolved independently of efforts to char-acterize uncertainty in remote sensing estimates of rain-fall. In this study, our aim is therefore to initiate a com-mon framework for building error metrics. In particu-lar, we are motivated to build such a frameworkcomprising multidimensional metrics that can be math-ematically transformed into a model for simulating sto-chastic realizations of satellite rainfall data for a givensatellite rainfall algorithm. There are several math-ematical error models today (e.g., Steiner 1996; Steineret al. 2003; Hong et al. 2006) that can yield such sto-chastic realizations of simulated rainfall. However,there seems to be none, to the best of our knowledge,that remain conceptually flexible enough to investigateinclusion of additional, or modification of, error metricsfor a given application.
We also emphasize that our framework is intended toaugment the commonly used metrics (e.g., correlation,bias, RMSE, etc.) in order to provide a better assess-ment of algorithms at hydrologically relevant scales. Insection 2, we introduce a set of error metrics that wasfirst formalized by Hossain and Anagnostou (2006).Overviews of the study region and rainfall datasets (ref-erence and satellite) are provided in section 3. In sec-tion 4, we present our error assessment across hydro-logically relevant spatial scales ranging from 0.04° to1.0° of latitude/longitude for a particular satellite-basedset of rainfall estimates. The implications of these re-sults on data use are discussed, along with the chal-lenges ahead in developing more robust metrics for op-erational data products. Finally, in section 5, we sum-marize the major findings and recommend future work.While rainfall is our primary focus, the techniques thatare described here are general enough to be applied tothe broader spectrum comprising precipitation.
2. Error metrics for satellite rainfall
In section 1 we hypothesized that error metricsshould quantify, at a minimum, three specific dimen-sions related to rainfall intermittency. We address thisconcept using the error-modeling approach first out-lined by Hossain and Anagnostou (2006, hereafterHA06). First, we note that the error structure necessaryto capture the rainfall intermittency at hydrologicallyrelevant scales arises from the physical issues associatedwith satellite rainfall estimation. Satellite-derived esti-mates are typically instantaneous, area-averaged rain-fall. Since rainfall is an intermittent process, each sat-ellite gridbox value will be classified by a rainfall algo-rithm as rainy or nonrainy (as discussed above, “rain” isused here as a shorthand for “precipitation”). When
compared to the corresponding ground validation rain-fall data (hereafter referred to as “reference”), a satel-lite estimate may fall into one of four possible outcomes:
1) Satellite successfully detects rain (successful rain de-tection, or “hit”).
2) Satellite fails to detect rain (unsuccessful rain detec-tion, or “miss”).
3) Satellite successfully detects the no-rain case (suc-cessful no-rain detection).
4) Satellite fails to detect the no-rain case (unsuccessfulno-rain detection, or “false alarm”).
For the data-producing community, there are alreadyaccepted metrics in use that can quantify these notionsof hits, misses, and false alarms. Some examples are,frequency bias (FB), FAR, and ETS. Ebert et al. (2007,p. 52) provides an introductory background on the for-mulation of these metrics that are often tagged with thesatellite estimates by the data producers during algo-rithm comparisons (see also appendix B). Each of theseconventional metrics typically refers to a particular as-pect of rain estimation considered important for evalu-ating algorithms at large space–time scales. For ex-ample, the metric FB indicates the tendency of an al-gorithm to overestimate or underestimate the aerialextent of rainy areas (�1 for overestimation; �1 forunderestimation). However, an issue that has remainedunclear is the use of these metrics to generate stochasticrealizations of satellite rainfall for assessing their hy-drologic implications. It is not clear how one would usethe FB measure in an error model to simulate satellite-like rainy areas with coherent space–time structures.Hence, an inherent limitation associated with some ofthese conventional metrics is the difficulty in math-ematically modeling the property they represent forsimulation of stochastic realizations of satellite rainfalldata. Many of the currently accepted metrics thereforehave diagnostic power (i.e., they tell us the level oferror for an actual algorithm). But most lack prognosticqualities for hydrologic error propagation experiments(i.e., they do not tell us how to use it a step further togenerate stochastic realizations of satellite rainfalldata). This fact motivates our proposed framework onadditional and hydrologically more relevant metrics.
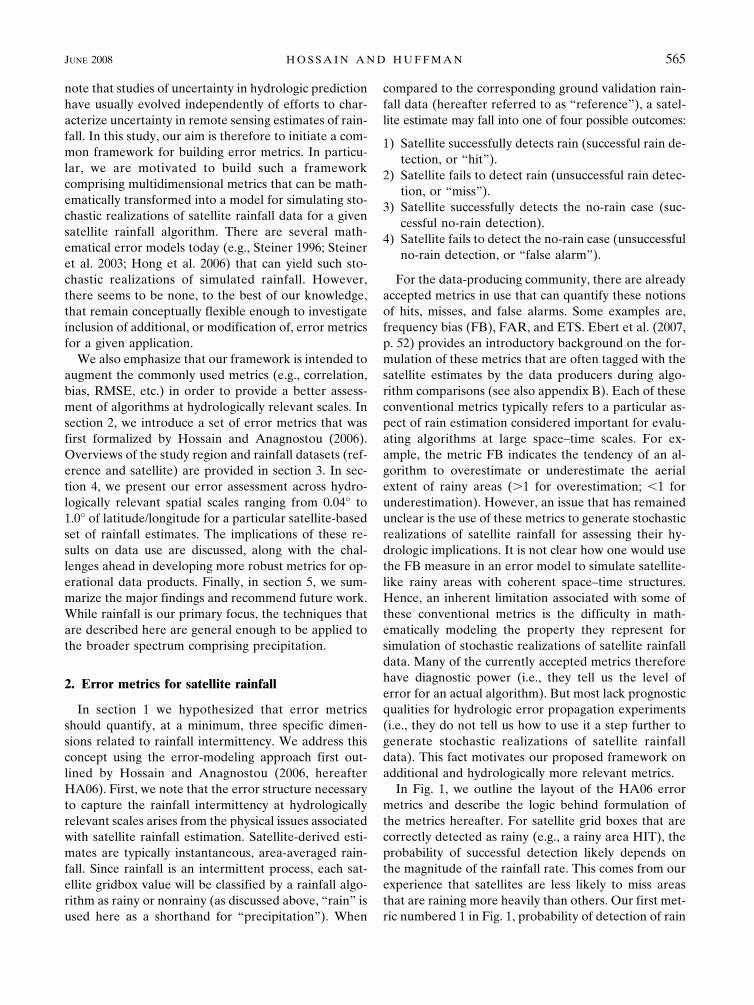
In Fig. 1, we outline the layout of the HA06 errormetrics and describe the logic behind formulation ofthe metrics hereafter. For satellite grid boxes that arecorrectly detected as rainy (e.g., a rainy area HIT), theprobability of successful detection likely depends onthe magnitude of the rainfall rate. This comes from ourexperience that satellites are less likely to miss areasthat are raining more heavily than others. Our first met-ric numbered 1 in Fig. 1, probability of detection of rain
JUNE 2008 H O S S A I N A N D H U F F M A N 565
(PODRAIN), is used to quantify this property. Here thePODRAIN for a given threshold rain rate � is definedstatistically as follows:
PODRAIN � Prob�RSAT � 0 |RREF � ��, �1�
where subscripts SAT and REF refer to satellite andreference values for rain rate, respectively.
The functional form of PODRAIN may be based oneither the reference [ground validation (GV)] or theestimated rain rate. For example, the traditional hy-drologist users would likely be interested in the prob-ability of rain detection benchmarked with respect toground data. On the other, the data producers may findit almost impossible to tag the probability of detectionof the satellite estimates to the GV data on an opera-
tional basis due to lack of global-scale ground valida-tion data, so they would choose to index errors on sat-ellite estimates instead.
To maintain consistency with the HA06 metric for-mulation, the � value is varied from the lowest thresh-old (�0 mm h1) to an arbitrarily high � value (�15mm h1). The PODRAIN is then regressed against the �value to identify the functional form for PODRAIN �f(�). From our experience, the functional form has mostoften been a logistic equation. As an example, if thePODRAIN value is 0.72 for � � 5 mm h1, then thismeans that the satellite algorithm has a 72% chance ofsuccessfully detecting rainy grid boxes with referencevalue exceeding 5 mm h1. Note that “detection” isdefined as any nonzero rain value. Such an error con-
FIG. 1. The logic of the conceptual framework for hydrologically relevant error metrics.Numbers in parentheses denote the metrics as discussed in section 2.
566 J O U R N A L O F H Y D R O M E T E O R O L O G Y VOLUME 9
ceptualization for rain detection makes the PODRAIN
relatively easy to simulate using the concept of Ber-noulli trials in a stochastic error model (HA06).
Next, for grid boxes that are detected correctly asnonrainy (a nonrainy HIT), the algorithm can becharacterized by a marginal probability of no rain asPODNORAIN. This measure is the ratio of the number ofsatellite grid boxes correctly classified as nonrainy tothe total number of grid boxes that are actually non-rainy according to reference data (metric number 2 inFig. 1). Grid boxes that are unsuccessfully detected asnonrainy—that is, the satellite detecting rain whenthere is none (rainy MISS)—can be classified as “falsealarm” grid boxes. For these grid boxes, it is more con-venient for us to quantify and simulate the observedprobability distribution of the false alarm rain rates.Hence, the first and second moments of the distributioncan account for an algorithm’s tendency to producefalse alarms (in Fig. 1, these two metrics are collectivelynumbered 3), which can then be easily simulated in astochastic error model.
For satellite grid boxes that are detected correctly asrainy or nonrainy (all HITs in Fig. 1), the detection’sspatial pattern may exhibit a clear covariance struc-ture—the probability of successful detection of a satel-lite grid box as rainy or nonrainy may be a function ofits proximity to another successfully detected grid boxin the neighborhood. One measure to quantify this spa-tial structure is the correlation length, which can beused in a stochastic error model for the generation ofcorrelated random fields (Deutsch and Journel 1998).Accordingly, we quantify the spatial structure of suc-cessful detection of rainy and nonrainy area with twometrics—CLRAIN and CLNORAIN, respectively (themetrics numbered 4 and 5 in Fig. 1; CL stands for cor-relation length). The metrics CLNORAIN and CLRAIN
specifically refer to the spatial dimension of error whenconsidered in combination with the POD metrics.
Finally, when compared to the reference value, thegrid boxes that are successfully detected as rainy mayexhibit three additional properties: (i) they will have aspatial structure; (ii) they may be “off” from the truevalue; and (iii) they will have temporal persistence.These three properties pertain to the three dimensionsof error metrics highlighted in section 1. The first andsecond moments of retrieval error (bias and standarddeviation) can collectively quantify the error propertyfor the retrieval dimension; in Fig. 1, these two metricsare numbered 6 and 7. To account for the spatial struc-ture of the retrieval error, we introduce a metricCLRET—correlation length of retrieval—that can beused to simulate correlated random fields. This metricis numbered 8 in Fig. 1.
We address the temporal dimension of the satellite-estimation error with a relatively simple representation:We assume that only the mean-field bias (systematicerror) of retrieval error is correlated in time in an Eu-lerian (surface based) frame of reference. Hence, thelag 1 correlation of the mean-field bias is used as themetric to quantify the temporal dimension of error(metric number 8 in Fig. 1). The temporal persistenceof satellite-estimated rainfall probably arises from amixture of the true spatial and temporal correlations ofthe rain system in its Lagrangian (system following)frame of reference, and the advection speed of thatframe of reference. The temporal persistence of satel-lite-estimation error will therefore arise from the abovecombination of correlations of the rain system. At thisstage, an Eulerian simplification makes our frameworktractable for generating stochastic ensembles of satel-lite rainfall data, although a more sophisticated ap-proach may be needed in the future.
Collecting all these components, it appears that onepossible set of error metrics is as follows: 1) Probabilityof rain detection (and as a function of rainfall magni-tude), PODRAIN; 2) Probability of no-rain detection,PODNORAIN; 3) First- and second-order moments ofthe probability distribution during false alarms; 4) Cor-relation lengths for the detection of rain, CLRAIN, and5) no rain, CLNORAIN; 6) Conditional systematic re-trieval error or mean-field bias (when reference rain �0); 7) Conditional random retrieval error or error vari-ance; 8) Correlation length for the retrieval error (con-ditional, when rain � 0.0), CLRET; and 9) Lag 1 auto-correlation of the mean-field bias. The mathematicalformulations of these nine error metrics are reasonablystraightforward and are provided in appendix A. Read-ers should refer to HA06 for a more complete descrip-tion on how these nine error metrics can be used in astochastic error model to simulate realizations of satel-lite rainfall data.
It is not clear whether these nine metrics completelydescribe the error structure of satellite rainfall estima-tion at hydrologically relevant scales. The needs of par-ticular users and applications will necessarily drive theevolution to the best representation of these errorstructure parameters.
3. Data and study region
We choose the U.S. National Weather Service(NWS) stage II rainfall data as the ground validationrainfall dataset for illustrating the nine error metrics.This dataset uses the NWS Weather Surveillance Ra-dar-1988 Doppler (WSR-88D) estimates with real-timeadjustments based on mean-field radar–rain gaugehourly accumulation comparisons (Fulton et al. 1998;
JUNE 2008 H O S S A I N A N D H U F F M A N 567
Seo et al. 1999, 2000). The original resolution is 4 km,hourly.
For a representative satellite rainfall algorithm, weuse data from a recent version of the Precipitation Es-timation from Remotely Sensed Information UsingArtificial Neural Networks (PERSIANN; Sorooshianet al. 2000). The original PERSIANN is a satellite IR-based algorithm with calibration by passive microwaverainfall estimates in a neural net framework that pro-duces global estimates of rainfall at 0.25° 0.25°,half-hourly resolution (Hong et al. 2005a). The revisedversion used in this study includes a self-organizingnonlinear output (SONO) neural network for cloud-patch-based rainfall estimation. The revised PERSIANNalgorithm estimates 0.04°, half-hourly rainfall and isavailable over the Internet (http://hydis8.eng.uci.edu/GCCS/) (Hong et al. 2005b). The fine submicrowavefootprint scale is achieved by using the Climate Predic-tion Center Merged IR Dataset (Janowiak et al. 2001)at full resolution to guide disaggregating the microwaveestimates from the original PERSIANN grid of 0.12°before use in training the neural network scheme.
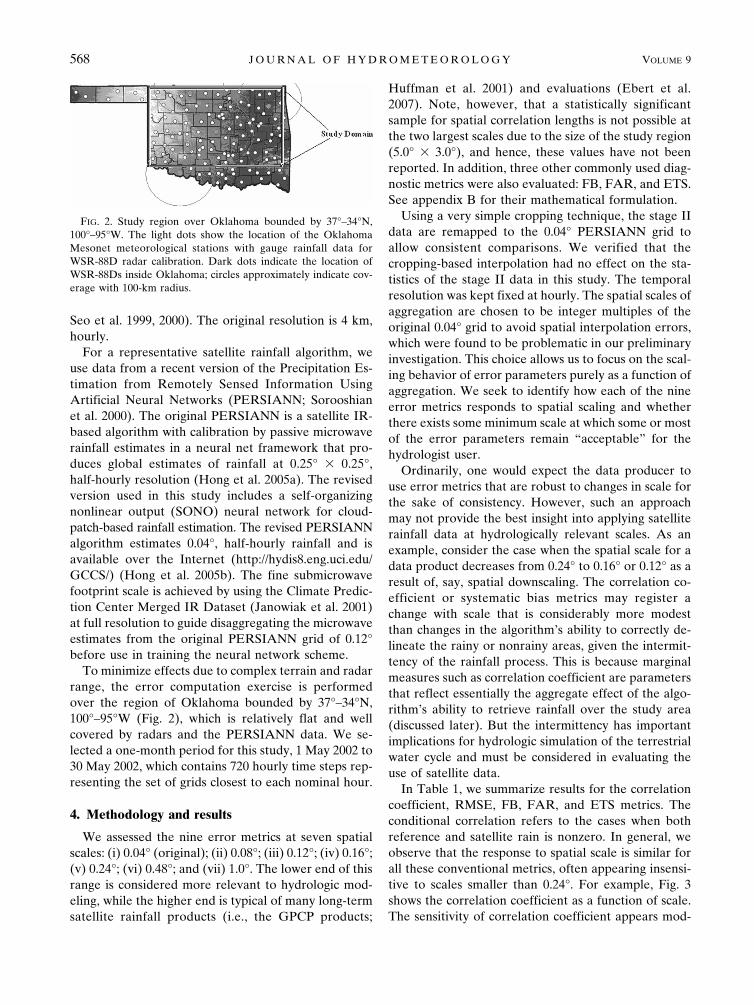
To minimize effects due to complex terrain and radarrange, the error computation exercise is performedover the region of Oklahoma bounded by 37°–34°N,100°–95°W (Fig. 2), which is relatively flat and wellcovered by radars and the PERSIANN data. We se-lected a one-month period for this study, 1 May 2002 to30 May 2002, which contains 720 hourly time steps rep-resenting the set of grids closest to each nominal hour.
4. Methodology and results
We assessed the nine error metrics at seven spatialscales: (i) 0.04° (original); (ii) 0.08°; (iii) 0.12°; (iv) 0.16°;(v) 0.24°; (vi) 0.48°; and (vii) 1.0°. The lower end of thisrange is considered more relevant to hydrologic mod-eling, while the higher end is typical of many long-termsatellite rainfall products (i.e., the GPCP products;
Huffman et al. 2001) and evaluations (Ebert et al.2007). Note, however, that a statistically significantsample for spatial correlation lengths is not possible atthe two largest scales due to the size of the study region(5.0° 3.0°), and hence, these values have not beenreported. In addition, three other commonly used diag-nostic metrics were also evaluated: FB, FAR, and ETS.See appendix B for their mathematical formulation.
Using a very simple cropping technique, the stage IIdata are remapped to the 0.04° PERSIANN grid toallow consistent comparisons. We verified that thecropping-based interpolation had no effect on the sta-tistics of the stage II data in this study. The temporalresolution was kept fixed at hourly. The spatial scales ofaggregation are chosen to be integer multiples of theoriginal 0.04° grid to avoid spatial interpolation errors,which were found to be problematic in our preliminaryinvestigation. This choice allows us to focus on the scal-ing behavior of error parameters purely as a function ofaggregation. We seek to identify how each of the nineerror metrics responds to spatial scaling and whetherthere exists some minimum scale at which some or mostof the error parameters remain “acceptable” for thehydrologist user.
Ordinarily, one would expect the data producer touse error metrics that are robust to changes in scale forthe sake of consistency. However, such an approachmay not provide the best insight into applying satelliterainfall data at hydrologically relevant scales. As anexample, consider the case when the spatial scale for adata product decreases from 0.24° to 0.16° or 0.12° as aresult of, say, spatial downscaling. The correlation co-efficient or systematic bias metrics may register achange with scale that is considerably more modestthan changes in the algorithm’s ability to correctly de-lineate the rainy or nonrainy areas, given the intermit-tency of the rainfall process. This is because marginalmeasures such as correlation coefficient are parametersthat reflect essentially the aggregate effect of the algo-rithm’s ability to retrieve rainfall over the study area(discussed later). But the intermittency has importantimplications for hydrologic simulation of the terrestrialwater cycle and must be considered in evaluating theuse of satellite data.
In Table 1, we summarize results for the correlationcoefficient, RMSE, FB, FAR, and ETS metrics. Theconditional correlation refers to the cases when bothreference and satellite rain is nonzero. In general, weobserve that the response to spatial scale is similar forall these conventional metrics, often appearing insensi-tive to scales smaller than 0.24°. For example, Fig. 3shows the correlation coefficient as a function of scale.The sensitivity of correlation coefficient appears mod-
FIG. 2. Study region over Oklahoma bounded by 37°–34°N,100°–95°W. The light dots show the location of the OklahomaMesonet meteorological stations with gauge rainfall data forWSR-88D radar calibration. Dark dots indicate the location ofWSR-88Ds inside Oklahoma; circles approximately indicate cov-erage with 100-km radius.
568 J O U R N A L O F H Y D R O M E T E O R O L O G Y VOLUME 9

est and it remains difficult to use this metric in a sto-chastic error model.
An interesting pattern emerges in Fig. 4 for ourproposed metric on probability of rain detection(PODRAIN) as a function of reference threshold rainrate. With spatial aggregation, both the maximumPODRAIN (at reference rain rates greater than 15 mmh1) and the gradient of probability detection as a func-tion of reference threshold rainfall rate increase notice-ably, as expected (the highest being for 1.0°). As ex-plained in section 2, this means that the algorithm ishighly unlikely to have zero rain in areas raining at arate greater than 15 mm h1, although the satellite-estimated rain rate may not necessarily match closelywith the ground validation data. The PODNORAIN ex-hibits even stronger scale dependence (Fig. 5). Theprobabilities for both rain and no-rain detection re-spond definitively as spatial scales decrease below0.48°. Hence, these two metrics that account for rainfallintermittency add information to the traditional list ofmetrics for exploring satellite rainfall data applicationin hydrologic models.
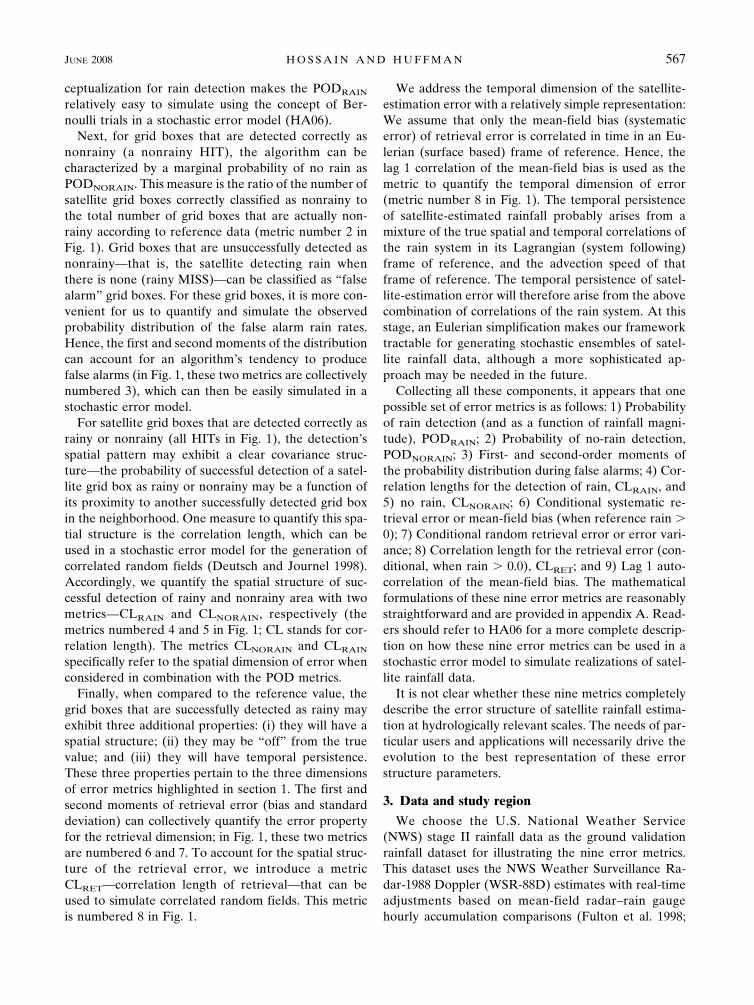
In Fig. 6, we show the spatiotemporal structure formetrics on conditional retrieval error (random; upperleft panel), mean-field bias (temporal autocorrelationfunction; upper right panel), and the spatial correlationfunctions for rain detection (lower left panel) and no-rain detection (lower right panel). Even though the dis-tinction in spatial scaling for these spatiotemporal errorparameters is weak at the scales considered, HA06show that these metrics can be used coherently in anerror model to simulate realistic space–time covariancestructure of satellite rainfall data. If correlation lengthsin space and time are computed (assuming that an ex-ponential model is appropriate; see appendix A), amore informative picture emerges (Fig. 7). We observea clear sensitivity of the correlation length to spatialscales, with the correlation length for rain detectionbeing the most sensitive. The lag 1 (hourly) temporalcorrelation of mean-field bias however remains insen-sitive to scale as would be expected since the domain’sarea is the same for all grid sizes. These results dem-onstrate that the suggested error metrics on rain detec-
tion/delineation correlation lengths can offer insightinto the useful spatial scales for applying satellite-basedrainfall in hydrologic models. While the assessment ofthe direct implications of these metrics on hydrologicmodeling is beyond the scope of this study, Hossain andAnagnostou (2004) have shown that an improvement inthe probability of rain detection can yield substantialimprovements in flood prediction at the 0.1° scale forsaturation-excess watersheds in the Alps. Intuitively,the same can be expected of Hortonian watershedswhere spatial pattern of the rainy areas along with therain rate and soil’s infiltration capacity dictate the pro-pensity of a region to produce direct runoff.
Finally, in order to demonstrate the value of our pro-posed error framework in distinguishing the strengthsand weaknesses of existing HRPP algorithms, we lookat four global satellite rainfall products. These are 1)Tropical Rainfall Measuring Mission (TRMM) Multi-satellite Precipitation Analysis (TMPA) microwave-calibrated infrared (IR) rainfall product 3B41RT(Huffman et al. 2007); 2) TMPA merged microwave-IRrainfall product 3B42RT (Huffman et al. 2007); 3)NOAA CPC morphed passive microwave rainfall prod-uct (CMORPH; Joyce et al. 2004), and 4) PERSIANN.The error analysis is performed at the native scale ofalgorithms for the year 2004 over two regions in the
FIG. 3. Correlation coefficient of satellite rainfall data withstage II rainfall as a function of spatial scale.
TABLE 1. Some commonly used error metrics as a function of spatial scales (degrees of lat/lon).
0.04° 0.08° 0.12° 0.16° 0.24° 0.48° 1.0°
Correlation (unconditional) 0.386 0.383 0.393 0.401 0.418 0.469 0.569Correlation (conditional) 0.272 0.298 0.319 0.334 0.361 0.437 0.547Root-mean-square error (mm h1) 4.708 3.933 3.530 3.230 2.776 1.98 1.25FB 1.524 1.405 1.423 1.419 1.460 1.548 1.677FAR 0.686 0.634 0.619 0.601 0.5804 0.5370 0.5066ETS 0.205 0.235 0.245 0.255 0.271 0.302 0.306
JUNE 2008 H O S S A I N A N D H U F F M A N 569

United States known to have a distinct hydroclimatol-ogy: (i) the Midwest (a semiarid zone) and (ii) Florida(subtropical zone modulated by coastal effects). WSR-88D stage-II rainfall data are used as a reference forground validation data. The main purpose of this exer-cise is to assess whether our proposed framework of
metrics can clarify regional and seasonal differences fora given algorithm when used in combination with con-ventional metrics, without undertaking a comparativeassessment of the various algorithms.
Table 2 shows a summary of conventional metrics(correlation and standard deviation of error) and the
FIG. 4. Probability of rain detection as a function of reference(stage II) rainfall rate and spatial scales.
FIG. 5. Comparison of scaling behavior of maximum probabilityfor rain (at rain rates � 15 mm h1) and marginal probability ofno-rain detection.
FIG. 6. Spatiotemporal metrics as a function of spatial scales. (top left) Spatial correlation function for conditionalretrieval error (rain � 0); (top right) temporal correlation function for mean-field bias; (bottom left) spatialcorrelation function for rain detection; and (bottom right) spatial correlation function for no-rain detection. Notethat spatial correlation functions are not reported at scales 0.48° and 1.0° due to the small spatial sample availableover the study region. The separating distance (km) is reported by approximating 1° of latitude or longitude as100 km.
570 J O U R N A L O F H Y D R O M E T E O R O L O G Y VOLUME 9
Fig 6 live 4/C
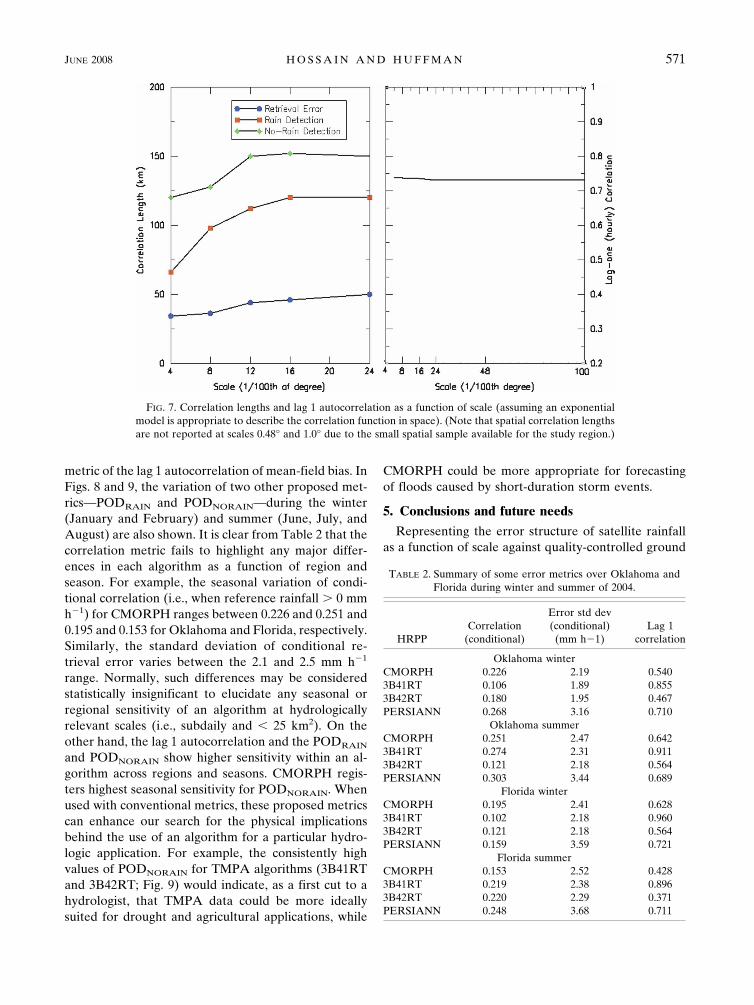
metric of the lag 1 autocorrelation of mean-field bias. InFigs. 8 and 9, the variation of two other proposed met-rics—PODRAIN and PODNORAIN—during the winter(January and February) and summer (June, July, andAugust) are also shown. It is clear from Table 2 that thecorrelation metric fails to highlight any major differ-ences in each algorithm as a function of region andseason. For example, the seasonal variation of condi-tional correlation (i.e., when reference rainfall � 0 mmh1) for CMORPH ranges between 0.226 and 0.251 and0.195 and 0.153 for Oklahoma and Florida, respectively.Similarly, the standard deviation of conditional re-trieval error varies between the 2.1 and 2.5 mm h1
range. Normally, such differences may be consideredstatistically insignificant to elucidate any seasonal orregional sensitivity of an algorithm at hydrologicallyrelevant scales (i.e., subdaily and � 25 km2). On theother hand, the lag 1 autocorrelation and the PODRAIN
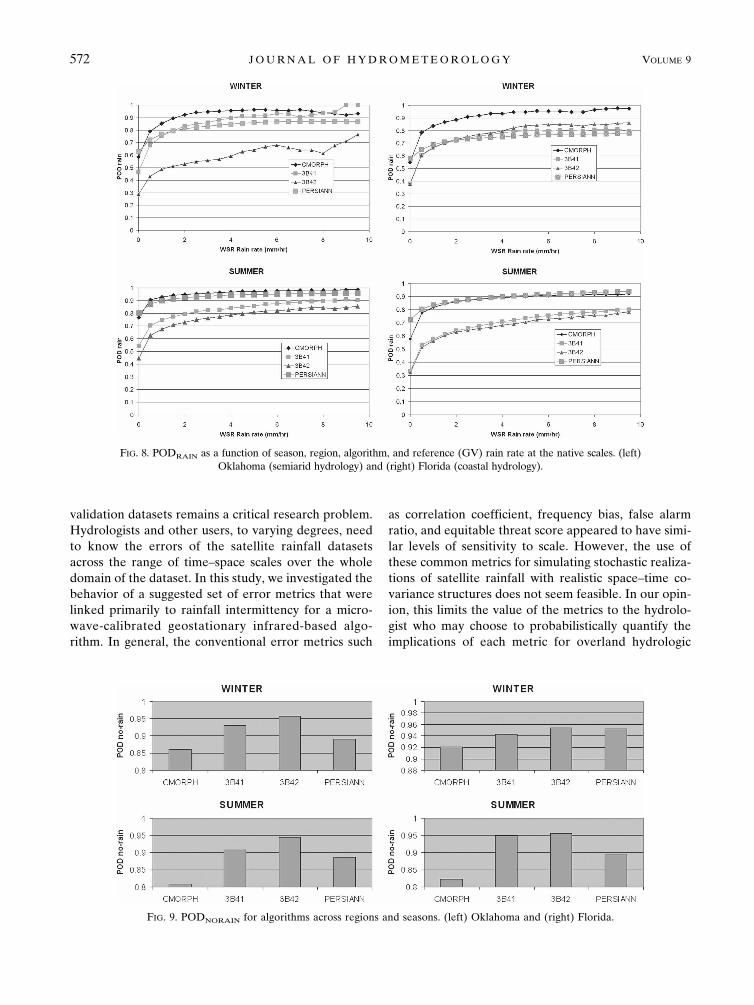
and PODNORAIN show higher sensitivity within an al-gorithm across regions and seasons. CMORPH regis-ters highest seasonal sensitivity for PODNORAIN. Whenused with conventional metrics, these proposed metricscan enhance our search for the physical implicationsbehind the use of an algorithm for a particular hydro-logic application. For example, the consistently highvalues of PODNORAIN for TMPA algorithms (3B41RTand 3B42RT; Fig. 9) would indicate, as a first cut to ahydrologist, that TMPA data could be more ideallysuited for drought and agricultural applications, while
CMORPH could be more appropriate for forecastingof floods caused by short-duration storm events.
5. Conclusions and future needs
Representing the error structure of satellite rainfallas a function of scale against quality-controlled ground
TABLE 2. Summary of some error metrics over Oklahoma andFlorida during winter and summer of 2004.
HRPPCorrelation
(conditional)
Error std dev(conditional)
(mm h1)Lag 1
correlation
Oklahoma winterCMORPH 0.226 2.19 0.5403B41RT 0.106 1.89 0.8553B42RT 0.180 1.95 0.467PERSIANN 0.268 3.16 0.710
Oklahoma summerCMORPH 0.251 2.47 0.6423B41RT 0.274 2.31 0.9113B42RT 0.121 2.18 0.564PERSIANN 0.303 3.44 0.689
Florida winterCMORPH 0.195 2.41 0.6283B41RT 0.102 2.18 0.9603B42RT 0.121 2.18 0.564PERSIANN 0.159 3.59 0.721
Florida summerCMORPH 0.153 2.52 0.4283B41RT 0.219 2.38 0.8963B42RT 0.220 2.29 0.371PERSIANN 0.248 3.68 0.711
FIG. 7. Correlation lengths and lag 1 autocorrelation as a function of scale (assuming an exponentialmodel is appropriate to describe the correlation function in space). (Note that spatial correlation lengthsare not reported at scales 0.48° and 1.0° due to the small spatial sample available for the study region.)
JUNE 2008 H O S S A I N A N D H U F F M A N 571
Fig 7 live 4/C
validation datasets remains a critical research problem.Hydrologists and other users, to varying degrees, needto know the errors of the satellite rainfall datasetsacross the range of time–space scales over the wholedomain of the dataset. In this study, we investigated thebehavior of a suggested set of error metrics that werelinked primarily to rainfall intermittency for a micro-wave-calibrated geostationary infrared-based algo-rithm. In general, the conventional error metrics such
as correlation coefficient, frequency bias, false alarmratio, and equitable threat score appeared to have simi-lar levels of sensitivity to scale. However, the use ofthese common metrics for simulating stochastic realiza-tions of satellite rainfall with realistic space–time co-variance structures does not seem feasible. In our opin-ion, this limits the value of the metrics to the hydrolo-gist who may choose to probabilistically quantify theimplications of each metric for overland hydrologic
FIG. 9. PODNORAIN for algorithms across regions and seasons. (left) Oklahoma and (right) Florida.
FIG. 8. PODRAIN as a function of season, region, algorithm, and reference (GV) rain rate at the native scales. (left)Oklahoma (semiarid hydrology) and (right) Florida (coastal hydrology).
572 J O U R N A L O F H Y D R O M E T E O R O L O G Y VOLUME 9
simulations. The probability of detection of rain and itsfunctional relationship to ground validation rainfallwere found to be the most sensitive to scale followed bythe correlation length for detection of rain. These spe-cific error metrics appear informative for identifyingthe useful scales for data integration over land and canalso be used in a stochastic error model.
The new-generation HRPP datasets pose significantopportunities for hydrologists, but with associated chal-lenges. Specifically, effective assessment frameworksand metrics for satellite rainfall data must be developedthat enhance the HRPPs’ utility for land surface hydrol-ogy and are jointly defined by the hydrologic and data-producing communities. While we have shown sometangible examples of error metrics and their potentialvalue in gauging utility, more work is needed to definehydrologically relevant metrics that can connect moredirectly to the physics and geometries of satellite rain-fall estimation.
The practicality of the approach presented in thispaper can be questioned because the details likely varyby region and season, and because many regions lackthe necessary ground validation data to develop region-specific error representations. However, it appears con-ceptually feasible to build on work already accom-plished on global classification of rainfall systems (Pe-tersen and Rutledge 2002). In addition, it is possible touse the TRMM Precipitation Radar (PR) as the refer-ence for the spatial domain (e.g., Hossain and Anag-nostou 2004) and apply a recent approach suggested by
Bellerby and Sun (2005) based on transfer of probabil-ity distribution functions for the temporal domain. An-other approach could be the use of geostatistical simu-lation techniques such as ordinary or indicator kriging(Deutsch and Journel 1998) to transfer error metricsfrom a ground validation site to ungauged regions un-der the assumption of stationarity of the metric values.
A challenge that remains is to choose a small set oferror parameters that enable practical use of the uncer-tainty information and capture the time–space structureof the uncertainties. At this level of complexity it mightbe best to establish functional forms for the error met-rics and supply coefficients for large regions and sea-sons. In some cases, average or “climatological” coef-ficients might suffice, while in other cases routine up-dates as a function of time might be required. Giventhis information a user could easily estimate the errorsthat correspond to the time–space scale of their appli-cation. In particular, a hydrologist could identify thenecessary scale of aggregation of satellite rainfall datato achieve a specified level of accuracy that would mini-mize error propagation in a hydrologic model for his/her intended application.
APPENDIX A
Formulation of Error Metrics
Consider first, the following 2 2 validation (con-tingency) matrix shown in Table A1 for hits and missesassociated with satellite rainfall estimates:
Probability of detection for rain �PODRAIN�:NA
NA � NB, �A1�
Probability of detection for no rain �PODNORAIN�:ND
ND � NC. �A2�
We also define the (successful) rain detection probabil-ity, PODRAIN, as a function of rainfall magnitude ofeither the reference rainfall or satellite estimate. Thefunctional form is usually identified through calibrationwith actual data (HA06) The PODNORAIN, is the uni-tary probability that satellite retrieval is zero when ref-erence rainfall is zero, which is also determined on thebasis of actual data.
A probability density function (Dfalse) is defined tocharacterize the probability distribution of the satelliteestimates when there are misses over nonrainy areas.This function is also identified through calibration onthe basis of actual sensor data. HA06 have reportedthat this Dfalse probability density function typically
tends to appear exponential. Hence, both the moments(first and second) can be defined using only one param-eter of the distribution, �. This can be computed usingthe chi-squared or maximum likelihood method.
To identify the correlation lengths of error (i.e., howdoes the error vary in space) a simple exponential-type
TABLE A1. Validation (contingency) matrix for hits and missesof satellite rainfall data.
Satellite estimates
Truth/reference
Rainy grid boxes Nonrainy grid boxes
Rainy grid boxes NA (HIT) NB (MISS)Nonrainy grid boxes NC (MISS) ND (HIT)
JUNE 2008 H O S S A I N A N D H U F F M A N 573
autocovariance function is assumed. The correlationlength (the separation distance at which correlation �1/e � 0.3678) is then determined on the basis of cali-bration with actual data over a large domain (the size ofOklahoma in this study). For identifying the spatial cor-relation length of rain detection, CLRAIN (or, no-raindetection–CLNORAIN) from data, all successfully de-tected rainy (nonrainy) pixels are assigned a value of1.0 while the rest has a value of 0.0. The empiricalsemivariogram is then computed as follows:
��h� �1
2n�h� i�1
n�h�
�z�xi� z�xi � h��2, �A3�
where z(xi) and z(xi � h) are the binary pixel values (0or 1) at distance xi and xi � h, respectively, and h is thelag in kilometers; n represents the number of datapoints at a separation distance of h. The term �(h) is thesemivariance at separation distance h. Assuming thatthe empirical variogram is best represented by an ex-ponential model, the functional parameters describingthe spatial variability can be fitted as follows:
��h� � c0 � c �1 eh�CL�, �A4�
where c0 represents the nugget variance, c is the sillvariance, and CL is the distance parameter known ascorrelation length. Conversely, the correlation functionis modeled as C � exp(h/CL), where C is the corre-lation.
For identifying the correlation length for retrievalerror, CLRET, a similar set of steps are adopted asabove for rain/no-rain detection, with the exceptionthat the binary values (0–1) are no longer pertinent.Instead, one computes the correlation length in termsof retrieval error defined as the difference between ref-erence and satellite estimate as described below.
The conditional (i.e., reference rainfall � 0 unit) non-zero satellite rain rates, RSAT, can be statistically re-lated to corresponding conditional reference rain rates,RREF, as
RSAT � RREF�S, �A5�
where the satellite retrieval error parameter, �s, is as-sumed to be lognormally distributed. It is up to the dataproducers to verify the assumption of lognormality.The advantage of such an assumption is that a log trans-formation [log(RSAT) log(RREF)] of Eq. (A5) trans-forms the �s to a Gaussian N(�, �) deviate, �, where �and � are the mean and standard deviation of retrievalerror, respectively.
The retrieval error parameter � is both spatially andtemporally autocorrelated. The spatial aspect has al-ready been discussed earlier in this appendix. For tem-
poral correlation, a lag 1 autocorrelation function isused to identify the temporal variability of � (i.e., con-ditional satellite rainfall bias).
APPENDIX B
Formulation of Some Common Error Metrics
Using the terminology adopted by Ebert et al. (2007),a grid box can be classified as a hit (H, observed rain iscorrectly detected), miss (M, observed rain is not de-tected), false alarm (F, rain detected but not observed),or null (no rain observed or detected).
The frequency bias is defined as
FB ��H � F �
�H � M�. �B1�
The false alarm ratio is defined as
FAR �F
�H � F �. �B2�
The equitable threat score is defined as
ETS �H He
�H � M � F He�, �B3�
where, He � (H � M)(H � F)/N and N � the totalnumber of grid boxes.
Acknowledgments. The authors wish to thank Dr. So-roosh Sorooshian of University of California, Irvine, forproviding the PERSIANN satellite rainfall data. Theauthors also gratefully acknowledge the comments re-ceived from four anonymous reviewers, which substan-tially improved the quality of the manuscript. The firstauthor was supported by a research initiation grantfrom the Tennessee Technological University. Addi-tional support from the Center for Management, Utili-zation, and Protection of Water Resources of Tennes-see Technological University is also acknowledged.
REFERENCES
Ali, A., T. Lebhl, and A. Amani, 2005: Rainfall estimation in theSahel. Part I: Error function. J. Appl. Meteor., 44, 1691–1706.
Anagnostou, E. N., 2004: Overview of overland satellite rainfallestimation for hydro-meteorological applications. Surv. Geo-phys., 25, 511–537.
Bellerby, T., and J. Sun, 2005: Probabilistic and ensemble repre-sentations of the uncertainty in IR/microwave rainfall prod-uct. J. Hydrometeor., 6, 1032–1044.
Deutsch, C. V., and A. Journel, 1998: GSLIB: Geostatistical Soft-ware Library and User’s Guide. Oxford University Press, 369pp.
Ebert, E. E., J. E. Janowiak, and C. Kidd, 2007: Comparison ofnear-real-time rainfall estimates from satellite observationsand numerical models. Bull. Amer. Meteor. Soc., 88, 47–64.
574 J O U R N A L O F H Y D R O M E T E O R O L O G Y VOLUME 9
Fulton, R. A., J. P. Breidenbach, D.-J. Seo, D. A. Miller, and T.O’Bannon, 1998: The WSR-88D rainfall algorithm. Wea.Forecasting, 13, 377–395.
Gebremichael, M., and W. F. Krajewski, 2004: Characterization ofthe temporal sampling error in space-time-averaged rainfallestimates from satellites. J. Geophys. Res., 109, D11110,doi:10.1029/2004JD004509.
——, and ——, 2005: Modeling distribution of temporal samplingerrors in area-time-averaged satellite rainfall estimates. At-mos. Res., 73, 243–259.
Heidke, P., 1926: Berechnung des Erfolges und der Gute derWindstarkevorhersagen im Sturmwarnungsdienst (in Ger-man). Geogr. Ann., 8, 301–349.
Hong, Y., K.-L. Hsu, S. Sorooshian, and X. Gao, 2005a: Self-organizing nonlinear output (SONO): A neural network suit-able for cloud patch–based rainfall estimation from satelliteimagery at small scales. Water Resour. Res., 41, W03008,doi:10.1029/2004WR003142.
——, ——, ——, and ——, 2005b: Improved representation ofdiurnal variability of rainfall from the Tropical Rainfall Mea-suring Mission Imager adjusted Rainfall Estimation from Re-motely sensed Information Using Artificial Neural Networks(PERSIANN) system. J. Geophys. Res., 110, D06102,doi:10.1029/JD2004JD005301.
——, ——, H. Moradkhani, and S. Sorooshian, 2006: Uncertaintyquantification of satellite rainfall estimation and Monte Carloassessment of the error propagation into hydrologic re-sponse. Water Resour. Res., 42, W08421, doi:10.1029/2005WR004398.
Hossain, F., and E. N. Anagnostou, 2004: Assessment of currentpassive-microwave- and infrared-based satellite rainfall re-mote sensing for flood prediction. J. Geophys. Res., 109,D07102, doi:10.1029/2003JD003986.
——, and ——, 2005: Using a multi-dimensional satellite rainfallerror model to characterize uncertainty in soil moisture fieldssimulated by an offline land surface model. Geophys. Res.Lett., 32, L15402, doi:10.1029/2005GL023122.
——, and ——, 2006: A two-dimensional satellite rainfall errormodel. IEEE Trans. Geosci. Remote Sens., 44, 1511–1522,doi:10.1109/TGRS.2005.863866.
——, and D. P. Lettenmaier, 2006: Flood prediction in the future:Recognizing hydrologic issues in anticipation of the GlobalPrecipitation Measurement mission—Opinion paper. WaterResour. Res., 44, W11301, doi:10.1029/2006WR005202.
Huffman, G. J., R. F. Adler, M. Morrissey, D. T. Bolvin, S. Curtis,R. Joyce, B. McGavock, and J. Susskind, 2001: Global pre-cipitation at one-degree daily resolution from multisatelliteobservations. J. Hydrometeor., 2, 36–50.
——, ——, D. T. Bolvin, and E. J. Nelkin, 2004: The status of themulti-satellite rainfall analysis and insights gained from add-ing new data sources. Second Int. Precipitation WorkingGroup Workshop, Monterey, CA, World Meteorological Or-ganization, 123–127.
——, and Coauthors, 2007: The TRMM multisatellite rainfallanalysis: Quasi-global, multiyear, combined-sensor rainfallestimates at fine scale. J. Hydrometeor., 8, 38–55.
Janowiak, J., R. J. Joyce, and Y. Yarosh, 2001: A real-time global
half-hourly pixel-resolution infrared dataset and its applica-tion. Bull. Amer. Meteor. Soc., 82, 205–217.
Joyce, R. L., J. E. Janowiak, P. A. Arkin, and P. Xie, 2004:CMORPH: A method that produces global precipitation es-timates from passive microwave and infrared data at highspatial and temporal resolution. J. Hydrometeor., 5, 487–503.
Lee, K. H., and E. N. Anagnostou, 2004: Investigation of the non-linear hydrologic response to rainfall forcing in physicallybased land surface modeling. Can. J. Remote Sens., 30, 706–716.
McCollum, J. R., W. F. Krajewski, R. R. Ferraro, and M. B. Ba,2002: Evaluation of biases of satellite rainfall estimation al-gorithm over the continental United States. J. Appl. Meteor.,41, 1065–1080.
Moradkhani, H., K. Hsu, Y. Hong, and S. Sorooshian, 2006: In-vestigating the impact of remotely sensed rainfall and hydro-logic model uncertainties on the ensemble streamflow fore-casting. Geophys. Res. Lett., 33, L12401, doi:10.1029/2006GL026855.
Nijssen, B., and D. P. Lettenmaier, 2004: Effect of rainfall sam-pling error on simulated hydrological fluxes and states: An-ticipating the Global Precipitation Measurement satellites. J.Geophys. Res., 109, D02103, doi:10.1029/2003JD003497.
North, G. R., and S. Nakamoto, 1989: Formalism for comparingrain estimation designs. J. Atmos. Oceanic Technol., 6, 985–992.
Petersen, W. A., and S. A. Rutledge, 2002: Regional variability intropical convection: Observations from TRMM. J. Climate,14, 3566–3586.
Seo, D.-J., J. P. Breidenbach, and E. R. Johnson, 1999: Real-timeestimation of mean field bias in radar rainfall data. J. Hydrol.,223, 131–147.
——, ——, R. Fulton, D. Miller, and T. O’Bannon, 2000: Real-time adjustment of range-dependent biases in WSR-88Drainfall estimates due to nonuniform vertical profile of reflec-tivity. J. Hydrometeor., 1, 222–240.
Shiklomanov, A. I., R. B. Lammers, and C. J. Vörösmarty, 2002:Widespread decline in hydrological monitoring threatenspan-Arctic research. Eos, Trans. Amer. Geophys. Union, 83,16–17.
Smith, E., and Coauthors, 2007: The international Global Precipi-tation Measurement (GPM) program and mission: An over-view. Measuring Rainfall from Space: EURAINSAT and theFuture, V. Levizzani and F. J. Turk, Eds., Kluwer Academic,722 pp.
Sorooshian, S., K.-L. Hsu, X. Gao, H. V. Gupta, B. Imam, and D.Braithwaite, 2000: Evaluation of PERSIANN system satel-lite-based estimates of tropical rainfall. Bull. Amer. Meteor.Soc., 81, 2035–2046.
Steiner, M., 1996: Uncertainty of estimates of monthly areal rain-fall for temporally sparse remote observations. Water Resour.Res., 32, 373–388.
——, T. L. Bell, Y. Zhang, and E. F. Wood, 2003: Comparison oftwo methods for estimating the sampling-related uncertaintyof satellite rainfall averages based on a large radar dataset. J.Climate, 16, 3759–3778.
Stokstad, E., 1999: Scarcity of rain, stream gages threatens fore-casts. Science, 285, 1199.
JUNE 2008 H O S S A I N A N D H U F F M A N 575


![Quantifying error in OSCE standard setting for varying ...eprints.whiterose.ac.uk/84990/1/QuantifyingErrorPaperRepository[1].pdf · Using a variety of metrics, the ‘quality’ of](https://img.pdfslide.us/doc/110x75/5abc03fc7f8b9a76038d67de/quantifying-error-in-osce-standard-setting-for-varying-1pdfusing-a-variety.jpg)