Embed Size (px)
Citation preview
Trajectories of criminal Trajectories of criminal behavior among adolescent behavior among adolescent substance users during substance users during treatment and thirty-month treatment and thirty-month follow-upfollow-up
Ya-Fen Chan, Ph.D., Rod Funk, B.S., & Ya-Fen Chan, Ph.D., Rod Funk, B.S., &
Michael Dennis, Ph.D. Michael Dennis, Ph.D.
Chestnut Health Systems, Bloomington, IllinoisChestnut Health Systems, Bloomington, Illinois
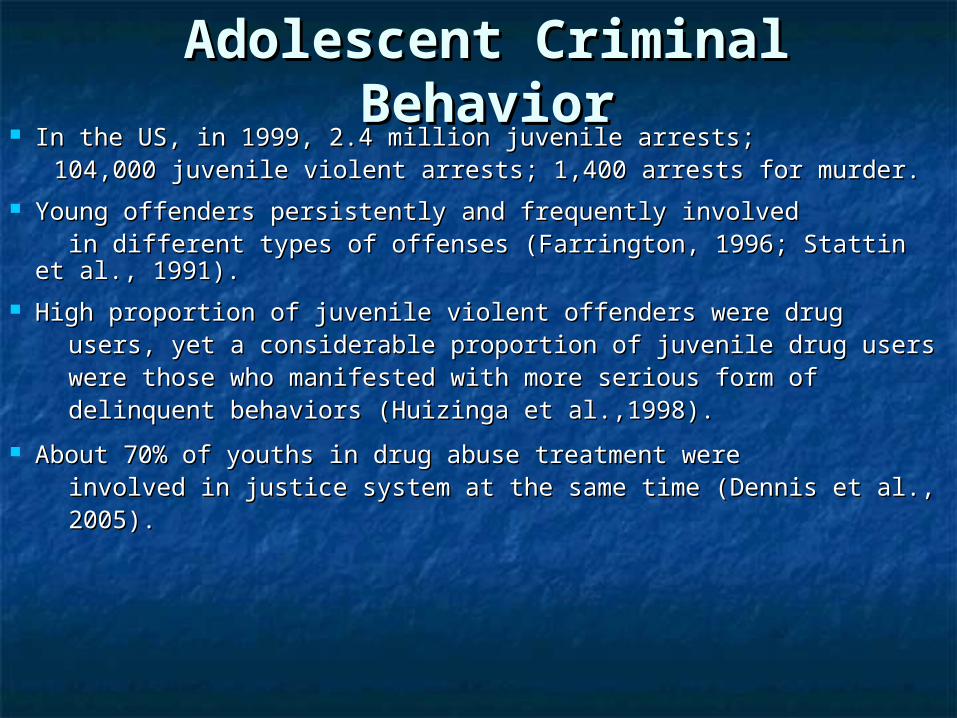
Adolescent Criminal BehaviorAdolescent Criminal Behavior In the US, in 1999, 2.4 million juvenile arrests; In the US, in 1999, 2.4 million juvenile arrests; 104,000 juvenile violent arrests; 1,400 arrests for murder.104,000 juvenile violent arrests; 1,400 arrests for murder.
Young offenders persistently and frequently involvedYoung offenders persistently and frequently involved in different types of offenses (Farrington, 1996; Stattin et al., 1991).in different types of offenses (Farrington, 1996; Stattin et al., 1991).
High proportion of juvenile violent offenders were drug High proportion of juvenile violent offenders were drug users, yet a considerable proportion of juvenile drug users users, yet a considerable proportion of juvenile drug users were those who manifested with more serious form of were those who manifested with more serious form of delinquent behaviors (Huizinga et al.,1998).delinquent behaviors (Huizinga et al.,1998).
About 70% of youths in drug abuse treatment were About 70% of youths in drug abuse treatment were involved in justice system at the same time (Dennis et al., involved in justice system at the same time (Dennis et al., 2005). 2005).
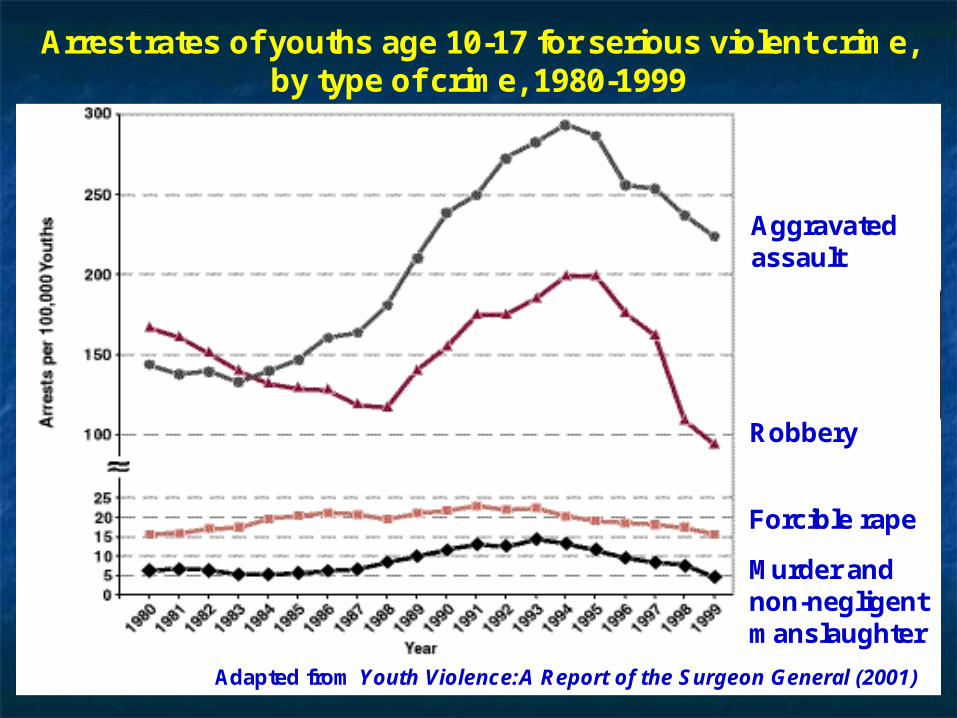
Arrest rates of youths age 10-17 for serious violent crime, by type of crime, 1980-1999
Murder and non-negligent manslaughter
Forcible rape
Robbery
Aggravatedassault
Adapted from Youth Violence:A Report of the Surgeon General (2001)
ObjectiveObjective
To identify the trajectories of criminal To identify the trajectories of criminal
behavior and its correlates among behavior and its correlates among
adolescent drug users from treatment adolescent drug users from treatment
entry to 3, 6, 9, 12, and 30 months entry to 3, 6, 9, 12, and 30 months
follow-upfollow-up
SampleSample
800 adolescents entering outpatient and residential 800 adolescents entering outpatient and residential substance abuse treatment in 6 cities (Farmington, substance abuse treatment in 6 cities (Farmington, CT; Madison County, IL; Oakland, CA; Philadelphia, CT; Madison County, IL; Oakland, CA; Philadelphia, PA; St. Petersburg, FL; Tucson, AZ) as part of the PA; St. Petersburg, FL; Tucson, AZ) as part of the Persistent Effects of Treatment Study of Persistent Effects of Treatment Study of Adolescents (PETS-A) were sampled.Adolescents (PETS-A) were sampled.
Adolescents were interviewed by research staff at Adolescents were interviewed by research staff at intake and 3, 6, 9, 12 and 30 months after intake, intake and 3, 6, 9, 12 and 30 months after intake, using the Global Appraisal of Individual Needs using the Global Appraisal of Individual Needs (GAIN). (GAIN).
Outcome MeasureOutcome Measure Criminal behaviors include indices related property Criminal behaviors include indices related property
crime, substance use related crime, and violent crime, substance use related crime, and violent crime.crime.
At intake, the past 12 month criminal behavior were At intake, the past 12 month criminal behavior were
assessed. For 3, 6, 9, 12 and 30 months follow-up, assessed. For 3, 6, 9, 12 and 30 months follow-up, the past three month criminal behavior were asked.the past three month criminal behavior were asked.
Participants with intake and at least four follow-up Participants with intake and at least four follow-up data were included. The missing wave was imputed data were included. The missing wave was imputed using interpolation of the prior and posterior waves using interpolation of the prior and posterior waves and the regression to project the missing wave. and the regression to project the missing wave.
Cluster AnalysisCluster Analysis A technique to develop typologies and identify A technique to develop typologies and identify
patters of association in a heterogeneous population patters of association in a heterogeneous population
Use Ward’s minimum distance with the measure of Use Ward’s minimum distance with the measure of Squared Euclidean Distance Squared Euclidean Distance
Cluster on different types of crime, days of illegal Cluster on different types of crime, days of illegal activity, days of illegal activity for money and days in activity, days of illegal activity for money and days in a controlled environmenta controlled environment
Once the cluster solutions are identified, the Once the cluster solutions are identified, the correlates can be examinedcorrelates can be examined
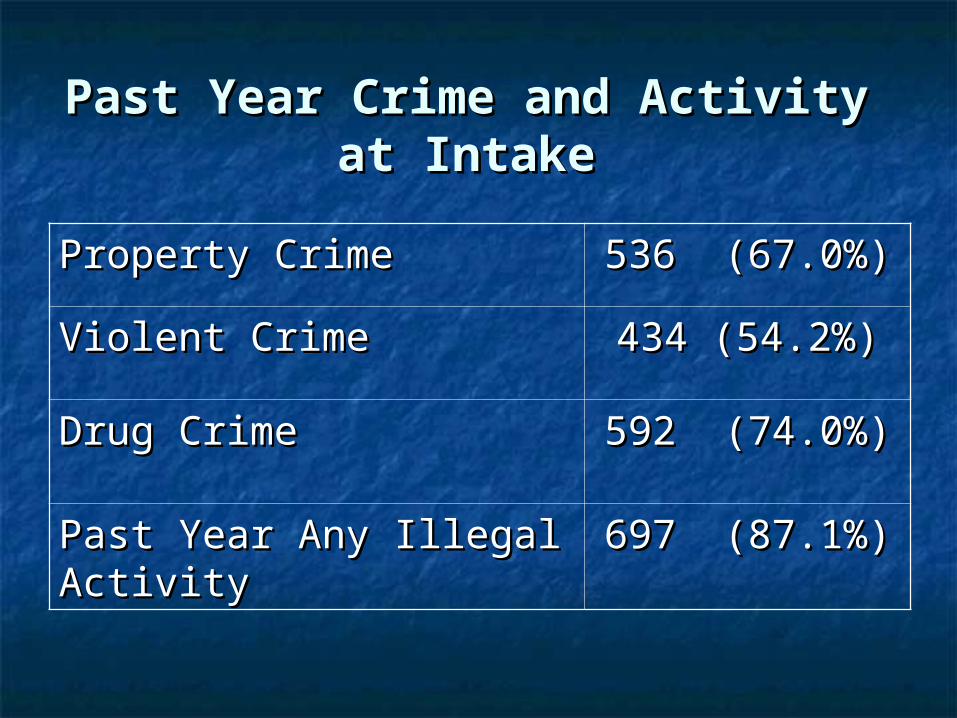
Past Year Crime and ActivityPast Year Crime and Activityat Intakeat Intake
Property CrimeProperty Crime 536 (67.0%)536 (67.0%)
Violent CrimeViolent Crime 434 (54.2%)434 (54.2%)
Drug CrimeDrug Crime 592 (74.0%)592 (74.0%)
Past Year Any Illegal ActivityPast Year Any Illegal Activity 697 (87.1%)697 (87.1%)
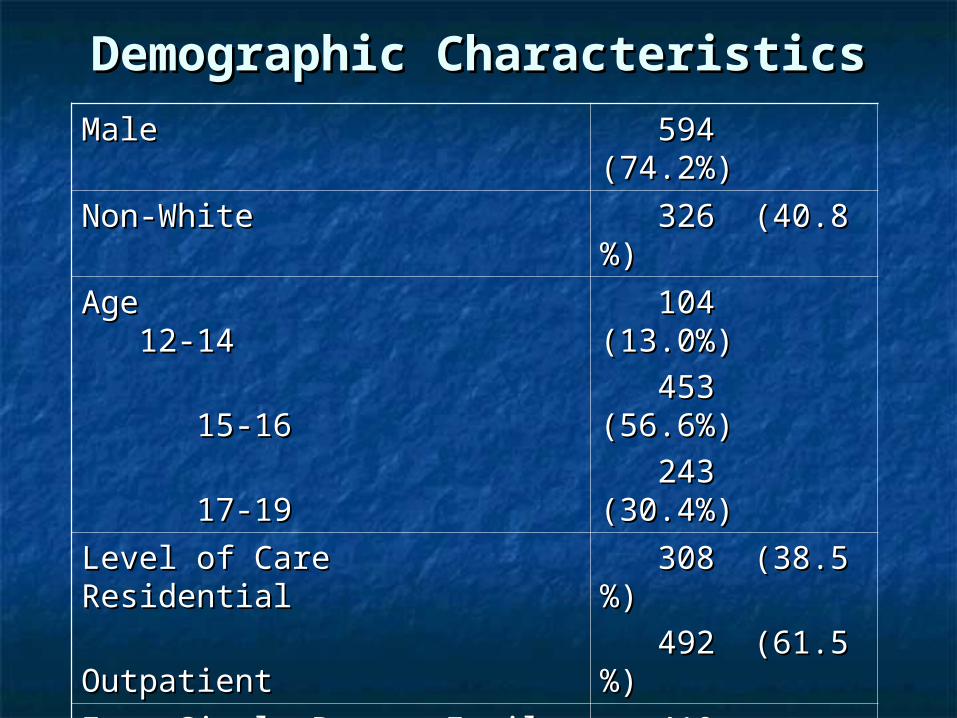
Demographic CharacteristicsDemographic Characteristics
MaleMale 594 (74.2%)594 (74.2%)
Non-WhiteNon-White 326 (40.8%)326 (40.8%)
Age 12-14Age 12-14
15-1615-16
17-1917-19
104 (13.0%)104 (13.0%)
453 (56.6%)453 (56.6%)
243 (30.4%)243 (30.4%)
Level of Care ResidentialLevel of Care Residential
OutpatientOutpatient
308 (38.5%)308 (38.5%)
492 (61.5%)492 (61.5%)
From Single Parent FamilyFrom Single Parent Family 410 (51.2%)410 (51.2%)
Age of First Drug Use <15Age of First Drug Use <15 704 (88.1%)704 (88.1%)
Ever Being Homeless or RunawayEver Being Homeless or Runaway 100 (15.5%)100 (15.5%)
Ever Being VictimizedEver Being Victimized 547 (68.4%)547 (68.4%)
Currently CJ InvolvementCurrently CJ Involvement 521 (65.1%) 521 (65.1%)
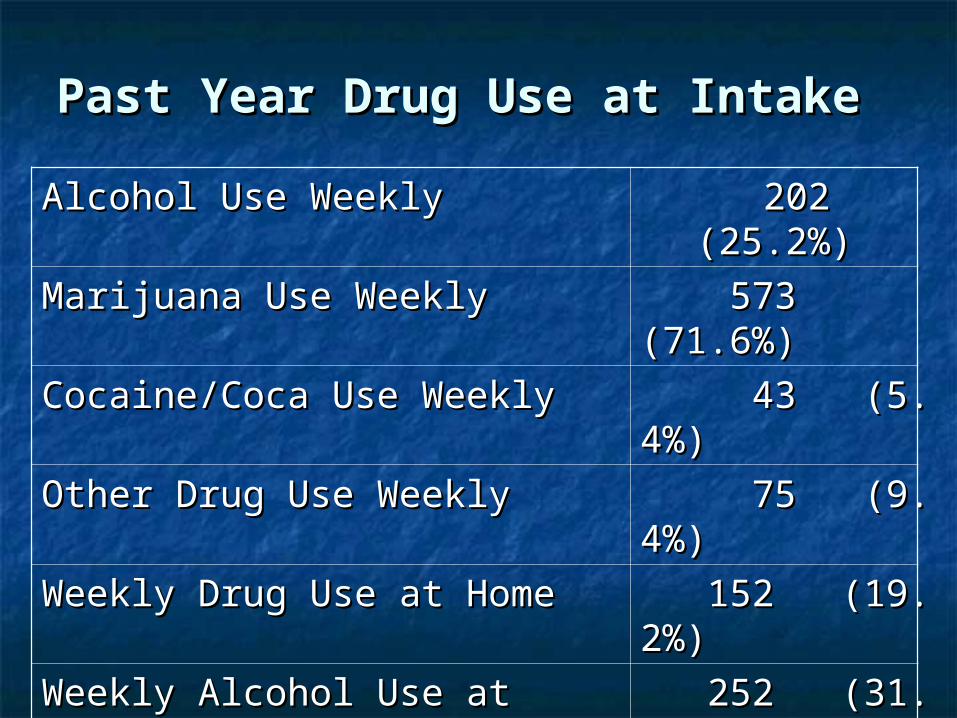
Past Year Drug Use at IntakePast Year Drug Use at Intake
Alcohol Use WeeklyAlcohol Use Weekly 202 (25.2%)202 (25.2%)
Marijuana Use WeeklyMarijuana Use Weekly 573 (71.6%)573 (71.6%)
Cocaine/Coca Use WeeklyCocaine/Coca Use Weekly 43 (5.4%)43 (5.4%)
Other Drug Use WeeklyOther Drug Use Weekly 75 (9.4%)75 (9.4%)
Weekly Drug Use at HomeWeekly Drug Use at Home 152 (19.2%)152 (19.2%)
Weekly Alcohol Use at HomeWeekly Alcohol Use at Home 252 (31.7%)252 (31.7%)
Social Peer Use Drug in the Past Social Peer Use Drug in the Past 90 Days90 Days
734 (92.2%)734 (92.2%)
Social Peer Use Alcohol WeeklySocial Peer Use Alcohol Weekly 564 (70.8%)564 (70.8%)
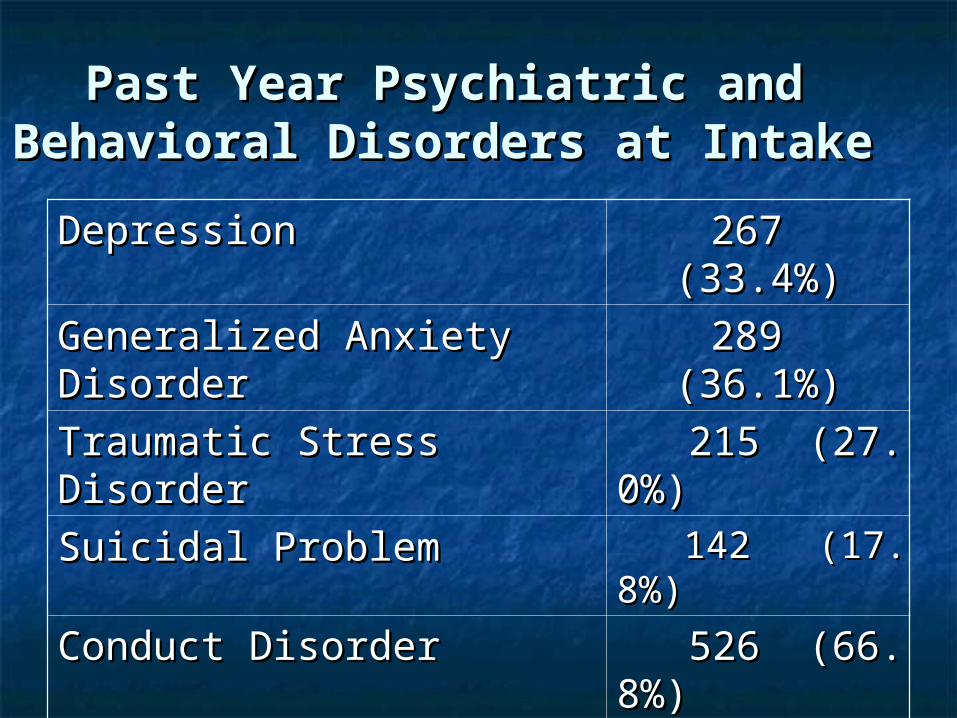
Past Year Psychiatric and Past Year Psychiatric and Behavioral Disorders at IntakeBehavioral Disorders at Intake
DepressionDepression 267 (33.4%)267 (33.4%)
Generalized Anxiety DisorderGeneralized Anxiety Disorder 289 (36.1%)289 (36.1%)
Traumatic Stress DisorderTraumatic Stress Disorder 215 (27.0%)215 (27.0%)
Suicidal ProblemSuicidal Problem 142 (17.8%)142 (17.8%)
Conduct DisorderConduct Disorder 526 (66.8%)526 (66.8%)
ADHDADHD 412 (51.5%)412 (51.5%)
Substance DependenceSubstance Dependence
AbuseAbuse
487 (60.9%)487 (60.9%)
292 (36.5%)292 (36.5%)
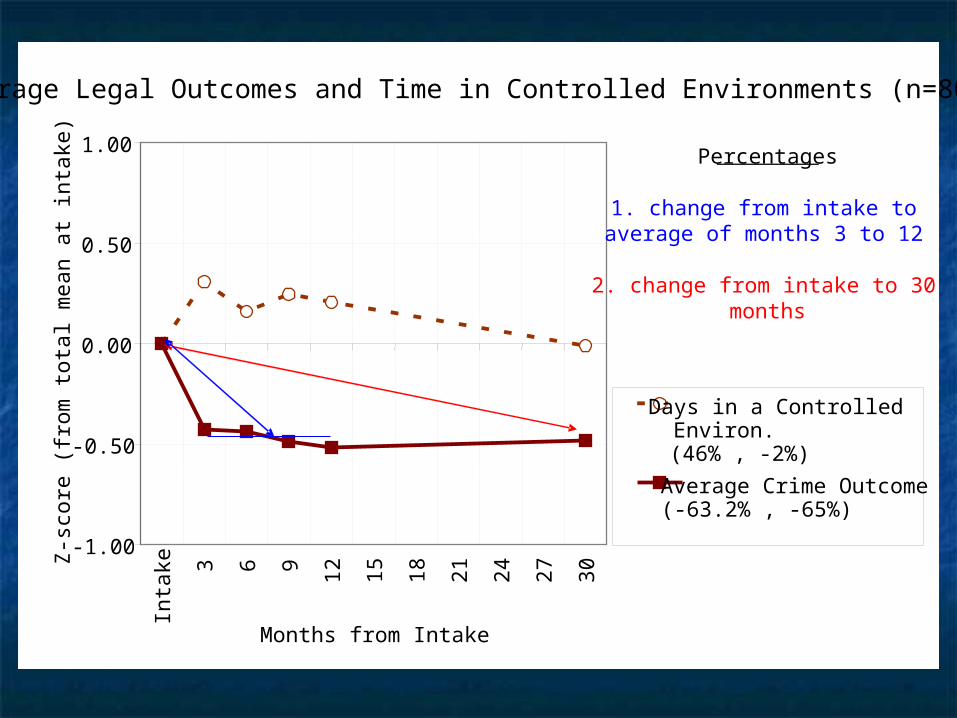
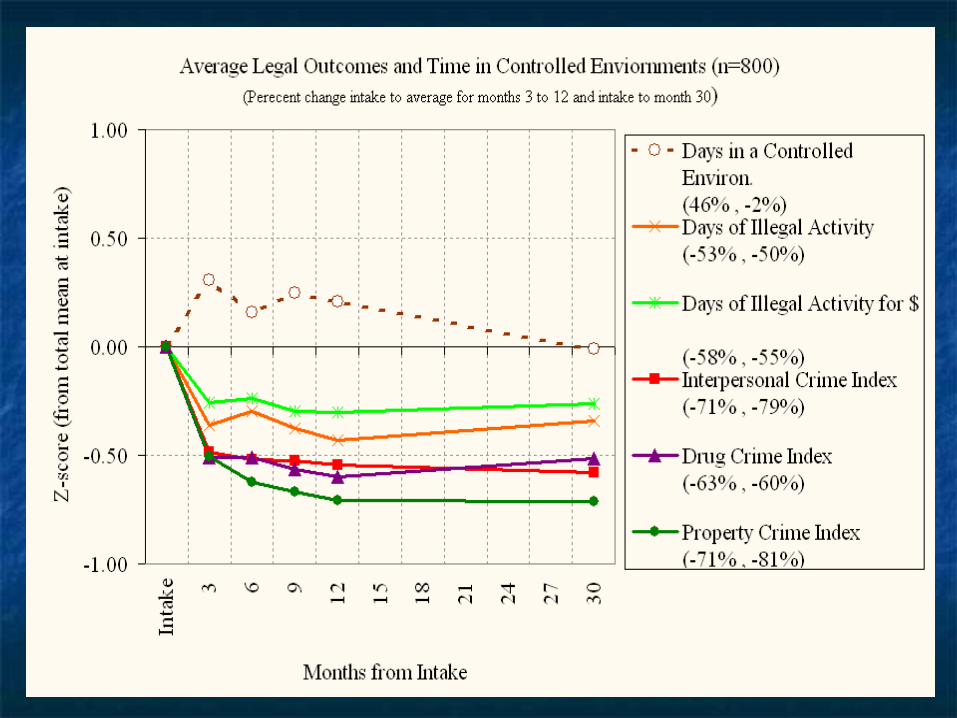
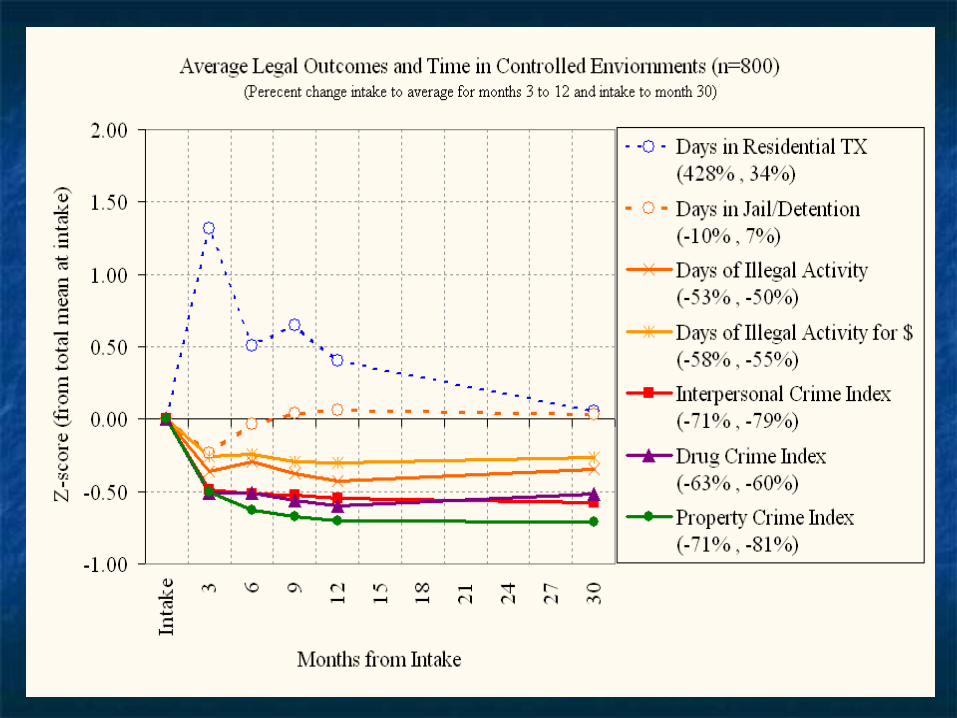
Average Legal Outcomes and Time in Controlled Environments (n=800)
-1.00
-0.50
0.00
0.50
1.00In
take 3 6 9 12 15 18 21 24 27 30
Months from Intake
Z-s
core
(fr
om to
tal m
ean
at in
take
)
Days in a ControlledEnviron.(46% , -2%)
Average Crime Outcome(-63.2% , -65%)
Percentages
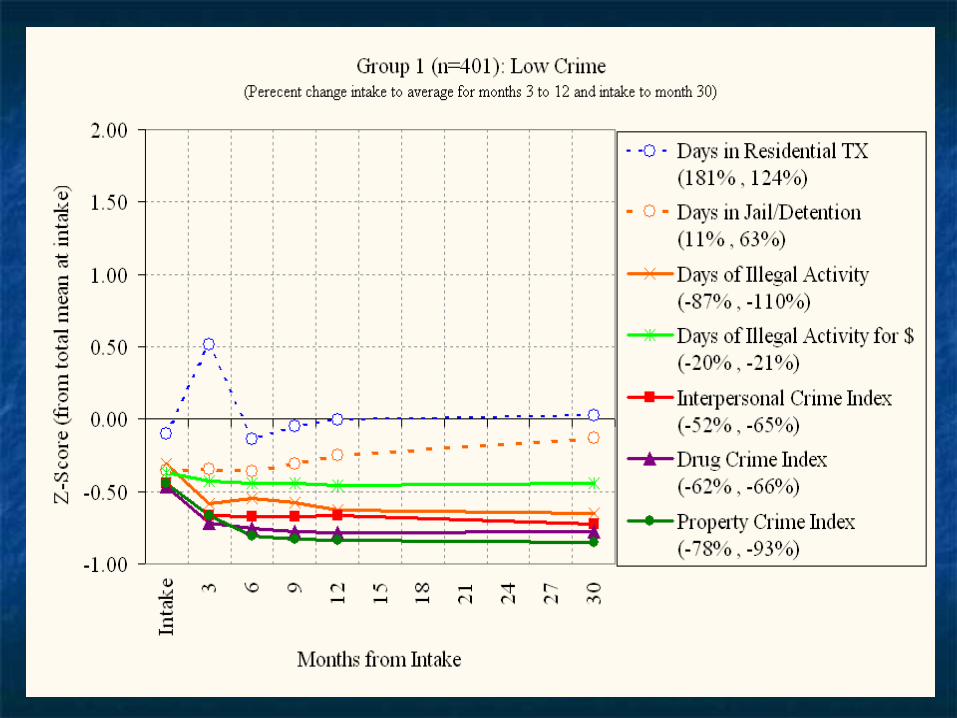
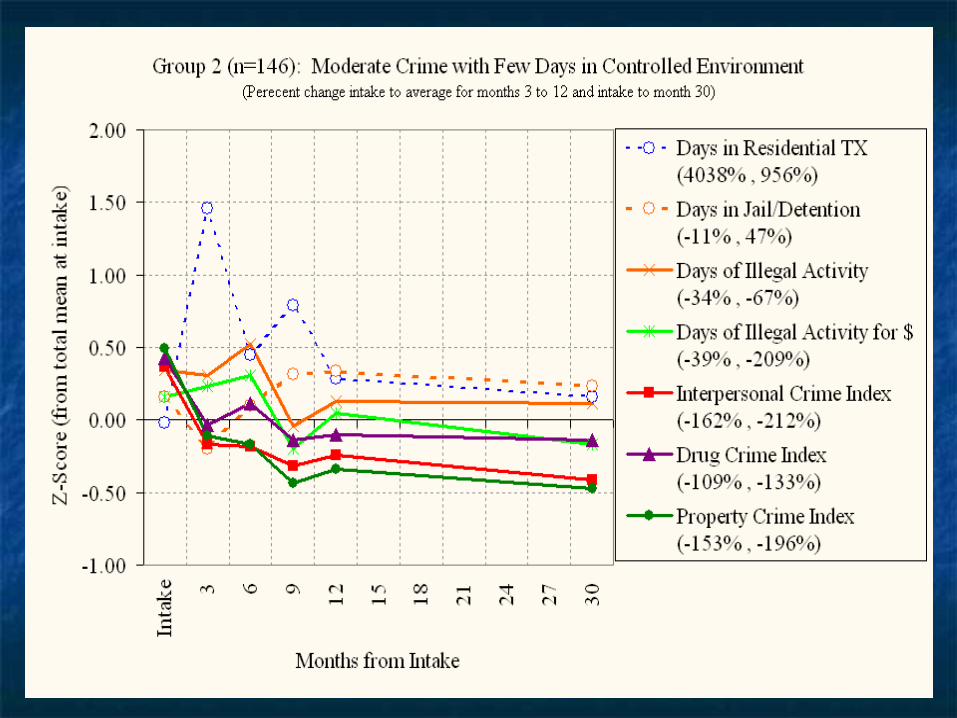
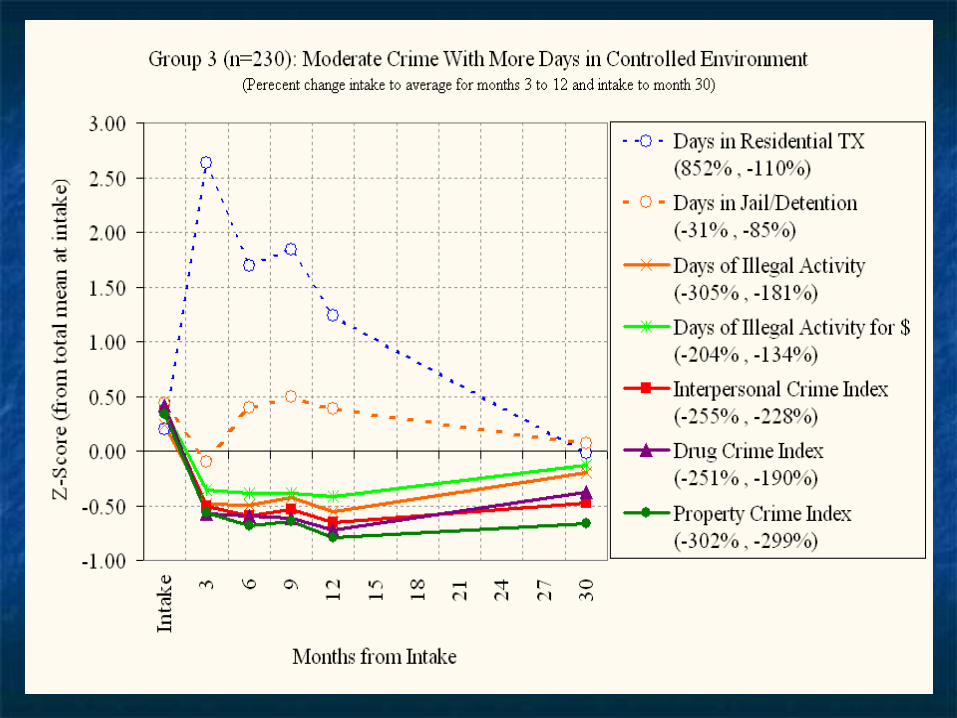
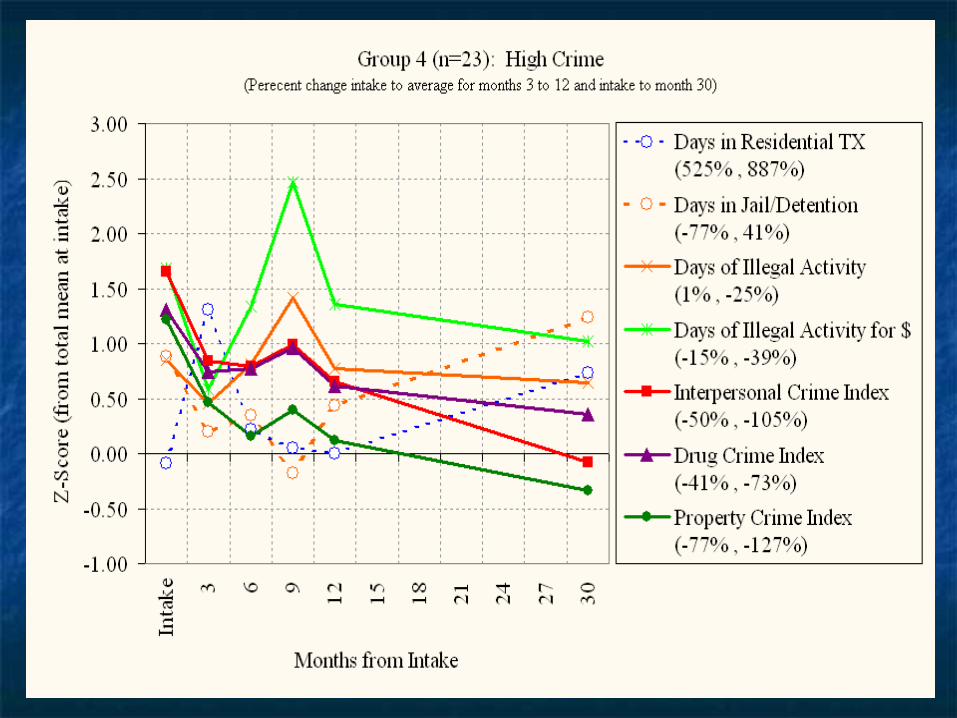
2. change from intake to 30 months
1. change from intake to average of months 3 to 12
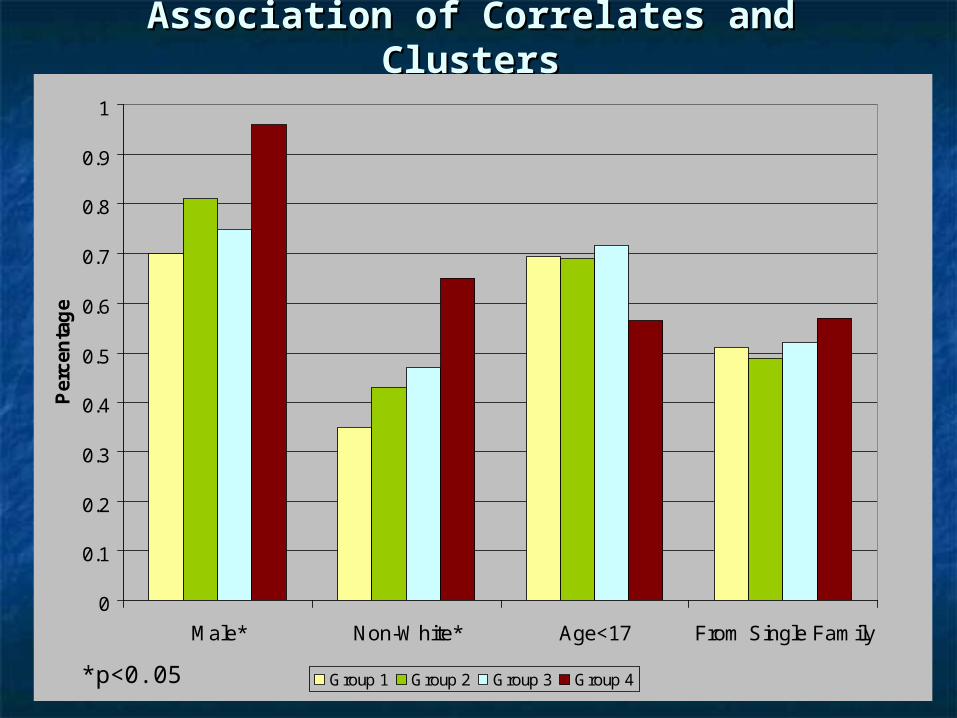
Association of Correlates and ClustersAssociation of Correlates and Clusters
0
0.1
0.2
0.3
0.4
0.5
0.6
0.7
0.8
0.9
1
Male* Non-White* Age<17 From Single Family
Per
cen
tag
e
Group 1 Group 2 Group 3 Group 4*p<0.05
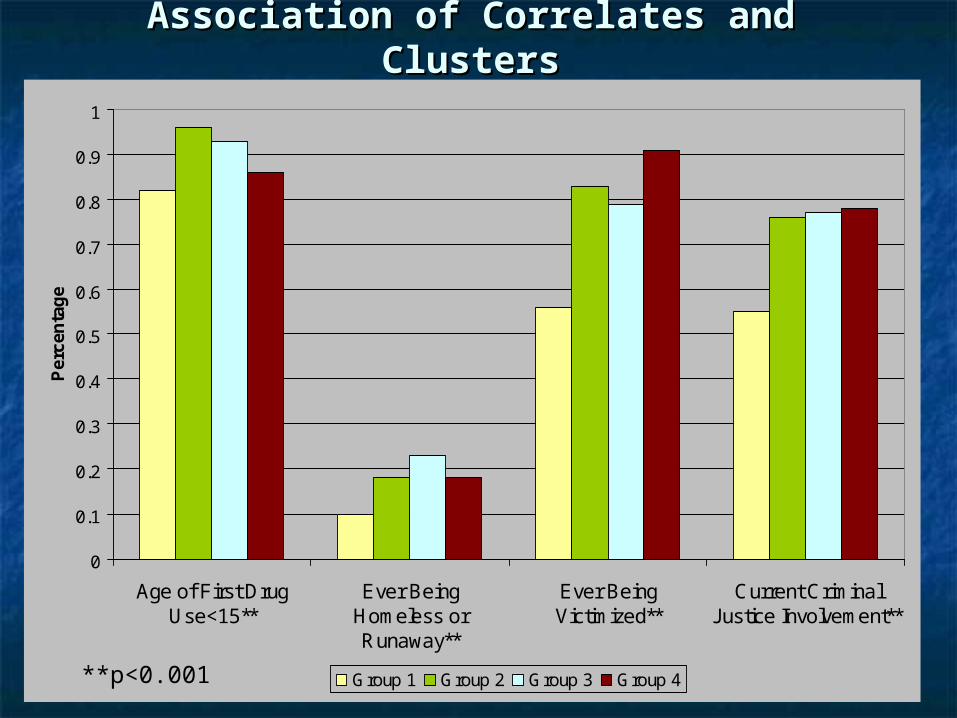
Association of Correlates and ClustersAssociation of Correlates and Clusters
0
0.1
0.2
0.3
0.4
0.5
0.6
0.7
0.8
0.9
1
Age of First DrugUse<15**
Ever BeingHomeless orRunaway**
Ever BeingVictimized**
Current CriminalJustice Involvement**
Per
cen
tag
e
Group 1 Group 2 Group 3 Group 4**p<0.001
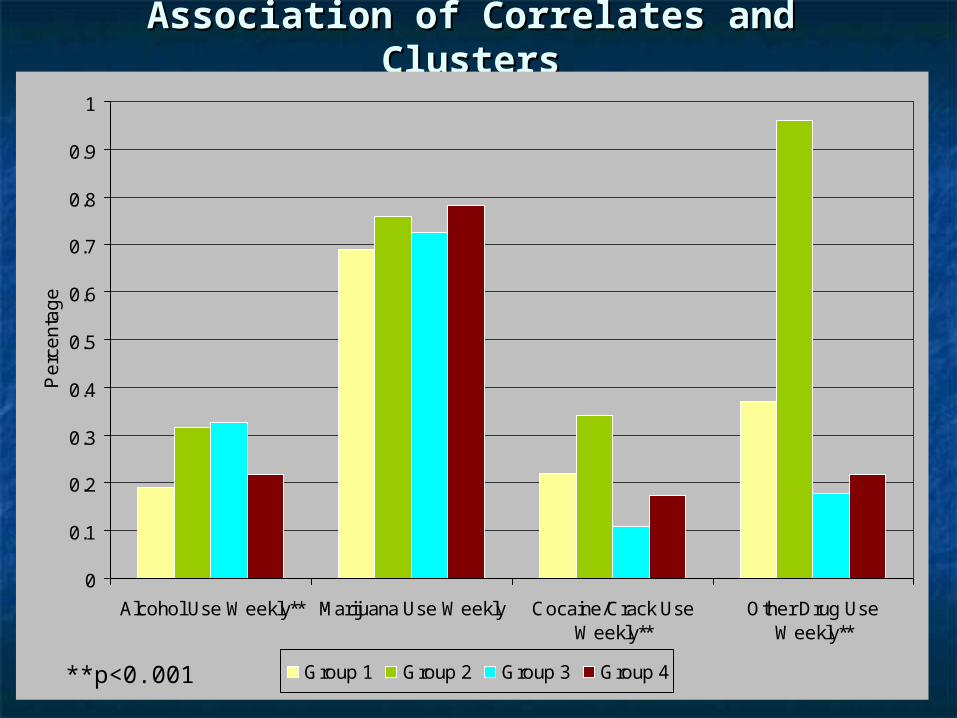
Association of Correlates and ClustersAssociation of Correlates and Clusters
0
0.1
0.2
0.3
0.4
0.5
0.6
0.7
0.8
0.9
1
Alcohol Use Weekly** Marijuana Use Weekly Cocaine/Crack UseWeekly**
Other Drug UseWeekly**
Pe
rce
nta
ge
Group 1 Group 2 Group 3 Group 4**p<0.001
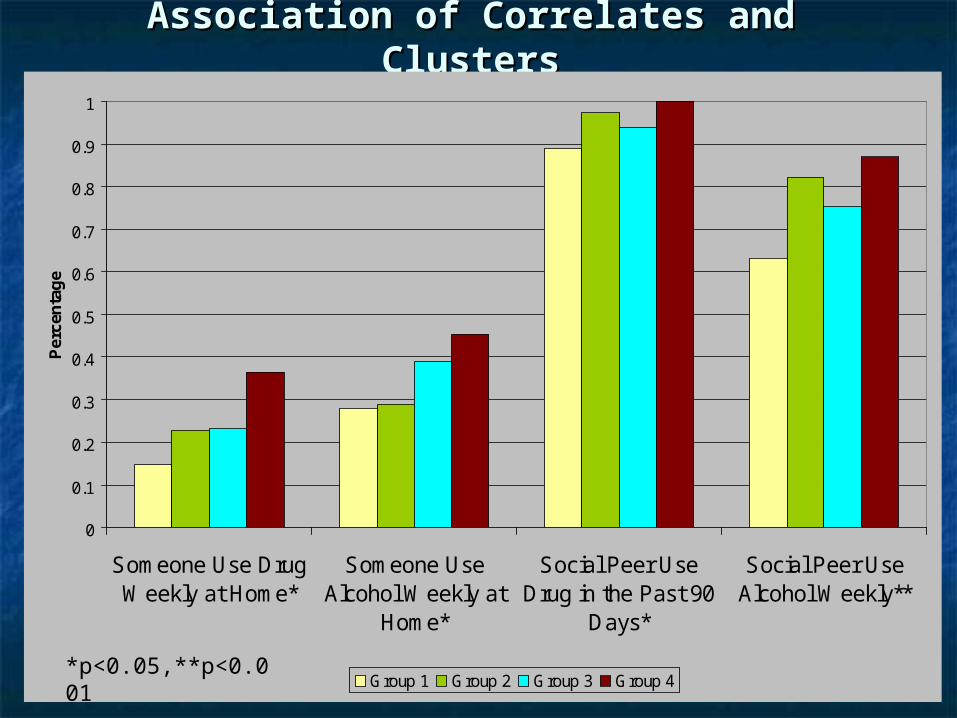
Association of Correlates and ClustersAssociation of Correlates and Clusters
0
0.1
0.2
0.3
0.4
0.5
0.6
0.7
0.8
0.9
1
Someone Use DrugWeekly at Home*
Someone UseAlcohol Weekly at
Home*
Social Peer UseDrug in the Past 90
Days*
Social Peer UseAlcohol Weekly**
Per
cen
tag
e
Group 1 Group 2 Group 3 Group 4*p<0.05,**p<0.001
Association of Correlates and ClustersAssociation of Correlates and Clusters
0
0.1
0.2
0.3
0.4
0.5
0.6
0.7
0.8
0.9
1
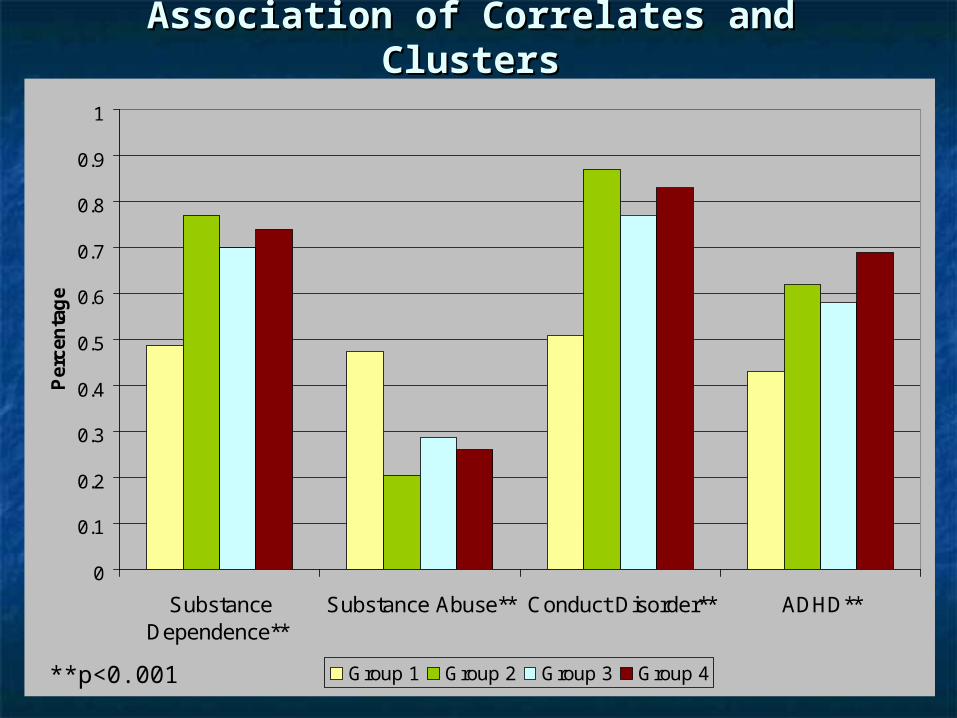
SubstanceDependence**
Substance Abuse** Conduct Disorder** ADHD**
Per
cen
tag
e
Group 1 Group 2 Group 3 Group 4**p<0.001
Association of Correlates and ClustersAssociation of Correlates and Clusters
0
0.1
0.2
0.3
0.4
0.5
0.6
0.7
0.8
0.9
1
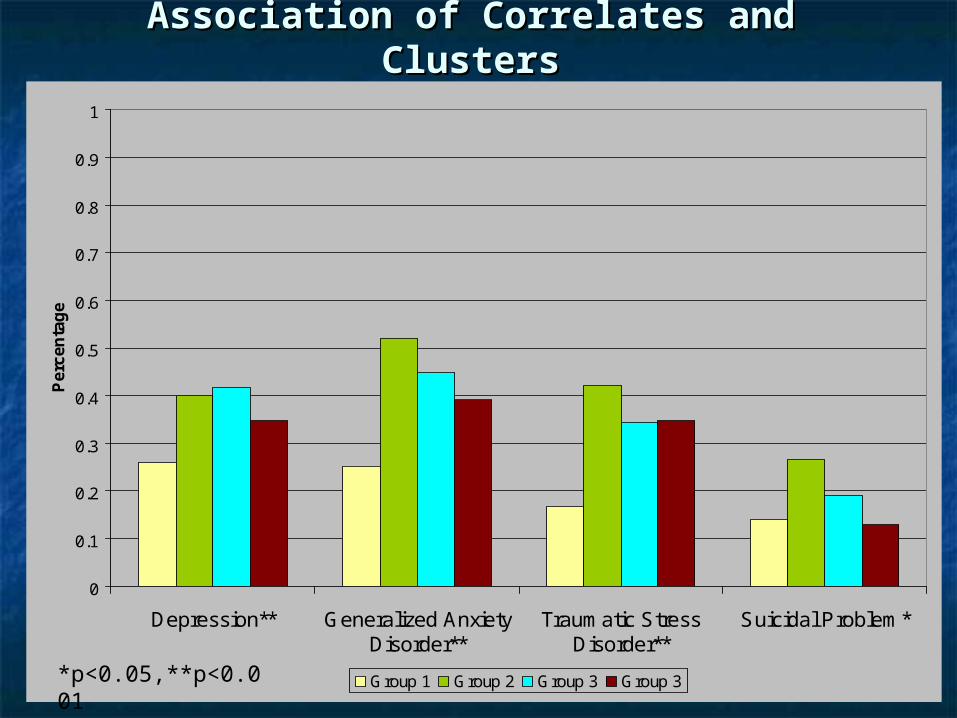
Depression** Generalized AnxietyDisorder**
Traumatic StressDisorder**
Suicidal Problem*
Per
cen
tag
e
Group 1 Group 2 Group 3 Group 3*p<0.05,**p<0.001
ConclusionsConclusions Treatment is associated with reductions in illegal Treatment is associated with reductions in illegal
activity and violence.activity and violence.
Without continuing care, these effects deteriorate over Without continuing care, these effects deteriorate over time and detention rates go back up for the moderate time and detention rates go back up for the moderate to high severity adolescents. to high severity adolescents.
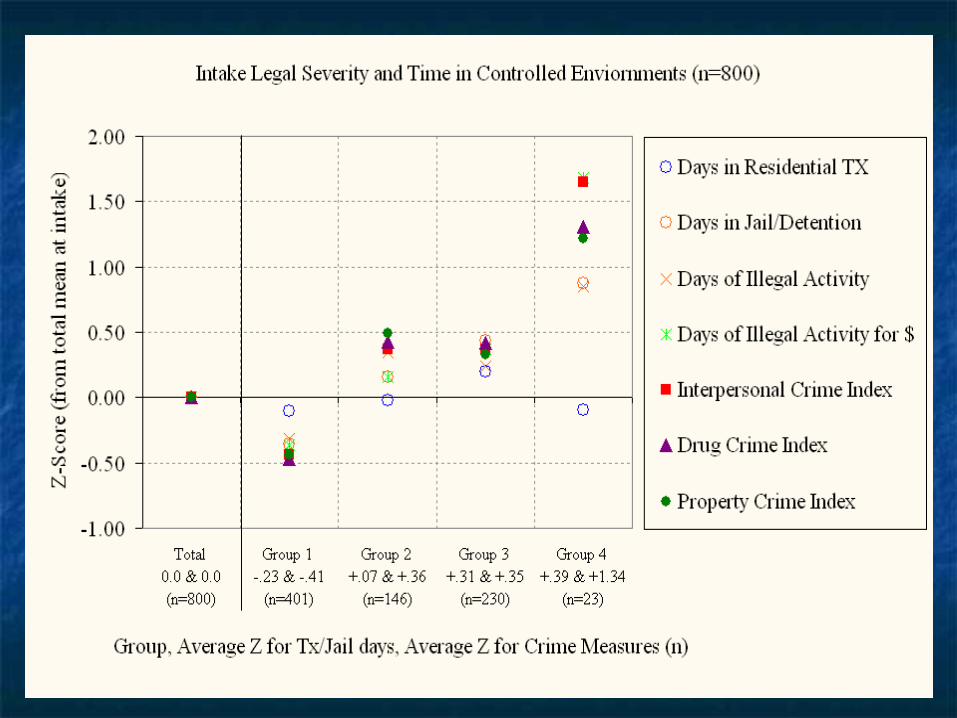
Adolescents with high crime/violence are particularly Adolescents with high crime/violence are particularly prone to relapse and recidivism and are the most likely prone to relapse and recidivism and are the most likely to be back in treatment, trouble or incarcerated at 30 to be back in treatment, trouble or incarcerated at 30 months. months.
This fourth group is more likely to be male, non-white, This fourth group is more likely to be male, non-white, victimized, involved with the juvenile justice system, victimized, involved with the juvenile justice system, and the most likely to be surrounded by other people and the most likely to be surrounded by other people using.using.
The two moderate groups are more likely to have The two moderate groups are more likely to have higher rates of psychiatric disorders.higher rates of psychiatric disorders.
Limitations, Strength Limitations, Strength & Next Steps& Next Steps
LimitationsLimitations self reportself report descriptive/observationaldescriptive/observational
StrengthsStrengths Detailed assessmentDetailed assessment Large sampleLarge sample High follow-up ratesHigh follow-up rates
Next StepsNext Steps Replicate with additional dataReplicate with additional data Predict trajectory likelihood based on intake and/or initial Predict trajectory likelihood based on intake and/or initial
response to treatment. response to treatment. Evaluate the impact of additional continuing care (e.g.., Evaluate the impact of additional continuing care (e.g..,
Godley experiment) on longer term trajectories.Godley experiment) on longer term trajectories.
AcknowledgmentAcknowledgment
The content of this presentations are based on treatment & research funded by the Center for Substance Abuse Treatment (CSAT), Substance Abuse and Mental Health Services Administration (SAMHSA) under contract 270-2003-00006 using data provided by the CYT and AMT grantees: (TI11320, TI11324, TI11317, TI11321, TI11323, TI11874, TI11424, TI11894, TI11871, TI11433, TI11423, TI11432, TI11422, TI11892, TI11888). The opinions are those of the author and do not reflect official positions of the consortium or government. Available on line at www.chestnut.org/LI/Posters or by contacting Joan Unsicker at 720 West Chestnut, Bloomington, IL 61701, phone: (309) 827-6026, fax: (309) 829-4661, e-Mail: [email protected]


![s3-us-west-2.amazonaws.comCi… · 324 Funk^G Funk Mark B l223Sanc]piperR(MW 274-4182 Funk Mike ll205H3rvestWoodRc»iE ... 226-1677 Funk Paul S 149SignatijreWaySW 246-3305 Funk R](https://img.pdfslide.us/doc/110x75/5f9f0b6f8b971057a170c737/s3-us-west-2-ci-324-funkg-funk-mark-b-l223sancpiperrmw-274-4182-funk-mike.jpg)