Embed Size (px)
Citation preview

Masters of Public Health Degree in Population Studies
The University of Zambia
Lusaka
2017
INVESTIGATING AFLATOXIN CONTAMINATION AND KNOWLEDGE
LEVELS IN PRODUCING SAFE PEANUT BUTTER AMONG SELECTED
LUSAKA URBAN PROCESSORS
By
Maureen Samson Banda
A Dissertation Submitted to the University of Zambia in Partial Fulfilment of the

ii
DECLARATION

iii
COPYRIGHT
All rights reserved. No part of this dissertation may be produced, stored in a retrieval
system or transmitted in any form or by other means, electronic, mechanical,
photocopy or recording without prior consent of the author.
@ Maureen Samson Banda

iv
CERTIFICATE OF APPROVAL
v
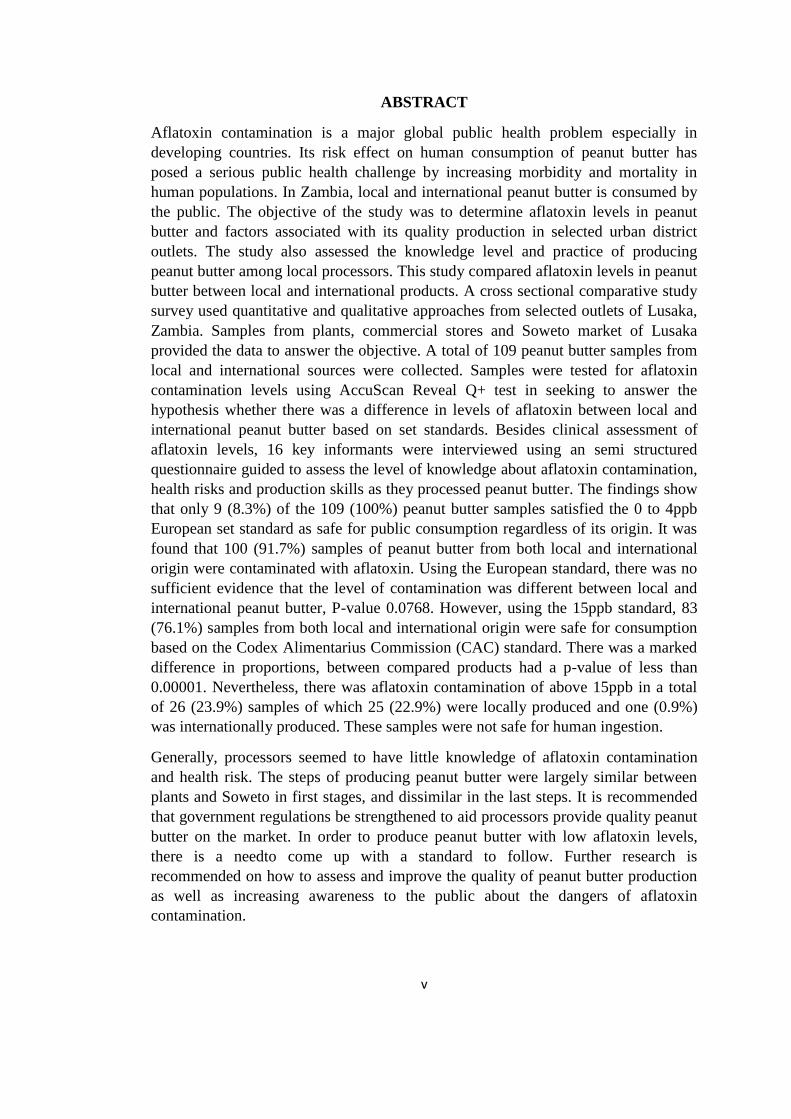
ABSTRACT
Aflatoxin contamination is a major global public health problem especially in
developing countries. Its risk effect on human consumption of peanut butter has
posed a serious public health challenge by increasing morbidity and mortality in
human populations. In Zambia, local and international peanut butter is consumed by
the public. The objective of the study was to determine aflatoxin levels in peanut
butter and factors associated with its quality production in selected urban district
outlets. The study also assessed the knowledge level and practice of producing
peanut butter among local processors. This study compared aflatoxin levels in peanut
butter between local and international products. A cross sectional comparative study
survey used quantitative and qualitative approaches from selected outlets of Lusaka,
Zambia. Samples from plants, commercial stores and Soweto market of Lusaka
provided the data to answer the objective. A total of 109 peanut butter samples from
local and international sources were collected. Samples were tested for aflatoxin
contamination levels using AccuScan Reveal Q+ test in seeking to answer the
hypothesis whether there was a difference in levels of aflatoxin between local and
international peanut butter based on set standards. Besides clinical assessment of
aflatoxin levels, 16 key informants were interviewed using an semi structured
questionnaire guided to assess the level of knowledge about aflatoxin contamination,
health risks and production skills as they processed peanut butter. The findings show
that only 9 (8.3%) of the 109 (100%) peanut butter samples satisfied the 0 to 4ppb
European set standard as safe for public consumption regardless of its origin. It was
found that 100 (91.7%) samples of peanut butter from both local and international
origin were contaminated with aflatoxin. Using the European standard, there was no
sufficient evidence that the level of contamination was different between local and
international peanut butter, P-value 0.0768. However, using the 15ppb standard, 83
(76.1%) samples from both local and international origin were safe for consumption
based on the Codex Alimentarius Commission (CAC) standard. There was a marked
difference in proportions, between compared products had a p-value of less than
0.00001. Nevertheless, there was aflatoxin contamination of above 15ppb in a total
of 26 (23.9%) samples of which 25 (22.9%) were locally produced and one (0.9%)
was internationally produced. These samples were not safe for human ingestion.
Generally, processors seemed to have little knowledge of aflatoxin contamination
and health risk. The steps of producing peanut butter were largely similar between
plants and Soweto in first stages, and dissimilar in the last steps. It is recommended
that government regulations be strengthened to aid processors provide quality peanut
butter on the market. In order to produce peanut butter with low aflatoxin levels,
there is a needto come up with a standard to follow. Further research is
recommended on how to assess and improve the quality of peanut butter production
as well as increasing awareness to the public about the dangers of aflatoxin
contamination.

vi
DEDICATION
This work is dedicated to the promotion of the good health of the Zambian
population.

vii
ACKNOWLEDGEMENTS
It has been a long journey but the Lord has been good throughout this research work.
I give thanks to Him who is my Master and Lord indeed.
A special gratitude again goes to the staff at the University of Zambia’s School of
Agriculture and Microbiology laboratory, particularly and specifically to Munsanda
and Hendrix for the great work of being there when I needed their help during
sample testing. Without your support, this work would not have been completed
when it was.
My husband, Amos, has been on my side through and through giving support and
understanding at all times. Anikonda, my son, drove me to and from the laboratory,
helping me carry samples daily until laboratory works were over. Tiwonge, my little
girl, helped clean up the mess one day when I was running behind time. She ran most
of my business errands and prayed much for me. Herbalife meetings suffered my
absence on several occasions when I could not provide my assistance and presence.
My friends HenitaSimate and Beatrice Chikotola with their busy schedules, accepted
to read through my work occasionally and gave valued counsel. To others not
mentioned here but have contributed in one way or another, I say thank you for your
support in this way. An exceptional appreciation to Professor BabatundeAgbola who
read through the whole document page by page and nowI can submit the work for
examination, I salute you.
Special thanks to my “principle” supervisor Dr. Rosemary Ndonyo Likwa for being a
valuable critique in ensuring that this work is of good quality the way it has become.
I am grateful to Dr. Phoebe Bwembya, Mr. Allan Mbewe and Dr. Jeremiah Banda,
all of whom I often troubled to check my work and who put in their best to assist in
the quality output of this work. May the Lord bless you all. I also thank the faculty in
the Department of Public Health for their tireless assistance in so many ways
including financial help, especially when all hopes seeded lost. I owe each one of
you a debt of gratitude and plead that this gesture be extended to others that will
come after me. Sirs and madams, may the Lord return much more from where you
took out to assist me in testing for Aflatoxin in peanut butter.

viii
TABLE OF CONTENTS
COPYRIGHT…………………………………………………………………
DECLARATION……………………...……………………………………….ii
CERTIFICATE OF COMPLETION………………………………………..iii
ABSTRACT…………………………………………………………………….iv
DEDICATION………………………………………………………………….v
ACKNOWLEDGEMENTS…………………….…………………………….vi
LIST OFTABLE………………………………………………………………vii
LIST OF FIGURES…………………………………………………………..viii
LIST OF APPENICES………………………………………………………..ix
ACRONYMS……………………………………………................................x
CHAPTER ONE: INTRODUCTION……………………………………….1
1.1 Background………………………..……………………………………1
1.2 Statement of the Problem………………………………………………3
1.3 Conceptual Framework…………………………………………..…….5
1.4 Rationale…………………………….………………………………….6
1.5 Research Questions………………………………………….…………7
1.5.1 General Objective………………………………………………………7
1.5.2 Specific Objectives………………………………………….………….7
1.6 Ethical Consideration…………………………………………………..7
CHAPTER TWO: LITERATURE REVIEW……………………………..9
2.1 Aflatoxin and Processing……………………………………………….9
2.2 Aflatoxin Measurements……………………………………………….11
2.3 Aflatoxin and Health……………………………………………..…….12
2.3.1 Global…………………………………………………………………..13
2.3.2 Regional………………………………..………………………………14
2.4 Zambian Safe Peanut Processing Guidelines………………………….16
2.4.1 Challenge of Aflatoxin Control………………………………………..16

ix
2.5 Aflatoxin Reduction Measures………………………………………....18
CHAPTER THREE: METHODOLOGY………………………………….20
3.1 Study Site………………………………………………………………20
3.2 Study Design……………………………………………………………21
3.3 Variables and Measurements………………………….………………..21
3.4 Sampling Procedure………………………………………..………….22
3.4.1 Sample Size……………………………………………....……………23
3.4.2 Sample Size Distribution………………………………………………24
3.4.3 Canister Sample Selection Procedure………………………………….25
3.4.4 Canister Coding and Characteristics…………………………………..26
3.5 Testing Peanut Butter Samples………………………………………..26
3.5.1 Sample Preparation and Extraction……………………………………26
3.5.2 Testing Procedures…………………………………………………….26
3.5.3 Reading Test Results………………………………………………….27
3.6 Data Entry and Analysis………………………………………………28
3.7 Pre-testing the Tool…………………………………………………...28
3.8 Qualitative Data Collection and Analysis…………………………….28
3.9 Eligibility Criteria……………………………………………………..29
CHAPTER FOUR: STUDY RESULTS……………………………………30
4.0 Introduction…………………………………………………………….30
4.1 Quantitative Results……………………………………………………30
4.1.1 Descriptive Summary…………………………………………………..30
4.1.1.1 Centrality and Variation………………………………………………..30
4.1.1.2 Aflatoxin Contamination in Relation to Texture………………………32
4.1.1.3 Aflatoxin Contamination in Relation to Shelf-life…………………….33
4.1.1.2 Aflatoxin Contamination in Relation to Standards..…………………..34
4.1.2 Inferential Results………………………………………………………...35
4.1.2.1 Parametric Test of Aflatoxin Contamination by Origin………………..35
4.1.2.2 Log of Aflatoxin Contamination by Origin…………………………….36

x
4.1.2.3 Parametric Test of Aflatoxin Contamination by Set Standard………….37
4.2 Qualitative Results……………………………………………………….37
4.2.1 Introduction……………………………………………………………....37
4.2.2 Demographic Characteristics of Respondents…………………………...38
4.2.3 Knowledge of Aflatoxin Contamination…………………………………38
4.2.4 Knowledge of Aflatoxin Health Risks…………………………………...40
4.2.5 Safe Peanut Butter Production Skills…………………………………….42
4.2.5.1 Cleaning of the Processing Machine……………………………….........42
4.2.5.2 Processing Steps of Peanut Butter………………………………………..42
4.2.5.4 Inspection by Health Officers……………………………………………..45
4.2.5.5 Distribution of Peanut Butter……………………………......................46
CHAPTER FIVE: DISCUSSION OF FINDINGS……………………………47
5.1 Aflatoxin Contamination in General……………………………………...47
5.2 Aflatoxin Contamination in Relation to Set Standards…………………..48
5.2.1 Aflatoxin Contamination Knowledge………………………………….....49
5.2.2 Health Risk Knowledge…………………………………………………..51
5.2.3 Safe Peanut Butter Production Skills……………………………………..52
5.2.3.1 Cleanliness of the Machine………………………………......................53
5.2.3.2 Inspection by Officers……………………………………………………..54
5.2.3.3 Distribution of Peanut Butter………………………………………...........55
5.4 Limitations………………………………………………………..............56
CHAPTER SIX: CONCLUSION AND RECOMMENDATIONS…………,..56
6.1 Conclusion…………………………………………………………………57
6.2 Recommendations………………………………………………………….57
REFERENCES……………………………………………………………………60
APPENDICES…………………………………………………………………….64

xi
LIST OF TABLES
Table 1: Peanut Butter Specification……………………………………………...15
Table 2: Variables and Measurements…………………………………………….21
Table 3: Actual Sample Size for Peanut Butter canisters…………………………24
Table 4: Descriptive Summary Statistics of Peanut Butter...............................29
Table 5: Descriptive Summary of Aflatoxin Concerns…………………………….30
Table 6: Peanut Butter Contamination in Relation to Texture …………………….31
Table 7: Proportions of Contamination in Specific Standards.............................32
Table 8: Demographic Characteristics of Processors……………………………….36
Table 9: How Processors Distinguished Good from bad Groundnuts ….…………37

xii
LIST OF FIGURES
Figure 1: Aflatoxin ICRISAT in Peanut…………………………………………..04
Figure 2: Conceptual Framework for Level of Aflatoxin in Peanut Butter………05
Figure 3: Map for Peanut Butter Sample Collection……………………………..20
Figure 4: Aflatoxin Concentration by Origin……………………………………..33
Figure 5: Log of Aflatoxin Concentration by Origin…....................................34
Figure 6: Sorting Groundnuts before Processing……......................................39
Figure 7: Flow Chart for Peanut Butter Processing………………………………41

xiii
LIST OF APPENDICES
Appendix 1: Information Sheet and Consent Form………………………………..61
Appendix 2: Nyanja Translation of the Information Sheet and Consent Form……65
Appendix 3: Semi-Structured Questionnaire Interview Guide for Processors and
retailers in Lusaka urban district…………………………………..69
Appendix4: Nyanja Translation, Mafunso a Mapangidwe a Pinati Bata a
opanga ndi ogulitsa m’malo a Lusaka district……………… …….74
Appendix 5: Two sample T test Calculations…………………..………………….79
Appendix 6: Test of Proportions……………………………………………………80
Appendix 7: Summary Statistics of Aflatoxin Brands………….........................81

xiv
ACRONYMS
AOAC Association of Official Analytical Chemists- method 925.40, moisture
in nuts and nut products. Method 935.53- Fiber in nuts and nut
products.
CAC Codex Alimentarius Commission- international regulatory board
which sets limits on food safety commodities for consumer safety.
HACCP Hazard Analysis Critical Control Point
HPLC High Performance Liquid Chromatographic
EFSA European Food Safety Authority
EU European Union
ICRISAT International Crops Research Institute for the Semi-Arid Tropics
IUPAC International Union of Pure and Applied Chemists
LP Level of processing
MTL Maximum Tolerated Level
TLC Thin Layer Chromatography
USAID United States Agency for International Development
ZABS Zambia Bureau of Standards
ng/kg Nanogram per kilogram body weight per day
μg/kg Microgram per kilogram
ppb Parts per billion

1
CHAPTER ONE
INTRODUCTION
1.1 Background
Aflatoxin contamination is a major global Public Health problem especially in
developing countries and may account for as high as 28% of all global liver cancer
cases (Liu and Wu, 2010). Several epidemiological studies in Africa and Asia have
demonstrated an association between dietary Aflatoxin and liver cancer, the
International Agency for Research on Cancer (IARC) in 1988, placed aflatoxin B1
on the list of human carcinogens (IARC, 2002). Further, the occurrence and extent of
aflatoxin contamination varies and is influenced by many environmental factors
including geographical location, suboptimal agriculture and agronomic practices
susceptibility of commodity to fungal invasions pre-harvest, transportation, storage
and processing (Georgiadou et al. 2012, Schwartzbord and Brown, 2015 and Mutegi
et al. 2013).
According to Gulchi (2015), aflatoxin is a naturally occurring toxic secondary
metabolite produced by fungi Aspergillus flavis and Aspergillus parasiticus, soil
borne fungi which can grow on both living and dead plant matter. Gulchi further
stated that moisture, due to high heat accumulation, influence fungi populations in
the soil. When temperature increases in the soil, moisture reduces causing drought
stress. Fungi competition with inactivity progression lead to production of increased
toxins on groundnuts. Further, aflatoxin producing strains, Aspergillus flavis and A.
parasiticus can grow at optimum temperatures ranging from 32 to 33 degrees
centigrade (UÇKUN and Işıl, 2014). Aflatoxin contamination development begins
with fungus in the soil and dead matter in the field (Atayde et al. 2012). Since
aflatoxin occurs naturally, it cannot be terminated or eradicated completely but can
be reduced to low levels that are safe for human consumption (Shephard, 2008).
Historically, aflatoxins were first discovered as a result of the deaths of over 100,
000 young Turkeys in England in 1960 from a new disease termed “Turkey X
disease” (Blount, 1961). Guo et al. (2009) also reported ‘‘Turkey X disease’’
outbreak which occurred in more than 150 villages in Western India in 1974 where
397 persons were affected and 108 persons died (cited in Krishnamachari et al.
1975). The investigations on the poultry and ducklings outbreak of “Turkey X

2
disease” by Blount (1961) revealed that there was an association between the feed
given to these birds, a Brazilian peanut meal and the high toxins. Since then,
aflatoxin has been of interest for study by scientists (Shephard, 2008). In rural
Kenya, a largest outbreak happened in April 2004 where 317 cases and 125 deaths of
mostly children were reported because of eating aflatoxin contaminated maize
(Lewis et al. 2005). When highly aflatoxin contaminated products are consumed or
just chronic consumed in low doses, health risk problems such as, liver cancers,
aflatoxicosis, liver cirrhosis, stunted growth, low immunity and eventually death can
occur (Guo et al. 2009, Schwartzbord and Brown, 2015, Nyikal et al. 2004). Again
literature reveals that highly contaminated peanut products contribute to economic
loss for the traders (N’dede et al. 2012).
Based on findings from various studies, many countries have set standards for safe
tolerable limits for humans to consume in different products (Njumbe et al. 2014).
Current local and international Maximum Tolerated Levels for developing countries,
as imposed by the European Union (EU), are between 4μg/kg and 30μg/kg (FAO,
2003, Njumbe et al. 2014). Furthermore, legislation in the EU sets maximum
aflatoxin levels for groundnuts destined for processing within the EU at 10 ppb and
for those destined for direct human consumption at 4ppb (Otsuki et al. 2001, FAO,
2003). In some developing nations, including Zambia, where limits are not yet in
place, 15μg/kg has been imposed as maximum acceptable levels of flatoxin for safe
consumable peanut products (EFSA, 2007 and ZABS, 2008). The US Food and Drug
Administration set guidelines for maximum allowable limit at 20ppb for food and
feed in developing countries (Guo et al. 2009).
With regard to aflatoxin knowledge among stakeholders, Azaman et al. (2016) found
that this was necessary. Processor knowledge contributed greatly to aflatoxin
reduction in peanut products in their study. Little is known about processor
knowledge on aflatoxin contamination and health risks associated with consumption
of aflatoxin peanut butter in Lusaka urban district. Besides, skills used to produce
peanut butter in these outlets is also scarce. For example, whether sorting is done to
remove bad affected and poor grade groundnuts to encourage use of good groundnuts
for processing peanut butter is not known. This study is the first to source such
knowledge from processing plants, hence the gap to be filled. Availing aflatoxin
knowledge to stakeholders like farmers, processors, traders and consumers is
3
necessary. This knowledge can be used in Public Health as base for interventions
essential to address aflatoxin concerns. Increasing aflatoxin related research efforts
can bring about vital realistic and helpful knowledge. Wild and Gong (2002) stated
in their review that Toxicology of aflatoxin has paved way to provide base for
decision making in Public Health on acceptable exposures and interventions to
reduce aflatoxin contamination risks in human.
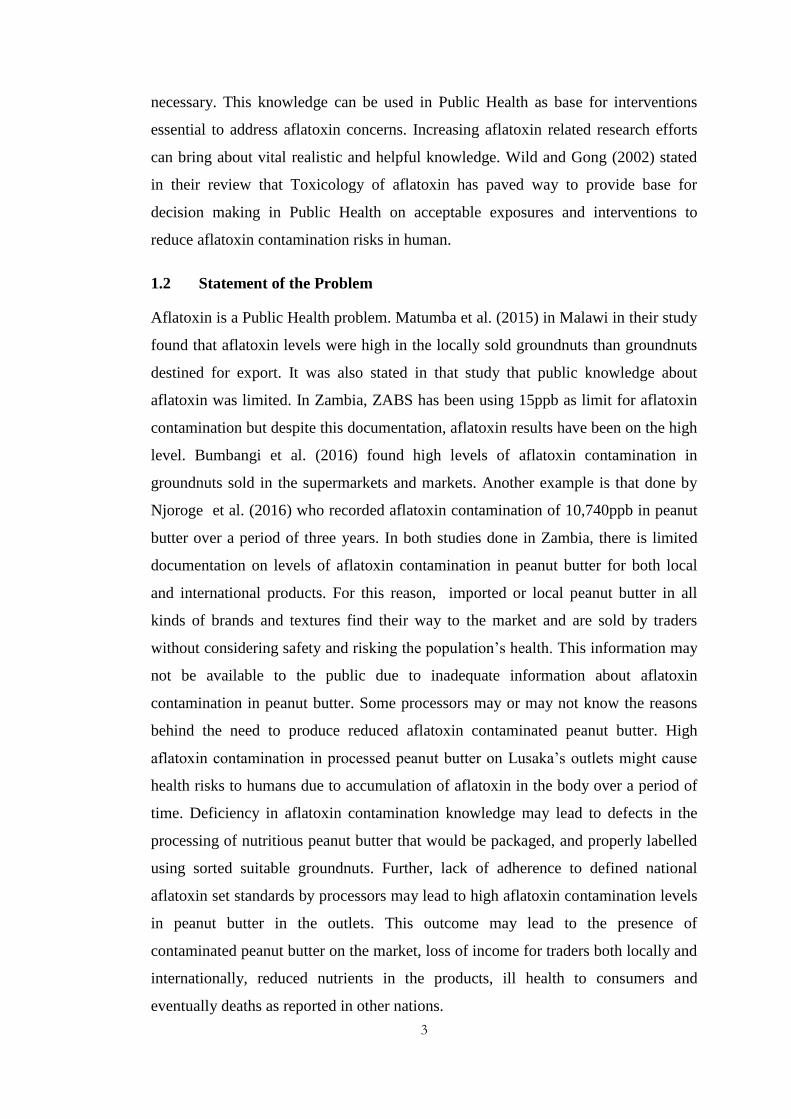
1.2 Statement of the Problem
Aflatoxin is a Public Health problem. Matumba et al. (2015) in Malawi in their study
found that aflatoxin levels were high in the locally sold groundnuts than groundnuts
destined for export. It was also stated in that study that public knowledge about
aflatoxin was limited. In Zambia, ZABS has been using 15ppb as limit for aflatoxin
contamination but despite this documentation, aflatoxin results have been on the high
level. Bumbangi et al. (2016) found high levels of aflatoxin contamination in
groundnuts sold in the supermarkets and markets. Another example is that done by
Njoroge et al. (2016) who recorded aflatoxin contamination of 10,740ppb in peanut
butter over a period of three years. In both studies done in Zambia, there is limited
documentation on levels of aflatoxin contamination in peanut butter for both local
and international products. For this reason, imported or local peanut butter in all
kinds of brands and textures find their way to the market and are sold by traders
without considering safety and risking the population’s health. This information may
not be available to the public due to inadequate information about aflatoxin
contamination in peanut butter. Some processors may or may not know the reasons
behind the need to produce reduced aflatoxin contaminated peanut butter. High
aflatoxin contamination in processed peanut butter on Lusaka’s outlets might cause
health risks to humans due to accumulation of aflatoxin in the body over a period of
time. Deficiency in aflatoxin contamination knowledge may lead to defects in the
processing of nutritious peanut butter that would be packaged, and properly labelled
using sorted suitable groundnuts. Further, lack of adherence to defined national
aflatoxin set standards by processors may lead to high aflatoxin contamination levels
in peanut butter in the outlets. This outcome may lead to the presence of
contaminated peanut butter on the market, loss of income for traders both locally and
internationally, reduced nutrients in the products, ill health to consumers and
eventually deaths as reported in other nations.

4
Earlier studies concentrated on investigating aflatoxin levels in peanut products from
the markets and stores. This study is the first to include processing plants for
aflatoxin contamination level examination, processing skills, knowledge of
contamination and health risks among processors which is also limited. This
information will assist in detecting why aflatoxin levels continue to rise in peanut
butter in the outlets. This revelation has led to the need for the current study to be
undertaken.
Below is Figure 1 showing fresh groundnuts which are raw products used in
processing peanut butter. Among them are bad types of peanut which sometimes can
be used in processing peanut butter without noticing, thereby increasing aflatoxin in
the products.
Figure 1: Aflatoxin ICRISAT & A.F Ecology Centre Farmer’s Field
Demonstration in Peanut Source: (Grace, 2013).
The consumer must be dependent on processors to provide safe peanut butter in their
outlets. And further, cleaning of grinder is to reduce on aflatoxin contamination as
Ndung’u et al. (2013) documented in their study. This knowledge is vital for
processors to have in this study.

5
1.3 Conceptual Framework
Figure 2 is a coceptual framework showing variables that might contribute to
increased aflatoxin in peanut butter.
Figure 2: Conceptual Framework for Levels of Aflatoxin in Peanut Butter
The figure above shows how naturally aflatoxin from groundnuts or peanut butter
can lead to high levels of aflatoxin. When we plant the seed in the soil, without
clearing dead matter, high chances of aflatoxin is increased (Atayde et al. 2012). As
the crop continues to grow under the soil, there is a release of carbon and nitrogen
substrates by injured groundnut pegs which culminate into colonization of the pods.
When the environment is hot and humid, there is release of spores on plant residues
which get dispersed by wind through the field (Donor & Cole, 2002). Moisture forms
moulds which increases aflatoxin in the product. Small, immature kernels are more
easily infected in a shorter period of time than kernels in more mature pods.
Infections of groundnut kernels at other maturity stages are relative to the survival of
the fungus and not as a new infection at a later stage of maturity.
Relaxed national aflatoxin limit standards contributes to the presence of high
aflatoxin contaminated peanut products. Again limited processing skills and
knowledge about dangers of aflatoxin contamination contributes to increased
aflatoxin in peanut butter.
In the post-harvest stage, aflatoxin continues to develop as peanuts are being
prepared for storage. If peanuts are not sorted to separate quality peanut from
HIGH AFLATOXIN LEVELS IN PEANUT
BUTTER
Limited
processing
knowledge
Relaxed National
standards on
aflatoxin limits
s
Liver
cancer
Stunted
growth
Death
Aflatoxicosis
Liver
cirrhosis
Immunity
Suppression
Natural
aflatoxin in
groundnuts
Less nutrients in
peanut butter

6
immature and discoloured ones, there is an increased chance of moisture creation and
insect manifestation (UÇKUN and Işıl, 2014). Moisture and insects increase
aflatoxin in peanut which in turn reduces the quality of peanut. When such low
quality peanuts are used for peanut butter processing, aflatoxin levels are likely to be
raised. Again if the storage area is not clean and well ventilated, humidity and mould
develops and with it aflatoxin progression continues (Njumbe et al. 2014). When
such peanut is used for processing peanut butter, the possibility of having raised
aflatoxin in the product is again high.
1.4 Rationale
Aflatoxin contamination is a subject that is very important in Public Health.
Aflatoxin consumption by humans through contaminated peanut butter is a Public
Health hazard. Availability of information on aflatoxin is therefore crucial to
stakeholders as the population’s wellbeing rely on it particularly when decisions are
to be made. For instance, to come up with an intervention for addressing aflatoxin
contamination problems, research findings from studies like the current one would be
very necessary. For as peanut butter is highly consumed by many people in Lusaka,
the public is at high health risk of ingesting increased aflatoxin contaminated
products in their bodies.
Results from this study will also provide knowledge to processors as well as
stakeholders on aflatoxin level contamination in peanut butter and the dangers
associated with the problem. The results of the study will encourage ZABS to work
towards toughening regulations on processor adherence to the available standards. As
a result of this study, subsequent researches in peanut butter may begin to show
reduction in aflatoxin contamination levels. When that period is attained, peanut
butter will have viable markets both locally and internationally. Processing plants
will ensure they put into effect knowledge gained to advance market confidence but
also to protect the population which they serve from contaminated peanut butter and
health risks.
Further, results will help with formulation of policy and programs on clearer
guidance on acceptable aflatoxin limits for peanut butter from local and international
sources. This evidence underlines the need to come up with a standard to use in
checking for quality imports and exports in the nation. The results will be availed to
7
the public through the media and further research is recommended on how to
improve peanut butter production as well as increase aflatoxin contamination and
health risk awareness among processors and the public. Collaborative research is
encouraged with international processors to compare notes in trying to address
aflatoxin contamination levels.
1.5 Research Questions
1. Are there differences in levels of aflatoxin between local and international
peanut butter in relation to set regulations?
2. Are processors aware of the dangers of consuming peanut butter with high
aflatoxin levels and the health risks associated with it?
3. Do processors’ production skills help in reducing aflatoxin contamination
levels in peanut butter?
1.5.1 General Objective
To investigate aflatoxin levels and knowledge of production skills in peanut
butter among processors.
1.5.2 Specific Objectives
1. To compare aflatoxin levels between local and international peanut butter
products in relation to set standards.
2. To establish whether processors are aware of the dangers and health risks
associated with consumption of aflatoxin contaminated peanut butter.
3. To assess processors’ production skills in relation to reducing aflatoxin
levels in peanut butter.
1.6 Ethical Consideration
Permission was sought from all respondents who agreed to take part in the study.
Confidentiality was observed and there was no connection between the processor and
peanut butter produced throughout the study. Processors were told that the benefit
from the research would be that the study would educate them on the ways of
improving their peanut butter processing so that their businesses would be acceptable
on the international market. The study findings would also help the customers
purchase safe products for the good of their health.

8
CHAPTER TWO
LITERATURE REVIEW
This segment reviews what has already been completed in some parts of the world.
In this section, selected studies conducted across the globe have been cited in order
to help guide the current research. Aflatoxin has been a concern around the world
because of the negative effects that come by ingestion of food that have high
aflatoxin contamination levels.
2.1 Aflatoxin and Processing
Aflatoxin is an inevitable, undesirable food contaminant, which occurs naturally
(EFSA, 2007). Aflatoxins are secondary metabolites of the common food borne fungi
Aspergillus flavis and A. parasiticus which colonize crops in tropical and subtropical
regions throughout the world (Njumbe et al. 2014). Food is needed by all people
hence unintentional ingestion of aflatoxin, is a challenge that demands for a
consensus in addressing it both locally and internationally
The presence of aflatoxin in peanut is due to suboptimal processing techniques of
the raw peanuts such as drying and faulty storage conditions (Traistaru and
Moldovan, 2012). Lack of sunshine leading to failure of the kernel to completely dry,
Mutegi et al. (2013b), and (Traistaru and Moldovan, 2012). Water leakages, storage
duration, humidity, insect activity, temperature changes are major causes of mouldy
development which is associated with aflatoxin contamination during storage period
(Traistaru and Moldovan, 2012). These factors contribute to high levels of aflatoxin
in processed peanut.
In a study that examined the financial risk associated with sorting of peanut along the
marketing chain in Benin, West Africa; findings were that the costs of sorting and
storage were leading factors in reducing aflatoxin levels in peanut but the practices of
drying, sorting and storing pose financial risks to market traders of peanut (N'dede et
al. 2012).
Aflatoxin in processed peanut can cause harm when accidental exposures are
frequent such as cross contamination by other substances (Chang et al. 2013).

9
Therefore, peanut processing industries must follow strict guidelines to ensure
compliance in harmonisation of international safety standards (Chang et al. 2013).
In a study that was conducted in Pakistan, 198 peanut products were commercially
obtained from major cities of Punjab and analysed for aflatoxins using High
Performance Liquid Chromatographic (Iqbal et al. 2013). Iqbal’s study revealed that
the mean concentration in raw peanut with shell was 6.4 μg/kg, raw peanut without
shell 9.6 μg/kg, roasted peanut with and without shell 10.4 and 12.3 μg/kg,
respectively, that for peanut butter was 2.4 μg/kg, peanut cookies was 4.6 μg/kg and
peanut nimko had 3.4 μg/kg, (Iqbal et al. 2013). This study influenced the
Government to enact regulation that encouraged market participants to reduce
contamination (Iqbal et al. 2013). Governments could be influenced with increased
evidence resulting from studies done within the nation showing a true picture on the
ground similar to Iqbals.
According to (Ding et al. 2012) a study conducted in China, where different peanut
products were tested for aflatoxin levels from four agro-ecological zones, revealed
that there was low aflatoxin contamination in raw peanuts. However, higher aflatoxin
levels were detected in peanut products, such as peanut oil, fried peanuts and roasted
peanuts (Ding et al. 2012). These results suggest that it is possible that contamination
could have occurred somewhere within the peanut processing value chain (Mutegi et
al. 2013a). This indicates that processing points too could have aflatoxin levels that
may be different from other points of peanut butter processing. One could find
different results if samples were taken at these different points of processing.
Another study carried out in four production regions in the State of São Paulo,
Brazil, analysed the soil samples to determine the occurrence of fungal species that
contributed to aflatoxin contamination (Atayde et al. 2012). According to Atayde et
al. (2012), it was found that although A. flavus and Aspergillus parasiticus were
isolated from peanuts, few samples were contaminated with aflatoxins. Therefore,
the isolation of these species from soil showed that this is the main route of peanut
contamination (Atayde et al. 2012).
10
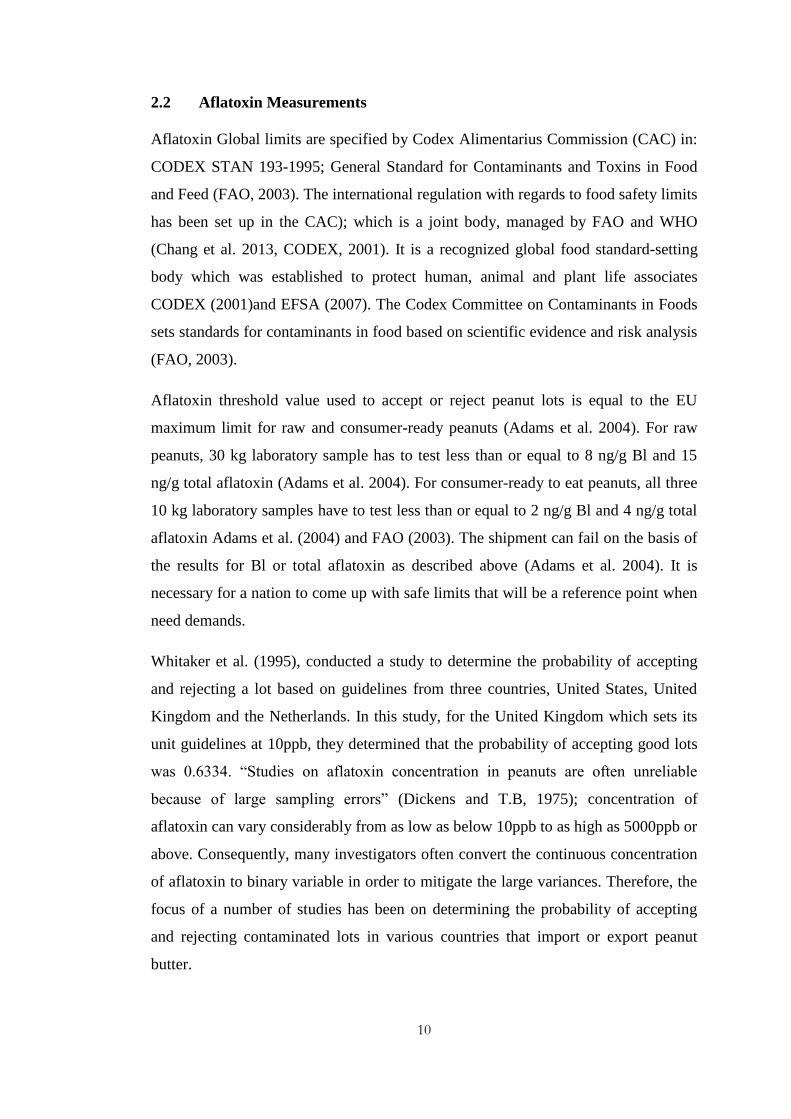
2.2 Aflatoxin Measurements
Aflatoxin Global limits are specified by Codex Alimentarius Commission (CAC) in:
CODEX STAN 193-1995; General Standard for Contaminants and Toxins in Food
and Feed (FAO, 2003). The international regulation with regards to food safety limits
has been set up in the CAC); which is a joint body, managed by FAO and WHO
(Chang et al. 2013, CODEX, 2001). It is a recognized global food standard-setting
body which was established to protect human, animal and plant life associates
CODEX (2001)and EFSA (2007). The Codex Committee on Contaminants in Foods
sets standards for contaminants in food based on scientific evidence and risk analysis
(FAO, 2003).
Aflatoxin threshold value used to accept or reject peanut lots is equal to the EU
maximum limit for raw and consumer-ready peanuts (Adams et al. 2004). For raw
peanuts, 30 kg laboratory sample has to test less than or equal to 8 ng/g Bl and 15
ng/g total aflatoxin (Adams et al. 2004). For consumer-ready to eat peanuts, all three
10 kg laboratory samples have to test less than or equal to 2 ng/g Bl and 4 ng/g total
aflatoxin Adams et al. (2004) and FAO (2003). The shipment can fail on the basis of
the results for Bl or total aflatoxin as described above (Adams et al. 2004). It is
necessary for a nation to come up with safe limits that will be a reference point when
need demands.
Whitaker et al. (1995), conducted a study to determine the probability of accepting
and rejecting a lot based on guidelines from three countries, United States, United
Kingdom and the Netherlands. In this study, for the United Kingdom which sets its
unit guidelines at 10ppb, they determined that the probability of accepting good lots
was 0.6334. “Studies on aflatoxin concentration in peanuts are often unreliable
because of large sampling errors” (Dickens and T.B, 1975); concentration of
aflatoxin can vary considerably from as low as below 10ppb to as high as 5000ppb or
above. Consequently, many investigators often convert the continuous concentration
of aflatoxin to binary variable in order to mitigate the large variances. Therefore, the
focus of a number of studies has been on determining the probability of accepting
and rejecting contaminated lots in various countries that import or export peanut
butter.

11
In Zambia, the most reliable data on aflatoxin concentration seems to be the one by
Juliet Akello’s presentation on Aflatoxin Awareness & Management held at the
stakeholders’ meeting in Lusaka on 28th
April, 2015 (ICRISAT, 2015) with the
proportion of 32%, obtained from Chipata, Lundazi, Katete, Mambwe, Nyimba and
Petauke.
However, smallholder production systems and small–medium enterprise tend not to
follow regulations in doing business in processed peanut (Lamuka, 2014). The
characteristics of processing industries hinder achievement of domestic and
international processed peanut safety standards (Lamuka, 2014). Nevertheless, the
recent developments in developing nations include increased emphasis on processed
peanut safety regulations, strict processed peanut safety standards, reorientation
toward preventive quality management, and a shift toward process-based standards
and mandatory Hazard Analysis Critical Control Point (HACCP), (Lamuka, 2014).
Indeed if these are in place, movement towards better aflatoxin level management
may be realised. This process requires team work.
2.3 Aflatoxin and Health
Aflatoxins have been linked to immune suppression, increased susceptibility to
disease (like in HIV and malaria). They are also implicated in compromised vaccine
efficacy and stunted child growth and development (Bankole et al. 2005).
Different health conditions are associated with high levels of aflatoxin. Acute
aflatoxin poisoning has been reported in many parts of the world including Taiwan,
Uganda and India. The clinical symptoms of aflatoxicosis include vomiting,
abdominal pain, pulmonary oedema, convulsions, coma and death with cerebral
oedema and fatty liver, kidneys and heart (Liu and Wu, 2010). In addition, exposure
to high levels of aflatoxin can result in acute human aflatoxicosis leading to jaundice,
oedema, hemorrhage and eventually death (Nyikal et al. 2004, Probst et al. 2007,
Shephard, 2008). There have been various reported outbreaks of human aflatoxicosis
in Africa (Nyikal et al. 2004, Probst et al. 2007).
The Democratic Republic of Congo is amongst African countries listed with high
prevalence of liver cancer(Kamika and Takoy, 2011). Many other studies have
associated aflatoxins with undesirable outcomes in human populations and livestock

12
(Shephard, 2008, IARC, 1993, EFSA, 2007). Some of these negative outcomes
include liver cirrhosis, liver cancer, immunity suppression, stunted growth and
aflatoxicosis in animals and eventually death (Njumbe et al. 2014, Ismail et al. 2014).
Aflatoxin has been implicated as causing cancer, and according to (EFSA, 2007) and
Shephard (2008), even very low levels of exposure. “Although it is impossible to
completely eliminate aflatoxin in food worldwide, it is possible to significantly
reduce levels and dramatically reduce liver cancer incidence worldwide” (Liu and
Wu, 2010).
Recent studies in Benin and Togo did a cross-sectional study among 480 children
aged nine months to five years conducted to identify the effect of aflatoxin exposure
on child growth (Egal et al. 2005). It was highlighted that health consequence of
aflatoxin exposure, led to stunting in children where growth hesitance occurs at the
time of weaning. The compromised growth was attributed to consumption of
aflatoxin contaminated foods (Egal et al. 2005).
2.3.1 Global
Currently, over 5 billion people worldwide are at risk of chronic exposure to
aflatoxins; and many studies provide clear evidence that consumption of aflatoxin
contaminated foodstuff is one of the causes of liver cancer in humans in China and
sub-Saharan Africa where in certain regions, at least 250,000 deaths occur every year
(CODEX, 2001, Liu and Wu, 2010, Gong et al. 2002).
Peanut is one of the most important oilseed crops and snack foods in the world agro-
food trade market. Peanut is also a product that is frequently implicated in aflatoxin
contamination (UÇKUN and Işıl, 2014). In Haiti, samples of raw peanuts (n ¼ 21),
peanut butters (n ¼ 32), and maize (n ¼ 30) were obtained in Port-au-Prince and Cap
Haitian, during 2012 and 2013 in a study to monitor aflatoxin contamination
(Schwartzbord and Brown, 2015). The outcome showed the concentration of total
aflatoxins being greatest in peanut butter. This ranged from 137 mg/kg and 2720
mg/kg (Schwartzbord and Brown, 2015). This information is a revelation of
increased aflatoxin in peanut butter.
A study conducted in Greece followed the production chain of pistachio nuts from
farm to storage. This was to determine production steps, conditions handling
practices that affect aflatoxin production (Georgiadou et al. 2012). The results

13
showed that the most critical step for aflatoxin contamination is maturity. If kernels
are immature, they tend to enclose high levels of aflatoxin. This is why sorting is
necessary if aflatoxin levels are to be reduced. This was the first stage that aflatoxin
was detected above permitted limits that ranged from 11 mg/kg to 1361 mg/kg
among orchards (Georgiadou et al. 2012). In addition to that, this study found that at
harvest time, aflatoxin concentration was even higher reaching 1420 mg/kg. the
study further detected heavy insect infestations in the orchard indicating a positive
correlation between aflatoxin contamination and insect infestation (Georgiadou et al.
2012). At post-harvest time, aflatoxin contamination detected in the three out of four
orchards, varied from 40 mg/kg to 1200 mg/kg, at drying and 650 mg/kg to 1100
mg/kg at storage (Georgiadou et al. 2012).
Another study was conducted in brazil to evaluate the mycoflora and occurrence of
aflatoxins in stored peanut samples from Tupa˜, State of Sa˜o Paulo, Brazil where
samples were analyzed monthly over a period of one (Nakai et al. 2008). According
to Nakai et al. (2008), the results showed that the growth of Aspergillus flavus was
mainly influenced by temperature and relative humidity.
In China, a study to determine aflatoxin levels in peanut and corn was done using
ultra-high-pressure limit chromatography (Fu et al. 2008). Among the 16 peanut
samples tested 12.5% were contaminated with aflatoxin (Fu et al. 2008). Among 18
corn samples, 22% were contaminated using the test method which is rapid, simple
and accurate for monitoring aflatoxins in corn and peanuts (Fu et al. 2008).
2.3.2 Regional
Aflatoxin is a major problem in many countries. In a study conducted in Kenya to
investigate market characteristics in peanut and their association with levels of
aflatoxin revealed negative impact on food security (Mutegi et al. 2013b). In this
study, it was found that 37% of the samples exceeded the 10mg/kg regulatory limit
for aflatoxin contamination levels set by the Kenya Bureau of Standards (KEBS).
The raw podded peanuts had the lowest c 2¼ 167.78; P < 0.001 levels of aflatoxin,
with majority having levels of less than 4mg/kg and only 4% having more than
10mg/kg(Mutegi et al. 2013b).
Furthermore, these findings established that most aflatoxin-contaminated products
were peanut butter and spoilt peanuts, whose recommended KEBS levels exceeded

14
10mg/kg (Mutegi et al. 2013b). According to Mutegi et al. (2013b), it was found that
packaging materials significantly (c 2¼ 73.89; P < 0.001) influenced the amount of
aflatoxin in the product, with majority of peanut samples stored in plastic jars having
>10mg/kg of aflatoxin.
A study conducted in Nigeria on dry roasted groundnuts to analyzed for moisture
content, fungal populations and aflatoxin contamination found that moisture content
in groundnuts varied as this is because mould counts, ranged between 3.6% to 102
colony-forming units per gram (Bankole et al. 2005).Aflatoxin B1 was found in more
than 50% samples, in B2, G1 and G2 detection was 26% and below. The conclusion
was that regular consumption of dry roasted groundnuts by Nigerians could present
potential health hazards to consumers (Bankole et al. 2005).
Another study was carried out among 480 children aged nine months to five years in
four agro ecological zones from Benin, Togo on dietary exposure to aflatoxin from
groundnut identified the effect of aflatoxin on child growth (Egal et al. 2005).
Among the findings, it was noted that higher frequencies of groundnut consumption
correlated with higher socio-economic status in most of the survey area; people with
higher disposable income were more inclined to buying a groundnut snack that is
notoriously contaminated with aflatoxin (Bankole et al. 2005).
According to Bankole et al. (2005), even though, the etiology of kwashiorkor is still
not yet clear, much higher aflatoxins have been found in the blood, urine and livers
of children in Nigeria with the disease than in similar age matched children
(Hendrickse, 1983) as cited in (Bankole et al. 2005). The presence of the toxin was
established in the autopsy brain tissue of some Nigerian children (Oyelami et al.
1995) as cited in (Bankole et al. 2005). Moreover, a recent epidemiological study
revealed a striking association between exposure to aflatoxins and growth stunting
(Gong et al. 2002). Children in Zambia who fall in this category, similarly, are given
peanut butter for nutrient addition to their meals as early as the time of weaning. On
the contrary, such reports are not present.
In the Democratic Republic of Congo, a study was carried out to assess natural
occurrence of aflatoxin B1 in raw peanuts. Sixty peanut samples were analyzed for
aflatoxin B1, using Thin Layer Chromatography(Kamika and Takoy, 2011). The
study analysis showed that aflatoxin B1 levels increased from the dry season to the
15
rainy season with values ranging from 1.5 to 390 and 12 to 937, respectively
(Kamika and Takoy, 2011). Seventy percent of the peanut samples from both seasons
exceeded the maximum limit of 5 mg/kg prescribed by the World Health
Organization (CODEX, 2001).
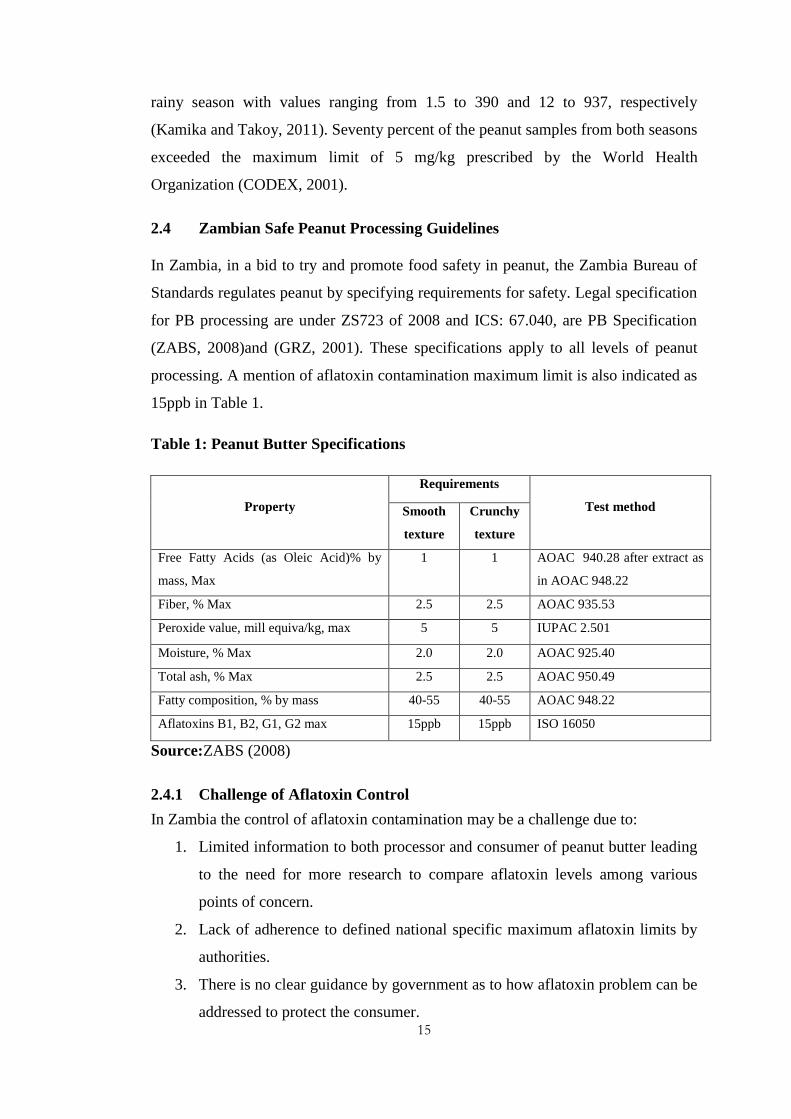
2.4 Zambian Safe Peanut Processing Guidelines
In Zambia, in a bid to try and promote food safety in peanut, the Zambia Bureau of
Standards regulates peanut by specifying requirements for safety. Legal specification
for PB processing are under ZS723 of 2008 and ICS: 67.040, are PB Specification
(ZABS, 2008)and (GRZ, 2001). These specifications apply to all levels of peanut
processing. A mention of aflatoxin contamination maximum limit is also indicated as
15ppb in Table 1.
Table 1: Peanut Butter Specifications
Property
Requirements
Test method Smooth
texture
Crunchy
texture
Free Fatty Acids (as Oleic Acid)% by
mass, Max
1 1 AOAC 940.28 after extract as
in AOAC 948.22
Fiber, % Max 2.5 2.5 AOAC 935.53
Peroxide value, mill equiva/kg, max 5 5 IUPAC 2.501
Moisture, % Max 2.0 2.0 AOAC 925.40
Total ash, % Max 2.5 2.5 AOAC 950.49
Fatty composition, % by mass 40-55 40-55 AOAC 948.22
Aflatoxins B1, B2, G1, G2 max 15ppb 15ppb ISO 16050
Source:ZABS (2008)
2.4.1 Challenge of Aflatoxin Control
In Zambia the control of aflatoxin contamination may be a challenge due to:
1. Limited information to both processor and consumer of peanut butter leading
to the need for more research to compare aflatoxin levels among various
points of concern.
2. Lack of adherence to defined national specific maximum aflatoxin limits by
authorities.
3. There is no clear guidance by government as to how aflatoxin problem can be
addressed to protect the consumer.

16
2.5 Aflatoxin Reduction Measures
There are several ways that can be adopted to reduce levels of aflatoxin in crops. It
has been reported (IITA) that sprinkling aflasafe in a field, two to three weeks before
the flowering stage of maize prevents aflatoxin contamination while the crop remains
in the field, and subsequently in storage (ICRISAT, 2013, EIARD, 2013). The report
further says that even if the grains are not stored properly, or get wet during or after
harvest, the product continues to prevent aflatoxin contamination. With what has
been revealed by studies, this idea could be adopt for tropical countries. Only that
sensitisation must increase hence the need for more to be done on aflatoxin research.
In order to forge ahead with aflatoxin reduction, partnerships need to be created
between local and international research institutions and departments of agriculture
in various states (Atayde et al. 2012). In addition, marketing agencies, NGOs, farmer
groups, consumer groups, agrochemical manufacturers, and other stakeholders need
to work as a team in order to develop strategies that address the problem of aflatoxin
(Atayde et al. 2012).
Aflatoxin contamination can be avoided by not keeping processed peanut for more
than a few months, storing in a dry, low humidity cool environment or freezer
(Mutegi et al. 2013a, Kamika and Takoy, 2011). Furthermore, aflatoxin levels can be
reduced by buying from known sources where processed peanut have been handled
well. In addition, physical sorting and electric colour sorting removes infected
peanuts which often have high levels of aflatoxin and improves trade system (N'dede
et al. 2012, UÇKUN and Işıl, 2014, Schwartzbord and Brown, 2015).
To lessen outbreaks, cooperation among all stakeholders within a peanut processing
chain and regulators to implement effective peanut safety programs (Chang et al.
2013).
According to a study conducted in Turkey on Monitoring of aflatoxin in peanuts,
moisture can be reduced by irrigation to relieve stress and heat created in the soil due
to draught and high temperatures (Dorner and Cole, 2002, Torres et al. 2014, Dorner,
2008). Moreover, it is stated that application of non-toxic strain of A. flavis and or A.
parasiticus to the soil of the developing crop increases the spoil number leading to

17
competition for nutrients and naturally accruing toxins for growth on peanuts
(Dorner and Cole, 2002, Zanon et al. 2013).
Further ways of reducing aflatoxin levels include avoiding direct contact of peanut
with the soil, using appropriate technology and minimizing damage (EIARD, 2013,
Chang et al. 2013). Using appropriate packaging materials and mode of transport,
pest control, storing products in airtight bags in a well-aerated store can reduce
aflatoxin levels significantly (Mutegi et al. 2013a). Moreover, it is indicated that
cleaning stores before loading new products will help reduce aflatoxin in peanut
(Chang et al. 2013).
In the study conducted among peanut handlers in Benin to try and assess Economic
Risks of aflatoxin Contamination in Marketing of Peanut, it was found that most of
the handlers were unable to (N'dede et al. 2012).However, the handlers could only
pick signs of spoiled peanuts such as discoloration or insect damaged (N'dede et al.
2012).
Removing discoloured and mouldy grains physically can reduce contamination
because a normal peanut appearance can be among the good ones without fungal
infection signs (Mutegi et al. 2013b). Sorting is another helpful technique that is
coming out as being associated with reducing aflatoxin levels in a situation where
mature and immature peanuts are mixed (N'dede et al. 2012, Mutegi et al. 2013b,
Schwartzbord and Brown, 2015). Sorting removes damaged, immature or rotten nuts;
harvesting mature kernel reduces immature grain which are prone to increasing
aflatoxin (Kabak et al. 2006).
Crop rotation and use of high quality seeds of early maturing has been suggested as
one of the ways to reduce aflatoxin levels in peanut (UÇKUN and Işıl, 2014). Timely
planting of peanut on fertile soils must be encouraged and there must be proper
control of pests and diseases pre-harvest (UÇKUN and Işıl, 2014). During post-
harvest stage, ensuring that timely harvesting, fast drying of groundnuts to below
10% moisture is essential.
Good pre-harvest practices to minimize aflatoxin contamination entails use of good
agricultural practices including: proper disposal of previous crop remains(Mutegi et
al. 2013b).

18
In Zambia, use of aflasafe, drying and storage practices in the 10 districts of Central
and Eastern provinces, yielded positive results in reducing aflatoxin levels in maize
and groundnuts for 2013 and 2014 harvest periods (Ismail et al. 2014). According to
ICRISAT (2013), sprinkling aflasafe before and after harvesting crop has proved to
reduce aflatoxin levels significantly as shown in a study that covered Nigeria, Kenya
and Zambia in 2011. Sorting has been used and currently, sorted peanuts from
Eastern province can be sold to South Africa (Mukuka and Shipekesa, 2013).

19
CHAPTER THREE
METHODOLOGY
3.1 Study Site
The study site was Lusaka urban district of Zambia which has a population of
1,747,152 (CSO, 2010). This site was chosen because it receives different brands of
processed peanut butter from both local and international origins. In addition, the city
was chosen because of the strategic position it commands in the country in relation to
peanut butter processing and consumption patterns. Outlets from which these
products were purchased included: processing plants (A, B and C) and retail sites
(Commercial stores and Soweto market). Soweto market was purposively selected
because of its popularity among consumers in the city. Soweto also serves as a
wholesale site for retail outlets for other markets in Lusaka. Figure 3 is a map from
Google Earth showing places from which peanut butter was purchased.

20
Figure 3: Map for Peanut Butter Sample Collection. Source Google
Earth: Cartographic Office, UNZA (2017).
3.2 Study Design
This was a cross section survey research study between local and international
peanut butter. Quantitative technique was used for canister peanut butter sample
testing while for processor knowledge, qualitative method was used to help answer
the questions.
3.3 Variables and Measurements
The variables included in Table 2 relate to both quantitative and qualitative data. In
the quantitative are the dependent variable aflatoxin in peanut butter and the
independent variables being set standards the international and local origin. For
Map for Collection of Peanut Butter Samples

21
qualitative variables, processing knowledge is the dependent variable and processor
responses are the independent variables.
Table 2 illustrates the different variables and their indicators for measurements:
Table 2: Variables and Measurements
Variable Type Operational
Definition
Indicator Measurement
Scale
Dependent
Aflatoxin in peanut
butter
Presence of aflatoxin
in peanut butter per
ppb which may or
may not be safe for
human consumption
Aflatoxin presence
in relation to
standards:
1. European
2. CAC
3. Above 15ppb
Continuous
Processing
knowledge
Ability to characterise
good peanut for
processing.
Safe processing skills
possession.
Contamination and
health risk awareness.
1. Characterise
good and bad
peanut
2. Processing skills
3. Sorting of
peanut
4. Awareness of
aflatoxin
contamination
and health risks
Responses
3.4 Sampling Procedure
A sample size was needed to compare aflatoxin contamination levels from samples
of local and international peanut butter, rather difficult task. A study recorded in
literature review on page 7 by Whitaker et al. (1995) will be used to help determine
the probability of accepting and rejecting aflatoxin contaminated samples. In their
study, for the United Kingdom which set its guidelines at 10ppb, they determined
that the probability of accepting good lots was 0.6334. “Studies on aflatoxin
concentration in peanuts are often unreliable because of large sampling errors”
(Dickens and T.B, 1975); concentration of aflatoxin can vary considerably from as
low as below 10ppb to as high as above 5000ppb. In this study, binary variables were
used to compare aflatoxin contamination levels but some descriptive statistics were
reported on continuous concentration of aflatoxin. In Zambia, to determination
sample size, we used sample prevalence of 32% for the local and 63% for the
international sample units based on cited literature on same page.

22
3.4.1 Sample Size
A sample size of 53 peanut butter canisters in each group (local and international),
was calculated using the formula from Rosner’s book and ed. (Rosner, 1990) in this
way:
Let:
PL = probability that a randomly chosen canister of local peanut butter is
accepted
PI = probability that a randomly chosen canister of international peanut butter
is accepted
X1, X2, . . ., Xin be measurements of aflatoxin levels in a random sample of
canisters of size n for local peanut butter
We assume the sample is drawn from a normal distribution with mean μ1 and
variance σ2.
Y1, Y2, Yn be measurements of aflatoxin levels in a random sample of size n
of canisters for international peanut butter.
We assume the sample is drawn from a normal distribution with mean μ2 and
variance σ2.
We assumed variation of aflatoxin contamination levels was the same for
both local and international peanut butter.
Using 10ppb as the acceptable standard for both local and international products, the
values of PL and PI become:
PL = Pr(X < 10) and PI = Pr(Y < 10), where X and Y were measurements of
aflatoxin levels in canisters of peanut butter for local and international samples,
respectively. The sample size formula for comparing two binomial proportions is
given by:
[ √ (
) √
]
, general sample size formula.
[ √ √ ]
, specific formula for k =1
Where:
for k = 1, i.e., equal sample sizes.
P1 = PL = Pr (X < 10) = 0.32, for local
P2 = PI = Pr (Y < 10) = 0.63, for international.

23
Initially, we assume there is no difference between local and international aflatoxin
contamination levels so that P1 = P2 = P under H0. The estimate of P is the average of
P1 and P2. Will denote the average by
P1 – P2 = ∆ = 0.31
= Z0.975 = 1.96, fixing Type I error at α = 0.05 (5%).
= Z0.80 = 0.84, fixing Type II error at β = 0.1 (10%), i.e. power at
90%.
Substituting these values in the formula we obtained:
[ √ √ ]
= 1.384195795 + 0.859317682 = 2.2435134782
Therefore, n = 53 peanut butter canisters from each origin.
3.4.2 Sample Size Distribution
Having determined the sample size, samples were distributed to the target population
consisting of one market and three plants, for the local main outlet-population and
three commercial chain stores for the international main outlet- population. The
choice of the plants, market and commercial stores as primary sample areas were
purposively done because these were the major suppliers of peanut butter for the
majority of people. The three main outlets formed the strata for the population. The
strata covered one market (A), with 14 stands as sub-outlet points which provided
canisters of peanut butter for testing and three processing plants (B, C and D), each
plant acted as a sub-outlet point that provided canisters for peanut butter tested for
local samples. And the three commercial stores (E, F and G) picked from the 20
distribution points acted as sub-outlets as well for the international canisters for
peanut butter testing.
The sample size of 53 was apportioned equally to the local outlets, the three
processing plants and the market. This meant that 53/4 = 13.25 or 14 canisters were
to be sampled from each sub-outlet for the local products. However, in one outlet
among the plants, there was a short fall of two canisters and in another outlet we had

24
one extra canister. For Soweto, processor stands acted as sub-outlets in providing the
14 samples. Thus, a total of 55 instead of the calculated size of 53 samples were
purchased to represent local products.
For the international products, 53 canisters were proportionally allocated to the stores
based on the number of outlets each store had. Store E had nine outlets, F had six and
G had five bringing the total to 20. This led to the following proportional allocation;
E 24 (9/20*53 ≈24), F 16 and G 14, bringing the total sample size to 54. The
distribution of sample size is summarised in Table 2 below.
Table 3: Actual Sample Size for Peanut Butter Canisters
Outlets ID Origin Sample size
1 A Local 14
2 B Local 12
2 C Local 15
2 D Local 14
3 E International (9/20*53) =23.85
or 24
3 F International (6/20*53) = 15.9
or 16
3 G International (5/20*53) =13.25
or 14
3.4.3 Canister Sample Selection Procedure
Actual stores, sub-outlets, were randomly selected from the developed list: for store
E, one of the nine was selected, one out of six for store F and one out of five for store
G. In these selected sub-outlets, a list of peanut butter canisters was developed to
assist in selecting desired canisters using a systematic random sampling method of
one in two. This selection was irrespective of texture or brand. However, data on
texture or brand were recorded merely as characteristics of a canister.
All the three processing plant owners could not allow investigator to enter their
warehouses to randomly sample units. Managers instead were instructed to
systematically sample the number of canisters that were needed which they did. At
Soweto market, samples of peanut butter were collected from processors who were
available at the time of data collection using systematic sampling of processors.
Purchased peanut butter samples were kept at room temperature for two weeks

25
before taking them to the laboratory for testing to keep samples close to the way they
were at the time of purchasing. This was also a period to wait for the reagents to
come from outside the country for testing samples.
3.4.4 Canister Coding and Data Collection
A checklist was used to capture sample numbers (1 to 109), brand name, date of
collection, origin (local and international), main outlets assigned 1 to 3 (market,
plants and commercial stores), sub-outlets for the stores (E to G) and individual
stands for outlet A where each of the 14 processors supplied 1 peanut butter canister;
texture (crunchy or smooth), shelf life (manufacturing and expiry dates). Proper
labelling (coding) of samples was done to avoid mix up of products from different
collection points and for easy identification. Each canister was identified by its main
outlet and sub-outlet for commercial stores and the sampling number. For example,
sub outlet D would be assigned label 2 (main outlet) and 3 (sub-outlet) and canisters
number 1 (of the 14 samples collected). A canister with an identification number 2, 3
and 1 would therefore be indicated as a sample from the main outlet 2, for sub-outlet
3 (processing plant) and sample number1. The same trend repeated itself throughout
the sample unit collection.
3.5 Testing Peanut Butter Samples
At the time of testing, peanut butter samples were collected and taken to test for
aflatoxin concentration levels at the University of Zambia's School of Agriculture
and Microbiology Soil Laboratory using a checklist. Peanut butter produced both
locally and internationally were tested using NEOGEN Reveal Q+ Test Neogen
(2015) based on European standard of 4μg/kg and 15ppb Codex Alimentarious
Commission (CAC) as acceptable maximum limit for safe levels (Otsuki et al. 2001,
FAO, 2003). Each canister yielded two samples for testing to see variation within the
canister making the actual tested peanut butter, of 20g each, totalling 218.
3.5.1 Sample Preparation and Extraction
Peanut butter was tested using Reveal Q+ Test which is a Competitive Direct
Enzyme-Linked Immunosobernt Assay (CD-ELISA) in order to obtain aflatoxin
concentration in parts per billion (ppb). The device is an immunoassay technique
used for rapid detection and quantification of Aflatoxin levels in processed and

26
unprocessed foods. The tests were done by the investigator with the help of the
laboratory technicians for the 109 peanut butter canisters.
Materials needed for conducting the test included, 65% ethanol solution, sample
collection cups with lids, a scale, a timer, sample cup rack, Aflatoxin Stat tablet
reader, graduated cylinder, filter paper, sample collection tubes with cups, 100 µL
pipettes with tips, 500µL pipette, tips, paper towels and gloves. In addition, Neogen
test strips, sample diluents, clear sample cups and a reader were also used.
3.5.2 Testing Procedures
An appropriate number of clear sample dilution cups were labelled and placed into a
rack in readiness for mixing and to avoid disorder. A total of 20 grams of peanut
butter were weighed in cups and mixed with 60ml of 65% ethanol which were
shaken vigorously for 3 minutes to extract Aflatoxin from the mixture. The sample
was then allowed to settle for 1 minute or more depending on the thickness of the
peanut butter which was later filtered. Thereafter, 500µL of sample diluents was put
in a clear cup using a 500 µL pipette where100µL of sample extract was added and
mixed by pipetting up and down for 5 times. Thus from this mixture, a 100 µL was
taken and transferred in a new clear sample cup where a test strip end was inserted
into the sample cup. The timer was set for 5 minutes in readiness to test Aflatoxin
concentration while being checked to ensure the strip was in contact with the liquid
and had begun to wick. A timer was pressed to note the start of the 5 minutes’ period
for the strip to develop after which the strip was removed from the sample cup.
3.5.3 Reading Test Results
Stat reader was turned on, the test type selected and vital data entered, for instance,
name of the project, which samples are being tested, if from Soweto outlet, then SO
was picked from the reader tablet menu making sure that the choice matched the
sample numbers (1 to 14) being tested. The strip was then fully inserted into a white
cartridge adapter with the sample end first and lines facing upside-down. The
cartridge was inserted into the Stat reader which automatically began analysing the
strip. The reader analysed the test and the result was displayed on the screen which
was saved on the tablet for storage but also recorded on a hard copy for backup. The
reading of results was done within 1-minute completion of the 6-minute incubation.

27
Hence total aflatoxin B1 was read and used instead of the individual B1 and B2 and
G1 and G2 as described in other researches. This was because the machine could not
detect specific aflatoxin types.
3.6 Data Entry and Analysis
Collected quantitative data for aflatoxin concentration levels were compared and
rechecked from both the tablet and the hard copy that were used. Data was coded and
cleaned up before analysis. Data was entered into Excel and later transferred into
SPSS version 20 which was used for statistical analysis. Descriptive summaries of
the concentration of aflatoxin for both local and international peanut butter were
produced. Comparisons between local and international concentration of aflatoxin
were done using two sample t-test. Tests were also performed to compare
proportions of samples that met specific set categories between local and
international data sets. The categories considered were 0 - 4ppb and 0 - 15ppb. All
tests were performed at 5% level of significance. Estimates of 95 percent confidence
intervals were also reported.
3.7 Pre-testing the Tool
A pilot study was conducted on two company respondents from Zambia Milling and
Quality Feeds who helped provide information that was used to refine the semi
structured questionnaire in this study. The final data collection tool consisted of three
parts. First part dealt with the demographic characteristics of the respondents, the
second part dealt with information about aflatoxin contamination and health risks,
the last part dealt with issues related to the peanut butter processing skills, inspection
and distribution.
3.8 Qualitative Data Collection and Analysis
A semi structured guided questionnaire was used by the interviewer to capture
qualitative data on safe processing skills, aflatoxin contamination and health risks to
humans from processors. Interviews were done for triangulation of aflatoxin data
between what was revealed in quantitative and what in fact was on the ground
practically. All respondents were given information about the research and upon
understanding and agreeing to participate, they each signed the consent form. These
were interviewed and no audio recording was done. Qualitative data was analysed

28
using themes and texts derived from the respondents to give meaning and
implications in the presentation of data. Participant and outlet identity was by use of
anonymity, only the researcher and team knew who these were.
3.9 Eligibility Criteria
Local peanut butter samples from Soweto market and processing plants were
considered irrespective of brand or texture.
Only international peanut butter available in the commercial stores at the time
of the study were included.
Processors who signed the consent form participated while, those who
refused were excluded.
A total of 109 peanut butter canisters were included in the study and tested for
aflatoxin contamination. Sixteen local processors from the processing plants and the
market were interviewed.

29
CHAPTER FOUR
STUDY RESULTS
4.0 Introduction
This chapter highlights the findings of both quantitative and qualitative approaches
of the survey. The first section presents the quantitative results by looking at
descriptive summaries of aflatoxin contamination levels in peanut butter, and ends
with inferential results. Second section presents the qualitative results of the study.
4.1 Quantitative Results
4.1.1 Descriptive Summary
In this section we looked at aflatoxin contamination in terms of the mean, variance
irrespective of the characteristics of the samples. The section ends with the report on
the contamination in relation to texture and shelf life.
4.1.1.1 Centrality and Variation
Table 4 below gives descriptive summaries consisting of sample size, mean,
minimum, maximum and standard deviation by origin and outlet. Outlets A to D
provided local products and outlets E to G provided international samples.
Table 4: Descriptive Summary of Peanut Butter
Outlets N
Aflatoxin concentration in ppb
Origin Mean Min Max Std.
Deviation
Local
A 14 32.50 3.30 147.20 46.848
B 12 6.32 3.70 9.15 1.690
C 15 68.38 42.90 122.50 25.104
D 14 13.06 8.85 16.30 2.275
International
E
24
6.40
3.25
32.95
5.859
F 16 5.36 3.95 8.10 1.194
G 14 5.54 1.75 10.35 2.166
Total
109
18.86
1.75
147.20
28.738

30
The results show that the amount of aflatoxin concentration in our samples had a
minimum of 1.75ppb (G) and a maximum of 147.2ppb (A). Generally, high level
values of aflatoxin were observed in samples from local outlets and low values in
those from international outlets. Samples from outlet (F) had the lowest average
amount of aflatoxin (5.3625ppb) while samples from outlet (C) had the highest
average amount of aflatoxin (68.38ppb). There was a lot more variation in local
samples than in international samples. For local samples, variation ranged from
1.69ppb to 46.85ppb while for international samples it was from 1.19ppb to 5.86ppb.
There were 55 (50.5%) samples from the local and 54 (49.5%) samples from
international products. Ignoring outlets, the international peanut butter products
yielded the lowest values with a minimum of 1.75ppb to a maximum of 32.95ppb.
This data is summarized in Table 5 below.
Table 5: Descriptive Summary of Aflatoxin Concentration
Origin No. Minimum Median Maximum Mean
Std.
Deviation
International 54 1.75 4.92 32.95 5.87 4.085
Local 55 3.30 13.10 147.20 31.62 36.066
Total 109 1.75 6.95 147.20 18.86 28.738
The median and the mean are reasonably close for the data from the international
sample but quite apart for the local sample as seen in Table 5. The standard deviation
of aflatoxin contamination for the local sample is about nine times greater than that
of the international.
4.1.1.2 Aflatoxin Contamination in Relation to Texture
In our samples, texture had two categories, crunchy and smooth. The sample yielded
more of smooth canisters of peanut butter than crunchy. There were 85 (78%)
smooth canisters and 24 (22%) crunchy. Table 6 shows aflatoxin concentration
between local and international peanut butter in relation to crunchy and smooth
textures. For the international peanut butter, 14 (12.8%) were of crunchy texture with
a minimum aflatoxin concentration of 1.75ppb to a maximum of 32.95ppb. The mean
for this texture was 7.59ppb with a standard deviation of 7.63ppb. For the smooth
texture, there were 40 (36.7%) canisters with a minimum of 3.2ppb and a maximum
of 10.35ppb and a mean of 5.2650ppb. the standard deviation was much lower than
for the crunchy texture, 1.36ppb.

31
For the local products, 10 (9.2%) were of crunchy texture with a minimum
concentration of 43.15ppb and a maximum of 83.55ppb and a mean of 59.4150ppb.
For the smooth texture, 45 (41.3%) had a minimum of 3.30ppb and a maximum of
147.2ppb with a mean of 25.4467ppb. Comparing with the international products, the
standard deviations were higher. This data can be examined in the table below.
Table 6: Peanut Butter Contamination in Relation to Texture
Origin
Texture
N (%)
Minimum
Maximum
Mean
Std.
Deviation
International
Crunchy
14 (12.8)
1.75
32.95
7.5929
7.62695
Smooth 40 (36.7) 3.20 10.35 5.2650 1.35747
Local
Crunchy
10 (9.2)
43.15
83.55
59.4150
12.62744
Smooth 45 (41.3) 3.30 147.20 25.4467 36.73147
Combination
Texture
Crunchy
24 (22.0)
1.75
83.55
29.1854
27.86372
Smooth 85 (78.0) 3.20 147.20 15.9494 28.46507
Total 109 (100.0)
Crunchy peanut butter in local products showed high values in both the minimum
and maximum readings, 43.15ppb and 83.55ppb, respectively. The mean for crunchy
samples was much higher than for smooth, 29.18ppb compared to 15.95ppb ignoring
the origin. The difference in variation between crunchy (27.86372ppb) and smooth
texture (28.46507ppb) was not much, while the mean for crunchy 29.1854ppb was
higher than that for the smooth texture (15.9494ppb).
4.1.1.3 Aflatoxin Contamination in Relation to Shelf-Life
In the process of data collection, it was discovered that manufacturing and expiry
dates were missing in some canisters for both local and international products. This
made it difficult to calculate shelf-life for all the canisters. However, in 51 sample
units, information was available on manufacturing and expiry dates. The average
shelf life ranged from 274 days to 547 days which is about a year.
32
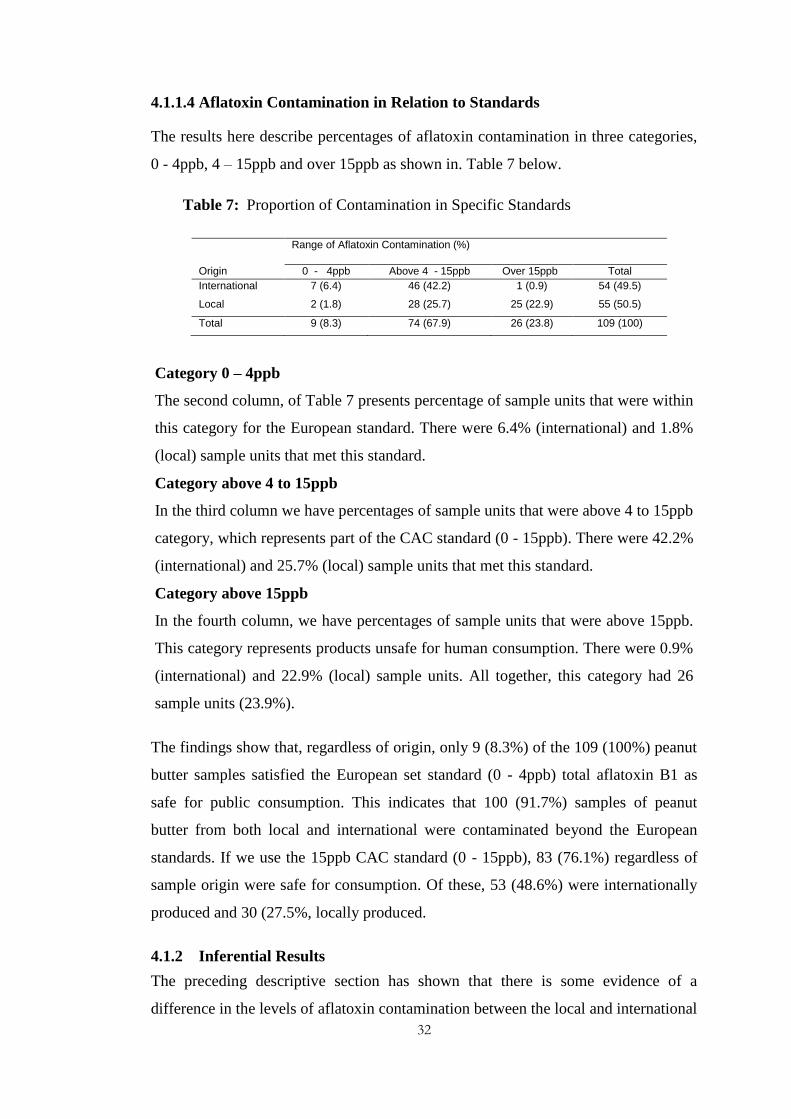
4.1.1.4 Aflatoxin Contamination in Relation to Standards
The results here describe percentages of aflatoxin contamination in three categories,
0 - 4ppb, 4 – 15ppb and over 15ppb as shown in. Table 7 below.
Table 7: Proportion of Contamination in Specific Standards
Range of Aflatoxin Contamination (%)
Origin 0 - 4ppb Above 4 - 15ppb Over 15ppb Total
International 7 (6.4) 46 (42.2) 1 (0.9) 54 (49.5)
Local 2 (1.8) 28 (25.7) 25 (22.9) 55 (50.5)
Total 9 (8.3) 74 (67.9) 26 (23.8) 109 (100)
Category 0 – 4ppb
The second column, of Table 7 presents percentage of sample units that were within
this category for the European standard. There were 6.4% (international) and 1.8%
(local) sample units that met this standard.
Category above 4 to 15ppb
In the third column we have percentages of sample units that were above 4 to 15ppb
category, which represents part of the CAC standard (0 - 15ppb). There were 42.2%
(international) and 25.7% (local) sample units that met this standard.
Category above 15ppb
In the fourth column, we have percentages of sample units that were above 15ppb.
This category represents products unsafe for human consumption. There were 0.9%
(international) and 22.9% (local) sample units. All together, this category had 26
sample units (23.9%).
The findings show that, regardless of origin, only 9 (8.3%) of the 109 (100%) peanut
butter samples satisfied the European set standard (0 - 4ppb) total aflatoxin B1 as
safe for public consumption. This indicates that 100 (91.7%) samples of peanut
butter from both local and international were contaminated beyond the European
standards. If we use the 15ppb CAC standard (0 - 15ppb), 83 (76.1%) regardless of
sample origin were safe for consumption. Of these, 53 (48.6%) were internationally
produced and 30 (27.5%, locally produced.
4.1.2 Inferential Results
The preceding descriptive section has shown that there is some evidence of a
difference in the levels of aflatoxin contamination between the local and international

33
peanut butter. In the section that follows, we determined the statistical significance of
the difference seen in the descriptive section. The inferential section compared
proportions of sample units that met safe standards between the local and
international peanut butter irrespective of the characteristics of canisters. A
parametric approach was used to carry out the test.
4.1.2.1 Parametric Test of Aflatoxin Contamination by Origin
To compare proportions of peanut butter that meet safe standards between local and
international products, we carried out a two-sample t test of proportions. The test
requires that data be normal and equal variance between local and international
population of peanut butter be assumed to hold.
Figure 4: Aflatoxin Concentration by Origin
In Figure 4 we have histograms of aflatoxin concentration for both international and
local data sets. The upper panel in the figure shows the histogram for the
international data set while the lower panel shows that for the local data set.
Normality assumption is not satisfied because there is skewedness to the right in both
histograms. Furthermore, variation is higher in the local as compared to the
international data set. For the international peanut butter, most of the values are in
the range 0 to 10ppb while for the local, most of the values are between 0 and 20ppb
but values go as higher as above140ppb.

34
4.1.2.2 Log of Aflatoxin Contamination by Origin
To achieve normality, the dependent variable was transformed by taking a natural
log. The transformed dependant variable, Ln (Aflatoxin in ppb), appeared to satisfy
the normality assumption and a common variance could also be assumed, as seen in
Figure 5.
Figure 5: Log of Aflatoxin Concentration by Origin
A comparison of aflatoxin levels between local and international samples was done
using the transformed variable. Details of the calculations are in Appendices 8 which
shows that using the log of aflatoxin, the hypothesis that the mean values between
local and international peanut butter are the same is rejected. The observed t value
was -8.019 (-1.22426/0.15266) which is outside the interval (-1.98, 1.98), suggesting
that the result is highly statistically significant with a very small p-value of less than
0.00001. The 95% confidence interval of the difference -1.22426 was estimated to be
(-1.52690, -0.92163). This also confirms the significant result since 0 is not
contained in the interval.
4.1.2.3 Parametric Test of Aflatoxin Contamination by Set Standards
Further, tests were carried out to compare a difference in proportions between local
and international peanut butter products category by category as defined in Table 7.
European Standards (0 to 4ppb)

35
In Table 7, for international sample units 7 out of 54 were within 0 – 4ppb while for the
local, only 2 out of 55 did so. The difference in proportions was -0.094 (2/55 – 7/55) with an
estimated standard error of 0.053. These values gave a Z-score of -1.77 with an estimated
95% confidence interval of -0.011 to 0.197. This result shows that there was no
significant difference (p-value = 0.0768) in aflatoxin contamination levels between
the local and international products using the European set standard of 0 – 4ppb. This
means that using the 0 – 4 standard, there was no sufficient evidence that the levels
of contamination are any different between local and international peanut butter.
CAC Standard (0-15ppb)
However, using the 0 to 15ppb standard, a significant result was observed with a p-
value of less than 0.00001. The difference in proportions was -0.43603 with an
estimated standard error of 0.07081, these values yeild a Z-score of 6.158 with an
estimated 95% confidence interval of 0.29566 to 0.57640. Thus, aflatoxin
concenration was significantly different between local and international products
using this range. Appendix 6 gives the detailed calculations for the two categories
mentioned here.
4.2 Qualitative Results
4.2.1 Introduction
This section reports the information gathered from processors regarding knowledge
on aflatoxin contamination, health risks and safe processing skills of peanut butter.
The first part dealt with demographic characteristics of the processors and proceeded
to discuss knowledge of aflatoxin contamination, health risks and safe production
skill for peanut butter.
4.2.2 Demographic Characteristics of Respondents
Overall, there were 15 males and one female participant whose ages ranged from 21
to 53 years old. Majority, seven, of the participants were aged between 40 and 44
years followed by four participants aged between 25 to 29 years. Two respondents
were aged between 30 and 34 years, one was aged between 35 and 39 years. One
respondent was above 50 years and one was below 21 years old. Out of 17
processors and retailers contacted, 14 were from the market while three were from
processing plants. From the three plants, two key informants were interviewed while

36
one declined and all processors from the market were interviewed. Regarding
education, majority, nine participants reported having attended up to secondary
school level, four attended tertiary education while three went up to primary school.
No one reported not having gone to school among processors. These characteristics
are summarised in Table 8 below.
Table 8: Demographic Characteristics of Processors
Characteristic
Age Category
Total < 24 25 - 29 30 - 34 35 - 39 40 - 44 Above
50
Education
Primary 1 1 2 4
Secondary 3 2 1 6
Tertiary 1 2 3 6
Sex Female 1 1
Male 1 4 2 7 1 15
Outlet
Soweto
Market 1 4 2 1 5 1 14
Processing
Plants 2 2
4.2.3 Knowledge of Aflatoxin Contamination
In terms of aflatoxin contamination awareness, the results showed that there were
differences in the level of knowledge on what aflatoxin was among the respondents
at plants and Soweto market. Plant processors had a higher knowledge and stated that
aflatoxin was a “poison” compared with the market processors who gave varied
responses. Upon being probed, some said it was a “disease” others said it was a
“poison.” and some had “no idea.” The variation in responses indicated that there
was little or no knowledge about aflatoxin contamination among market processors
compared to those from the plants.
On the other hand, when participants were asked on how they identified or
distinguished between good and bad groundnuts before processing peanut butter,
their responses do not seem to vary much as evidenced by Table 9 below:
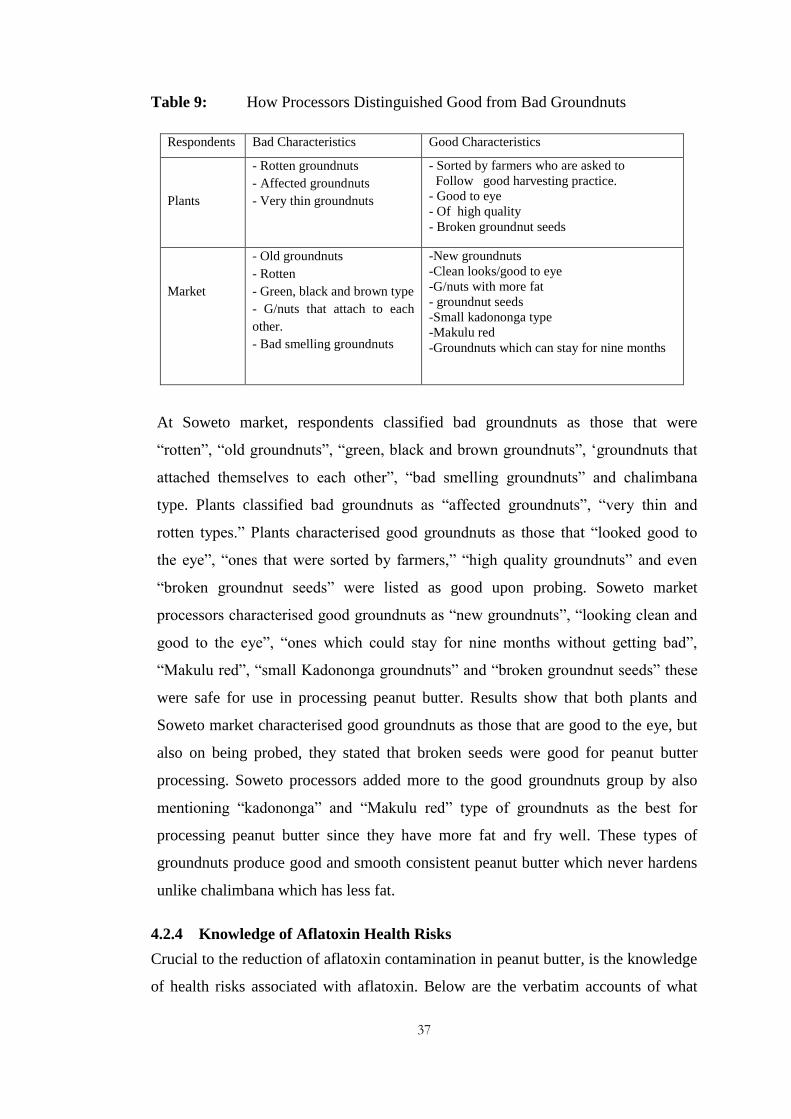
37
Table 9: How Processors Distinguished Good from Bad Groundnuts
Respondents Bad Characteristics Good Characteristics
Plants
- Rotten groundnuts
- Affected groundnuts
- Very thin groundnuts
- Sorted by farmers who are asked to
Follow good harvesting practice.
- Good to eye
- Of high quality
- Broken groundnut seeds
Market
- Old groundnuts
- Rotten
- Green, black and brown type
- G/nuts that attach to each
other.
- Bad smelling groundnuts
-New groundnuts
-Clean looks/good to eye
-G/nuts with more fat
- groundnut seeds
-Small kadononga type
-Makulu red
-Groundnuts which can stay for nine months
At Soweto market, respondents classified bad groundnuts as those that were
“rotten”, “old groundnuts”, “green, black and brown groundnuts”, ‘groundnuts that
attached themselves to each other”, “bad smelling groundnuts” and chalimbana
type. Plants classified bad groundnuts as “affected groundnuts”, “very thin and
rotten types.” Plants characterised good groundnuts as those that “looked good to
the eye”, “ones that were sorted by farmers,” “high quality groundnuts” and even
“broken groundnut seeds” were listed as good upon probing. Soweto market
processors characterised good groundnuts as “new groundnuts”, “looking clean and
good to the eye”, “ones which could stay for nine months without getting bad”,
“Makulu red”, “small Kadononga groundnuts” and “broken groundnut seeds” these
were safe for use in processing peanut butter. Results show that both plants and
Soweto market characterised good groundnuts as those that are good to the eye, but
also on being probed, they stated that broken seeds were good for peanut butter
processing. Soweto processors added more to the good groundnuts group by also
mentioning “kadononga” and “Makulu red” type of groundnuts as the best for
processing peanut butter since they have more fat and fry well. These types of
groundnuts produce good and smooth consistent peanut butter which never hardens
unlike chalimbana which has less fat.
4.2.4 Knowledge of Aflatoxin Health Risks
Crucial to the reduction of aflatoxin contamination in peanut butter, is the knowledge
of health risks associated with aflatoxin. Below are the verbatim accounts of what

38
was reported by respondents regarding broken groundnut seeds, very thin
groundnuts, health risks and sorting of groundnuts.
On broken groundnut seed one respondent had this to say:
“Broken groundnut seeds are not a problem as long as they look good, we
use them to process peanut butter and some of them get broken by the
machine during shelling.”(Male plant Respondent number16)
Still another respondent contributed and mentioned that:
“Broken groundnut seeds have no problem, we use them to make peanut
butter
because they are okay.” (Male Respondent number 5 from Soweto).
Further, when processors were queried on what they did with very thin groundnuts
that they sorted out, it was interestingly reported that these were given to those who
could consume them:
“Very thin groundnuts are sorted but are not thrown away. These are
given to others who can eat them.” (Male Respondent number 14 from
Soweto).
The discourse above indicate that there is little or no knowledge of aflatoxin health
risks in the processing plants and market. This was evident in the choices they made
when given a list of possible health risks, the processors were hesitant to identify
what these were. Below is what one respondent echoed:
“Health risks! I do not know what health risks can be brought
about by eating contaminated peanut butter but there are
people who are sick. This is why government spends a lot of
money treating people in the hospitals who suffer from diseases
caused by aflatoxin.” (Male Respondent number 16 from plant).
Information was solicited from the processors on how they could detect good from
bad groundnuts used for processing peanut butter. Their general response was that
they did so by sorting out or eliminating affected groundnuts. One of the respondents
had this to say:
“By always asking farmers to follow good harvesting practices.
We do sorting of groundnuts after receiving them from farmers
For eliminating affected groundnuts.” (Male Respondent number
15 from plant).
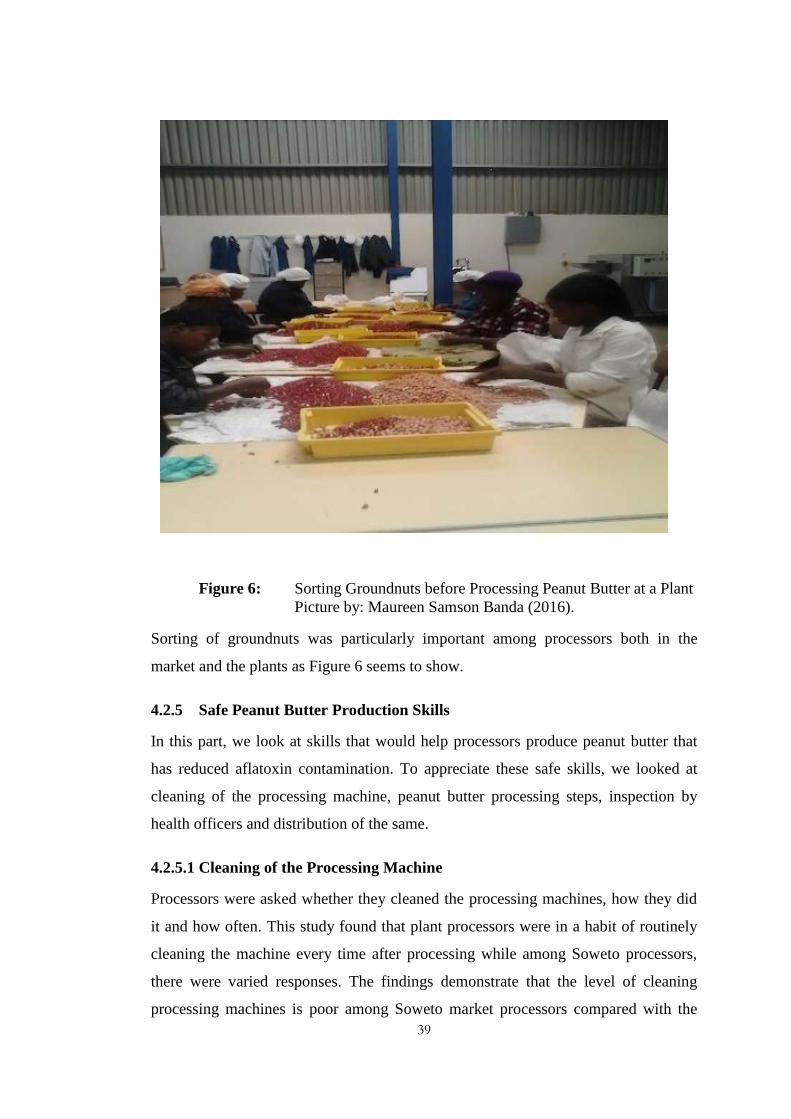
39
Figure 6: Sorting Groundnuts before Processing Peanut Butter at a Plant
Picture by: Maureen Samson Banda (2016).
Sorting of groundnuts was particularly important among processors both in the
market and the plants as Figure 6 seems to show.
4.2.5 Safe Peanut Butter Production Skills
In this part, we look at skills that would help processors produce peanut butter that
has reduced aflatoxin contamination. To appreciate these safe skills, we looked at
cleaning of the processing machine, peanut butter processing steps, inspection by
health officers and distribution of the same.
4.2.5.1 Cleaning of the Processing Machine
Processors were asked whether they cleaned the processing machines, how they did
it and how often. This study found that plant processors were in a habit of routinely
cleaning the machine every time after processing while among Soweto processors,
there were varied responses. The findings demonstrate that the level of cleaning
processing machines is poor among Soweto market processors compared with the

40
plant processors. Frequency of cleaning included daily, every other day, three times
per week due to busy schedules, twice per day and still others did it every they used
the machine. Some processors never cleaned their machines at all for fear that they
might get damaged since grinders were electrical. One of the respondents said:
“I clean the machine sometimes but not every day because of the
busy schedules and one cannot use water to clean for fear that
the machine would be damaged.”(Male respondent number 11 from Soweto).
Another respondent stated that:
“I clean the machine every day because if it is dirty, customers
will not buy peanut butter. I clean by wiping with a damp cloth.”
(Male Respondent number 2 from Soweto).
4.2.5.2 Processing Steps of Peanut Butter
Another interesting aspect of the findings was that a respondent was asked to state
what steps he took to process peanut butter with reduced aflatoxin contamination.
After stating the steps, he wanted to know the consequences for those whose peanut
butter would be found with high aflatoxin contamination levels. In his words this is
what he wondered about:
“What will happen to processors whose peanut butter will be found to have
high aflatoxin contamination? And what precautions will those making laws
put to ensure peanut butter that is made here has low aflatoxin levels if they
are not going to be
around to see what we do?” (Male Respondent number 12 of Soweto).
There are about 12 steps of processing raw groundnuts into peanut butter among
which include: storage, sorting, roasting, cooling, blanching, grinding, mixing, and
filling in canisters before distributing. There were some variations between plants in
some stages of processing. Clearly plants are highly mechanised than the processing
in Soweto market so that some stages are more elaborate in plants. Pictorially, the
processes can be viewed as shown in the flow chart in Figure 7.

41
Figure 7: Flow Chart for Processing Peanut Butter at the Sub-Outlets
In response to the steps, the results were as shown in Figure 7; where one plant
followed all the steps for processing from “storage to distribution.” The other plant
began from “storage,” and then “sorting” of groundnuts before “roasting,” ”Cooling”
followed after roasting, and then “blanching” (removal of skin). There was no
“further sorting" done and the next step was “grinding” groundnuts and “mixing it
with salt.” After "mixing,” another step “cooling" was done in readiness for
packaging or “filling in jars.” Again this plant skipped weighing of peanut butter and
went on to “labelling” the canisters and finally, “distribution” to consumers and other
outlets.
In Soweto, many respondents followed processing steps from “storage to filling in
the jars” as indicated in Figure 7, while they skipped weighing and labelling, going
processors
plant soweto
storage
sorting
roasting
cooling blanching
further sorting
grinding
mixing with salt cooling
filling in jars
weighing
labeling distribution
Key:
Standard procedure
_____ Plant steps
…… Soweto steps

42
straight into distributing to consumers. Some skipped “further sorting” after
blanching. Comparing peanut butter production between plant and Soweto market, it
was concluded that there were differences in the steps. The similarities were shown
at the beginning but later, dissimilarities were seen.
4.2.5.4 Inspection by Health Officers
Inspection is an important aspect of ensuring that standards are upheld especially in
issues affecting Public Health. The findings in our study show that processors’
responses regarding being visited by the health team from both the processing plants
and Soweto market were rare. Public Health officers never visited producers nor did
they pass through to see how processors produced peanut butter. This was cemented
by one respondent who made it clear by stating:
“No Public Health officers don’t come here. It is us who go to them
especially
when we want to sell our products elsewhere because officers need to inspect
the place where we make peanut butter to see if the place is good.” (Male
Respondent 1 from Soweto)
Another respondent proposed the following:
“Environmental health workers must be going around checking and seeing
that good processing of peanut butter is maintained in the outlets. Educate
processors and sensitise them so they know how to produce reduced
aflatoxin contaminated peanut butter.” (Male Respondent number 12 from
Soweto).
Yet another respondent demanded inspection:
“Regular reviews of Aflatoxin standards by ZABS is
required. Aflatoxin level is at 20ppb,in Zambia but outside they require
0 Aflatoxin in Europe, South Africa requires 5ppb. So we need this
checked so that we can sell our peanut butter outside because kwacha
has been unstable.” (Male Respondent number 15 Plant).
4.2.5.5 Distribution of Peanut Butter
Whether or not peanut butter is contaminatedt, processors must sell what they
produce. This led to the researcher to enquire where processors distributed their
products to. Market processors stated that they distributed theirs to passers-by and

43
people from compounds who wanted to consume it as well as for resell. The plants
distributed their peanut butter to passers-by, retailers, commercial shops and to
international markets. In comparing data from the two main outlets, both distributed
to passers-by and retail shops but the plants had the liberty to sell internationally as
well as to commercial shops. Another respondent revealed that his peanut butter was
sold to the Chinese nationals:
“Some Chinese and other processors come to order for sell in their
shops. Others bring their own peanuts to process for consumption.”
(Male Respondent number 11 of Soweto).
Yet another respondent added that:
“Some come to buy our peanut butter that we make and put labels on
them to go and sell in their shops.” (Male Respondent number 8 from
Soweto).
And another respondent mentioned:
“I sell to orphans. Three people come every two weeks to buy
for them.” (Male Respondent number 2 Soweto)
One of the outlets testified selling the products to neighbouring countries and
mentioned:
“We sell to all people. We sell to neighbouring countries such as Malawi,
Zimbabwe, Namibia, Tanzania and DRC.” (Male Respondent number
15 Plant).
CHAPTER FIVE
DISCUSSION OF FINDINGS
The study sought to compare and investigate differences in aflatoxin contamination
levels of peanut butter between local and international origin from selected outlets of
Lusaka. The research also evaluated processor knowledge of aflatoxin
contamination, health risks and good production skills that would help in lowering

44
aflatoxin levels in peanut butter among local processors. The results were presented
in chapter four and in this chapter, a discussion of the findings is made. These
outcomes were established in both quantitative and qualitative results section
revealing that there was little or no knowledge of aflatoxin contamination and health
risks among processors. Processing plant producers had better knowledge on the
skills that would help reduce aflatoxin contamination in peanut butter compared to
processors from the market. Triangulation of responses were included to consolidate
the outcome of the whole research work.
5.1 Aflatoxin Contamination in General
Study results revealed that there was no significant evidence to conclude that there
was a difference in the proportions of aflatoxin contamination levels between local
and international origin peanut butter. Local peanut butter samples, however, showed
higher aflatoxin levels compared with that of the international samples as indicated
in the results section. These findings are comparable to those done in Malawi by
Matumba et al. (2014), where local and imported peanut butter products were
compared. It was discovered in that study that locally processed peanut butter had
significantly higher aflatoxin contamination levels than the imported type. This was
true with our findings when we use 15ppb. The median for imported products was
2.7μg/kg and maximum 4.3μg/kg. Locally processed peanut butter revealed results
that ranged from 34.2μg/kg to 115.6μg/kg and were labelled unhealthy for human
consumption globally as recorded in FAO, 2004 (Matumba et al. 2014). This result
differs from the current study which found 30 local samples safe for public
consumption and 25 were unhealthy for human consumption
Schwartzbord and Brown (2015) in the Haiti recorded 32 peanut butter samples
presenting advanced total aflatoxin contamination of median 137µg/kg and
maximum of 2720µg/kg, more than that found in Lusaka with the median of 6.95ppb
and maximum of 147.2ppb. In Pakistan, 198 peanut products were commercially
obtained from major cities of Punjab Iqbal et al. (2013). Analysis of aflatoxin
contamination revealed that 16 (50%) tested peanut butter samples had mean
concentration of 2.4 μg/kg. In Lusaka’s selected outlets study, 100 (91.8%) samples
were contaminated with high aflatoxin levels of overal mean value 18.8638 when
45
Europeanu standard was used. The local peanut butter mean was 31.6227ppb while
that of the international was 5.8685ppb.
In India, a sudy to find out aflatoxin levels in common foods by Koirala et al. (2005)
found that one-third of the samples had high levels of aflatoxin of above 30ppb with
the highest values detected from peanut butter (42.5%).The information continues to
tell the information that aflatoxin contamination is a real problem in many parts of the
world, hence the need for more research and sharing of information with the
stakeholders to address it.
Contrasting with peanut butter from Soweto market and processing plants where very
high aflatoxin contamination levels than that from commercial stores were recorded,
Mupunga at el. (2014) in Zimbabwefound very high aflatoxin levels incommercial
peanut butter samples than those from the markets.
5.2 Aflatoxin Contamination in Relation to Set Standards
The findings were that using the 0 to 4ppb European standard, 9 out of 109 total
samples, regardless of origin were safe for human consumption. The range included
samples from 1.75ppb to 3.95ppb. The second category using CAC of 15ppb
included the 9 (8.3%) samples from the European standard, totalling 83 (76.1%)
samples as safe for public consumption. The remainder, 26 (23.9%) samples were
unsafe for human consumption. These results are comparable to those done by
Mutegi et al. (2013) where 71.8% of the peanut butter products satisfied both the
European and Kenyan Bureau of standard (KBS).
The study results were further comparable to the findings reported by Njoroge et al.
(2016) from the survey undertaken in the years (2012, 2013 and 2014) on regular
monitoring of peanut butter survey in Zambia. Njoroge recorded extremely higher
aflatoxin contamination values in peanut butter of upto130μg/kg, 1000μg/kg and
10,740μg/kg. Aflatoxin contamination among the eight brands they tested were 73%,
ranging upto 130μg/kg, 80% ranging up to 10,740μ/kg and 53% ranging up to
1000μ/kg respectively. Our study recorded contamination of up to 147.5ppb which is
higher than 130μg/kg recorded in the first year of the survey. Using 15ppb approaved
(CAC, 2014) to judge how the public is exposed to aflatoxin contamination in peanut
butter, 53 (48.9%) international samples were safe for consumption compared to
only 30 (27.5%) from the local products. The local peanut butter had highest

46
aflatoxin contamination levels compared to the international peanut butter. This
contrasted with Njoronge’s who recorded that South African peanut butter had the
highest aflatoxin contamination than that of the local products.
In Taiwan, Chen et al. (2013) detected aflatoxin contamination in 32.7% peanut
products where levels ranged from 0.2 to 513.4 mg/kg. The highest contamination
among the products was peanut butter of 142 samples, with a mean value of 52.8%
exceeding 15 mg/kg Taiwanese regulatory limit. In our study, samples that exceeded
15ppb were 26 (23. 9%). These finding imply that aflatoxin is a problem and
addressing it by finding ways of reducing it might be the way to go in all these
outlets to protect the population. Much good would come about which might include
improved health, good profit realization by processors and well informed processors
being established in the outlets when aflatoxin levels in peanut butter is reduced.
5.2.1 Aflatoxin Contamination Knowledge
The findings on the understanding of aflatoxin contamination among Soweto market
and plant processors revealed that respondents did not know what aflatoxin
contamination was. The variation in responses to what aflatoxin was informed the
study that there was little or no knowledge of aflatoxin contamination in the sub-
outlets. Further, processors’ general classification of good groundnuts for use in
processing peanut butter revealed in the result section leaves much to be desired. For
instance, groundnuts of good looks may be deceiving because some of such kinds
have been found to be of poor quality when closely examined. They do carry high
levels of aflatoxin contamination levels and use of such groundnuts for processing
peanut butter may be unsafe to the consumer which later may translate into
customer’s poor health. Another signal was given when processors stated that they
used broken groundnut seeds to process peanut butter as recorded on page 38 in the
results section. This result explains why aflatoxin contamination was high in most of
the local peanut butter products. On the contrary, the results are dissimilar to the
study by Azaman et al. (2016) who showed that participants had adequate knowledge
on aflatoxin contamination.
Naturally, business people do not want to make a loss in doing business. Similarly in
this study processors did not want to suffer loss by sorting out broken groundnut
seeds and so they used the eye to judge good seed to process peanut butter. One

47
respondent in the current study indicated the need to sell peanut butter outside
Zambia so he can make profit since the currency was low compared to dollar. The
findings are similar to West African study by N’dede et al. (2012) in Benin who
examined the financial risk associated with sorting and storing of peanut along the
marketing chain. It was found that even though the costs of sorting and storing
peanut could aid in reducing aflatoxin levels in peanut products, the practice posed
financial risk to peanut traders. This implied that the quantity of peanut is reduced
and less money is paid to the processors. This might explain again why peanut butter
in the current study had increased aflatoxin contamination despite processors stating
that they sorted out their groundnuts before processing. Such unfit groundnuts would
be added to rather maximize profit in processed products because they were seen as
having no problems. Even thin ground nuts could have been added to the seeds
destined for peanut butter processing as noted by other researchers that we do not see
what actually happened during processing. In our results, thin groundnuts were used
for others who can eat them, as stated by one of the participants. This profit making
revelation may have gratified processors with cash received while retarding aflatoxin
level reduction efforts in peanut butter. There is cause to look at how this problem
can be mitigated.
Literature has shown that not sorting out broken groundnut seeds lead to increasing
aflatoxin contamination levels. A study in Greece by Georgioudou et al. (2012)
analysed aflatoxin in nuts and discovered that damaged nuts contained 60% more
aflatoxin in them than normal. Therefore, if processors could sort broken groundnuts
seeds before processing their peanut butter, aflatoxin contamination may be greatly
reduced thereby improving the aflatoxin contamination levels in peanut butter on
Lusaka’s urban outlets. On one hand, removing bad groundnuts among good ones
lead to having more aflatoxin contaminated products on the market that will supply
local poor people with contaminated products. With this contaminated product, the
health of consumers is at stake. Indeed, such kind of groundnuts are bound to be sold
at lower prices which the poor can easily access due to their economic constraints as
some authors have noted. On the other hand, such unfit groundnuts end up being
used in peanut butter processing still putting the consumers at great health risk
through consumption of contaminated product.

48
Knowledge that broken groundnut seeds and just good to the eye looking groundnuts
can increase contamination is necessary for Lusaka’s producers and consumers to
attain. If processors’ understand the importance of sorting and what to sort from
groundnuts before processing, through sensitisation and campaigns, reduction of
aflatoxin levels in peanut butter can be possible. Indeed, Mutegi et al. also quoted
Park, 2002 who stated that sorting out physically damaged and infected grains with
strange shapes and sizes could result in 40-80% reduction of aflatoxin levels. This is
a very good reduction percentage to fight for in both Soweto market and plant outlets
but even so internationally. Again parallel to these study findings, Schwatzbord and
Brown (2015) cited that although peanut processors removed kernels with visible
mould, sorting was often uncommon before peanut butter processing in Haiti where
contamination in 94% samples was detected.
5.2.2 Health Risk Knowledge
Regarding aflatoxin health risks to humans due to consumption of contaminated
peanut butter, both respondents from the local sub-outlets expressed their ignorance
of such. This was evidenced by responses given by participants as some of them
stated that they did not know what health risks there were. A mention by one of the
processors in the results section on page 38 and 39 that he did not know what health
risks aflatoxin contaminated peanut butter would bring about but was certain that it
caused diseases, is an example. These results were similar to a study in Ghana by
Jolly et al. (2009) who examined quality assurance institutions and farmers’ practice
and perception on health effects awareness of aflatoxin in the peanut value chain
among the public. The conclusion was that there was low awareness of health effects
among them. Again our results are similar to Wild & Gong, (2010) who found
comparable results that in regions where there is greater contamination, mycotoxin
knowledge and understanding of adverse health effects was lacking and the known
risks were poorly communicated to governments. In Zambia, aflatoxin knowledge is
not a subject that most people know about and hence the need to improve
communication of such important information to the public and stakeholders at large.
This move can begin with investigator’s passion for research accumulation of
evidence enough to convince other interested parties of the need for knowledge on
aflatoxin subject and health risks to enlighten the population. Consumption of high
aflatoxin contaminated peanut products, like Liu and Wu in their review (2010)
49
observed, bring about consequences such as liver and kidney cancers and other
ailments. Liu and Wu in 2010, further stated that although it is impossible to
completely eliminate aflatoxin in food worldwide, it is possible to significantly
reduce the levels and so reduce liver cancer incidence worldwide. The Democratic
Republic of Congo is amongst African countries listed with high prevalence of liver
cancer as cited in Kamika and Takoy, (2011). These health issues might be
prevailing in Zambia where little knowledge regarding contamination and health
risks in the sub-outlets has been revealed. The population is unaware due to lack of
research to expose such information. Congo for example, is Zambia’s neighbor and
there is need for quick precautions in the direction of increasing awareness through
the media and whatever means would be necessary to take.
5.2.3 Safe Peanut Butter Production Skills
In our study, both plants and Soweto market respondents stated how they try to
reduce aflatoxin levels in peanut butter for consumer safety. Sorting of groundnuts
before processing peanut butter was one of the ways as already mentioned above. On
page 40, a flow chart for peanut butter processing was given with various steps for
use in processing peanut butter. Some steps were omitted and others were considered
by the processors in local sub-outlet. Omitted steps on further sorting of groundnuts
could have been crucial and critical in trying to reduce aflatoxin in peanut butter.
This omission may have contributed to high accumulation of aflatoxin contamination
in peanut butter as given in the results.
Desire to maximise profit by processors could have been the reason causing some
steps to be omitted in processing. The steps given by the processors are close to the
example given in the GMP, (2009) document which included purchasing of shelled
peanut, receiving, storing, cleaning, cooling, grinding, adding ingredients, grinding,
DE aeration, cooling, filling in jars, packaging and labelling. There is a branch to
purchasing jars and cleaning them. All together, the steps add between 13 and 15
whereas in our study processors mentioned 12 steps.
5.2.3.1 Cleanliness of the Machine
Observance of hygiene is vital and must be considered and practiced if processors are
to reduce aflatoxin contamination in peanut butter and provide safe peanut butter to
consumers. Processors stated that they clean the machine by wiping and not all the

50
time but rarely due to busy schedules. They cleaned by wiping as the machines were
electrical and use of water to clean would cause damage. Variation in responses
between the plant and market respondents in cleaning and how often this was done
led to a conclusion that no proper procedure was followed. Thus, not observing
hygiene regularly could have contributed to high aflatoxin contamination in peanut
butter samples.
Further observation on cleanliness was made and some retailers in Soweto market
appeared quite unkempt at their stands. All respondents had no dress code to help in
their appearance and to attract customers. Smart appearance of processors would
translate into them desiring to produce quality peanut butter to match their standard
of cleanliness. The gesture could help in reducing aflatoxin contamination in peanut
butter but also in attracting customers to buy their product. Accumulation of sand in
peanut butter, which most consumers have been experiencing and complaining about
upon chewing food spread with peanut butter could be associated with failure to keep
up with personal and machine hygiene among processors in these outlets. Our
findings are similar to Ndung’u et al. (2013) who found in their study that most
practices by processors such as failure to clean the grinder after peanut butter
production, storing roasted peanut longer before grinding and cooling roasted nuts on
the floor, in the open could have contributed to increased aflatoxin contamination in
peanut butter. Processors who do not observe hygiene when producing peanut butter
contribute to creation of high aflatoxin levels in the product. To curb the situation,
there is need to impart knowledge in the processors regarding aflatoxin
contamination and health risk effects to humans associated with peanut butter
processing. Azaman at el. (2016), respondents had favourable attitude and high
hygiene practices towards aflatoxin reduction efforts. Such safe practices if acquired
and applied, might aid Lusaka processors in that direction.
Another study in Coted’voire, by Boli et al. (2013) established that Good
Manufacturing Practices and good hygiene could help reduce contamination in
processed products. In addition, if proper hygiene practices and personal sanitation
are not applied, Azaman et al. (2016) reported, public health crisis can result from
aflatoxin contamination. In the same study, hygiene practices between small-scale
manufacturers and retailers showed no differences and citing Walker, Pritchard and
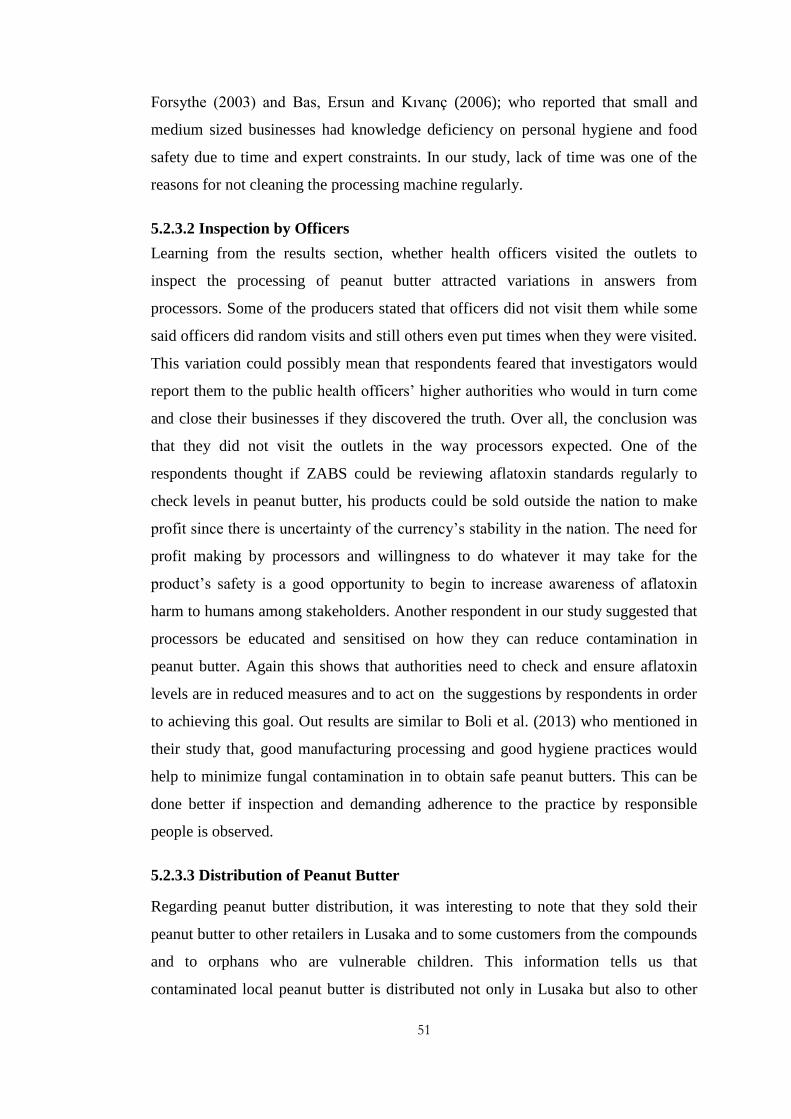
51
Forsythe (2003) and Bas, Ersun and Kıvanç (2006); who reported that small and
medium sized businesses had knowledge deficiency on personal hygiene and food
safety due to time and expert constraints. In our study, lack of time was one of the
reasons for not cleaning the processing machine regularly.
5.2.3.2 Inspection by Officers
Learning from the results section, whether health officers visited the outlets to
inspect the processing of peanut butter attracted variations in answers from
processors. Some of the producers stated that officers did not visit them while some
said officers did random visits and still others even put times when they were visited.
This variation could possibly mean that respondents feared that investigators would
report them to the public health officers’ higher authorities who would in turn come
and close their businesses if they discovered the truth. Over all, the conclusion was
that they did not visit the outlets in the way processors expected. One of the
respondents thought if ZABS could be reviewing aflatoxin standards regularly to
check levels in peanut butter, his products could be sold outside the nation to make
profit since there is uncertainty of the currency’s stability in the nation. The need for
profit making by processors and willingness to do whatever it may take for the
product’s safety is a good opportunity to begin to increase awareness of aflatoxin
harm to humans among stakeholders. Another respondent in our study suggested that
processors be educated and sensitised on how they can reduce contamination in
peanut butter. Again this shows that authorities need to check and ensure aflatoxin
levels are in reduced measures and to act on the suggestions by respondents in order
to achieving this goal. Out results are similar to Boli et al. (2013) who mentioned in
their study that, good manufacturing processing and good hygiene practices would
help to minimize fungal contamination in to obtain safe peanut butters. This can be
done better if inspection and demanding adherence to the practice by responsible
people is observed.
5.2.3.3 Distribution of Peanut Butter
Regarding peanut butter distribution, it was interesting to note that they sold their
peanut butter to other retailers in Lusaka and to some customers from the compounds
and to orphans who are vulnerable children. This information tells us that
contaminated local peanut butter is distributed not only in Lusaka but also to other
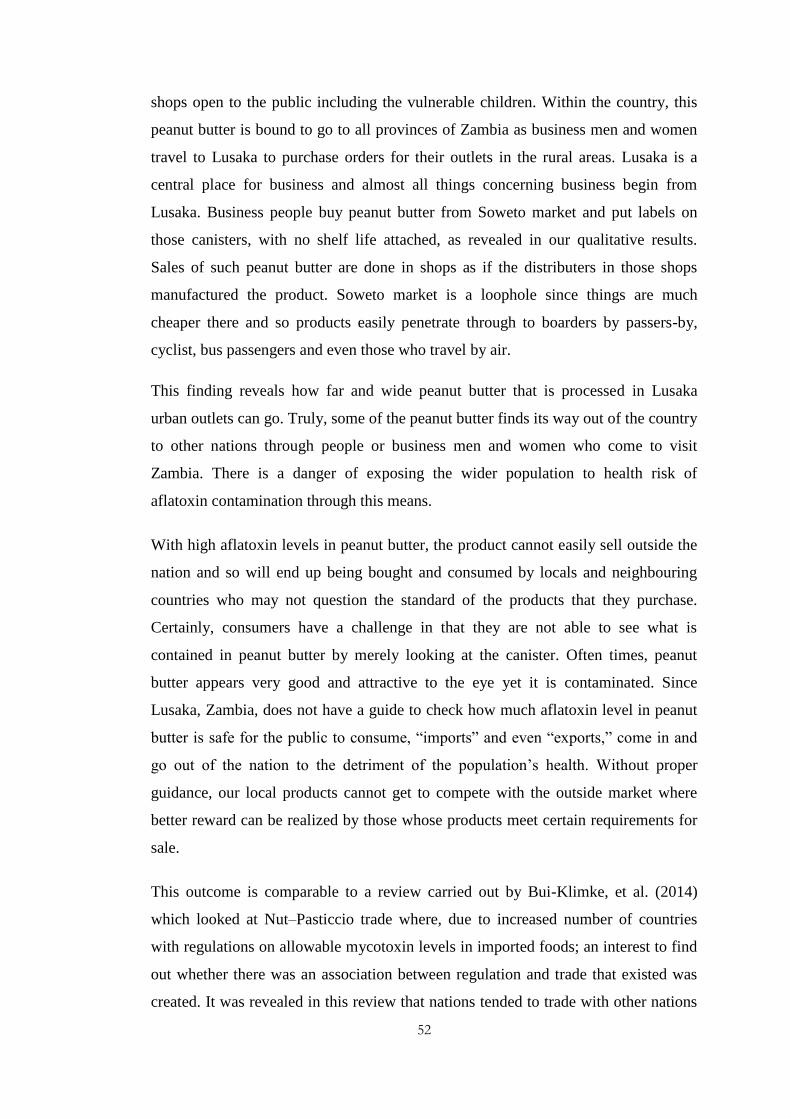
52
shops open to the public including the vulnerable children. Within the country, this
peanut butter is bound to go to all provinces of Zambia as business men and women
travel to Lusaka to purchase orders for their outlets in the rural areas. Lusaka is a
central place for business and almost all things concerning business begin from
Lusaka. Business people buy peanut butter from Soweto market and put labels on
those canisters, with no shelf life attached, as revealed in our qualitative results.
Sales of such peanut butter are done in shops as if the distributers in those shops
manufactured the product. Soweto market is a loophole since things are much
cheaper there and so products easily penetrate through to boarders by passers-by,
cyclist, bus passengers and even those who travel by air.
This finding reveals how far and wide peanut butter that is processed in Lusaka
urban outlets can go. Truly, some of the peanut butter finds its way out of the country
to other nations through people or business men and women who come to visit
Zambia. There is a danger of exposing the wider population to health risk of
aflatoxin contamination through this means.
With high aflatoxin levels in peanut butter, the product cannot easily sell outside the
nation and so will end up being bought and consumed by locals and neighbouring
countries who may not question the standard of the products that they purchase.
Certainly, consumers have a challenge in that they are not able to see what is
contained in peanut butter by merely looking at the canister. Often times, peanut
butter appears very good and attractive to the eye yet it is contaminated. Since
Lusaka, Zambia, does not have a guide to check how much aflatoxin level in peanut
butter is safe for the public to consume, “imports” and even “exports,” come in and
go out of the nation to the detriment of the population’s health. Without proper
guidance, our local products cannot get to compete with the outside market where
better reward can be realized by those whose products meet certain requirements for
sale.
This outcome is comparable to a review carried out by Bui-Klimke, et al. (2014)
which looked at Nut–Pasticcio trade where, due to increased number of countries
with regulations on allowable mycotoxin levels in imported foods; an interest to find
out whether there was an association between regulation and trade that existed was
created. It was revealed in this review that nations tended to trade with other nations

53
that had identical aflatoxin standards. Countries without regulations were importing
highly contaminated products from other countries with unrestricted laws or no
regulations. The findings are similar to the current study report conclusion since
responses revealed that peanut butter from their outlet was sold to other nations. Due
to the lack of monitoring of peanut butter that comes in by the receiving nation and
how peanut butter goes out through the distributing processor or company, there is a
Public Health threat. Such revelations could be true with peanut butter processed in
Lusaka, which is bound to reach many a population in and outside the nation,
exposing them to contaminated peanut butter and its health risks.
Regarding aflatoxin contamination and health risks in Lusaka’s outlets, further
exploration is required to protect this population and also that of the neighbouring
countries. It has been said elsewhere in public health that prevention, from health
risks, is better than curing a disease. In addition to training and sensitising of
processors, a provision of a mechanism for accepting good and rejecting bad peanut
butter on the market would be a starting point of addressing this problem.
5.4 Limitations
The results could not be generalised to all of Lusaka, but it was limited to selected
outlets in Lusaka urban district in the province. Future studies may require taking
into consideration more processing plants not included in this study to see variations
in responses and the experience and attitudes of processors before and during data
collection. Another observation was that aflatoxin was a topic that few people knew
about, several visits were made to try and convince the processors to provide their
products for testing and to be interviewed. This experience inherently affirms the
inadequate knowledge about the implications of aflatoxin contamination among
processors.
54
CHAPTER SIX
CONCLUSION AND RECOMMENDATIONS
6.1 Conclusion
The study compared aflatoxin levels between local and international peanut butter
totalling 109 samples from selected outlets of Lusaka urban city, Zambia. The study
also explored knowledge on aflatoxin contamination, health risks and safe production
skills to see if what is practiced would contribute to reducing aflatoxin contamination
in peanut butter among processors. The rates of aflatoxin concentration levels sold in
these outlets were not significantly different using the European set standard of 0 to
4ppb. Only nine (8.3%) sample units of which seven (6.4%) were from the
international and two (1.8%) from local origin, were safe for consumption. Using
15ppb approved CAC, 83 (76.1%) of all products, with 53 (48.6%) from
international and 30 (27.5%) from local peanut butter sample units satisfied the
standard. The high rates of aflatoxin contamination found in peanut butter samples
sold in these outlets implies that Lusaka’s population is at risk of consuming
contaminated peanut butter which presents a threat to the population wellbeing.
Generally, processors seemed to have little or no knowledge of aflatoxin
contamination and health risks to human beings through consuming contaminated
peanut butter. Regarding safe production skills, processors had similar steps in the
outlets but divergences were observed in some parts. Cleaning of the processing
machines was poor among Soweto respondents compared to those of the processing
plants. Inspection was rarely done.
The presence of high aflatoxin levels in peanut butter must be a concern for both the
general public and government. Ways of reducing contamination need to be
explored. This is possible through government intervention who must encourage
research and enforce available regulations of standards to be followed. Processors
and retailers can be held accountable by ensuring that they adhere to regulations and
for those who fail to obey, punishment is to be exercised.
6.2 Recommendations
In promoting set standards for the benefit of the population, the public should be well
informed about the health risks that aflatoxin contamination in peanut butter can
bring to humans. Emphasis on compulsory sorting or removing of broken seeds,

55
good to eye and very thin groundnut seeds before processing peanut butter should be
encouraged to reduce aflatoxin contamination. It is important that the Zambia Bureau
of Standards work towards toughening inspection, monitoring and ensuring
compliance to available means of standards for quality maintenance of the products.
Even though based on CAC standards, aflatoxin levels from international peanut
butter were lower than the locally produced, inspection must still be carried out to
ensure products on the markets are safe for public consumption.
Sensitising the local population through the media and training of processors on the
health risk of consuming aflatoxin contaminated peanut butter is recommended.
Health officers need to make inspection visits to processing plants and retail markets
to check and give guidance on safe processing of peanut butter. Practices that
contribute to reducing aflatoxin contamination in peanut butter such as hygiene
observance through use of dress code and cleaning of the processing machine should
be encouraged.
Areas of future investigations should focus on ensuring that imported and other
locally produced peanut butter that have not been captured in this research be also
studied. It is also recommended that researchers be provided with opportunities to
conduct collaborative research with international processors to keep abreast with
current trends and works on aflatoxin. This would contribute to upholding acceptable
standards and practices for reducing aflatoxin contamination in peanut butter
processing. Teamwork must be considered seriously, not only among peanut butter
processors in the outlets but also among all involved in the groundnut production
string; from seed planter, to harvester, to the one who stores and the processor of
peanut butter to ensure reduction in aflatoxin contamination. There is need to
improve the quality of peanut butter and increase awareness on the dangers of
aflatoxin contaminated products in the outlets in order to protect the public.

56
REFERENCES
Adams, T., Whitaker, T. B., Barug, D., Van Egmond, H., Lopez-Garcia, R., Van
Osenbruggen, T. & Visconti, A. 2004. “Peanuts, Aflatoxin, and the US origin
Certification Program”. Meeting the Mycotoxin Menace. Wageningen, Netherlands,
Wageningen Academic Publishers, 183-196.
Atayde, D.D., Reis, T.A., Godoy, I.J., Zorzete, P., Reis, G.M. and Corrêa, B. 2012.
“Mycobiota and aflatoxins in a peanut variety grown in different regions in the state
of São Paulo, Brazil”. Crop Protection., 33,7 – 12.
Codex Alimentarius Commission, 2014. “General Standard for Contaminates and
toxins in food and feed”. Codex Stan 193 – 1995, 1 – 53.
Balz, A., Heil, E. and Jordan, I. 2015. “Nutrition-sensitive agriculture: new term or
new concept?” Agriculture and Food Security., 4, 6. DOI 10.1186/s40066-015-0026-
4 BioMed Central. International Nutrition, Institute of Nutritional Science, Justus
Liebig University Giessen, Wilhelmstrasse 20, 35392 Giessen, Germany.
Blount, W. 1961. Turkey “X” disease. Turkeys., 9, 52 – 55
Boli, Z.A., L.T, Alloue-boraus, M.W., Kakou, C.A. and Koffi-nerry, R. 2013.
“Proximatecomposition and mycological characterization of peanut butter sold in
retail markets in Abidjan”. Journal of Applied Biosciences.,72, 5822 – 5829.
Bui-Klimke, T.R., Gulch, H., Kensler, T.W., Yuan J.M, Wu, F. 2014. “Aflatoxin
Regulations and Global Pistachio Trade. Insights from Social Network Analysis PloS
ONE” 9(3): e92149. Doi:10.1371/journal.pone.0092149.
Bumbangi, N.F., Muma., J. B., K., Choongo, K., Mukanga, M., Velub., M.R.,
Veldmane, F., Hatloy, F.A., Mapatanoa, M.A., 2016. “Occurrence and Factors
Associated with Aflatoxin Contamination of raw Peanuts from Lusaka District’s
Markets, Zambia”. Food Control., 68, 291 – 296.
Chang, A.S., Sreedharan, A. and Schneider, K.R., 2013. “Peanut and peanut
products: a food safety perspective”. Food Control., 32, 296 – 303.
Chen, Ying-Chun, Liao, Chia-ding, Lin, Hsu-Yang, Chiueh, Lih-Ching, Yang-Chih
Shih, Daniel., 2013. “Survey of Aflatoxin Contamination in peanut products in
Taiwan from 1997 to 2011”. Food and Drug Administration, Department of Health,
Taipei 115, Taiwan.
Chun, Hyang Sook, Jung, Kim Hyun, Ok, Eehyun, Hwan, Jin-Bong, Chung, Duck-
Hwa. 2006. “Determination of Aflatoxin levels in nuts and their Products Consumed
in South Korea”. Food Safety Research Division, Korea Food Research Institute,
Sungnam., 463 – 746.
Chun, H.S., Kim, H.J., Ok, H.E., Hwang, J.B. and Chung D.H. 2007. “Effects of
aflatoxin levels in nuts and their products consumed in South Korea”. Food
Chemistry, 102, 385 – 391.

57
Central Statistical Office (CSO), 2010. “Census of Population and Housing” Zambia
Population and Demographic Projections 2011 -2035. Lusaka, Zambia.
Dickens, J. W. & T.B, W. 1975. “Efficacy of Electronic Color Sorting and Hand
Picking to Remove Aflatoxin Contaminated kernels from Commercial Lots of
Shelled Peanuts”. Southern Region , ARS, USDA and Department of Biology and
Agricultural Engeneering, North Carolina State University 27607, 2, 45-50.
Ding, X., Li, P. B. & Yizhen, Z. H. 2012. “Aflatoxin B 1 in Post-harvest Peanuts and
Dietary Risk in China”. Food Control, 23, 143-148.
Dorner, J.W. Cole, R.J. 2002. “Effects of application of nontoxic strains of
Aspergillus flavis and A. parasiticus on subsequent Aflatoxin contamination in
peanut in storage”. Journal of stored Products Research., 38, 329 – 339.
Egal, S., Hounsa, A., Gong, Y., Turner, P., Wild, C., Hall, A., Hell, K. & Cardwell,
K. 2005. “Dietary exposure to aflatoxin from maize and groundnut in young children
from Benin and Togo, West Africa”. International Journal of Food Microbiology,
104, 215-224.
EFSA 2007. “Opinion of the scientific panel on Contaminants in the Food Chain on a
request from the commission related to the Potential Increase of Consumer Health
Risk by a possible increase of the existing Maximum Levels for Aflatoxins in
almonds, hazelnuts and pistachios and derived product”. The EFSA Journal., 446, 1 –
127.
FAO, 2003. “Mycotoxin regulations in and current developments. Factors affecting
the constitution of mycotoxin regulations in food and feed”. Food Control., 26, 580-
586.
Georgiadou, M. Dimou, A. and Yanniotis, S. 2012. “Aflatoxin contamination in
pistachio nuts: A farm to storage study”. Food Control., 26, 580 – 586.
Gulchi, E. 2015. “Aflatoxin Contamination in Groundnut (Arachis hypogaea L.)
caused by Aspergillus Species in Ethiopia”. Journal of Applied & Environmental
Microbiology., 3, 1, 11 – 19.
GRZ 2001. Food and Drug Act Cap 303 of the Laws of Zambia. In: HEALTH, P.
(ed.). Zambia: Government Printers.
Guo, B., Yu, J., Holbrook, C., Cleveland, T., Nierman, W. and Scully, B. 2009.
“Strategies in Prevention of Pre-harvest Aflatoxin Contamination in Peanuts:
Aflatoxin Biosynthesis, Genetics and Genomics”. Peanut Science., 36, 11 – 20.
IARC 2002. “Some Traditional Herbal Medicines, some Mycotoxin, Naphthalene
and Styrene”. IARC. Monogr Eval Carcinog Risks Hum., 82, 171-300.
Ismail, S., Shindano, J., Banda Nyirenda, D., Bandyopadhyay, R. & Akello, J. 2014.
“Does Exposure to Aflatoxin Constrain Efforts to Reduce Stunting in Zambia”?

58
Iqbal, S.Z., Asi, M.R., Zuber, M., Akram, N. and Batool, N., 2013. “Aflatoxins
contamination in peanut and peanut products commercially available in retail
markets of Punjab, Pakistan”. Food Control., 32, 83 – 86.
Jolly, C.M.B., Bayard, T.T., Awuah, S.C., Fialor and J.T. Williams. 2009.
“Examining the Structure of awareness and Perceptions of groundnut Aflatoxin
among Ghanaian Health and Agricultural Professionals and its influence on their
Actions.” The journal of Social Economics., 38, 280 – 287.
Jolly P.E, Jiang Y, Ellis M.O, Awuah R.T, Appawu J, Nnedu O, Stilles J.K, Wang
J.S, Adjei O, Jolly CM, Williams JH., 2007. “Association between Aflatoxin
Exposure and Health characteristics, Liver function, Hepatitis and Malaria in
Ghanaians”. Journal of Nutritional and Environmental Medicine., 16, 242 – 257.
Kabak, B., Dobson, A. D. W. and Var, I., 2006. “Strategies to Prevent Mycotoxin
Contamination of Food and Animal Feed: A Review”. Critical Reviews in Food
Science and Nutrition. ProQuest Health and Medical Complete 46, 593.
Kamika, I. and Takoy, L., 2011. “Natural occurrence of Aflatoxin B1 in peanut
collected from Kinshasa, Democratic Republic of Congo”. Food Control, 22, 1760 –
1764.
Khoshpey, B. & Zaini, F. 2011. “Aflatoxins in Iran: Nature, Hazards and
Carcinogenicity”. Iranian J Public Health., 40, 1 – 30.
Koirala, P. Kumar, S., Yadav, B. K., Premarajan, K.C. 2005., “Occurrence of
Aflatoxin in some of the Food and Feed in Nepal”. Indian Journal of Medical
Sciences., 59, 331 – 336.
Lamuka, P. 2014. “Public Health Measures: Challenges of Developing Countries in
Management of Food Safety”.
Lewis, L., M. Onsongo, H. Njapau, H. Schurz-Rogers, G. Luber, S. Kieszak, J.
Nyamongo, L. Backer, A.M. Dahiye, A. Misore, K. DeCock, and C. Rubin. 2005.,
“Aflatoxin contamination of commercial maize products during an outbreak of acute
aflatoxicosis in eastern and central Kenya”, Environ. Health Perspect 113:1763-
1767.
Liu, Y and Wu, F. 2010. “Global Burden of Aflatoxin-induced Hepatocellular
Carcinoma: a Risk Assessment”. Environmental Health Perspectives., 118, 818 –
824.
Matumba, L., Monjerezi M., Biswick T., Mwatseteza J., Mukumba W., Kamangira
D., Mtukuso A. 2014. “Survey of the incidence and level of Aflatoxin contamination
in a range of locally and imported processed foods on Malawian retail market”. Food
Control., 39:87 -91.
Matumba, L., Poucke C.V., Monjerezi M., Ediage, E.N., DeSeager, S. 2015.
“Concentrating Aflatoxins on the domestic market through groundnut export: A
focus on Malawian groundnut value and supply chain”. Food Control., 51, 236 –
239.

59
Mukuka, R. M. & Shipekesa, A. M. 2013. “Value Chain Analysis of the Groundnuts
Sector in the Eastern Province of Zambia”. The Indaba Agricultural Policy Research
Institute (IAPRI).
Mupunga, I., Lebelo, S.L., Mngqawa, P., Rheeder, J.P. and Katerere, D.R. 2014.
“Natural Occurrence of Aflatoxins in Peanuts and Peanut Butter from Bulawayo,
Zimbabwe”. Journal of Food Protection., 77, 1814 – 1818.
Mutegi, C., Wagacha, C.J., Kimani, J. and Karanja, L. 2013. “Effect of storage on
conditions on quality and aflatoxin contamination of Peanuts.” (Arachis hypogaea
L). International Journal of Agri Science., 3, 746 – 758.
Nakai, V.K., De Oliveira Rocha, L., Gonçalez, E., Fonseca, H., Ortega, E.M. and
Corrêa, B., 2008. “Distribution of fungi and Aflatoxins in a stored peanut variety”.
Food Chemistry., 106, 285 – 290.
N’dede, C.B., Jolly, C., Vodouhe, S.D., and Jolly, P. 2012. “Economic Risks of
Aflatoxin Contamination in Marketing of Peanut in Benin”. Economics Research
International., 2012, 1 – 12.
Ndung’u, J. W., Makokha, A.O., Onyango, C.A., Mutegi, C.K., Wagacha, J.M.,
Christie, M.E. 2013. “Prevalence and potential for Aflatoxin contamination in
groundnuts and peanut butter from farmers and traders in Nairobi and Nyanza
provinces of Kenya”. Prevalence and Aflatoxin contamination in groundnuts. Journal
of Applied Biosciences., 65, 4922 – 4934. ISSN 1997 – 5902.
Njoroge, S.M., Matumba, L., Kanenga, K., Siambi, M., Wariya, F. Maruwo, J. and
Monyo, E. 2016. “A Case for Regular Aflatoxin Monitoring in Peanut Butter in Sub-
Saharan Africa: Lessons from 3-Year Survey in Zambia”. Journal of Food
Protection., 79, 795 – 800.
Njumbe, E., Hell, K. and De Saeger, S. 2014. “A comprehensive study to explore
differences in mycotoxin patterns from agro-ecological regions through maize,
peanut, and cassava products: A case study, Cameroon”. Journal of agricultural and
food chemistry., 62, 4789 -4797.
Nyikal, J., Misore, A., Nzioka, c., Njuguna, c., Muchiri, e., Njau, j., Maingi, s.,
Njoroge, j., Mutiso, j., Onteri, j., Langat, A., Kilei, I., Nyamongo, j. &Ogana, G.
2004. “Outbreak of aflatoxin poisoning -eastern and central provinces, Kenya”.
Centers for Disease Control and Prevention. Morb Mort. January - July 2004. ed.
Otsuki, T., Wilson, J.S. and Sewadeh, M. 2001. “What price precaution European
harmonisation of Aflatoxin regulations and African groundnut exports”. European
Review of Agricultural Economics., 28, 263 – 284.
Rosner, B. (ed), 1990. “Fundamentals of Biostatistics”., 3rd
ed. PWS-KENT
Publishing Company: Boston, Massachusetts.

60
Schwartzbord, J.R. and Brown, D.L. 2015. “Aflatoxin contamination in Haitian
peanut products and maize and the safety of oil processed from contaminated
peanuts”. Food Control., 56, 114 – 118.
Shephard, G.S. 2008. “Risk Assessment of Aflatoxins in Food in Africa. Food
Additives and Contaminants”., 25, 1246 – 1256.
Traistaru, E. and Moldovan, R. C. 2012. “Comparative study regarding the
application of HPLC and ELISA methods for aflatoxins detection in peanuts”. J Agro
alimentary Proc Technol., 18, 81 – 5.
Uçkun, O and Işıl V. 2014. “Monitoring of Aflatoxins in Peanuts”. Türk Tarım ve
Doğa Bilimleri., 6, 1310 – 1314.
Wagacha, J.M., Mutegi, C., Karanja, L., Kimani, J. Chritie, M.E. 2010. “Fungal
Species Isolated from peanuts in Major Kenyan markets”. Emphasis on Aspergillus
section Flavis. Crop Protection., 52, 1 – 9.
Whitaker, T. B., Springer, J., Defize, P. R., Dekoe, W. J. & Coker, R. 1995.
“Evaluation of Sampling Plans Used in the United States, United Kingdom, and the
Netherlands to Test Raw Shelled Peanut for Aflatoxin”. Journal of AOAC
International, 78, 1010 - 1018.
Wild, C.P and Turner 2002. “The Toxicology of Aflatoxin as a Basis for Public
Health Decisions”. Mutagenesis., 17, 471-481.https:doi.org/0.1093/mutage/17.6.471.
Zambia Bureau of Standards, ZS 723:2008. “Zambian Peanut Butter Specification”.
Zambia: Government Printers. ICS: 67.040., 2-3.
Zanon, M.A., Chiotta M., Gia, J., Merlera, G., Barros, G. and Chulze, S. 2013.
“Evaluation of potential bio control agent for aflatoxin in Argentinean peanuts”
International Journal of Food Microbiology., 162, 220 – 225.

61
APPENDICES
APPENDIX 1: Information Sheet and Consent Form
The University of Zambia
School Public Health
Department of Population Studies
Information Sheet and Consent for Peanut Butter Processors and Retailers in Lusaka
____________________________________________________________________
TITILE: Investigating Aflatoxin Contamination and Knowledge levels in
producing safe Peanut Butter among selected Lusaka Urban Processors.
SECTION A: Information Sheet
This information sheet is for processors and retailers in peanut butter that are going
to be invited to participate in the study, “Investigating Aflatoxin Contamination
and Knowledge levels in producing safe Peanut Butter among selected Lusaka
Urban Processors.” Aflatoxin is a chemical produced by fungi in peanuts. It is
mould seen as dark, brown, white, grey coloured peanuts and in its high levels of
product consumption; it causes ill health to consumers.
Introduction
To Participant,
My names are Maureen Samson Banda, a student at the University of Zambia
undertaking a master’s degree in public health. I am conducting a study in Lusaka
urban to determine and compare Aflatoxin levels between peanut butter produced in
Lusaka (Zambia) and that coming from outside Zambia. You are invited to take part
in this study because you can help with the information that is needed. If there is
anything you do not understand please feel free to ask as we go through the
information sheet and I will explain it to you.

62
The Purpose of the Study
The main purpose of this study is to investigate and compare Aflatoxin levels
in local and international peanut butter in relation to acceptable international
set standards.
The study would also like to assess the level of Aflatoxin contamination
knowledge and production of safe peanut butter among local processors and
retailers in selected Lusaka Urban outlets.
Participant Selection
You are being invited to take part in the study because you have been processing and
retailing peanut butter over a period of time and you know a lot concerning Aflatoxin
that can help in answering the questions.
Voluntary Participation
Your participation in this study is voluntary. You are free to choose to take part or
stop taking part at any time without any punishment.
Duration
The interview will be given only once and will take about 15 or 20 minutes.
Risks
Risks in this study are somewhat minimal. Nonetheless, participant may be affected
psychologically as their business could get associated with issues of Aflatoxin.
Nevertheless, you are free not to take part in this study.
Benefits
Even though the findings of this study may not benefit you right away, it will help
regulatory agencies such as Public Health Authorities and Ministry of Health in
decision making with regards to public health policy on Aflatoxin harm as it relates
to public exposure. The study findings will be vital for public safety and hence the
need for it to be done.
63
Confidentiality
The information that you provide will not be exposed and confidentiality will be
observed. Anything you say will be confidential and it will not be associated
personally to you in any reports after this study. You are included in this study
because you may have knowledge on the possible health effects of aflatoxin in PB
that may create on consumers. Information given will be used to prepare reports after
analysis, without including any specific names.
Findings from the Study
The information that will be collected will be used to find solutions to the problem of
high Aflatoxin levels in peanut butter. Further, information will quicken public
health workers to check for acceptable Aflatoxin levels in peanut butter that the
public is consuming from Lusaka outlets.
Sharing of Results
The information collected will not be shared with or given to anyone except among
the research team and University of Zambia. The information will also be shared
with you on conclusion of the study by the investigator. Information will also be
shared with the Ministry of Health, School of Agriculture laboratory and Zambia
Bureau of standards.
Right to Refuse or Withdraw
You have the right to refuse to participate or to withdraw from the study at any time.
SECTION B: Consent Form
The purpose of this study has been adequately explained to me, and I understand the
aim, risks, benefits and confidentiality of this study. I further understand that if I
agree to participate, in this study, I can withdraw at any time without having to give
an explanation and that taking part in this study is purely voluntary.
If you are willing to participate in the study, please do so by signing below.
I ……………………………………………………… (Name) agree to participate in
this study.
Participant signature/ thumb print…………...Date…………………………

64
Consent provider sign………………………. Date………………………….
If you need any further clarifications even after our discussions, you can contact the
Principle Investigator or the chairperson of the ethics committee on the following
addresses:
WHO TO CONTACT IN CASE OF QUESTIONS:
Maureen Samson Banda
UNZA School Public Health
Department of Population Studies
P.O Box 50110
Lusaka.
Cell 0967431247 or 0955431247
Email: [email protected]
You may also contact:
The Chairperson Biomedical Ethics Committee
Telephone: +260211256067
E-mail: [email protected]

65
APPENDIX 2: Nyanja Translation of the Information Sheet and Consent Form
The University of Zambia
School of Public Health
Department of Population Studies
CIPEPALA ca Nkhani ca Opanga ndi Ogulitsa Pinati Bata m’malo Osankhidwa
mu Lusaka
____________________________________________________________________
CHAPAMUTU: Kufuna Kuwona Muyeso wa Cuku mu Pinati Bata Mogwirizana
ndi kutetezedwa kwake m’malo osankhidwa ogulitsilamo mu
Lusaka.
Gawo A: Pepala ya Nkhani Zounikila
Cipepala ca nkhani ici ndi ca opanga ndi ogulitsa pinati bata amene azaitanidwa
kutengako mbali mu maphunziro a “Kufuna kuwona muyeso wa cuku ndi
kutetezedwa kwa pinati bata m’malo osankhidwa kupanga ndi kugulitsilamo a mu
Lusaka.”
Ciyambi
Kwa otengako mbali,
Maureen Samson Banda ndiyo maina anga, wa mu sukulu la maphunziro akuya pa
University of Zambia mugawo la za umoyo wa anthu ambiri. Ndicita maphunziro mu
Lusaka akufuna kupeza komanso kusiyanitsa ndi kulinganiza kwake kwa muyeso wa
cuku mu pinati bata yopangidwa mu Lusaka ndi pinati bata yocokela kunja kwa
dziko. Muitanidwa kutengako mbali mu maphunziro amenewa cifukwa mukhoza
kuthandiza pa nkhani yofunikila iyi. Ngati pali ciliconse cimene inu simumvetsa,
conde khalani omasuka kufunsa pamene tipita mu cipepala ca nkhani ici ndipo
ndizayesa kumasulila.
Cilingo cha Maphunziro awa Ndicho:
i. Kufuna kupeza komanso kulinganiza ndi kusiyanitsa muyesowa cuku
copezeka mu pinati bata yopangidwa mu Lusaka ndi pinati bata yocokela
kunja kwa dziko kulingana ndi malamulo oikidwa obvomelezedwa a
maiko ambiri.

66
ii. Kuwona pa muyeso wakudziwa kuipa kwa cuku ndi mapangidwe a pinati
bata yotetezedwa pakati pa opanga ndi ogulitsa pinati bata a m’malo
osankhidwa mu Lusaka.
Kusankha kwa Otengako Mbali
Muitanidwa kutengako mbali mu maphunziro amenewa cifukwa cakuti mwakhala
opanga ndi kugulitsa pinati bata mwa kanthawi ndipo mudziwa zambiri zimene
zingathandize kuyankha mafunso pa nkhani yofunikila pa zinthu zokhuzana ndi cuku
mu pinati bata.
Kuzipeleka pakutengako Mbali
Kutengako mbali m’maphunziro awa ndikozipeleka. Ndinu omasuka kuleka
kutengako mbali kopanda kulandila cilangociliconse.
Nthawi
Mafunso azapatsidwa kamodzi cabe ndipo azangotenga mphindi monga15 kapena 20
cabe.
Ziopsyezo
Ziopsyezo potengako mbali m’maphunziro awa ndizazing’ono kwambiri. Otengako
mbali akhoza kubvutidwa m’maganizo cifukwa bizinesi yao ikhoza kukhudzidwa
mwakupezeka ndi cuku cambiri mu pinati bata. Otengako mbali akhoza kuganiza
kuti mwina zotulukamo za cuku zikhoza kukhala zoipa. Ndinu omasuka kusatengako
mbali m’maphunziro amenewa.
Zothandiza
Angakhale zili tero, zotulukamo za m’maphunziro aye ndizofunikila kuteteza anthu
akudya pinati bata kuti akhale ndi umoyo wabwino. Kulibe malipilo aliwonse kwa
inu pakutengako mbali mu maphunziro aya. Angakhale kuti zotulukamo
m’maphunziro aya sizizakuthandizani inu kwatsopano apa, zimenezi zizathandiza
aulamuliro monga aza umoyo wa anthu ambiri ndi a boma (Ministry of Health) kuti
apange ciganizo pa za umoyo pakupanga mapulogramu ya kucepetsa cuku mu pinati
bata. Maphunziro ndiyofunikila kucitika cifukwa cuku cibweretsa mabvuto pathupi
la anthu akudya pinati bata imene ili ndi cuku copitilila muyeso.

67
Cisinsi
Nkhani zimene muzapatsa sizizaululika kwa aliyense ndipo cisinsi ceni-ceni
cizasungidwa kwathunthu. Zilizonse zimene inu muzakamba zizakhala za cisinsi
ndipo sizizaphatikizidwa kwa inu mu ma lipoti titatha maphunziro awa. Inu
mwasankhidwa kutengako mbali m’maphunziro amenewa cifukwa cakuti mwina
mukhoza kudziwa za kuculuka kwa cuku mu pinati bata ndi kukhudzidwa kwacha
kwa za umoyo wa iwo akudya.
Zopezeka mu Maphunziro aya ziza:
Thandiza akulu a zaumoyo wa anthu kufuna kudziwa muyeso wa cuku woyenela
mu pinati bata imene anthu akudya mu Lusaka.
Zizaunikila opanga pinati bata pa njira zabwino zopangilamo pinati bata.
Kugawana Zotuluka m’maphunziro
Nkhani zotuluka m’maphunziro sizizagawanitsidwa ndi munthu wina aliyense
kucoselako akulu ocita maphunziro ndi a ku University of Zambia. Nkhanizi
zizapatsidwanso kwa inu kupyolela mwa oyang’anila pa maphunziro amenewa
titatha kupeza mayankho m’maphunziro amenewa.
Danga Lokana kapena kuleka Kutengako mbali
Otengako mbali ndiomasuka kufunsa mafunso aliwonse ndipo ngati awona kuti
sakhutila, ali ndi danga loleka kutengako mbali mu maphunziro nthawi iliyonse.
GAWO B: Cipepala ca Cibvomekezo
Cilingo ca maphunziro aya camasulidwa kwa ine, ndipo ndamvetsa za colinga,
ziopsyezo, thandizo ndi cisinsi ca maphunziro amenewa. Mopitiliza, ndamvetsanso
kuti ngati ndibvomela kutengako mbali m’maphunziro amenewa, ndikhoza kuleka
panthawi iliyonse kosapeleka lonjezo ndikuti kutengako mbali m’maphunziro aya,
ndikozipeleka kwathunthu.
Ngati mwazipeleka kutengako mbali mumaphunziro aya, Conde citani cimeneci
pakusaina cipepala ici pansipa.
Ine ………………………………… (Dzina) ndibvomela kutengako mbali
m’maphunziro aya.

68
Wotengako mbali kusaina /Kudinda cala ………………… (Tsiku)………………
Wopatsa cibvomelezo kusaina ………………………...…… (Tsiku)……………
Ngati mufuna zomasulila zilizonse ngakhale titatha zokambilana zathu, mukhoza
kuwona mkulu wamaphunziro kapena a cheya a zocititsa maphuziro a mtundu
umenewu pansipa.
Ngati muli ndi mafunso kapena bvuto iliyonse pa maphunziro amenewa- Onani:
OWONA NGATI PALI MAFUNSO
Maureen Samson Banda
UNZA School of Public Health
Department of Population Studies
P.O Box 50110
Lusaka.
Cell:0967431247 or 0955431247
Email: [email protected]
Mukhozanso kuwona
The Chairperson Biomedical Ethics Committee
Telephone: +260211256067
E-mail: [email protected]

69
APPENDIX 3: Semi-Structured Questionnaire Guide for Processors and Retailers in
Lusaka Urban District
Questionnaire number………………………………………………………
Interview Date…………………………………………… Day Month Year
Interviewer initial ……………………………………………………….
SECTION A. Participant Identification and Demographic
No.
Please answer these questions
Outlet name 1) Soweto (1-12) Specify 1,2,3,4,5,6,7,8,9,10,11,12 [ ]
2) Plant JB [ ]
3) Plant FP [ ]
4) Plant SAZ [ ]
Respondent title: 1) Manager/Director [ ]
2) Assistant [ ]
3) Other specify…………………………….
Sex: 1) Male [ ]
2) Female [ ]
When were you born?
Day Month Year
What is your highest level of education?
1) No education [ ]
2) Primary [ ]
3) Secondary [ ]
4) Tertiary [ ]
Response
Official
use
1
2
3
4
5

70
SECTION B. Aflatoxin Health Risk, Processor Production Skills, Inspection and
Regulation in Zambia
Aflatoxin is something that is produced by fungi. It is present in peanuts and other
crops. Peanuts that looks mouldy, shrivelled, manifested with insects, contain high
levels of Aflatoxin. Frequent consumption of such products has been associated with
ill health and eventual death. Now I am going to ask you about Aflatoxin and its
health issues. Please feel free to answer these questions. Your name will not appear
in the results. The information that you give is meant to help improve peanut butter
processing in Lusaka.
Q6. What do you understand by the word Aflatoxin? List of probe responses:
Q7. Are you aware that high Aflatoxin can cause health risk to humans if
consumed?
1) Yes [ ] go to Q7b
2) No[ ] go to Q8
Q7b. What health risk can be caused by Aflatoxin? List of responses and probes:
Aflatoxin causes:
1 Stunted growth
2 Liver cancer
3 Immunity suppression
4 Aflatoxicosis
5 Do not know
Q8a. Are you aware of what currently Zambia uses as acceptable Aflatoxin limit
for peanut butter?
1) Yes [ ] go to Q8b
2) No [ ] go to Q9
Q8b. What is Zambia using for Aflatoxin acceptable peanut butter limit? Probe with:
Aflatoxin is:
1 A disease
2 Poison
3 Medicine
4 Do not know

71
Q8c. Other ……………………………………………………………………
Q9. How do you know that the groundnuts you are using to make Peanut butter
has less aflatoxin? …………………………………………………………
Q10. Do public health officers come to inspect your peanut butter processing?
1) Yes [ ] go to Q10b
2) No [ ] go to Q11
Q10b. How often do public health officers come to inspect your peanut butter
processing?
……………………………………………………………………………
Q11. There are some helpful requirements which processors can use to produce
quality peanut butter. Please indicate your opinion how much you agree or
disagree with the requirement as helping. Probe list
1 = Strongly disagree, 2 = Disagree, 3= Neutral, 4= Agree or 5= Strongly
agree
Zambia’s acceptable standard
1 15μg/kg
2 1000μg/kg
3 2500μg/kg
4 Do not know
Possible helpful activity
Strongly
disagree
1
Disagree
2
Neutral
3
Agree
4
Strongly
agree
5
Training of processors
Sensitisation of processors
Increase profit on PB sales
Law enforcement
Encourage Team work
Use of Lab tests
In-process quality control

72
Q12a. As a processor, have you received any training in peanut butter processing?
1) Yes [ ] go to Q12b
2) No [ ] go to Q13
Q12b. Where did you train?
SECTION C. Peanut Butter Processing Skills
Now I am going to ask you questions regarding peanut butter processing that you
may be familiar with. By ‘processing’, I mean step by step activities that you
undertake before you come up with a finished packaged container to distribute.
Q13a. Tell me step by step what you do to produce your peanut butter from start to
end when it is ready for sale? List of responses and probes
Processing steps Response
1 Storage
2 Sorting
3 Roasting
4 Cooling
5 Blanching remove husks
6 Further sorting
7 Grinding
8 Mixing salt/stabilizer
9 Cooling
10 Filling in sterilised jars
11 Weighing
12 Labelling
13 Distributing to customers
Q13b. Do you clean your peanut butter processing machine?
1) Yes [ ] go to Q13c
2) No [ ] go to Q14
Q13c. How often do you clean your peanut butter processing machine?
…………………………………………………………………………………
Training Source
1 College
2 Workshop
3 Conference
4 By observing others do it

73
Q14. Before processing your peanut butter, what do you sort out as bad in the
groundnuts? Probe with:
Sorting:
1 Broken kernels
2 Insect manifestation
3 Rotten peanut
4 High moisture peanut
5 Mixed coloured peanut
Q15. Based on your experience or what you have heard, what are the things that
Show that this groundnut is good to use for peanut butter processing?
Q16. How much peanut butter do you produce per day?
Amount…………………….. Date……………………………………..
Q17. Where do you sell your peanut butter?..…………………………………
Q18. Do you have any questions or additions from what we have discussed in this
interview?
Thank you
74
APPENDIX 4: Nyanja Translation, Mafunso a Mapangidwe a Pinati Bata a Opanga
ndi Ogulitsa m’malo a Lusaka District:
Nambala ya mafunso…………………………………………….
Tsiku la kukambisana…………………………………………
Tsiku Mwezi
Caka
Dzina la ofunsa mafunso muufupi ……………………………….
1
2
3
4
5
Conde yankhani mafunso aya:
Dzina la ogawanitsa1) Malo oyamba Soweto (1-12) osankha1, 2, 3,4,5,6... [ ]
1) Malo oyamba SO [ ]
2) Malo aciwiri JB [ ]
3) Malo acitatu FP [ ]
4) Malo acinai SAZ [ ]
Woyankha:1) Wamkulu wa nchito/Mtsogoleri [ ]
2)Wamkulu wa nchito wa ciwiri [ ]
3) Winawache …………………………………………………….
Munthu: 1) Mwamuna [ ]
2) Mkazi [ ]
Zaka: Munabadwa liti?
Tsiku Mwezi Caka
Kodi sukulu munafika patali bwanji?
1) Sindinapite kusukulu [ ]
2) Pulaimale [ ]
3) Sekondale [ ]
4) Maphunzilo apamwamba [ ]
GAWO B: Cuku, umoyo, Kuyang’anira Opanga Pinati Bata ndi lamulo m’Zambia
Cuku ndi cinthu cina cimene cipangidwa ndi turombo cimene cimapezeka
munshawa. Nshawa zimene ziwoneka zakuda, zamankwinya, zili ndi tudoyo

75
zimakhala ndi cuku copitilila malire. Kupezeka kawiri-kawiri akudya nshawa
zoterezi kumabweretsa umoyo wa matenda pa thump la munthu ndipo pambuyo pake
imfa.
Tsopano ndizakufunsani mafunso pa za cuku ndizina zaumoyo. Conde khalani
omasuka kuyankha mafunso amenewa. Dzina lanu silizawoneka pa zotulukamo
m’maphunziro aya. Nkhani zimene muzapatsa zizathandiza kukometsa mapangidwe
a pinati bata mu Lusaka.
Q6. Kodi munvetsa ciyani pa liu lakuti ‘cuku’? Conde nenani cimene muganiza.
Q7a. Kodi mudziwa kuti Cuku cikhoza kubweretsa bvuto pazaumoyo ngati
cidyedwa mopitilila muyeso?
1) Inde [ ] pitani ku Q7b
2) Iyai [ ] pitani ku Q8
Q7b. Kodi ndizaumoyo zobvuta zotani pathupi zimene zibwera cifukwa ca cuku?
Conde nenani zimene muganiza. Mndandanda wakufunsitsitsa.
Cuku cibweretsa
1 Kusakula msinkhu bwino
2 Kansa ya mciwindi
3 Kucepa kwacitetezo ca matenda mthupi
4 Thupi kutentha kamba ka ciwindi codwalila
5 Sindidziwa
Q8a. Kodi mudziwa za muyesowa wa cuku cololedwa mu pinati bata cimene
cigwiritsidwa nchito palipano mu Zambia?
1) Inde [ ] pitani ku Q8b
2) Iyai [ ] pitani ku Q9
Q8b. Kodi cuku cololedwa pa mapangidwe a pinati bata panthawi ino ndi mpimo
uti? Kufunsitsitsa:
Cuku ndi Responses
1 Matenda
2 Paizoni
3 Mankhwala
4 Sindidziwa

76
Q8c. Zina………………………………………………………………………
Q9. Kodi mudziwa bwanji kuti nshawa zimene mugwiritsa nchito kupanga pinati
bata zili ndi cuku cocepa?
………………………………………………………………………………
Q10. Kodi akulu akulu a zaumoyo wa anthu a mboma amabwera kukawona
m’mene mupangila pinati bata?
1) Inde [ ] pitani ku Q10b
2) Iyai [ ] pitani ku Q11
Q10b. Kodi amabwera kangati pa caka?...................................................................
Q11. Pali zina zofunikila zimene zingathandize opanga pinati bata kuti apange
pinati bata yabwino kwambiri. Muthebulo pansipa, pali mndandanda wa zina
mwazinthuzo. Conde, onetsani ciganizo canu pakuchula zinthuzi:
1 = Kusabvomeleza kwambiri 2 = Kusabvomeleza 3 = Pakati-kati 4 = Kubvomeleza5
= Kubvomeleza kwambiri.
Zocitika zingathandize
Kusabvomelez
a kwambiri 1
.
Kusabvom
eleza 2
Pakati-
kati
3
Kubvo
meleza
4
Kubvomelez
a kwambiri.
5
Kuphunzitsa wopanga
pinati bata
Kuunikila ogulitsa
onse
Kuikilako phindu
pogulitsa pinati bata
Kuika lamulo limodzi
lopangilamo PB
Kugwira nchito
mogwirizana
Kufufuza bwino
mulabu yamayeso
Kasamalidwe ka
mapangidwe a PB
Q12a. Monga opanga pinati Bata, kodi munalandilako maphunziro aliwonse
kulingana ndi mapangidwe a pinati bata?
1) Inde[ ] pitani ku Q12b
2) Iyai [ ] pitani ku Q13

77
Q12b. Kodi manaphunzira kuti?
Kumene munaphunzira
1 Kukoleji
2 Kuwekishopo
3 Kukonfalensi
4 Pakuwonelela anzanga opanga
GAWO C: Mapangidwe a Pinati Bata
Tsopano ndizakufunsani mafunso pa zimene muziwa popanga pinati bata zimene
mungakumbukile bwino. Pa liu lakuti ‘kupanga’ nditanthauza zimene mumacita kuti
mupange pinati bata.
Q13. Ndiuzeni mwa tsatane-tsatane zimene mucita pakupanga pinati bata kucokera
poyamba kufikila pothela pamene mulonga mucoikamo kukagulitsa.
Mndandanda wakufunsitsitsa.
Zocita Yankho
1 Kosungila
2 Kusankha
3 Kukanzinga
4 Kuzizilitsa
5 Kucotsa mamba
6 Kusankhanso
7 Kugaya
8 Kuika mcere/sauti
9 Kuziziritsanso
10 Kulongeza moika
11 Kupima kulemela
12 Kuika malemba
13 Kupeleka kwaogula
Q13b. Kodi mumatsuka mashini yopangila pinati bata yanu?
1) Inde [ ] pitani ku Q13c

78
2) Iyai [ ] pitani ku Q14
Q13c. Mumatsuka kangati pa sabata?……………………..
Q14. Musanapange pinati bata yanu kodi mumasankha nshawa zanu? Conde
nenani mtundu wa nshawa zimene musankha zoipa. Mndandanda
wakufunsitsitsa.
Q15. Kulingana ndi zimene mwapitamo kapena zimene mwamvapo, kodi ndi
zinthu zotani zimene ziwonetsa kuti nshawa iyi ndi yabwino? Conde nenani
nshawa zimene zili bwino mupangila pinati
bata…………………………………
Q16. Ndi pinati bata yocuruka bwanji imene mupange pa Tsiku?
Kuculuka…….../mpimo…………………………………………………..
Q17. Kodi kugulitsa kuti pinati bata yanu? Conde nenani kina ciliconse Kumene
mugulitsa pinati bata. Mndandanda wakufunsitsitsa. ……………………
………………………………………………………………………………
Q18. Kodi muli ndi zowonjezerapo zilizonse kapena mafunso aliwonse pa zimene
takambitsana pamaphunziro aya?.....................................................................
Zikomo.
Nshawa zoipa
1 Nshawa zong’ambika
2 Nshawa zili ndi tudoyo
3 Nshawa zowola/ zodwala
4 Nshawa zamnanira kwambiri
5 Nshawa zamitundu-mitundu

79
Log of Aflatoxin concentration in ppb: Group Statistics
ORIGIN N Mean Std. Deviation Std.
Error
Mean
Log of amount of
Aflatoxin in ppb
International 54 1.6694 .39177 .05331
Local 55 2.8937 1.05244 .14191
t-test for Equality of Means
t df Sig. (2-
tailed)
Mean Difference Std. Error
Difference
Log of amount of
Aflatoxin in ppb -8.019 107 .000 -1.22426 .15266
APPENDIX 5: Two Sample T test Calculations
Hypotheses: H0: = 0 vs H1: 0, and tested statistics using
Test used:
√
~ =
Decision used:
The Null hypothesis is rejected if the t value observed is outside the interval:
( ) (-1.98, 1.98).
Results from SPSS:

80
APPENDIX 6: Test of Proportions
Evidence that proportions are different
Let XL be the number of observations which are below 4ppb in a random sample size
from the local population. Let XI be the number of observations which are below 4ppb in a
random sample size from the international population. Let PL, PI be the true proportions of
acceptable peanut butter by European standards for the local and international populations,
respectively.
Hypotheses: H0: = 0 vs H1: 0, and using test statistic
Test used:
√ (
)
~N (0, 1), and are estimates of
observations below 4ppb for local and international samples, respectively.
and
q = 1 – p, where are the number of observations below 4ppb for local and
international samples, respectively.
Decision used: We reject Ho in favour of H1 with α = 0.05 if the values are outside
(- Z0.975, Z0.975) = (-1.96, 1.96).
Difference in proportions for 0- 4ppb European set standard
Difference in proportions for 0- 15ppb CAC standard
Differenceof proportion
Std. Error Difference
Z =
95% Confidence Interval of the
Difference of proportions
Lower Upper
-0.094 0.053 -1.77 -0.011 0.197
Differenceof proportion
Std. Error Difference
Z =
95% Confidence Interval of
the Difference of proportions
Lower Upper
.43603 .07081 6.158 .29566 .57640

81
APPENDIX 7:Summary Statistics of Aflatoxin Brands
Brand name N Mean Minimum Maximum Std deviatiom
Black cat crunchy 3 5.7833 4.55 8.10 2.00769
Black cat smooth 5 6.1300 4.65 7.15 1.26.521
Chocolate crunchy 5 54.8500 47.10 59.80 5.30990
Extra crunchy 14 63.9800 43.15 83.55 16.68756
Jungle Beat plain 12 6.3167 3.70 9.15 1.69039
Plain smooth 5 86.3100 42.90 122.50 35.27206
Extra smooth 14 13.0571 8.85 16.30 2.27468
PnP smooth 2 8.0250 5.70 10.35 3.28805
Pot o’ogold smooth 2 4.7250 4.40 5.05 0.45962
Ritebrand crunchy 2 5.9750 4.85 7.10 1.59099
SaveMor crunchy 2 21.7250 10.50 32.95 15.87455
Spar crunchy 1 4.3500 4.35 4.35 .0
Unclassified 14 32.4964 3.30 147.20 46.84809
Yum caramel crunchy 2 2.3000 1.75 2.85 .77782
Yum creamy 4 5.1250 3.20 6.35 1.42741
Yum crunchy 4 6.1500 4.60 7.20 1.10303
Yum no added sugar 2 4.4250 3.95 4.90 .67175
Yum smooth 25 5.0040 3.25 8.05 1.02316
Total 109 18.8638 1.75 147.20 28.73854