Embed Size (px)
Citation preview

University of Portsmouth 501302
i
Investigate Length Effects of Concrete Beams Through the use of Non-
Destructive Methods.
By George Dance
501302
School of Civil Engineering and Surveying.
April 2014
University of Portsmouth 501302
ii
Abstract.
The advancement of Non-destructive testing methods within the construction industry is constantly
growing and its advantages are becoming apparent. This report looks into the effects of length on
concrete beams through the use of Non-destructive testing. The goal, through mainly primary
research is to extend the knowledge base of non-destructive methods and prove their effectiveness
within the construction industry. Laboratory testing will be the main source of research within this
report, testing three lengths of beams with a three point load acting on them through the use of
Digital Image Correlation (DIC) testing. From the results it was found that the maximum capacity for
strain a beam can handle increases as the beam reduces in length, furthermore the effectiveness of
the DIC method was highlighted and explored in detail during the testing process.

University of Portsmouth 501302
iii
Acknowledgements.
Firstly I would like to thank Dr Chen and Dr Nassif for all there help and guidance during the process
of this project.
I would also like to thank the laboratory technicians and Heman for helping during the testing
process and advising me when advice was needed.
Lastly I would like to thank my brother Harry, friends and family for supporting me through my life
and helping me get to where I am today.
Without any of the people above this project would not have come to realization.
University of Portsmouth 501302
iv
Statement of Originality
Title of Report: Investigate Length Effects of Concrete Beams Through the use of
Non-Destructive Methods.
Word count: 8,500
I, the undersigned, declare that this report is my own original work. Where I have
taken data, ideas and/or wording from another person or published source this is
explicitly acknowledged and referenced in the text.
I provide a copy of the electronic source from which this report was printed. I give
my permission for this report, and the electronic source, to be used in any
manner considered necessary to fulfil the requirements of the University of
Portsmouth Regulations, Procedures and Codes of Practice.
Please tick the appropriate box below.
I give permission that this report may be made available to others via the
University of Portsmouth library for the purpose of research.
I do not give permission that this report may be made available to others via
the University of Portsmouth library for the purpose of research.
Name: George Dance
Student number: 501302
Signature:
Date:
University of Portsmouth 501302
v
Contents Page.
Abstract. .............................................................................................................................................. ii
Acknowledgements. ........................................................................................................................... iii
List of Figures. ................................................................................................................................... vii
List of Tables. ................................................................................................................................... viii
Abbreviations. .................................................................................................................................. viii
1.0 Introduction. ................................................................................................................................. 1
1.1 Rationale Statement. ................................................................................................................ 1
1.2 Aim and Objectives. .................................................................................................................. 1
1.3 Structure of the Report. ............................................................................................................ 2
2.0 Literature Review. ......................................................................................................................... 3
2.1 Concrete. ................................................................................................................................... 3
2.1.1 Mechanical Properties. .......................................................................................................... 3
2.2 Non-destructive testing methods. ............................................................................................ 4
2.2.1 Ultrasonic testing. .................................................................................................................. 4
2.2.2 X-Radiography. ....................................................................................................................... 6
2.2.3 Thermography. ....................................................................................................................... 8
2.2.4 Liquid Penetrant Inspection (LPI). .......................................................................................... 8
2.2.5 Visual Inspection. ................................................................................................................... 8
2.2.6 Brittle coatings. ...................................................................................................................... 9
2.2.7 Digital Image Correlation camera (DIC camera). ................................................................... 9
2.3 Zwick/Roell Z250 Strength testing device. .............................................................................. 13
3.0 Methodology. .............................................................................................................................. 15
3.1 Introduction. ........................................................................................................................... 15
3.2 Pre testing. .............................................................................................................................. 15
3.3 Testing Samples ...................................................................................................................... 15
3.3.1 Preparation. ......................................................................................................................... 15
3.4 Visual inspection. .................................................................................................................... 17
3.5 Digital image correlation method. .......................................................................................... 17
3.6 Experiment. ............................................................................................................................. 20
4.0 Results. ........................................................................................................................................ 23
4.1 Cube Samples. ......................................................................................................................... 23
University of Portsmouth 501302
vi
4.2 Digital Imaging Correlation. .................................................................................................... 24
4.2.1 Displacement. ...................................................................................................................... 24
4.2.2 Strain. ................................................................................................................................... 26
4.2.3 Strain/span relation. ............................................................................................................ 26
4.3 Zwick/Roell Z250 Strength testing device results. .................................................................. 27
5.0 Data analysis. .............................................................................................................................. 29
5.1 Introduction. ........................................................................................................................... 29
5.2 DIC camera. ............................................................................................................................. 29
5.2.1 Displacement. ...................................................................................................................... 29
5.2.2 Relationship between the span and strain. ......................................................................... 29
5.2.3 Analysis of interrogation cells. ............................................................................................. 29
5.2.4 Displacement/strain Error analysis. ..................................................................................... 30
5.3 Zwick/Roell Z250 Strength testing device analysis. ................................................................ 31
5.4 Discussion. ............................................................................................................................... 31
5.5 Project limitations. .................................................................................................................. 32
6.0 Conclusion. .................................................................................................................................. 34
6.1 Recommended Further Research. .......................................................................................... 34
References. ....................................................................................................................................... 36
Appendix 1. (DIC Displacement) ....................................................................................................... 39
Appendix 2. (Z250 Results). .............................................................................................................. 45
Appendix 3. (Strain Images) .............................................................................................................. 50
Appendix 4. (Visual Inspection) ........................................................................................................ 55
Appendix 5. (Risk assessment) .......................................................................................................... 56
Appendix 6. (Ethics Review) .............................................................................................................. 58
Appendix 7 (Data from DIC strain testing) ........................................................................................ 60

University of Portsmouth 501302
vii
List of Figures.
Figure 1 (Pulse-Eco testing) .................................................................................................................................... 5
Figure 2 (CWI testing) ............................................................................................................................................. 6
Figure 3 (X Ray testing) ........................................................................................................................................... 7
Figure 4 (Imager E-lite) ......................................................................................................................................... 10
Figure 5 (Strain Master Process) ........................................................................................................................... 11
Figure 6 (Speckle pattern) ..................................................................................................................................... 11
Figure 7 (Mixing equipment) ................................................................................................................................ 16
Figure 8 (Concrete moulds) ................................................................................................................................... 16
Figure 9 (Curing process) ...................................................................................................................................... 17
Figure 10 (DIC set-up) ........................................................................................................................................... 17
Figure 11 (Deformation of interrogation cell) ....................................................................................................... 18
Figure 12 (Three point loading, Beams 1-3) .......................................................................................................... 21
Figure 13 (Three point loading, Beams 4-6) .......................................................................................................... 21
Figure 14 (Three point loading, Beams 7-9) .......................................................................................................... 21
Figure 15 (Experiment set-up) .............................................................................................................................. 22
Figure 16 (Critical area of beam) .......................................................................................................................... 22
Figure 17 (Beam 1 Undamaged) ........................................................................................................................... 24
Figure 18 (Beam 1 Damaged) ............................................................................................................................... 24
Figure 19 (Beam 4 undamaged) ........................................................................................................................... 25
Figure 20 (Beam 4 Damaged) ............................................................................................................................... 25
Figure 21 (Beam 8 Undamaged) ........................................................................................................................... 25
Figure 22 (Beam 8 Damaged) ............................................................................................................................... 26
Figure 23 (Strain/Span graph) .............................................................................................................................. 26
Figure 24 (Z250 graph, Beam 1) ........................................................................................................................... 27
Figure 25 (Z250 graph, Beam 4) ........................................................................................................................... 27
Figure 26 (Z250 graph, Beam 8) ........................................................................................................................... 28
Figure 27 (Beam 1 undamaged) ........................................................................................................................... 39
Figure 28 (Beam 1 damaged) ............................................................................................................................... 39
Figure 29 (Beam 2 undamaged) ........................................................................................................................... 39
Figure 30 (Beam 2 damaged) ............................................................................................................................... 40
Figure 31 (Beam 3 undamaged) ........................................................................................................................... 40
Figure 32 (Beam 3 damaged) ............................................................................................................................... 40
Figure 33 (Beam 4 undamaged) ........................................................................................................................... 41
Figure 34 (Beam 4 damaged) ............................................................................................................................... 41
Figure 35 (Beam 5 undamaged) ........................................................................................................................... 41
Figure 36 (Beam 5 damaged) ............................................................................................................................... 42
Figure 37 (Beam 6 undamaged) ........................................................................................................................... 42
Figure 38 (Beam 6 damaged) ............................................................................................................................... 42
Figure 39 (Beam 7 undamaged) ........................................................................................................................... 43
Figure 40 (Beam 7 Damaged) ............................................................................................................................... 43
Figure 41 (Beam 8 undamaged) ........................................................................................................................... 43
Figure 42 (Beam 8 damaged) ............................................................................................................................... 44
Figure 43 (Beam 9 undamaged) ........................................................................................................................... 44
Figure 44 (Beam 9 damaged) ............................................................................................................................... 44
Figure 45 (Beam 1 Z250) ....................................................................................................................................... 45

University of Portsmouth 501302
viii
Figure 46 (Beam 2 Z250) ....................................................................................................................................... 45
Figure 47 (Beam 3 Z250) ....................................................................................................................................... 46
Figure 48 (Beam 4 Z250) ....................................................................................................................................... 46
Figure 49 (Beam 5 Z250) ....................................................................................................................................... 47
Figure 50 (Beam 6 Z250) ....................................................................................................................................... 47
Figure 51 (Beam 7 Z250) ....................................................................................................................................... 48
Figure 52 (Beam 8 Z250) ....................................................................................................................................... 48
Figure 53 (Beam 9 Z250) ....................................................................................................................................... 49
Figure 54 (Beam 1 strain) ..................................................................................................................................... 50
Figure 55 (Beam 2 strain) ..................................................................................................................................... 50
Figure 56 (Beam 3 strain) ..................................................................................................................................... 51
Figure 57 (Beam 4 strain) ..................................................................................................................................... 51
Figure 58 (Beam 5 strain) ..................................................................................................................................... 52
Figure 59 (Beam 6 strain) ..................................................................................................................................... 52
Figure 60 (Beam 7 strain) ..................................................................................................................................... 53
Figure 61 (Beam 8 strain) ..................................................................................................................................... 53
Figure 62 (Beam 9 strain) ..................................................................................................................................... 54
List of Tables.
Table 1 (Specifications for the Zwick Z250 testing machine) ................................................................................ 14
Table 2 (Break down of a standard mixture) ........................................................................................................ 16
Table 3 (Details, cube one) ................................................................................................................................... 23
Table 4 (Details, cube two) ................................................................................................................................... 23
Table 5 (Details, cube three) ................................................................................................................................. 23
Abbreviations.
Carbon Fibre Reinforced Polymers (CFRP) Charged Couple Device (CCD) Coda Wave Interferometry (CWI) Digital Image Correlation (DIC) Fast Fourier Transformation (FFT) Infrared Radiations (IR) Liquid Penetrant Inspection (LPI) Non-Destructive Testing (NDT) Normalized Cross-Correlation (NCC) Sum of Square of Subset Intensity Gradients (SSSIG) Ultrasonic Pulse Velocity (UPV)

University of Portsmouth 501302
1
1.0 Introduction.
Non-destructive testing (NDT) is defined as a wide range of analysis techniques used within the
construction industry to evaluate the properties of a material, component or system without causing
damage.
1.1 Rationale Statement.
This project will give further insight into non-destructive testing methods and their effectiveness on
concrete beams of different lengths. Non-destructive testing can benefit large companies who
require more detailed quality reports. This can be achieved during the construction process or after,
depending on the preferences of the company involved (giving a flexibility, which would normally
not exist).
Non-destructive testing can also be used on existing buildings. The use of non-destructive testing
on existing buildings can help determine whether or not they are still structurally sound. This
method is particularly useful when concrete beams are involved; the reason for this is because over
time a lot can go wrong with a building. Parts of the building can start to fail putting unexpected
loads on the beams. A concrete beam could have also had unexpected environmental exposure and
its structural integrity could be in question.
Non-destructive testing can be more economically viable than conventional methods. For example;
if an already existing structure is under question for structural integrity. Instead of damaging it
further through conventional testing methods. Non-destructive methods can be used to prove the
building is still structurally stable. This saves resources by avoiding destroying and re building
another structure altogether.
1.2 Aim and Objectives.
Aim: The aim of this project is to investigate the strength and physical properties of different length
concrete beams through the use of non-destructive testing methods.
Objectives:
i. To provide more information on the effectiveness of Non-Destructive testing methods
within the construction industry.
ii. To Illustrate in detail some of the different types of non-destructive methods available.
iii. To provide information on new and advanced methods of non-destructive testing.
iv. To provide information on the characteristics of concrete beams.
University of Portsmouth 501302
2
1.3 Structure of the Report.
This report is comprised of six chapters. Following this introductory chapter, chapter two presents a
literature review on non-destructive testing, the different methods available, practice of these
methods and previous testing. Furthermore it looks into concrete and its mechanical properties. The
objective of this chapter is to further knowledge gaps on non-destructive testing and find key gaps in
previous research which can be looked into and studied further.
Chapter three is comprised of the methodology; which explains the method behind the research
being conducted in order to obtain the objectives set in chapter one. Within this chapter is a
detailed method of what will be done during the testing period. It will also contain a clear
understanding of how the results will be obtained. These results will then be displayed in chapter
four, containing; the displacement graphs/interrogation cell images showing how the displacement
affected the beam before and after fracture, strain over span graph investigating the relationship
between stain and span, strain interrogation cell images showing the location of the fractures, cube
testing results and the results from the Zwick Z250 testing machine.
The results mentioned above will be analysed in chapter five and a detailed discussion conducted
on how the results coincide with the previous testing and methods mentioned in chapter two.
Following this discussion is the conclusion (chapter 6), this chapter will give an overview of the
project and relate back to the aim and objectives set out in chapter one. Furthermore it will present
areas that could be improved or expanded should further testing be conducted.
University of Portsmouth 501302
3
2.0 Literature Review.
2.1 Concrete.
Concrete is one of the fundamental materials in modern construction. One of the reasons it is so
widely used is due to its ability to be easily modelled or casted when in its plastic form. It then
solidifies into a hard, strong and durable material that can even set under water.
There has been a constant development on the prospects of concrete ever since it started being
used in the construction industry. Most of these adaptations have centred on the aggregate mixture
and type of reinforcement. For example the use of fibres in the mixing process; increasing the
strength and price of the concrete.
Concrete is formed through the combination of cement (a lime based material that reacts with
water to solidify) and an aggregate (a granular material, such as sand, gravel, crushed stone or iron
blast furnace slag) (Paul Klieger, 1994).
The amount of cement in each mixture and the type of aggregate is changed depending on the
requirements of the job. For example the increase of aggregate within a mixture can increase or
decrease its strength depending on the proportion of aggregate. If the mixture is 0-20% aggregate
there is generally a gradual decrease in compressive strength. If the mixture is 40-80% aggregate
there will most likely be an increase in strength (Neville, 1995).
Concrete can also be affected by the amount of water added when the concrete is first mixed. As
shown in “Properties of Concrete, Fourth Edition” as the water content is increased it dramatically
decreases the compressive strength of the concrete sample (Neville, 1995).
2.1.1 Mechanical Properties.
The mechanical properties of concrete strongly reside in its compressive ability. The compressive
ability of concrete is one highest within the construction industry and is one of the many reasons it is
so widely used. One example of its use would be concrete columns.
Although concretes compressive ability is so high its elastic is very low, meaning other materials are
usually considered when there will be a high elastic stress in the construction process. (Rahal, 2007)
Other mechanical properties of concrete include: toughness, resistance to indentations, fire
resistance, resilience to natural elements, slow failure rate (cracking will usually appear before the
concrete fails), etc.
University of Portsmouth 501302
4
2.2 Non-destructive testing methods.
The book “Non-destructive testing techniques” by Ravi Prakash defines non-destructive testing as
“those testing methods in which the material under test is not destroyed or to say the future
usefulness of the material under test is not impaired.”
Compare this to mechanical testing (tensile testing, flexural testing, torsional testing etc.) which
tests the material in question to failure, fracturing or destroying the material rendering it useless for
future use, the benefits of non-destructive testing become easily recognisable. For example if a
concrete beam comes into question about its integrity a variety of non-destructive methods can be
applied to conclude whether it is still structurally sound or whether further action must be
conducted. If conventional methods are applied to this situation the beam would have to have been
destroyed and an unnecessary amount of capital would have to be spent replacing the beam
(rendering this method of testing in this particular scenario pointless).
2.2.1 Ultrasonic testing.
Ultrasonic testing is one of the most diverse and popular form of non-destructive testing used to
date. The reason this method is so widely used can be related to its numerous operations which
include; evaluating internal flaws, the detection of surface and sub-surface discrepancies, measuring
the thickness of a structure, evaluating the physical properties of a substance (elastic modulus) etc.
Due to its high penetrating powers extremely thick sections can be scanned. Because of its high
frequency, minor flaws/cracks can be found giving large areas of detailed information efficiently
(useful when dealing with damns). The amount of Hz used to analyse the subject depends on the
material. For example a coarse material such as concrete, wood and rock would use a low frequency
close to 50 kHz compared to other un-coarse materials which can use a frequency of up to 10 MHz
(Prakash, 2012).
Ultrasonic testing has two main techniques; pulse-echo and through transmission. Below is a brief
synoptic of these two methods.
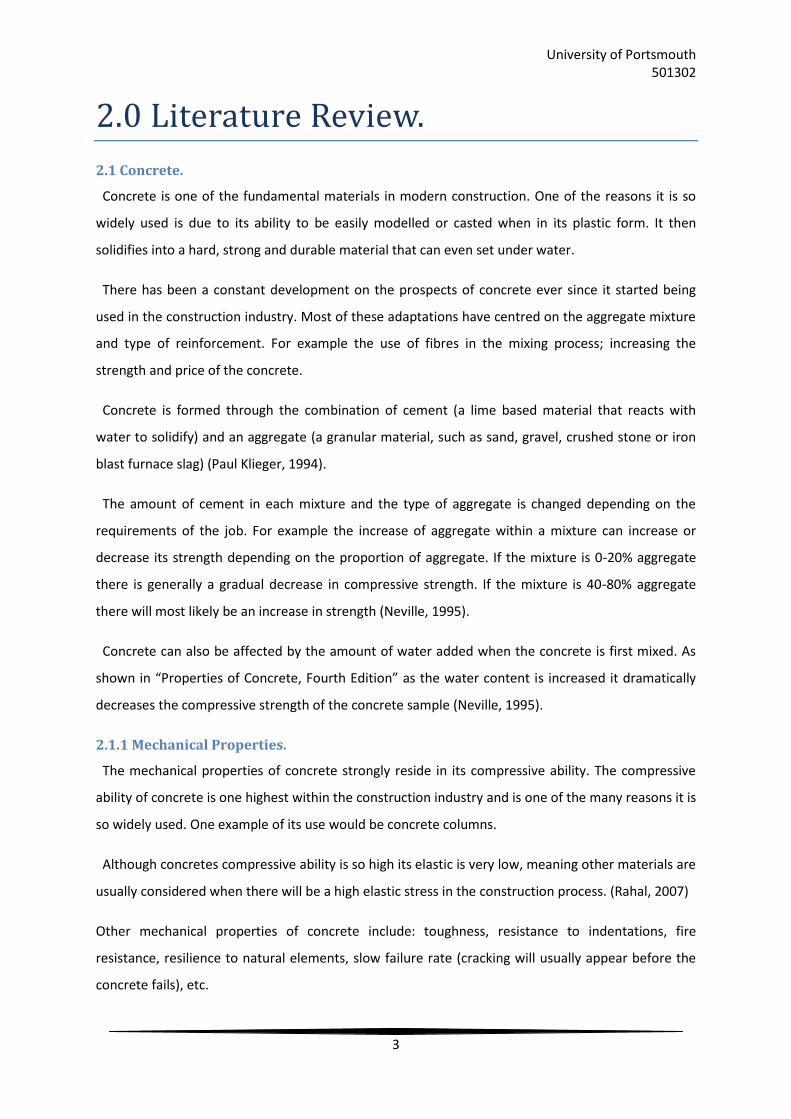
Pulse-echo testing: The Pulse–echo technic involves applying an oscillating “pulsing” voltage to a
piezo-electric crystal in order to produce an ultrasonic wave train. The echo of this wave is then
detected and separated into the initial pulse and the back-wall echo/defect echo. These echoes are
then compared and analysed to derive information regarding the qualities of the material under
examination.
University of Portsmouth 501302
5
In order for this method to be effective a coupling medium is required. In general this material is
something that can keep the surface of the test subject wet and stay between the transducer and
the test material whilst testing is in progress. (Karl-Jorg L, 2012)
Transmission testing: This method of testing involves the placement of a “transmitter” and
“receiver” on either side of the material under examination. Ultrasonic energy is then passed
through the material and if any defects are present the strength of the beam will be affected. In
cases of materials with a lot of air pockets (voids, cracks, blow-holes etc.) the beam might be fully
absorbed. (Karl-Jorg L, 2012)
For the testing of concrete beams transmission testing would be the preferable option due to its
increased effectiveness and more precise results. It also has the option of immersion type testing
giving a variety of possibilities during the testing process.
Previous testing.
Ultrasonic testing is a popular method within the field of non-destructive testing and a lot of
research has already been conducted on it. Riga Technical University tested ultrasonic pulse velocity
(UPV) on concrete with different water contents. It was proven that the concrete with higher water
content produced better results through the use of UPV than concrete with lower water content (up
to 16 per cent difference). The testing of concrete water content relates to this project by showing
the range of capabilities ultrasonic testing has. It also shows how important making your samples
with identical mixes is. 16 per cent difference is enough to have a heavy effect on the final results.
(Lencis Uldis, 2013)
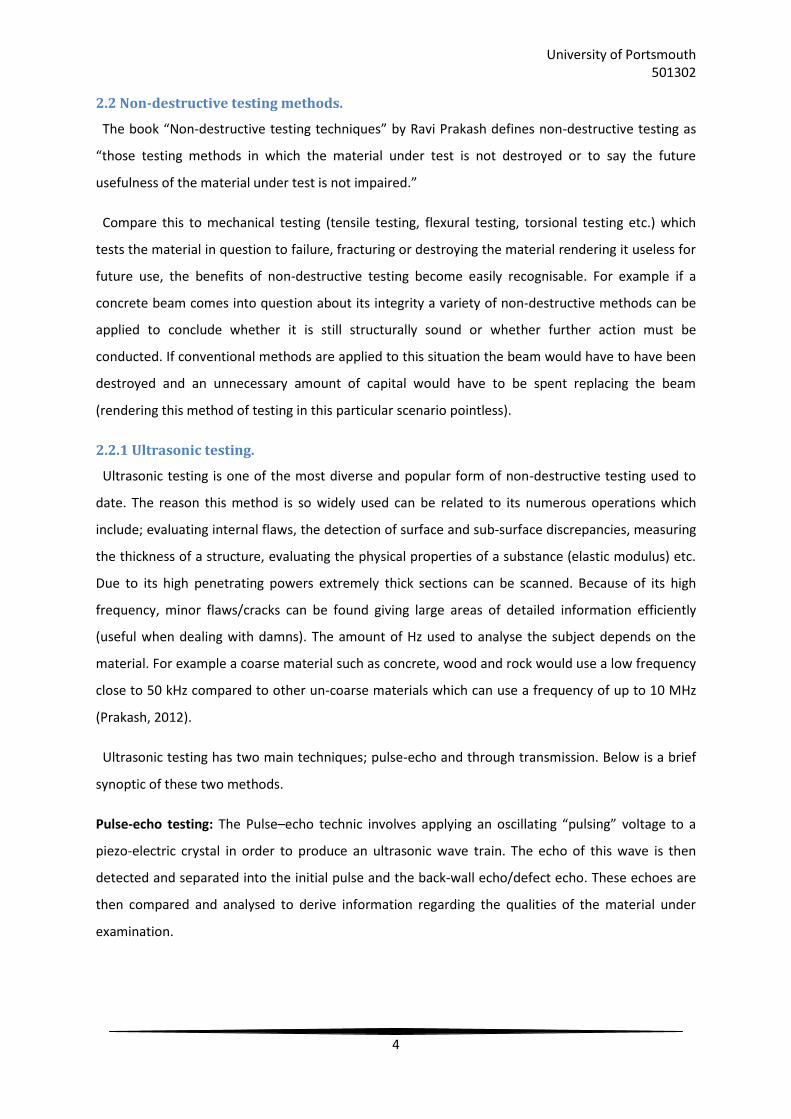
Coda wave interferometry (CWI) has been used to measure the propagation velocity variations due
to a stress field in a concrete beam under a four-point bending test, creating both compressive and
(Xiamen, 2014) Figure 1 (Pulse-Eco testing)
University of Portsmouth 501302
6
tensile stress simultaneously within the sample. During this test the beam will have 4 receivers
attached to the centre of the beam, as shown in figure 2. Whilst the beam is being loaded, a 200µs
chirp signal with a frequency range of 200-800 kHz will be used as an excitation signal for source.
Acquisition is carried out by using 5 MHz sampling frequency. The 4 receivers will then measure the
change in the velocity of the waves in order to figure out the different stresses of the testing sample.
(Zhang Y, 2013). The methods conducted in this test can relate to this project by showing that a
variety of different variable results can be obtained through CWI testing when relating to concrete
beams.
Critical Analysis.
As shown previously in this section (2.2.1), this particular method of testing has been proven to
have great advantages when finding out the internal flaws of a structure or substance and can be
applied in a variety of scenarios within the construction industry. However for this particular project
(Investigate length effects of concrete beams) these qualities will not be advantageous. This is due to
the internal structure of this beam remaining constant throughout its different lengths.
One new ultrasonic testing method which could be applied to this experiment would be the Coda
wave interferometry method. This method as mentioned earlier can evaluate the internal stresses of
a concrete beam and its variation over different lengths. The results of this experiment can be
compared with a known destructive method to help validate its effectiveness.
2.2.2 X-Radiography.
This form of non-destructive testing is one of the most widely used methods in the industry. It was
first used in 1920 and since then has grown in efficiency and popularity. This “x-ray” method is most
commonly known in the medical industry, but unlike the medical industry the samples that are being
examined are not damaged by the radiation so the scanning process can last for longer periods of
time giving more accurate results (Baldev R, 1997).
Figure 2 (CWI testing) (Zhang Y, 2013)
University of Portsmouth 501302
7
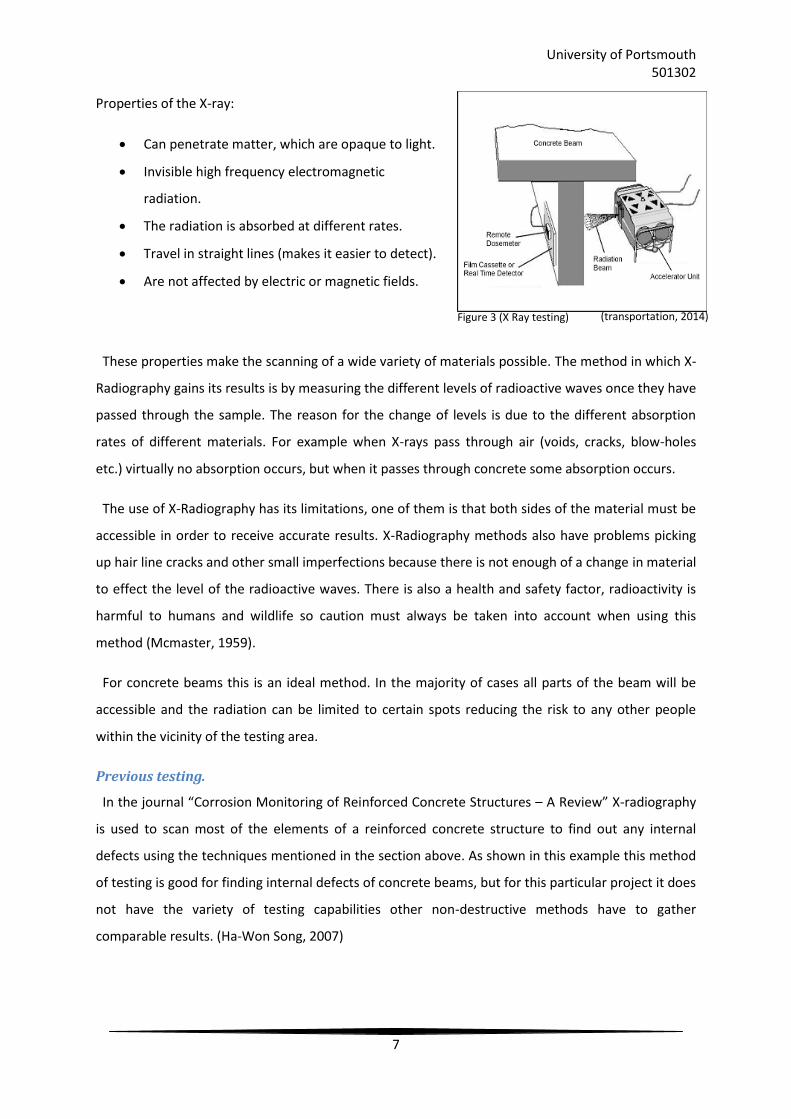
Properties of the X-ray:
Can penetrate matter, which are opaque to light.
Invisible high frequency electromagnetic
radiation.
The radiation is absorbed at different rates.
Travel in straight lines (makes it easier to detect).
Are not affected by electric or magnetic fields.
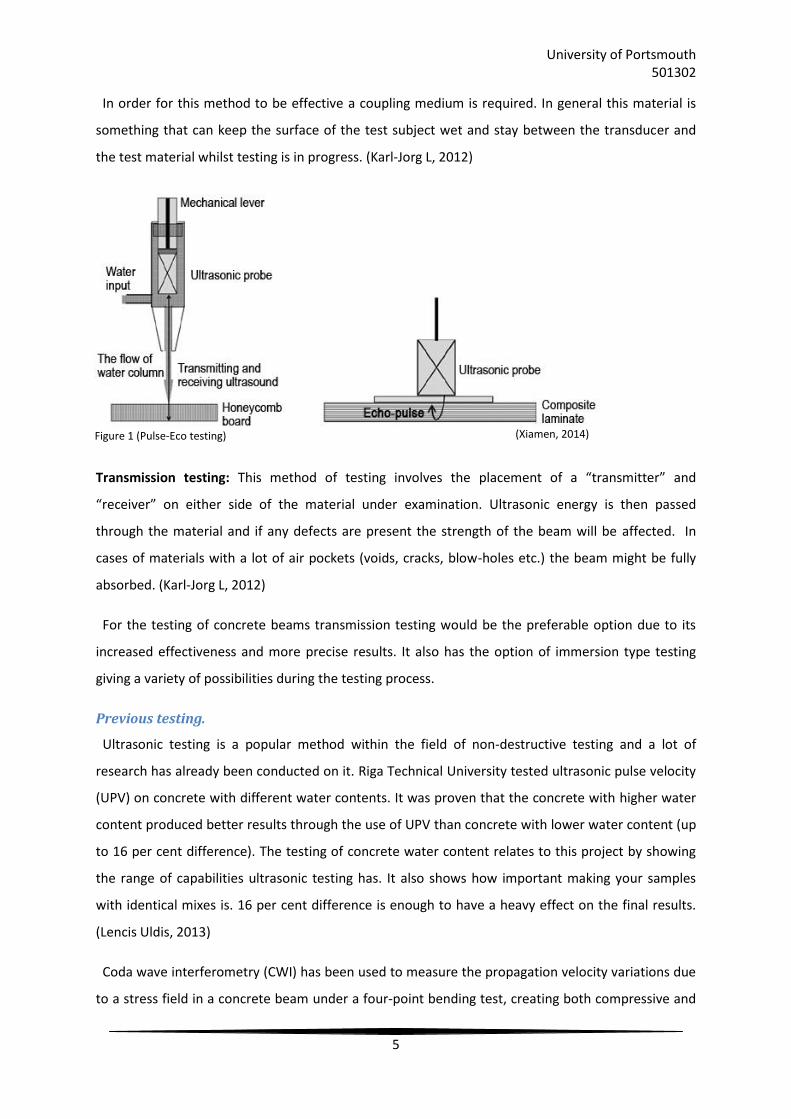
These properties make the scanning of a wide variety of materials possible. The method in which X-
Radiography gains its results is by measuring the different levels of radioactive waves once they have
passed through the sample. The reason for the change of levels is due to the different absorption
rates of different materials. For example when X-rays pass through air (voids, cracks, blow-holes
etc.) virtually no absorption occurs, but when it passes through concrete some absorption occurs.
The use of X-Radiography has its limitations, one of them is that both sides of the material must be
accessible in order to receive accurate results. X-Radiography methods also have problems picking
up hair line cracks and other small imperfections because there is not enough of a change in material
to effect the level of the radioactive waves. There is also a health and safety factor, radioactivity is
harmful to humans and wildlife so caution must always be taken into account when using this
method (Mcmaster, 1959).
For concrete beams this is an ideal method. In the majority of cases all parts of the beam will be
accessible and the radiation can be limited to certain spots reducing the risk to any other people
within the vicinity of the testing area.
Previous testing.
In the journal “Corrosion Monitoring of Reinforced Concrete Structures – A Review” X-radiography
is used to scan most of the elements of a reinforced concrete structure to find out any internal
defects using the techniques mentioned in the section above. As shown in this example this method
of testing is good for finding internal defects of concrete beams, but for this particular project it does
not have the variety of testing capabilities other non-destructive methods have to gather
comparable results. (Ha-Won Song, 2007)
(transportation, 2014) Figure 3 (X Ray testing)
University of Portsmouth 501302
8
2.2.3 Thermography.
Thermography is the study of infrared radiations (IR) across the surface of a material. All materials
emit IR and through the aid of a suitable detector can be seen. Thermography takes advantage of
the infrared spectral band by detecting the different levels throughout the material. These different
levels of radiations are then analysed and any abnormalities are singled out and classified as defects
within the material.
Thermography is heavily dependent on the surrounding area; it is important to keep the
surrounding area of any material being tested free from thermal radiation sources, otherwise the
radiation from these external sources will interfere with the sensor giving inaccurate results. (Baldev
R, 1997)
When testing from a distance the atmosphere interferes with the materials spectral characteristics
as well attenuating the radiation from the target. So for the testing of concrete beams it is
recommended to test the beam in an isolated environment from a close distance.
2.2.4 Liquid Penetrant Inspection (LPI).
Liquid penetration inspection has been around since the 1920’s and has grown to become one of
the more popular choices of NDT. Although oil and chalk-dust where used instead of a dye or
fluorescent liquid which is now used in modern testing.
LPI has become a popular method due to its simplistic but effective method and its ability to be
used on a wide variety of materials. The method involves releasing a steady flow of liquid (with
either a dye or fluorescent added to it) over the surface of the material creating a reasonably
uniform coating. The liquid will then penetrate into the flaw through capillary action allowing any
surface discrepancies to be located. (Prakash, 2012)
This method can only locate surface defects so it is limited in its abilities. It is also better suited for
testing older concrete beams which may have had time to develop surface discrepancies.
2.2.5 Visual Inspection.
Visual inspection is one of the cheapest and simplest non-destructive testing methods. The reason
it is so cheap and popular is because all you need to complete a basic visual inspection is a
competent person with good vision.
Visual inspection involves cleaning the surface of whatever material is about to be inspected. Then
a competent person with good vision will inspect the material for any discrepancies; cracking,
surface finish, decolouration, through surface openings etc.
University of Portsmouth 501302
9
When conducting visual testing you must take into account that normal eyes cannot focus on
objects which are closer than approximately 0.1mm. Also the minimum angular separation of two
point objects resolvable by the eye (without any optical aid) is about one minute of arc. (Prakash,
2012).
To advance the visual test other implements can be used; Lighting can be enhanced in order to
highlight any discrepancies better and the use of optical aids can enhance vision, picking up flaws
that the naked eye could not comprehend (Magnifying lenses, periscopes, microscopes, mirrors,
telescopes, boroscopes etc.).
This method can be particularly effective on concrete beams making sure that there are no obvious
flaws before further testing is conducted.
2.2.6 Brittle coatings.
Brittle coating involves the spraying of a quickly drying paint over the surface of a concrete beam.
This paint has its own threshold to a specific strain value and when this value is exceeded the paint
will deteriorate. Therefore this method can be used to determine when specific parts of the beam
exceed certain limits. (Prakash, 2012)
It can also be used as a warning to determine when the stress on a beam is getting close to its limit.
2.2.7 Digital Image Correlation camera (DIC camera).
This method of non-destructive testing is newly developed and rapidly growing in popularity. It is a
non-contact method that measures the normal strains, shear strain, deformation, deflection of the
beam and von Mises strain.
This is achieved by comparing two images of the concrete beam, one before loading and one after.
By using the speckle pattern technique, which will be applied to the surface of the beam before
testing. The DIC camera linked with a charged couple device (CCD) converts the images into a grey-
scale pattern. This is done by capturing the three numbers (called the colour components Y, Cb and
Cr) reflected be each pixel. (L Skarzynski, 2013)
Y is the luminosity (Brightness).
Cb is the blueness.
Cr is the redness.
University of Portsmouth 501302
10
From this a computer software system uses the displacement factor between these two images in
specific algorithms to calculate the strain between any two points on the images. Therefore the
mechanical properties mentioned earlier in this section can be determined. (Ming-Hsiang S, 2013)
This method of testing can be used effectively on a range materials and scales varying from
microscopic levels to scales as large as a bridge.
Standard camera statistics:
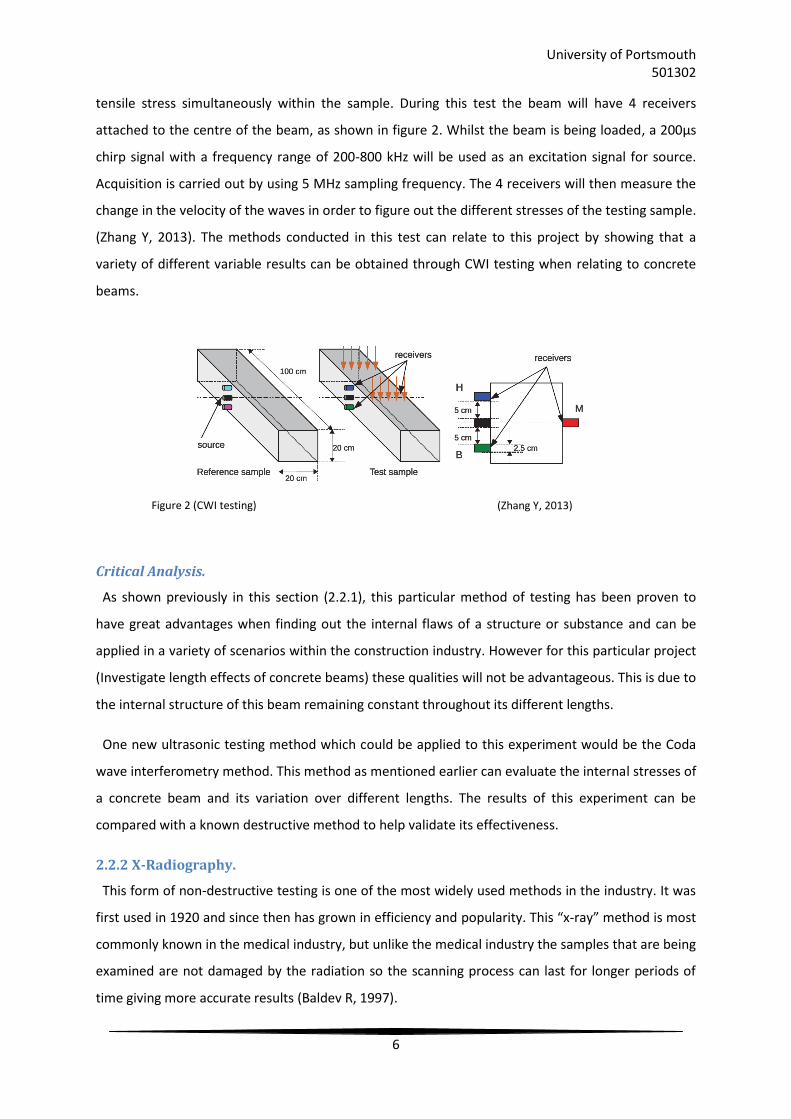
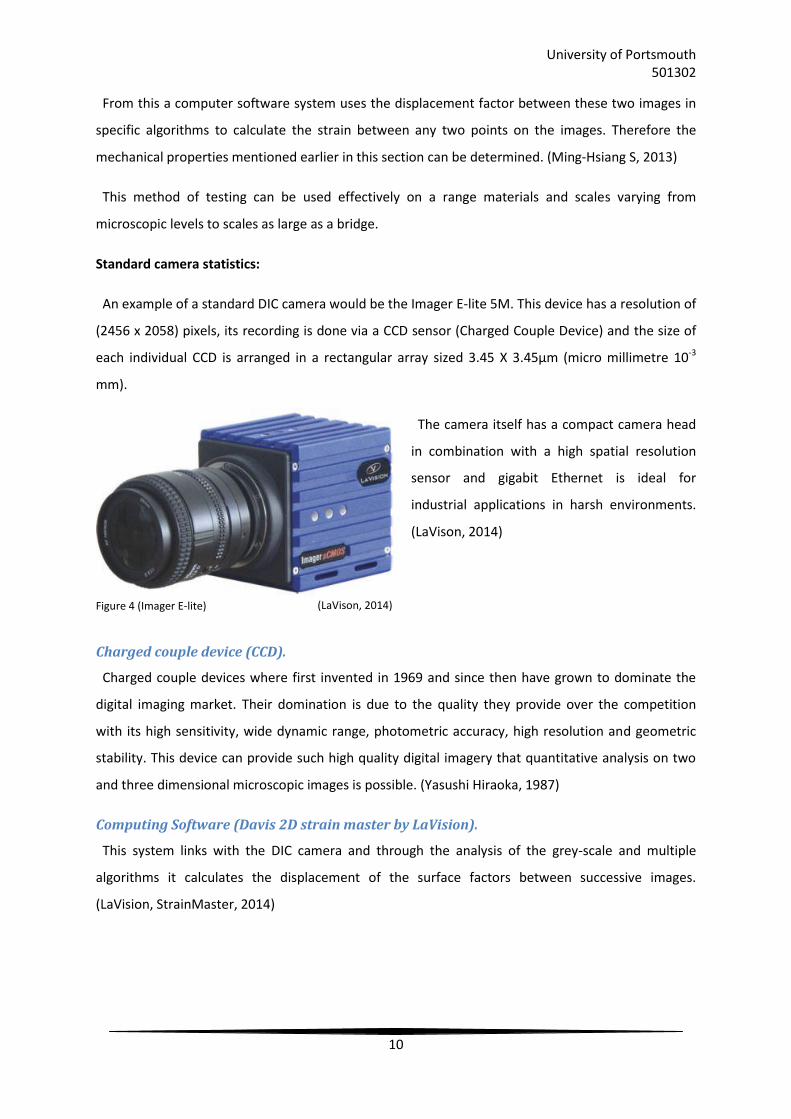
An example of a standard DIC camera would be the Imager E-lite 5M. This device has a resolution of
(2456 x 2058) pixels, its recording is done via a CCD sensor (Charged Couple Device) and the size of
each individual CCD is arranged in a rectangular array sized 3.45 X 3.45µm (micro millimetre 10-3
mm).
The camera itself has a compact camera head
in combination with a high spatial resolution
sensor and gigabit Ethernet is ideal for
industrial applications in harsh environments.
(LaVison, 2014)
Charged couple device (CCD).
Charged couple devices where first invented in 1969 and since then have grown to dominate the
digital imaging market. Their domination is due to the quality they provide over the competition
with its high sensitivity, wide dynamic range, photometric accuracy, high resolution and geometric
stability. This device can provide such high quality digital imagery that quantitative analysis on two
and three dimensional microscopic images is possible. (Yasushi Hiraoka, 1987)
Computing Software (Davis 2D strain master by LaVision).
This system links with the DIC camera and through the analysis of the grey-scale and multiple
algorithms it calculates the displacement of the surface factors between successive images.
(LaVision, StrainMaster, 2014)
(LaVison, 2014) Figure 4 (Imager E-lite)
University of Portsmouth 501302
11
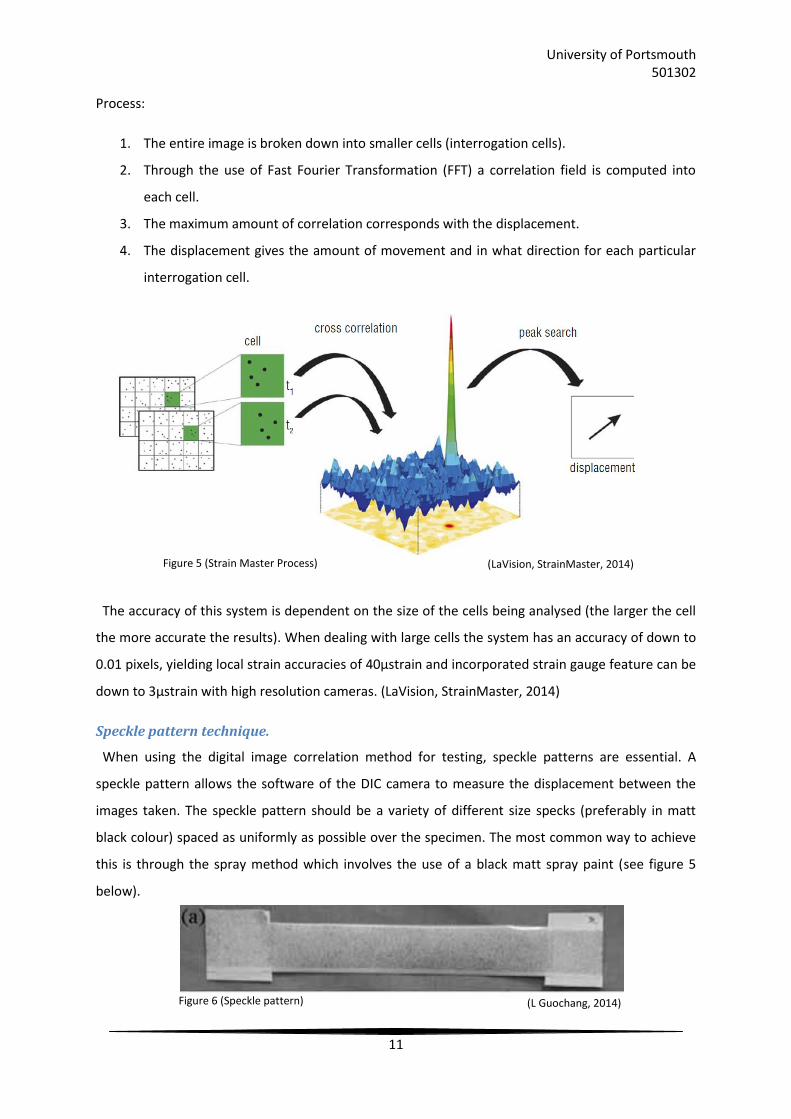
Process:
1. The entire image is broken down into smaller cells (interrogation cells).
2. Through the use of Fast Fourier Transformation (FFT) a correlation field is computed into
each cell.
3. The maximum amount of correlation corresponds with the displacement.
4. The displacement gives the amount of movement and in what direction for each particular
interrogation cell.
The accuracy of this system is dependent on the size of the cells being analysed (the larger the cell
the more accurate the results). When dealing with large cells the system has an accuracy of down to
0.01 pixels, yielding local strain accuracies of 40µstrain and incorporated strain gauge feature can be
down to 3µstrain with high resolution cameras. (LaVision, StrainMaster, 2014)
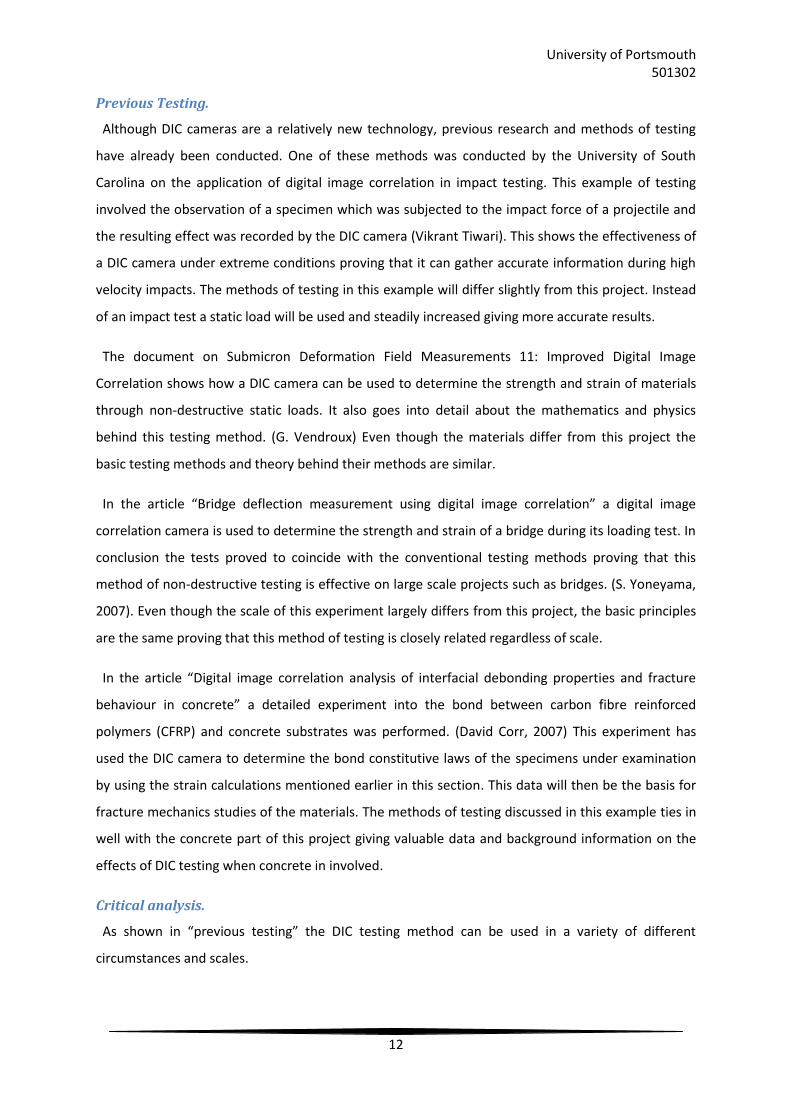
Speckle pattern technique.
When using the digital image correlation method for testing, speckle patterns are essential. A
speckle pattern allows the software of the DIC camera to measure the displacement between the
images taken. The speckle pattern should be a variety of different size specks (preferably in matt
black colour) spaced as uniformly as possible over the specimen. The most common way to achieve
this is through the spray method which involves the use of a black matt spray paint (see figure 5
below).
(L Guochang, 2014)
(LaVision, StrainMaster, 2014) Figure 5 (Strain Master Process)
Figure 6 (Speckle pattern)
University of Portsmouth 501302
12
Previous Testing.
Although DIC cameras are a relatively new technology, previous research and methods of testing
have already been conducted. One of these methods was conducted by the University of South
Carolina on the application of digital image correlation in impact testing. This example of testing
involved the observation of a specimen which was subjected to the impact force of a projectile and
the resulting effect was recorded by the DIC camera (Vikrant Tiwari). This shows the effectiveness of
a DIC camera under extreme conditions proving that it can gather accurate information during high
velocity impacts. The methods of testing in this example will differ slightly from this project. Instead
of an impact test a static load will be used and steadily increased giving more accurate results.
The document on Submicron Deformation Field Measurements 11: Improved Digital Image
Correlation shows how a DIC camera can be used to determine the strength and strain of materials
through non-destructive static loads. It also goes into detail about the mathematics and physics
behind this testing method. (G. Vendroux) Even though the materials differ from this project the
basic testing methods and theory behind their methods are similar.
In the article “Bridge deflection measurement using digital image correlation” a digital image
correlation camera is used to determine the strength and strain of a bridge during its loading test. In
conclusion the tests proved to coincide with the conventional testing methods proving that this
method of non-destructive testing is effective on large scale projects such as bridges. (S. Yoneyama,
2007). Even though the scale of this experiment largely differs from this project, the basic principles
are the same proving that this method of testing is closely related regardless of scale.
In the article “Digital image correlation analysis of interfacial debonding properties and fracture
behaviour in concrete” a detailed experiment into the bond between carbon fibre reinforced
polymers (CFRP) and concrete substrates was performed. (David Corr, 2007) This experiment has
used the DIC camera to determine the bond constitutive laws of the specimens under examination
by using the strain calculations mentioned earlier in this section. This data will then be the basis for
fracture mechanics studies of the materials. The methods of testing discussed in this example ties in
well with the concrete part of this project giving valuable data and background information on the
effects of DIC testing when concrete in involved.
Critical analysis.
As shown in “previous testing” the DIC testing method can be used in a variety of different
circumstances and scales.

University of Portsmouth 501302
13
Although this method has been proven to generate accurate results when it comes to determining
the strain of a subject under stress, as well as highlighting where cracks/imperfections might have
formed, its perceptive aspects when determining the internal state of a structure/material are
lacking.
There has also been little to no research done towards evaluating the effectiveness of the different
length of beams, leaving a gap in knowledge that this project could help fill.
2.3 Zwick/Roell Z250 Strength testing device.
This device can offer a variety of different tests. One test includes a three point or four point
loading of a beam, making it ideal for this project. Below are some of the basic scopes of the offered
tests by means of Zwick Z250 testing machine (Informacyjne, 2014):
Static tensile test at room temperature, with determination of values required by PN-EN ISO
6892-1 standard.
Static compression and bend test.
Determination of Young E module.
Determination of plastic anisotropy ratio „r” for sheets and strips.
Determination of strain-hardening coefficient „n” at drawing.
Technological tests of bending, breaking, flattening, expanding, etc.
Tests of mechanical properties of reinforced bars, tubes, plates, sections, welded joints, and
other steel products.
As shown above the Zwick Z250 testing machine offers a lot of data whilst simultaneously creating
the ideal environment for testing concrete beams through non-destructive methods. Table 1 shows
the specifications of this machines and highlights its accuracy.
University of Portsmouth 501302
14
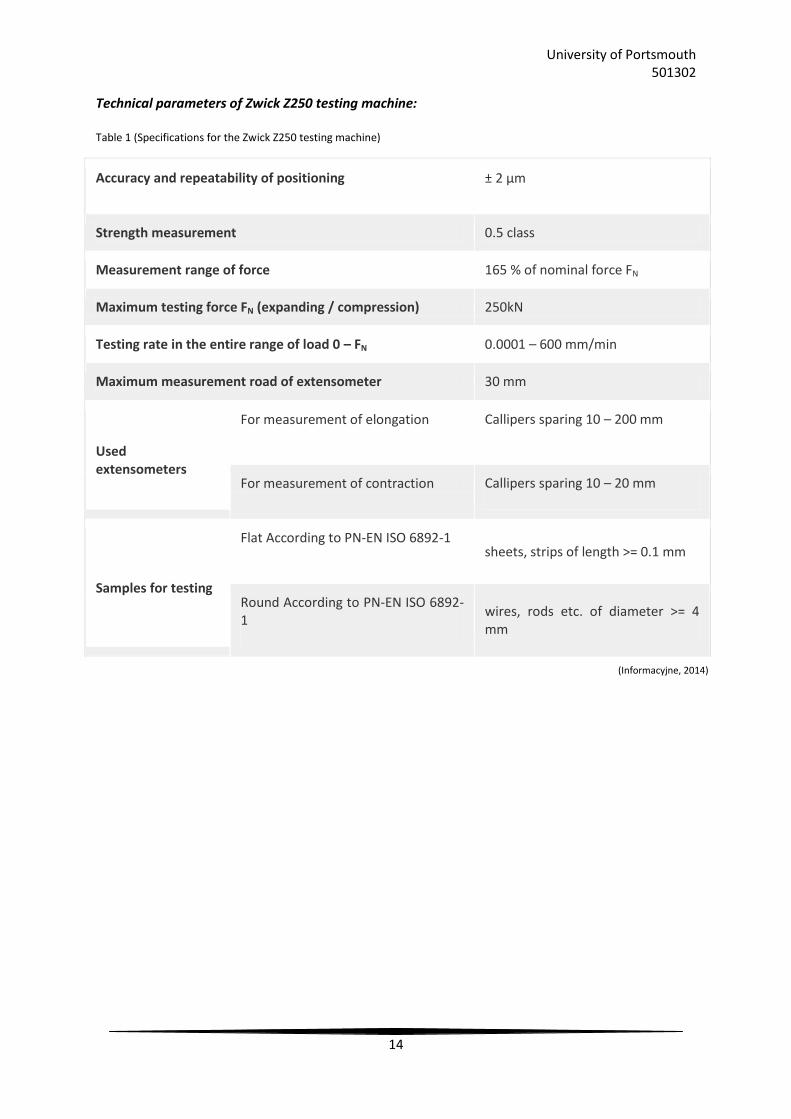
Technical parameters of Zwick Z250 testing machine:
Table 1 (Specifications for the Zwick Z250 testing machine)
Accuracy and repeatability of positioning ± 2 μm
Strength measurement 0.5 class
Measurement range of force 165 % of nominal force FN
Maximum testing force FN (expanding / compression) 250kN
Testing rate in the entire range of load 0 – FN 0.0001 – 600 mm/min
Maximum measurement road of extensometer 30 mm
Used extensometers
For measurement of elongation Callipers sparing 10 – 200 mm
For measurement of contraction Callipers sparing 10 – 20 mm
Samples for testing
Flat According to PN-EN ISO 6892-1 sheets, strips of length >= 0.1 mm
Round According to PN-EN ISO 6892-1
wires, rods etc. of diameter >= 4 mm
(Informacyjne, 2014)
University of Portsmouth 501302
15
3.0 Methodology.
3.1 Introduction.
In order to properly acquire the aims and objective stated in chapter one, two methods of non-
destructive testing where chosen. The first one is a basic visual inspection to make sure the test
subjects are in good condition, any obvious imperfections are noted and measured for future
consideration. The second testing method that was chosen is the digital image correlation
technique. This method is relatively new and further research will benefit its progression within the
construction industry, it is also one of the top non-destructive testing methods for concrete beams
and its advantages over conventional methods will be highlighted within this project.
For this project most of the research will be conducted within a laboratory. The reason for this is
because all the testing for this project needs a safe and controlled environment. On site testing for
this project was considered but due to the amount of health and safety required to accomplish this
and the transportation of the digital image correlation camera. It was concluded that this method of
testing was not necessary.
3.2 Pre testing.
Before any laboratory work commences an ethics review (Appendix 6) must have been produced
and signed by the appropriate authorities. A risk assessment (Appendix 5) must also be read by all
parties present and signed to confirm that everyone knows the risks involved.
3.3 Testing Samples
For this project three samples of three different length concrete beams; 500mmx100mmx100mm,
400mmx100mmx100mm and 300mmx100mmx100mm will be tested. This range of lengths has been
selected due to the 500mm max testing limitation of the three point load testing machine
(Zwick/Roell Z250). Hence in order to get the best range possible for the concrete beams the sample
lengths mentioned above where chosen.
3.3.1 Preparation.
The first consideration to take into account when creating these samples is the type of mixture. For
this project the most common mixture used on construction sites was selected to try and better link
the results to modern day construction.
University of Portsmouth 501302
16
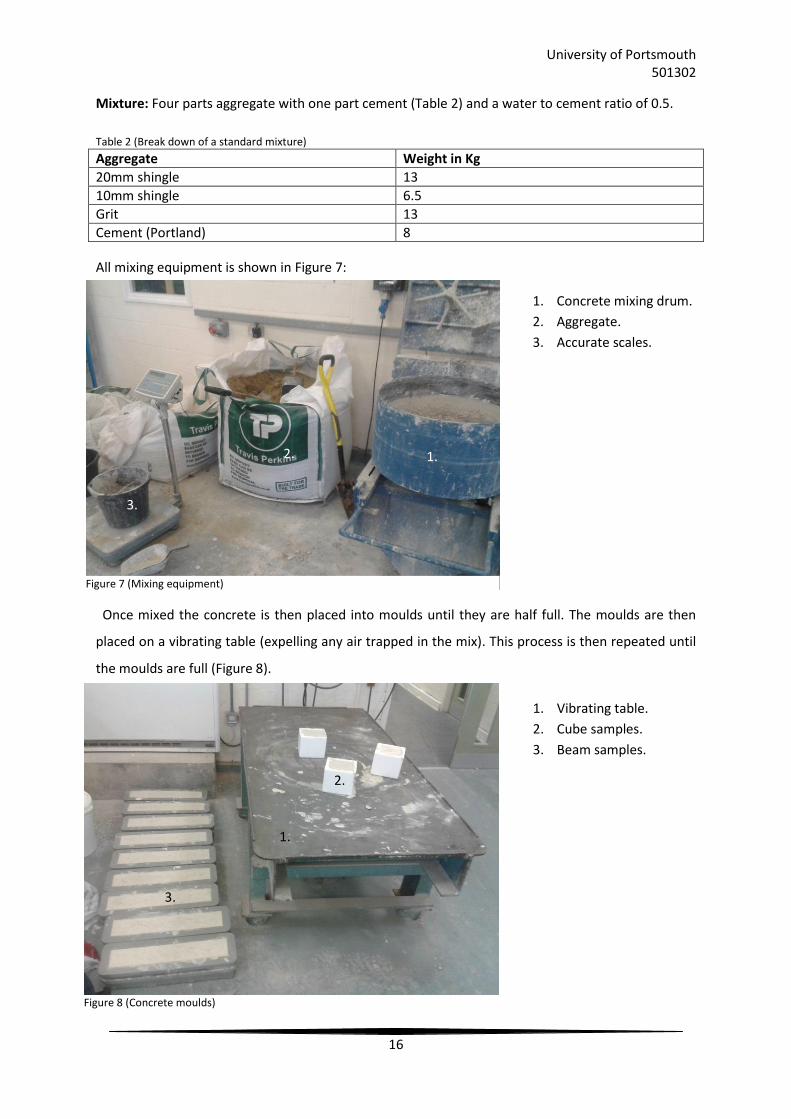
Mixture: Four parts aggregate with one part cement (Table 2) and a water to cement ratio of 0.5.
Table 2 (Break down of a standard mixture)
Aggregate Weight in Kg
20mm shingle 13
10mm shingle 6.5
Grit 13
Cement (Portland) 8
All mixing equipment is shown in Figure 7:
1. Concrete mixing drum.
2. Aggregate.
3. Accurate scales.
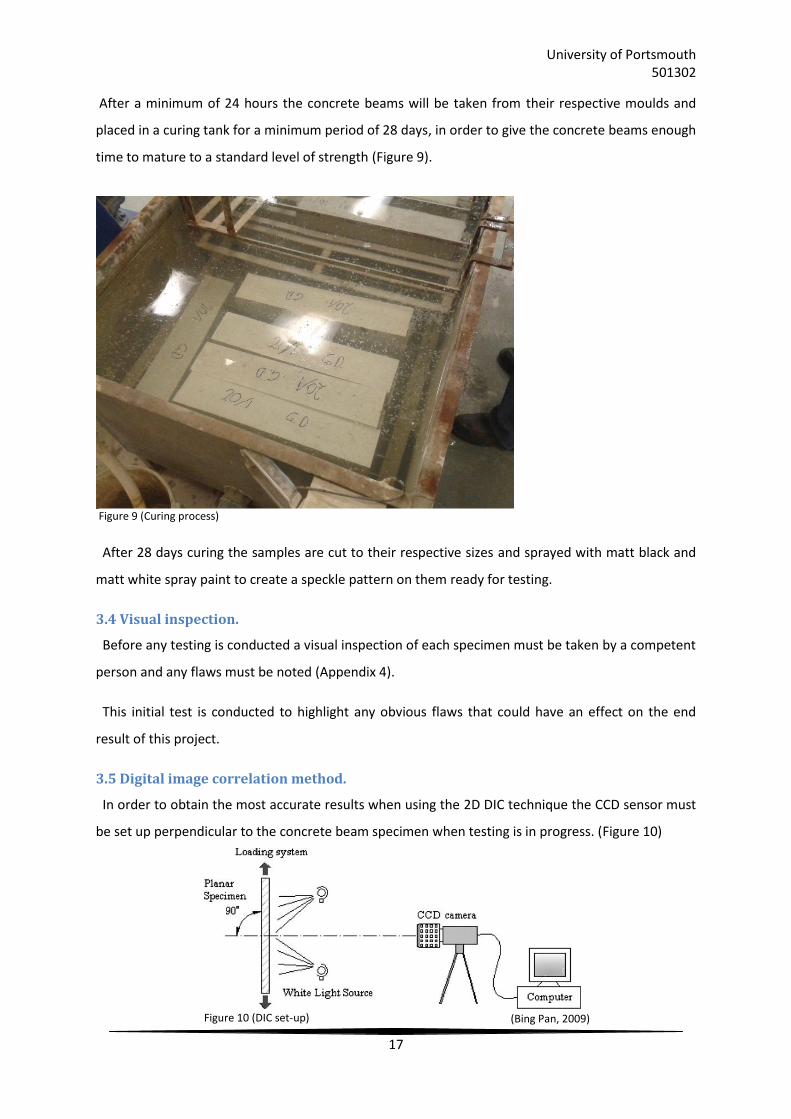
Once mixed the concrete is then placed into moulds until they are half full. The moulds are then
placed on a vibrating table (expelling any air trapped in the mix). This process is then repeated until
the moulds are full (Figure 8).
1. Vibrating table.
2. Cube samples.
3. Beam samples.
1.
3.
2.
3.
2.
1.
Figure 7 (Mixing equipment)
Figure 8 (Concrete moulds)
University of Portsmouth 501302
17
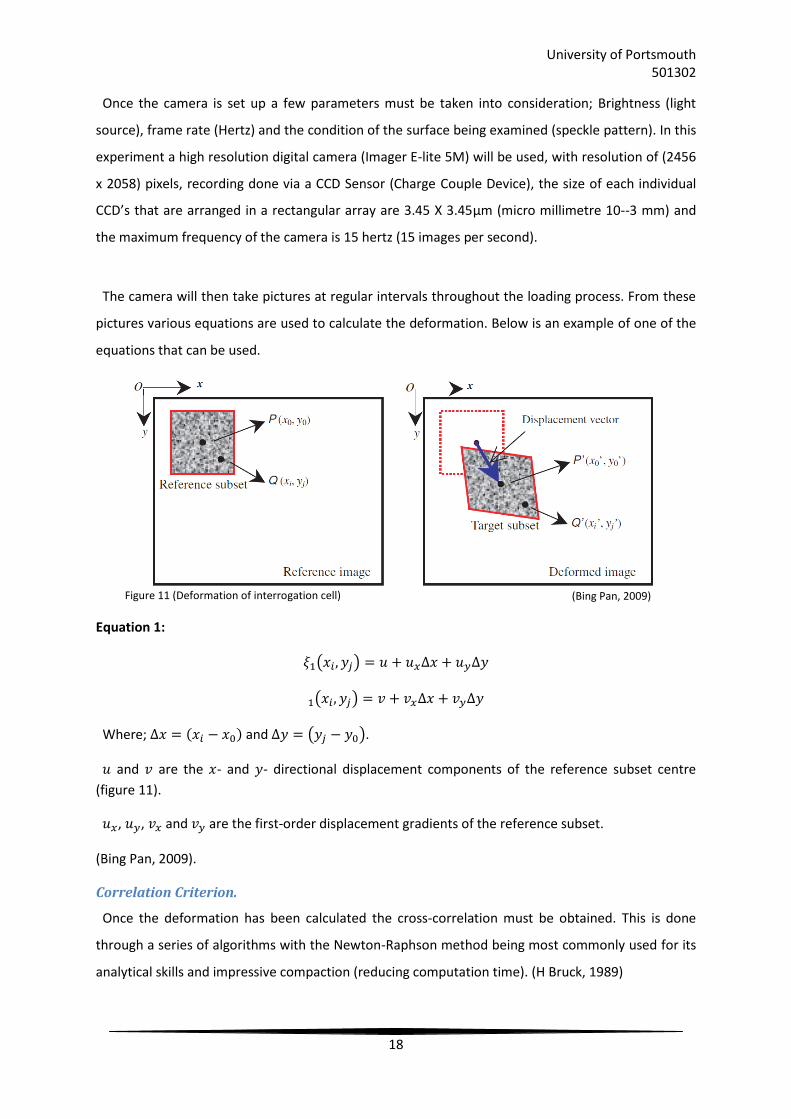
After a minimum of 24 hours the concrete beams will be taken from their respective moulds and
placed in a curing tank for a minimum period of 28 days, in order to give the concrete beams enough
time to mature to a standard level of strength (Figure 9).
After 28 days curing the samples are cut to their respective sizes and sprayed with matt black and
matt white spray paint to create a speckle pattern on them ready for testing.
3.4 Visual inspection.
Before any testing is conducted a visual inspection of each specimen must be taken by a competent
person and any flaws must be noted (Appendix 4).
This initial test is conducted to highlight any obvious flaws that could have an effect on the end
result of this project.
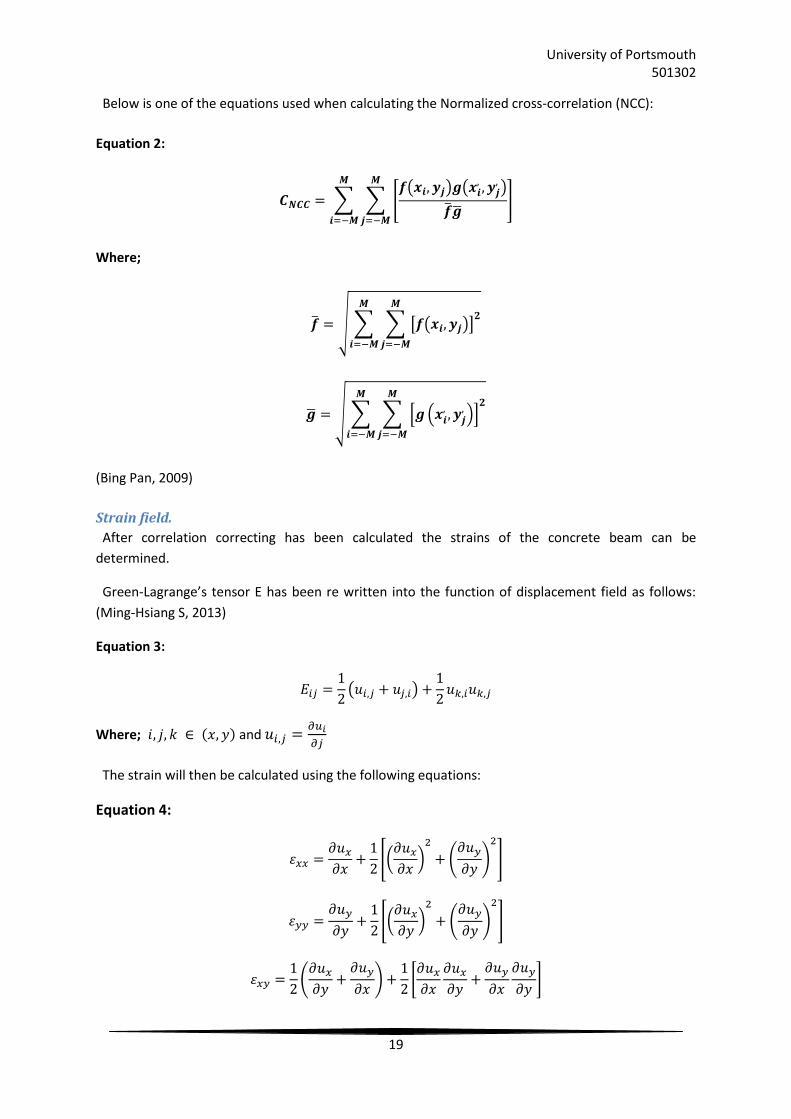
3.5 Digital image correlation method.
In order to obtain the most accurate results when using the 2D DIC technique the CCD sensor must
be set up perpendicular to the concrete beam specimen when testing is in progress. (Figure 10)
(Bing Pan, 2009)
Figure 9 (Curing process)
Figure 10 (DIC set-up)
University of Portsmouth 501302
18
Once the camera is set up a few parameters must be taken into consideration; Brightness (light
source), frame rate (Hertz) and the condition of the surface being examined (speckle pattern). In this
experiment a high resolution digital camera (Imager E-lite 5M) will be used, with resolution of (2456
x 2058) pixels, recording done via a CCD Sensor (Charge Couple Device), the size of each individual
CCD’s that are arranged in a rectangular array are 3.45 X 3.45µm (micro millimetre 10-3 mm) and
the maximum frequency of the camera is 15 hertz (15 images per second).
The camera will then take pictures at regular intervals throughout the loading process. From these
pictures various equations are used to calculate the deformation. Below is an example of one of the
equations that can be used.
Equation 1:
Where; and .
and are the - and - directional displacement components of the reference subset centre
(figure 11).
, , and are the first-order displacement gradients of the reference subset.
(Bing Pan, 2009).
Correlation Criterion.
Once the deformation has been calculated the cross-correlation must be obtained. This is done
through a series of algorithms with the Newton-Raphson method being most commonly used for its
analytical skills and impressive compaction (reducing computation time). (H Bruck, 1989)
(Bing Pan, 2009) Figure 11 (Deformation of interrogation cell)
University of Portsmouth 501302
19
Below is one of the equations used when calculating the Normalized cross-correlation (NCC):
Equation 2:
Where;
(Bing Pan, 2009)
Strain field.
After correlation correcting has been calculated the strains of the concrete beam can be
determined.
Green-Lagrange’s tensor E has been re written into the function of displacement field as follows:
(Ming-Hsiang S, 2013)
Equation 3:
Where; and
The strain will then be calculated using the following equations:
Equation 4:
University of Portsmouth 501302
20
Where;
is the von Mises strain.
and are the major and minor principle stresses respectively.
3.6 Experiment.
Deformation selection.
For this experiment a Zwick/Roall Z250 Strength testing device (section 2.3) will be used. This
device can create the ideal deformation in the beam samples through three point loading or four
point loading.
Whilst four point loading is the better method when picking up flaws throughout the structure of a
beam by spreading the stress through the sample, rather than focusing it on the midpoint like the
three point method. Three point loading has been selected due to the size of the beam samples. The
smallest beam is only 300mm long, which under three point loading will eventually fail due to
bending (the desired failure) and under four point testing will eventually fail due to shear force
(undesired failure).
Cube samples.
For this experiment three cube samples will be tested to destruction in order to figure out the max
load, stress and density of the concrete mixture. All preparation and testing will be done in
accordance with BS 1881-127:1990 (BSI, 1990).
Firstly each cube will be weighed in air and water and from this the density can be determined.
Equation 5:
Once the density of the sample has been determined it will then be placed into the ELE auto test
2000 and loaded at a pace rate of 3.00 KN/s until failure. From this failure the machine can work out
the stress (MPa) and the max load (KN).
University of Portsmouth 501302
21
Zwick/Roell Z250 Strength testing device, Testing.
During this experiment the Z250 strength testing device will be recording the estimated
displacement in mm against the amount of force acting on it in KN. For this experiment the force
acting on it must be converted into stress (MPa) in order to get comparable results. Equation 6 will
be used to convert the KN into MPa.
Equation 6:
Where;
= Stress
P = Load in N
L = Span in mm
b = width in mm
h = height in mm
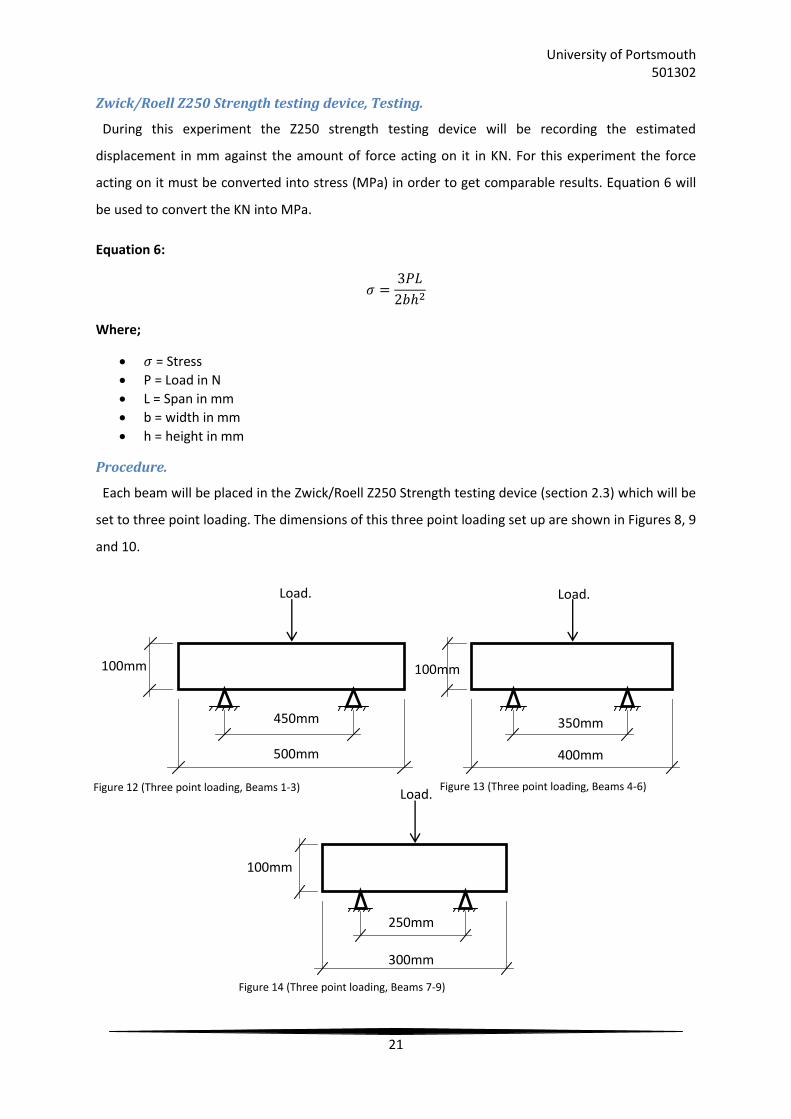
Procedure.
Each beam will be placed in the Zwick/Roell Z250 Strength testing device (section 2.3) which will be
set to three point loading. The dimensions of this three point loading set up are shown in Figures 8, 9
and 10.
500mm
450mm
Load.
100mm
400mm
350mm
Load.
100mm
300mm
250mm
Load.
100mm
Figure 9 (Three point loading, Beams 4-6) Figure 12 (Three point loading, Beams 1-3) Figure 13 (Three point loading, Beams 4-6)
Figure 14 (Three point loading, Beams 7-9)
University of Portsmouth 501302
22
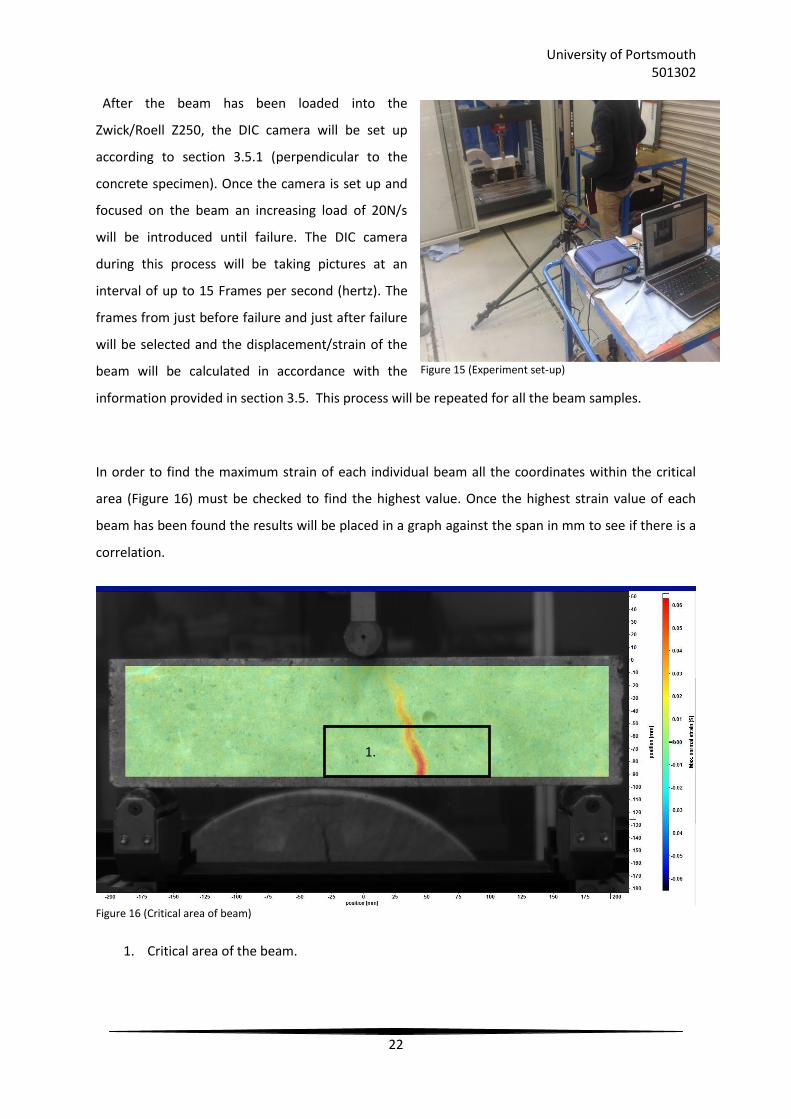
After the beam has been loaded into the
Zwick/Roell Z250, the DIC camera will be set up
according to section 3.5.1 (perpendicular to the
concrete specimen). Once the camera is set up and
focused on the beam an increasing load of 20N/s
will be introduced until failure. The DIC camera
during this process will be taking pictures at an
interval of up to 15 Frames per second (hertz). The
frames from just before failure and just after failure
will be selected and the displacement/strain of the
beam will be calculated in accordance with the
information provided in section 3.5. This process will be repeated for all the beam samples.
In order to find the maximum strain of each individual beam all the coordinates within the critical
area (Figure 16) must be checked to find the highest value. Once the highest strain value of each
beam has been found the results will be placed in a graph against the span in mm to see if there is a
correlation.
1. Critical area of the beam.
Figure 15 (Experiment set-up)
Figure 16 (Critical area of beam)
1.

University of Portsmouth 501302
23
4.0 Results.
4.1 Cube Samples.
Below are the results of each cubes sample. Stating their Max load (KN), stress (MPa) and density
(Kg/m3).
Cube 1:
Table 3 (Details, cube one)
Mass in air 2289 (g)
Mass in water 1300 (g)
Max load 582.8 (KN)
Stress 58.5 (MPa)
Cube 2:
Table 4 (Details, cube two)
Mass in air 2290 (g)
Mass in water 1300 (g)
Max load 587.2 (KN)
Stress 59 (MPa)
Cube 3:
Table 5 (Details, cube three)
Mass in air 2263 (g)
Mass in water 1280 (g)
Max load 584.8 (KN)
Stress 58.5 (MPa)
All stresses and densities are consistent and are close to the expected values.
University of Portsmouth 501302
24
4.2 Digital Imaging Correlation.
4.2.1 Displacement.
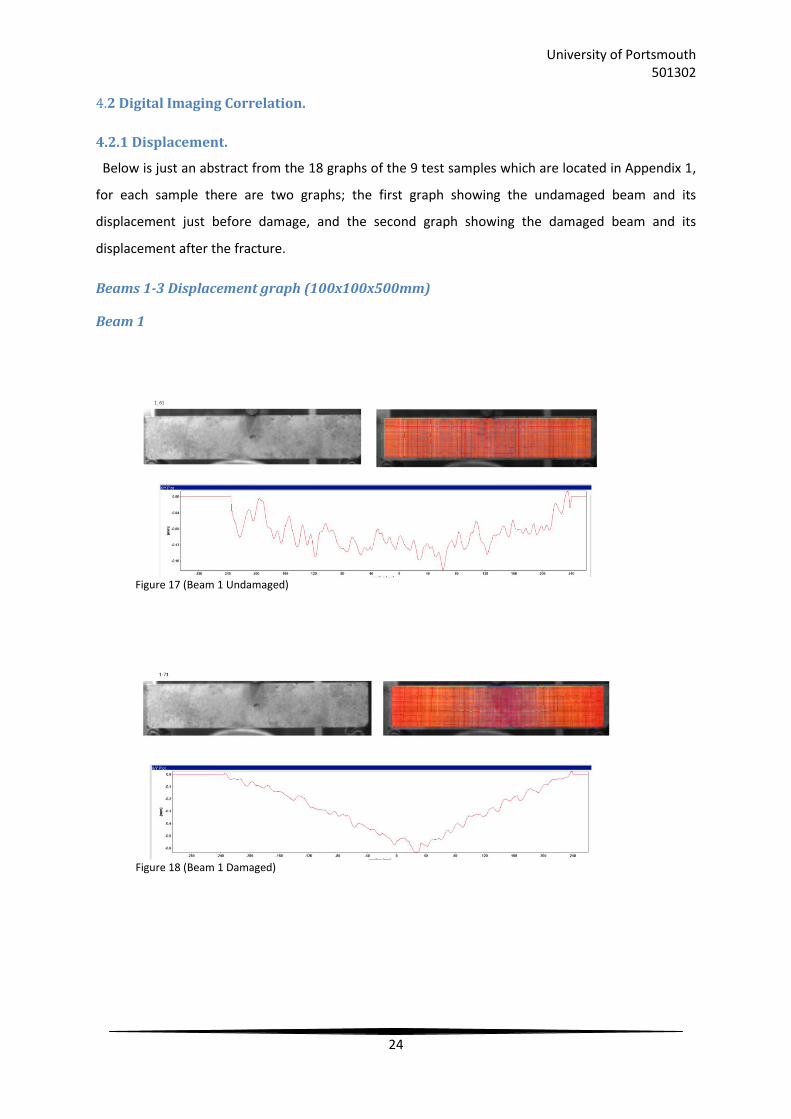
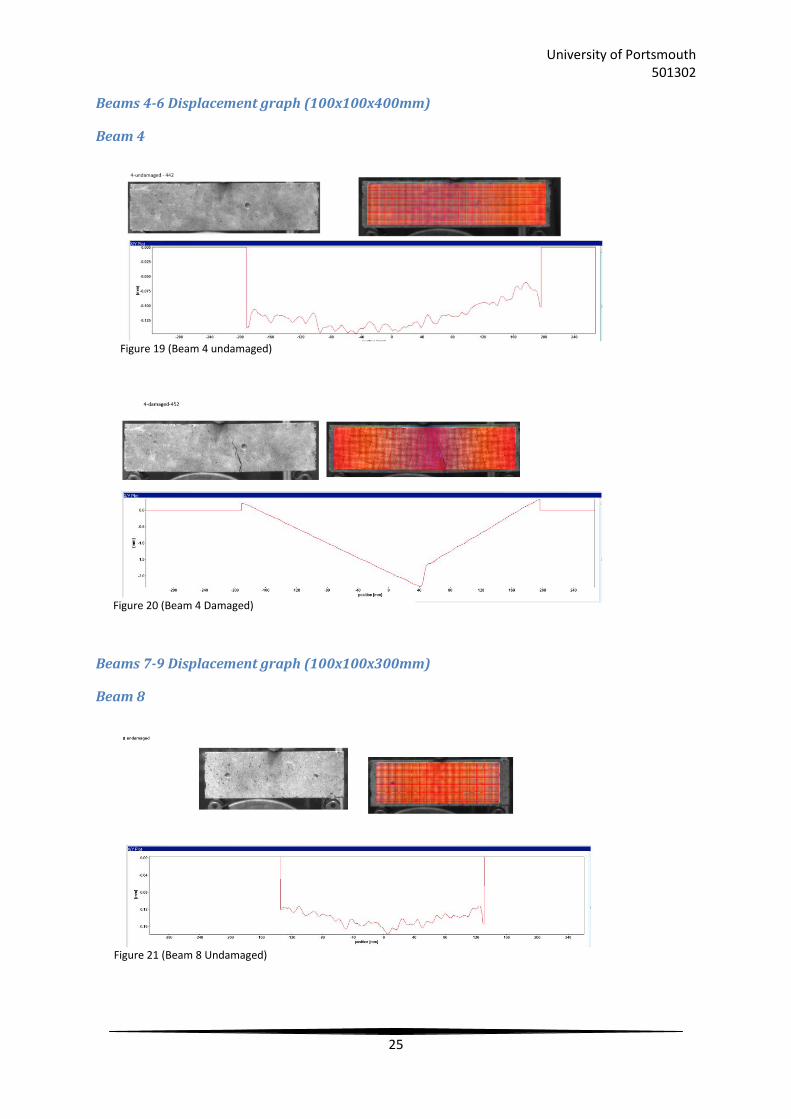
Below is just an abstract from the 18 graphs of the 9 test samples which are located in Appendix 1,
for each sample there are two graphs; the first graph showing the undamaged beam and its
displacement just before damage, and the second graph showing the damaged beam and its
displacement after the fracture.
Beams 1-3 Displacement graph (100x100x500mm)
Beam 1
Figure ? (Beam 1 Damaged)
Figure 17 (Beam 1 Undamaged)
Figure 18 (Beam 1 Damaged)
University of Portsmouth 501302
25
Beams 4-6 Displacement graph (100x100x400mm)
Beam 4
Beams 7-9 Displacement graph (100x100x300mm)
Beam 8
Figure 19 (Beam 4 undamaged)
Figure 20 (Beam 4 Damaged)
Figure 21 (Beam 8 Undamaged)
University of Portsmouth 501302
26
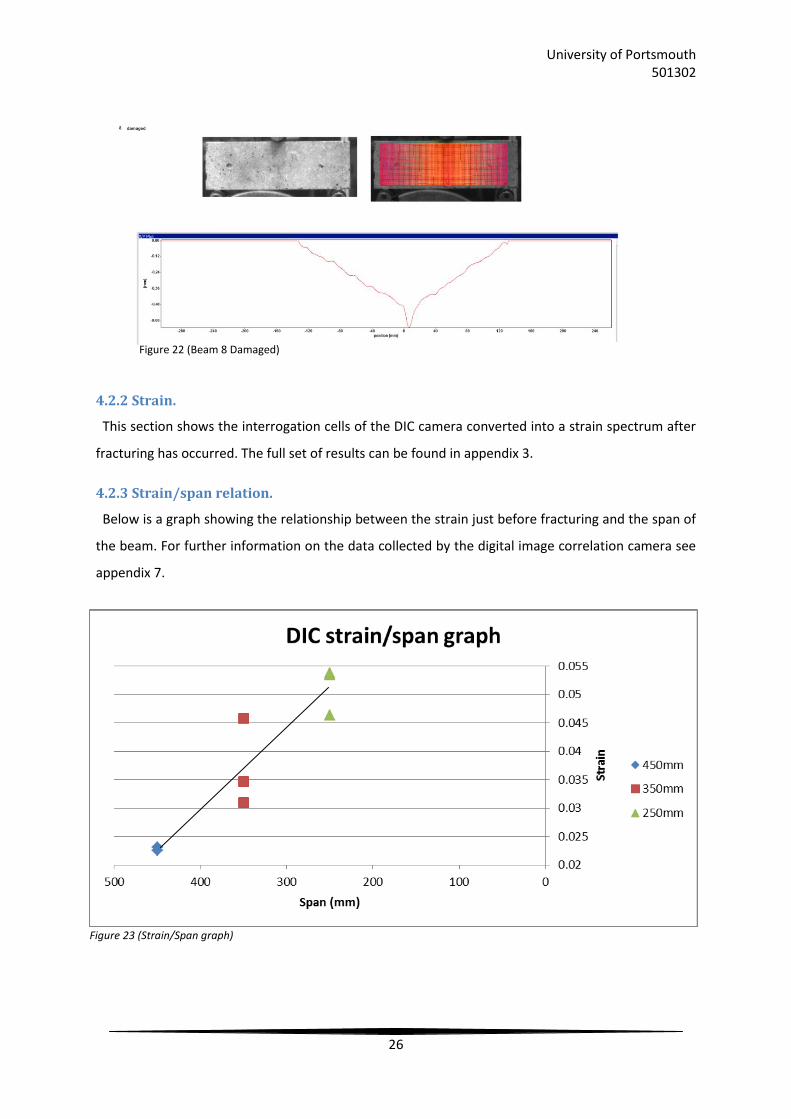
4.2.2 Strain.
This section shows the interrogation cells of the DIC camera converted into a strain spectrum after
fracturing has occurred. The full set of results can be found in appendix 3.
4.2.3 Strain/span relation.
Below is a graph showing the relationship between the strain just before fracturing and the span of
the beam. For further information on the data collected by the digital image correlation camera see
appendix 7.
Figure 22 (Beam 8 Damaged)
Figure 23 (Strain/Span graph)
University of Portsmouth 501302
27
0
1
2
3
4
5
6
0 0.05 0.1 0.15 0.2 0.25 0.3 0.35 0.4
Stre
ss (
MP
a)
Displacement (mm)
Beam 1
0
1
2
3
4
5
6
0 0.05 0.1 0.15 0.2 0.25 0.3 0.35 0.4
Stre
ss (
MP
a)
Displacment (mm)
Beam 4
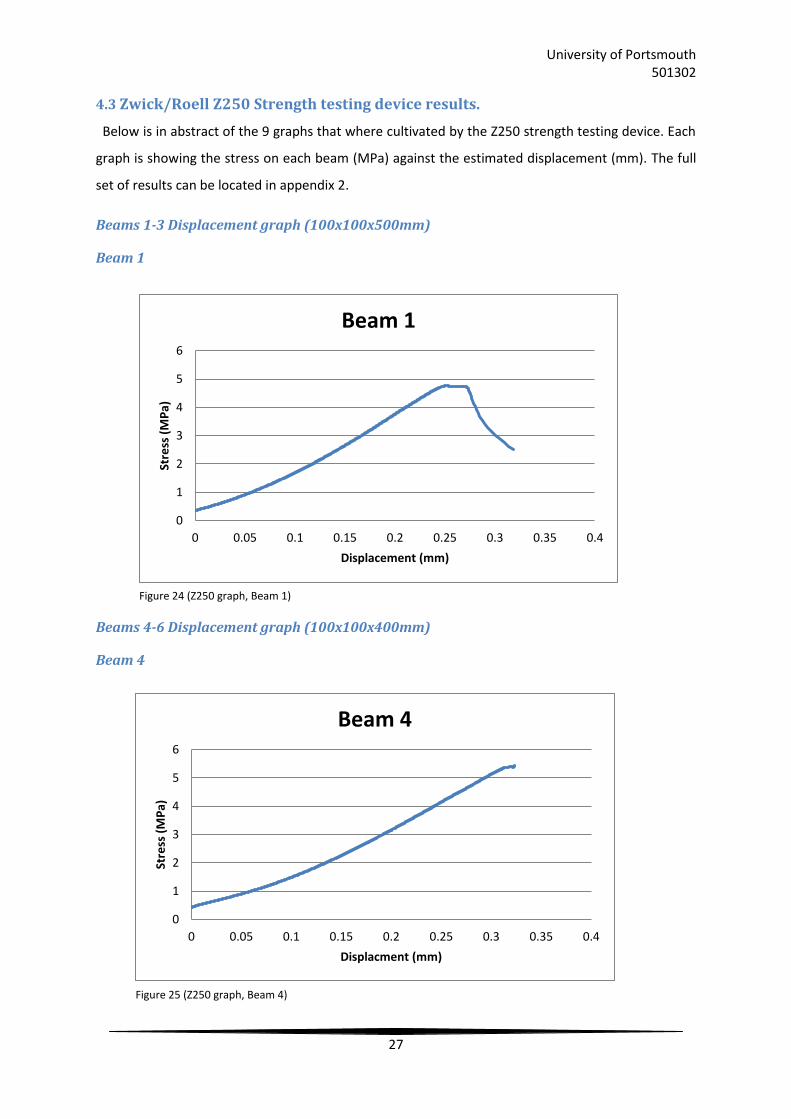
4.3 Zwick/Roell Z250 Strength testing device results.
Below is in abstract of the 9 graphs that where cultivated by the Z250 strength testing device. Each
graph is showing the stress on each beam (MPa) against the estimated displacement (mm). The full
set of results can be located in appendix 2.
Beams 1-3 Displacement graph (100x100x500mm)
Beam 1
Beams 4-6 Displacement graph (100x100x400mm)
Beam 4
Figure 24 (Z250 graph, Beam 1)
Figure 25 (Z250 graph, Beam 4)
University of Portsmouth 501302
28
0
1
2
3
4
5
6
0 0.05 0.1 0.15 0.2 0.25 0.3 0.35 0.4
Ste
ss (
MP
a)
Displacment (mm)
Beam 8
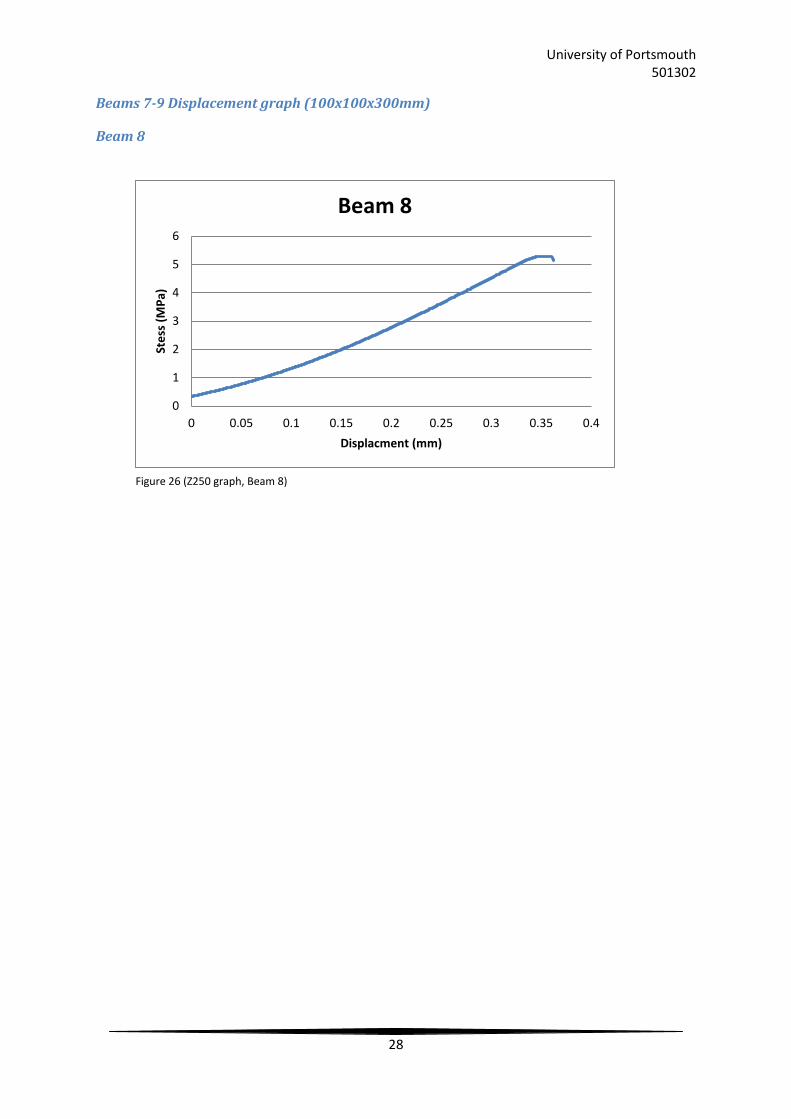
Beams 7-9 Displacement graph (100x100x300mm)
Beam 8
Figure 26 (Z250 graph, Beam 8)
University of Portsmouth 501302
29
5.0 Data analysis.
5.1 Introduction.
This section will analyse the data accumulated from the DIC camera and compare the different
results from each length of beam. These results will then be compared with the results from the
Zwick/Roell Z250 validating the accuracy of the DIC testing method. The information gained will be
linked and referred to the proposed objectives and data in the first two chapters of this project.
5.2 DIC camera.
5.2.1 Displacement.
One of the main factors that came to realisation through DIC testing is a correlation between where
the fracture occurred and the displacement of the undamaged beam. A good example of this is
“beam one” (figures 11 and 12). The graph in figure 11 is clearly showing that the majority of the
displacement is occurring towards the centre of the beam with the peak displacement
approximately 20mm from where the fracture eventually occurred (figure 12).
These patterns of displacement remain strong throughout the longer span of beams but starts to
weaken as the beams reduce in length, for example “beam 8” (figures 15 and 16). The displacement
graph in figure 15 has become a lot more liner in comparison with that of figure 11. Meaning a
reduced indication of where the fracture will occur. This is showing that this particular type of
testing becomes more effective as the beams length increases.
5.2.2 Relationship between the span and strain.
The DIC camera was used to discover the relationship of how the strain is affected as the beam
reduces in length; this data is shown in figure 22
Figure 22 is showing the highest point of strain recorded by the DIC camera (just before fracturing
occurred) against the span of the beam. This graph is showing a clear correlation between the
amount of strain required just before fracturing and the length of the beam; as the beam reduces in
length its maximum capacity for strain increases.
5.2.3 Analysis of interrogation cells.
The pictures of the interrogation cells for this project before fracturing have come out with a
mixture of results regardless to the length of the beam. For example beam 6 (figure 37) has some
discoloration towards the central area of the beam, giving an indication of where the fracture will
University of Portsmouth 501302
30
occur. Whereas beam 5 (figure 35) has very little to no discoloration across the beam giving little to
no indication of where the fracture will occur.
The image of the interrogation cells after fracturing (as shown in appendix 2) generated conclusive
results of where and to what extent the beam had fractured, excluding beam two which results are
an anomaly (discussed in section 5.2.4). Two good examples showing the range of precision when it
comes to this method are beam 3 (figure 32) and beam 4 (figure 34). Beam 3, which has a hairline
fracture shows discoloration around the fractured area but does not give a precise location. Beam 4
on the other end of the spectrum has a noticeable crack and the precise location of the affected
area, which is clearly highlighted within the image.
For more precise details of the fracture/cracks that occurred, the spectrum of the interrogation
cells can be altered; for example the cells could be altered from displacement (appendix 2) to strain
(appendix 3). As show within this appendix a much clearer image of the fracture/crack can be
obtained. However the image of the sample before fracturing occurred showed absolutely no useful
information or indication of where the fracture will occur.
5.2.4 Displacement/strain Error analysis.
When conducting experiments to do with non-destructive testing there will always be an element
of error, this section will help analyse the extent of which this projects capacity for error will affect
the outcome.
The 2D DIC testing method is simple in its set up and its method of practice, which reduces the
amount of variables in the experimental environment (reducing the amount of risk factors). Some of
the main factors that affect the quality of the results are; the quality of the loading system, the
perfection of the imaging system and the selection of a particular correlation algorithm (Section
3.5.1).
One of the factors that can affect the quality of the loading system is the setup of the camera
(perpendicular to the beam) as explained in section 3.5.1. When setting up there is no set way so
usually there is about a 5 degree error bracket. This error bracket has been concluded to produce a
displacement error of less than 0.1 pixels, giving a negligible factor for this projects result. (B Meng,
2006)
The speckle pattern has a large effect on the imaging system as explained in section 2.2.8. An
example of this method having a negative effect on the results would be in beam 2’s displacement
graphs (figure 29 and figure 30). The results of this particular test came out irregular by not showing
University of Portsmouth 501302
31
a precise fracture point. One of the most likely causes for this anomaly is the quality of the speckle
pattern, applied to the beam. Meaning one of the following parameters where not met; standard
mean speckle size, subset entropy or sum of square of subset intensity gradients (SSSIG). Meaning
the CCD camera could not correctly distinguish the difference in speckle pattern between the
uniformed and deformed images.
When selecting a correlation algorithm such details as correlation criterion, shape function, subset
size and sub-pixel interpolation scheme come into effect when calculating the final displacement
measurement. This will be used to correctly correlate the amount of influence each one of these
factors has towards the final results. Specific numerical tests must be conducted, but to put it in
simplistic terms the error of computed displacement associated with correlation algorithms can be
summarised into two components; mean bias error or systematic error (i.e. accuracy) and standard
deviation error or random error (i.e. precision) (Bing Pan, 2009). For this particular project the
algorithms have already been selected by the Davis 2D strain master computer system (section
2.2.7).
5.3 Zwick/Roell Z250 Strength testing device analysis.
The full set of results from the Z250 strength testing device are displayed in appendix 2. These
results have shown a relationship between the stress applied to the beams and the predicted
displacement.
The results of this testing method differ as the beams length changes; beams 1-3
(100x100x500mm) fracturing stress occurred at approximately 4.5 MPa with an approximate
displacement of 0.22 mm, beams 4-6 (100x100x400mm) fracturing strain occurred at approximately
5.3 MPa with an approximate displacement of 0.34 mm and finally beams 7-9 (100x100x300mm)
fracturing stress occurred at approximately 5.5 MPa with an approximate displacement of 0.38mm.
Showing that as the beams reduce in length the amount of strress required to fracture them
increases as well as the displacement of the beams just before fracturing.
5.4 Discussion.
As discussed in section 2.1.1 concrete has a very low elastic ability (Rahal, 2007). This lack of elastic
ability most commonly occurs within the construction industry in the form of beams under point
loading pressure (creating bending). This point loading will create cracking across the structure of
the beams and eventually fracturing.
The digital image correlation method can pick up these cracks and fracturing by comparing images
through the Davis 2D strain master computing software system (section 2.2.7). These images as
University of Portsmouth 501302
32
already discussed in this report can locate a hairline fracture and distinguish it from other cracks or
fractures. This system accomplishes this by converting the amount of movement throughout the
concrete beam into a grey scale. For example a hairline fracture will generate more movement
within a beams structure than the rest of the undamaged beam creating a change in “grey scale”,
hence creating a change in colour around the affected area highlighting its position on the sample.
Furthermore the more movement that is generated (larger fractures or cracks) the deeper the
colour goes on the grey scale, highlighting the affected area with greater detail.
Through the calculation of this grey scale, such graphs as the displacement graphs displayed in
section 4.2 can be obtained. These graphs as discussed in section 2.2.7 are calculated through
various algorithms. The result of these algorithms can help determine where the fracture will occur
before it happens. As discussed in section 5.2.1 the accuracy of these predictions reduces as the
beams length reduces. This has most likely occurred due to the reduction of bending force and the
increase in shear force. As the beam reduces in length the more prone it will become to shear failure
rather than bending failure. Hence the displacement within the sample will be spread out more
making it harder to predict the point of fracture.
The maximum capacity for strain a beam has increases as the beam reduces in length (section
5.2.2). This has been shown by the DIC camera and the Z250 strength testing device validating the
information gathered by the digital image correlation testing method. The change in strain level is
caused by the change in moment acting on the beam as shown in “Progress in Structures” (Xingang,
2012).
The displacement of the beam as the length of the beam changes has some mixed results. The DIC
methods results indicated that as the beam reduced in length the amount of displacement that
occurred before fracturing remained constant. However the Z250 strength testing device indicated
that the displacement of the beam increases as the beam reduces in length. It is known that the
displacement estimated by the Z250 testing device is a rough estimate whereas the displacement
calculated by the DIC method has been proven in previous testing to be accurate (Section 2.2.7). So
for this experiment the results concluded by the DIC method will be taken into account over the
results taken by the Z250.
5.5 Project limitations.
One of the main limitations that occurred during the laboratory stage of this project was the
variation in the length of the beam. This limitation caused less of a spectrum in which to compare
the effectiveness of the digital image correlation camera when it comes to the length of the beams,
University of Portsmouth 501302
33
therefore generating less concise results. This limitation occurred due to the testing equipment
available. The Z250 three point load testing apparatus could only accommodate a beam up to the
length of 500mm.
Due to the limitations on the length of the beams (as shown above) only three point loading was
available for testing. Four point loading would have been better suited for this project. A more
distributed load would have help highlight any flaws and given a better chance of cracking occurring
before fracturing, helping to highlighting the abilities of the DIC camera when locating cracks and
fractures.
Due to the amount of time and equipment available only one main method of non-destructive
testing was used (DIC). Were further methods of non-destructive testing to be used a wider array of
understanding and knowledge could have been displayed within this document. This knowledge
would have helped validate the results already mentioned in this chapter as well as showing the
range of possibilities non-destructive testing have.
University of Portsmouth 501302
34
6.0 Conclusion.
This project started by outlining the potential methods of non-destructive testing that could be
used within modern day industry and how the use of these methods could be utilised to better
understand the characteristics of different length concrete beams. After this research was
conducted a singular method was selected (Digital Image Correlation method). Through detailed
research and laboratory testing a better understanding of both the selected method and material
has been gained. The analysis has shown that as the beam decreases in length the amount of strain
needed to fracture it increases but the displacement remains constant.
The main conclusions taken from the research and testing of this project;
i. The displacement of a beam when approaching fracturing point remains constant regardless
of the beams length.
ii. Digital image correlation (DIC) testing can help predict where a crack or fracture will appear
on longer spans of beams but becomes less effective as the beams reduce in length.
iii. The location and type of existing fractures and cracks can be found using DIC imagery.
iv. Different methods of non-destructive testing can be used to determine the characteristics of
how length effects beams (Chapter two section 2.2).
This project has clearly shown the advantages of non-destructive testing (NDT) within the
construction industry and the accuracy that can be achieved through these methods.
6.1 Recommended Further Research.
Further research into the practicality of non-destructive testing within the construction industry
could be used to back up this report. This report has already mentioned some of the advantages of
non-destructive testing within the construction industry but further information will provide a better
justification for this project.
In order to extend on the research already conducted within this project, longer length beams
could be used. With longer lengths of beams further investigation could be conducted into the
effectiveness of digital image correlation in predicting the cracking and fracturing points on beams.
Another route of investigation could be to use a different method of non-destructive testing in
order to achieve the same results and compare the outcomes. A good alternative method would be
coda wave interferometry (CWI), a type of ultrasonic testing which can determine the internal
stresses of a beam.

University of Portsmouth 501302
35
During this project it became apparent that DIC testing has good analytical prowess when it comes
to determining fractures. This technique could be further explored by using four point loading
instead of three point loading to try and create and analyse cracking before fracturing occurs.
University of Portsmouth 501302
36
References.
B Meng, C. J. (2006). Errors caused by misalignment of the optical camera axis and the object surface
in the DSCM. J. Tsinghua University (Science Technology), 46.
Baldev R, J. T. (1997). Practical Non-Destructive Testing. New Delhi: Narosa Publishing House.
Bin Ibrahim, A. (2002). Guidebook on non-destructive testing of concrete structures. Vienna: IAEA.
Bing Pan, K. Q. (2009). Two-dimensional digital image correlation for in-plane displacement and
strain. Measurement Science and Technology, 17pp.
BSI. (1990, May 31). British standards online BSOL. Retrieved from BSOL:
https://bsol.bsigroup.com/Bibliographic/BibliographicInfoData/000000000000213026
David Corr, M. A. (2007). Digital image correlation analysis of interfacial debonding properties and
fracture behavior in concrete. Engineering Fracture Mechanics, 74(1-2), 109-121.
G. Vendroux, W. K. (n.d.). Submicron Deformation Field Measurements II: Improved digital image
correlation. California: California Institute of Technology.
Gungor, S. (2013). Material engineering. Retrieved from Digital Image Correlation:
http://materials.open.ac.uk/staff/staff_sg01.htm
H Bruck, S. M. (1989). Digital image correlation using Newton-Raphson method of partial differential
correction. Experimental Mechanics, 261-267.
Ha-Won Song, V. S. (2007). Corrosion Monitoring of Reinforced Concrete Structures - A Review.
International Journal of Electrochemical science, 1-28.
Hoffmeyer, P. (1978). The Pilodyn instrument as a non-destructive tester of the shock resistance of
wood. Vancouver: Non-destructive Testing of Wood Symposium.
Imlusa. (2003, December). NDT of timber components. Retrieved from
http://www.imlusa.com/NDT_of_Timber_Components.pdf
Informacyjne, S. (2014, April 3). ZWICK/ROELL Z250 STRENGTH TESTING DEVICE; STRENGTH RANGE
UP TO 250KN. Retrieved from Instytut Metalurgii Zelaza:
http://www.imz.gliwice.pl/en/news/BL___Department_of_Investigations_of_Properties/Zwi
ck_Roell_Z250_strength_testing_device__strength/[30,291,,,,]
Janesicik, J. R. (2001). Scientific charge-coupled devices. Washington: International ociety for Optical
Engineering.
Karl-Jorg L, R. M. (2012). Ultrasonic Nondestructive Testing of Materials. Boca Raton: Taylor &
Francis Group.
L Guochang, T. H. (2014). Mechanical Parameters determination of a polymeric membrane by digital
image correlation. Polymers & Polymer Composites, 157-161.
University of Portsmouth 501302
37
L Skarzynski, J. K. (2013). Aplication of DIC Technique to concrete - study on objectivity of Measured
Surface Displacements. Experimental Mechanics, 1545-1559.
LaVision. (2013). CCD and sCMOS Cameras. Retrieved from
http://www.lavision.de/en/products/cameras/ccd_and_scmos_cameras.php
LaVision. (2014). StrainMaster. Oxon: LaVisionUK LTD.
LaVison. (2014, March 20). CCD and sCMOS Cameras. Retrieved from Lavision:
http://www.lavision.de/en/products/cameras/ccd_and_scmos_cameras.php
Lencis Uldis, A. U. (2013). Moisture Effect on the Ultrasonic Pulse Velocity in Concrete Cured under
Normal Conditions and at Elevated Temperature. Construction Science, 71-78.
Madsen, B. (1989). Testing of wooden constructions in buildings. Washington: Seventh International
Nondestructive Testing of Wood Symposium.
Mcmaster, R. (1959). Nondestructive testing handbook. New York: The Ronald Press Company.
Ming-Hsiang S, W.-P. S. (2013, August). Application of digital image correlation method for analysing
crack variation of reinforced concrete beams. Indian Acsdemy of Science, pp. 723-741.
Neville, A. (1995). properties of concrete. Essex: Longman Group Limited.
Paul Klieger, J. F. (1994). Segnificance of tests and properties of concrete and concrete-making
materials. Fredericksburg: ASTM.
Prakash, R. (2012). Non-Destructive Testing Techniques. Tunbridge Wells: New Academic Science
Limited.
Rahal, K. (2007). Mechanical properties of concrete with recycled coarse aggregate. Building and
Environment, 407-415.
transportation, U. d. (2014). Integrity testing of other bridge substructure elements. Federal Lands
Highway Program.
Vikrant Tiwari, S. W. (n.d.). Application of Digital Image Correlation in Impact Testing. Carolina:
University of South Carolina.
Xiamen. (2014, March 18). Eddysun. Retrieved from Detection of aerospace composities:
http://www.eddysun.com/yylyDetail_en.aspx?id=183
Xingang, Z. (2012). Progress in Structures. Zurich: Trans Tech Publications.
Yasushi Hiraoka, J. S. (1987). The Use of a Charge-Coupled Device for Quantitative Optical
Microscopy of Biological Structures. Science, 36-41.
Zhang Y, A. O. (2013). Study of concrete's behavour under 4-point bending load using Coda wave
interferometry (CWI) analysis. AIP Conference proceedings, 398-404.

University of Portsmouth 501302
38
Zombori, B. (2001, march). Nondestructive Testing of Built in Wooden Members. Retrieved from
NDT: http://www.ndt.net/article/v06n03/skatter/skatter.htm
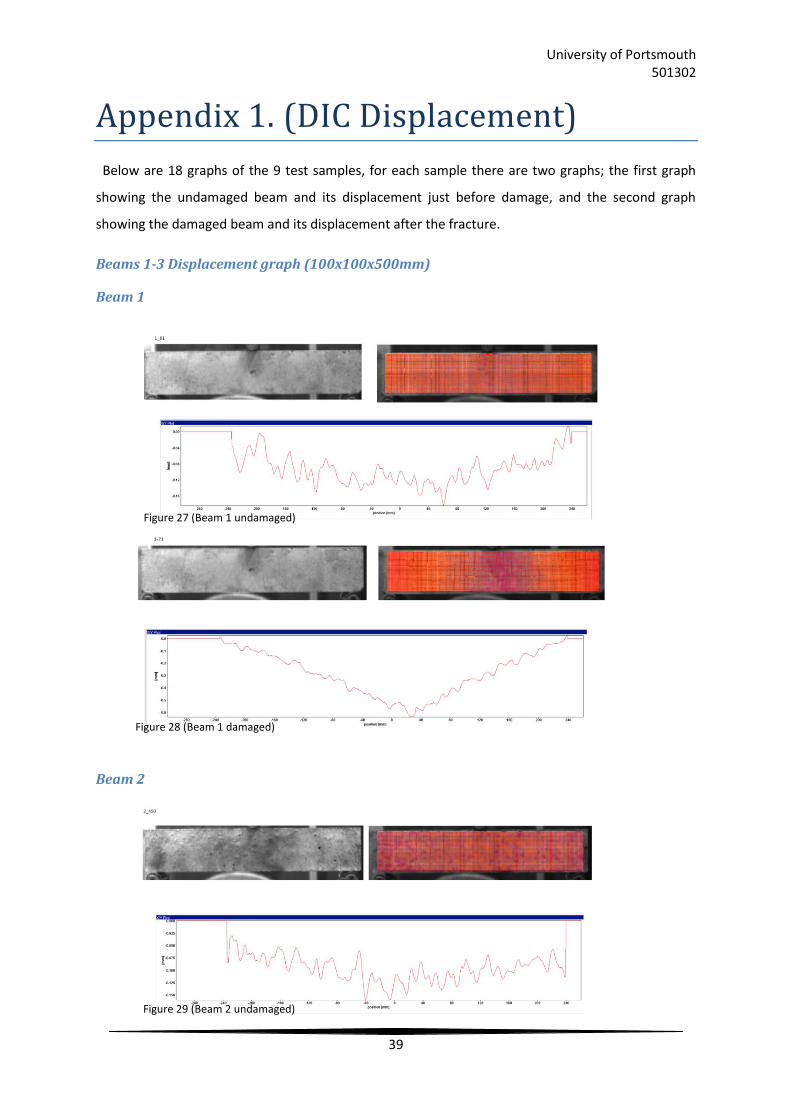
University of Portsmouth 501302
39
Appendix 1. (DIC Displacement)
Below are 18 graphs of the 9 test samples, for each sample there are two graphs; the first graph
showing the undamaged beam and its displacement just before damage, and the second graph
showing the damaged beam and its displacement after the fracture.
Beams 1-3 Displacement graph (100x100x500mm)
Beam 1
Beam 2
Figure 27 (Beam 1 undamaged)
Figure 28 (Beam 1 damaged)
Figure 29 (Beam 2 undamaged)
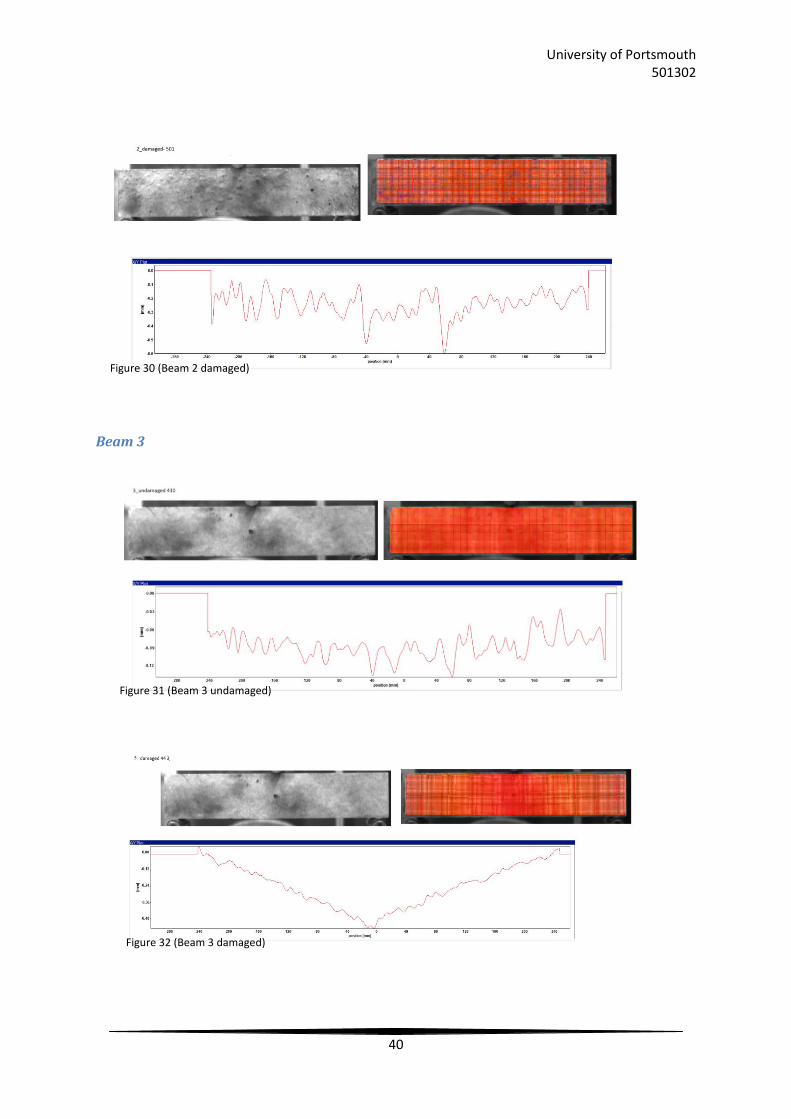
University of Portsmouth 501302
40
Beam 3
Figure 30 (Beam 2 damaged)
Figure 31 (Beam 3 undamaged)
Figure 32 (Beam 3 damaged)
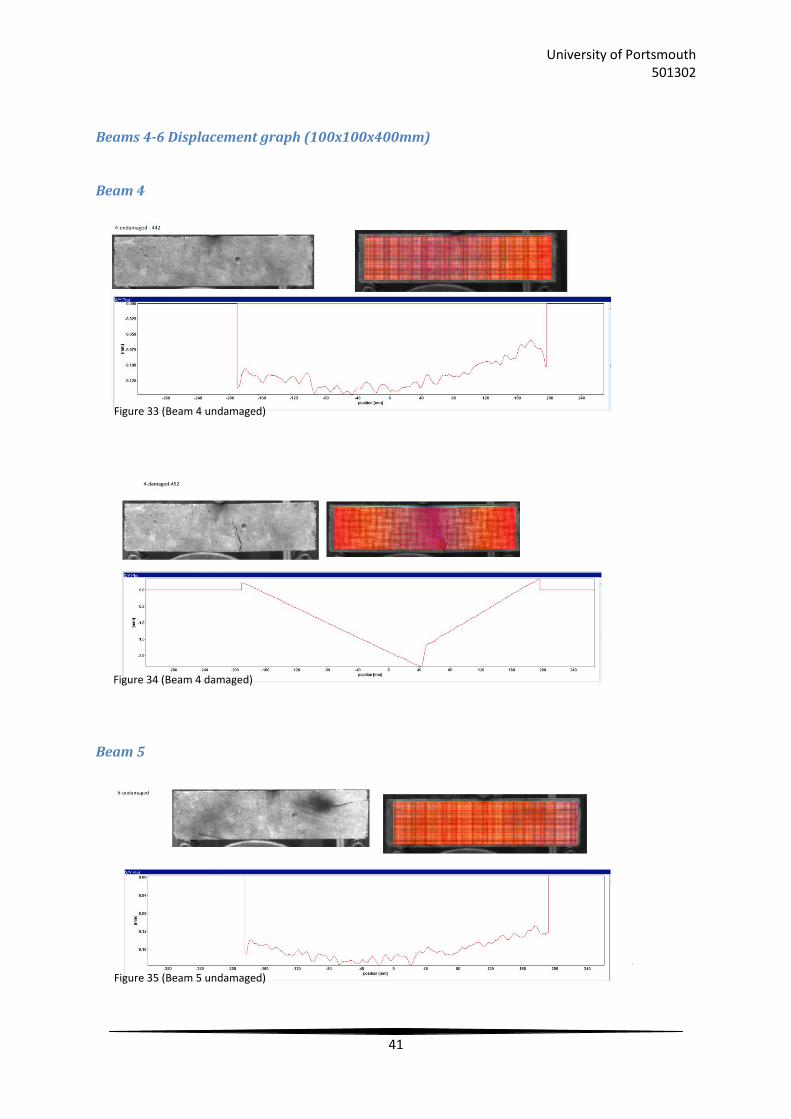
University of Portsmouth 501302
41
Beams 4-6 Displacement graph (100x100x400mm)
Beam 4
Beam 5
Figure 33 (Beam 4 undamaged)
Figure 34 (Beam 4 damaged)
Figure 35 (Beam 5 undamaged)

University of Portsmouth 501302
42
Beam 6
Figure 36 (Beam 5 damaged)
Figure 37 (Beam 6 undamaged)
Figure 38 (Beam 6 damaged)
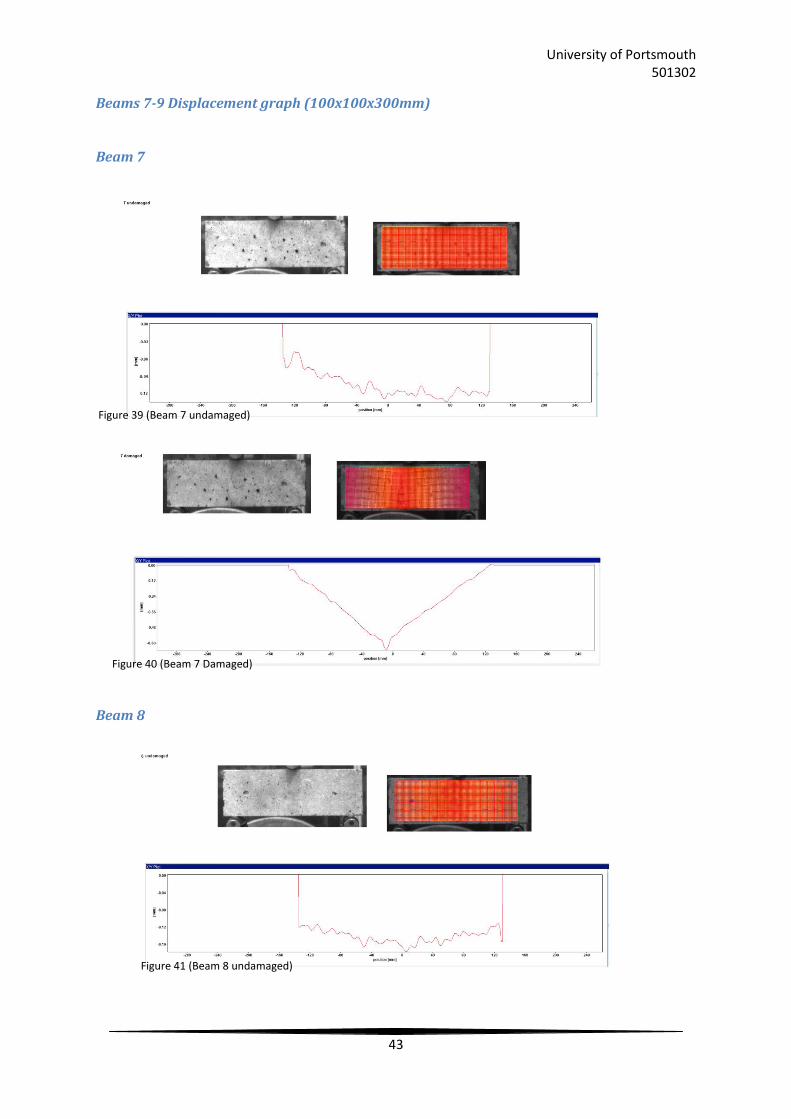
University of Portsmouth 501302
43
Beams 7-9 Displacement graph (100x100x300mm)
Beam 7
Beam 8
Figure 39 (Beam 7 undamaged)
Figure 40 (Beam 7 Damaged)
Figure 41 (Beam 8 undamaged)
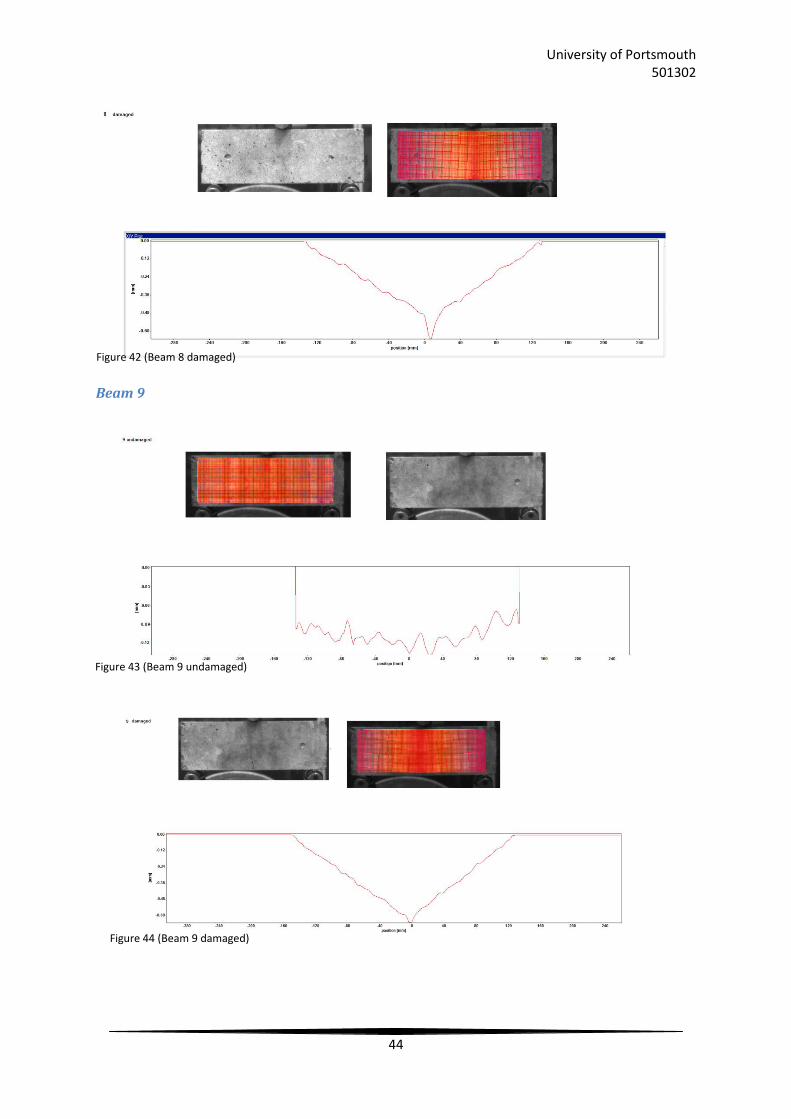
University of Portsmouth 501302
44
Beam 9
Figure 42 (Beam 8 damaged)
Figure 43 (Beam 9 undamaged)
Figure 44 (Beam 9 damaged)
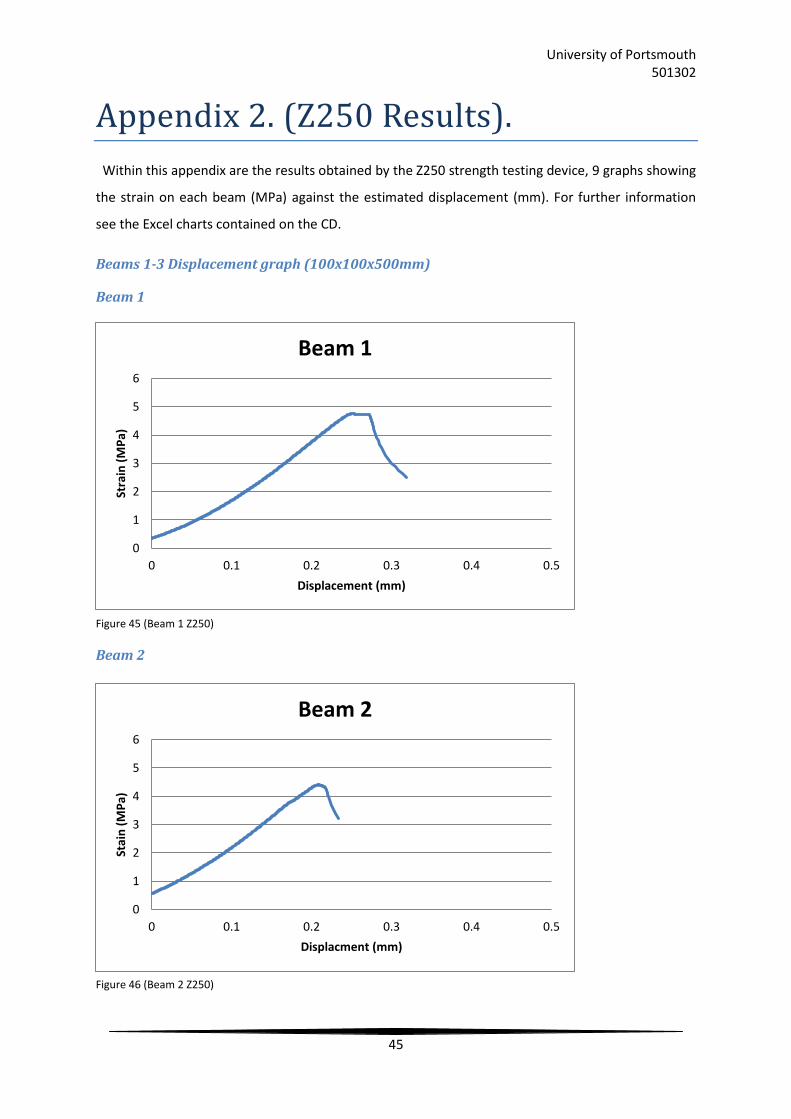
University of Portsmouth 501302
45
0
1
2
3
4
5
6
0 0.1 0.2 0.3 0.4 0.5
Stai
n (
MP
a)
Displacment (mm)
Beam 2
0
1
2
3
4
5
6
0 0.1 0.2 0.3 0.4 0.5
Stra
in (
MP
a)
Displacement (mm)
Beam 1
Appendix 2. (Z250 Results).
Within this appendix are the results obtained by the Z250 strength testing device, 9 graphs showing
the strain on each beam (MPa) against the estimated displacement (mm). For further information
see the Excel charts contained on the CD.
Beams 1-3 Displacement graph (100x100x500mm)
Beam 1
Beam 2
Figure 45 (Beam 1 Z250)
Figure 46 (Beam 2 Z250)
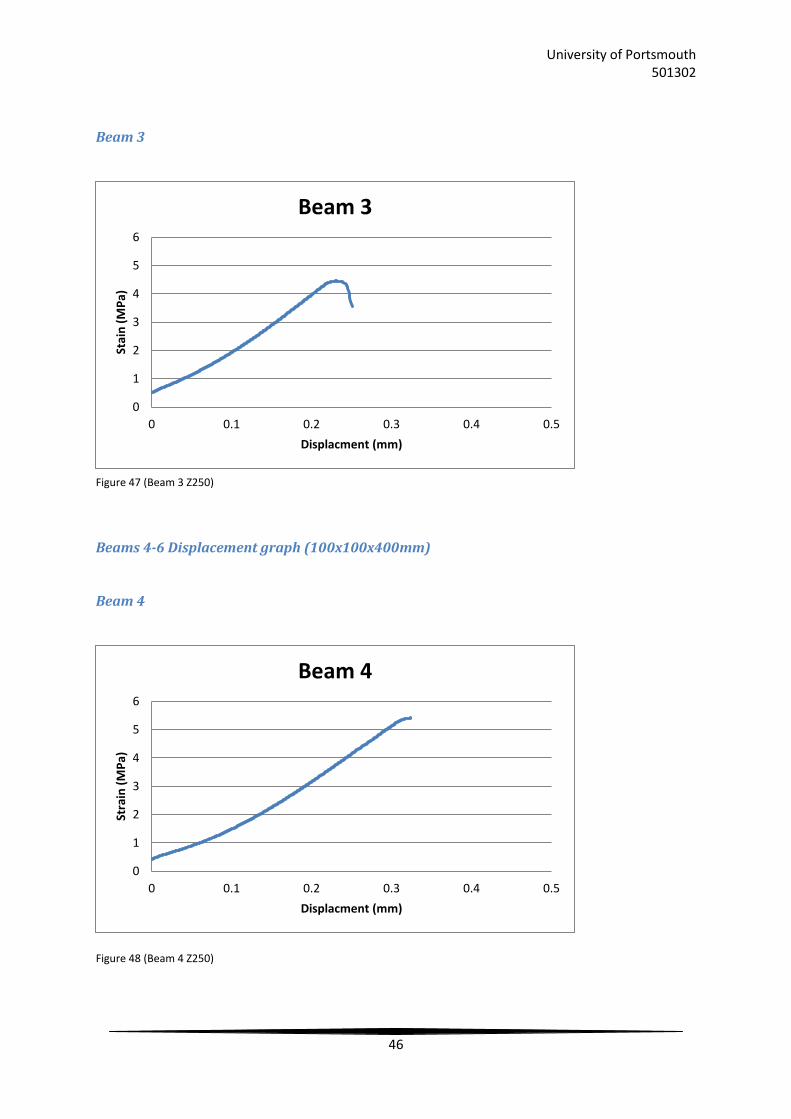
University of Portsmouth 501302
46
0
1
2
3
4
5
6
0 0.1 0.2 0.3 0.4 0.5
Stai
n (
MP
a)
Displacment (mm)
Beam 3
Beam 3
Beams 4-6 Displacement graph (100x100x400mm)
Beam 4
Figure 48 (Beam 4 Z250)
0
1
2
3
4
5
6
0 0.1 0.2 0.3 0.4 0.5
Stra
in (
MP
a)
Displacment (mm)
Beam 4
Figure 47 (Beam 3 Z250)
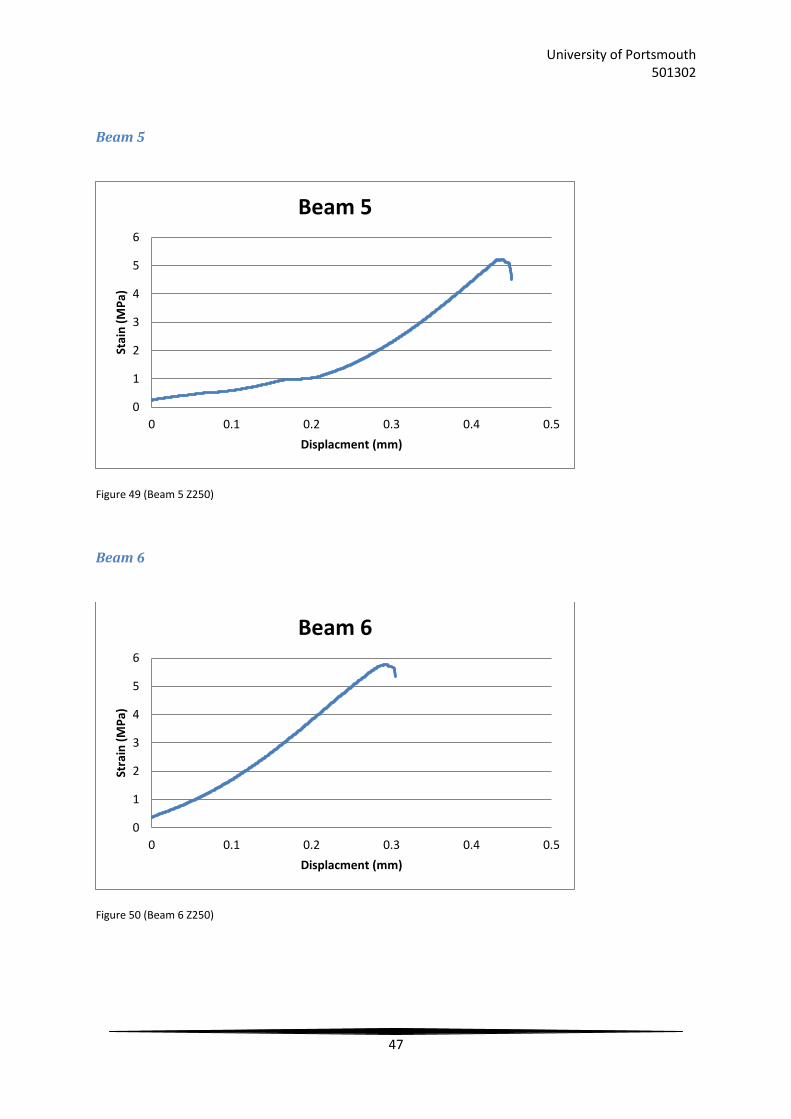
University of Portsmouth 501302
47
Beam 5
Figure 49 (Beam 5 Z250)
Beam 6
Figure 50 (Beam 6 Z250)
0
1
2
3
4
5
6
0 0.1 0.2 0.3 0.4 0.5
Stai
n (
MP
a)
Displacment (mm)
Beam 5
0
1
2
3
4
5
6
0 0.1 0.2 0.3 0.4 0.5
Stra
in (
MP
a)
Displacment (mm)
Beam 6
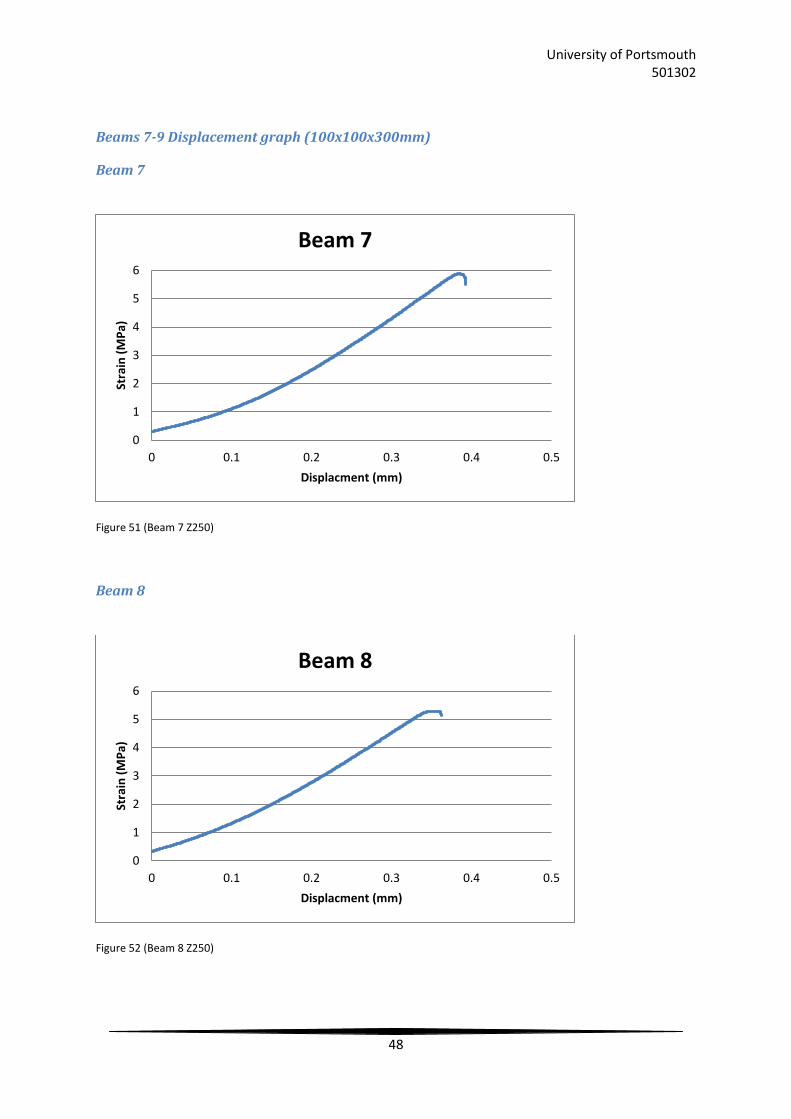
University of Portsmouth 501302
48
Beams 7-9 Displacement graph (100x100x300mm)
Beam 7
Figure 51 (Beam 7 Z250)
Beam 8
Figure 52 (Beam 8 Z250)
0
1
2
3
4
5
6
0 0.1 0.2 0.3 0.4 0.5
Stra
in (
MP
a)
Displacment (mm)
Beam 7
0
1
2
3
4
5
6
0 0.1 0.2 0.3 0.4 0.5
Stra
in (
MP
a)
Displacment (mm)
Beam 8
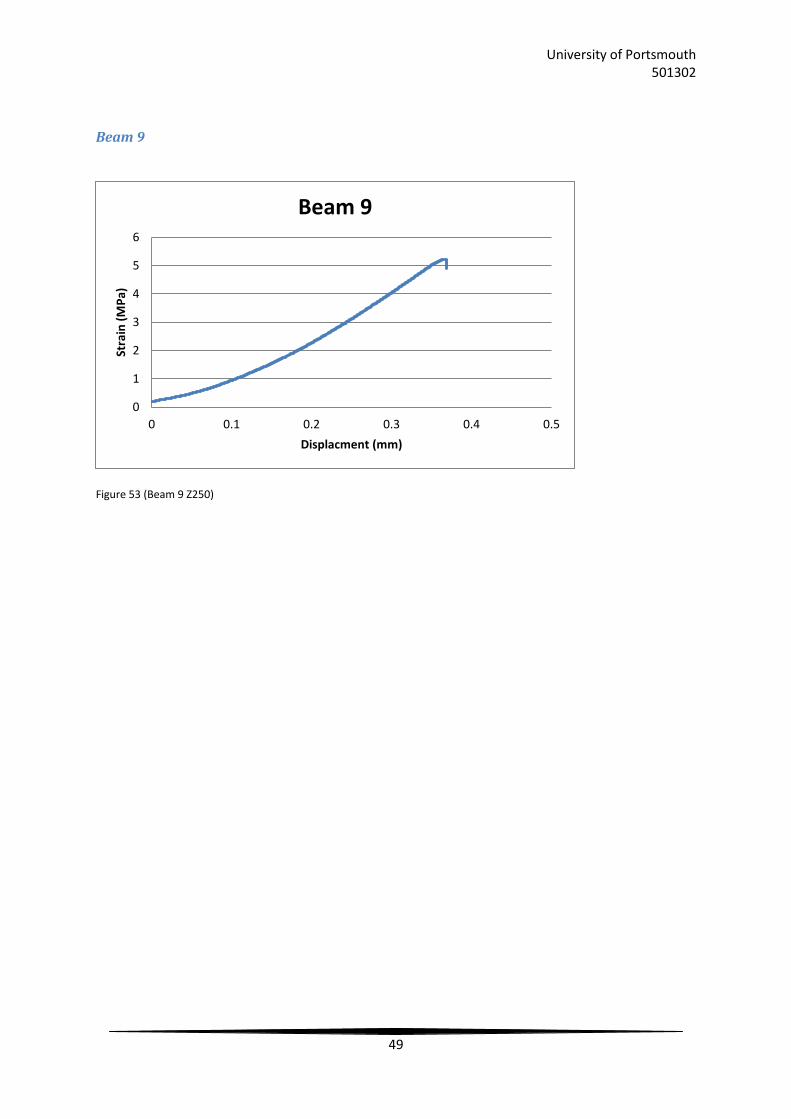
University of Portsmouth 501302
49
Beam 9
Figure 53 (Beam 9 Z250)
0
1
2
3
4
5
6
0 0.1 0.2 0.3 0.4 0.5
Stra
in (
MP
a)
Displacment (mm)
Beam 9

University of Portsmouth 501302
50
Appendix 3. (Strain Images)
Below are nine images showing the strain spectrum throughout each beam after
fracturing/cracking has occurred. Images of the strain before fracturing/cracking have not been
included in this project due to the strain being spread out randomly over the sample giving no useful
information.
Beams 1-3 Displacement graph (100x100x500mm)
Beam 1
Beam 2
Figure 54 (Beam 1 strain)
Figure 55 (Beam 2 strain)
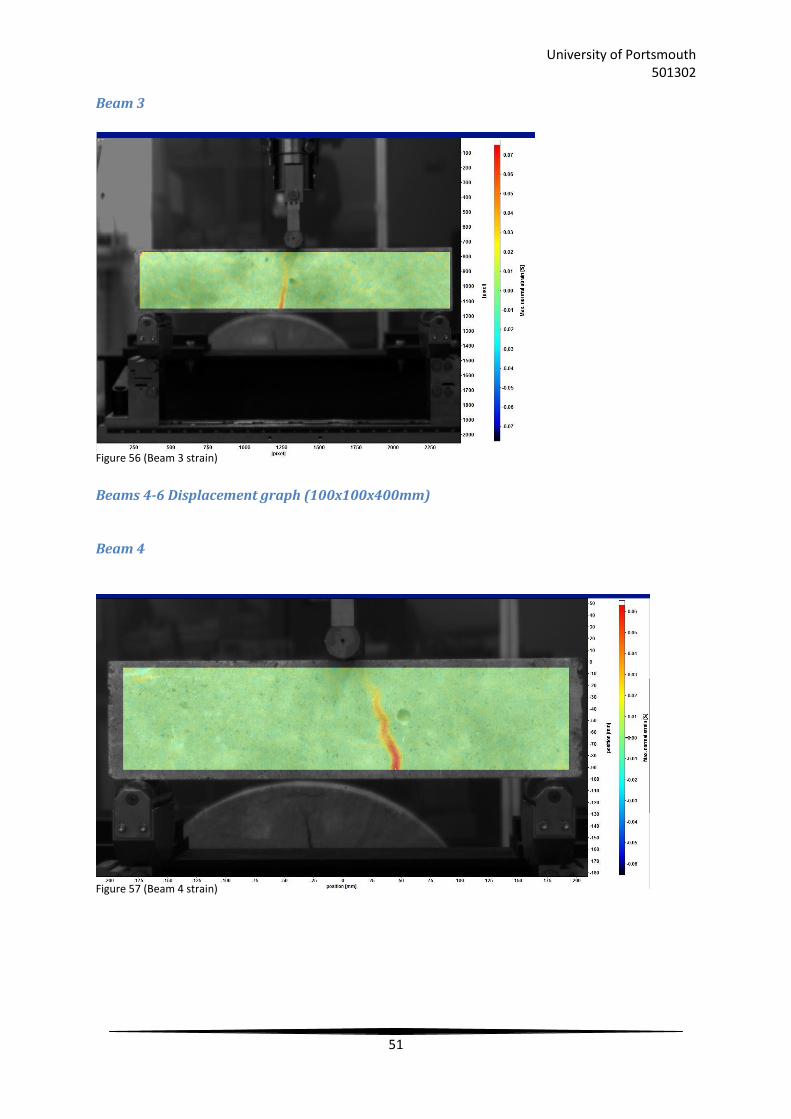
University of Portsmouth 501302
51
Beam 3
Beams 4-6 Displacement graph (100x100x400mm)
Beam 4
Figure 56 (Beam 3 strain)
Figure 57 (Beam 4 strain)
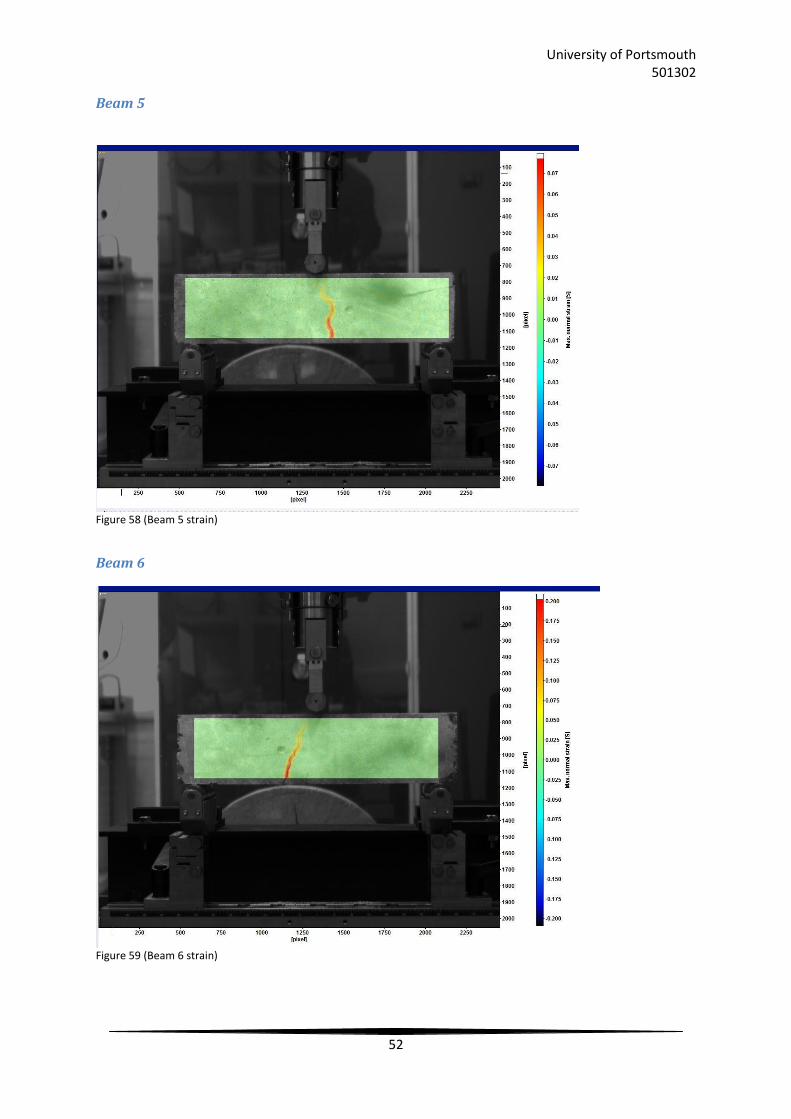
University of Portsmouth 501302
52
Beam 5
Beam 6
Figure 58 (Beam 5 strain)
Figure 59 (Beam 6 strain)
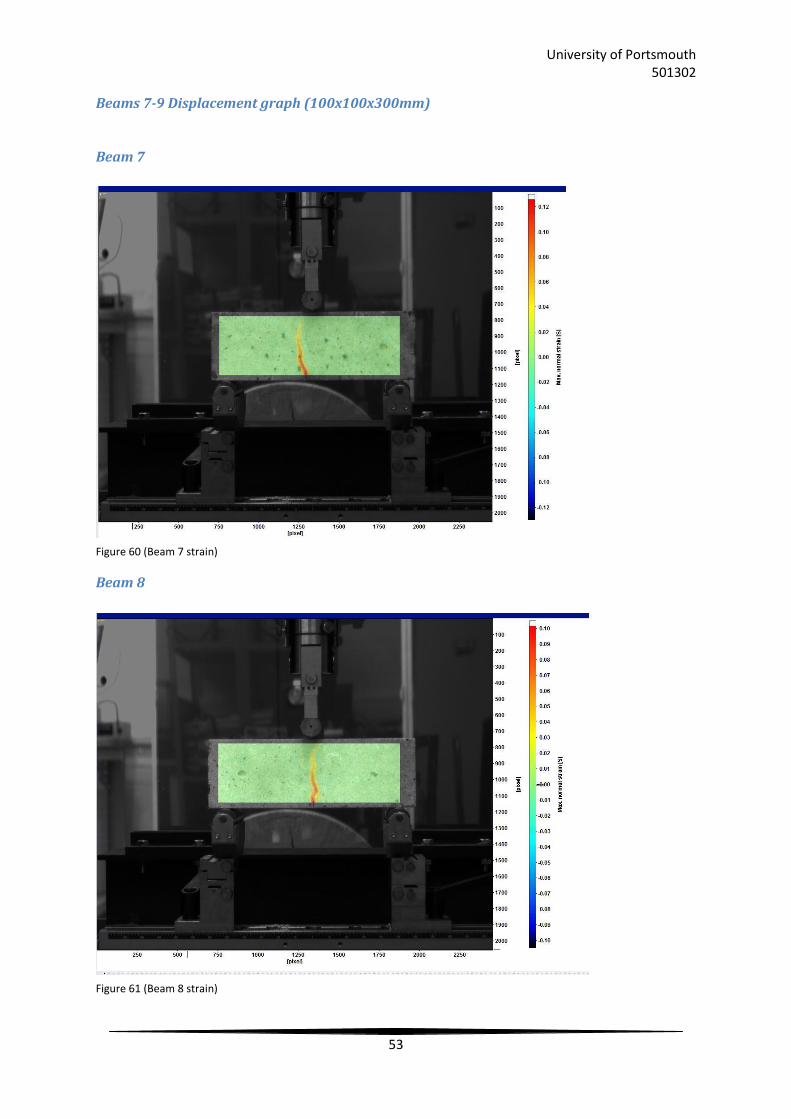
University of Portsmouth 501302
53
Beams 7-9 Displacement graph (100x100x300mm)
Beam 7
Beam 8
Figure 60 (Beam 7 strain)
Figure 61 (Beam 8 strain)
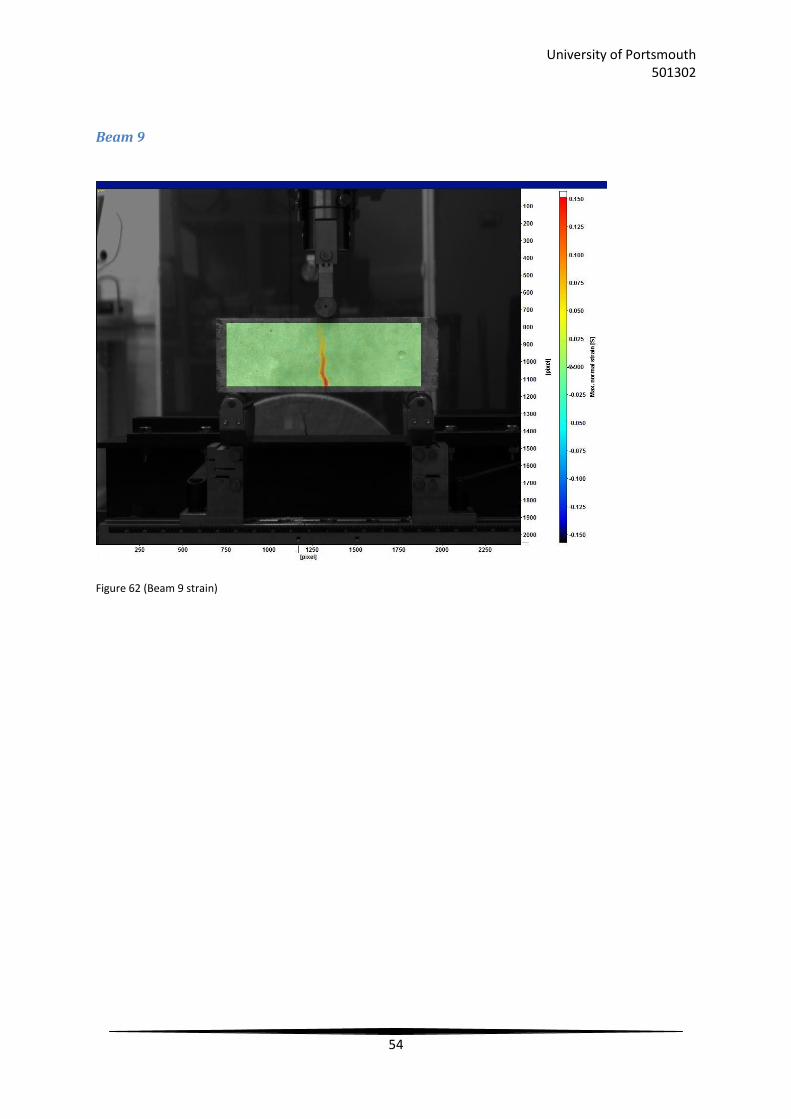
University of Portsmouth 501302
54
Beam 9
Figure 62 (Beam 9 strain)

University of Portsmouth 501302
55
Appendix 4. (Visual Inspection)
This appendix is showing the results of the visual inspection conducted on the beam samples
before the experiment began.
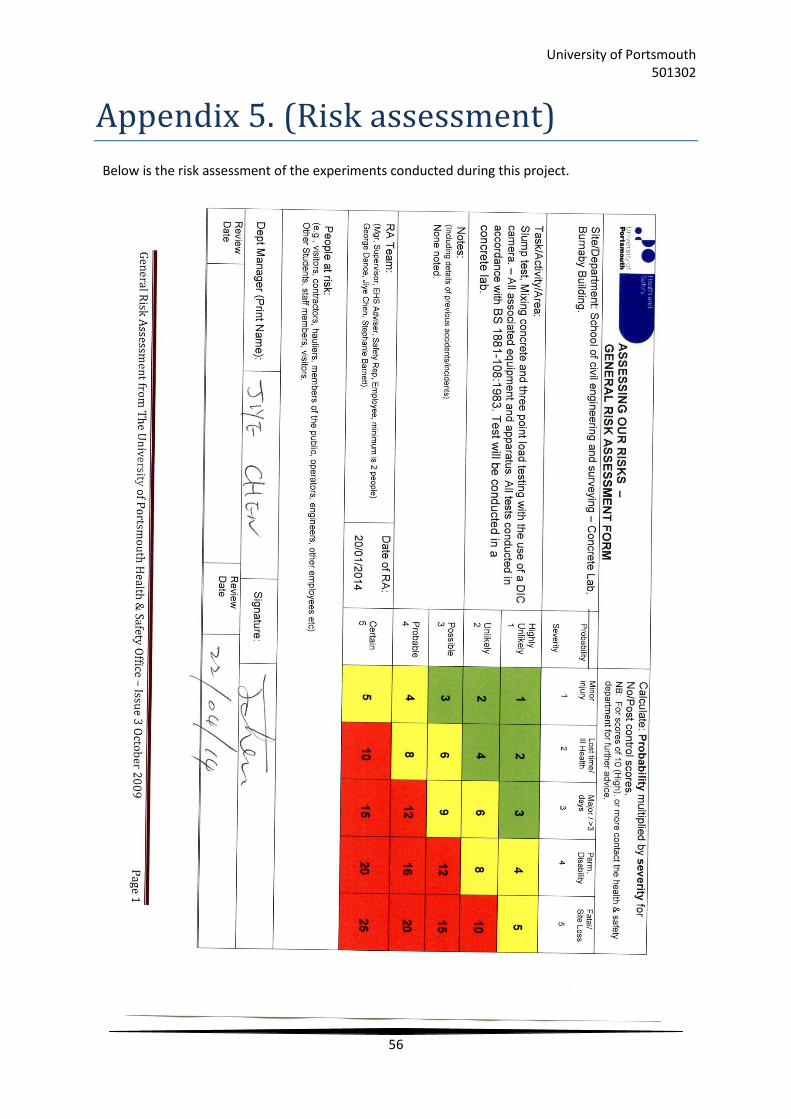
University of Portsmouth 501302
56
Appendix 5. (Risk assessment)
Below is the risk assessment of the experiments conducted during this project.

University of Portsmouth 501302
57
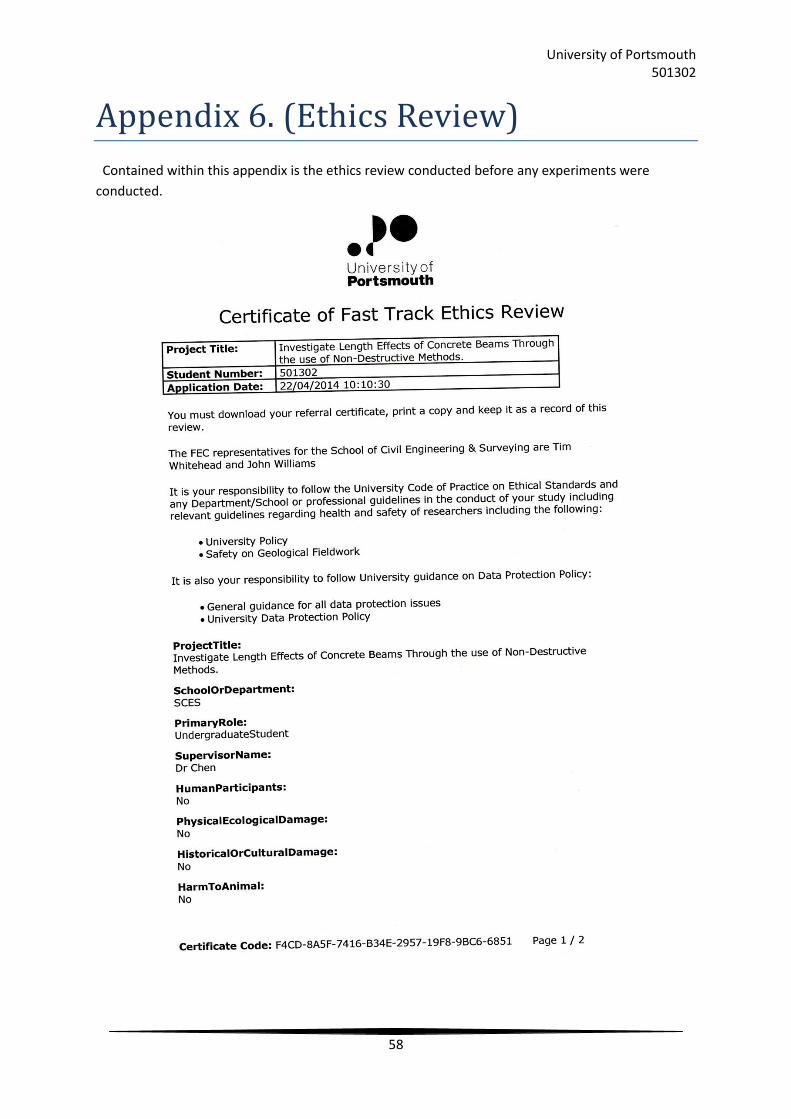
University of Portsmouth 501302
58
Appendix 6. (Ethics Review)
Contained within this appendix is the ethics review conducted before any experiments were
conducted.

University of Portsmouth 501302
59

University of Portsmouth 501302
60
Appendix 7 (Data from DIC strain testing)
The data in this section is the strain results from each beam from the DIC camera. (located on the
CD).