Embed Size (px)
Citation preview

Unit NE6: Volume and Surface Area TaskYear 10Measurement and GeometryBenjamin PottsNerang Cluster

ST PETER CLAVER COLLEGE
Mathematics 10 – 2012
Instrument A1.7 Measurement Volume and Surface Area(Extension and Accelerated Maths)
Name:
Year Strand Test Time
10 Maths Volume and surface area
Topics: Volume and Surface areaAssessment technique: Investigative task
Fluency & Understanding
Understanding and Problem Solving
Reasoning & Communication
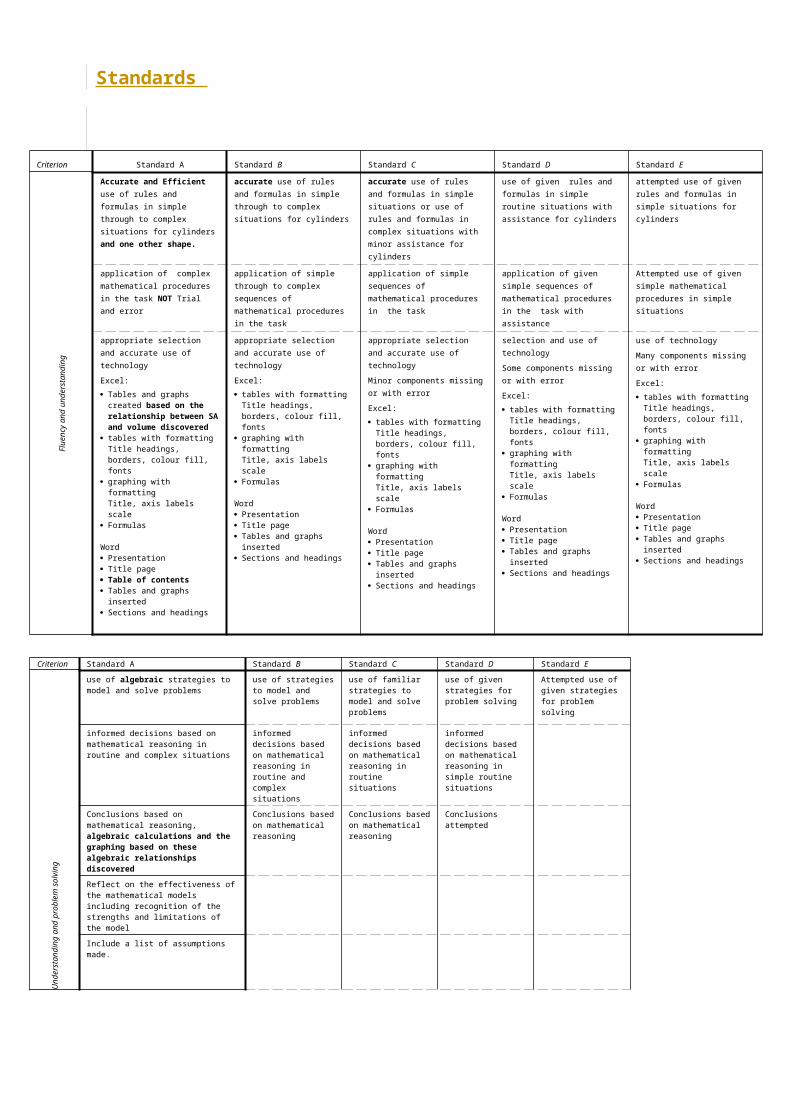
Standards
Criterion Standard A Standard B Standard C Standard D Standard E
Flue
ncy
and
unde
rsta
ndin
g
Accurate and Efficient use of rules and formulas in simple through to complex situations for cylinders and one other shape.
accurate use of rules and formulas in simple through to complex situations for cylinders
accurate use of rules and formulas in simple situations or use of rules and formulas in complex situations with minor assistance for cylinders
use of given rules and formulas in simple routine situations with assistance for cylinders
attempted use of given rules and formulas in simple situations for cylinders
application of complex mathematical procedures in the task NOT Trial and error
application of simple through to complex sequences of mathematical procedures in the task
application of simple sequences of mathematical procedures in the task
application of given simple sequences of mathematical procedures in the task with assistance
Attempted use of given simple mathematical procedures in simple situations
appropriate selection and accurate use of technology
Excel: Tables and graphs created
based on the relationship between SA and volume discovered
tables with formatting Title headings, borders, colour fill, fonts
graphing with formatting Title, axis labels scale
Formulas
Word Presentation Title page Table of contents Tables and graphs inserted Sections and headings
appropriate selection and accurate use of technology
Excel: tables with formatting
Title headings, borders, colour fill, fonts
graphing with formatting Title, axis labels scale
Formulas
Word Presentation Title page Tables and graphs inserted Sections and headings
appropriate selection and accurate use of technology
Minor components missing or with error
Excel: tables with formatting
Title headings, borders, colour fill, fonts
graphing with formatting Title, axis labels scale
Formulas
Word Presentation Title page Tables and graphs inserted Sections and headings
selection and use of technology
Some components missing or with error
Excel: tables with formatting
Title headings, borders, colour fill, fonts
graphing with formatting Title, axis labels scale
Formulas
Word Presentation Title page Tables and graphs inserted Sections and headings
use of technology
Many components missing or with error
Excel: tables with formatting
Title headings, borders, colour fill, fonts
graphing with formatting Title, axis labels scale
Formulas
Word Presentation Title page Tables and graphs inserted Sections and headings
Criterion Standard A Standard B Standard C Standard D Standard E
Und
erst
andi
ng a
nd p
robl
em s
olvi
ng
use of algebraic strategies to model and solve problems
use of strategies to model and solve problems
use of familiar strategies to model and solve problems
use of given strategies for problem solving
Attempted use of given strategies for problem solving
informed decisions based on mathematical reasoning in routine and complex situations
informed decisions based on mathematical reasoning in routine and complex situations
informed decisions based on mathematical reasoning in routine situations
informed decisions based on mathematical reasoning in simple routine situations
Conclusions based on mathematical reasoning, algebraic calculations and the graphing based on these algebraic relationships discovered
Conclusions based on mathematical reasoning
Conclusions based on mathematical reasoning
Conclusions attempted
Reflect on the effectiveness of the mathematical models including recognition of the strengths and limitations of the model
Include a list of assumptions made.

TASK
1. Select a Group to work with of 2 or 3 people.
2. You have been working in class to calculate the greatest volume possible from a box made from one sheet of A4 paper.
YOU HAVE LEARNT HOW TO:
Calculate surface area Calculate volume Use Excel – tables and graphs Analyse graphs Justify answers Write conclusions Solve to find the optimal answer
3. Use all your knowledge/skills to solve the following problem4. Be sure to keep a copy/photo/record of all of your attempts
Design Task
Coka Kola has decided to release a new size of soft drink can to meet the needs of younger people.
Criterion Standard A Standard B Standard C Standard D Standard E
Com
mun
icat
ion
and
Rea
soni
ng
accurate and appropriate use of mathematical terminology, conventions in complex algebraic situations
accurate and appropriate use of mathematical terminology and conventions in simple non-routine through to complex routine situations
accurate and appropriate use of mathematical terminology and conventions in simple non-routine and/or complex routine situations
appropriate use of mathematical terminology and conventions in simple routine situations
Little use of mathematical terminology and conventions in simple rehearsed situations
Clear and concise organisation and presentation of information in a variety of representations in simple non-routine through to complex routine situations
Clear organisation and presentation of information in a variety of representations in simple non-routine through to complex routine situations
Organisation and presentation of information in a variety of representations in simple non-routine and/or complex routine situations
presentation of information in a variety of representations in simple routine situations
Attempted presentation of information in simple rehearsed situations
Accurate and Appropriate algebraic analysis of results displayed
Accurate and Appropriate analysis of results displayed
Some analysis of results displayed
Accurate use of mathematical reasoning to develop logical and sequenced answers to the whole task
use of mathematical reasoning to develop logical and sequenced answers to the whole task
use of mathematical reasoning to develop some logical answers to the task
Use of some mathematical reasoning to develop some logical answers to the task
Clear Mathematical Justification of the reasonableness of the results obtained
Clear Justification of the reasonableness of the results obtained

Their research indicates the best volume will be 240 mL. The manager insists on a cylinder as this is easiest for the machinery, but
any size is possible. As the design team for Coka Kola you have to design the can size. The finance team insists on you coming up with the most economical
design possible. The cans are made from sheet metal which costs $45/m2.

Investigate 1. Use whatever methods you like to solve to investigate this problems2. Describe what you have done in detail – use writing, photos, diagrams, pictures, models
produced
Results/Calculate1. Calculate to allow the problem to be solved show these calculations2. Present results in a table and graph using excel
Use excel for tables and graphing 1. Create Tables with formatting - Title headings, borders, colour fill, fonts2. Create Graphing with formatting - Title, axis labels, scale 3. Use Formulas to calculate in excel.
Analyse results1. Analyse the results to find trends2. Analyse the results to find the answer to the task
Conclusion/ Optimization1. Write a conclusion
Things to do:
Extension and Accelerated Maths
Investigate 3. Use whatever methods you like to investigate this problems4. Identify variables( dependent and independent)5. Describe what you have done in detail – use writing, photos, diagrams, pictures, models
produced6. Find a relationship between Surface area and Volume for the cylinder7. Investigate other shapes to find the optimal shape for this problem.
Results/Calculate3. Calculate to allow the problem/s to be solved show these algebraic calculations4. Present results in a table and graph using excel
Use excel for tables and graphing 4. Create Tables with formatting - Title headings, borders, colour fill, fonts5. Create Graphing with formatting - Title, axis labels, scale 6. Use Formulas to calculate in excel.
Analyse results3. Analyse the results to find trends4. Analyse the results to find the answer to the task for the cylinder only( B standard) all for
the ultimate optimal shape
Conclusion/ Optimization2. Write a conclusion/s3. Discuss the optimization
Reflection1. Reflect on the effectiveness of the mathematical models by recognising and describing the
strengths and limitations of the model 2. Include a list of assumptions