Embed Size (px)
Citation preview

Income GrowthEquity GrowthRevenue GrowthAssets Growth
Income Growth (white)—Income Net Profit Margin—Income / Revenue
Assets Growth (white)—Assets Efficiency—Revenue / Assets
Equity Growth (white)—Equity Leverage—Assets / Equity
Revenue Growth (white)—Revenue Equity to Revenue—Equity / Revenue
Price Growth—S&P Price Growth Return on Assets—Income / Assets
Equity Growth—S&P Price Growth Return on Equity—Income / Equity
100
GAAP Structure of Company Finances
Share Price—Fair PriceMargin of Safety—Margin of Risk
Invest InCompanyEvolutionPicture Company Finances
www.seroia.com
BOB GOODENOUGH
HENRY McGILTON

Quarterly Data SummaryMICROSOFT
Revenue (magenta)
Income (yellow)
Assets (cyan)
Equity (blue)
Shares (purple, pink)
Price (green)
S&P Price (red)
QUARTER SHARES ADJUSTED PRICEROW
ENDEDREVENUE INCOME ASSETS EQUITY
DILUTED BASIC SHARE S&P
1 2006-12-31 12.542 2.626 66.371 36.634 9.942 9.806 29.86 1418.302 2006-09-30 10.811 3.478 65.354 36.101 10.010 9.929 27.26 1335.853 2006-06-30 11.804 2.828 69.597 40.104 10.531 10.438 23.14 1270.204 2006-03-31 10.900 2.977 66.854 42.038 10.415 10.303 26.91 1294.875 2005-12-31 11.837 3.653 67.257 44.208 10.638 10.560 25.78 1248.296 2005-09-30 9.741 3.141 71.462 48.327 10.772 10.696 25.29 1228.817 2005-06-30 10.161 3.700 70.815 48.115 10.906 10.839 24.34 1191.338 2005-03-31 9.620 2.563 66.275 47.373 10.931 10.856 23.61 1180.599 2004-12-31 10.818 3.463 64.941 47.232 10.956 10.877 26.02 1211.92
10 2004-09-30 9.189 2.528 94.268 75.946 10.920 10.873 24.16 1114.5811 2004-06-30 9.292 2.690 92.389 74.825 10.894 10.803 24.88 1140.8412 2004-03-31 9.175 1.315 89.767 70.580 10.856 10.785 21.72 1126.2113 2003-12-31 10.153 1.549 85.937 69.343 10.899 10.810 23.84 1111.9214 2003-09-30 8.215 2.614 84.281 66.680 10.885 10.811 24.08 995.9715 2003-06-30 8.065 1.921 79.571 61.020 10.882 10.723 22.21 974.5016 2003-03-31 7.835 2.794 74.482 58.282 10.864 10.715 20.97 848.1817 2002-12-31 8.541 2.552 72.359 55.812 10.846 10.703 22.32 879.8218 2002-09-30 7.746 2.726 70.235 53.516 10.933 10.739 18.89 815.2819 2002-06-30 7.253 1.525 67.646 52.180 11.106 10.811 23.62 989.8220 2002-03-31 7.245 2.738 68.379 54.300 11.129 10.830 26.04 1147.3921 2001-12-31 7.741 2.283 65.387 51.548 11.112 10.790 28.61 1148.0822 2001-09-30 6.126 1.283 61.367 48.505 11.134 10.796 22.09 1040.9423 2001-06-30 6.577 0.065 58.830 47.289 11.148 10.683 31.52 1224.3824 2001-03-31 6.403 2.451 59.605 48.090 11.126 10.672 23.61 1160.3325 2000-12-31 6.550 2.624 57.691 46.422 11.140 10.660 18.73 1320.2826 2000-09-30 5.766 2.206 56.089 45.343 11.114 10.598 26.04 1436.5127 2000-06-30 5.804 2.409 51.694 41.368 11.072 10.378 34.54 1454.6028 2000-03-31 5.656 2.385 50.895 39.792 11.086 10.418 45.88 1498.5829 1999-12-31 6.112 2.436 45.093 34.589 11.076 10.326 50.41 1469.2530 1999-09-30 5.384 2.191 39.672 31.340 11.054 10.258 39.10 1282.7131 1999-06-30 5.764 2.202 38.321 28.438 10.964 10.056 38.94 1372.7132 1999-03-31 4.595 1.917 33.561 25.722 11.024 10.110 38.70 1286.3733 1998-12-31 5.195 1.983 30.049 22.578 10.920 9.798 29.94 1229.2334 1998-09-30 4.193 1.683 25.569 19.124 10.868 9.916 23.76 1017.0135 1998-06-30 3.995 1.357 22.357 16.627 10.724 9.728 23.40 1133.8436 1998-03-31 3.774 1.337 19.545 14.676 10.740 9.732 19.32 1101.7537 1997-12-31 3.585 1.133 16.840 12.344 10.668 9.008 13.95 970.4338 1997-09-30 3.130 0.663 15.366 11.464 10.664 9.640 14.28 947.2839 1997-06-30 3.175 1.057 14.387 10.777 10.488 9.632 13.64 885.1440 1997-03-31 3.208 1.042 12.613 9.134 10.576 9.552 9.90 757.1241 1996-12-31 2.680 0.741 12.786 9.642 10.432 9.568 8.92 740.7442 1996-09-30 2.295 0.614 10.740 7.277 10.352 9.552 7.12 687.3343 1996-06-30 2.255 0.559 10.093 6.908 10.244 9.472 6.48 670.6344 1996-03-31 2.205 0.562 9.590 6.595 10.224 9.488 5.57 645.5045 1995-12-31 2.195 0.575 9.106 6.180 10.208 9.440 4.74 615.9346 1995-09-30 2.016 0.499 8.160 5.739 10.240 9.424 4.88 584.4147 1995-06-30 1.621 0.368 7.210 5.333 10.032 9.312 4.88 544.7548 1995-03-31 1.587 0.396 6.592 4.930 10.016 9.312 3.84 500.7149 1994-12-31 1.482 0.373 5.961 4.443 10.000 9.296 3.30 459.2750 1994-09-30 1.247 0.316 5.637 4.430 9.952 9.296 3.03 462.7151 1994-06-30 1.293 0.362 5.363 4.450 9.760 9.136 2.79 444.2752 1994-03-31 1.244 0.256 4.926 4.012 9.728 9.152 2.29 445.7753 1993-12-31 1.129 0.289 4.486 3.746 9.728 9.088 2.18 466.45

Invest In Company Evolution
100
GAAP Structure
MICROSOFT (MSFT)
Income GrowthEquity GrowthRevenue GrowthAssets Growth
Share Price Growth (white)—Share Price
Great investment opportunities come around when excellent companiesare surrounded by unusual circumstances that cause the stock to bemisappraised.
Warren E. Buffett—Fortune, December 19, 1988
Invest In Company Evolution pictures company finances. The frontcover of this book charts the shapes of great investment
opportunities, excellent companies, unusual circumstances, andmisappraised stocks. The rest of the book explains its front covertools by expanding on one structure, one table, and one chart. Don’tgather data or make charts. Just take a few hours to read and think.
Evaluating company performance is scattered and complex. We useGenerally Accepted Accounting Principles (GAAP) to derive a structureof Securities and Exchange Commission (SEC) data. GAAP Structureunites accounting measures to form evaluation measures. Its coloredbuttons relate these measures to form equations. Equations enableyou to systematically explore the health and progress of a company.
We reduce equations to four growth curves circled in GAAP Structure.Then, we compare them in a four-growth chart. Wall Street’s currenthabit is to pay for evolution. As you see in the early phase, whencompany growth accelerated, Share Price Growth (white) accelerated.Share Price (green) was an unexpected great investment opportunity.
Use this GAAP Structure to define, chart, and understand companyperformance: track companies, talk with advisors, and make betterinformed investment decisions. Use it to understand limits to factorsof growth, a growth hierarchy, criteria you enter in stock screeningtools, rankings from stock ranking tools, and meanings of advice.
This book is for people who enjoy thinking their way to true answers.It solves investment riddles, so you can now apply the measures inshelves of investment strategy books. An e-book version enablesquick reference, printing, and electronic education—www.seroia.com
You can cause an investment revolution by asking companies tobegin Quarterly and Annual Reports with a downloadable QuarterlyData Summary back to 1993 in XBRL (useful) format. Read the firstpage of every chapter to unfold a story of evolution. Then, snap intoplace concepts that help us recognize great investment opportunities.
iii

Contents
Simple design, intense content.
Edward R. Tufte—Scientific American, April, 2005
100
Invest In Company Evolution ................................................................. iii
I
A
E
R
1. Fundamental Trends ............................................................................ 1
Income .......................................................................................................... 2
Assets ............................................................................................................ 4
Equity ............................................................................................................ 6
Revenue ....................................................................................................... 8
II
AA
EE
RR
2. Growth Trends .......................................................................................... 11
Income Growth ....................................................................................... 12
Assets Growth .......................................................................................... 14
Equity Growth ......................................................................................... 16
Revenue Growth ..................................................................................... 18
RI
AR
EA
RE
AI
EI
3. Ratio Trends ................................................................................................ 21
Net Profit Margin—Income to Revenue .................................. 22
Efficiency—Revenue to Assets ...................................................... 24
Leverage—Assets to Equity ............................................................ 26
Equity to Revenue—Equity to Revenue ................................. 28
Return on Assets—Income to Assets ........................................ 30
Return on Equity—Income to Equity ....................................... 32
iv

Contents v
II
IA
IE
IR
4. Change Trends .......................................................................................... 35
Income Change to Income ............................................................... 36
Assets Change to Income .................................................................. 38
Equity Change to Income ................................................................. 40
Revenue Change to Income ............................................................ 42
RI
AR
EA
RE
AI
EI
5. Sustainable Trends ................................................................................ 45
Income Growth to Revenue Growth .......................................... 46
Revenue Growth to Assets Growth ............................................. 48
Assets Growth to Equity Growth .................................................. 50
Equity Growth to Revenue Growth ............................................ 52
Income Growth to Assets Growth ................................................ 54
Income Growth to Equity Growth ............................................... 56
IP
AP
EP
RP
IP
AP
EP
RP
6. Popularity Trends ................................................................................... 59
Price to Income ....................................................................................... 60
Price to Assets .......................................................................................... 62
Price to Equity ......................................................................................... 64
Price to Revenue .................................................................................... 66
Price Growth to Income Growth ................................................... 68
Price Growth to Assets Growth ..................................................... 70
Price Growth to Equity Growth ..................................................... 72
Price Growth to Revenue Growth ................................................ 74

vi Contents
7. Share and Fair Price Trends .......................................................... 77
Share Price Growth and S&P Price Growth .......................... 78
Equity Growth and S&P Price Growth ..................................... 80
Share Price and Fair Price ................................................................ 82
Fair Price Estimate ................................................................................ 84
100
8. GAAP Structure ....................................................................................... 87
GAAP Structure Molecule ........................................................... 89
GAAP Original Data ........................................................................ 91
GAAP Structure Verified by SEC Data ............................... 93
GAAP Structure Graphics Verified ....................................... 95
AA
EA IA A
EEI
ER
E E
AI EI II PI
RI IA
P EP
IPP
PR
P P
AR IR RR R
9. Solved Riddles ........................................................................................... 97
The GAAP Alphabet Riddle ............................................................. 98
The Monopoly Riddle .......................................................................... 99
The Best Numbers Riddle ................................................................. 100
The Annual Report Every Quarter Riddle ............................... 101
The Revenue and Income Riddle ................................................. 102
The Assets and Equity Riddle ........................................................ 103
The Growth Hierarchy Riddle ........................................................ 104
The Ratios Riddle ................................................................................... 105
The Leverage Riddle ............................................................................. 106
The Per Share Growth Riddle ......................................................... 107
The Split-Adjusted Close Price Riddle ...................................... 108
The Mathematics Riddle ................................................................... 109
The Computable Riddle ..................................................................... 110
The Definitions Riddle ........................................................................ 111

Contents vii
The Color Codes Riddle ..................................................................... 112
The Get Data Riddle ............................................................................ 113
A. Further Reading ....................................................................................... 120
Investing ...................................................................................................... 120
General Interest ...................................................................................... 125
Investment Inspirational ................................................................... 129
Financial Analysis ................................................................................. 130
B. Words Of Wisdom ................................................................................ 134
Government .............................................................................................. 134
Value Investing ........................................................................................ 135
Accurate Data .......................................................................................... 135
Forecasting ................................................................................................. 136
Psychology of Investing ..................................................................... 136
Media and Investing ............................................................................ 137
Market Manias ........................................................................................ 138
Financial Advisory Newsletters ..................................................... 138
Index .................................................................................................................. 140
Acknowledgments ................................................................................. 154
Colophon ....................................................................................................... 156
Authors ............................................................................................................ 157
Copyright ....................................................................................................... 158
Growth Trends2
DATASTREAMS MICROSOFT
IIIncome Growth
AA
Assets Growth
EEEquity Growth
RRRevenue Growth
Growth is always a component in the calculation of value (fair price),constituting a variable whose importance can range from negligible toenormous and whose impact can be negative as well as positive.
Warren E. Buffett—Letter to Berkshire Shareholders, 1992
Evaluation became a lot easier once we discovered all equations ofour GAAP Structure on the facing page and page 87 reduce to only
four growth trends—income growth, assets growth, equity growth,revenue growth. These growth trends equal Ratio Trends on page 21multiplied by corresponding Change Trends on page 35.
The Growth Hierarchy Riddle on page 104 reveals insights gained bycondensing all the SEC data since 1993 from our Quarterly Data Sum-mary into one front cover chart that compares the four growth trends.
You need growth trends (white) to see the rate of change in funda-mentals. Fundamentals show you changes only in amounts—the rateof change is [ ( new value − old value ) / old value ] × 100. Eachchart displays a growth trend—calculated from the fundamentaldatastream on its left. The facing page simplifies business thinking,showing you the datastreams used to calculate growth trends and thefactors that are multiplied to cause each growth trend.
Although growth has no single correct value, the growth hierarchydescribes the ideal company growing income as fast as possible,while growing equity, revenue, and assets equal to it. In real life,growth is optimized within this reasoned hierarchy.
The Best Numbers Riddle on page 100 shows why you want shareprice growth—influenced by popularity—to beat S&P price growth,and equity growth to beat S&P price growth. Ideally, you want theaverage growth of each fundamental to beat the S&P average of 11%.
Look at the four growth charts on the left. The naive investor seescolored income, assets, equity, and revenue going up. The savvyinvestor also sees revenue growth turning down first, simultaneouslyfollowed by growth of income, assets, and equity. People stare atcolored datastreams—blind to aligned white growth turning points.
A pilot without instruments flies blind in the weather. An investorwithout growth trends makes blind decisions.
11

12 Chapter 2—Growth Trends
Income Growth
MICROSOFT
Income Growth
Income Growth—Income
Income Growth—Share Price
You’re better off ignoring 5-year compound (income) growth and profitmargins exceeding the Compustat mean and focusing exclusively onstocks that show persistent (income) growth without regard to magnitude.
James P. O’Shaughnessy—What Works on Wall Street
Income growth shows the rate of change, stated as a percent. Youcan not see this rate in the fundamental—income.
Income (earnings) growth is change in income divided by income[ ( new income − old income ) / old income ] × 100. The Per ShareGrowth Riddle on page 107 shows we follow scholars using incomeper diluted share growth—not income per basic share growth.
Look for “persistent” income growth as in the middle chart. NoticeO’Shaughnessy is very careful to say “persistent”. He also says“without regard to magnitude”, and avoids the word “consistent”.Look at income (yellow). It is persistently increasing, so you see thatincome growth (white) is persistent. Keep in mind two facts aboutincome: Not all income is reinvested to earn more income; Highincome growth—even if it is decreasing—may still provide moreincome added to equity than the company is able to reinvest.
You want to see the income growth trend. In the bottom chart,shortly after income growth turns steeply down, investors take theshare price down. However, there is not always a correlation in direc-tion or magnitude. Nevertheless, a downturn in revenue growth fol-lowed by a downturn in income growth should get you to pay closeattention to your share price trend. Following are two reasons whyinvestors may change share price.
First, income growth is the popular growth component for calculatingthe Fair Price Estimate—Intrinsic Value on page 85, though we arguein The Growth Hierarchy Riddle on page 104 for a reasoned number.If fair price goes down, investors may lower share price.
Second, income growth affects the amount of income available forreinvestment in assets and equity to fund revenue to earn moreincome. If revenue growth is going down—and the growth of income,assets, and equity turn down—investors may soon lower share price.
Despite volatility and other reservations about income growth, yousee the additions of income to equity that become available for rein-vestment when you look at Equity Growth on page 16. Martin S. Frid-son says in Financial Statement Analysis, “As long as the amount ofequity capital invested per share continues to rise, more income canbe earned on that equity, and . . . (income) per share can increase.”

13
Income Growth Events
100
GAAP Structure
MICROSOFT
Income GrowthEquity GrowthRevenue GrowthAssets Growth
You see in the chart above from TheGrowth Hierarchy Riddle on page 104,that income growth (yellow) fluctuatesaround the more nearly equal growthpaths of equity, revenue, and assets.You should form your own estimate ofgrowth that is much more conservativethan income growth. Consider its vola-tility and the fact that revenue (thesource of equity) is growing muchslower than income just after December2004. Even if some formula calls for“income growth”, don’t blindly plug inincome growth—think!
The December 2004 dividend madeequity growth decrease, so equitygrowth is temporarily not the good esti-mate of fair price growth proposed inThe Best Numbers Riddle on page 100.
Income growth (circled) reduces your evaluation from 2 to 1because it’s the product of two factors to its left: Income Change to
Income on page 36, and the factor 100. Leave the details of GAAPStructure on the left until page 87.
The Best Numbers Riddle on page 100 says ideally income growthequals equity growth, beating S&P price growth (averaging 11%)—ason the page facing Share and Fair Price Trends on page 77.
As you see in the growth hierarchy chart on the left—no sane inves-tor would use volatile income growth in the estimate of fair pricegrowth without considering the growth of revenue, assets, and equity.
During the dot-com boom the company increased income—probablythrough product pricing, not revenue growth. You see this in thechart on the left. During the boom, management kept revenue growthwell below equity growth, so in the bust there was less decrease inrevenue growth. Look at the chart below to see that income growthplummets. This causes the Fair Price Estimate on page 84 to plummetfollowed by share price. The Growth Hierarchy Riddle on page 104proposes growth factors more realistic and consistent than income.
MICROSOFT
Income Growth—Income
GAAP Structure8
100
GAAP Structure
DNA Structure
Atomic Structure
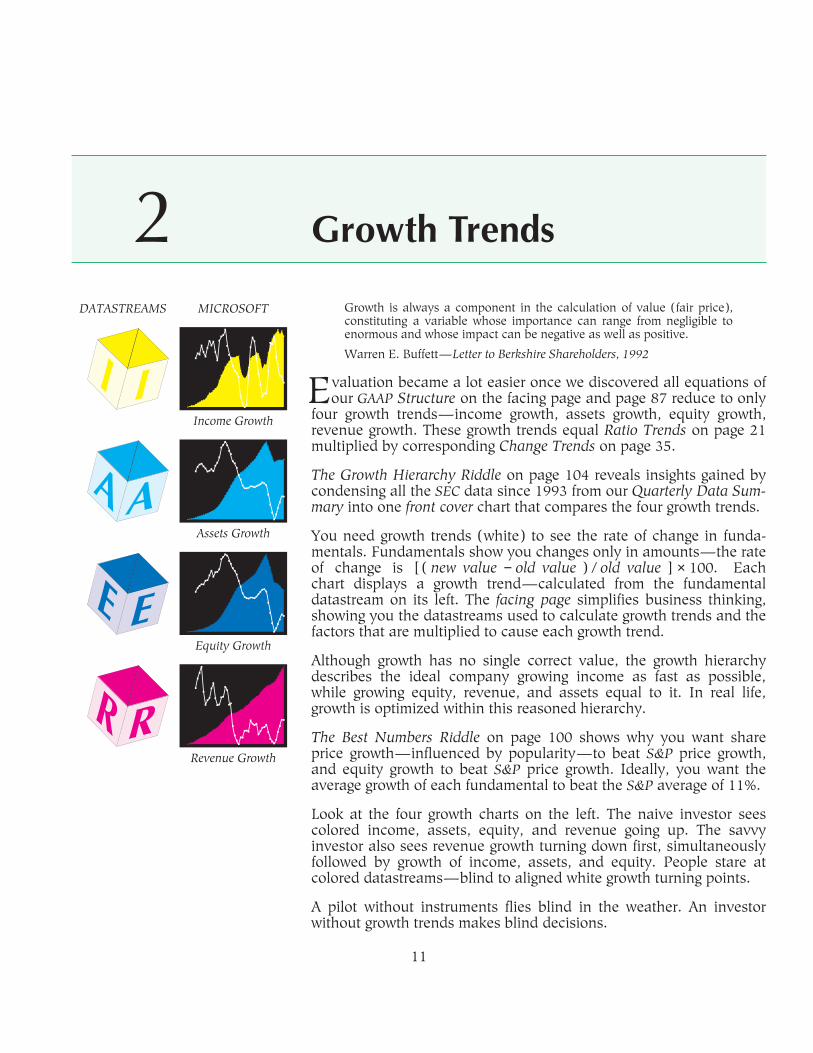
Without our ability to arrange things in ordered succession little pro-gress could have been made.
Tobias Dantzig—Number, The Language of Science
GAAP † Structure reveals order in the financial puzzle you can’t seein its fundamentals. It predicts factors on rows, and the bottom
five factors on its diagonal—equity to revenue, and four change toincome ratios. These previously unpublished relations expandresults to reveal their causes—enabling astute investment decisions.
The truth of the numbers is essential to your confidence in the trendcharts. We all know some companies lie—but they must lie con-sistently for sides of the equations to be equal in GAAP Structure.
GAAP Structure is built with income (yellow), assets (cyan), equity(blue), revenue (magenta), and for public companies price (green).
Some investors know that leverage times efficiency times net profitmargin causes return on equity. Now, the GAAP Structure matrixexpands your understanding of relations to see the causes of growth.
The facing page begins our proof—which derives GAAP Structurefrom SEC data, then proves GAAP Structure is verified by SEC data.
When you look closely at the structures on the left, you find only afew fundamental concepts. As Jacob Bronowski says, “simplicity tri-umphs, however complex the worlds within worlds may appear”:
GAAP Structure—income, assets, equity, revenue;DNA Structure—adenine, thymine, guanine, cytosine;Atomic Structure—atoms ordered by atomic weights.
Globally, billions of people communicate with alphabetic systems ofonly a few letters. The GAAP Alphabet Riddle on page 98 describeshow GAAP Structure brings financial communication to everyday life.
† United States Generally Accepted Accounting Principles (US GAAP)
Financial Accounting Standards Board (FASB) at http://www.fasb.org/st/
87

GAAP Structure 89
GAAP Structure Molecule
100
GAAP Structure
I think both Crick and I realized we were famous because the doublehelix was the most important molecule of life, and therefore we got ournames associated with it.
James Watson—Nobel Prize Winner, Discover Dialogue, July 2003
GAAP † Structure is the most important molecule of businessbecause it reveals the arrangement of fundamentals—income,
assets, equity, and revenue—in ordered succession, deriving fromSEC data a tool for systematic evaluation of company evolution.
We derive GAAP Structure from SEC databy deriving four fundamentals that formfour ratio trends (with their results),and four change trends—all reduce, inordered succession, to equal the fourgrowth results on rows 5, 6, 7, 8.
The Best Numbers Riddle on page 100shows you want growth measures—andthus products of their factors—to beatthe S&P price growth (averaging 11%).
Company—measures the company.Stepping down the diagonal are the firstfour Ratio Trends from page 21, then thefour Change Trends from page 35.
Results—measures the company at aglance. A result equals the product ofthe factors on its row, as in GAAP Struc-ture Verified by SEC Data on page 93.
Market—measures what the market is“paying up” for each fundamental andthe growth of each fundamental. Themarket column of four is income yield.
Price—measures price and growth.
In GAAP Structure, revenue and incomesum 4 quarters per average 4 quartersdiluted shares, as in The Revenue andIncome Riddle on page 102. Assets andequity average 4 quarters per average 4quarters diluted shares, as in The Assetsand Equity Riddle on page 103. Price iswithin the quarter, nearest the end, asin The Get Data Riddle on page 113.
Colored, per-share income, assets, equity, revenue, and price build45 measures, minus duplicates, into the 26-measure GAAP Structure.
100
Company Results Market Price
Fact
ors c
ausin
g Res
ults
Chang
e Tr
ends
Ratio
Tre
nds
δ RevenueIncome
δ EquityIncome
δ AssetsIncome
δ IncomeIncome
EquityRevenue
Leverage Efficiency ProfitMargin
IncomeYield
The GAAP Structure molecule on the facing page requires only twoversions of the five measures—income, assets, equity, revenue, andprice— I1 , A1 , E1 , R1 , P1 ; and I5 , A5 , E5 , R5 , P5 . GAAP Struc-ture shows which number to pick from GAAP Original Data facingpage 91. For example, R5 is the number at row 5, columnRs 4q / Sa 4q . GAAP Structure growth formulas require sub 5, implyingthat all rows must use sub 5. Charts, however, show you all the data!
† United States Generally Accepted Accounting Principles (US GAAP)
Financial Accounting Standards Board (FASB) at http://www.fasb.org/st/

Further ReadingA
I’ve got a little list.I’ve got a little list.
Gilbert and Sullivan—The Mikado
Between us, we reckon we have read around three hundred bookson finance, investing, trading, risk management, money
management, inquiring systems, decision systems, truthful and per-suasive visual displays, and the psychology of making money.
Additionally, we have read thousands of magazine and newspaperarticles on all aspects of finance, investing, commodities, futures,options, derivatives, fundamental and technical analyses, and so on.
We believe that in the process of constructing our bibliography wehave identified a few of those writers whose concepts make sense tous. Because our list is extensive, we suggest that you scan our reflec-tions and start with the work that interests you most.
Investing
Take On The Street
How to Fight forYour Financial Future
Arthur Levitt—Former Chairman of the Securities and ExchangeCommission—brought us free and easy Internet access to the datathat is the starting point for making astute investment decisions. Hereformed the regulations to better level the playing field on whichhonest small investors think. He reveals the high-view of dynamicsthat shape investing. He prepares us to make responsible decisions.
Arthur Levitt’s vision, leadership, data, and reforms affect us all. Hishuman story is of people who have prevailed in the face of opposi-tion. Arthur Levitt worked with President Clinton, Congress, theSecurities and Exchange Commission, company leaders, and inves-tors to shape the context of investment today. He describes the truthbehind investing, and achievements that created a more honestinvestment environment. He prepares us to act courageously. Onceyou have read Arthur Levitt’s story, all your investment reading andinvesting will have a deeper, more useful, personal meaning.
120

Colophon
Colophon was a city in Lydia and the titular see of Asia Minor. Its namecomes from the word “summit”, which is the origin of the bibliographicterm “colophon”, in the metaphorical sense of a “crowning touch”.
—— Wikipedia
Book Design by Julia D’Arcy, Teri Fujimoto ( ), and Henry McGilton.
Body copy is set in eleven point Hiroshige on thirteen point leading.Chapter and section headings are set in Optima Bold.
Creation Source Text for this manuscript was prepared using software tools availableon Apple Macintosh computers running Mac OS X. Source text was typedand edited using VI—one of the primary visual editors available for UNIX
systems, and TextEdit—the basic editor available on Mac OS X.
Composition
Built On Macintosh
Formatting used PSFIG by Ned Batchelder and Trevor Darrell and the GNU
suite of TROFF-related tools by James Clark. Tom Kiffe provided MacGhost-View 4.3 on Mac OS X used to test and refine PostScript pictures andcharts, and technical consulting on producing PDF graphics and text.Tables of contents, cross references, and index were generated using home-grown software and macro packages. The entire document was composedfrom source through formatting to printer with no manual intervention.
Henry McGilton of Trilithon Software, www.trilithon.com provided technicalconsulting on the documentation tools and color space used to produce theprint-ready PostScript code; created the Java tools to generate the charts;provided PostScript programming expertise; and consulted on issues ofbook design, layout, mathematical typesetting, and typography.
Graphics Charts are vector graphics generated by awk scripts and a specialized Javaprogram to generate files of PostScript code that were included using PSFIG.
Credits S&P 500 (SPX) Adjusted Close Price data, courtesy Rudolph Cabral, Com-modity Systems Inc. (CSI). Cessna, inside back cover, photo by PaulBowen, courtesy Cessna Aircraft. Earth at Night, back cover, courtesyUnited States National Aeronautics and Space Administration (NASA), via theDefense Meteorological Satellites Program. http://visibleearth.nasa.gov/
www.seroia.com PDF Electronic Book distribution from www.seroia.com was implemented byTodd Sterling of http://www.onetreeDesign.com/ who alerted us to issues ine-commerce, taxation, pagination, and encryption for editing and printing.

Authors
Our Earth is degenerate in these latter days;
bribery and corruption are common;
children no longer obey their parents;
every man wants to write a book,
and the end of the world is evidently approaching.
Assyrian Tablet, approximately 2,700 BC
Oxford University Press wants “information about yourself on whyyou are qualified to write this book.” We believe with these thinkers.
Grigori Perelman solved the Poincare Conjecture (The New Yorker,August 2006), “Everybody understood that if the proof is correct thenno other recognition is needed”; E. B. White (William Strunk, Jr.,and E. B. White, The Elements of Style), “No one can write decentlywho is distrustful of the reader’s intelligence, or whose attitude ispatronizing”; and the Harvard Business Review, inviting “expertswhose authority comes from careful analysis, study, and experience.”
BobGoodenough Bob started his minimum-data decision systems career in 1967 as aUSAF Mach-II fighter pilot—relying on cockpit instruments to makelife and death decisions. He earned his PhD in OrganizationalDevelopment in 1976 from the Union Institute. (The Institute wasfunded by Carnegie Mellon and the U. S. Department of Education.)Bob was Inventor’s Consultant for Apple’s HyperCard—shipped withevery Mac for 10 years. His 1993–1997 consultation with CypressSemiconductor convinced him and colleagues they had sufficientcommand of technology and Securities and Exchange Commissiondata to jump-start global investing literacy for students and adults.
Henry McGilton Henry started his computer programming career in 1963. Hefounded Technical Publications at Sun Microsystems, and co-authored Introducing the UNIX System and Introducing UNIX SystemV—McGraw-Hill books that sold more than three-hundred thousandcopies in five languages worldwide. Henry also co-authored Typeset-ting Tables on the UNIX System and PostScript by Example—anAddison-Wesley book. Forty years of programming including tenyears of Java now bring Henry to use the Objective-C language todevelop desktop applications for Mac OS X. Henry is usually foundon a squash court when he’s not pursuing the life of a boulevardier.

Copyright
Trilithon—Stonehenge
You cannot name 20 persons in the whole United States who in the last100 years have produced books which have outlived the copyright limit.
Mark Twain—Congressional Hearing, December 7, 1906
Trilithon Press, Santa Cruz, California 95060
Copyright 2007 by Bob Goodenough and Henry McGilton.
All rights reserved. Hardback and Electronic edition published 2007
First edition published 2007.
Printed in Canada / Imprime au Canada
16 15 14 13 12 11 10 09 08 07 1 2 3 4 5 6 7 8 9 10
ISBN-13: 978-0-9626289-5-5 (HARDBACK )
Library of Congress Control Number: 2006908270
Invest in company evolution, picture company finances. — 1st ed.
Includes bibliographical references, color illustrations, cross references, and index.����������������������������������������������������������������������������The authors and publisher took care in preparation of this book, but make no
expressed or implied warranty and assume no responsibility for errors or omissions.
No liability is assumed for incidental or consequential damages in connection with
or arising out of the use of the information or programs contained herein.����������������������������������������������������������������������������No part of this publication may be reproduced, stored in a retrieval system, or
transmitted, in any form, or by any means, electronic, mechanical, photocopying,
recording, or otherwise, without prior written permission of the publisher.����������������������������������������������������������������������������
Cover Design Bob Goodenough and Henry McGilton
Production Typeset in Hiroshige and Optima at Trilithon Software
Indexing Trilithon Software
Editor Amanda S. Sorensen
Editor Lee A. Appelbaum
Editor Michael Goldeen����������������������������������������������������������������������������(∞) The paper used in the hardback book meets the minimum requirements of the
American National Standard for Information Sciences—Permanence of Paper for
Printed Library Materials, ANSI Z.39.48-1992.
Mixed Sources Product group from well-managed forests,
controlled sources, and recycled wood or fiber.
www.fsc.org Cert no SW-COC-2080 1996 Forest Stewardship Council
The Publisher’s policy is to use paper manufactured from sustainable forests.����������������������������������������������������������������������������www.seroia.com

Imperatives
Cessna, Generating LiftPaul Bowen, Photographer
We are immeasurably better off as a result of technology, but there is stilla lot of suffering in the world to overcome. We have a moral imperative,therefore, to continue the pursuit of knowledge and advanced technolo-gies, such as nanotechnology, that can continue to overcome human affl-iction. There is also an economic imperative to continue due to the per-vasive acceleration of technology, including miniaturization, in the com-petitive economy.
Ray Kurzweil—U.S. House of Representatives Hearing, April 9, 2003
Robert G. Hagstrom, AuthorThe Warren Buffett Way
Has Warren seen this?
Martin S. Fridson, AuthorFinancial Statement Analysis
Since your inventions enjoy Trade Secret and Copyright protection, Iencourage you to share your research findings in the great debate.
Executive EditorA Major Publishing Company
Can I see what you have? I need to stress up front that we cannot do abook like this in color. Send me a copy when you’ve published.
Chief Financial OfficerA New York Stock Exchange Company
We believe it is not in the best interests of our shareholders to havethis much company information so easily available to the public.
Executive Vice President for InvestingA Major Wall Street Brokerage
I used to educate my clients. They took so much time my performancedropped and they went elsewhere. Now I keep clients at arms-length.
Joy Hoffmann, Vice PresidentFederal Reserve Bank of San Francisco
You may say, I have an interest. We educate on automatic-depositsand bill-paying. You’re ahead of where we hope to be in 20 years.
Bob Rand, [email protected] and Exchange Commission
I’ll put your (company) example on the following page as it morespecifically addresses searching with the EDGAR historical archives.
Senior ExecutiveThe Charles Schwab Corporation
Show this to Chuck. Your book illustrates all of the fundamentals herecommends in Charles Schwab’s Guide to Financial Independence.
Lee Appelbaum, Co-Inventor, DataRetrieval Adopted by NASDAQ: VRTY
The GAAP Structure matrix is your contribution. I wonder what ourworld will be like when people make informed investment decisions?

160 Imperatives
ISBN-13: 978-0-9626289-5-5
9 780962 628955
5 4 5 0 0
Income GrowthEquity GrowthRevenue GrowthAssets Growth
100
GAAP Structure of Company Finances
Invest InCompanyEvolutionPicture Company Finances
www.seroia.com
BOB GOODENOUGH
HENRY McGILTON