Embed Size (px)
Citation preview

THE STATE EDUCATION DEPA RT M E N TTHE UNIVERSITY OF THE STATE OF NEW YORK
PART II.6
Inverse (Indirect) Machines...........................2
Statistics of The M&M Candy.......................8
NOTE: This document is a work in progress. PartsII and III, in particular, are in need of furtherdevelopment, and we invite the submission ofadditional learning experiences and local perfor-mance tasks for these sections. Inquiries regardingsubmission of materials should be directed to: TheMathematics, Science, and Technology ResourceGuide, Room 681 EBA, New York State EducationDepartment, Albany, NY 12234 (tel. 518-474-5922).
http://www.nysed.gov
&

Students need to recognize relationships
between quantities. Most relationships
studied in the early years of algebra are
either direct or inverse (indirect) relationships.
Mathematics classes spend a large part of their
curriculum learning to manipulate mathemati-
cal models of direct relationships. Although
listed as part of the NYS Sequential Mathematics
Course 1 curriculum, students do not generally
spend very much time with inverse (indirect)
relationships and seldom have an opportunity
for a hands on investigation of the same. The
study of levers as simple machines is no longer
contained in the junior high school science cur-
riculum. Thus, the first encounter a student
may have with the study and/or use of levers
is in a physics course, if (s)he chooses to take
such a course.
After a demonstration and discussion of thethree different classes of levers, students willbe assigned to groups of three or four to com-plete the following activities:
2 Mathematics, Science, and Technology
▲ compare data
▲ evaluate conjectures
▲ apply skills to solutions
▲ ratios/proportions
▲ graphing utilities
▲ proportions to scale
▲ curve fitting
▲ revise a model
▲ collect information
▲ mathematical models
▲ predictions
▲ work effectively
▲ gather/process information
▲ generate/analyze ideas
▲ observe common themes
▲ realize results
▲ present results
C O M M E N C E M E N T
MST
1
MST
3
MST
7
MST
6
(Indirect)
Levers: Simple Machines
Patricia Frey-Mason
Buffalo Academy for Visual and
Performing Arts
333 Clinton Street
Buffalo, NY 14204
(716) 851-3868
f r e y p @ a o l . c o m
Grades 9 & 11
Prior KnowledgeStudents should be familiar withthe solution of proportions andwith writing equations andexpressions from verbal descrip-tions.

Learning Experiences 3
Day 1• With the entire class, introduce the terms: levers, fulcrum, effort, and load.• In small groups of three or four, have the students build each type of lever and “play” with it.
What similarities/differences do the students observe? Record these and use in a full classdiscussion.
• Have the students identify levers in their daily surroundings and identify each lever’s class.
HOMEWORK: Students will draw or cut out a picture as an example of each type of lever.Students will label the appropriate parts of the picture: fulcrum, effort, and load

4 Mathematics, Science, and Technology
Day 2• Complete Lab A.
Using the Lego dactaTM Technic I kit, students will build a class one (1) lever and determinethe relationship between weights placed on the lever and its distance from the fulcrum.Students will be asked to express the observed relationship in an algebraic form. As part ofLab A, students will be making predictions and testing them. They will record only those pre-dictions, regarding the number and position of the bricks, which yielded a balance betweenthe load and the effort.
HOMEWORK: Students will complete the Conclusions section of Lab A.
Day 3• The full class will report and discuss the results of Lab A.• The class will determine, from among the group responses and further discussions, an appro-
priate algebraic representation for the relationship between weight (load) and distance fromthe fulcrum for a First Class lever.
HOMEWORK: Students will make corrections and adjustments to their work on Lab A.
Day 4• Complete Lab B.
Using the Lego dactaTM Technic I kit, adjust your lever so that the fulcrum is placed at thethird hole from one end of the lever. Aspecified weight, a brick from the Lego dactaTM TechnicI kit, should be placed on the short end of the lever. Construct a bucket utilizing two rubberbands joined together for the handle and attached to a small paper cup. The bucket will besuspended from the opposite end of the lever by hanging it from a paper clip through the lasthole (#10) of the lever. Predictions should be made regarding the number of paper clipsneeded to cause the lever to change orientation (from raised to dropped).
• Test your observation using the knowledge of relations and algebraic expressions developedin Lab A by adding paper clips to the bucket until the lever changes orientation. Were yourpredictions correct? If not, why?
• By averaging the results of several groups, or several trials, you will obtain data which youshould graph.
HOMEWORK: Graph the data and determine a line of best fit with the equation for that line.(Uncooked spaghetti can be used to help find the line of best fit.) Use that equation to determinethe weight of the brick.
Day 5• Full class reporting and discussion of the results of Lab B.• What were the limitations of this experiment? How could the results of the experiment be
made more exact? What modifications to the Labs could be made to yield “better” data? Canyou think of other situations/experiments which would also illustrate inverse (indirect) vari-ation?
• Complete Pair Practice Sheet identifying direct and inverse (indirect) variation relationships.
HOMEWORK: Review information regarding direct and inverse (indirect) variation in prepara-tion for a quiz.

Learning Experiences 5
Day 6• Traditional pencil and paper assessment, identifying direct and inverse (indirect) variation
relations.
One Week Later• Students will be randomly divided into groups of four as they arrive in the classroom. They
will be given the following situation and asked to propose a workable solution.
A school bus has taken a group of students on an outing to a remote pond forthe purpose of collecting science data. The bus acquires a flat tire, and the sub-stitute bus driver discovers that the company has forgotten to include a jack forthe bus in the tool compartment. He does have all the other necessary tools anda spare tire. How can the students help the bus driver?
Note: The class will first have to determine an approximate weight of the bus. This could bedone by estimation based upon the comparative weights of other large objects, i.e., cars [In thiscase students would be working with direct proportions to obtain an estimate of the bus’sweight.], or by contacting a local school bus company.
• Each group must write up a viable solution which will include a diagram, a list of necessarytools and/or materials, and step-by-step instructions for solving the bus driver’s dilemma.Solutions will be holistically ranked and the better solutions will be presented to the class thefollowing day.
Cooperative Learning• The teacher will organize groups of three to four students each.• Groups will reflect gender and ethnic balances.• Each group member will have a specific role in the group.• Social skills, such as explaining ideas, encouraging team members, asking for clarification,
giving constructive criticism, and keeping an open mind will be encouraged.• Peer review and responsibility for the group’s success will be emphasized .
Gender and EquityIssues• Gender equity will be considered
when forming the groups.• Activities will be both gender-free
and bias-free.• All students will be expected to
know how to use the materialsand will have an opportunity todo so.
• Through the cooperative groups,students with different skill levelswill be able to get help from theirpeers in addition to assistancefrom the teacher.

6 Mathematics, Science, and Technology
Lab A: Using the LegodactaTM Technic I kitstudents will builda class one(1 ) leverand determine therelationshipbetween weightsplaced on the leverand its distancefrom the fulcrum.Students will beasked to express theobserved relation-ship in an algebraicform.
Lab B: Using the Lego dactaTM Technic I kit, students will adjust their lever so that the fulcrum is placedat the third hole from one end of the lever. Aspecified weight, a brick from the Lego dactaTMTechnic I kit, will be placed on the short end of the lever. The students will construct a bucket uti-lizing two rubber bands joined together for the handle and attached to a small paper cup. Thebucket will be suspended from the opposite end of the lever by hanging it from a paper clipthrough the last hole (#10) of the lever. Students will test their observations and algebraicexpressions developed in Lab A by adding paper clips to the bucket until the lever changes ori-entation. By averaging the results of several groups, or several trials, students will obtain datawhich should be graphed. Aline of best fit should be determined and the equation for that linewritten. Students should recognize that the equation can be used to determine the weight of thebrick.

Learning Experiences 7
ASSESSMENT• Written work in student portfolio• Student-generated graph• Student-generated algebraic expressions and equation for the student generated data• Rationale for observed patterns (collected orally by teacher while circulating among groups)• Teacher observed data, actions, and interactions.
Assessment

8 Mathematics, Science, and Technology
I N T E R M E D I AT E
Statistics of The M&M Candy
Basically, this unit introduces the stu-
dents to estimation, measurement (lin-
ear and mass), and experimental and
theoretical probability using a bag of M&M
candies. The students conduct surveys in each
class to determine the team’s favorite color
and compare their results to the company’s
research using various charts and graphs on
the computer. They are also informally intro-
duced to ratio, proportion, and percentage.
Maureen Gipp
Commack School District
Candlewood Middle School
1200 Carll’s Straight Path
Dix Hills, NY 11746
(516) 595-2784
Grade 7
▲ inductive reasoning
▲ solve problems
▲ reasoning strategies
▲ conjectures/arguments
▲ conclusions using inductive
▲ simple/compound state-ments
▲ equivalent forms
▲ ratios/proportions/percents
▲ order relations
▲ estimate/make/use
▲ standard/nonstandard mea-surements
▲ display/describe/compare
▲ critical judgement
▲ check reasonableness
▲ solve problems
▲ estimate probability
▲ simulation techniques
▲ determine probabilities
MST
1
MST
3
Materials:• rulers and/or Vernier calibrators (one
for each pair of students)• triple beam balance (one for each group
of four) • three 1-pound bags on M & M candies -
two plain and one peanut; Note: One bagof the plain candies is used in estimat-ing and then as simple rewards. Thesecond bag is used in calculating themass.
• a small package of M & M candies (onefor each individual student)
I didn’t know there was thismuch math in a bag ofM&M’s.
Student
Learning Experiences 9
The concluding activities focus on statistics and their experiences during the activity. In socialstudies, their research skills will be augmented by studying the history of chocolate, the produc-tion of chocolate, and the Hershey Company. Students will be encouraged to design their ownmagazine advertisement or create a script for a commercial. Using their imagination they will begiven the opportunity to create a candy super hero, report on being a “presidential M&M”, ordescribe their feelings on being the new blue M&M in “the bag.”
It is expected that the students have some knowledge of measurement, statistics, and simpleprobability in order tosucceed with this learn-ing experience.
In all the activities theteacher is primarily afacilitator. The activitiesare set up so that the stu-dents can work indepen-dently or question amember of their cooper-ative group.
For this project, theaccelerated and self-con-tained students wereintegrated with theRegents math students.Each group had a mini-mum of one acceleratedmath student and oneexceptionally brightRegents student. Theself-contained studentswere placed with stu-dents who had demon-strated to the teachertheir ability to explainthemselves well and hadpatience. Both of theseskills are vital for thegroup to be successful.English as a second lan-guage (ESL) students arealso part of our team.They also were inte-grated into the main-stream.
ACTIVITY 1: ESTIMATION AND PREDICTIONSThe students had the opportunity to observe for several days a 1-pound bag of plain M&M’sdisplayed in a clear container and a 1-pound bag of peanut candies in a solid container. After abrief discussion about how many candies are in the clear container, a discussion of how manycandies are in the solid container ensues.

10 Mathematics, Science, and Technology
Each student is expected to complete the worksheets. The candies in the containers are used asrewards in class and each student is required to place tally marks on charts set up in the class-room to record the results. When all the candies are given out, the frequency of each color is tal-lied and recorded.
ACTIVITY 2: SURVEY, TALLY, AND FREQUENCYAquick discussion, led by the teacher, is held about which color(s) appeared to be the most fre-quent in the clear container.
Asurvey of the stu-dents, and anyadults, regardingtheir favorite M&Mcolor is then con-ducted by theteacher. The teachercan have a trans-parency of the chart,modeling for theclass how to dealwith the tally marks.These results arethen compared totheir observation ofthe clear container.
Questions that canbe addressed: • Are the results
similar? How?• Who was
included in thesample sur-veyed?
• How would thiscompare to a sur-vey of adults?
• What would bethe favorite colorof the entireteam? Why?
Each student isexpected to com-plete the work-sheets.
Note: Activities 3 and4 can be done indepen-dently in science andmathematics or com-bined in a double sci-ence/mathematicsperiod.

Learning Experiences 11
ACTIVITY 3: MEASURING M&M CANDIESIn science class (or during a double period) each student will work with a partner to measurethe diameter of one M&M candy using a metric ruler or Vernier calibrator. The students repeatthe process using 20 candies laid in a straight line. They compute the average and compare it totheir first measurement.
The second part of the activity deals with mass measurement and the students use a triple beambalance to compute the mass of one candy and then 20 candies. The students receive 20 candiesin a sandwich bag. An average mass is then calculated.
Using this informa-tion, the student isexpected to calculatehow many candiesare in a 1-poundbag. Each studentwill then reviewtheir observationestimate and theirmeasurement esti-mate and write theirconclusions.
12 Mathematics, Science, and Technology
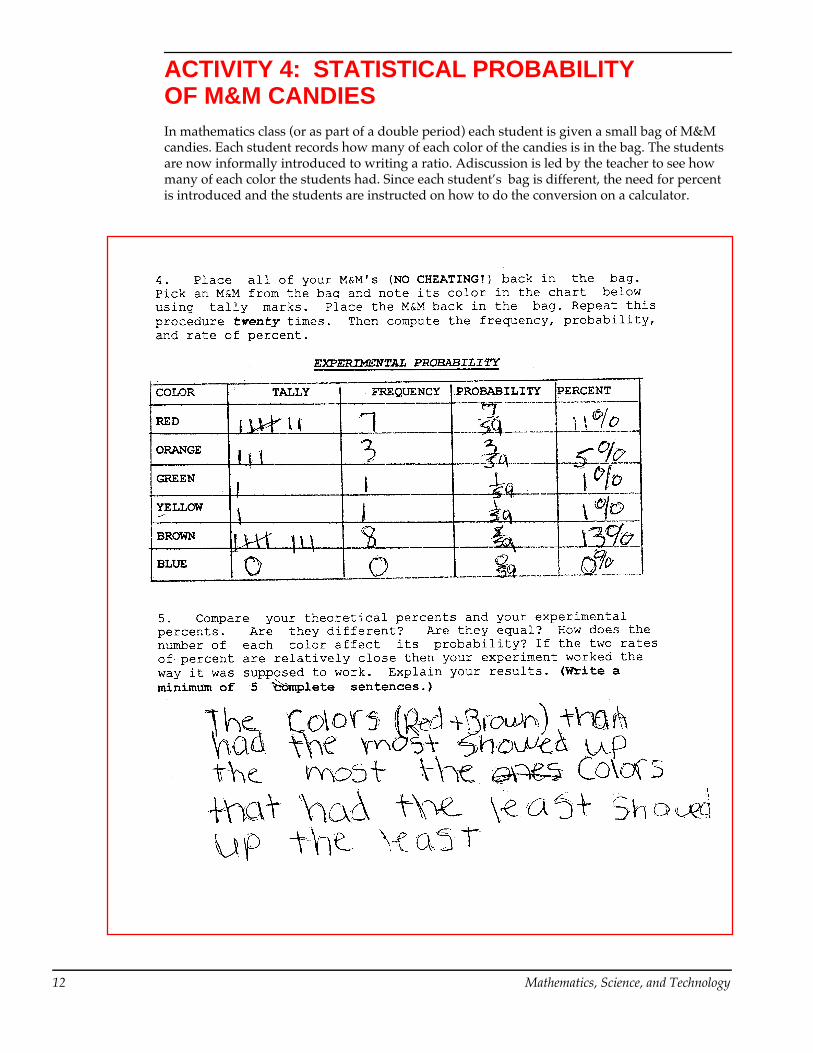
ACTIVITY 4: STATISTICAL PROBABILITYOF M&M CANDIESIn mathematics class (or as part of a double period) each student is given a small bag of M&Mcandies. Each student records how many of each color of the candies is in the bag. The studentsare now informally introduced to writing a ratio. Adiscussion is led by the teacher to see howmany of each color the students had. Since each student’s bag is different, the need for percentis introduced and the students are instructed on how to do the conversion on a calculator.

Learning Experiences 13
The second part of the activity is the experiment. Each student places the candy back in the bagor some other container, retrieves one candy, records its color, returns it to the bag and repeatsthis procedure 20 times.
The final activity requires students to compare their two results and draw conclusions.

14 Mathematics, Science, and Technology
ACTIVITY 5: M&M CONCLUSIONSThe concluding worksheets were designed to allow the students to summarize some of the dataand to draw some conclusions from this data. The concepts of range, median, mode, and meanare also reinforced in this activity.
M&M BONUS ACTIVITIES:These are extended activities for the student to explore. Achoice is given and students areencouraged to come up with their own ideas. These activities are optional and count as extracredit.
Learning Experiences 15
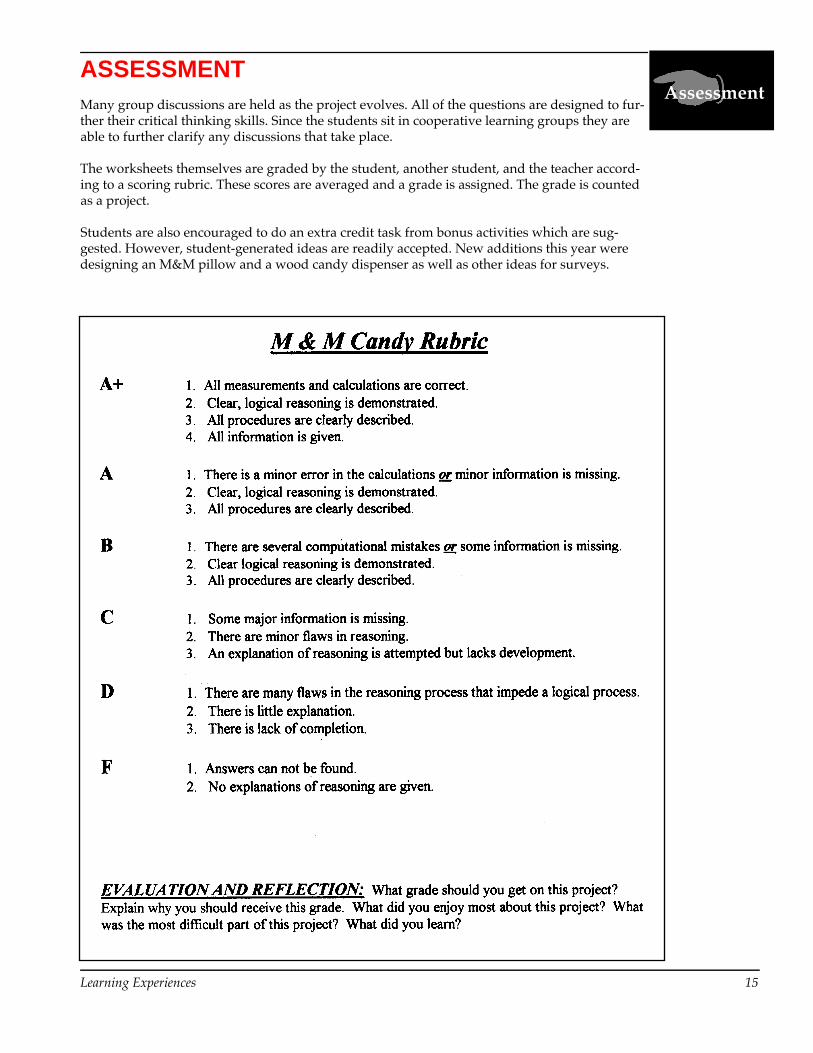
ASSESSMENTMany group discussions are held as the project evolves. All of the questions are designed to fur-ther their critical thinking skills. Since the students sit in cooperative learning groups they areable to further clarify any discussions that take place.
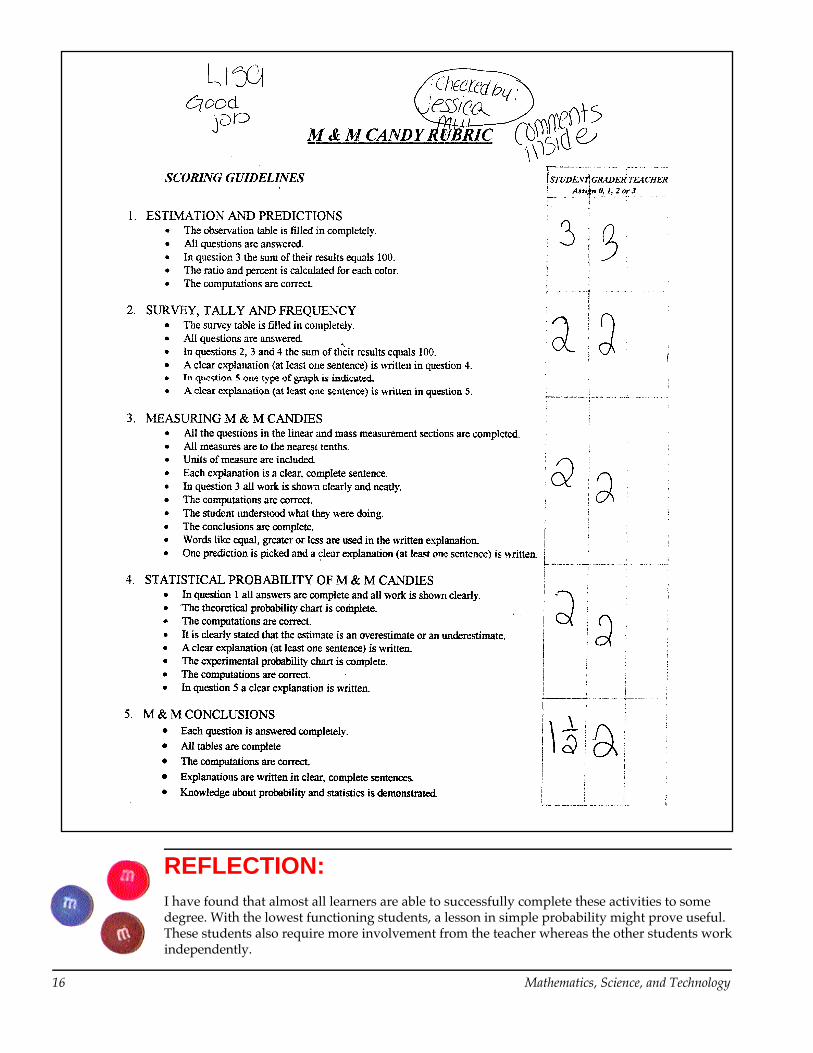
The worksheets themselves are graded by the student, another student, and the teacher accord-ing to a scoring rubric. These scores are averaged and a grade is assigned. The grade is countedas a project.
Students are also encouraged to do an extra credit task from bonus activities which are sug-gested. However, student-generated ideas are readily accepted. New additions this year weredesigning an M&M pillow and a wood candy dispenser as well as other ideas for surveys.
Assessment
16 Mathematics, Science, and Technology
REFLECTION:I have found that almost all learners are able to successfully complete these activities to somedegree. With the lowest functioning students, a lesson in simple probability might prove useful.These students also require more involvement from the teacher whereas the other students workindependently.


![Technical Datasheet - Veracious Inc · Inverse Characteristics Curve [Over Current IDMT]: Very Inverse Long Inverse Standard Inverse Extremely Inverse α C 0.02 1 2 1 0.14 13.5 80](https://img.pdfslide.us/doc/110x75/60dab49f5dabad678957ab65/technical-datasheet-veracious-inc-inverse-characteristics-curve-over-current.jpg)