Embed Size (px)
Citation preview

"TEACHER
STRESS
INVENTORY
Michael J. Fimian

Copyright © 1988 by the Clinical Psychology Publishing Co., Inc.
All rights reserved. This book or any part thereof may not be reproduced in any form whatsoever, except for brief passages embodied in critical reviews and articles, without the prior written permission of the publisher. Write to: Permissions, CPPC, 4 Conant Square, Brandon, VT 05733
Printed in the United States of America.
ISBN 0-88422-102-4

ACKNOWLEDGMENTS
I wish to thank Dianna D' Aurora, William Krupicka, Hilda Moretz, and Lisa Conners for their assis~ance in the coding and analysis of these data and the preparation of the manuscripts related to the development and use of the Teacher Stress Inventory; also Bob Gable, Miriam Cherkes-Julkowlski, and Jacqueline Dunaway of the University of Connecticut for their invaluable technical assistance and support.
This work was made possible through the support of:
The Appalachian State University Department of Language, Reading, and Exceptionalities and the Reich College of Education Research Committee, Appalachian State University, Boone, NC, for the release time and resources to conduct some of the later TSI work.
The late Bureau of Education of the Handicapped, Office of Education, Washington, DC, for the provision of funds for the earlier TSI work conducted in Connecticut and Vermont: Grant Award G008100046.
The Bureau of Research and Evaluation, of the Vermont State Department of Education, Montpelier, Vermont, for their contribution of the personnel and material resources that made the Vermont surveys a reality.

ACKNOWLEDGMENTS
The University of Connecticut Research Foundation, for the funds that supported earlier pilot testing of the TSI: Grant Award 5171-000-22-0401-35-817.
I also wish to thank the following for their data contributions:
Dr. Roberta McHardy Dr. Michael Courtney Dr. Joseph Zacherman Ms. Susan Wiley Ms. Faye Housley Ms. Margaret Honaker Ms. Carol Childers Dr. Sally Townsend Dr. Leland Cooper Mr. Bm London Mr. Ken Graves Dr. Mike Milstein Dr. Sheldon Braaten Ms. Linda Patrick
Investigators who use the TSI in clinical or experimental research are requested to communicate their findings to Dr. Michael J. Fimian, Associate Professor, Department of Language, Reading, and ExceptionaIities, Appalachian State University, Boone, NC, 28608. Observations and experiences of clinicians and workshop presenters who use the TSI in their practice will also be appreciated.
vi

This work is dedicated to the memory of Herbert J. Prehm

CONTENTS
1. Introduction. . . . . . . . . . . . . . . . . . . . . . . . . . . . . . . . . . . . 1 Background of the Teacher Stress Inventory Model ................................ 3
Definition of the Model ........................ 3 TSI Users Defined . . . . . . . . . . . . . . . . . . . . . . . . . . . . . 3
Distinctions from Other Stress Models ............. 5 Life Events ................................... 6 Work Events ................................. 6 Burnout...................................... 6 Role Stress ................................... 7 Type AlB Personalities ........................ 7
Summary...................................... 8 2. Instructions for Administration ................... 9
Suggested Uses ................................. 9 Test Setting .................................... 9 Avoidance of Sensitization to Teacher Stress ....... 10 Assuring Respondent Privacy ..................... 10 Assuring Respondent Confidentiality .............. 11 Administering the Teacher Stress Inventory ........ 11 Insuring Response Completion ................... 12 Scoring ........................................ 12
ix

CONTENTS
3. Test Norms and Interpretation. . . . . . . . . . . . . . . . . . . . 14 Relative Comparisons. . . . . . . . . . . . . . . . . . . . . . . . . . . . 14 Normative Data ................................. 15
Significant Differences Among TSI Scores ........ 15 Deciles . . . . . . . . . . . . . . . . . . . . . . . . . . . . . . . . . . . . . . . 19
Reference Group Comparisons ............... 20 Gender Comparisons ........................ 21 Grade Level Comparisons. . . . . . . . . . . . . . . . . . . . 21
4. Inventory Developrnent .......................... 39
The Current and Final Form of the Teacher
Relationships with Personal/
Teacher Stress Scale ............................. 39 The Initial Form of the Teacher Stress Inventory .... 40
Stress Inventory ................................ 42 Item Selection and Analysis ...................... 42
Face Validity ................................. 42 Factorial Validity .............................. 43
Early Work. . . . . . . . . . . . . . . . . . . . . . . . . . . . . . . . . 43 Recent Work ............................... 44
Content Validity .............................. 51 Scale/Subscale Intercorrelations . . . . . . . . . . . . . . . . . 54 Scale/Subscale Means and Standard Deviations ... 56 Scale/Subscale Distributions .................... 56 Convergent Validity ........................... 58
External Validation of Personal Experience ..... 59
Professional Variables ....................... 61 Relationships with Other Constructs ... . . . . . . . . 64
TSI Reliability ................................ 75 Alpha Reliability ............................ 75 Test-Retest Reliability ........................ 77 Split-Half Reliability ......................... 79 Alternate Forms Reliability ................... 80
Summary ...................................... 81 Suggestions for Further Research ................. 81
References .......................................... 83
x

LIST OF TABLES AND FIGURES
Figures 1. The Teacher Stress Inventory Factors 4 2. Graphic Representation of High/Low
Cut-Off Points for the TSI Subscale and Scale Mean Scores ....................... . 18
3. TSI Stress Sources Distributions ............... . 58 4. TSI Stress Manifestations Distributions ......... . 59 5. TSI Total Score Distribution ................... . 60
Tables 1. TSI Total Score Ranges by Significance Levels 16 2. TSI Subscale/Scale Decile Cut-Off Points for the
Combined Sample (n = 3,401) ................ . 22 3. TSI Subscale/Scale Decile Cut-Off Points
for Regular Education Teachers (n = 962) ...... . 24 4. TSI Subscale/Scale Decile Cut-Off Points
for Special Education Teachers (n = 2,352) ..... . 26 5. TSI Subscale/Scale Decile Cut-Off Points for Male
Teachers (n = 726) .......................... . 28 6. TSI Subscale/Scale Decile Cut-Off Points
for Female Teachers (n = 2,561) ............... . 30 7. TSI Subscale/Scale Decile Cut-Off Points
for Elementary Teachers (n = 791) ............. . 32
xi

LIST OF TABLES AND FIGURES
8. TSI Subscale/Scale Decile Cut-Off Points for Middle School Teachers (n = 499) ........... 34
9. TSI Subscale/Scale Decile Cut-Off Points for Secondary Teachers (n = 1,420) ............. 36
10. Teacher Stress Inventory Samples .............. 45 11. Scale Numbers, Abbreviated Items, Component
Loadings, Item Means, and Standard Deviations for the 10-Factor Solution ......................... 48
12. Experts' Means, Standard Deviations, Interrater rs, and Item Mean Ranges ........................ 54
13. TSI Subscale/Scale Intercorrelations ............. 55 14. Regular, Special, and Combined Samples' Means
and Standard Deviations. . . . . . . . . . . . . . . . . . . . . . . 57 15. Indices of Teacher and Significant
Other Congruence ............................ 61 16. TSI Subscale/Scale Alpha Reliability Estimates ... 76 17. Correlations Between TSI Administrations
Across Time ... . . . . . . . . . . . . . . . . . . . . . . . . . . . . . . . 79 18. TSI Test-Retest Data for 8-Week Intervals ........ 80
xii

1 INTRODUCTION
The assessment of occupational stress in teachers is an increasingly important consideration in the maintenance and motivation of instructional personnel. Both the data-based phenomenon of teacher stress (Anderson, 1981; Fimian & Santoro, 1983; Maslach & Jackson, 1981) and non-data-based perspectives (Bloch, 1978; Fimian, 1980; Styles & Cavanagh, 1977; "Teacher burnout," 1979) have been amply documented. The majority of these, however, have discussed the problem in only general terms. Also, when valid and reliable psychometric constructs were employed, they measured burnout or the end result of long-term stressful experiences. What is needed is a psychometrically valid and reliable measurement of teacher stress.
Because stress and burnout are complex issues, there are numerous factors that can contribute to teacher stress levels. Weiskopf (1980) identified a number of sources of stress: (a) work overload, (b) lack of on-the-job success, (c) longer amounts of time directly interacting with students, (d) poor student-teacher ratios, (e) poorly defined program structures, and (f) the constant responsibility for others. In a separate review, Fimian (1982) summarized 135 sources and manifestations of stress cited in the literature into one or more of 13 a priori categories. Additionally, Gallery, Eisenbach, and Holman (1981) noted four contributing
1

TEACHER STRESS INVENTORY
factors: (a) role ambiguity, (b) role conflict, (c) role overload, and (d) lack of administrative support.
To date, numerous teacher groups have been studied from an empirical perspective: group-home staff (Fimian, 1984a; Thompson, 1980); teachers of the emotionally disabled (Lawrence & McKinnon, 1980); professionals working with the deaf (Meadow, 1981); teachers of the mentally retarded, emotionally disturbed, and learning disabled (Fimian, Pierson, & McHardy, 1986; Johnson, Gold, Williams, & Fiscus, 1981; Zabel & Zabel, 1981); and general special education teacher populations (Fimian & Santoro, 1983; McIntyre, 1981). A number of regular education samples have also been studied. Schwab (1980) identified the empirical relationship among burnout and role conflict and ambiguity levels in teachers, whereas Anderson (1981) found similar results relating burnout to needs deficiency levels. Schwab (1980), Anderson (1981), and Presley (1982) each determined that background personal (e.g., sex and age) and professional (e.g., number of years teaching and caseload size) variables act as particularly poor predictors of burnout. As in the nonempirical literature, though, the majority of these investigations have focused on burnout and not on the stressful precursors of burnout.
It is also apparent in the literature that teacher stress is not attributable to a single source. It can be and often is operationalized in various empirical and nonempirical ways to account for a number of "factors" or "problems" at any given time. Maslach and Jackson (1981), for example, outlined three factors related to burnout: emotional exhaustion, depersonalization, and a lack of personal accomplishment related to one's job. Pines, Aronson, and Kafry (1981) determined that IIoccupational tedium" was significantly related to both stress and burnout. Others, too, have attempted to define occupational stress in terms of operationalized job satisfaction, role strain, role conflict, role ambiguity, and! or teacher attitudes.
The study of teachers has long attempted to identify and isolate variables that either improve their competence and performance levels or that identify impediments that hinder increased competence. Identifying the background and organizational variables that contribute to manageable stress levels, reduce burnout, and
2

Introduction
support on-the-job performance could assist local education agencies in setting and refining long-term plans of work improvement. These plans could, with time, enhance job satisfaction, reduce role conflict and ambiguity, and improve supervisory and administrative support. How the stress-related problems are defined for teachers, therefore, is a crucial point in the process of identifying and resolving their stress-related problems. This manual proposes a means of measuring the complex construct of occupational teacher stress. Additionally, the manual will assist researchers and practitioners in their use of the Teacher Stress Inventory.
BaCkground of the Teacher Stress Inventory Model
Definition of the Model
The Teacher Stress Inventory (TSI) model is operationally defined in terms of 10 factors that comprise teacher stress. In both the literature and common usage of the term "work stress" it is apparent that certain things cause stress and that this stress, when it does occur, becomes evident in terms of any number of physiological, behavioral, and other types of "symptoms." It should thus be possible to identify one array of events that act as sources of stress and another of events that act as manifestations of stress. Such a structure is apparent in the TSI; 5 factors represent sources of stress, whereas another 5 represent manifestations. Collectively, the 10 factors represent the stress construct termed "Total Stress." The TSI model is shown in Figure 1, and each factor is defined in detail later in this manual.
TSI Users Defined
The item content of the Teacher Stress Inventory was initially developed based on the experiences of public school teachers working with regular and special needs students. As noted in Chapter 4, these items were first field tested and then used with a
3

TEACHER STRESS INVENTORY
Figure 1. The Teacher Stress Inventory Factors
Sources of stress Manifestations of stress
Time management Work-related stressors Professional distress Discipline and motivation Professional investment
Emotional manifestations Fatigue manifestations Cardiovascular manifestations Gastronomic manifestations Behavioral manifestations
Total stress
number of teacher samples in eight states. To this extent, the Teacher Stress Inventory should be used only to assess the stress levels of United States public school teachers teaching regular or special education students in grades 1 through 12. Though the Teacher Stress Inventory has been used with a number of teacher samples in other countries, and with numerous teacher trainees and college professors in the United States, norms are not yet available for these groups. Teacher scores on the subscales and scale can then be compared against the norms established for the entire norm group; regular or special education teachers; male or female teachers; and/or elementary, middle school, or secondary teachers. Insofar as the majority of the data upon which the Teacher Stress Inventory was developed were collected from the Northeast, Middle Atlantic, and Southeastern states, comparisons of teachers from nonrepresented geographical areas in the United States to the norm group may be inappropriate. Thus, additional caution should be exercised when comparing teacher scores to those of the norm group.
Teachers actively involved in the full-time instruction of children and youth are appropriate respondents for the TSI. In some cases (e.g., workshop settings), teachers will either complete and score the TSI on their own or will complete it and have their scores computed by a workshop presenter. In this fashion teachers receive feedback about their stress levels and identify stressrelated problems based on significantly higher than average
4

Introduction
scores in comparison to the TSI norm group. In other cases (e.g., survey projects), teachers complete the TSI and return it to the practitioner or researcher conducting organization-wide stress surveys. In such cases, and unless the respondent number is rather small, teachers may not receive individualized feedback. Teachers who have left the classroom to administrate full time should not complete the TSI. These individuals are directed to the school administrator stress research that has been conducted by Walter Gmelch and his colleagues at the University of Oregon and Washington State University (Gmelch, 1977). Preschool teachers, kindergarten teachers, and college professors should not use this version of the TSI.
The norms presented in Chapter 3 have been computed based on the data provided by an aggregate sample of 3,401 elementary and secondary teachers; thus, the TSI should be used only with teachers teaching in grades 1 through 12. The data derived from the aggregate sample were used to compute norms for both the Total Stress Score and the subscale scores. TSI Total Stress Score norms have also been established for regular education teachers (n = 962) and special education teachers (n = 2,352); thus the TSI can be used by teachers from either group. Male (n = 726) and female (n = 2,561) teacher norms have also been computed. Finally, norms have also been established for elementary (n = 791), middle school (n = 499), and secondary (n = 1,420) teachers; thus, teachers in any of these levels can be compared to their appropriate norm group. TSI users have the option of comparing respondent scores to the entire norm group, to one particular subsample (e.g., to the male teacher norms), or to both the aggregate sample and one or more subsamples.
Distinctions from Other Stress Models
The construct defined by the Teacher Stress Inventory is different in many respects from other models of stress and burnout that are frequently used in the human services professions.
5

TEACHER STRESS INVENTORY
Life Events
Numerous "life events" that cause and result in stress have been proposed by other investigators. Albrecht (1979) cited psychological factors, social pressures and challenges, physical factors, and relationships and transactions as major sources of stress. Additionally, one of the most widely used stress inventories-the Social Readjustment Rating Scale developed by Holmes and Rahe (1967)-has been frequently used to assess stress experienced by teachers and other human service workers. There is little doubt that some type of relationship exists between the stress prompted by everyday life and that experienced by teachers on the job. The factors that cause stress in the world of work, however, probably prove quite different in nature and magnitude from those experienced beyond the workplace. Holmes and Rahe's scale, for example, contains 43 items-only 6 of which have anything to do with work. Of these, none actually represent the day-to-day events experienced by teachers (unless, of course, one loses one's job on a daily basis). Thus, life events represent a different set of problems-and constructs-to the practitioner and researcher from those classed as "work events."
Work Events
In an attempt to define stress, Albrecht (1979) outlined a number of a priori sets of events more closely related to the world of work: workload, physical variables, job status, accountability, task variety, human contact, and physical and mental challenge. Though these variables are frequently discussed in the speculative literature, few attempts have been made to define them operationally in terms of psychometriC constructs. The development of the TSI is one such attempt to do so.
Burnout
Perhaps the most frequently used scale to assess teacher stress and burnout is the Maslach Burnout Inventory (MBI; Maslach &
6

Introduction
Jackson, 1981). Often overlooked by users of the MBI, however, is the fact that the MBI measures burnout, not stress. Though the two constructs are related, both conceptually and correlationaUy, they are nonetheless separate entities. Indeed, the burnout construct and its factors-emotional exhaustion, depersonalization, and a lack of personal accomplishment-are thought to be the end result of long-term stressful situations (Maslach, 1981). Thus, one cannot become "burned out" without experiencing intense stress for an extended period of time. Human nature being what it is, however, one does not usually "bum out" on the job if stress is experienced at moderate levels. Thus, the TSl assesses stress in terms of very different, and much more teacher-specific, factors than those that define the MBl
Role Stress
Other researchers, particularly those in the United Kingdom, have attempted to define occupational stress operationally in terms of the degree of conflict and ambiguity experienced in one's job. Following this work, numerous researchers in the United States have used these factors to predict burnout levels in both regular (Schwab, 1980) and special education (Crane, 1981) teachers. Based on the assumption that variables other than one's teaching role can aggravate stress levels, the TSl is composed of variables different from, and much more teacher-specific than, those measured by instruments used to assess role conflict and role ambigUity.
Type AlB Personalities
The personality of the worker has often been used to explain onthe-job stress levels. Type A personalities, usually assessed using inventories such as the Jenkins Activity Survey (Jenkins, Zyzanski, & Rosenman, 1979), are typically characterized as harddriving, ambitious, competitive, and overinvolved in their jobs and life endeavors; their Type B counterparts are usually de
7

TEACHER STRESS INVENTORY
scribed conversely. Based on these characteristics, the Type A personality should experience greater levels of stress and burnout on the job than do the Type Bs. Though Type A personalities, particularly those scoring high on the competitiveness factor, have been significantly linked to coronary problems, the actual link between personality and stress and burnout as assessed by measures such as the TSI and MBI has yet to be adequately researched.
Summary
The Teacher Stress Inventory is a 49-item, 10-factor instrument that assesses the degree of strength of occupational stress experienced by American teachers in the public schools. Special and regular education teachers across elementary, middle, and secondary school levels provided data for the development of the Inventory. The 5 stress source factors are Time Management, Work-Related Stressors, Professional Distress, Discipline and Motivation, and Professional Investment; the 5 stress manifestations factors are Emotional Manifestations, Fatigue Manifestations, Cardiovascular Manifestations, Gastronomic Manifestations, and Behavioral Manifestations. The 5 stress source and 5 stress manifestations subscale scores can be summed and divided by 10 in order to derive a Total Stress Score. The stressful events measured by the Teacher Stress Inventory are different from those in other scales that address general stress or burnout in that the TSI assesses numerous stressful teaching events experienced on the job and in the schools.
8

2 INSTRUCTIONS FOR
ADMINISTRATION
Suggested Uses
The TSI can be used in one of three ways. First, it can be used individually by teachers wishing to assess their stress levels in comparison to the TSI norm group. Second, it can be used by teachers in group settings such as workshops. In this case, teachers assess their individual stress levels and compare these to the norm group. Significantly high stress scores in either dimension for any TSI factor indicate problems with stress requiring attention. Typically, the purpose for using the TSI in either of these fashions is to provide data to individual teachers. The third manner in which the TSI can be used is to conduct school-, system-, or statewide surveys of teacher stress. Under these conditions the TSI is employed by investigators to identify and assess stress problems at systems levels.
Test Setting
The test setting will vary depending on how the TSI is used. Because the Inventory can be completed and scored in about 15 minutes, individual teachers can do so in their classrooms, break
9

TEACHER STRESS INVENTORY
rooms, or at home. It is recommended, however, that the Inventory be completed at the worksite, in the environment in which the teacher spends the most time. In cases in which the TSI is to be completed at teacher stress workshops, it should be done so without collaboration or interaction with other teachers prior to the presentation of stress-related materials and facts. Every attempt should be made to control for response bias in the test environment. This can best be done by avoiding sensitizing teachers to the topic of stress, assuring respondent privacy and confidentiality, and attending closely to administration and scoring details.
Avoidance of Sensitization to Teacher Stress
Teachers have varying beliefs about work-related stress. To minimize the reactive effects of such beliefs and attitudes, it is important that the issue of teacher stress not be raised, presented, or discussed prior to TSI completion. For this reason also, the final version of the TSI is not labeled "Teacher Stress Inventory"; rather, it is entitled the "Teacher Concerns Inventory." Cover letters, if used in surveyor workshop work, may mention the topic of stress in passing but should not emphasize it; instead, practitioners and investigators usually mention "work-related problems." Once the Inventory has been administered to all respondents, it is then appropriate to discuss stress and the TSI assessment of stress-related work problems.
Assuring Respondent Privacy
Respondents should complete the TSI privately, without discussion or interaction with other respondents. Knowing a colleague's answer to a particular item or set of items could bias an individual's responses. Thus, repondents should be tested individually or in group sessions in which privacy is assured. As already mentioned, it is possible for the respondent to complete the TSI at home, but there are a number of limitations associated
10

Instructions for Administration
with this procedure. First, the mental set related to and attitudes about one's home may differ from those associated with work. Completing the TSI in a non-work-related environment, therefore, could bias the responses to particular items. Second, respondents' answers may be biased if they talk with other people such as significant others, friends, and wives or husbands. And third, the response rate may prove to be less than 100%, as is typically the case in survey work. Following up nonrespondents is not a simple task, in terms of both financial and human resources. Completing the TSI privately should help control for some of these potential sources of bias.
Assuring Respondent Confidentiality
Many of the issues addressed by the item content of the TSI are of a sensitive and personal nature. Because it is important that respondents feel comfortable (or at least not feel uncomfortable) coming to terms with and honestly expressing their true feelings about these issues, certain steps should be taken to assure the confidentiality of the information they are providing. Under the best of circumstances, the TSI should be completed on an anonymous basis. Doing so frees the respondent from worry about identification, particularly if the TSI is administered on a small group basis. It is not always possible or advantageous to administer the Inventory on an anonymous basis. In some cases identification may be required-in order to conduct longitudinal research or to provide feedback to workshop participants, for example. In such cases every effort should be made to use a code number (e.g., a contrived number or the respondent's social security number), a label (e.g., a contrived name), or some other form of identification that is not personally revealing.
Administering the Teacher Stress Inventory
The Teacher Stress Inventory is composed of 49 stress-related and 9 optional demographic items and takes about 15 minutes to
11

TEACHER STRESS INVENTORY
complete. It is self-administered, with simple directions for completion provided on the form. The respondent completes the 3page Inventory by circling the appropriate answer on the 1-to-5 rating scale, then summing and dividing scores. No special qualifications, techniques, or procedures are required of the examiner administering the TSI. Ideally, though, this person should be either a third-party nonparticipant or someone completely neutral about the problems that may be experienced at the school. The TSI should not be administered by a person in a position of power or authority at a given worksite. This may cause respondents to be less candid about work problems, even in situations in which the TSI is administered on an anonymous basis. It is the responsibility of the examiner to assure a test situation in which response bias is minimized and respondent privacy and confidentiality are assured.
Insuring Response Completion
It is important that respondents answer all test items. In situations in which the item is irrelevant to the particular role filled by the teacher, score the item as a 1 (1 = no strength; not noticeable). Computer programs used to assess TSI data should employ a "blank equals" convention, which can be recoded to compute a 1 for each missing value.
Scoring
The Teacher Stress Inventory is easily hand-scored. It consists of 10 subscales, each subscale being composed of three to eight items. Because numbers have to be added and divided, it is advisable to have a calculator readily available-particularly in workshops being conducted in a limited time frame. The following procedure is used to score the TSI:
1. Assure that each of the items has been rated. Irrelevant or otherwise uncompleted items should be rated 1.
12

Instructions for Administration
2. Score each subscale, one at a time. Then, note and follow the scoring directions at the end of each subscale. For example, sum the eight responses associated with Time Management, the first subscale on the TSL Then, divide this sum by the number of items in the subscale-in this case, by eight (8). This is the teacher's mean item score, also termed subscale score, for Time Management. Place this score in the circle adjacent to and to the right of the scoring directions.
3. Proceed to the remaining TSI subscales and continue this process until one mean item score is derived for each.
4. To compute the Total Stress Score, sum the mean item or subscale scores in each of the circles, then divide this value by 10, the total number of TSI subscales. Place this value in the diamond on the third and last page of the Inventory.
These mean item and total scores can then be interpreted using the procedure outlined in the following chapter.
13

3 TEST NORMS AND INTERPRETATION
The TSI uses a number of methods that assist teachers in determining where their test scores fit into the "larger picture." First, each teacher's Total Stress Score can be compared in a relative fashion with the anchor points on the 1-to-5 strength-rating scale. Second, a direct comparison of the Total Stress Score and the subscale scores can be made to those yielded by the aggregate norm group of 3,401 teachers to determine whether the respondent is experiencing significantly stronger or weaker stress than the "typical" teacher. Third, TSI total and subscale scores can be compared to the decile charts developed using the data provided by the norm sample. These comparisons can be made with respect to the entire group, to special education teachers, to regular education teachers, to male teachers, to female teachers, to elementary teachers, to middle school teachers, and/or to secondary teachers.
Relative Comparisons
One of the simplest and most practical means of obtaining a relative bearing with respect to a TSI Total Stress Score is to compare that score to the anchor points on which it was derived:
14

Test Norms and Interpretation
1 2 3 4 5 HOW no mild medium great major
STRONG strength; strength; strength; strength; strength; ? not barely moderately very extremely
noticeable noticeable noticeable noticeable noticeable
Because this score is near-normally distributed for both the special education teachers (mean = 2.59; median = 2.56) and the regular education teachers (mean = 2.64; median = 2.59), and since these values fall just short of the 3.0 "medium strength" mark, a score of 3.5 would place the strength of stress midway between medium and great strength, with the stressful events being moderately to very noticeable. Conversely, a score of 1.9 would place a respondent near the mild strength rating, with his or her stressful events being barely noticeable. Any total score at the higher end of the strength scale should be considered a potential problem.
Normative Data
Normative types of comparisons can be made by using either deciles or by comparing respondent scores with those yielded by the norm group.
Significant Differences Among TSI Scores
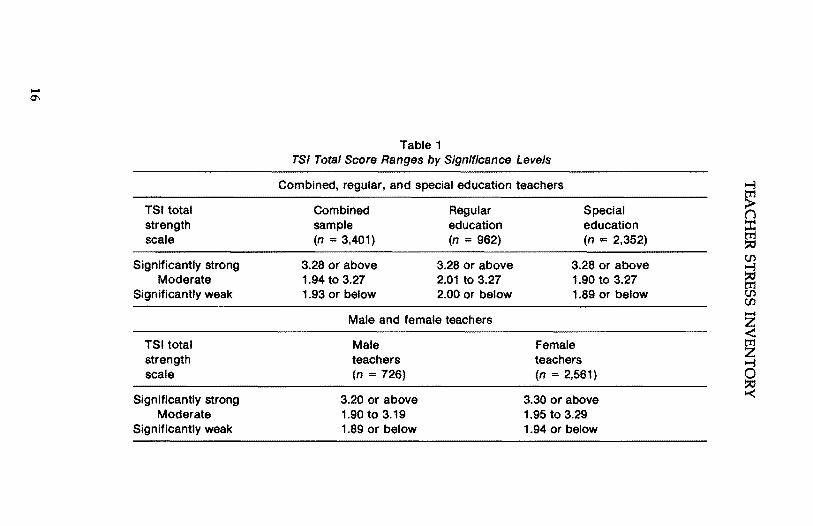
One additional means of determining the relative standing of a TSI respondent is by using the data displayed in Table 1 and/or the line graph shown in Figure 2. With respect to the range of significance levels for the Total Stress Score, an individual's Total Stress Score can be compared to the cut-off points presented in Table 1. This comparison can be made in relationship to the ranges established for the regular, special, and combined teacher groups; the ranges established for male and female teachers; and the ranges established for elementary, middle, and secondary school teachers. Cut-off points for significance levels (i.e., either
15
-'"
Table 1 TSI Total Score Ranges by Significance Levels
Combined, regular, and special education teachers
~ TSI total Combined Regular Special () strength sample education education ::r:: scale (n = 3,401) (n 962) (n = 2,352) ~
Significantly strong 3.28 or above 3.28 or above 3.28 or above r:.J)
Moderate 1.94 to 3.27 2.01 to 3.27 1.90 to 3.27 ~Significantly weak 1.93 or below 2.00 or below 1.89 or below r:.J)
Male and female teachers
~ TSI total strength
Male teachers
Female teachers Z
~ scale (n 726) (n = 2,561) o
~ Significantly strong 3.20 or above 3.30 or above Moderate 1.90 to 3.19 1.95 to 3.29
Significantly weak 1.89 or below 1.94 or below

Elementary, middle, and secondary teachers ~ tr>-~
TSI total strength
Elementary teachers
Middle school teachers
Secondary teachers
3 tr>
scale (n = 791) (n = 499) (n = 1,420) ~ Significantly strong 3.29 or above 3.40 or above 3.23 or above ;r
Moderate 1.91 to 3.28 2.11 to 3.39 1.96 to 3.22 ~ Significantly weak 1.90 or below 2.10 or below 1.95 or below
~ Note. Cut-off points for significance levels were set at ± 1 standard deviation around the mean of each sub o· sample . ~
...... "'-l

TEACHER STRESS INVENTORY
1 .5 o TirreMan
u(Strsrs Behav
.. SIS HIBH
o~AN
, SIG LOW
Figure 2. Graphic Representation of High-Low Cut-Off Points for
the TSI Subscale and Scale Mean Scores © 1988 CPPC. All rights reserved.
significantly lower or significantly higher than average) were set at ±1 standard deviation around the mean for each subsample. Significantly strong stress levels indicate that the respondent has scored at or above the 84th percentile; significantly weak stress levels indicate a score at or below the 16th percentile. Those teachers falling in the midrange for a given subsample (e.g., male teachers) are those experiencing moderate stress levels.
For the teacher wishing to make additional general comparisons of his or her scale and subscale scores to those of the norm group of 3,401 teachers, he or she should consider using Figure 2. This visual representation allows the teacher to graph his or her scores in comparison to (a) the average or mean score, (b) significantly high scores, and/or (c) significantly low scores for the entire norm sample. These cut-off points are based on one mean score and standard deviation derived for each of 10 subscale and the one total scores. One standard deviation above the mean signifies significantly strong stress; one standard deviation below the mean indicates significantly weaker stress.
18

Test Norms and Interpretation
These comparisons are best made using the following procedure:
1. Calculate the subscale and scale scores for each TSI subscale and scale.
2. Locate the "TimeMan" abbreviation for the Time Management subscale on Figure 2; place a large dot indicating the score from the Time Management subscale directly above the TimeMan abbreviation. Then, continue with the balance of the TSI subscale and scale scores; the order of abbreviations in Figure 2 corresponds to that of the subscales on the TSI. Then, connect the dots with a solid line.
3. Once the ratings have been entered and charted on Table 2, comparison interpretations can be made. Are the respondent's data points in the lighter midrange? If so, each and all of the scores fell in the "average" midrange. Strictly speaking, an average score for a subscale would fall directly on the diamond above the subscale's abbreviation; scores usually vary somewhat above or somewhat below the subscale mean score. If they stay within the lighter midrange, it can be said that the respondent experienced higher than average or lower than average, but not significantly higher or lower than average, stress levels. Should the score exceed either the higher or lower cut-off points and be placed within either one or the other of the shaded areas of Figure 2, then the respondent is experiencing either significantly stronger or significantly weaker than average stress levels.
Thus, a personalized profile of stress ratings can be developed and interpreted.
Deciles
So far the respondent has compared his or her score on only an a priori or very simple basis. How this score may stand in comparison with those of a variety of other teachers-whether they be regular or special education; male or female; or elementary, mid
19

TEACHER STRESS INVENTORY
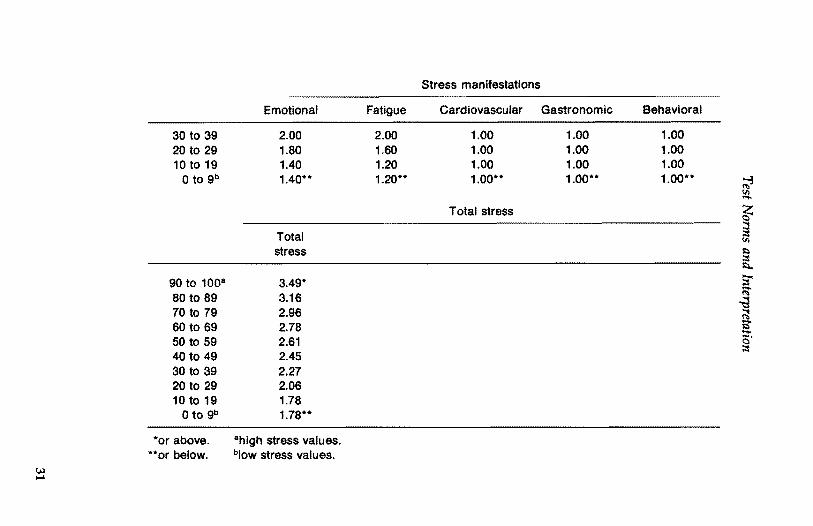
dIe, or secondary-is another important consideration that may warrant interpretation. Doing so requires the TsI user to make somewhat detailed normative comparisons. The norm group composition and size to which TsI respondent scores are being compared are profiled in the balance of the tables in Chapter 3. Because some of the stress subscales' distributions tend to be positively skewed (most notably Behavioral Manifestations, Gastronomic Manifestations, and Cardiovascular Manifestations), the subscale and scale scores are compared to decile ranges as opposed to individual percentiles.
These comparisons can be made at the reference group level, the gender level, and/or the grade level.
Reference Group Comparisons
Individual TsI respondents' subscale and scale scores can be compared to the norms established for the combined sample (n = 3,401), the regular education sample (n = 962), or the special education norm sample (n = 2,352), as appropriate.
1. Identify to which comparison group the respondent's scores will be compared: regular, special, and/or combined.
2. Identify the appropriate table for each of the reference groups: Table 2 for the combined sample, Table 3 for the regular sample, and/or Table 4 for the special education sample. Proceed to the appropriate table.
3. Note that on each table, the stress source subscales are listed across the top, the stress manifestations across the middle, and the total stress scores across the bottom. Identify the subscale/scale against which the comparison will be made. Under the subscale/ scale title is a range of potential scores. Find the score within the range that is immediately smaller than the actual TsI score; look to the leftmost column. This column indicates the decile range in which the respondent's score fell. The lower the decile range, the smaller the TsI score; the larger the TsI score, the higher the decile range.
20

Test Norms and Interpretation
Gender Comparisons
Individual TSI respondents' subscale and scale scores can be compared to the norms established for the male sample (n = 726) or the female sample (n = 2,561), as appropriate.
1. Identify to which comparison group the respondent's scores will be compared: male or female.
2. Identify the appropriate table for each of the reference groups: Table 5 for the male sample, Table 6 for the female sample. Proceed to the appropriate table.
3. Note that on each table, the stress source subscales are listed across the top, the stress manifestations across the middle, and the total stress scores across the bottom. Identify the subscale/scale against which the comparison(s) will be made. Under the subscale/scale title is a range of potential scores; find the score within the range that is immediately smaller than the actual TSI score; look to the leftmost column. This column indicates the decile range in which the respondent's score fell. The lower the decile range, the smaller the TSI score; the larger the TSI score, the higher the decile range.
Grade Level Comparisons
Individual TSI respondents' subscale and scale scores can also be compared to the norms established for the elementary school sample (n = 791), the middle school sample (n = 499), or the secondary school sample (n = 1,420), as appropriate.
1. Identify to which comparison group the respondent's scores will be compared: elementary, middle, or secondary.
2. Identify the appropriate table for each of the reference groups: Table 7 for the elementary sample, Table 8 for the middle school sample, or Table 9 for the secondary school sample. Proceed to the appropriate table.
3. As in previous examples, the stress source subscales are listed
21

N N
Table 2 TSI Subscale/Scale Decile Cut-Off Points for the Combined Sample (n = 3,401)
Stress sources
Decile Time Work-related Professional Discipline Professional range management stressors distress & motivation investment
I:Tj ~
90 to 1008
80 to 89 70 to 79 60 to 69 50 to 59 40 to 49 30 to 39 20 to 29 10 to 19
o to 9b
90 to 100· 80 to 89 70 to 79 60 to 69 50 to 59
4.25· 3.88 3.75 3.50 3.25 3.13 2.86 2.50 2.00 2.00**
Emotional
4.00* 3.60 3.20 2.80 2.60
4.33* 4.00 3.67 3.50 3.11 3.00 2.67 2.33 1.83 1.83**
Fatigue
4.00* 3.40 3.00 2.60 2.41
4.60· 4.50· 4.20 4.00 3.80 3.50 3.40 3.17 3.00 3.00 2.80 2.67 2.40 2.33 2.00 2.00 1.60 1.50 1.60** 1.50**
Stress manifestations
Card iovascu lar Gastronomic
3.33* 3.50* 2.67 2.67 2.33 2.00 2.00 1.67 1.67 1.33
4.00* 3.50 3.25 3.00 2.75 2.25 2.00 1.75 1.25 1.25**
Behavioral
2.25* 1.75 1.50 1.25 1.05
)n ::I:: I:Tj :::0 to ~ :::0 I:Tj to to-~ I:Tj
Z 0 ~
~

Stress manifestations
Emotional Fatigue Card iovascular Gastronomic Behavioral
40 to 49 2.20 2.20 1.33 1.00 1.00 30 to 39 2.00 1.80 1.00 1.00 1.00 20 to 29 1.60 1.50 1.00 1.00 1.00 10 to 19 1.20 1.20 1.00 1.00 1.00 o to 9b 1.20** 1.20" 1.00** 1.00** 1.00** ~
(I).... Total stress ~
Total stress
90 to 1008
80 to 89 70 to 79 60 to 69 50 to 59 40 to 49 30 to 39 20 to 29 10 to 19 o to 9b
3.48* 3.15 2.95 2.75 2.50 2.42 2.26 2.04 1.76 1.76**
~ (I)
$:l ;::t I:l.
;;.[ ~ S'.... §'
*or above. 8high stress values.
N **or below. blow stress values.
Vol

N .... Table 3
TSI Subsea/e/Scale Decile Cut-Off Points for Regular Education Teachers (n = 962)
Stress sources
Decile Time Work -related Professional Discipline Professional range management stressors distress & motivation investment
~
90 to 100· 4.38* 4.33" 4.60· 4.50" 4.25· m >
80 to 89 70 to 79
4.00 3.75
4.00 3.67
4.20 3.80
3.83 3.50
3.75 3.50
n ::r:: m
60 to 69 3.50 3.50 3.40 3.17 3.15 ~
50 to 59 3.31 3.17 3.00 3.00 2.75 en ~
40 to 49 30 to 39
3.13 2.88
3.00 2.83
2.80 2.60
2.67 2.39
2.50 2.25
~ m en 20 to 29 2.50 2.33 2.20 2.17 1.75 en-10 to 19 2.13 2.00 1.80 1.67 1.50
o to 9b 2.13* 2.00** 1.60** 1.67** 1.50** ~ Z
Stress manifestations ~ 0
Emotional Fatigue Cardiovascular Gastronomic Behavioral ~ 90 to 100a 4.00· 4.00· 3.33· 3.67· 2.50* 80 to 89 3.40 3.40 2.67 3.00 1.75 70 to 79 3.00 3.00 2.33 2.33 1.50 60 to 69 2.60 2.60 1.67 2.00 1.25 50 to 59 2.40 2.40 1.67 1.50 1.05 40 to 49 2.00 2.00 1.33 1.00 1.00

Stress manifestations
Emotional Fatigue Cardiovascular Gastronomic Behavioral
30 to 39 1.80 1.80 1.00 1.00 1.00 20 to 29 1.40 1.50 1.00 1.00 1.00 10 to 19 1.20 1.00 1.00 1.00 1.00
o to 9b 1.20** 1.00** 1.00** 1.00*" 1.00" ~ til-
Total stress ~ Total stress
90 to 1008
80 to 89 70 to 79 60 to 69 50 to 59 40 to 49 30 to 39 20 to 29 10 to 19
o to 9b
3.49* 3.16 2.95 2.73 2.59 2.45 2.30 2.11 1.81 1.81 **
~ li:)
i ~ ~ ~ it :::t. o ;:
*or above. 8high stress values. "or below. blow stress values.
N (JI

N 0
Table 4 TSI Subsca/e/Sca/e Decile Cut-Off Points for Special Education Teachers (n = 2,352)
Stress sources
Decile Time Work-related Professional Discipline Professional range management stressors distress & motivation investment
90 to 1008 4.25* 4.33* 4.60* 4.33* 4.00* ...., t'r1
80 to 89 70 to 79 60 to 69
3.88 3.75 3.50
4.00 3.67 3.40
4.16 3.80 3.40
4.00 3.50 3.17
3.50 3.25 2.75
:> () ::r: t'r1
50 to 59 3.25 3.17 3.00 2.83 2.50 :;0
40 to 49 3.13 3.00 2.80 2.50 2.25 rJ'l...., 30 to 39 20 to 29
2.75 2.50
2.67 2.25
2.40 2.00
2.17 2.00
2.00 1.75
:;0 t'r1 rJ'l
10 to 19 2.00 1.83 1.60 1.50 1.25 rJ'l-o to 9b 2.00** 1.83** 1.60** 1.50** 1.25**
~ Stress manifestations Z....,
Emotional Fatigue Cardiovascular Gastronomic Behavioral 0 ~
90 to 1008 4.00* 4.00* 3.33* 3.33* 2.25* 80 to 89 3.60 3.40 2.67 2.33 1.75 70 to 79 3.20 3.00 2.33 2.00 1.50 60 to 69 2.80 2.64 1.67 1.67 1.25 50 to 59 2.60 2.40 1.67 1.33 1.05 40 to 49 2.25 2.20 1.33 1.00 1.00

Stress manifestations
Emotional Fatigue Cardiovascular Gastronomic Behavioral
30 to 39 2.00 1.80 1.00 1.00 1.00 20 to 29 1.80 1.50 1.00 1.00 1.00 10 to 19 1.40 1.20 1.00 1.00 1.00
o to 9b 1.40" 1.20** 1.00" 1.00"* 1.00'" ~ I;/l....
Total stress t: ~ Total I;/l
stress ~ ;:t $::I.
90 to 100a 3.47* ;;r.... ~
80 to 89 3.14 ~ 70 to 79 60 to 69 50 to 59
2.94 2.75 2.56
~ a.... 5' ;:t
40 to 49 2.39 30 to 39 2.22 20 to 29 2.00 10 to 19 1.71 o to 9b 1.71**
·or above. ··or below. 8hlgh stress values. blow stress values.
N '1

00 N
Table 5 TS/ Subsea/e/Sca/e Decile Cut-Off Points for Ma/e Teachers (n = 726)
Stress sources
Decile Time Work-related Professional DIscipline Professional range management stressors distress & motivation investment
.....j
90 to 1008 4.13* 4.17* 4.40* 4.33* 4.25* ~ 80 to 89 3.88 3.83 4.20 3.83 3.75 n 70 to 79 60 to 69
3.50 3.25
3.50 3.33
3.80 3.50
3.50 3.17
3.50 3.05
::t tTJ ~
50 to 59 3.12 3.00 3.20 3.00 2.75 CIl 40 to 49 2.88 2.83 2.80 2.67 2.50 .....j
~ 30 to 39 20 to 29
2.58 2.25
2.50 2.17
2.60 2.00
2.39 2.00
2.25 1.75
tTJ CIl CIl
10 to 19 1.88 1.67 1.70 1.67 1.45 ,.... o to 9b 1.88** 1.67** 1.70** 1.67** 1.45** ~ Stress manifestations .....j
a Emotional Fatigue Cardiovascular Gastronomic Behavioral ~
90 to 100· 3.80* 4.00* 3.33· 3.67· 2.75* 80 to 89 3.20 3.20 2.67 3.00 2.00 70 to 79 3.00 2.80 2.33 2.33 1.50 60 to 69 2.60 2.50 1.67 2.00 1.25 50 to 59 2.40 2.20 1.67 1.50 1.25 40 to 49 2.00 2.00 1.33 1.00 1.00

Stress manifestations
Emotional Fatigue Card lovascu lar Gastronomic Behavioral
30 to 39 1.80 1.60 1.00 1.00 1.00 20 to 29 1.40 1.40 1.00 1.00 1.00 10 to 19 1.20 1.00 1.00 1.00 1.00 oto 9b 1.20" 1.00" 1.00" 1.00" 1.00" ~
~-Total stress ~
Total stress
90 to 1008
80 to 89 70 to 79 60 to 69 50 to 59 40 to 49 30 to 39 20 to 29 10 to 19
oto 9b
3.41* 3.09 2.83 2.65 2.49 2.34 2.19 1.98 1.71 1.71**
~ ~
I::) ;:it $:I..
;r .[ ~ o· ;:it
·or above. 8hlgh stress values. "or below. blow stress values.
N \Q

Y.l 0
Table 6 TSI Subseale/Sca/e Decile Cut-Off Points for Female Teachers (n = 2,561)
Stress sources
Decile Time Work -related Professional Discipline Professional range management stressors distress & motivation investment ....,
90 to 100· 80 to 89
4.25* 4.00
4.33· 4.00
4.60· 4.20
4.50· 4.00
4.00· 3.50
rl1 >(j
70 to 79 3.75 3.67 3.80 3.50 3.25 ::r:: rl1
60 to 69 3.50 3.50 3.40 3.17 3.00 ~
50 to 59 3.25 3.25 3.00 3.00 2.50 (J)...., 40 to 49 3.13 3.00 2.80 2.67 2.25 ~ 30 to 39 2.88 2.67 2.60 2.33 2.00 rl1
(J)
20 to 29 2.57 2.33 2.00 2.00 1.75 (J)
10 to 19 2.13 2.00 1.60 1.50 1.25 ..... o to 9b 2.13*· 2.00" 1.60" 1.50" 1.25" ~
Stress manifestations Z...., 0
Emotional Fatigue Cardiovascular Gastronomic Behavioral ~ --<
90 to 100" 4.00· 4.00* 3.33· 3.50· 2.25· 80 to 89 3.60 3.50 2.67 2.67 1.75 70 to 79 3.20 3.00 2.33 2.00 1.50 60 to 69 3.00 2.80 2.00 1.67 1.25 50 to 59 2.60 2.50 1.67 1.50 1.05 40 to 49 2.23 2.20 1.33 1.33 1.00
Stress manifestations
Emotional Fatigue Cardiovascular Gastronomic Behavioral
30 to 39 2.00 2.00 1.00 1.00 1.00 20 to 29 1.80 1.60 1.00 1.00 1.00 10 to 19 1.40 1.20 1.00 1.00 1.00 o to 9b 1.40" 1.20** 1.00** 1.00·· 1.00·· ~
III-Total stress ~ ~ Total III
stress 1i:I ;::!
90 to 1008
80 to 89 70 to 79 60 to 69 50 to 59 40 to 49 30 to 39 20 to 29 10 to 19
o to 9b
3.49" 3.16 2.96 2.78 2.61 2.45 2.27 2.06 1.78 1.78··
~
S'
-d ~
E"-~ c· ;::!
·or above. 8high stress values. "or below. blow stress values.
w ....

I'.>J N
Table 7 TSI SubsealelScaie Decile Cut-Off Points for Elementary Teachers (n = 791)
Stress sources
Decile range
Time management
Work-related stressors
Professional distress
Discipline & motivation
Professional investment
~ 90 to 1008 4.38· 4.33· 4.60· 4.40· 4.00· ~ 80 to 89 4.00 4.00 4.00 3.83 3.50 70 to 79 3.75 3.67 3.80 3.50 3.25
n:r: 60 to 69 3.50 3.50 3.40 3.17 3.00 ~ 50 to 59 3.38 3.33 3.00 2.83 2.50 Ul
~40 to 49 3.13 3.00 2.80 2.50 2.25 30 to 39 2.88 2.80 2.40 2.17 2.00 rn20 to 29 2.50 2.33 2.00 1.83 1.75 Ul 10 to 19 2.00 2.00 1.60 1.33 1.25 -oto 9b 2.00·· 2.00·· 1.60·· 1.33·· 1.25·· ~
Stress manifestations Z ~ 0
Emotional Fatigue Cardiovascular Gastronomic Behavioral ~ 90 to 1008 4.20· 3.80· 3.33· 3.39· 2.00· 80 to 89 3.60 3.40 2.67 2.33 1.75 70 to 79 3.20 3.00 2.00 2.00 1.50 60 to 69 3.00 2.60 2.00 1.67 1.25 50 to 59 2.60 2.41 1.67 1.33 1.05 40 to 49 2.20 2.00 1.33 1.00 1.10

Stress manifestations
Emotional Fatigue Cardiovascular Gastronomic Behavioral
30 to 39 2.00 1.80 1.00 1.00 1.00 20 to 29 1.80 1.50 1.00 1.00 1.00 10 to 19 1.40 1.20 1.00 1.00 1.00 o to 9b lAO" 1.00·· 1.00" 1.00·· 1.00·· ~
<:II-Total stress ~ Total stress
90 to 100a 80 to 89 70 to 79 60 to 69 50 to 59 40 to 49 30 to 39 20 to 29 10 to 19
o to 9b
3.51" 3.15 2.99 2.76 2.59 2.44 2.27 2.02 1.72 1.72··
~ <:II
I:l :::t ~
;:r ~
1-c· :::t
·or above. ahigh stress values.
<:.oJ "or below. blow stress values.
<:.oJ

<...l
"'" Table 8 TSI SubscafelScafe Decile Cut-Off Points for Middfe Schoof Teachers (n = 499)
Stress sources
Decile Time Work -related Professional Discipline Professional range management stressors distress & motivation investment ....:j
~ 90 to 1008
80 to 89 4.38* 4.00
4.50* 4.00
4.60* 4.20
4.68* 4.00
4.00* 3.65
n ::r.:
70 to 79 3.88 3.83 4.00 3.83 3.25 tr1 ~
60 to 69 50 to 59 40 to 49 30 to 39
3.75 3.50 3.25 3.12
3.50 3.33 3.17 3.00
3.60 3.20 3.00 2.60
3.50 3.33 3.00 2.67
3.00 2.75 2.33 2.00
(/'J
;a rn (/'J
20 to 29 2.75 2.67 2.20 2.17 1.75 .... 10 to 19 2.25 2.25 1.80 1.83 1.50 ~ o to gb 2.25·* 2.25.... 1.80" 1.83** 1.50*· tr1
Z Stress manifestations
....:j
0 Emotional Fatigue Cardiovascular Gastronomic Behavioral ~
90 to 1008 4.20· 4.00* 3.67· 3.33* 2.10· 80 to 89 3.80 3.60 2.67 2.33 1.75 70 to 79 3.20 3.20 2.33 2.00 1.50 60 to 69 3.00 2.80 2.00 1.33 1.25 50 to 59 2.80 2.40 1.67 1.20 1.05 40 to 49 2.56 2.20 1.33 1.00 1.00

Stress manifestations
Emotional Fatigue Cardiovascular Gastronomic Behavioral
30 to 39 20 to 29 10 to 19
oto 9b
90 to 10080 to 89 70 to 79 60 to 69 50 to 59 40 to 49 30 to 39 20 to 29 10 to 19
oto 9b
2.20 2.00 1.40 1.40""
Total stress
3.61" 3.29 3.08 2.88 2.74 2.55 2.41 2.20 1.98 1.98"*
1.80 1.00 1.00 1.00 1.60 1.00 1.00 1.00 1.20 1.00 1.00 1.00 1.20"" 1.00** 1.00"" 1.00"*
Total stress
~ <:n.... ~ ~ ;:.
5.. S" ~ a;:. :1". <::> ~
·or above. -high stress values. ""or below. blow stress values.
W QI

W 0\
Table 9 TSI Subsea/e/Sca/e Decile Cut-Off Points for Secondary Teachers (n = 1,420)
Stress sources
Decile Time Work-related Professional Discipline Professional ...,range management stressors distress & motivation investment
~ 90 to 1008
80 to 89 4.25* 3.88
4.33* 4.00
4.60* 4.20
4.33* 3.83
4.00* 3.75
n:r: 70 to 79 3.75 3.67 3.80 3.50 3.25 trl
:::tI 60 to 69 50 to 59 40 to 49
3.50 3.25 3.00
3.50 3.12 3.00
3.40 3.20 2.80
3.17 2.83 2.50
3.00 2.75 2.50
en..., :::tI trl
30 to 39 20 to 29
2.75 2.40
2.67 2.33
2.40 2.00
2.23 2.00
2.25 1.75
en en-10 to 19 2.00 2.00 1.60 1.68 1.50 ~o to 9b 2.00** 2.00** 1.60** 1.68** 1.50** Z...,
Stress manifestations 0 ~ Emotional Fatigue Cardiovascular Gastronomic Behavioral
90 to 1008 3.83* 4.00* 3.33* 3.40* 2.50* 80 to 89 3.40 3.40 2.67 2.67 1.75 70 to 79 3.00 3.00 2.33 2.00 1.50 60 to 69 2.60 2.75 2.00 1.67 1.25 50 to 59 2.40 2.40 1.67 1.33 1.25 40 to 49 2.20 2.20 1.33 1.00 1.00

Stress manifestations
Emotional Fatigue Cardiovascular Gastronomic Behavioral
30 to 39 1.80 1.80 1.00 1.00 1.00 20 to 29 1.60 1.50 1.00 1.00 1.00 10 to 19 1.20 1.20 1.00 1.00 1.00
oto 9b 1.20" 1.20" 1.00" 1.00** 1.00** ~ t.I>....
Total stress ~ Total stress
90 to 1008
80 to 89 70 to 79 60 to 69 50 to 59 40 to 49 30 to 39 20 to 29 10 to 19
o to 9b
3.41* 3.12 2.93 2.73 2.56 2.41 2.27 2.05 1.80 1.70·*
~ t.I>
lI::I ;::: $:l,.
~ ..;j ~ i::r.... o· ;:::
*or above. Shigh stress values.
W "or below. blow stress values.
'-l

TEACHER STRESS INVENTORY
across the top, the stress manifestations across the middle, and the total stress scores across the bottom. Identify the subscale/scale against which the comparison(s) will be made. Under the subscale/scale title is a range of potential scores; find the score within the range that is immediately smaller than the actual TSI score; look to the leftmost column. This column indicates the decile range in which the respondent's score fell. The lower the decile range, the smaller the TSI score; the larger the TSI score, the higher the decile range.
TSI subscale or scale scores that fall in the higher ranges for any of these subsamples should act as a source of recommendations for potential interventions; problems with Time Management, for example, should prompt the teacher's attention to any number of time management skills that can be acquired with time and practice.
38

4 INVENTORY
DEVELOPMENT
As is the case with many instruments, the Teacher Stress Inventory has undergone an evolutionary process of development. Accordingly, during the first few years of its inception, the TSI was modified twice. Psychometric procedures outlined by Nunnally (1978) and Gable (1986) were used to refine the TSI.
Teacher Stress Scale
The first version of the TSI was a pilot form of the instrument called the Teacher Stress Scale. With respect to the preliminary content validity of the scale, Fimian first summarized the available literature during 1979. Finding 135 sources and manifestations of teacher stress, he then categorized these into one or more of 13 a priori factors (Fimian, 1982). Then, using the preliminary content validation procedures described in greater detail later in this chapter, an initial item pool was developed. This final list of 63 usable items was used to develop the next and pilot form of the TSI, also termed the Teacher Stress Scale.
The 63-item Teacher Stress Scale was then used in the first round of factor validations. Following earlier work conducted by Maslach and Jackson (1981), two likert-type measures for each of
39

TEACHER STRESS INVENTORY
the 63 items were adopted: one each for the strength and frequency dimensions. The stress strength scale ranged from 1 (no strength, not noticeable) to 5 (major strength, extremely noticeable). This subjective measure allowed teachers to rate the degree of perceived impact each item would have upon a teacher's overall stress level. Based on this scale, items rated 3, 4, or 5 would be the most significant contributors to teachers' overall stress levels. Thus, respondents did not signify the absence or presence of on-the-job stress, but instead indicated the degree of stress strength experienced. Concurrently, a 7-point likert-type scale was developed to assess the frequency with which the stressful events were experienced in the workplace. This objective frequency scale ranged from 1 (never) to 7 (every day). High ratings on this scale would indicate that the stressful event was experienced relatively often. These rating scales were used on the subsequent version of the TSI. An additional 8 personal and 13 professional information items were also included on a front cover of the form.
The Teacher Stress Scale was then distributed to 365 special education teachers from Connecticut. Submitting these data to principal components factor analyses followed by oblique and varimax rotations, 30 of the original 63 items were retained. Seven factors resulted that explained 70% of the strength and 64% of the frequency variance associated with the item interrelationships; factors were identical for both the strength and frequency dimensions. These were termed Personal/Professional Stressors, Professional Distress, Discipline and Motivation, Emotional Manifestations, Biobehavioral Manifestations, and PhYSiological-Fatigue Manifestations. These 30 items were retained and acted as the core of the new version of the scale, now termed the Teacher Stress Inventory (Fimian, 1985).
The Initial Form of the Teacher Stress Inventory
This initial form of the Teacher Stress Inventory was used to survey both regular and special education teachers from Vermont. Prior to this study, 12 conceptually similar items were added to
40

Inventory Development
the factors whose reliability estimates proved lowest, for a total of 42 items. This longer version of the TSI, using the same two Ukert-type scales to assess the strength and frequency dimensions, was then distributed to the Vermont regular and special education teachers during the 1980-81 public school year. Based on the responses gathered from these teachers, an additional round of factor analyses was conducted. Using these new data, and based on the same factor and reliability analyses used with Connecticut teacher data, one of the additional items was deleted from the item pool, resulting in a 41-item form. Factor patterns and structure and alpha reliability estimates were nearly identical to those found in the Connecticut study. Thus, the 41-item TSI form was established (Fimian, 1984b).
Concurrently, and based on the content appraisal feedback obtained from the 226 stress experts described later in this chapter, one additional a priori factor consisting of 8 items related to time and time management problems was added to the TSI. These items, adapted from Truch (1980) and modified to reflect teaching concerns, were termed "Time Management" and added to the TSI in early 1982, increasing the item n from 41 to 49. Since then this longer form has been used with 17 additional samples.
In this initial form of the TSI there were two dimensions being assessed: strength and frequency. Because the two dimensions were moderately t6 strongly correlated to one another (Fimian & Zacherman, 1987), some TSI users opted to use only one or the other dimension by using specially developed strength-only or frequency-only TSI forms to assess only the one preferred dimension and to make inferences about the other. Were the TSI strength and frequency dimensions adequately related to one another to warrant the use of either the strength-only or frequency-only form in place of the strength-and-frequency version? Fimian and Zacherman (1987) found substantial positive correlations between the frequency and strength subscale and scale scores. Based on data collected from 14 samples, subscale correlations ranged from a low of .30 to a high of .99, with only one nonsignificant correlation out of over 90 possibilities; in only 1% of the time did a frequency factor not correlate significantly with its strength analogue. Similar findings were evident with respect
41

TEACHER STRESS INVENTORY
to the relationships between the Total Strength and Total Frequency scores. In light of these data, the frequency dimension was dropped from further use during the Fall of 1987, and final factor and reliability analyses were conducted at the time on the aggregate data pool (n = 3,401) using only the strength data.
The Current and Final Form of the Teacher Stress Inventory
Based on the analyses conducted on the data aggregated from 21 different teacher samples, and reported in both this chapter and in Fimian and Fastenau (1987), five stress source and five stress manifestation factors were identified. Sequenced in strong-toweak order of their relative impact upon teachers, these are Time Management, Work-Related Stressors, Professional Distress, Discipline and Motivation, Professional Investment, Emotional Manifestations, Fatigue Manifestations, Cardiovascular Manifestations, Gastronomic Manifestations, and Behavioral Manifestations. Collectively, these define the construct termed "teacher stress" in the balance of this manual and form the basis for the final form of the TSI.
Item Selection and Analysis
Evidence for the face, content, factorial, and convergent validity of the Teacher Stress Inventory has been collected.
Face Validity
With respect to the face validity of the TSI, Fimian (1982) first summarized the available literature during the fall of 1979 and found 135 sources and manifestations of teacher stress. These stressors were then categorized into 1 of 13 a priori factors: (a) Personal Competence, (b) Self-Relationship, (c) Conflicting Values, (d) Social Approval, (e) Isolation, (f) Expectations, (g) SelfFulfillment, (h) Environmental, (i) Unmet Professional Needs, (j)
42

Inventory Development
Self-Inflicted Stress, (k) Professional Constraints, (1) StudentTeacher Relationships, and (m) Miscellaneous Demands of Teaching. Redundant and conceptually similar items were combined or deleted from the item pool, resulting in a list of 79 items. Each item was then placed on an index card. These were distributed, individually or in small groups, to 2 faculty members and 14 graduate students from the University of Connecticut College of Education and to 16 teachers from local school districts. Respondents were asked to sort the cards into two piles: one for items most related to teacher stress and the other for items less related to stress. Related items were logged on a master list, and a check mark was recorded each time an item was selected as relevant. The teachers also provided informal written feedback about the appropriateness of item inclusion in the next version of the TSl Judgmental screening and editing of the appraisal samples' selections from the list of 79 items resulted in a rank order of items based on the frequency of selection. The final list of 63 usable items represented 80% of the initial 79 items and was used to develop the TSI pilot form called the Teacher Stress Scale.
Factorial Validity
One means of establishing the construct validity of any instrument is to establish its factorial validity. The purpose of factor analysis is "to examine empirically the interrelationships among the items and to identify clusters of items that share sufficient variation to identify their existence as a factor or construct to be measured by the instrument" (Gable, 1986, p. 85). Thus, if there are factors underlying the data collected from different teacher samples, these would become evident using factor analytic techniques.
Early Work
Following procedures suggested by Nunnally (1978) and outlined by Gable (1986), a number of studies were conducted that
43

TEACHER STRESS INVENTORY
would examine the factorial validity of the Teacher Stress Inventory. The first, conducted on the Connecticut data collected using the Teacher Stress Scale pilot form, resulted in a six-factor solution (Fimian, 1985). Then, with the additional items added to the pilot form, the second set of factor analyses was conducted using this pilot form to collect data from the Vermont teachers; this, too, resulted in the six-factor version of the TSI form (Fimian, 1984b).
Recent Work
The initial version of the TSI was used for the next 5 years in a number of workshops, research projects, and dissertations. The data collected from these projects were pooled to form an aggregate sample of 3,401 regular and special education teachers.
Samples. These teachers, representing 21 individual samples from eight states, provided data for the most recent round of TSI development activities. Sample designations, descriptions, and related information are presented in Table 10. Of these, 13 samples' inventories were distributed through the mail; the balance of the data were collected either at workshops or through regional surveys. More detailed information regarding these samples can be found in Fimian (1983), Courtney (1987), Honaker (1987), and Zacherman (1984). Of these 3,401 teachers, 743 were included in "all regular teachers" samples, 1,778 were included in "all special education teacher" samples, and 880 were grouped in combined special/regular teacher samples; of this last group, 88 were unclassifiable, and the majority were special education teachers. Thus, the final counts were 960 (regular education), 2,353 (special education), and 88 (unclassified by group), for a total of 3,401 teachers.
The majority of the teachers in the norm sample were female (n = 2,561; 75%), and the balance were male (n = 726; 21%; some percentages may not sum to 100% due to missing cases and/or rounding error). Many were in their twenties (n = 1,292; 38%), with the remainder in their thirties (n = 1,398; 41%), their forties
44

Inventory Development
Table 10 Teacher Stress Inventory Samples
Sample Condition Date Sample Total
Regular education teachers
North Carolina North Carolina Vermont North Carolina North Carolina
Workshop Workshop Statewide survey Workshop Statewide survey
1987 1986 1981 1987 1987
24 17
435 47
220 Subtotal 743
Special education teachers
Georgia Georgia Vermont Vermont Connecticut North Carolina North Carolina North Carolina North Carolina North Carolina
Workshop Workshop Statewide survey Statewide survey Statewide survey Statewide survey Reliability study Workshop Statewide survey Statewide survey
1985 1985 1980 1981 1980 1986 1986 1987 1986 1987
39 39
371 371 365 266 98 15
126 88
Subtotal 1.778
Combined samples
New York West Virginia Alabama North Carolina North Carolina North Carolina
Citywide survey Regional survey Regional survey Regional survey Workshop Workshop
1982 1987 1987 1987 1987 1987
249 131 154 267 53 26
Subtotal Total
880 3,401
Note. Some totals in the narrative may differ from these due to the redistribution of special and regular education teachers from the combined sample to their appropriate sample.
45

TEACHER STRESS INVENTORY
(n = 386; 11%), or fifty or older (n = 164; 8%). They included secondary school teachers (n = 1,420; 42%), elementary school teachers (n = 791; 23%), or middle school teachers (n = 499; 15%). The majority had less than 10 years' experience (n = 2,092; 62%), whereas the balance reported more. The minority reported teaching fewer than 20 students per day (n = 1,008; 37%), and the rest reported more than 20 (n = 1,728; 51%). A minority had achieved a bachelor's degree (n = 450; 13%), the balance an advanced degree.
Statistical analyses. Based on the teacher data, and in order to identify stress factors, preliminary principal components factor analyses were conducted and followed by Oblique and varimax rotations using the stress strength data collected in questions 1 through 49, according to an instrument development model proposed elsewhere (Child, 1970; Nie, Hull, Jenkins, Steinbrenner, & Bent, 1975) and later expanded upon by Gable (1986). Then, the internal consistency reliability estimates for the TSI subscales and scale were examined using Cronbach's coefficient alpha (Hull & Nie, 1981; Nunnally, 1978). Once valid and reliable TSI subscales and scores were identified, the relationships among these were investigated using Pearson product-moment correlational analyses. The factorial validity of the revised TSI was examined using the 49 TSI items. Preliminary principal components analyses were conducted and followed by oblique and varimax rotations. Based on the 49-by-49 item intercorrelation matrix and the principal components analyses, 10 factors for the stress strength dimension emerged that accounted for 58% of the stress variance; only factors with eigenvalues exceeding 1.0 were retained. An initial inspection of the factor patterns indicated 10 discrete factors.
Then, one set of selection criteria was applied to each of the 49 items. Items were retained that (a) had factor loadings of .35 or greater on the stress strength dimension, (b) loaded clearly on only one factor (i.e., simple structure was achieved), and (c) contributed to the subjective interpretability of the particular factor on which the item loaded.
Once the factors were identified, the TSI's internal consistency or alpha reliability estimates were then examined. One estimate
46

Inventory Development
was generated for each of the 10 stress strength subscales. Also, one estimate was generated for the total group of items. Then, any item that did not reduce the internal consistency reliability of the particular subscale in which it was nested was retained. Factors whose alpha reliability estimates exceeded .60 were retained; exploratory alpha ranges of .60 to .90 for the TSI subscales and .85 to .95 for the TSI scale were targeted. Final acceptance or deletion of the TSI items, therefore, was based on a combination of findings from each of the analyses. Items were kept that were not only valid in terms of subscale/scale factorial validity, but also reliable in terms of subscale/scale internal consistency reliability.
Results. Table 11 contains the 49 retained and abbreviated item stems with their communalities and component loadings derived from the oblique rotations for the stress strength measures for each of 10 resulting factors. Employing a root criterion of unity, the 10-component solution derived from the strength item scores accounted for 58% of the total stress strength variance associated with the item interrelationships. It was evident from Table 11 that (a) 10 discrete and interpretable factors resulted and (b) of the original 49 items, all exceeded the .35 loading criterion with all but 2 exceeding .40. Thus, no items were deleted from the pool. All items included in the initial form of the TSI were retained for the final form.
The percentage of explained variance per factor was then calculated by summing each of the squares of their correlation coefficients listed on the varimax factor correlation matrix and then dividing this sum by the number of entries (i.e., 49); perfactor contributions were then summed. Lotus 1-2-3 (Version 2.0) was used to conduct all calculations.
Since only the stress strength dimension was under investigation, one total score for that dimension was developed using the item mean data. Also, since the stress strength dimension is collectively defined in terms of the 10 factors, item mean scores were used to develop 10 conceptually similar subscales. Subscale scores were derived by first summing the item scores for the stems nested within each subscale and then dividing the resulting value by the number of items in that particular subscale. In this
47

00 ,p.
Table 11 Scale Numbers, Abbreviated Items, Component Loadings, Item Means,
and Standard Deviations for the 10-Factor Solution
Item Abbreviated Component no. item stem loading Communality M SO
Factor I: PROFESSIONAL INVESTMENT o-j tTl
11. 13. 14. 15.
Personal opinions not sufficiently aired Lack control over decisions Not emotionally/intellectually stimulated Lack opportunities for improvement
.548
.53
.44
.39
.57
.55
.42
.37
2.6b
3.0 2.5 2.7
1.3 1.4 1.3 1.4
:> n:r: tTl :;:;:l (J) o-j
Factor II: BEHAVIORAL MANIFESTATIONS :;:;:l tTl
29. Using over-the-counter drugs .77 .71 1.4 0.9 (J) (J)
28. 31. 27.
Using prescription drugs Using alcohol Calling in sick
.73
.69
.37
.70
.71
.54
1.4 1.4 1.5
1.0 0.9 1.0
...... Z <: tTl Z o-j
47. Easily overcommit myself
Factor III: TIME MANAGEMENT
.70 .48 3.2 1.3
0 :;:;:l -<
45. Become impatient .70 .53 3.1 1.2 44. Do more than one thing at a time .68 .57 3.6 1.2 46. Have little time to relax .67 .62 3.7 1.2 48. Think about unrelated matters .66 .54 2.8 1.2 49. Feel uncomfortable wasting time .66 .48 3.6 1.3 43. Not enough time to get things done .58 .59 3.5 1.3 42. Rush in my speech .45 .36 2.4 1.3

Factor IV: DISCIPLINE AND MOTIVATION
17. Discipline problems in my classroom .79 .64 2.7 1.3 16. Having to monitor pupil behavior .77 .64 3.0 1.4 19. Students who would do better if they tried harder .77 .58 3.2 1.3 18. Teaching students who are poorly motivated .76 .59 3.3 1.3 20. Inadequate or poorly defined discipline policies .62 .46 2.7 1.4 21. Authority rejected by pupils/admlnistrators .61 .55 2.7 1.4
Factor V: EMOTIONAL MANIFESTATIONS
22. 24. 23.
Feeling insecure Feeling vulnerable Feeling unable to cope
.86
.84
.74
.69
.69
.64
2.5 2.4 2.4
1.3 1.3 1.3
~ <::! ~ ;::s-c
25. Feeling depressed .69 .63 2.8 1.3 ~ 26. Feeling anxious .65 .57 3.0 1.3 t:l
~
Factor VI: WORK-RELATED STRESS <::! ll. c ~
1. 3.
Little time to prepare Too much work to do
.70
.68 .58 .59
3.1 3.4
1.3 1.2
;: ~ ;::s-5. School day pace is too fast .67 .48 2.7 1.3
4. Caseload/class is too big .66 .47 2.8 1.4 2. Personal priorities being shortchanged .58 .50 3.3 1.3 6. Too much administrative paperwork .43 .32 3.7 1.3
Factor VII: GASTRONOMIC MANIFESTATIONS
34. Stomach pain of extended duration .83 .79 1.7 1.1
.,.. \0
35. 39.
Stomach cramps Stomach acid
.86
.82 .78 .67
1.7 1.9
1.1 1.3

0 U1 Table 11
(Continued)
Item Abbreviated Component no. item stem loading Communality M SD
Factor VIII: CARDIOVASCULAR MANIFESTATIONS ..., 32. Feelings of increased blood pressure .78 .66 1.9 1.3
~ 33. Feelings of heart pounding or racing 30. Rapid/shallow breath
.75
.62 .69 .64
2.1 1.6
1.3 1.1
() ::r:
Factor IX: FATIGUE MANIFESTATIONS
40. Sleeping more than usual .69 .59 2.2 1.3
trl :::tI (Jl
;a 41. Procrastinating .65 .55 2.6 1.3 !:Tj
r.J)
38. Becoming fatigued in short time .58 .68 2.6 1.4 r.J)
36. Physical exhaustion 37. Physical weakness
.47
.39
Factor X: PROFESSIONAL DISTRESS
. 67
.58 3.0 2.1
1.4 1.3
..... Z -<!:Tj
Z..., 0
7. Lack promotion or advancement opportunities 8. Not progresSing rapidly in job
.77
.68 .64 .59
2.9 2.5
1.5 1.4
:::tI ><
9. Need more status and respect .65 .62 3.0 1.4 12. Receive an inadequate salary .62 .49 3.7 1.4 10. Lack recognition .51 .55 3.3 1.4
Sitems have been sequenced from the largest to smallest component loading within factors. bltem means have been adjusted for missing cases, then rounded off to the nearest tenth. Means are based on the following rating scale: 1 = no strength, not noticeable; 3 = medium strength, moderately noticeable; 5 = major strength, extremely noticeable.

Inventory Development
fashion, each subscale's score falls within the 1-to-5-point strength range. Thus, the relative strength of each collective body of stressful events (hereafter termed "subscale'') can be easily interpreted. Insofar as the overall stress experienced by teachers is operationally defined as the relative strength with which all 49 events are experienced, the 10 stress strength subscale scores were first summed and then divided by the total number of stress factors for a Total Stress Strength Score. By so doing, the resulting Total Stress Strength Score should fall within the 1-to-5-point strength range, and the relative strength of stressful events can be easily interpreted.
Content Validity
Five samples of experts provided data once each in one of five summers to establish the content validity of the TSI (Fimian, 1987a). An "expert" was defined as one who was knowledgeable about teacher stress and burnout. Each had (a) authored one or more stress articles, monographs or books; (b) conducted quantitative, qualitative, and/or combination stress research; and/or (c) conducted stress management workshops for practitioners. The samples' data were pooled; thus, the aggregate sample of 226 experts, representing 62% of the surveys distributed between 1980 and 1984, was used in this content validation. Return rates, though moderate and varying in size, are typical in comparison to voluntary self-report stress studies conducted prior to 1982 (Fimian, 1983). The majority of the respondents were male (64%); below the age of 40 (62%); had taught children at one time for more than 5 years (72%); had received or were completing their doctoral degree (96%); had presented stress management workshops to practitioners (63%); had authored one or more stressrelated works (62%; place and type of publication undetermined); and had conducted some type of stress research (56%) of a quantitative (27%), qualitative (11%), or combination (19%) nature.
A modified version of the TSI was used to collect the expert appraisal data. As discussed earlier in this chapter, an item pool of
51

TEACHER STRESS INVENTORY
135 stems was reduced to 42 through the procedures of content, factorial, and construct validation outlined in greater detail elsewhere (Fimian, 1984b, 1985). To these, 16 conceptually similar items-including the Time Management items-were added to the modified TSI for future development. Of the resulting 58 questions (Q1 to Q58), 7 were designated as "Other" and allowed respondents to add and rate their own stress sources or manifestations; 51 items were of the closed-ended variety and were rated by the experts. Two of these items were later omitted from the analyses as these were established earlier as having little discriminant worth. Thus the item pool was reduced from 51 to 49, 41 of which were drawn from the original TSI resulting from the pilot studies in Connecticut and Vermont. Of these 49 items, 8 were conceptually related to Time Management problems and were appended to the end of the Inventory during its third year of use based on earlier recommendations of a number of the experts. In the content validity study, each of the 49 items was associated with a 4-point Likert-type scale (1 = not relevant; 2 = somewhat relevant; 3 = quite relevant; 4 = very relevant), which would allow each expert to determine the degree to which each item was related to his or her individual concept of teacher stress. Finally, an additional 8 ''Personal and Professional Information" items were included on the cover page of the form.
Design and procedures. The design selected and used with the content validity samples is a "cross-sectional" survey design (Huck, Cormier, & Bounds, 1974); each expert was surveyed once during the summers of 1980 to 1984. During each academic year an address list of "stress experts" was developed from that year's literature. These individuals were then surveyed the following summer using paper-and-pencil procedures; one introductory letter, modified Inventory, and prestamped, return-addressed envelope was distributed to each potential respondent.
Results. Relevance means for the TSI items varied somewhat around the 3.0 or quite relevant level, ranging from a low of 2.5 (Q24, Teachers feel frustrated because their students would prob
52

Inventory Development
ably do better if they only tried harder) to a high of 3.4 (Q29 and Q47, Feeling unable to cope; Experiencing physical exhaustion). Of the 49 rated items, 28 met or exceeded the 3.0 relevance level, whereas 21 fell slightly below this. Items meeting or exceeding the 2.5 level (e.g., relevant) were retained in the item pool; all items were retained as they fell in the relevant to quite relevant range.
In order to assess the degree of congruence among the experts' ratings, Finn's (1970) r formula was then used to calculate an interrater reliability correlation, first for each item, then for each TSI subscale and scale, as outlined by Tinsley and Weiss (1975). These correlations, which could range from 0.0 to 1.0, indicate a total lack of correspondence (r = 0.0) to perfect agreement (r = 1.0) among raters. The item-level data were entered into these computations first, then the subscale and scale data. As noted in Table 12, item-level correlations ranged from a low of .18 (Q34, Using prescription drugs) to a high of .90 (Q50, Rushing in one's speech). All correlations exceeded the .05 (2 items), .01 (6 items), and .001 (41 items) probability levels. The data were then inspected at the subscale and scale levels using the newly defined factors of the final form of the TSI; these reliabilities, as noted in Table 12, ranged from a low of .42 (Behavioral Manifestations) to a high of .72 (Time Management). Interrater reliability for the Total TSI was .82. The reliability estimates were generally larger for the stress sources than they were for the stress manifestations, indicating slightly more agreement among the experts about what causes teacher stress than about how that stress is manifested. All subscale and scale interrater reliabilities exceeded .001 probability levels for given sample sizes.
Also reported in Table 12 are the expert appraisal means and standard deviations based on the summed and averaged itemlevel ratings. Subscale means ranged from a low of 2.9 (Professional Investment; Gastronomic Manifestations) to a high of 3.3 (Emotional Manifestations). A scale mean of 3.1 indicated that the experts viewed the pool of stress items as being quite relevant to teacher stress. Standard deviations were moderate at both subscale (0.6 to 0.9) and scale (0.5) levels.
53

TEACHER STRESS INVENTORY
Table 12 Experts' Means, Standard Deviations, fnterrater rs, and
ftem Mean Ranges
Item mean range TSI subscales Interrater and scale M SD r Lowest Highest
Stress sou rces
Time management 3.0 0.6 .72- 2.6 3.3 Work-related stressors 3.0 0.6 .70· 2.7 3.1 Professional distress 3.2 0.7 .64- 2.9 3.4 Discipline and motivation 3.0 0.6 .68- 2.6 3.3 Professional investment 2.9 0.7 .64- 2.6 3.2
Stress manifestations
Emotional manifestations 3.3 0.7 .65' 3.0 3.4 Fatigue manifestations 3.1 0.7 .65· 2.9 3.4 Cardiovascular manifestations 3.1 0.7 .46- 3.1 3.2 Gastronomic manifestations 2.9 0.8 .45- 2.8 3.1 Behavioral manifestations 3.0 0.9 .42- 2.8 3.1
Total stress strength
Total stress 3.1 0.5 .82" 2.6 3.4
SAil rs and mean scores based on an n of 226, unless otherwise indicated. bThe Time Management factor was not included in the 1980-82 factorial validity research; means, standard deviations, and interrater rs for Time Management are based on an n of 104 expert appraisal respondents. 'p .001.
ScalelSubscale Intercorrelations
Table 13 presents the correlations among the derived subscale and total scale scores for the combined samples group. These data indicate that low to moderate positive correlations exist between and among the subscale scores (r range = .20, between Discipline and Motivation and Behavioral Manifestations and between Work-Related Stressors and Behavioral Manifestations, to .62, between Professional Distress and Professional Involvement). Almost 60% of the pOSSible correlations exceeded the .40 level,
54

Table 13 TSI SubscalelScale Intercorrelations
TSI subscale/scale
TSI subscale/scale II III IV V VI VII VIII IX X
I. Professional involvement
II. Behavioral 29 man ifestations
III. Time 41 16 management
IV. Discipline and motivation
47 20 39 ~ <:::l (1:> ;:t
0V. Emotional 37 33 50 42 ~
man ifestations tl VI. Work-related
stressors 45 20 60 36 39 ~
(1:>
Q VII. Gastronomic 30 50 24 21 34 22
~ Si
manifestations VIII. Cardiovascular 30 51 30 25 41 24 46
(1:> ;:t.....
manifestations IX. Fatigue 38 40 50 35 56 38 48 51
man ifestations X. Professional 62 25 43 42 36 48 24 25 37
distress
Total stress 69 53 73 66 71 68 55 59 72 70
Note: Decimals have been omitted to enhance readabililty; all correlations are significant at or beyond U1 the .001 probability level. U1

TEACHER STRESS INVENTORY
while 16% exceeded .50. In reviewing the relationships between the subscales and the TSI total score, it was evident that Behavioral Manifestations was least related to the TSI total score (r = .53), whereas Time Management was the most (r = .73); all correlations exceeded the .50 level, 7 of the 10 coefficients exceeded the .60 level, and 4 of the 10 exceeded .70. All correlations fell at or beyond the 0.001 level of probability, indicating that even the weakest of the relationships was nonetheless significant. All subscales and scale scores, therefore, were significantly related to all other TSI subscale and scale scores.
ScalelSubscale Means and Standard Deviations
Inspection of the means and standard deviations reported by the special education, regular education, and combined teacher samples for the TSI subscales and scale, presented in Table 14, indicated that the strength of the subscales varied to a degree. The mean subscale scores for each of the three groups are ranked highest to lowest in Table 14; the rankings across TSI subscales for each of the three groups were identical. Time Management ranked the highest for the special, regular, and combined groups; Behavioral Manifestations the lowest. Overall, mean scores for the stress source factors were larger than were those of the stress manifestations; thus the strength of the sources of teacher stress exceeded that of the manifestations of teacher stress. Total Stress Strength means and standard deviations were identical for each of the three groups, with a mean of 2.6 and a standard deviation of 0.7; thus the samples reported stress strengths in the moderate range, with some variation across means for teacher stress factors.
ScalelSubscale Distributions
With the exception of Discipline and Motivation and Professional Investment, each of the distributions for the stress source factors was essentially unimodal and normally distributed; as noted in
56

Inventory Development
Table 14 Regular, Special, and Combined Samples' Means
and Standard Deviations
Combined8 Regular Special samples education education
TSI subscale (n=3.401) (n=962) (n=2.352) and scale variables M SD M SD M SD
Stress sources
Time management 3.2 0.8 3.3 0.9 3.2 0.9 Work-related stressors 3.1 0.9 3.2 0.9 3.1 0.9 Professional distress 3.1 1.1 3.1 1.0 3.1 1.1 Discipline and motivation 2.9 1.1 3.0 1.0 2.9 1.1 Professional investment 2.7 1.0 2.8 1.1 2.6 1.0
Stress manifestations
Emotional manifestations 2.6 1.0 2.5 1.0 2.7 1.0 Fatigue manifestations 2.5 1.0 2.5 1.1 2.5 0.8 Cardiovascular manifestations 1.9 1.0 2.0 1.0 1.9 1.0 Gastronomic manifestations 1.8 1.1 1.9 1.1 1.7 1.1 Behavioral manifestations 1.5 0.8 1.5 0.8 1.5 0.8
Total stress strength
Total stress 2.6 0.7 2.6 0.7 2.6 0.7
8Eighty-six cases did not specify being either regular or special education teachers; those within "combined" samples were redistributed to either regular or special education, with the majority being special education.
Figure 3, the two aforementioned subscales were slightly and positively skewed. Each of the distributions for the stress manifestations factors was positively skewed. As noted in Figure 4, Emotional Manifestations was skewed the least, Behavioral Manifestations the most. The Total Stress Score's distribution, displayed in Figure 5, was near-normally distributed.
57

TEACHER STRESS INVENTORY
.............................................. 500 j............................................................................................................ 400
............................................................................................... 300 ...............,................................ 200
100 ,;::-----j 0
PI DM
PD~S
500 400 300 ZOO 100 o ~~~~~~~~~~~~~TM
1.0 3.0 5.0 2.0 4.0
Figure 3. lSI Stress Sources Distributions
1M = lime Management PI Professional Investment
OM = Discipline and Motivation PO = Professional Distress
WRS = Work-Related Stress
Convergent Validity
Convergent validity was demonstrated in several ways. First, teachers' TSI scores were correlated with ratings made independently by a significant other, a person who knew the teacher well. Second, total TSI scores were correlated with the presence of certain personal and professional characteristics, all of which were hypothesized to correlate very little with the TSI scores. And third, TSI scores were correlated with measures of various psychological, physiological, and organizational constructs that had been hypothesized to be related to stress. Collectively, the three sets of correlations provide evidence for the validity of the TSI.
58

Inventory Development
400 300 200 100
400 300 200 100 o
1.0 5.0 2. () 4.0
Figure 4. TSI Stress Manifestations Distributions
EM = Emotional Manifestations CM =Cardiovascular Manifestations BM Behavioral Manifestations FM = Fatigue Manifestations GM = Gastronomic Manifestations
External Validation of Personal Experience
Do individuals close to teachers under stress perceive these teachers as being "stressed out"? One type of validating evidence comes from outside observers whose independent assessments of a teacher's stressful experiences parallel the individual teacher's self-rating. Limited data exist to indicate that individuals close to teachers-those coworkers, teachers, aides, wives, husbands, friends, and lovers termed "significant others"-might share their teaching friends' perceptions of how stressful their jobs are. Assuming that high-stress and low-stress teachers would manifest their stress levels in numerous ways to their significant others, it was hypothesized that the teachers' ratings and the significant others' ratings of the teachers' stressful experiences would be
59
...........................................................................................
...............................................................................................
--=-----10
EM FM
eM 8M
BM
3.0

TEACHER STRESS INVENTORY
100
°1.0
..................................................................................... 400
_ ...................................................................... 300
_ ..·····..·..·..·....·....·..·....................·....·..·....1200
3.0
100
-------/0
5.0 2,0 4.0
Figure 5. TSI Total Score Distribution
significantly congruent. Accordingly, a group of 47 regular education teachers were asked to rate their stress levels. They were also asked to have someone close to them-their "significant other"rate how strongly they were experiencing stress, based on the others' verbal, nonverbal, and observational interactions with the teachers and using the initial form TSI. The data, reported in greater detail in Fimian (1986a), are presented in Table 15. The teachers' ratings were found to be significantly related to those of their significant others, both in terms of each of the subscale (r range = .46 to .69; p = .001) and the Total Strength (r = .65; P = .001) scores. Teachers who scored highly on each of the TSI subscales and full scale were observed by their significant other as being subject to very strong stress. Conversely, those scoring low on the TSI were observed and rated by those close to them as being under little stress. Stress has typically been defined as being a "personal event," or something closely related to the perceptions of the person who comes under stress. Apparently, those perceptions are shared to a significant degree by those closely related to the teacher under stress as well (Fimian, 1986a).
60

lnventory Development
Table 15 Indices of Teacher and Significant Other Congruence
Teacher stress Cross-rater inventory No. of correlations value variables items (Sample n = 48) (df = 1/47)
Stress sources
Personal! professio nal stressors 6 .65"* 1.10
Professional distress 9 .56"* -1.47 Discipline and
motivation 6 .68*** 0.10 Time management 8 .58*** 1.92t
Stress manifestations
Emotional manifestations 5 .46*** 2.92** Biobehavioral
manifestations 7 .47*** 2.37* Physiological-fatigue
manifestations 8 .52*** 1.59
Total stress strength
Total stress 49 .65*** 2.0 *
tp < .10 trend. *p < .05.
"p < .01. ***p < .001.
Relationships with Personal/Professional Variables
The validity of the TSI is also demonstrated by data that confirm hypotheses about the relationships between various personal and work characteristics and experienced stress. First, and because teachers seem to bring only a limited "amount" of themselves to the workplace, it was hypothesized that the personal variables would be only marginally related to teacher stress levels. Second, and based on the assumption that the TSI factors assess jobrelated problems, it stands to reason that the TSI scores would correlate to a greater degree with professional or job variables
61

TEACHER STRESS INVENTORY
than they would to personal variables. Overall, though, and since the TSI model was developed to reflect and measure stress result ing from organizational processes and problems, the relationships between given variables such as teacher sex and age, class size, grade level, and others should be limited at best.
Personal variables. The first set of variables-termed personal variables-was hypothesized to be related little, if at all, to the strength of stress. These variables include teacher sex, age, experience, and the level of their own professional development. With respect to teacher sex, it was originally hypothesized that teacher gender would not be significantly related to stress (Fimian, 1983). Using Pearson r analyses to correlate cross-sex samples' (total n = 3,291) Total Stress Scores, a coefficient of .06 (p = .001) resulted. These data indicate that there is a very small yet significant relationship between teacher gender and teacher stress, with female teachers experiencing more stress than males; due to the small magnitude of the index and the extremely large sample size, however, this relationship is probably due more to the sensitivity of the analyses than to events actually occurring in the real world. In the light of this consideration, it is apparent that teacher gender bears little actual relationship to teacher stress levels.
When considering teacher age, and since teacher age has been found to be negatively correlated to only a limited degree with teacher burnout, the same relationship was predicted between age and teacher stress; it was originally hypothesized that teacher age would be only somewhat related to stress levels (Fimian, 1983). Earlier investigations demonstrated an extremely weak, yet consistent, negative correlation between teacher burnout and age; the older the teacher got, the less burnout was experienced and reported (Crane, 1981; Schwab, 1980). Using Pearson r analyses to correlate cross-age samples' (total n = 3,335) Total Stress Scores, a coefficient of -.09 (p = .001) resulted. These data indicate that there is a very small yet significant relationship between teacher age and teacher stress, with younger teachers experiencing more stress than do older teachers; as in the case of teacher sex, though, and due to the small magnitude of the coefficient and the extremely large sample size, this relationship may be due
62

Inventory Development
more to the sensitivity of the analysis than to events that occur to different-aged teachers. Thus, it is apparent that teacher age bears only a limited relationship to teacher stress levels.
With respect to teacher education levels, it was originally hypothesized that the teacher's education level would not be significantly related to stress (Fimian, 1983). Again using Pearson r analyses to correlate the teachers' education levels (e.g., bachelor's, master's, or advanced degrees; total n = 1,733) and their Total Stress Scores, a coefficient of .00 resulted indicating that teacher education level bears little relationship to teacher stress levels. Finally, and with respect to years' teaching experience, it was originally hypothesized that the number of years teachers have taught would not be significantly related to stress (Fimian, 1983). Using Pearson r analyses to correlate teaching experience in terms of years (total n = 2,247) with Total Stress Scores, a coefficient of .06 (p = .001) resulted. These data indicate that there is a very small yet significant relationship between teacher experience and teacher stress, with more experienced teachers reporting more stress than do less experienced teachers; due to the small magnitude of the index and the extremely large sample size, however, this relationship may be due more to the sensitivity of the analyses than to actual events. In light of this, it is apparent that the degree of teacher experience bears little relationship to teacher stress levels.
Professional variables. The remaining variables-those termed profeSSional, work, or job variables-were hypothesized to be at least somewhat related to the strength of stress. These variables include student number and grade level. Additionally, the magnitude of these relationships would be in the low to low-moderate range, if Significant at all. With respect to student number, it was hypothesized that the number of students taught would be somewhat related to stress levels (Fimian, 1983). Earlier investigations indicated a very low positive correlation between teacher stress and student number; the more students taught, the more stress was experienced and reported. Using Pearson r analyses to correlate the number of students taught (total teacher n = 2,731) with Total Stress Scores, a coefficient of .13 (p = .001) resulted. These
63

TEACHER STRESS INVENTORY
data indicate that there is a small yet significant relationship between reported student number and teacher stress, with teachers who have larger class sizes and caseloads reporting more stress than teachers working with fewer students; as in the case of the prior variables, and due to the small magnitude of the index and the large sample size, this relationship may be due more to the sensitivity of the analyses than to actual relationships between caseload size and teacher stress. Apparently the size of teaching caseloads is somewhat related to teacher stress, though it is so to only a limited degree.
When discussing grade level, it has often been noticed how simple a matter it is working with younger students; teachers teaching older students were often thought to experience more stress caused by the inherent difficulties of their jobs (noted in Greenberg, 1984). However, it was earlier hypothesized and confirmed that grade level taught would bear little relationship to stress levels (Fimian, 1983). Using Pearson r analyses to correlate the grade level taught (total teacher n = 2,712) with Total Stress Scores, a coefficient of .02 resulted, indicating the absence of a relationship between the grade level at which one teaches and the stress experienced while teaching. Apparently, teaching younger students in the lower grades can result in just as much stress as teaching in the later grades.
Relationships with Other Constructs
The third means of establishing convergent validity is to correlate the TSI total scores with various psychological and organizational measures predicted to be positively or negatively related to occupational stress. The Teacher Stress Inventory has been concurrently related to a number of perceptual, affective, and organizational variables commonly thought to be related to teacher stress. In so doing, the concurrent validity of the TSI stress construct with other constructs is established.
Teacher stress and burnout. Some limited evidence exists that teacher stress is significantly related to teacher burnout. It stands
64

Inventory Development
to reason that those teachers experiencing the most on-the-job stress would also be those most prone to occupational burnout and that positive correlations would result between the stress and burnout levels encountered in the schools. To determine if this is so, the Maslach Burnout Inventory (MBI) (Maslach & Jackson, 1981) was used in combination with the TSI in a number of unpublished investigations. Based on data collected from a number of teacher samples and the use of Pearson correlations, the MBI subscale Emotional Exhaustion was found to be positively and significantly related to the TSI Total Stress Score: rs = .81, .79, .68, and .63 (ns =24,266,72, and 28; all ps = .001). Depersonalization was also significantly related to the Total Stress Score: rs = .71, .46, .65, and .50, respectively (ns = 24, 266, 72, and 28; all ps ::: .001). Mixed results were found for the relationship between the TSl total score and the MBI subscale (lack of) Personal Accomplishment, however. In this case, the data were reflected for the positively stated personal accomplishment items in the original MBI form, to represent a problem with or lack of on-the-job personal accomplishment. The Total Stress Score of the TSI was correlated with a lack of personal accomplishment at the following level in only one of the four samples: .41 (n = 28; P = .05). Apparently, teacher stress strength levels are significantly related to burnout intensity levels reported by teachers for both emotional exhaustion and depersonalization, but not for the lack of personal accomplishment. In comparison to their low-stressed colleagues, teachers under stress are more likely to feel emotionally "wiped out" and to distance themselves psychologically from their students than they are to feel unaccomplished on the job.
This pattern of high-stress, high-burnout relationships remains consistent when inspecting the correlations between the TSI Total Stress Score with the Total Burnout Score. When the Total Stress Score was correlated with the MBI intensity total score, the following correlations resulted: rs = .73, .74, .64, and .66, respectively (ns = 24,266,731 and 28; all ps = .001), representing 41 % to 55% shared variance between the strength of stressful events and the intensity of reported burnout. In the case of one sample (sample n = 266), and after controlling for variation attributable to background variables in a multiple regression model, up to 71%
65

TEACHER STRESS INVENTORY
of the MBI subscale variation and 59% of the total MBI score variation was accounted for by the TSI Total Stress Score. From these data it is clear that those who very strongly experience stressful events are also those at the greatest risk of burning out on the job.
Teacher stress and role problems. It has long been hypothesized yet only recently researched that teacher burnout may be highly related to the role problems that teachers experience. The research to date indicates that teacher burnout is significantly related to both role conflict and role ambiguity (Crane, 1981; Pierson, 1984; Schwab, 1980). It was hypothesized that similar positive relationships would be found between the strength of teacher stress and the degree to which problems such as role conflict and ambiguity are experienced.
Having insufficient information about teaching roles, as measured by the Role Questionnaire (note Schwab, 1980)-usually termed role ambiguity-was found to be significantly related to the TSI Total Strength Score in the two samples in which the combination of the variables was investigated: rs = .39 (sample n = 73, P = .001) and .41 (sample n = 28, P = .05). Apparently those teachers experiencing on-the-job ambiguity were also those experiencing the strongest stress.
When teachers have sufficient but conflicting information about how to conduct themselves professionally, they are experiencing role conflict. Role conflict, as measured by the Role Questionnaire, has also been investigated in combination with the TSI with a number of samples: rs = .80 (sample n = 266, P = .01), .61 (sample n = 73, P = .001), and .36 (sample n = 28, P :;= trend). Those teachers experiencing the most on-the-job conflict were also those experiencing the strongest stress. Also, and based on the magnitude of the correlations between the stress and role measures, it appears that role conflict is more strongly related to teacher stress than is role ambiguity. In most cases both role ambiguity and role conflict, either separately or in combination, acted as significant predictors of stress strength and stress frequency levels in multiple regression equations.
One additional investigation (Golaszewski, Milstein, Duquette, & London, 1984) explored the relationships between role over
66

Inventory Development
load, inadequate role preparation, and role underload and the initial form TSI subs cales Emotional Manifestations, PhysiologicalFatigue Manifestations, and Biobehavioral Manifestations. As hypothesized, role overload was found to be significantly related to the Emotional Manifestations (r ::= .55, p .001), PhysiologicalFatigue Manifestations (r ::= .45, p = .001), and Biobehavioral Manifestations (r = .24, P = .05) subscales. Similar relationships were found for role underload-Emotional Manifestations (r = .24, P ::= .05), Physiological-Fatigue Manifestations (r ::= .23, p .05)-and inadequate role preparation-Emotional Manifestations (r = .59, P ::= .001), Physiological-Fatigue (r ::= .38, p = .05), and Biobehavioral Manifestations (r = .38, P ::= .05). Those teachers with too wide or too narrow a role span, or who were not adequately prepared to take on the roles in which they were placed, were those who experienced the strongest stress manifestations.
Teacher stress and counseling. Is there a relationship between the presence of on-the-job stress and teachers seeking counseling for work-related problems? It was hypothesized that such a relationship would exist and that those in counseling would report significantly higher levels of teacher stress than those not in counseling. Based on the data reported in Fimian and Krupicka (1987; sample n = 365), it was apparent that the presence of counseling was related to the total strength of stress (r = .20, P = .001). With respect to counseling recipient and nonrecipient differences, those encountering work-related problems and receiving professional counseling for problems at work not only experienced higher levels of Professional Distress, but also experienced significantly stronger stress manifestations than did those not in counseling. Consistently, counseled teachers experienced significantly stronger Emotional, Biobehavioral, and PhysiologicalFatigue manifestations than those not receiving counseling for job-related problems.
Teacher stress and training adequacy. Does being adequately prepared to take on the role of "teacher" help minimize teacher stress in the future? This question was asked by comparing the stress
67

TEACHER STRESS INVENTORY
strength levels of 721 special education teachers who said that their previous training adequately prepared them for teaching vs. those of 992 teachers who said that they were not adequately prepared. Of these teachers, 42% indicated that they were adequately prepared vs. 58% who indicated they were not (Fimian & Conners, 1987). When the two groups were compared with respect to their stress levels, those not receiving an adequate teacher training background reported significantly stronger stress related to Professional Distress, Discipline and Motivation problems, Emotional Manifestations, and Total Stress than did the adequately trained teachers; those not adequately trained experienced significantly weaker problems related to Personal/Professional Stressors. Apparently, and in most stressful incidents, teachers who felt inadequately prepared were those who experienced the strongest stress in the classroom. Which comes first-perceptions of inadequate training or on-the-job stress? Which variable "causes" the other is not particularly clear as this is a "chicken or egg" issue. Until a more objective measure of training adequacy is developed and used in a fashion different from that of this particular investigation, the question of causality will remain unanswered.
Teacher stress and central life interest. Are teachers who prioritize their work over their personal lives more likely to experience stress than those whose personal lives are more important? This question was investigated by Zacherman (1984) when he surveyed 244 New York City teachers in terms of their central life interests and stress levels. Using the Central Life Interest Questionnaire (note Zacherman, 1984) and the initial form Teacher Stress Inventory, Zacherman established that those special education and regular teachers who prioritized their work life were more likely to report significantly larger TSI strength scores than were those primarily interested in their personal lives. It was hypothesized that removing one's self from life in general also disrupts naturally occurring systems of and structures for support that are not typical of the workplace. Accordingly, stress levels tend to be higher.
68

Inventory Development
Teacher stress and supervisory/peer support. Are teachers who receive support more likely to experience lower stress levels than those not receiving support? Fimian investigated the receipt of both peer and supervisory support experienced and reported by 1,107 Vermont and Connecticut teachers. The results, reported in greater detail in Fimian (1986b, 1986c), confirmed the oftenaccepted yet usually untested assumption that the receipt of peer and supervisory support would act as a moderator of teacher stress. Evidently, teachers are more likely to receive aid and support from peers in time of stress than they are to receive it from supervisors: two of every three teachers reported not receiving supervisory support. Peer support, though discussed more, has been researched less. Only a small minority-lO% of the teachers-did not receive peer support.
It is also apparent that supervisory support plays a major role in moderating the perceived strength of teacher stress. Those not receiving supervisory support experienced significantly stronger Personal/Professional Stressors, Professional Distress, Discipline and Motivation problems, and Emotional and PhysiologicalFatigue Manifestations, as well as the Total Strength of Stress than did those who did receive support. Those not receiving peer support reported significantly stronger Professional Distress in comparison to support recipients, with the nonrecipients experiencing stressful events as being significantly stronger than did the recipients of peer support.
In other work, Courtney (1987) compared 28 teachers not receiving administrative support with 103 teachers receiving such support and found results similar to Fimian's. Except for the initial form TSI subscale Biobehavioral Manifestations, those not receiving administrative support experienced significantly stronger stress related to each of the other subscales and significantly more stress overall than did the supported teachers. Only 21% of this sample reported not receiving such support. Braaten (1987), in his study of role-related stress among 108 special education teachers in Minnesota, found a significant relationship (p = .006) between elevated stress levels and the absence of administrative support; in his study, 57% of the teachers reported receiving administrative support, whereas 43% reported not receiving such support.
69

TEACHER STRESS INVENTORY
Teacher stress and job satisfaction. An analysis was conducted for 539 teachers from the aggregate pool of 3,401 teachers. These teachers were asked to rate their job satisfaction levels as they were completing the TS!. A correlation of .17 (p = .001) between the Total Strength Score and teacher dissatisfaction was established indicating that those teachers most dissatisfied with their jobs were also those subject to the strongest stressful experiences. Using similar analyses and scales, Honaker (1987) found that, of 131 West Virginia teachers, those who reported being less satisfied with their teaching roles were also those experiencing significantly more stress in terms of each of the TSI subscales. Similarly, of Braaten's (1987) sample of 108 special education teachers from Minnesota, those reporting less job satisfaction also reported significantly stronger stress than teachers satisfied with their jobs. Apparently, job dissatisfaction is only somewhat related to teacher stress-teachers who are stressed on the job are not necessarily those most dissatisfied with their jobs. Future work with well-established satisfaction constructs will need to be conducted to clarify this relationship.
Teacher stress and job stress. An additional analysis was conducted for 539 teachers from the aggregate data pool. These teachers were asked to rate their job stress levels as they were completing the TS!. A correlation of.51 (p = .001) with the Total Stress Score indicated that those who rated their jobs as very stressful were the same teachers who reported the strongest on-the-job stress as defined by the TS!. Using similar analyses and scales, Honaker (1987) found that, of 131 West Virginia teachers, those who reported being more highly stressed on the job were also those experiencing significantly more stress across each of the TSI subscales.
Teacher stress and substance abuse. Is teacher stress at all related to the use of over-the-counter (OTC), prescription (P), and alcoholic (A) drugs? This question was investigated based on the data collected from 1,788 teachers from Vermont, Connecticut, and New York (sample sizes = 365, 371, 371, 435, and 249, respectively), It was determined from these data that the strength of
70

Inventory Development
occupational stress plays a role in supporting the use of OTC, P, and A drugs (Fimian, Zacherman, & McHardy, 1985). It was also apparent that (a) the strength of need to use such substances is significantly related to the perceived strength of on-the-job stressthe stronger the stressful events are perceived to be, the stronger the reported need to make use of substances that would act as stress buffers; (b) 1 in every 20 teachers reported great to major need to use OTC or P drugs to ameliorate stress, whereas 1 in 10 reported a great to major need to use alcohol in the same capacity; (c) 1 in 30 teachers used OTC and/or P drugs on a daily or neardaily basis, whereas 1 in 10 routinely used alcohol during times of stress; and (d) the strength of stress can be used to estimate the degree of need to use stress-buffering substances. In short, OTC, P, and A substances were used by many teachers in the face of stressful events. Also, a small percentage (e.g., 5% to 10%) routinely used and felt the need to use substances in order to reduce stress to more manageable levels. Apparently, the use of drugs is significantly related to the strength of stressful on-the-job events experienced by teachers. Some caution should be exercised when considering these data, however; typically, substance use and abuse tends to be underreported in self-report studies. In the case of this investigation, there was little opportunity to address or control for this issue.
Teacher stress and physiological symptoms. It was hypothesized that the presence of strong levels of teacher stress would be related to the frequency with which psychosomatic symptoms were experienced. Based on the Connecticut teachers' data and reported in an unpublished manuscript (Fimian, 1986e), the relationship between teachers' perceptions of stress and the physiological events they experienced was established. Overall, the teachers reported somewhat to moderately frequent psychosomatic disorders. Frequencies were reported for each of 16 disorders: e.g., stomach acid, cramps, and pain; racing heart; feelings of increased blood pressure; headaches; voice loss; cold sweat; physical exhaustion and weakness; nausea; rapid breath; dizziness; fatigue; back pains; and decreased appetite (Belcastro, 1981; Bloch, 1978; Gmelch, 1977; Knab, 1982); each was sig
71

TEACHER STRESS INVENTORY
nificantly related to one another. Teachers who were apt to experience one of the psychosomatic symptoms were very likely to experience at least some of the other 15. Those who frequently experienced one or more of the symptoms were also very likely to experience the rest frequently. When the psychosomatic disorders were inspected in light of reported stress levels, two consistent relationships were noted: (a) teachers under stress experienced significantly more frequent psychosomatic disorders than did those under relatively little stress and (b) teachers who experienced frequent psychosomatic disorders were generally under significantly more stress than those who did not experience symptoms.
Additional work with the correlates of physiological symptoms of stress and rated stress levels has been conducted by Golaszewski et al. (1984). In this investigation, 118 teachers from New York were asked to complete the TSI, and then had their blood pressure taken. In this investigation, significant relationships between teachers' systolic blood pressure and Emotional Manifestations (r = .29, P = .05) and Physiological-Fatigue Manifestations (r = .32, P = .05) were noted. Since only the TSI manifestations subscales were used in this investigation, only future studies will confirm the relationships between biological indicators and the other TSI stress scores.
Teacher stress and anxiety. It stands to reason that the stress experienced by teachers would also be related to their anxiety levels; The more anxiety experienced, the stronger the stress. The TSI has been used in combination with the State-Trait Anxiety Scale (Spielberger, 1973) with three different samples from Georgia (ns = 39,39, and 10). The Total Stress Score was found to be related to teachers' state anxiety levels: rs = .07 (p = trend), .49 (p = .001), and .87 (p = .05). The Total Stress Score was also found to be related to the teachers' trait anxiety levels (sample n = 10, r = .93, P = .05), indicating that those teachers who are naturally anxious (Le, who score highly on the trait anxiety measure) and who find themselves in stressful situations (e.g., who score highly on the state anxiety measure) are also those who report the strongest stressful experiences associated with teaching.
72

Inventory Development
Teacher stress and social readjustment. Are teachers who experience stressful life events more likely to report stressful workrelated events? It was hypothesized that a small yet significant correlation would result between work stress and life stress. The TSI and the Social Readjustment Scale were used to survey 23 of the 266 North Carolina teachers listed in Table 10. The Social Readjustment Rating Scale (Holmes & Rahe, 1967), a commonly used measure of the degree to which stressful life experiences occur to adults, was significantly related to Discipline and Motivation (r = .46, P = .05), Emotional Manifestations (r = .42, P = .05), and the Total Stress Score (r = .42, P= .05) of the TSI. A multiple R of .18 (p = .05) indicated that, after accounting for variance attributable to Type AlB personalities, locus of control, and need deficiencies, stressful life events still accounted for a significant percent of variance related to the strength of teacher stress. From these data it is apparent that work-related and life stress are related to one another to at least a limited degree. Work with larger samples, though, is needed to verify and clarify such relationships.
Teacher stress and tedium. Is there a relationship between teacher stress levels and the tedium experienced during their day-to-day routines? First investigated by Pines, Aronson, and Kafry (1981), tedium was found to be related significantly to the burnout model developed by Maslach and Jackson (1981). It stands to reason that classroom tedium would also be significantly related to teacher stress. The Tedium Measure was used with a subsample (n = 21) drawn from the 266 North Carolina teachers. The teachers completed both the TSI and the Tedium Measure; from these data, it was determined that the Total Stress Score of the TSI was significantly related to the Tedium measure subscales Physical Exhaustion (r = .77, P = .001), Emotional Exhaustion (r = .80, P = .001), and Mental Exhaustion (r = .78, P = .001), as well as to the Total Tedium Score (r = .83, P = .001).
Teacher stress and principal management style. Do the ways in which principals express leadership, use power and authority, arrive at decisions, and interact with teachers (Sergiovanni & El
73

TEACHER STRESS INVENTORY
liot, 1975) have a bearing on teacher stress levels? Using the Managerial Style Questionnaire developed by McBer and Company (1980), Courtney (1987) investigated these issues by examining the relationships between leadership styles and teacher stress as measured by the TSI and reported by 267 North Carolina teachers. Hypothesizing that some styles of management would produce more stress for teachers whereas others would result in less, Courtney determined that principal management style was indeed significantly related to teacher stress at the .001 level-the management coaching style was the least stressful to teachers, and the pacesetting style the most. Courtney also noted that principals with coaching styles tended to display a concern for high performance standards and saw their job as helping or showing teachers how to improve their performance and encouraging professional development and shared decision making. Accordingly, they directed by asking their teachers to set their own goals. Pacesetters, on the other hand, tended to set high standards and to lead by example, have trouble delegating and taking responsibility, become coercive when teachers experienced difficulties, have little sympathy for poor performance, and not develop or support their teachers. Given the work climate generated under such a management style, it is clear why teachers under the coaching principals would experience and report less stress than those under pacesetters.
Teacher stress and principal leadership. Is there a relationship between the ways in which principals lead their staff and teacher stress levels? Courtney investigated this relationship by surveying 267 teachers with respect to their stress levels and their principals' leadership style, as defined by the Principal Management Instructional Rating Scale (note Courtney, 1987). This scale measures 11 job functions that reflect the areas of principal responsibility in his or her role of instructional leader. Instructional leadership of the principal was found to be Significantly related to teacher stress levels, particularly with respect to promoting a positive learning climate, developing and enforcing standards, providing incentives for teachers, and promoting professional develop
74

Inventory Development
ment. The absence of these factors was significantly related to elevated teacher stress levels.
Teacher stress and stress inoculation programs. Some limited data exist that indicate that teacher stress, as defined by the TSI, can be modified through the use of stress inoculation training programs. Cecil (1987) and his advisor Susan Forman used the TSI to measure the differential effects that stress interventions would have upon teachers. Fifty-four South Carolina teachers were randomly assigned to one of three experimental conditions-stress inoculation training, coworker support group, and a no-treatment control group. Teachers were assessed before treatment, immediately after treatment, and 4 weeks later. Programs were conducted for each of the treatment conditions for 90 minutes per week over a period of 6 consecutive weeks. The stress inoculation group was effective in reducing stress related to Professional Distress, Personal-Professional Stressors, Discipline and Motivation, and Emotional Manifestations, whereas the coworker support group was not.
TSI Reliability
There are four types of reliability that have been investigated using the TSI: (a) alpha or internal consistency, (b) test-retest, (c) split-half, and (d) alternate-forms.
Alpha Reliability
One of the primary measures of reliability is that known as alpha or internal consistency reliability. Gable (1986) noted that this reliability coefficient is drawn directly from the domain-sampling theory of measurement error described in Nunnally (1978). In so doing, the use of Cronbach's (1951) coefficient alpha addresses the error due to item sampling practices and the use of IIone shot," single, or cross-sectional administrations of an instrument. Also, it provides an index that allows users to estimate the degree to
75

TEACHER STRESS INVENTORY
which the items within a subscale or scale "hang together." Poorly selected items generally do not relate to one another as strongly as do items that have undergone a thorough and systematic process of item selection. As measurement error "creeps in," the body of items relate to one another less and less; accordingly, the alpha reliability estimate that represents these relationships tends to be lower than is conventionally desirable. In short, the less "internal consistency" within a body of items, the lower the alpha reliability estimate. The more inconsistent the response patterns are across items within an item pool, the lower the alpha reliability.
Evidence of the TSI's internal consistency is provided in Table 16. This table contains the names, items, and alpha reliability estimates for each derived TSI subscale and scale, once each for the
Table 16 TSI Subseala/Scale Alpha Reliability Estimates
TSI subscale Combined8 Regular Special and scale Item samples education education variables N (n=3,401) (n=960) (n = 2.353)
Stress sources
Time management 8 .83 .87 .82 Work-related stressors 6 .80 .74 .77 Professional distress 5 .82 .75 .81 Discipline and motivation 6 .86 .82 .84 Professional investment 4 .75 .70 .67
Stress manifestations
Emotional manifestations 5 .87 .84 .85 Fatigue manifestations 5 .82 .70 .75 Cardiovascular manifestations 3 .78 .77 .78 Gastronomic manifestations 3 .88 .76 .86 Behavioral manifestations 4 .82 .83 .81
Total stress strength
Total stress 49 .93 .92 .93
8Eighty-eight eases did not specify being either regular or special edueation teachers.
76

Inventory Development
special (n = 2,352), regular (n = 962), and combined (n = 3,401) teacher samples. Subscale reliability estimates for the special education teachers ranged from a low of .67 (Professional Investment) to a high of .86 (Gastronomic Manifestations); one estimate fell in the .60s, three in the .70s, and six in the .80s. The whole scale alpha reliability was .93. Subscale reliability estimates for the regular education teachers ranged from lows of .70 (both Professional Investment and Fatigue Manifestations) to a high of .87 (Time Management); no estimates fell in the .60s, six in the .70s, and four in the .80s. The whole scale alpha reliability was .92. Subscale reliability estimates for the combined teacher sample ranged from a low of .75 (Professional Investment) to a high of .88 (Gastronomic Manifestations); no estimates fell in the .60s, two in the .70s, and eight in the .80s. The whole scale alpha reliability for the combined sample was .93.
Since all items were included in the reliability analyses, and none reduced the subscale or scale reliability estimates, all 49 items were again retained. Based on these data, also, the preestablished target range of .60 to .90 for all TSI subscales was reached in each instance; the smallest approximated .67, whereas the largest exceeded .88. Sixty percent of the estimates fell above .80, and 96% fell above .70; thus, it is evident that the samples responded to the TSI in a consistently reliable fashion. Also, and with respect to the whole scale alpha estimates of .93, .92, and .93 for the combined, special education, and regular education teacher groups, respectively, these values indicate a high degree of overall internal consistency across samples.
Based on the aforementioned criteria for item acceptance or deletion, item numberswere neither reducedvia the factorial validation nor reduced via the internal consistency reliability analyses. Thus, all 49 stress strength items were retained, and all reliabilities were judged adequate for present subscale inclusion in the TSI.
Test-Retest Reliability
The alpha reliability procedure does not address an important source of error-that due to fluctuations in individual responses
77
TEACHER STRESS INVENTORY
across time. This last concern addresses the "stability" of both the construct of stress and the measures used to assess it across time (Gable, 1986). limited test-retest reliability data have been collected for the initial form of the TSI and are reported in Fimian (1986c).
To establish the test-retest reliability, two sets of TSIs were mailed to a random sample of 60 North Carolina special education teachers in February 1985 (Le., initial sample) and again within 2 weeks (Samples 1 to 4). This sample was generated from computerized personnel lists acquired from the North Carolina State Department of Public Instruction. Of those completed and returned, 82% or 49 from both the initial and the retest samples proved usable and were included in the analyses. When the surveys were initially distributed, four different sets of administration directions were included, one each to 25% of the sample. These directions requested that the teacher complete the second TSI after 2 hours (Sample I, n = 9), 1 day (Sample 2, n = 15), 1 week (Sample 3, n = 11), or 2 weeks (Sample 4, n = 14) after completing the first. Of the completed inventories, 82% or 49 from Samples 1 through 4 were included in the analyses. Paired samples t-tests were used to determine the correlations between the initial and four retest samples (Nie et al, 1975). Test-retest estimates for the subscales and scale are reported in Table 17. Correlations for the 2-hour to 2-week samples ranged .42 to .99 for subscales and .67 to .99 for the whole scale. Only 2.5% of the subscale correlations proved insignificant; the majority of the remaining test-retest reliabilities correlated beyond the .001 level, demonstrating 45% to 98% shared variance across 2-hour to 2-week intervals. Thus, the test-retest reliabilities proved acceptable for future research and time series research.
Independent evidence of the test-retest stability of the TSI is provided from data collected from a sample of 39 Georgia teachers, first in September of 1984 and then again in November of 1984. These data, presented in Table 18, indicate that test-retest correlations ranged .49 to .84 (p = .001) for the TSI subscales and .76 (p =.001) for the Total Stress Score. Thus, all TSI subscales, and the TSI scale for the strength dimension, were significantly related to their analogous measures across 8-week intervals (Fimian, 1986c).
78

Inventory Development
Table 17 Correlations Between TSI Administrations Across Time
Teacher stress Sample 1 Sample 2 Sample 3 Sample 4 inventory 2-hr 1-day 1-wk 2-wk variables (n=9) (n=15) (n=ll) (n=14)
Stress sources
Time management .94 .87 .82 .81 Work-related stressors .99 .95 .94 .87 Professional distress .99 .84 .82 .93 Discipline and motivation .96 .88 .90 .90 Professional investment .90 .78 .76 .93
Stress manifestations
Emotional manifestations .88 .79 .95 .97 Fatigue manifestations .88 .94 .92 .99 Cardiovascular manifestations .88 .57* .59* .97 Gastronomic manifestations .97 .98 .70** .96 Behavioral manifestations .94 .64** .42n• .95
Total stress strength
Total stress .96 .84 .67 .99
nSnot significant. *p .05.
**p .01. Note. All other correlations significant to the .001 probability level.
Split-Half Reliability
Whereas Cronbach's alpha represents the average of all possible item splits of an instrument, split-half analyses provide data-based estimates on only one split. This procedure requires that the original TSI be randomly split into two equivalent sets of items. Thus each item set would represent one of two item pools drawn from one content domain-in this case, the domain of "teacher stress." The correlation of the scores from the two halves is then inspected. If each of the subsets of items is truly representative of the content domain from which they were drawn, then each short
79

TEACHER STRESS INVENTORY
Table 18 TSI Test-Retest Data for 8-Week Intervals
Teacher stress Test-retest inventory correlation variables (n=39)
Stress sources
Time management .65 Work-related stressors .49 Professional distress .84 Discipline and motivation .58 Professional investment .83
Stress manifestations
Emotional manifestations .48 Fatigue manifestations .69 Cardiovascular manifestations .80 Gastronomic manifestations .58 Behavioral manifestations .61
Total stress strength
Total strength .76
Note. All correlations significant to the .001 probability level.
form's alpha should be reasonably large, and the correlations between forms should prove at least moderate in magnitude (American Psychological Association, 1974). Limited split-half reliability data for the initial form TSI have been collected and are reported in Fimian (1986c).
Alternate Forms Reliability
Based on prior work (Fimian, 1985), and in order to develop two shorter forms, the initial form 49-item inventory was split by oddnumbered items into Form A (25 items) and even-numbered items into Form B (24 items). These were then administered to
80

Inventory Development
two groups of 96 North Carolina special education teachers in February, 1985. These data are reported in Fimian (1987b).
Summary
With respect to the validity of the TSI, it is apparent from the preceding sections of Chapter 4 that the occupational stress experienced by teachers is actually a multiple factor construct, that these factors are significantly related to one another, and that the stress factors were experienced by the norm group of 3,401 teachers at moderate levels. Also, the overall construct framed by the Teacher Stress Inventory is related to a number of work, job, and organizational variables in terms of both predicted directions and magnitudes. Teacher stress is related more to environmental events, and the teachers' perceptions of these events, than it is to personal or professional variables such as teacher gender, age, education level, number of students, and number of years teach~ ing. Thus, the majority of the hypothesized relationships were confirmed. As additional data and findings are contributed by present TSI users, these relationships will be extended, confirmed, refuted, or modified.
With respect to the reliability data, it is apparent that the TSl is adequately reliable in terms of its alpha, split-half, test-retest, and alternate-forms reliability estimates. Thus, it can be used for both research and other field purposes, as well as for making group-togroup and individual-to-group comparisons.
Suggestions for Further Research
A number of suggestions for future research using the TSI are warranted:
1. Sample sizes larger than some of those presented in this manual should be used, particularly with respect to the TSI's concurrent validity and reliability.
2. Many of those using the TSl are doing so to make teacher
81

TEACHER STRESS INVENTORY
group comparisons. Of more importance would be the TSI's use in conjunction with one or more additional instruments that assess personality, other types of stress or anxiety, or organizational variables. For example, only limited data have been collected to determine the TSI's relationship to variables such as locus of control, peer and supervisory support, and job satisfaction. None have been conducted to date that would investigate needs deficiencies or organizational health. Using the TSI in combination with other instruments would allow future researchers to define the shape of their "puzzle piece" well enough that, when considered with other findings, the '1arger picture" of teacher stress will become clarified.
3. With the exception of work reported by Fimian and Blanton (1986) and Farber (1981), no other investigators have conducted longitudinal studies investigating teacher stress or burnout. To his knowledge, this investigator is the only one presently tracking stress, burnout, and role problems from levels of training through the establishment of teaching careers. Considering the difficulties encountered in attempting to fund and mount such projects versus the relative attractiveness of conducting cross-sectional or "one-shot" surveys, this is not too surprising. Though yet to be confirmed, it is commonly assumed that stress and burnout are stable across time, yet subject to variation from any number of situational variables. How stress levels vary and what causes them to vary, if indeed they do, will be determined only through longitudinal projects.
4. With the exception of some of the work currently being conducted by Mark Cecil and his doctoral advisor Susan Forman, little if any work exploring the validity of the stress reduction claims proposed by consultants who establish stress management workshops, courses, or other interventions has been conducted. Do such interventions, which have become a multi-million-dollar-a-year industry, actually work? Only future and applied pre-post work linked to welldefined stress interventions will be able to answer this question.
82

REFERENCES
Albrecht, K. (1979). Stress and the manager. Englewood Cliffs, NJ: Prentice-Hall, Inc.
American Psychological Association. (1974). Standards for educational and psychological tests. Washington, DC: Author.
Anderson, M. B. (1981). A study of differences among perceived need deficiencies, perceived burnout, and select background variables for classroom teachers (Unpublished doctoral dissertation. Department of Educational Psychology, University of Connecticut, Storrs, 1980). Dissertation Abstracts International, 41 (10), 4218A.
Belcastro, P. A. (1981). The relationship between somatic complaints and illnesses of burned out and non-burned out teachers in secondary Catholic schools. Dissertation Abstracts International, 41 (07), 2948A.
Bloch, A. M. (1978). Combat neurosis in inner-city schools. American Journal of Psychiatry, 135, 1189-1192.
Braaten, S. (1987). Causality in role-related stress as perceived by a selective group of special education teachers of emotionally and behaviorally disordered students. Unpublished dissertation, University of Minnesota, Minneapolis.
Cecil, M. A. (1987). A comparison of the effects of stress inoculation training and coworker social support on teacher stress. Unpublished dissertation, University of South Carolina, Columbia.
Child, D. (1970). The essentials of factor analysis. New York: Holt, Rinehart & Winston.
Courtney, M. B. (1987). The relationship between the perceived degree of in
83

TEACHER STRESS INVENTORY
structionalleadership and principal management style and teacher stress. Unpublished dissertation, Teachers College, Columbia University, New York.
Crane, S. (1981). An analysis of the relationship among personal and professional variables, role ambiguity, role conflict, and perceived burnout of special education teachers (Unpublished doctoral dissertation, University of Connecticut, Storrs, 1981). Dissertation Abstracts International, 42, 3549A. (University Microfilms International Film No. DA 8201270)
Cronbach, L. J. (1951). Coefficient alpha and the internal structure of tests. Psychometrika, 16, 297-334.
Farber, B. A. (1981). Teacher burnout: Summary of first phase of research done in academic year 1980-81. Unpublished report. Teachers College, Columbia University, New York.
Fimian, M. J. (1980). Stress reduction techniques for teachers. The Pointer, 24,64-70.
Fimian, M. J. (1982). What is teacher stress? The Clearing House, 56, 101106.
Fimian, M. J. (1983). An analysis of the relationships among background personal, professional variables and perceived stress levels of mainstream and special education teachers. Dissertation Abstracts International, 43, 2590A. (University Microfilms No. DA 8300129)
Fimian, M. J. (1984a). Organizational variables related to stress and burnout in community-based programs. Education and Training of the Mentally Retarded, 19, 202-210.
Fimian, M. J. (1984b). The development of an instrument to measure occupational stress in teachers: The Teacher Stress Inventory. The British Journal of Occupational Psychology, 57, 277-293.
Fimian, M. J. (1985). The development of an instrument to measure occupational stress in teachers of exceptional students. Techniques: Journal for Remedial Education and Counseling, 1, 270-285.
Fimian, M. J. (1986a). Teachers' and significant others' ratings ofteacher stress. Manuscript submitted for publication. Department of Language, Reading, and Exceptionalities. Appalachian State University, Boone, NC.
Fimian, M. J. (1986b). Social support and occupational stress in special education. Exceptional Children, 52, 436-442.
Fimian, M. J. (1986c). Social support, stress and special education teachers: Improving the work situation. The Pointer, 31, 49-53.
Fimian, M. J. (1986d). A note on the reliability of the Teacher Stress Inventory. Psychological Reports, 59, 275-278.
Fimian, M. J. (1986e). Psychosomatic disorders and occupational stress in
84

References
teachers. Unpublished manuscript. Department of Language, Reading, and Exceptionalities, Appalachian State University, Boone, NC.
Fimian, M. J. (1987a). Teacher stress: An expert appraisal. Psychology in the Schools, 24, 5-14.
Fimian, M. J. (1987b). The alternate-forms and alpha reliability of the Teacher Stress Inventory. Psychology in the Schools, 24, 234-236.
Fimian, M. J., & Blanton, L. P. (1986). Variables related to stress and burnout in special education teacher trainees and first-year teachers. Teacher Education and Special Education, 9, 9-22.
Fimian, M. J., & Conners, L. (1987). Adequacy of teacher training and its relationship to occupational stress in teachers. Manuscript submitted for publication. Department of Language, Reading, and Exceptionalities, Appalachian State University, Boone, NC.
Fimian, M. J., & Fastenau, P. S. (1987). The factorial validity, content validity, and alpha reliability of the Teacher Stress Inventory: A re-analysis of aggregate data. Manuscript submitted for publication. Department of Language, Reading, and Exceptionalities, Appalachian State University, Boone, NC.
Fimian, M. J., & Krupicka, W. M. (1987). Occupational stress and the receipt of profeSSional counseling in special education. Psychological Reports, 65, 995-999.
Fimian, M. J., Pierson, D. P., & McHardy, R. (1986). Occupational stress reported by teachers of learning disabled and non-learning disabled handicapped students. Journal of Learning Disabilities, 19, 145-158.
Fimian, M. J., & Santoro, T. M. (1983). Correlates of occupational stress as reported by full-time special education teachers. Exceptional Children, 49, 72-76.
Fimian, M. J., & Zacherman, J. (1987). The strength and frequency of teacher stress: An investigation of the "Camel's Hump Hypothesis." Manuscript submitted for publication. Department of Language, Reading, and Exceptionalities, Appalachian State University, Boone, NC.
Fimian, M. J., Zacherman, J., & McHardy, R. J. (1985). Substance abuse and teacher stress. Journal of Drug Education, IS, 139-155.
Finn, R. H. (1970). A note on estimating the reliability of categorical data. Educational and Psychological Measurement, 30, 71-76.
Gable, R. K. (1986). Instrument development for the affective domain. Boston, MA: Kluwer-Nijhoff.
Gallery, M. E., Eisenbach, J. J., & Holman, J. (1981). Burnout: A critical appraisal and proposed intervention strategies. Unpublished manuscript. Department of Special Education, Western Michigan University, Kalamazoo, MI.
85

TEACHER STRESS INVENTORY
Gmelch, W. H. (1977). Beyond stress to effective management. USSC Bulletin, Oregon School Study Council, 20 (9, 10), College of Education, University of Oregon, Eugene.
Golaszewski, T. J., Milstein, M. M., Duquette, D., & London, W. M. (1984). Organizational and health manifestations of teacher stress: A preliminary report on the Buffalo Teacher Stress Intervention Project. Journal of Organizational Safety and Health, 54(11),458-463.
Greenberg, S. F. (1984). Stress and the teaching profession. Baltimore: Brookes.
Holmes, T. H., & Rahe, R. H. (1967). The Social Readjustment Rating Scale. Journal of Psychosomatic Research, 11, 213-218.
Honaker, M. (1987). Teacher stress and its effects: Regular education versus special education teachers. Unpublished master's thesis, West Virginia College of Graduate Studies, Beckley, West Virginia.
Huck, S. W., Cormier, W. H., & Bounds, H. G. (1974). Reading statistics and research. New York: Harper and Row.
Hull, C. H., & Nie, N. H. (1981). SPSS Update 7-9. New York: McGrawHill.
Jenkins, C. D., Zyzanski, S. J., & Rosenman, R. H. (1979). The Jenkins Activity Survey Manual. New York: The Psychological Corporation.
Johnson, A. B., Gold, V., Williams, E., & Fiscus, E. D. (1981, April). Special education teacher burnout: A three-part investigation. Paper presented at the 59th Annual Convention of the Council for Exceptional Children, New York, NY.
Lawrence, G. M., & McKinnon, A. J. (1980). Attrition, burnout, and job satisfactions of teachers of the emotionally disabled. Unpublished manuscript, Grant Wood Area Education Agency, and the University of Iowa.
Knab, R. M. (1982). Stressful beliefs, coping responses, and perceived success in coping among teachers. Dissertation Abstracts International, 42(11), 4674A.
Maslach, C. (1981, November). Understanding burnout: Problems, progress, and promise. Paper presented at the National Conference on Burnout, Philadelphia, Pennsylvania.
Maslach, c., & Jackson, S. E. (1981). The measure of experienced burnout. Journal of Occupational Behavior, 2, 99-113.
McBer and Company. (1980). Managerial style questionnaire: Trainer's manual. Boston: Author.
McIntyre, T. (1981). An investigation of the relationship among teacher burnout, locus of control, and select personal/professional factors in special education teachers. Dissertation Abstracts International, 42 (9), 3949A. (University Microfilms International Film No. DA 8205164)
86

References
Meadow, K P. (1981). Burnout in professionals working with deaf children. American Annals of the Deaf, 126, 13-22.
Nie, H. H., Hull, C. H., Jenkins, J. G., Steinbrenner, K, & Bent, D. H. (1975). Statistical package for the social sciences. New York: McGrawHill.
Nunnally, J. c. (1978). Psychometric theory (2nd ed.). New York: McGraw-Hill.
Pierson, D. A (1984). Perceived intensity of burnout among supportive service groups and a comparison teacher group as related to perceived need deficiencies, perceived role stress, and selected personal and professional variables and percepts (Doctoral dissertation, The University of Connecticut, Storrs, 1983), Dissertation Abstracts International, 44, 3018A (University Microfilms International Film No. DA 8401984)
Pines, A M., Aronson, E., & Kafry, D. (1981). Burnout; From tedium to personal growth. New York: The Free Press.
Presley, P. H. (1982). Teacher burnout in special education-Myth or reality? (Doctoral dissertation, Southern Illinois State University at Carbondale, 1981). Dissertation Abstracts International, 42, 4403A (University Microfilms International Film No. DA 8206487)
Schwab, R. L. (1980). The relationship of role conflict, role ambiguity, teacher background variables and perceived burnout among teachers. Dissertation Abstracts International, 41, 3823-A (University Microfilms International No. 8106751)
Sergiovani, T., & Elliot, D. (1975). Educational and organizational leadership in elementary schools. Englewood Cliffs, NJ: Prentice Hall.
Spielberger, C. D. (1973). The State-Trait Inventory Manual. Palo Alto, CA: Consulting Psychologists Press.
Styles, K, & Cavanagh, G. (1977). Stress in teaching and how to handle it. English Journal, January, 76-79.
"Teacher burnout." (1979). Teacher burnout: How to cope when the world goes black. Instructor, 88, 56-62.
Thompson, J. W. (1980). "Burnout" in group horne houseparents. American Journal of Psychiatry, 137, 710-714.
Tinsley, H. A, & Weiss, D. J. (1975). Interrater reliability and agreement of subjective judgements. Journal of Counseling Psychology, 22, 358376.
Truch, S. (1980). Teacher burnout and what to do about it. Novato, CA: Academic Therapy Publications.
Weiskopf, P. E. (1980). Burnout among teachers of exceptional children. Exceptional Children, 47, 18-23.
87

TEACHER STRESS INVENTORY
Zabel, R. H., & Zabel, M. K. (April, 1981). Factors involved in burnout among teachers of emotionally disturbed and other types of exceptional children. Paper presented at the Annual Conference on Exceptional Children, Council for Exceptional Children, NY.
Zacherman, J. (1984). The relationship between stress, job involvement, and teaching the handicapped (Doctoral dissertation, Yeshiva University, 1983). Dissertation Abstracts International, 44, 3244A. (University Microfilms International Film No. DA 8404994)
88