Embed Size (px)
Citation preview

Copyright 0 1995 by the Genetics Society of America
An Introgression Line Population of Lycopersicon pennellii in the Cultivated Tomato Enables the Identification and Fine Mapping of Yield-Associated QTL
Yuval Eshed and Dani Zamir
Department of Field and Vegetable Crops and The Otto Warburg Center for Biotechnology, Faculty of Agriculture, The Hebrew University of Jerusalem, Rehovot 761 00, Israel
Manuscript received March 6, 1995 Accepted for publication August 11, 1995
ABSTRACT Methodologies for mapping of genes underlying quantitative traits have advanced considerably but
have not been accompanied by a parallel development of new population structures. We present a novel population consisting of 50 introgression lines (ILs) originating from a cross between the green-fruited species Lycopersicon pennellii and the cultivated tomato (cv M82). Each of the lines contains a single homozygous restriction fragment length polymorphism-defined L. pennellii chromosome segment, and together the lines provide complete coverage of the genome and a set of lines nearly isogenic to M82. A field trial of the ILs and their hybrids revealed at least 23 quantitative trait loci (QTL) for total soluble solids content and 18 for fruit mass; these estimates are twice as high as previously reported estimates based on traditional mapping populations. For finer mapping of a QTL affecting fruit mass, the intro- gressed segment was recombined into smaller fragments that allowed the identification of three linked loci. At least 16 QTL for plant weight, 22 for percentage green fruit weight, 11 for total yield and 14 for total soluble solids yield were identified. Gene action for fruit and plant characteristics was mainly additive, while overdominance (or pseudo-overdominance) of wild species introgressions was detected for yield.
C OMPLETE linkage maps of DNA markers have fa- cilitated mapping of genes affecting quantitatively
inherited traits (PATERSON et al. 1991a; TANKSLEY 1993). Suitable mapping populations for such studies must possess sufficient polymorphism for marker analysis and for quantitative traits. For self-pollinated crops, such as rice (CAUSSE et al. 1994), soybean (KEIM et al. 1990) and tomato (MILLER and TANKSLEY 1990), little variation between cultivated varieties is detectable by DNA mark- ers. To overcome this problem, studies of quantitative trait loci (QTL) were performed on wide crosses be- tween species or races. The population structures most commonly used for QTL mapping in self-pollinated crops were FY/FB or recombinant inbreds.
Conventional mapping populations have several limi- tations in the accurate identification and fine mapping of QTL. One of the major shortcomings is their resolu- tion power. In a simulation study on backcross popula- tions, it was demonstrated that for QTL of large effects, in experiments with large populations and high density linkage maps, the confidence interval for QTL map location is on the order of 10 cM (DARVASI et al. 1993). Another limitation is in the ability to identify QTL with small effects. In many instances it was found that a large portion of the phenotypic variation for the measured traits could be explained by the segregation of a few
Corresponding author: Dani Zamir, Department of Field and Vegeta- ble Crops, Faculty of Agriculture, The Hebrew University of Jerusa- lem, P.O. Box 12, Rehovot 76100, Israel.
Grnetics 141: 1147-1 162 (November, 199.5)
major QTL. For example, 33-37% of the phenotypic variation for seed weight in cowpea and mungbean was explained by a single QTL (FATOKUN et al. 1992). A QTL for glume hardness explained 42% of the variation in a maize-teosinte cross (DOEBLEY and STEC 1991). A major QTL can overshadow the effects of minor inde- pendently segregating QTL by increasing the total phe- notypic variation, and thus genes with lesser effects might fall below the threshold of detection. The over- shadowing effect interferes with the correct estimation of the number of QTL and with their fine mapping. An additional restriction of standard populations may result from the interaction between two unlinked QTL. Interacting loci can reduce the difference between the subgroups of the tested QTL and therefore the loci may escape detection.
In tomato, which has been a model plant for QTL mapping, the low level of variation among the cultivated varieties is not limited to FWLPs but is also typical of agronomically important traits. The narrow genetic ba- sis of the cultivated tomato has emphasized the value of exotic germplasm for improvement of the crop (RICK 1982). QTL studies with complete genome coverage in tomato have been conducted on backcross (PATERSON et al. 1988), F2/F3 (PATERSON et al. 1991b) and recombi- nant inbred populations (GOLDMAN et al. 1995) involv- ing interspecific crosses. In these populations each of the segregating plants possessed a large fraction of the wild species genome and some individuals were charac- terized by partial or complete sterility. A few major

1148 Y. Eshed and D. Zamir
genes for sterility can exert an overshadowing effect on QTL that might be of great interest. For this reason it has not been possible to map QTL for increased yield in tomato, and studies have focused instead on fruit characteristics, abiotic stress tolerance, insect resistance or morphological variation of the young seedlings (NIENHUIS et nl. 1987; PATERSON et al. 1988; MARTIN et nl. 1989; DE VICENTE and TANKSLEY 1993).
To overcome the problem of interspecific mapping of QTL associated with yield, we modified population structures used in the past by combining them with DNA markers. WEHRHAHN and (1965) have demon- strated that effects of individual QTL in wheat can be measured by using backcross inbred lines (BILs). BILs are characterized by the low proportion of the donor parent in each of the population members and therefore are ideally suited for mapping interspecific variation.
In this paper we describe the application of a novel introgression line (IL) population, which resembles the BILs, for the mapping of interspecific variation for quantitative traits associated with yield in tomato. The IL population is comprised of 50 L. esculentum lines, each containing a single homozygous restriction frag- ment length polymorphism (RFLP)-defined chromo- some segment, introduced from the green-fruited spe- cies L. pennellii (ESHED and ZAMIR 1994b). Among the lines there is a complete representation of the wild species genome. The ILs are nearly isogenic to the re- cipient genotype, and therefore all the genetic variation that differentiate them can be associated with the intro- gressed segment. Since each line carries only a small fraction of the wild species genome, most of the fertility problems can be eliminated and yield-associated traits can be measured. We demonstrate that the alternative mapping population structure presented here could in- crease the ability of geneticists to dissect a quantitative trait by using saturated FWLP linkage maps.
MATERIALS AND METHODS
Plant material: The parental lines for the IL population were the processing tomato inbred variety M82 (L . esculentum) and the inbred accession of L. pennellii (LA 716). The develop- ment scheme of the ILs, through repeated backcrossing and RFLP selection, was described previously by ESHED and ZAMIR (1994b). The IL population is composed of 50 L. esculentum (x = 12) lines, each containing a single RFLPdefined chro- mosome segment of L. pennellii (Figure I ) . The lines contain an average of 33 cM from a total genome size of 1200 cM (2.75%); overlapping regions between neighboring lines were selected to ensure complete representation of the wild species genome. The total length of the overlaps is 480 cM. Determi- nation of the size and identity of introgressed segments was based on RFLP analysis of 375 markers chosen to cover the entire tomato genetic map at minimal intervals. Our claim that the lines contain a single introgression is based on the RFLP analysis, which in no case revealed additional indepen- dent introgressions. The purity of the ILs is also supported by fingerprinting of the lines with multicopy microsatellite probes ( ESHED and ZAMIR, unpublished data). It should be noted that the introgression of IL8-1 was the only one that
was not assayed in homozygous condition; this was because of elimination of male gametes carrying the L. pmnellii allele (ESHED and ZAMIR, unpublished data).
For the analysis described in this study, the 50 11,s were both selfed and crossed with M82 and A8 (a different pro- cessing inbred with larger fruit and higher content of soluble solids) (Table 1). The following genotypes were transplanted in the field in Akko on March 1993 in a completely random- ized design: I,. prnnellii (eight plants), M82 (30 plants), AS (23 plants), hybrids of AS with M82 (20 plants), FI-interspecific hybrids (20 plants), selfed progenies of each of the 49 homo- zygous ILs (six plants), hybrids of ILs with M82 (six plants each) and hybrids of ILs with A8 (six plants each). Hybrids heterozygous for the introgression IL8-1 were selected using the isozyme marker Ap-2. Seedlings (35 days old) were trans- planted into a drip-irrigated field with 50 cm between plants and 2 m between rows (1 m2 per plant).
Two regions of the genome were selected for the fine m a p ping analysis in 1994. One region was covered by IL2-5 and IL2-6 and was associated with small fruit size. The other was contained in IL1-4 and was associated with high yield of total soluble solids (BY). Large F2s of a cross between these 11,s with M82 were grown, and recombinants in the targeted re- gions were selected following RFLP analysis (BERNATZKY and TANKSLEY 1986) with the most distal markers defining the introgressions. Recombinant plants were subjected to RFLP analysis with additional markers available for the introgressed segments to define their genotype. Recombinants of interest were selfed again to obtain lines homozygous for shorter in- trogressions. After lines for the fine mapping analysis were fixed i n a homozygous condition, their progeny were trans- planted in the field in Akko on March 1994 (10 plant? from each IL and 30 plants from M82 in a completely randomized design). For fruit mass mapping only selfed plants were grown, while for the BY analysis selfed progenies and hybrids with MS2 were tested.
Phenotyping: Fruits of all lines were harvested when 95- 100% of the tomatoes of MS2 were red (IO5 days after trans- planting in the field). The following measurements were taken for each of the plants: weight of the vegetative part (PW), percentage green fruit weight at harvest time (G), and red fruit weight. Total fresh yield per plant (Y) included both the red and green fruit. The experiment was harvested ac- cording to the order of the planting in the rows and not based on maturity level. Under field conditions toward harvest time, every day -3% of the fruit change their color from green to red. Therefore it is reasonable to expect that even the late maturing genotypes would have reached complete maturity had the plants been harvested a few days later. For this reason our yield parameter for each of the genotypes included both the red and green fruit weight. Total soluble solids concentration - Brix (B) represents mainly the soluble sugars and acid concentration in the fruit and is a standard quality parameter for the processing tomato industry. B was assayed on a sample of 20 red fruits per plant (measured using the digital refractometer RFM-80 BS), and mean fruit mass (FM) was calculated from all the red fruits. The product of Y and B provides an estimate of the grams of soluble solids produced per plant (BY).
Statistical analysis: Statistical analyses were performed on the JMP V.3.1 software package for Macintosh (SAS Institute 1994). Mean values of the parameters measured for the tested genotypes were compared to the appropriate control geno- types using the “Fit Y by X’ function and “Compare with control” with an alpha level of 0.05 (DUNNET 1955). M82 was the common control for the ILs and their hybrids with M82; M82 X AS was the common control for the hybrids of the ILs with A8. The additive effect (a ) was half of the difference

Introgression Lines for QTL Mapping
P l a n t % Green Fruit B r i x Y i e l d Brix weight fruit mass ( B ) ( Y ) x Yield ( P W ) w e i g h t ( F M ) ( B Y )
( G I
1149
1 5 0 ~ d -17.1 2 5 0 ~ 0.5 40 11.8 40 p 9.6 50 59.3* 75
3
d -
-1 50 -250 -40 4 0 -50 -75 a 57.7 83.4 -1 3.4 10.6 -1 3.2 -6.2 d -5.0 19.9 7.9 -6.1 27.1 14.9
a 25.9 44.3 -1 .5 9.4 6.2 15.4 d 7.0 -1 7.1 6.7 8.6 24.4 34.1
1
CT233 P n l
E 3 0 1
TG24 c CD15 c CTl22A
rl TG334 TGBO
Y
rl
-
T
d r
c f
d
10 cM
0
TG196 Skdh 1
TG310 TG70
TG5 9 CT91 B:TG224
TU3 TG71 CTl65
TGI 97 TG335
TG161 CT224A
TG237 TG245 TG430 TG85
TGS3 TG617:TG17
TGZSS;TG267 TG158 TG258A;TG389 TG159 TGZ 7 TG259
FIGURE 1.-The chromosomal location, size, identity and phenotypic effects of the 50 L. pennellii ILs. The genetic map was constructed on the basis of 119 BC1 plants as described by ESHED et al. (1992). Mapped markers are connected to the chromosome with a horizontal line, and markers not assayed on the BCl map are placed according to their approximate positions according to TANKSLEX et al. (1992). Each line was probed with all the markers, and the ones showing the wild species alleles are marked by the bar to the left of the chromosome. The phenotypic difference (as percentage of control) for each of the ILs and their hybrids is given for the following traits: PW, plant weight; G, percentage green fruit at harvest time; FM, fruit mass; B, total soluble solids - Brix; Y, yield; BY, Brix X yield. For each trait the left bar represents the relative performance of the ILs (p/p), the central bar shows the effects of hybrids with M82 (e/p), and the bar at the right is the relative performance of the hybrid with the tester A8 (e’/p) (the control is M82 X AS). Bars in black indicate significant differences exceeding p < 0.05, and empty bars indicate nonsignificant differences. The following components of genetic variability for each IL X trait are presented as percentage of control (M82). The additive effect (a) is half of the difference between the IL and M82, and its significance was calculated on the basis of the comparison between them. The dominance deviation (d) is the difference between IL X M82 and the midvalue of its parents. Significant d values at the p < 0.05 are marked by *. Significant overdominance at the p < 0.05 level is marked by an underline of the d value.
between each IL and M82, and its significance level was deter- mined by the comparison between the IL and M82. The domi- nance deviation (d) and its significance were calculated by contrasting the IL X M82 (+1) with M82 (-0.5) and the appropriate IL (-0.5). The threshhold level for significant d values was 0.001, which provides an experiment-wise error of 0.05 for the 50 compared genotypes. All calculations were performed with the measured values, except for G, where square root transformation was evaluated to improve normal- ity. Results are presented as the percent difference (A%) from isogenic control. Interaction with genetic background (hybrids of ILs with M82 and with AS) was determined for each introgression by two way analysis of variance with signifi- cance threshhold of 0.001. The coefficient of variation (CY) for each trait was calculated by dividing the general (over all tested genotypes) SD by the general mean. The minimum number of p < 0.05 significant QTL affecting a trait (Table
2) was calculated on the basis of the following assumptions: 1) each IL affecting the trait carries only a single QTL, 2) two overlapping introgressions with a significant effect on the trait (in the same direction relative to the control) carry the same QTL and 3) a QTL is counted only if the IL or its hybrid is significantly different from the corresponding control, re- gardless of the significance of a and d. The mean degree of dominance for each trait ( d / [ a ] ) (Table 2) was calculated from the mean dominance deviation for all ILs divided by the mean additive effect.
For the 1994 trial, a multiple range test between the lines evaluated for the finer mapping of the introgression of inter- est was performed by the “Fit Y by X’ function and “Each pair comparison” with an alpha level of 0.05. For comparisons of the lines derived from ILl-4, the inbred ILs and the hybrids of ILs X M82 were compared separately. M82 was included in both comparisons as a control.

1150 Y. Eshed and D. Zamir
P W G FM B Y BY
I
2
8 c1 c
rc 0 c1 c Q) 0 Q) L
e
a
Phenotype of
- 15, 2 5 0 b 4 0 b 4 0 b '5b
ni d
-1 50 -250 4 0 4 0 -50 -75 a -23.8 -38.0
150 d -9.8
-1 50 a -9.1 0.6
a -15.8 48.9
d 19.0 12.2
a 26.6 90.6
-41.0" -34.0
a 63.6 75.0
d -3.4 10.3
" .
-1 2.9 -6.4
4.3 -0.6
4 0 6 4Op 4 0
-1 0.2 6.5
4 0 b -3.3 4Of 0.9
4 0 4 0 L -28.7 4Of 13.6
4 0 -20.2 11.7
-1 2.4 8.7
FIGURE 1.-
RESULTS
parental species and their F1 hy- .- brid The parental species and their interspecific hy- brid were characterized for the quantitative traits under investigation. Highly significant differences between L. esculentum and the F1 hybrid were found for all mea- sured traits except BY (Table l). The vigor of the F1 hybrid was most striking for PW, which was 24 times higher than for M82 and eight times higher than for L. pennellii.
L. pennellii did not set fruit under the field conditions where the Y of the hybrid was 50% of that of M82; this difference in fruit set could have affected PW, since there i s competition for assimilates between the vegeta- tive and the reproductive organs of the plant. To elimi- nate the effect of variation for fruit set from the study of vegetative growth, L. pennellii was compared in the following year to a male-sterile isoline of M82; their plant weights were very similar (8.8 and 7.1 kg per plant,
-1 7.0 -21.5
5 0 F -1 7.5
-50 -4.3 -5.6
5 0 p -16.5 i'?F -1 2.4
-50 5 0 F 1.4 :7F 1.3
-50 -1.3 10.3
11.1 23.6
2.8 10.3
-Continued
2
R45S TG31 T G Z l l CTlO6A
CT638 TG276
TMl2 TG1 8 CT255 TG165 TG554
?2;TG353 TG308
TG493 TG454
TG191
TU6 CD9C
TGI 31 B CT75;TG426 TG48
TG537 CT9
TG34 TG91;CD66
ii;O;TG50B TG361
TG141A TG154
respectively), while plant weight of their hybrid was seven times higher than that of the parents.
Another factor that might influence PW is growth habit: M82 is a determinate plant due to homozygosity for the recessive mutation sp (self-pruning) , whereas L. pennellii and the FI are indeterminate. L . pennellii was also compared to an indeterminate male-sterile L. escu- lentum line (Sp/Sp) for evaluation of the effect of the mutation sp on plant growth. The sterile indeterminate line was more than twice as large as the sterile M82 or L. pennellii. PW (both fresh and dry) of the F1 hybrid between the wild species and the indeterminate Id. escu- lentum line was 3.7 times higher than that of the indeter- minate sterile L. esculentum parent. This result indicates that only a part of the heterotic effect observed for growth rate of the vegetative parts can be attributed to the differences in fruit set ability and growth habit between the two species.
Large differences in FM, B and G between the two

Introgression Lines for QTL Mapping 1151
P W G FM B Y BY
10.0 101.5 d -21.9 -72.0
-2.5 8.1 -2.2 4.5 4.8 -1 4.3 -1 1.9
a 6.5 41.8 d -28.1 -56.1
a 55.7 91.6
-1 2.8 10.3 -1 1.0 4.1
1509" 2 5 O p 4 0 b -3.9 4 0 ~ 1.2 5 0 b -11.6 7 5 b -11.4
0
0
1
-1 5 -250 -40 -40 -1 1 .8 8.3
-50 -30.5 -27.8
-75
-250 25F 147.9
d -39.1 11.9
7.5 4.1 26.7 33.1 40
4 0 -1 8.8 8.1 2.7 -41.7 8.0 -3.7 39.5' 41.6.
3
TGt88;TGSOC
TG244;TG94
m P 1 5 0 1 2 5 0 ~ 4 0 b 4 0 ~ 5 O b 7 5 k
d -1 50 -250 -40 -40 -50 -75
-5.0 5.4 a 3.8 68.8 -5.1 7.1 d 3.6 -3.0 -8.2 7.9 6.7 10.5
FIGURE 1 .- Continued
parental species can be inferred from a comparison of L. esculentum with the interspecific F, hybrid. The wild species was responsible for lower FM, higher B and higher G (Table 1).
Phenotypic analysis of the IL population: The IL population did not appear markedly different from the cultivated varieties (Table 1). The plants of the ILs were bigger, with later ripening, lower fruit mass, higher solu- ble solids content (Brix) and lower yield than the con- trol. When tested as hybrids, BY was higher than the controls, while for the other measured traits they were generally intermediate between the inbred ILs and the controls.
Plant weight (PW): Of the 49 ILs presented in Figure 1, 24 had a significantly different PW at harvest date compared to M82 (Table 2). IL1-1 had the highest PW in the experiment, i.e., 209% higher than M82, while IL1-1 X M82 had a 100% increase relative to M82. In the A8 X M82 genetic background the same introgres- sion had a very similar effect, contributing to a 91% increase in plant weight (Figure 1 ) . IL1-1 and IL1-2 had very similar effects on plant weight as well as other traits discussed below, suggesting that these QTL reside in their overlapping segment. It is interesting to note that
both lines carry the S (self-incompatibility) (LIEDL et al. 1993) locus, which in a homozygous state produces almost sterile plants of very strong vegetative growth. IL6-2 and IL6-3 are both of indeterminate growth habit due to the allele Sp originating from L. pennellii; how- ever, PW of IL6-2 was 58% lower than that of the con- trol, while PW of IL6-3 was 1'73% higher. Since PWs of the hybrids of both ILs were much higher than that of the control, we conclude that the difference between the two is due to homozygosity in IL6-2 for the recessive mutation ndw (necrotic dwarf) (WEIDE et al. 1993).
In 22 ILs there was a significant additive effect ( a ) associated with an increase of PW, whereas only two ILs were associated with a significant decrease in PW. The two indeterminate ILs (IL6-2 and IL6-3) had a signifi- cantly increased dominance deviation, of which one (IL6-2) was overdominant. Overall, PW showed additive inheritance ( d / [ a] = 0.06), and the minimal number of QTL affecting the trait was 16.
Percentage green fruit weight (G): Processing tomato va- rieties were developed for a single harvest that takes place when 95-100% of the fruits are mature red. Since the ILs were harvested together, G represents the rela- tive earliness of the different genotypes. G in the ILs

1152 Y. Eshed and D. Zamir
P W G FM B Y B Y
showed a bi
d I=- l5I"
-J -1 l5I- 5 a 6.0
-1 5 I 7.3
d 3.5
d
-1 5 a -2.7
d -1.0
d 7.7
d
-1 5
-250 25k 27.5
-37.4
-250 25b -40.1
-7.4
-250 2 5 0 1 " -9.1
-32.7
-250
40 40t-= -2.3
-3.6
4 0 "I- -4.8
2.7
4 0 3.6 -3.2
40
4 0 "I- 4.2
4.6
4 0 "t- 0.3
4.8
4 0 "I- 2.3
2.3
-40
-50 -0.6
3.9
6.3
1.7
-50 5k -0.9
10.3
-50
-75 7 1 - 3.0
-75 7 1 - 5.4
-75 71" 0.2
0.8
-0.4
1 1.7
-75
a 31.9 101.4 -3.1 15.5 -9.1 2.5
d -9.8 48.5 12.2 4.1 25.7 33.8'
FIGURE 1. - Continued
nomial distribution and therefore a square root transformation was performed. Significantly late ripening characterized 33 of the 49 ILs; only IL2-1 and IL42 ripened significantly earlier than the control. Two ILs (IL 6-2 and IL 7-2) showed a significant dominance deviation but none was overdominant. G was generally inherited in an additive manner and the minimum number of significant QTL was estimated as 22.
Fruit mass (FM): In 22 ILs, FM was lower than in the control. However, 1L7-5 and IL12-1 contained genes originating from L. pennellii, which increased FM, indi- cating transgressive segregation. The smallest fruit size was measured in IL6-2 (homozygous for ndw) ; this was followed by IL2-5, which was subjected to fine mapping (discussed later). The L. esculentum alleles, generally producing higher FM, showed partial dominance over the L. pennellii alleles ( d / [ a ] = 0.34). The minimum number of QTL estimated for this trait was 18.
Total soluble solids concentration - Brix (B): In 31 ILs the B values were significantly higher than in the con- trol, and only IL2-1 had a lower B value than M82. The highest B values were found for IL6-2 and IL6-3, which were indeterminate. These two lines differ from M82 in their growth habit (indeterminate 11s. determinate), and this is known to have a major effect on B (EMERY and MUNGER 1970). The minimum number of QTL affecting B was 23, with generally partial dominance to the L . pennellii alleles for higher B values.
Total fmit yield (Y): Nine homozygous ILs had signifi- cantly lower Y values than M82, while only IL7-5 had a
higher Y. Unlike th
cT1 ZZC CT63C GP180 COS9
7649
TG41 $8
TG123 TG146A;TE483 TG1 62 TG1468
TGZOB "2
TG272 Adhl TGZ84B TG6L TG65-CT188
TG305 TG155 TG345 CT5 0
CT7 3 CT133
TG22;CT1266 CT2248;TG37
16464
TGs7i
Le previous traits, Y of th Le hybrids could not be predicted from the Y of their inbred IL parents. The ILs with the lowest Y values in a homozy- gous condition (ILl-1, IL1-2, IL3-3, IL3-4, IL6-2 and IL7-2) gave rise to hybrids with Y values equal or supe- rior to those of controls. Seven ILs with significant dom- inance deviation for increased Y were identified. Three of these (ILl-1, IL5-4, and IL7-3) showed significant overdominance, indicating that the hybrid outyielded its highest parent. Hybrids of ILI-4, IL6-3, IL7-5 and IL9-2 had higher Y values than M82 but not from their homozygous IL parent. The minimum number of QTL for Y was 11, and the mode of inheritance was largely overdominant ( d / [ a ] = 2.16).
Total yield X Brix (BY): In tomatoes there is a negative relationship between total fruit yield and soluble solids concentration (STEVENS and RUDICH 1978). Therefore, the parameter BY provides both a biological and an agricultural estimate for the productivity of the plant. To obtain a better estimate of QTL affecting the horti- cultural yield, we analyzed the derived product BY. This product gives an estimate for the g of soluble solids produced per plant. IL2-6, IL6-3, IL7-5, IL9-2 and ILl1- 2 had significantly higher BY than M82. All of these lines were also distinguished from M82 in having larger and later maturing plants so their advantage can be explained by the larger source and the longer time of assimilate production. The same was true for the hy- brids of IL1-1, IL1-2, IL5-4, IL6-2 and IL7-3, all of which showed significant overdominance for this trait. IL2-1

Introgression Lines for QTL Mapping
P W G FM B
t3" 150
d -1 50
a 4.6 5.9 1.6 0.7 d 2.2 4.2 -1.89 2.7
Y BY
-50 5b 5.4 ,i- 6.9
-1.6 -0.9 t":Kk=:b- 150
d
-1 50 a 5.6 82.3 1.4 1.1 -14.0 -1 4.3
150 d kml~41p4ci~ 7.8
a 1.6 58.4 -2.5 3.2
d -1 5
d -13.2 13.2 8.2 3.7 150
d
-1 50 a 75.7 180.2 -3.5 14.8 d 1.6 27.2 4.3 0.2
x Kf-.4lk=:k- 150
d
-150 a 6.8 37.8 -7.0 1.8 d 12.0 3.4 10.7 5.8
FIGURE 1.-
was the only line for which the heterozygous was infe- rior to the control. At least 14 QTL were detected for BY, and the degree of dominance for this trait was the highest ( d / [ a ] = 10.26) (Table 2) of all the measured traits.
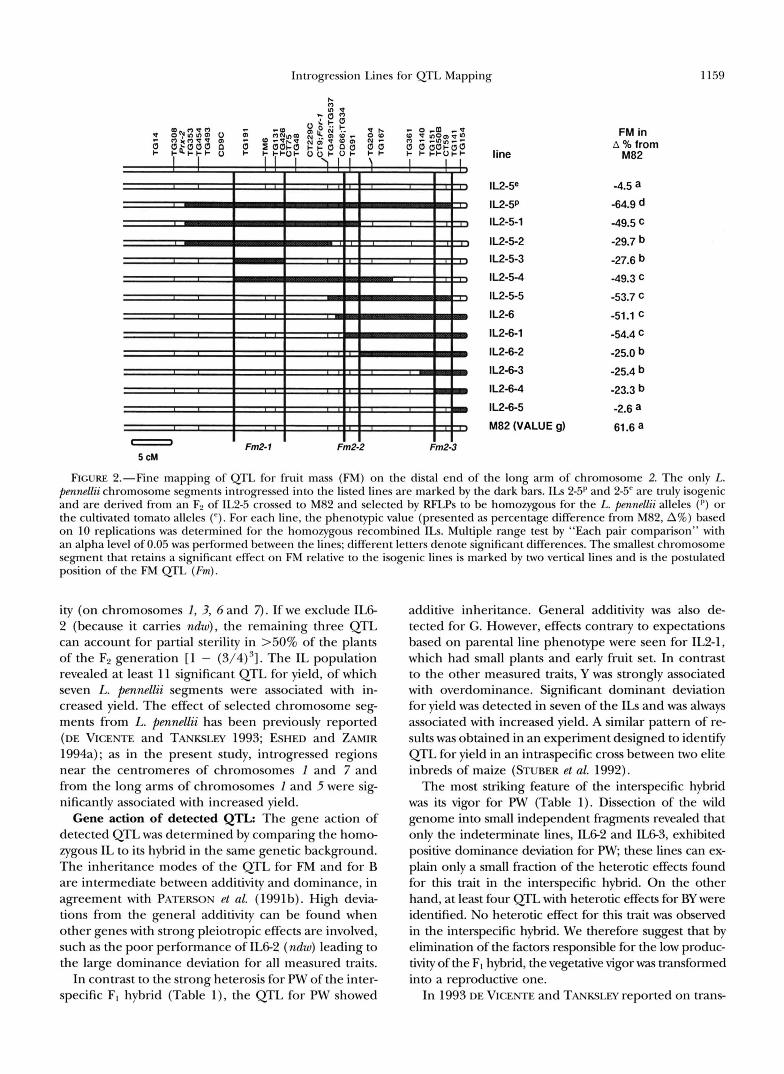
Fine mapping of QTL: Fine mapping of a FM QTL (chromosome 2): In the 1993 experiment, IL2-5 and IL2- 6 showed a considerable reduction (40-60%) in FM relative to the control; this effect was attributed to a single QTL that is overlapped by the two introgressions (Figure 1). To achieve finer mapping of this QTL in 1994, we conducted RFLP analysis in second and third generation progenies of IL2-5 and IL2-6 crosses with M82; 12 lines with different subsets of introgressed re- gion were evaluated for FM (Figure 2). The effect of the entire introgression of IL2-5p was similar to that in the 1993 experiment (65% reduction), while its true isogenic line IL2-5" (plants from F2 of IL2-5 X M82, selected for the cultivated tomato genotype) was not different from the control M82.
The IL2-5, IL2-6 region of L. pennellii appears to har- bor three different QTL for FM (Figure 2). None of the recombined progenies of IL2-5 retained the magni- tude of its effect on FM reduction. Two lines, IL2-5-2 and IL2-5-3, had similar effects on FM (28 and 30%,
28.1 24.8
-50 501- -5.2 .i" -3.3
-1.9 -0.6
-50 50v -1 5.1 ::v -0.7
-50 s°F 10.5 9.1 :F 9.7 16.9
-Continued
1153
respectively). The region that spans TGI 91 to TG426 is shared between these lines and we therefore assigned Fm2-1 to this interval, IL2-5-1 and IL2-5-4 contain longer segments of the L. pennellii chromosome, extending to TG91 and TG167, respectively. These lines exhibited a 50% reduction in FM, which indicated the existence of an additional QTL close to Fm2-1. The finer position of this QTL, designated Fm2-2, could be inferred from the recombined progenies of IL2-6. IL2-6-1 had the same fruit mass as IL2-6 and IL2-5-5, while IL2-6-2 had larger fruit. Only TG91 is shared by the first three of these lines and not by the fourth, so Fm2-2 is tightly linked to TG91. The position of the third QTL, Fm2-3, was deduced from the regions covered by IL2-6-3 and IL2-6-4 (with 25% reduction in FM) but not by IL2-6-5 (with FM similar to the control). Fm2-3 was placed be- tween TGSOB and CT59.
The map position of a QTL was located to an interval between flanking markers that were not introgressed to all the ILs carrying this QTL. According to the map (TANKSLEY et al. 1992) Fm2-1 (CD9C-CT75) is defined by an interval of 3.2 cM, Fm2-2 (cD66- TG204) by 3.7 cM and Fm2-3 (TG151- TG14la) by 14.1 cM. Recombi- nation frequencies detected for these intervals in the IL crosses were generally three to four times lower than

1154 Y. Eshed and D. Zamir
P W G FM B Y BY
3 150p;=;kd d -108.0'
ad
-1 50 a 83.7 50.3 d 48.0" -2.1
a 12.7 25.4 d 3.5 5.2
-40 4k -4.6
-40 "I" 0.6
-40 "I- 1.9
10.3 40
-40
-0.3
0.1
5.2 -1.2
-40 "P 16.2
-40 40P 25.1
-40 4 0 t - 1.4
18.3'
1 1.8.
4.4
-50 50b -9.0
11.8
-50 irp. 70.7'
-50 50P 2.0
24.8
50
-50
5.0 0.3
"b- 6
-75 I -5.4 9.4
75
-75 I!! -75 75f! 26.5
75 1 43.7*
-75
5.4 3.2
TG61 ZB GP164
TG29RCr216 -1 19 TGZS1;Ap.I TG97
;$:&GI 53 TGZ5;ndw TG24eTG406A TG54 CD25A TG446 TM4
TGZSS
CTSOB TG292 CTllOA TG27S rfl;TG279;ClZ06 TG548 TG99 PC5 TG422;TG581 TG11S TGl93 TG221 TGZ58B
FIGURE 1.- Continued
those presented in the map; reduced recombination rates have been previously reported for certain L. pen- nellii introgressions (RICK 1969).
Fine mapping of a BY QTL (chromosome 1): In a previous study, we reported that a 37cM introgression of chromo- some 1 from L. pennellii (IL14) improved the total solu- ble solids yield of tomato hybrids in plots by 16% (ESHED and ZAMIR 1994a). This introgression in a heterozygous condition was effective over a 2-year period and for two genetic backgrounds. The same effect of this introgres- sion was observed in the 1993 experiment (Figure 1). The improvement in BY was most apparent in the hy- brids of IL1-4; for the fine mapping we used a similar strategy to that described above for FM but included the heterozygous lines in the analysis (Figure 3).
Seven lines derived from IL1-4 and their hybrids with M82 were measured for B and Y. Overall, the pheno- typic effect of the introgressed segments on the mea- sured quantitative traits was smaller than the effects of the FM QTL. In addition, the phenotypic variation for Y was much higher than for FM. For these reasons, the results of the finer mapping are less conclusive. The effect of the entire introgression on BY was lower than the 49% increase found in 1993 (Figure 1); the hybrid of IL1-4P X M82 was 31% higher than the control, while its true isogenic line, IL1-4', derived from the F2 genera- tion of IL1-4 but selected against the introgressed seg- ment, was identical with M82. IL1-4 had a BY value similar to that of the control but lower than that of the heterozygous hybrid, indicating overdominance for the
trait. Three derived lines, IL1-44, IL1-45 and IL1-46, retained their significant effects over control when tested as hybrids. All three share the introgression from TG267 to TGI58, which was not covered by IL1-47 or any of the other recombined ILs. In contrast to IL1-4P, where the hybrid had higher BY values than those of the inbred IL and the control, the lines IL1-4-4, IL1-4 5 and IL1-46 had higher BY values than the hybrids and the control M82. This indicates a partially domi- nant mode of inheritance for the higher BY QTL in the shortened introgressions. The inconsistency in gene action between the complete and shortened segments could be explained if an additional, partially dominant QTL near TG245 reduces BY in a homozygous condi- tion. Indeed, IL1-41 and IL1-43 had lower BY values than the control (ILl-4'); however, the BY value of IL1- 4 2 was similar to that of the control. If such a QTL exists, it has a minor effect and should be tested in more replicates than the 10 examined here.
The conclusive result of this fine mapping attempt is that the increase in BY is associated with a 12-cM seg- ment of L. pennellii between TG53 and TG258A. The advantage of the different lines and their hybrids over M82 with respect to BY was an increase in either B or Y, but no consistent pattern could be observed (data not presented).
DISCUSSION
QTL identification using the ILs: Of the 50 ILs tested, eight had no significant effect on any of the

Introgression Lines for QTL Mapping
P W G FM B Y BY 150
r -1 50
a -8.0 8.5 -10.6 d 16.4 11.7 15.1
3.1 -1 1.7 -1 0.1 1 5 0 ~ 2 5 0 p 4 O b 4p 4.6 6.9 75k 11.3
2 a
-1 50 -250 -40 4 0 -50 -75 a 65.4 130.3 -1 6.5
~ 1 5 0 p d -23.3 p d
-1 50 a 65.7 162.4 4.9
17.8 -21.3 -1 0.4
40 ;p 23.5 75p 40
9.3 -1 1 .8 -5.0 d 15.4 48.4 1.7 1 5 0 ~ 2 5 0 ~ 4 0 b 8.1 A l z 5 2 L i 7 5 k
I?
a -1 50 -250 -40 -40 -50 -75
a 0.2 42.4 5.8 d 29.5 42.1 -0.5
d -2.9 23.1 2.4
5.5 -7.3 -2.9
40 1": WF 75F -40
3.3 16.7 19.3
3.6 16.6 20.1
1155
7
I
0 w c 0 0 d(Hyb-MB2) 4.3 1.4 -0.3 14.4 -8.4 2.4
L
c ob 1 5 0 1 2 5 0 ~ 4 0 1 4 0 k 7 5 b
d
-1 50 -250 -40 -40 -50 -75
+ 150 0
C = c,
Q) 2 -1s a i-_p.. 14.5 103.1 II - -3.4 :I- 3.4 .i.- -8.5 :p- -4.1
e ~ 150 d k;mJ+9 -0.9 :p 4oF SJF 75F Q)
d
-1 50 a 27.0 108.0 -7.0 9.1 -3.0 4.3 d 3.5 62.2 -7.9 -2.8 2.6 -0.8
FIGURE 1. - Continued
traits measured. These ILs cover a total of 203 cM FM and B showed relat
I TG529
ive
0 6 8
ly low environmental varia- (17%) of the wild species genome. The 294 (49 X 6) tion (low C V ) (Table 1) and can be compared to previ- homozygous IL X trait combinations yielded 135 that ous QTL findings in tomato where a similar experi- were significant at the p < 0.05 level. Of the 300 (50 ment-wise error was used (5%) . PW, G, Y and BY showed X 6) heterozygous IL X trait combinations measured, higher environmental variation and were assayed here 67 were significant at the p < 0.05 level in both genetic in tomato for the first time using a complete linkage backgrounds while 36 were significant in one back- map. In spite of the very small number of replicates ground only. (six) used to determine the phenotypic value of each

1156 Y. Eshed and D. Zamir
9
P W G FM B Y BY
d -3.1 -0.5 -2.0 7.6 -0.6 0.5 rc O ? I S O ~ 2 5 0 ~ 4 1 3 ~ 4 0 p 5 0 p 7 5 y
e = u ul
-150 -250 -40 E a 20.9 65.9 -6.2 12.0 10.2 22.0 40 -50 -75
Q) d 5.0 -27.3 1.6 14.7. 7.1 20.3
d -19.6 -54.0 2.1 4.6 7.2 11.1
r 1 5 0 ~ 2 5 0 b 40 c 4 0 p 5 O k 7 5 b
I E ' -150 -250 -40 c a 20.5 20.2 -12.5
4 0 -50 12.7 -1 1.6 -5.3
-75
E d 4.1 -21.6 -2.0 0.3 25.3 31 .O - 7 w 1 5 0 ~ 2 5 0 ~ 4 0 k 40f 7 5 k
0 :
= -150 p!
+ r d -250 -40 40 -50 -75
a 20.0 73.2 5.7 3.4 -1.4 0.5 U k d 1.9 43.4 -0.6 2.1 4.4 5.9
1 5 0 ~ 2 5 0 ~ 40 4 0 1 5 o b 7 s ~
? z a d
-1 50 -250 -40 a -1.7 9.2 -3.2
4 0 -50 -75 3.1 -9.1 -7.2
d 6.6 -1 9.4 -0.9 3.4 16.5 19.4
FIGURE
IL and its hybrids, 18 QTL for FM and 23 QTL for B were identified. In previous studies of the inheritance of FM and B, using a complete linkage map in a BC1 generation derived from a cross with L. chmielewskii, six QTL were identified for FM and four for B (PATERSON et al. 1988). Mapping studies involving L. cheesmanii in- terspecific F2 and FB generations revealed 13 QTL for FM and seven for B (PATERSON et al. 1991). In a recom- binant inbred population derived from the same cross, 13 QTL were identified for FM and for B (GOLDMAN et al. 1995).
1 .- Continued
CTZ25A TG254 TG105B
TGS tg18
PI TG225
Y T G l O
0) cd52a
d CTZl 5A CTZ158 0 2 1 5C TGlOl;TG5918 TO1 SO TGSSO tg55 TGl44;TG186 TG248 cT74 CT198
ctz18
6l d
-
2 76421
d TG8 TG424 CTl 1 ZA TG328;TG591A
CTZZO
10
TG230ST113C TG31 S CAB7
TG395
TG596 d
CTSlA CD45
TG43 tg52
TGlOS CTl Z6A
TG408 TGZ85:CT26OC C T l l 28 TG420
CD34B
CD34A
TG241 TG229
z r TG3OS;u
x CP.0 - d TGlA;CTS7
CTSL
z CT240
TGZ06A
TG233 CD32B
c
4
tg65
The advantage of the ILs in identification of QTL cannot be attributed to the phenotype of the parental lines used to generate them because the other experi- ments also used interspecific crosses with similar pheno- typic differences between parents. One factor contribut- ing to the high efficiency of QTL identification using the ILs is the minimal overshadowing effect. All studies of intraspecific (EMERY and MUNGER 1970) and interspe- cific crosses involving L. chmiehskii, L. chesmanii and L. pennellii identified a major QTL for B on chromosome 6 linked to sp; the indeterminate plants always had

Introgression Lines for QTL Mapping
P W G FM B Y BY
1157
150
d -1 50
a 31.2 86.5 d -10.9 25.4 PlP 150
d -1 50
a 36.9 100.5 d -10.1 13.0
k:P 150
a -1 50
a 9.5 68.0 d 7.9 40.0
i-l- 150
=! -1 50
a 2.7 19.4 d -8.2 35.8
i501" - d -1 50 a -3.5
i 5 0 t - =! -1 50 a 5.0
z 1 5 0 1 "
z150k
d 23.4
d 3.3
- -I
-1 50 a 5.0
d 17.5
- =!
-1 50 a -15.9
d -7.6
-250 250t- -2.7
29.2
-250 250t- 10.4
-3.3
-250 250k 49.0
32.3
-250 250t - -6.5
-1 .2
4 0 *i.. -1 3.2
4 0 ")lb: -0.5
4 0 aP -8.4
-1.7
4 0 40k -8.2
4.4
-40 "P 12.5
4 0 4 0 k = 6.5
40 40F 13.3
40 40P- 1 1.4
4 0 'F 7.3
-0.1
-2.8
-50 -2.4 ,t- 0.6 5oF ;;ir; -50
3.0 16.7
-50 -6.3 -1.4 15.3 17.3
-50 50k I- 4 .7 4.4 -1 0.4 -3.0
40
-40 5.7 -4.8 -0.7
2.6 9.2 13.4 22.9 40
4 0 4.0 9.3 -0.4 7. 5 -3.0 6.3 17.5 25.8
40
40 -0.9 9.0 6.4 15.0
0.9 4.6 17.6 23.1
4.9 2.9 -1 0.7 -9.1
4 .4 0.2 -6.8 -5.3
FIGURE 1 .- Continued
7 1
TG180 Aco 1
TG68 ' TGZ63A C T l 9 CT1 ZOB c179 TGZ63B
C n l l A TGZBB ppr1
TGSOA C M B
TG111 TG565 bP@dhZ
ESC<T"l6C
TGZBA TG296
CT80B
CT276
TG473;TGbOZ CDZ
higher B values. Such a gene contributes to large pheno- generated on the basis of the independent markers and typic variation when the effect of an unlinked marker a gene-induced elevation of the mean B value in the on B is examined in a segregating population. The over- population. Since variation is usually correlated with the shadowing effect can result from two main factors: an mean of a measured trait, the existance of high popula- unequal distribution of sp in the subgroups of genotypes tion means will reduce the possibility of detecting QTL

1158 Y. Eshed and D. Zamir
TABLE 1
Mean phenotypic values for the tested genotypes
Percentage
Genotype replicates (kg) weight (g) Brix Yield (kg) No. of Plant weight green fruit Fruit mass Brix X yield
(g)
L. pennellii 8 4.4 t 1.7 NA NA NA 0 0 M82 X I,. pennellii 20 36.9 i- 11.2** 74.9 i- 13.0** 5.4 2 0.8** 10.3 i- 1.3** 4.0 t 0.7** 415 t 91 M82 30 1.5 t 0.5 3.9 t 4.0 58.2 t 7.1 4.3 ? 0.2 8.2 t 1.7 361 t 82
M82 30 1.5 t 0.5 3.9 -+ 4.0 58.2 t 7.1 4.3 t 0.2 8.2 +- 1.7 361 t 82 M82 X A8 20 1.5 ? 0.3 3.1 5 2.5 64.7 i- 8.1"" 4.7 ? 0.3* 8.6 -+ 1.5 396 ? 66 A8 23 1.6 t 0.5 6.8 t 5.0 73.0 -+ 8.0"" 5.0 t 0.4** 7.0 5 1.6" 351 i- 89
49 inbred ILs 6 2.2 t 0.9** 14.4 t- 18.5"" 50.9 t 11.0** 4.9 t 0.5** 7.0 2 2.2** 347 t 115 M82 X 50 Ls 6 1.8 i- 0.5* 8.9 i- 6.5** 56.0 f 6.0 4.7 f 0.4"" 8.9 t 1.2 424 -t 76** A8 X 50 1Ls 6 1.9 t 0.6** 7.4 2 5.3** 60.7 i- 6.8* 4.9 t 0.4* 9.2 f 1.4 461 t 96**
C.V." 25.3 32.5" 11.5 6.9 21.2 22.2
Mean phenotypic values and standard deviations of three genotypic groups are presented. The genotypic groups are as follows: the parental species, L. pennellii, L. esculentum (cv M82) and their interspecific hybrid; the L. esculentum inbred lines M82, A8 and their hybrid; the homozygous introgression lines (ILs) and their hybrids with M82 and A8. All means were compared to M82 except for A8 X 50 ILs that were compared to M82 X AS. Means marked with *, ** differ significantly ( t test: p < 0.05, p < 0.01 respectively). NA, data not available because the plants did not set fruit.
Coefficient of variation (%) was calculated on the basis of all genotypes. ' Coefficient of variation (%) was calculated after a square root transformation.
with milder effects. An additional factor that might ac- count for the large number of QTL detected in this study is the exposure of novel variation not detected in conventional segregating populations. The two examples of such variation are the male gamete eliminator (IL8- 1) and the ndw mutation (IL 6 2 ) . These genes have not been previously reported for any of the FTsegregating populations of L . esculentum X L. pennellii, although this cross was used extensively in genetic studies. Only when introgressed into the cultivated background, without ad- ditional wild species chromosome segments, were these genes identified (WEIDE et al. 1993). Such an inheritance pattern is probably due to other unlinked epistatic genes from L. pennellii. The same mode of inheritance can
account for QTL and may be an important source of trangressive variation.
The QTL for PW and G had the largest effects of all the traits measured. These parameters allowed the identification of 16 and 22 QTL, respectively, despite the large environmental variation. Yield is among the most difficult traits to manipulate genetically; not only does every metabolic pathway ultimately affect repro- duction, but the environment is also a major determi- nant of yield. Genetic analysis of yield in interspecific crosses is often affected by some overshadowing QTL associated with partial sterility. In this study we identi- fied at least four such QTL, in which homozygosity for the wild species allele resulted in almost complete steril-
TABLE 2
The number of significant effects ( p < 0.05) of L. pennellii introgressions on the components of genetic variation for the quantitative traits studied
Genetic Plant % Green Fruit Brix Total Brix X components" weight fruit weight mass ( T W fruit yield yield
a+ 22 33 2 31 1 5 a- 2 2 20 1 9 7 d + 2 0 0 3 7 8
od 1 0 0 0 2 5 Mean d/ [a] " 0.06 0.06 0.34 0.45 2.16 10.26 Minimal number
of QTL 16 22 18 23 11 14
"The genetic components of the variations are as follows: additive (a), dominance deviation (d), and overdominance (od).
d- 0 2 0 0 0 0
Values higher relative to the control genotype are indicated by + the values lower than the control are indicated by -. The degree of dominance (mean d / [ a ] ) was calculated on the basis of all ILs, regardless of significance of d and a.
I The minimal number of significant QTL affecting a trait was calculated on the basis of the assumptions described in MATERIALS AND METHODS.
Introgression Lines for QTL Mapping 1159
II
line
IL2-!je
112-5P 112-5-1
112-5-2 lL2-5-3
112-5-4
IL2-5-5
IL2-6
IL2-6-1
lL2-6-2
112-6-3
112-6-4
112-6-5
M82 (VALUE g)
FM in A 70 from
M82
-4.5 a -64.9 d -49.5 c -29.7 b
-27.6 b -49.3 c
-53.7 c
-51.1 c -54.4 c -25.0 b -25.4 b -23.3 b -2.6 a 61.6 a
FIGURE 2.-Fine mapping of QTL for fruit mass (FM) on the distal end of the long arm of chromosome 2. The only L. pennellii chromosome segments introgressed into the listed lines are marked by the dark bars. ILs 2-5P and 2-5’ are truly isogenic and are derived from an FY of IL2-5 crossed to M82 and selected by RFLPs to be homozygous for the L. pennellii alleles (l’) or the cultivated tomato alleles (‘.). For each line, the phenotypic value (presented as percentage difference from M82, A%) based on 10 replications was determined for the homozygous recombined ILs. Multiple range test by “Each pair comparison” with an alpha level of 0.05 was performed between the lines; different letters denote significant differences. The smallest chromosome semen t that retains a significant effect on FM relative to the isogenic lines is marked by two vertical lines and is the postulated position of the FM QTL”(l;m).
ity (on chromosomes 1, 3, 6 and 7). If we exclude IL6 2 (because it carries ndzu), the remaining three QTL can account for partial sterility in >50% of the plants of the F2 generation [ l - (3/4)’]. The IL population revealed at least 11 significant QTL for yield, of which seven L. pennellii segments were associated with in- creased yield. The effect of selected chromosome seg- ments from L. pennellii has been previously reported (DE VICENTE and TANKSLEY 1993; ESHED and ZAMIR 1994a); as in the present study, introgressed regions near the centromeres of chromosomes I and 7 and from the long arms of chromosomes I and 5 were sig- nificantly associated with increased yield.
Gene action of detected QTL: The gene action of detected QTL was determined by comparing the homo- zygous IL to its hybrid in the same genetic background. The inheritance modes of the QTL for FM and for B are intermediate between additivity and dominance, in agreement with PATEWON et al. (1991b). High devia- tions from the general additivity can be found when other genes with strong pleiotropic effects are involved, such as the poor performance of IL62 (ndw) leading to the large dominance deviation for all measured traits.
In contrast to the strong heterosis for PW of the inter- specific FI hybrid (Table l ) , the QTL for PW showed
additive inheritance. General additivity was also de- tected for G. However, effects contrary to expectations based on parental line phenotype were seen for IL2-1, which had small plants and early fruit set. In contrast to the other measured traits, Y was strongly associated with overdominance. Significant dominant deviation for yield was detected in seven of the ILs and was always associated with increased yield. A similar pattern of re- sults was obtained in an experiment designed to identify QTL for yield in an intraspecific cross between two elite inbreds of maize (STUBER et al. 1992).
The most striking feature of the interspecific hybrid was its vigor for PW (Table 1). Dissection of the wild genome into small independent fragments revealed that only the indeterminate lines, ILG2 and IL63, exhibited positive dominance deviation for PW, these lines can ex- plain only a small fraction of the heterotic effects found for this trait in the interspecific hybrid. On the other hand, at least four QTL with heterotic effects for BY were identified. No heterotic effect for this trait was observed in the interspecific hybrid. We therefore suggest that by elimination of the factors responsible for the low produc- tivity of the FI hybrid, the vegetative vigor was transformed into a reproductive one.
In 1993 DE VICENTE and TANKSLEX reported on trans-

Y. Eshrtl and D. Zamir
Brix x Yield in A Oh from
M82 IL IL x M82
I I I Byl-2 ? Byl-1
‘ 0 5 CM
FIGL’RE 3.-Fine mapping of QTI. for yield of total solulde solids (BY) i n the distal end of the long arm o f chromosome 1. The only I,. 1~c,717~lliichromosome segments introgressed into the listed lines are marked by the dark bars (all lines are progenies of 11, 1-4). 1L.s 1 4 ’ and 1-4‘ arc truly isogenic and arc derivcd from F! of IL. 1-4 crossed t o M82 and selected by RFLPs to be homozygous for the I.. pnnc l l i i allelcs (1’) or the cultivated tomato alleles ( I . ) . For each line, the phenotypic value (presented as percent difference from “82, A%) based on 10 rcplications was dctcrminetl for both t h r homozygom 1I.s and the heterozygous IL. X M82. Multiple range test by “Each pair comparison” with an alpha level o f 0.0.3 \vas performed Iletween the inbreds and between the hyhrids separately; different letters denote significant differences. The location of the QTI, is determined by the smallest chromosomal segment that retains a significant eff’ect on BY and is marked by the area between the vertical lines, which is the postulatcd location of the QTI. for this trait.
gressive segregation in 10 out of 11 quantitative traits measured on F2 seedlings of the same interspecific cross. In this study we show that the same is true for quantitative traits measured on maturc plants and for traits having economic importance.
Sensitivity of QTL to genetic background: Culti- vated tomato varieties represent only a small fraction of the variation presented in Lycopcrsicon (RICK 1982; MILLER and TmKStm 1990). This leads to the expecta- tion that significant effects of the introgressions found in one cultivar are likely to be maintained in others. In this study, the effect of the I-. prnnrllii introgressions was tested using an additional processing inbred line (AS) with larger FM and higher B. None of the 300 possible interactions with genetic background was sig- nificant. These results confirm the broad and dramatic effects of the novel variation introduced into the culti- vated crop.
Fine mapping of QTL: To overcome the problem of high resolution mapping of QTL in conventional crosses, PATERSOX rt nl. (1990) used selected overlap- ping recombinant chromosomes. In this study we dem- onstrate that a FM QTL can be resolved into three linked QTL; it is possible that upon finer mapping addi- tional loci will be revealed. I:m,2-1 was mapped to an interval of 3.2 cM (Figure 2) , which in certain areas o f
the tomato genome can be covered by a single YAC (SEGXI. r/ nl. 1992).
The heterotic effect of the 3 7 c M introgression of ILl- 4 on BY was consistcnt over 3 years and for different genetic backgrounds and growing stands (ESI-IEI) and ZASIIR 1994a). Finer mapping of this BY QTL suggested that two loci were involved: a partially dominant gene originating from the wild parent was responsible for the increase in BY and a linked recessive gene of I,. pnnellii origin reduced BY. It appears that combined action of these QTL, which fit5 the pseudo-overdominance model for heterosis (CROW 1952), resulted in the lower BY of the homozygous IL1-4 compared to it5 hybrids.
Implications for general genetics and plant breed- ing: For each of the traits analyzed in this study, intro- gressions with phenotypic effects of different magni- tudes were identified (Figure 1). These results are in agreement with the accumulated data from numerous QTL studies that establish definitively that polygenes vary widely in their effects, and in many instances a large proportion of the variation can be explained by the segregation of a few major QTL (TANKSLEY 1993).
Although the number of replicates used in the study was \‘en small (six per genotype), more QTL could be identified by comparison with similar studies in tomato, where each genotype has been measured from a few

Introgression Lines for QTL Mapping 1161
dozen to a few hundred times. The numbers of QTL reported in this study are skewed downward for the following reasons. First, it is not necessarily correct that two overlapping introgressions with a similar effect carry the same QTL. Second, an IL can carry more than one QTL, as demonstrated here for IL2-5 and IL2-6. The higher sensitivity of this population is a result of the minimal genetic variation within the lines.
A statistical advantage for the experimental design is the use of a common control for all lines that can be grown in large numbers and can ensure enough de- grees of freedom. An additional advantage of the ILs is the ease of distinction between additive and dominance effects. Moreover, once an inbred IL is produced, its effect can be determined for various genetic back- grounds (only in a heterozygous state) and in different environments. This factor is of major importance for identification of QTL with broad effects.
We favor the development of a permanent resource of ILs that provides several advantages over conven- tional populations. In addition to the high efficiency of QTL identification and fine mapping, it could also contribute to investigations of interaction between QTL. Reliable estimates of the interaction between QTL are difficult to obtain in segregating populations since the frequencies of some of the genotypic combi- nations are too low to allow meaningful statistical com- parisons. The availability of nearly isogenic lines con- taining different QTL would allow examination of these lines in various genotypic constitutions in balanced ex- periments aimed at the precise analysis of epistatic in- teraction.
An important advantage of the IL approach is its immediate applicability in breeding. If the recipient genome is a leading variety, the derived lines may repre- sent a significant improvement and a basis for the intro- duction of a new cultivar. ILs can also be applied in a number of ways other than those described in this arti- cle (ESHED and ZAMIR 1994b), such as mapping of new DNA clones to the genome, identification of region- specific DNA markers, and fine mapping of qualitative genes.
The main disadvantage of IL populations is the long time and the large amount of work required for their development. We estimate that after complete genotyp- ing of a BCl population and selection of the appre priate lines providing coverage of the genome with min- imal overlaps, two additional cycles of backcrosses accompanied by genotypic and phenotypic selection are required. In a selfed BC3 population the founders of an IL population can be identified. It is however expected that in outcrossing species the proportion of genes associated with deleterious recessive mutations would be higher than reported here.
Wild species represent a widely divergent gene pool for the improvement of cultivated plants. Exotic germ- plasm have been used extensively for breeding for sim-
ply inherited traits such as disease resistances. Although in a pioneering study RICK (1974) has demonstrated that high soluble solids content in tomato could be improved through wild species crosses, the use of these resources for improvement of complex traits was con- sidered largely impractical because of the many undesir- able traits carried by wild species. This study demon- strates that genes from a very small green-fi-uited, poor- yielding wild species can serve as a source for many agriculturally important traits. Even traits that were not apparent in the parental lines eventually segregated among the ILs.
Methodologies for the identification and mapping of genes underlying quantitative traits in plants have advanced considerably in recent years since the advent of marker-saturated linkage maps (TANJSSLEY 1993). The developments in marker technologies have not however been accompanied by corresponding progress in population structures. In this study we describe a new population capable of facilitating the utilization of wild germplasm by providing the means for identifica- tion and fine mapping of QTL.
All DNA clones were provided by Dr. S. D. TANKSLEY, except for TM clones provided by Dr. E. LIFSCHITZ and GP clones provided by Dr. C. GEBHARDT. We thank G. GEM from Akko Experiment Station for his assistance in conducting the field trials and T. PLEBAN, H. VAN
Oss, T. BLOCH, M. EMANUEL and A. NATOR for technical assistance. We thank Dr. S. D. TANKSLEY, Dr. I. PARAN, Dr. H. VOET and N. ORI for stimulating discussions and S. SMITH for editing. This research was supported in part by grant no. US-2427-94 from BARD, The United States-Israel Binational Research and Development Fund. Seeds of the ILs have been distributed through the Tomato Genetics Resource Center, University of California, Davis. The IL database has been deposited in the Solanaceae database and is available through the internet: [email protected].
LITERATURE CITED
BERNATZKY, R., and S. D. TANKSLEY, 1986 Methods for detection of single or low copy sequences in tomato on Southern blots. Plant Mol. Biol. Rept. 4: 37-41.
CAUSSE, M. A., T. M. FULTON, Y. G. Gu, S. N. AHN, J. CHUNWONGSE et al., 1994 Saturated molecular map of the rice genome based on an interspecific backcross population. Genetics 138: 1251- 1274.
CROW, J. F., 1952 Dominance and overdominance, pp. 282-297 in Heterosis, edited by J. W. GOWEN. Iowa State College Press, Ames, IA.
DARVASI, A,, A. WEINREB, V. MINKE, J. I. WELLER and M. SOLLER, 1993 Detecting marker-QTL linkage and estimating QTL gene effect and map location using a saturated genetic map. Genetics 134:
DE VICENTE, M. C., and S. D. TANKSLEY, 1993 QTL analysis of trans- gressive segregation in an interspecific tomato cross. Genetics
DOEBLEY, J., and A. STEC, 1991 Genetic analysis of the morphologi- cal differences between maize and teosinte. Genetics 129: 285- 295.
DUNNET, C. W., 1955 A muliple comparison procedure for compar- ing several treatments with a control. J. Amer. Stat. Asso. 50:
EMERY, G. C., and H. M. MUNGER, 1970 Effect of inherited differ- ences in growth habit on fruit size and soluble solids in tomato. J. Am. SOC. Hort. Sci. 95: 410-412.
ESHED, Y., and D. ZAMIR, 1994a Introgressions from Lycopersiconpen-
943-951.
134: 585-596.
1096-1121.

1162 Y. Eshed and D. Zamir
nellii can improve the soluble solids yield of tomato hybrids. Theor. Appl. Genet. 88: 891-897.
ESHED, Y., and D. ZAMIR, 1994b A genomic library of 1.yropersicon panellii in L. esculentum: a tool for fine mapping of genes. Euphy- tica 79: 175-179.
ESHED, Y., M. ABU-ABIED, Y. SARANGA and D. ZAMIR, 1992 Lycopwsi- con esculentum lines containing small overlapping introgressions from L. pennellii. Theor. Appl. Genet. 83: 1027-1034.
FATOKUN C. A,, D. I. MENANCIO-HAUTEA, D. DANESH and N. D. YOUNG, 1992 Evidence for orthologous seed weight genes in cowpea and mung bean based on RFLP mapping. Genetics 132: 841- 846.
GOLDMAN, I. L., I. PARAN and D. i h ~ l R , 1995 Quantitative trait locus analysis of a recombinant inbred line population derived from a Lycopwsicon esculentum X Lycopwsicon chrrsmanii cross. Theor. Appl. Genet. 90: 925-932.
KEIM, P., B. W. DIERS, T. OLSON and R. C. SHOEMAKER, 1990 RFLP mapping in soybean: association between marker loci and varia- tion in quantitative traits. Genetics 126: 735-742.
LIEDI., B. E., S. E. Lrc, D. ESPOSITO and M. A. MUTSCHI.ER, 1993 Identification and mapping of S in a self compatible F2 popula- tion of L. rsculmtum X I.. pennellii. Rept. Tomato Genet. Coop. 43: 33-35.
MII.I.ER, J. C., and S. D. TANKSIXY, 1990 FWLP analysis of phyloge- netic relationships and genetic variation in the genus Lycopwsi- con. Theor. Appl. Genet. 80: 437-448.
NIENHIJIS, J., T. HELENTJARIS, M. SI.OC:UM, B. RUGGERO and A. SCHAEFER, 1987 Restriction fragment length polymorphism analysis of loci associated with insect resistance in tomato. Crop Sci. 27: 797-803.
PATEKSON, A. H., E. S. IANDER, J. D. HEWITT, S. PETERSON, S. E. I.IN(:OLN et al., 1988 Resolution of quantitative traits into Men- delian factors, using a complete linkage map of restriction frag- ment length polymorphisms. Nature 335: 721-726.
PATERSON, A. H., J. W. DE-VERNA, B. LANINI and S. D. TANKSLEY, 1990 Fine mapping of quantitative trait loci using selected overlapping recombinant chromosomes, in an interspecific cross of tomato. Genetics 124: 735-74'2.
PATERSON, A. H., S. D. TANIGI.EY and M. E. SORRFLLS, l99la DNA markers in plant improvement. Adv. Agron. 46: 39-90.
PATERSON, A. H., S. DAMON, J. D. HEWITT, D. ZAMIR, H. D. RABINO-
WITCH et al., 1991b Mendelian factors underlying quantitative traits in tomato: comparison across species, generations and envi- ronments. Genetics 127: 181-197.
RICK, C. M., 1969 Controlled introgression of chromosomes of Soh- num pennellii into Lycqpersicon esculatum: segregation and recom- bination. Genetics 6 2 753-768.
RICK, C. M., 1974 High soluble-solids content in large-fruited to- mato lines derived from a wild green-fruited species. Hilgardia
RICK, C. M., 1982 The potential of exotic germplasm for tomato improvement, pp. 1-28 in Plant Improvement and Somatic Cell GP- netics, edited by I. K. VASIL, W. R. SCOWCROFT and K. J. FREY. Academic Press, New York.
SAS INSTITUTE lnc., 1994 JMP Statistics and Graphics Guide: version 3. SAS Institute Inc., Cary, NC.
SEGAI., G., M. S m x r I , M. A. SCHAFFER, N. OM, D. ZAMIR et al., 1992 Correlation of genetic and physical structure in the region sur- rounding the 1-2 FuJarium oxy.~porum resistance locus in tomato. Mol. Gen. Genet. 231: 179-185.
STEYENS, M. A., and J. RUDICH, 1978 Genetic potential for overcom- ing physiological limitations on adaptability, yield, and quality in the tomato. Hort. Sci. 13: 673-678.
STUBER, C. W., S. E. LINCOLN, D. E. WOLFF, T. HELENTJARIS and E. S. LANDER, 1992 Identification of genetic factors contribut- ing to heterosis in a hybrid from two elite maize inbred lines using molecular markers. Genetics 132: 823-839.
TANKSIXY, S. D. 1993 Mapping polygenes. Annu. Rev. Genet. 27:
TANKSLEY, S. D., M. W. CANAL, J. C. PRINCE, M. C. DE VICENTE, M. W. BONIERABALE et al., 1992 High density molecular linkage maps of the tomato and potato genomes: biological inferences and practical applications. Genetics 132: 1141 -1 160
WEHRHAHN, C., and W. AI.IARD, 1965 The detection and measure- ment of the effects of individual genes involved in the inheri- tance of a quantitative character in wheat. Genetics 51: 109-1 19.
WEIDF., R., M. F. VAN WORDRAGEN, R. KLEIN IANKHORST, R. VERKERK, PI al., 1993 Integration of classical and molecular linkage maps of tomato chromosome 6. Genetics 135: 1175-1186.
42: 493-510.
205-233.
Communicating editor: M. R. HANSON