Embed Size (px)
Citation preview
© Crown copyright 2004 Page 1
Introduction to upper air measurements with radiosondes and other in situ observing systems
John Nash, C. Gaffard ,R. Smout and M. SmeesObservation Development, Met Office, Exeter
Integrated Ground-based Observing Systems Applications for Climate, Meteorology and Civil Protection
03-07 September 2007, L’Aquila, Italy
© Crown copyright 2004 Page 2
Introduction
Introduction
Review of Radiosondes past and present
Sampling provided by radiosondes
Errors of radiosonde measurements
[Aircraft measurements, references provided].
© Crown copyright 2004 Page 3
Basic source on radiosondes and upper wind measurements
Guide to Meteorological Instruments and Methods of ObservationSeventh Edition [revised 2006]
WMO- No8
Should be available in electronic form from WMO by end of 2007.
Part I chapter 12 Measurement of upper air pressure, temperature
and humidity
chapter 13 Measurement of upper wind
Part IIchapter 10 Balloon Techniques
© Crown copyright 2004 Page 4
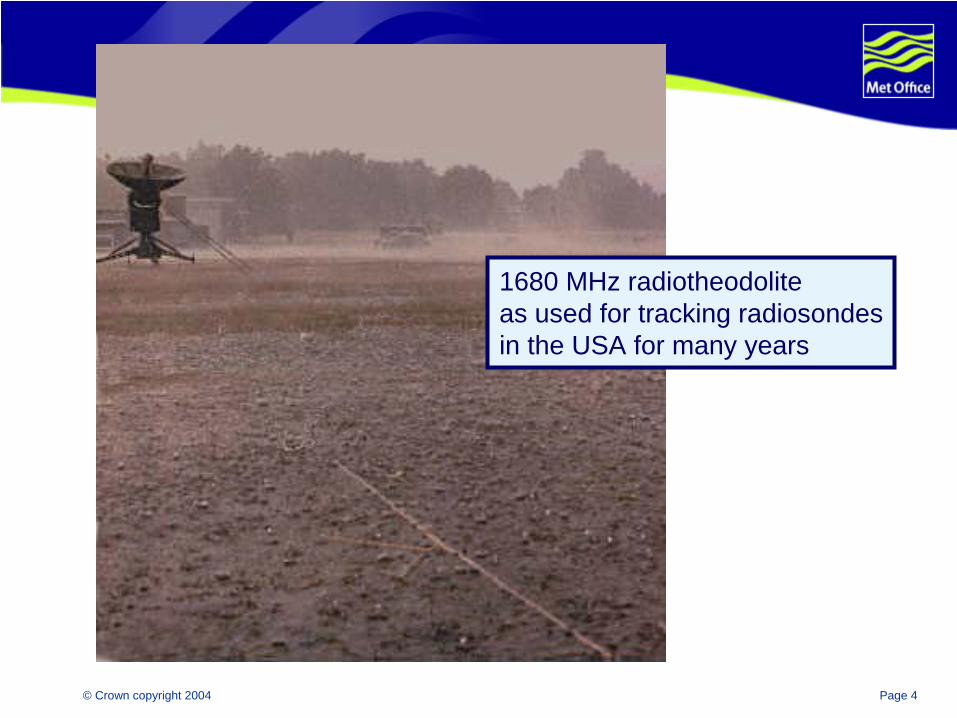
1680 MHz radiotheodoliteas used for tracking radiosondesin the USA for many years
© Crown copyright 2004 Page 5
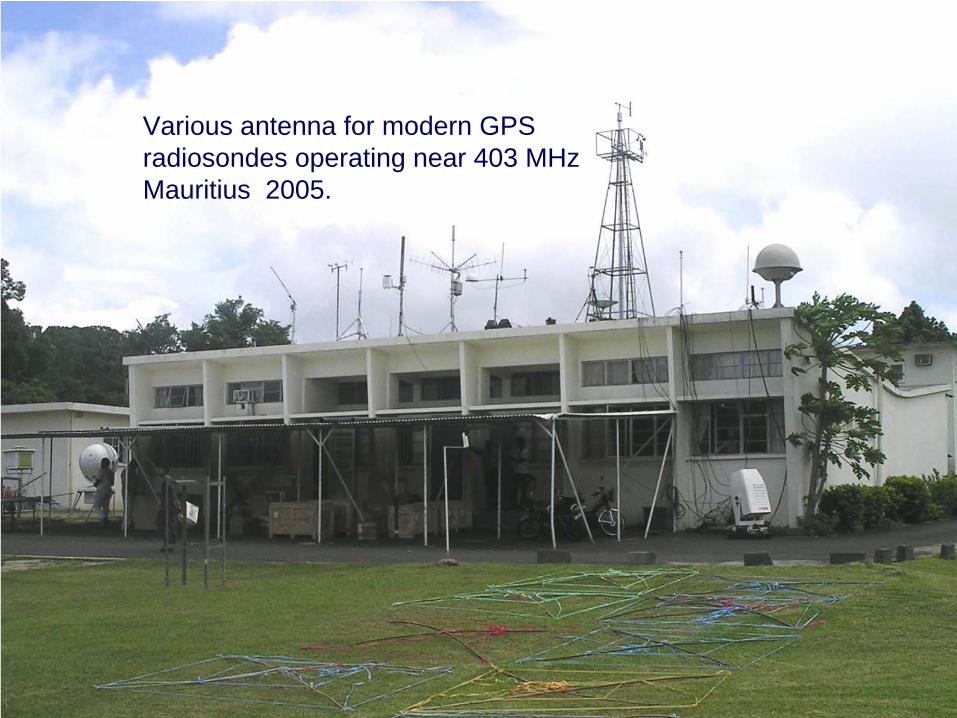
Various antenna for modern GPS radiosondes operating near 403 MHzMauritius 2005.
© Crown copyright 2004 Page 6
Upper wind
Wind profiles from radiosondes are derived from tracking the displacement of the balloon from the launch site as a function of time.
The radiosonde itself can be tracked using a radiotheodolite, secondary radar or reception of navigational signals by an antenna on the radiosonde. Terrestrial navigational signals Omega and Loran-C were commonly used from 1980 onwards, but now have mostly been replaced by GPS [Global Positioning System ] satellite signals.
In some countries radars were used to track a target hung under the balloon
The rate of ascent of the balloons can be between 5 and 8 ms-1, and the tracking techniques used with the older radiotheodolites allowed a resolution of about 2 minutes in wind near the ground and 4 minutes at best in the stratosphere. Now GPS signals allow a temporal resolution of a few seconds , but in fact winds are normally filtered longer than this to take out the rotation of the radiosondes in a pendulum under the balloon, since a suspension length of at least 20m is necessary to avoid contamination of the radiosonde measurements by the balloon at upper levels.
© Crown copyright 2004 Page 7
Balloon usage
The modern balloons routinely used by most meteorological services are either natural rubber latex or a synthetic latex .They expand as they ascend and will lift the radiosonde to heights between 20 and 26 km above the surface, before bursting. The weights of these balloons are usually between 200g and 500g
For more expenditure on a larger balloon, weight around 1000g, heights in excess of 30 km [ pressures lower than 10 hPa ] can be obtained before burst. The lifting gas may be hydrogen orhelium.
Very few stations in the GCOS Upper Air network manage to observe regularly to a pressure of 5 hPa.
Most modern radiosondes are not designed to observe accurately at pressures much lower than 5 hPa. However, observing heights as high as 40 km can be obtained using special plastic [non- expanding] balloons
© Crown copyright 2004 Page 8
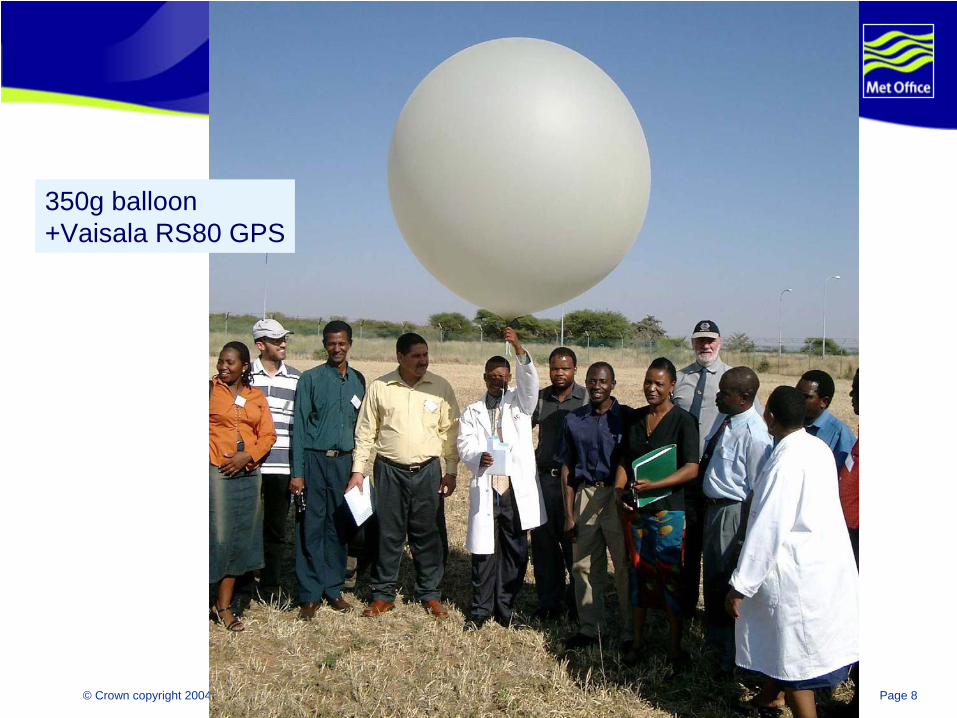
350g balloon+Vaisala RS80 GPS
© Crown copyright 2004 Page 9
Review of progress with radiosondes and radiosondes in use
In 1955, the radiosonde was the primary source of upper air information for meteorologists.
Large numbers of people were employed at an upper air station. Four to six persons on a shift. All reports were produced by hand from traces on chart recorders or decoded from coded radiosonde signals by hand.
Radio reception was relatively poor compared to modern systems, and this limited the ability to compare the output fromdifferent radiosondes flown together.
Hence, the WMO Radiosonde Comparison held in Payerne in 1956 was unable to provide any serious insight into the relativeperformance of the radiosonde types, and the reference radiosondes tested in WMO Reference Radiosonde Comparison conducted in 1968 did not agree very well.
In this period , the quality of the message was strongly dependent on the motivation of the staff to perform the calculations correctly.
© Crown copyright 2004 Page 10
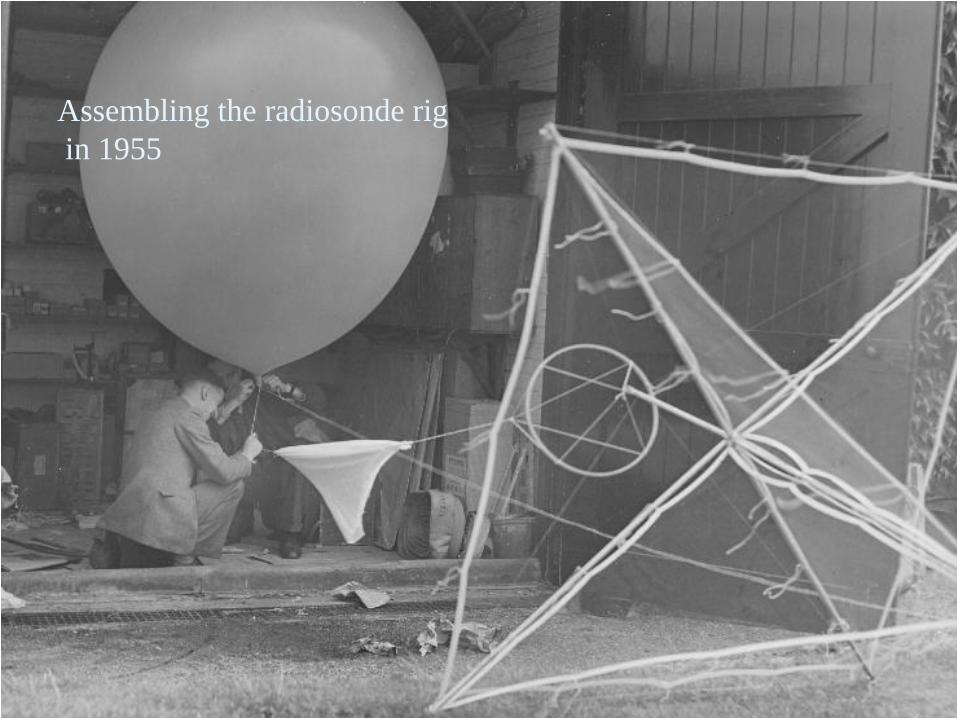
Assembling the radiosonde rigin 1955
© Crown copyright 2004 Page 11
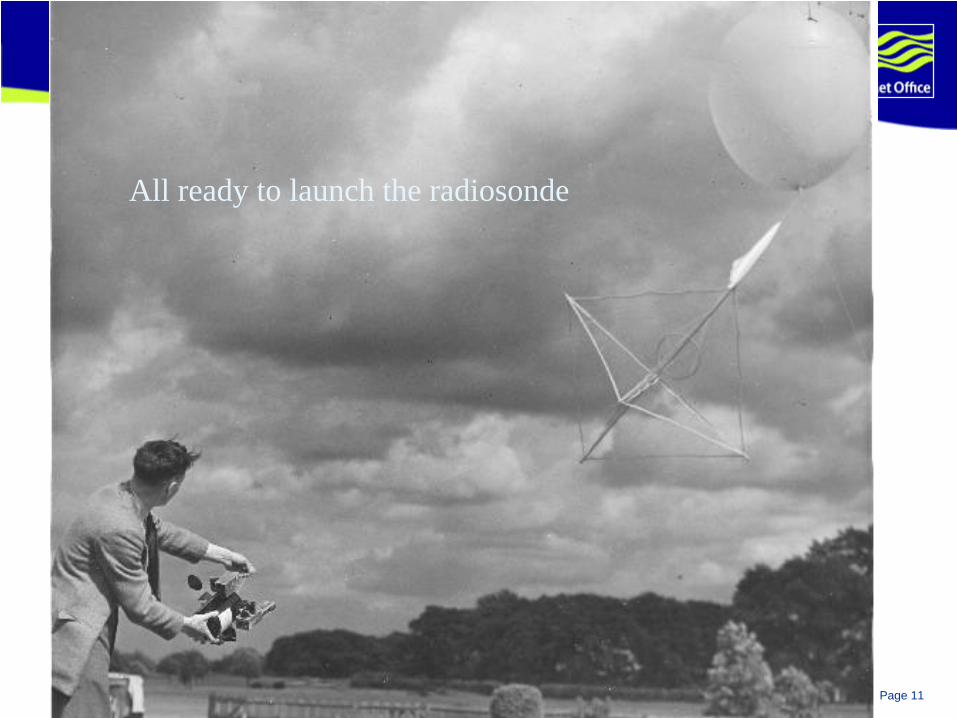
All ready to launch the radiosonde
© Crown copyright 2004 Page 12
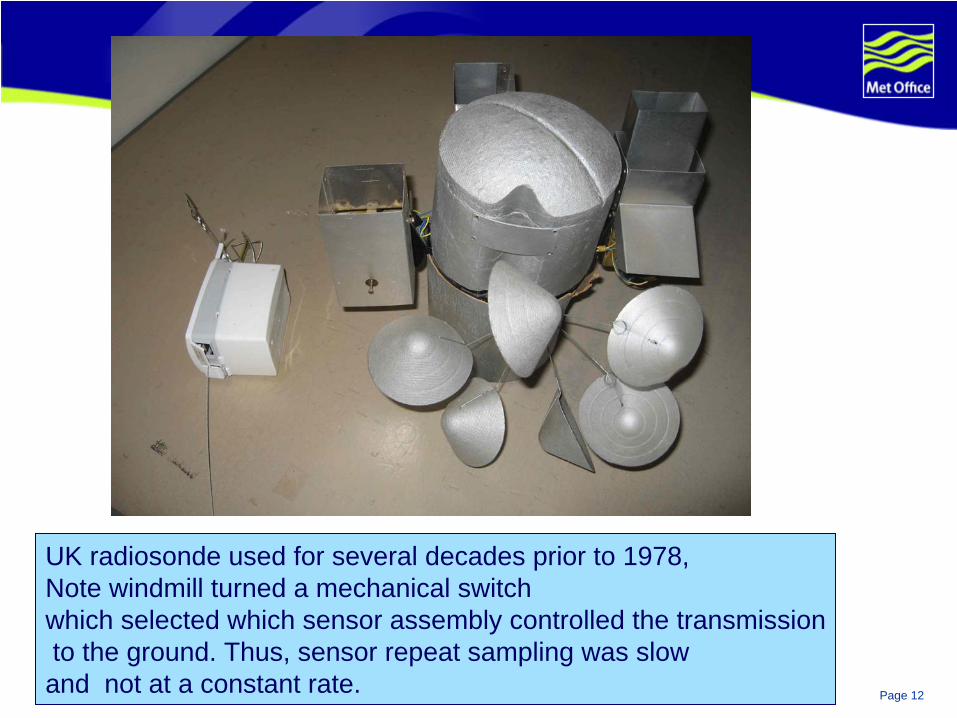
UK radiosonde used for several decades prior to 1978,Note windmill turned a mechanical switch which selected which sensor assembly controlled the transmissionto the ground. Thus, sensor repeat sampling was slow and not at a constant rate.
© Crown copyright 2004 Page 13
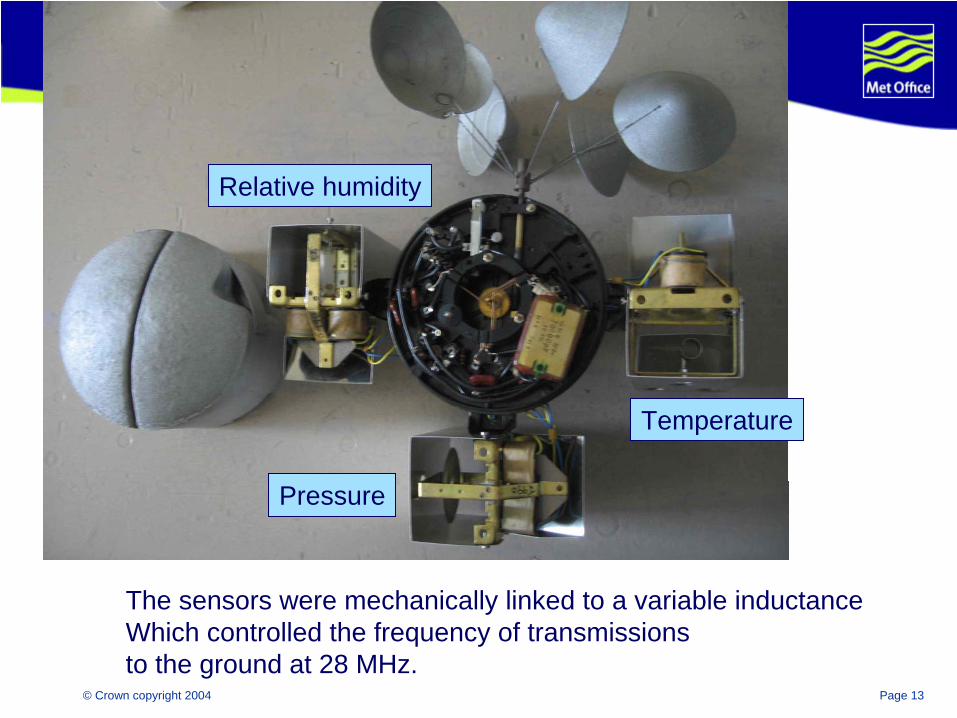
Pressure
Temperature
Relative humidity
The sensors were mechanically linked to a variable inductance Which controlled the frequency of transmissions to the ground at 28 MHz.
© Crown copyright 2004 Page 14
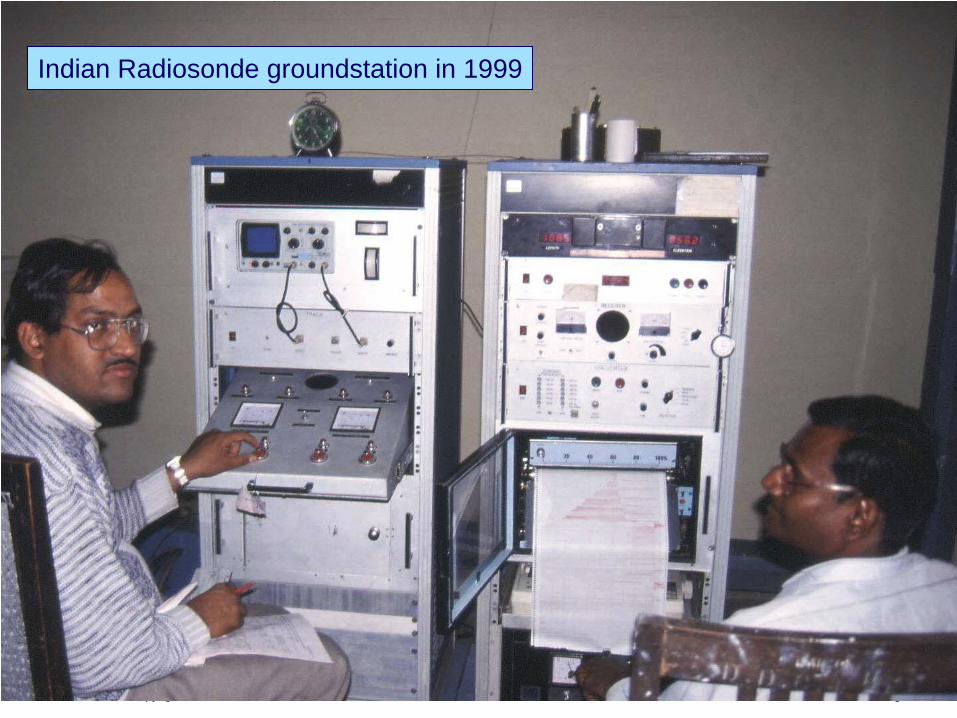
Indian Radiosonde groundstation in 1999
© Crown copyright 2004 Page 15
Coding of messages
Early radiosonde signals were transferred to special working diagrams after decoding or were made available on chart recorder outputs. The messsages sent were derived by hand.
So the results were reported in a code that allowed the values of temperature and dewpoint depression and wind to be reported at a set of standard pressure levels, e.g. 850, 700, 500, 300, 200, 100, etc. hPa. Here the values were supposed to be those actually measured. In addition the message contained an additional set of levels that allowed the temperature profile structure to be reproduced to ± 1 C in the troposphere and ± 2 C in the stratosphere, and the relative humidity profile to ± 15 per cent.
When radiosonde observations started these coding errors were probably not much different to the errors in the sensor measurements, but this is not the case today. The sensor sampling rates in the old radiosondes were not high , but now detailed profile observations with the sensors sampled every second, can be exploited by taking detailed data from the ground system archives and not relying on the approximations in the TEMP code. A new BUFR code representing the detailed data is currently in the process of implementation.
© Crown copyright 2004 Page 16
By early 1980’s
Information from satellite remote sensing was expected to replace radiosondes by 1990.
However, advances in electronics were allowing the introduction of improved data transmission and reception, electronic multiplexing of sensor output, improved sensors and affordable computers to process data semi-automatically or automatically.
Thus, those countries able to take advantage of these innovations were able to change the quality and accuracy of radiosonde output, and to make it very much less dependent on the operator motivation.
© Crown copyright 2004 Page 17
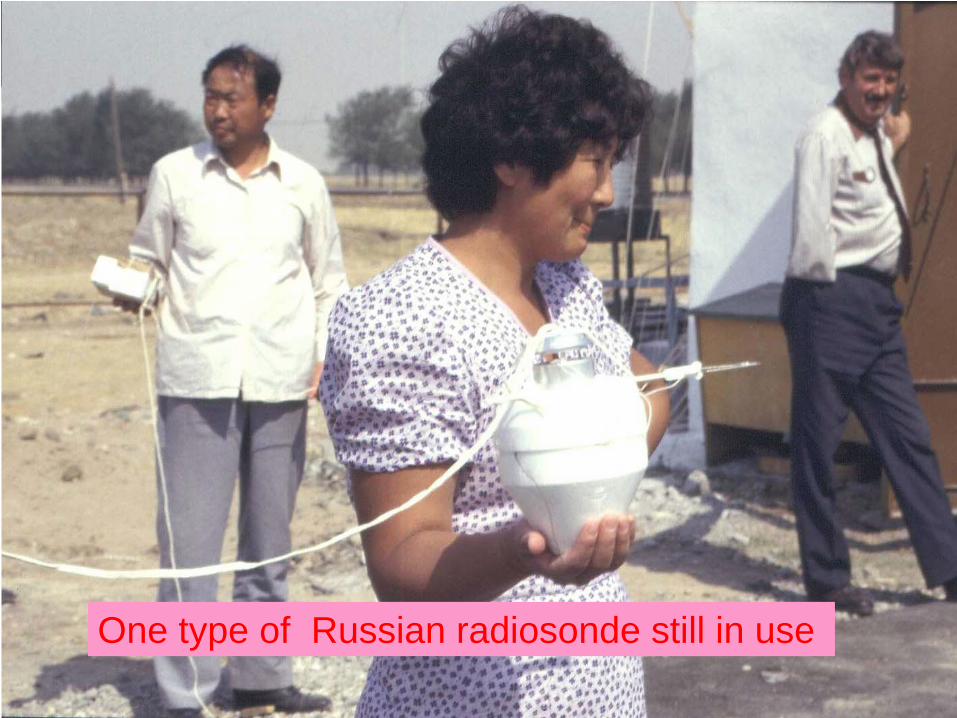
One type of Russian radiosonde still in use
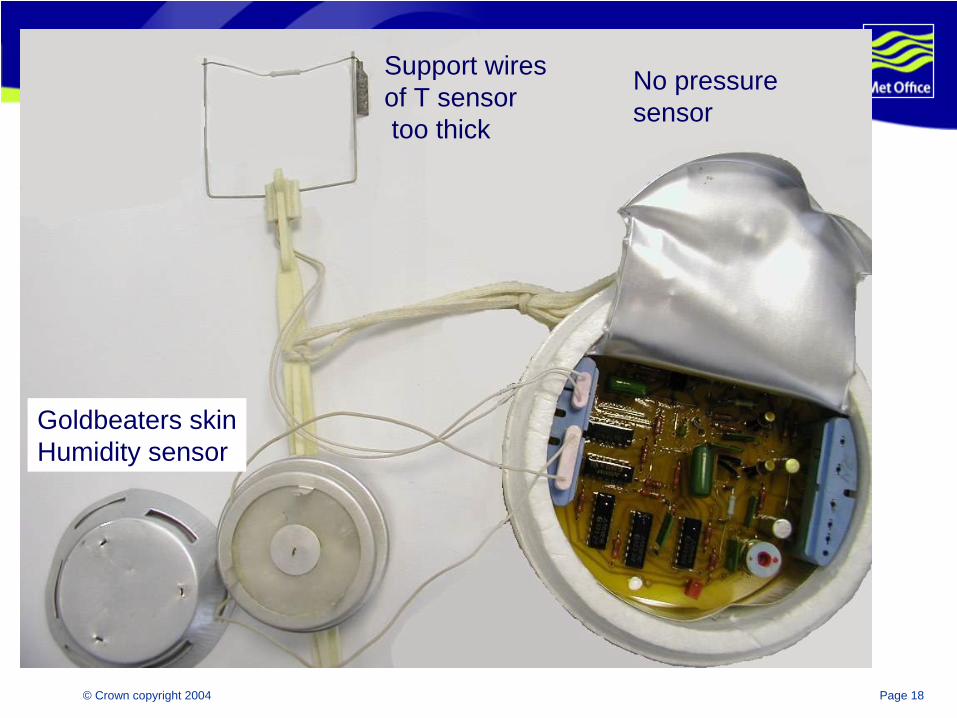
© Crown copyright 2004 Page 18
Goldbeaters skinHumidity sensor
Support wires of T sensortoo thick
No pressuresensor
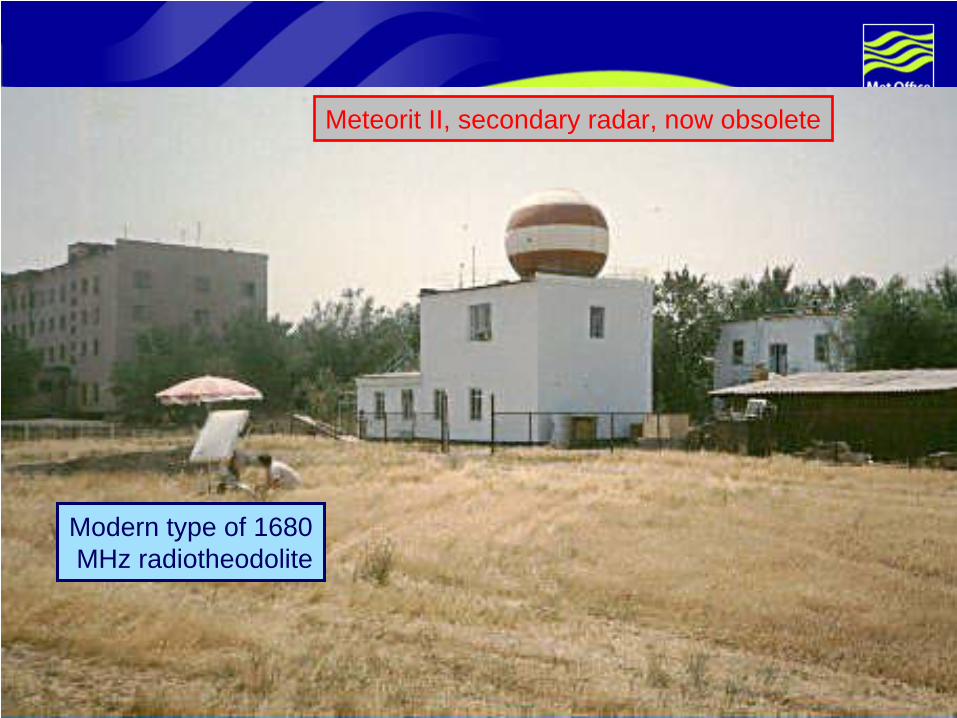
© Crown copyright 2004 Page 19
Modern type of 1680MHz radiotheodolite
Meteorit II, secondary radar, now obsolete
© Crown copyright 2004 Page 20
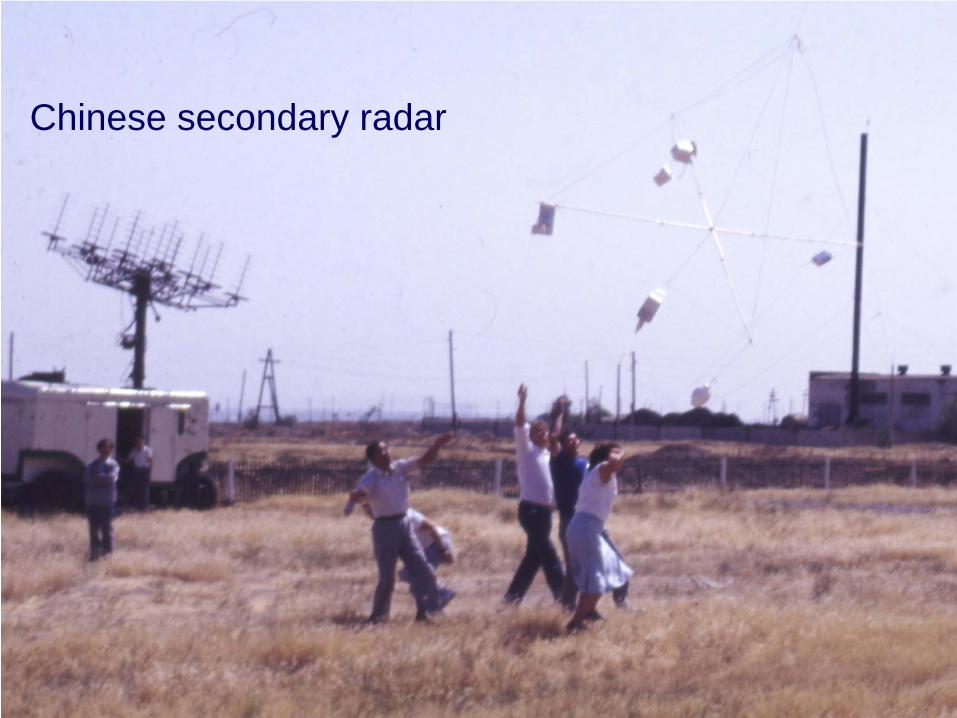
Chinese secondary radar
© Crown copyright 2004 Page 21
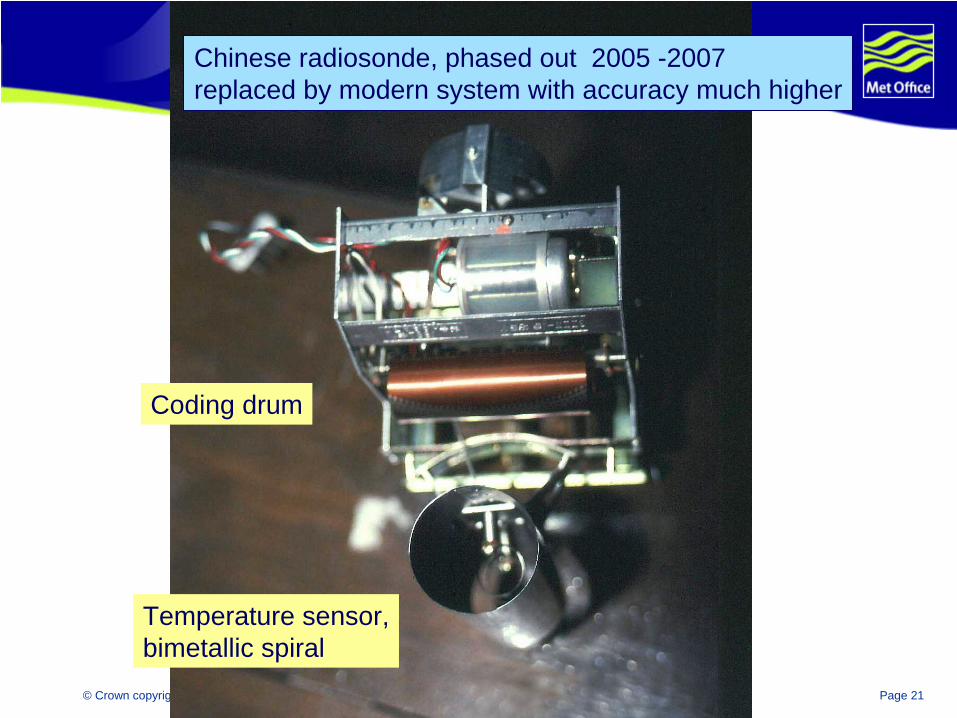
Coding drum
Temperature sensor,bimetallic spiral
Chinese radiosonde, phased out 2005 -2007replaced by modern system with accuracy much higher
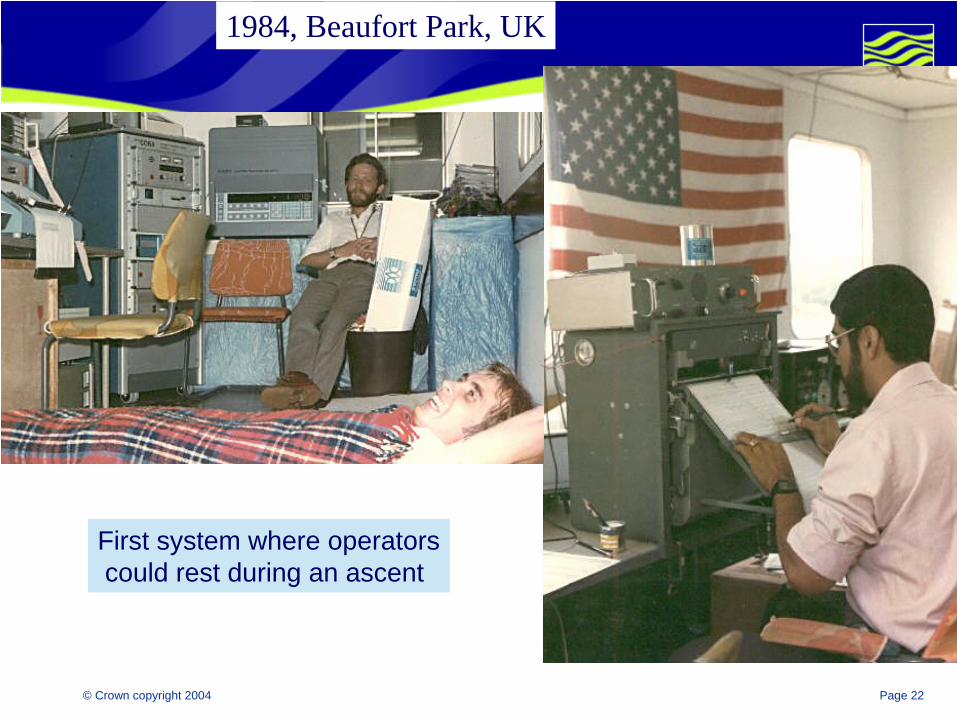
© Crown copyright 2004 Page 22
First system where operatorscould rest during an ascent
1984, Beaufort Park, UK
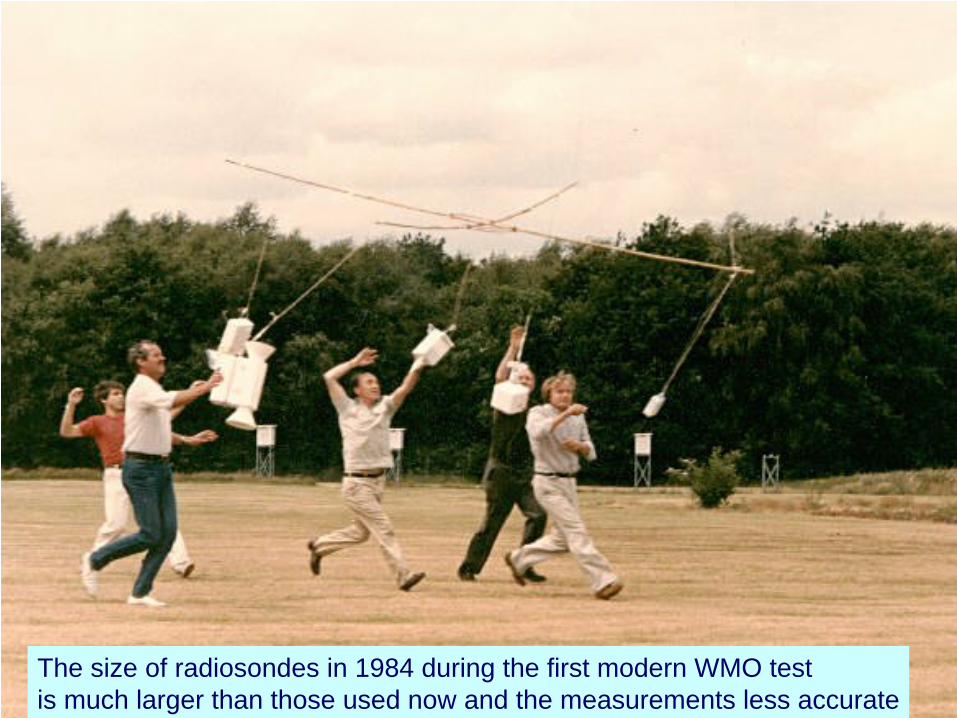
© Crown copyright 2004 Page 23
The size of radiosondes in 1984 during the first modern WMO testis much larger than those used now and the measurements less accurate
© Crown copyright 2004 Page 24
In recent years
A new generation of radiosondes has been introduced exploiting ASIC [Application Specific Integrated Circuits] developments. This allows the use of decoded GPS signals, giving very accurate windmeasurements and accurate height measurements. Occupied bandwidth has been reduced on standard radiosondes, and transmissions are more stable than in earlier standard designs.
Temperature and relative humidity sensors have also been improved to extend the useful vertical range of both measurements , so reliable temperatures can be measured to pressures as low as 5 hPa and reliable relative humidity to temperatures as low as -70 deg C.
Aircraft measurements are expected to reduce the number of regular radiosonde launches
Ground-based remote sensing systems are being developed to provide continuous upper –air measurements at high temporal resolution, but often lower vertical resolution.
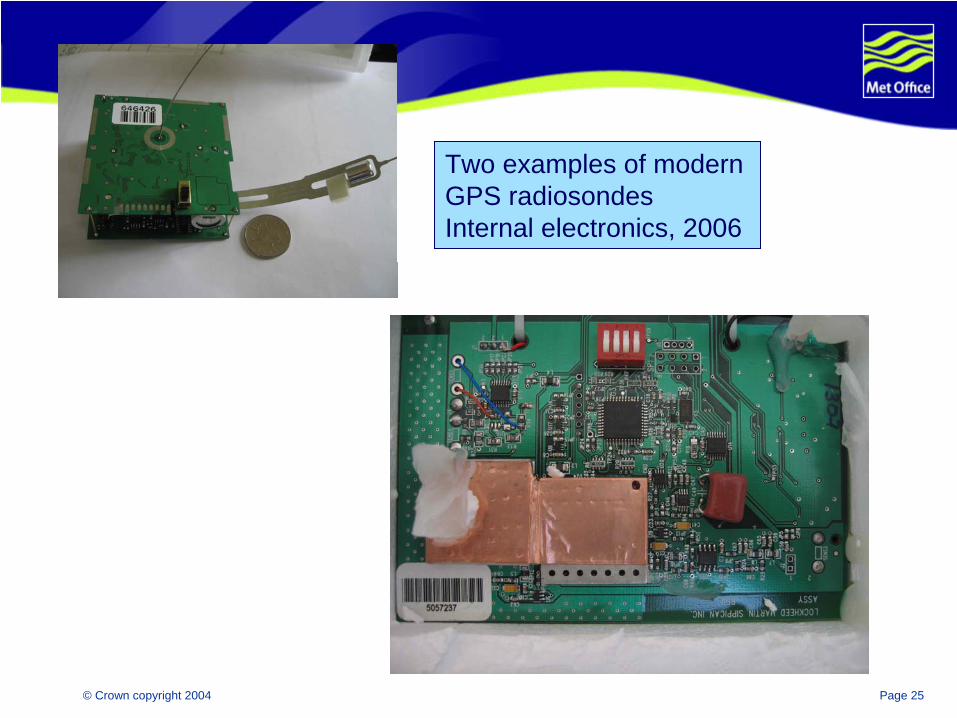
© Crown copyright 2004 Page 25
Two examples of modern GPS radiosondes Internal electronics, 2006
© Crown copyright 2004 Page 26
Summary
The design and characteristics of radiosondes in use has changed radically with time, so that representations of radiosonde systems stuck in the past is largely untrue.
However in some countries , relatively poor systems still remain, so that not all of the 700 civilian stations making measurements daily have the same error characteristics
The better radiosonde are able to meet the most exacting user requirements for all operational use and scientific studies, apart from possibly the very high accuracy requested for relative humidity in the upper troposphere for climate trend studies.
Detailed description of the various radiosonde observing principles can be found in the CIMO Guide[2006].
A knowledge of radiosonde errors is essential when using radiosondes to compare with remote sensing measurements. This includes an understanding of the representativeness errorsfrom the rapid ascent of the balloon through the vertical structure of the atmosphere, usually 1 km in the vertical in about 3 minutes.