Embed Size (px)
Citation preview
Detrick, R., Honnorez, J., Bryan, W. B., Juteau, T., et al., 1990 Proceedings of the Ocean Drilling Program, Scientific Results, Vol. 106/109
17. M E A S U R E M E N T S O F T H E P E R M E A B I L I T Y O F T H E U P P E R O C E A N I C C R U S T A T H O L E 395A, O D P L E G 109 1
Keir Becker2
ABSTRACT
An inflatable drill-string packer was used to measure the in-situ bulk permeability of two zones within the 571 m of 7.3-m.y.-old crustal section overlain by 93 m of sediment in Hole 395A. Downhole temperatures (Becker et al., 1984; Kopietz et al., this volume) indicate that the upper 200-250 m of basalt (to a depth of about 350 m below seafloor, or mbsf) is quite permeable, about 10_14-10-13 m2. During Leg 78B, Hickman et al. (1984a) measured a very low permeability for the section 583-664 mbsf, about 10~I8-1(T17 m2. During Leg 109, the packer was inflated first at 396 mbsf, isolating the section 396-606 mbsf with good results, and then at 516 mbsf, isolating the section 516-606 mbsf with some leakage past the packer and poor results. At both depths, standard slug tests and constant-rate injection tests were conducted. The results indicate that the bulk permeability of the section 396-606 mbsf is on the order of 10~14 m2. Thus, with the exception of the impermeable zone measured by Hickman et al. (1984a), most of the basement section cored in Hole 395A is quite permeable, and would support active hydrogeological processes such as those modeled by Langseth et al. (1984).
INTRODUCTION
The bulk porosity and permeability of the upper oceanic crust probably depend on irregular fracturing and voids of uncertain scale, which cannot be represented by dredged or cored samples. Given present technology, the crustal porosity and permeability are best measured in situ from deep boreholes, preferably at averaging scales large enough to fully include the effects of irregular fracture porosity. We report here the methods, data, and preliminary results of two such in-situ packer experiments, which were conducted during Leg 109 of the Ocean Drilling Program (ODP) to assess the bulk permeability of the section of upper oceanic crust penetrated by Hole 395A.
SITE LOCATION AND PREVIOUS HYDROGEOLOGICAL MEASUREMENTS
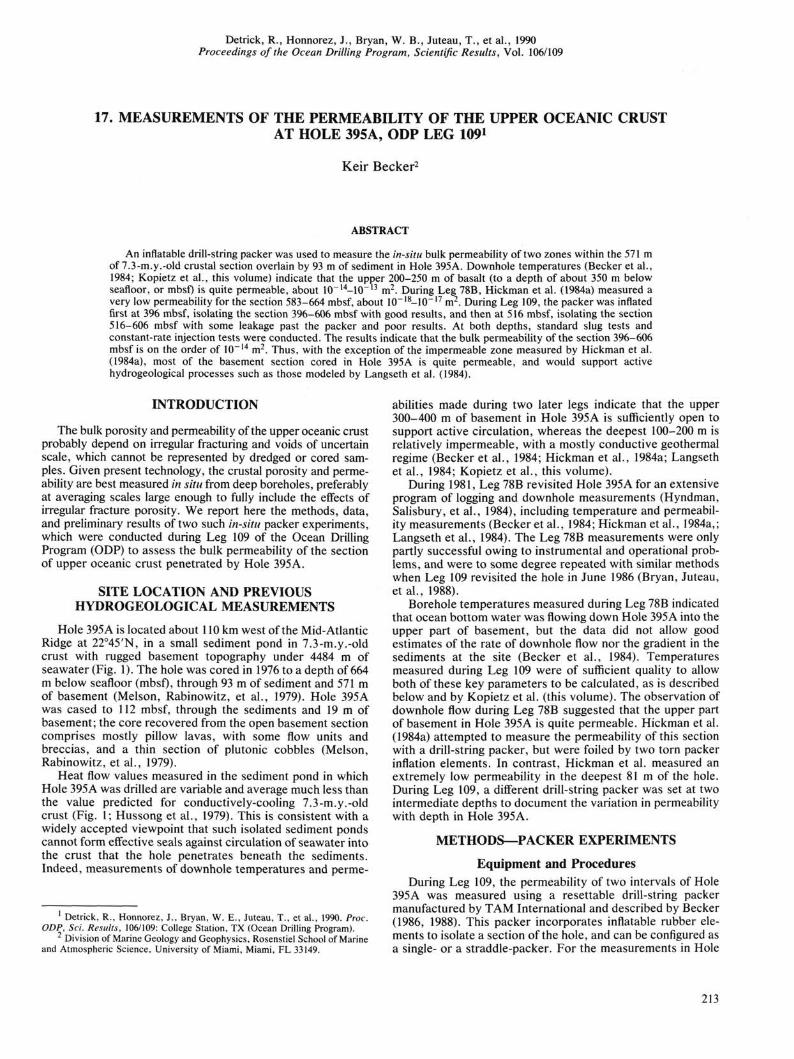
Hole 395A is located about 110 km west of the Mid-Atlantic Ridge at 22°45'N, in a small sediment pond in 7.3-m.y.-old crust with rugged basement topography under 4484 m of seawater (Fig. 1). The hole was cored in 1976 to a depth of 664 m below seafloor (mbsf), through 93 m of sediment and 571 m of basement (Melson, Rabinowitz, et al., 1979). Hole 395A was cased to 112 mbsf, through the sediments and 19 m of basement; the core recovered from the open basement section comprises mostly pillow lavas, with some flow units and breccias, and a thin section of plutonic cobbles (Melson, Rabinowitz, et al., 1979).
Heat flow values measured in the sediment pond in which Hole 395A was drilled are variable and average much less than the value predicted for conductively-cooling 7.3-m.y.-old crust (Fig. 1; Hussong et al., 1979). This is consistent with a widely accepted viewpoint that such isolated sediment ponds cannot form effective seals against circulation of seawater into the crust that the hole penetrates beneath the sediments. Indeed, measurements of downhole temperatures and perme-
1 Detrick, R., Honnorez, J., Bryan, W. E., Juteau, T., et al., 1990. Proc. ODP, Sci. Results, 106/109: College Station, TX (Ocean Drilling Program).
Division of Marine Geology and Geophysics, Rosenstiel School of Marine and Atmospheric Science, University of Miami, Miami, FL 33149.
abilities made during two later legs indicate that the upper 300-400 m of basement in Hole 395A is sufficiently open to support active circulation, whereas the deepest 100-200 m is relatively impermeable, with a mostly conductive geothermal regime (Becker et al., 1984; Hickman et al., 1984a; Langseth et al., 1984; Kopietz et al., this volume).
During 1981, Leg 78B revisited Hole 395A for an extensive program of logging and downhole measurements (Hyndman, Salisbury, et al., 1984), including temperature and permeability measurements (Becker et al., 1984; Hickman et al., 1984a,; Langseth et al., 1984). The Leg 78B measurements were only partly successful owing to instrumental and operational problems, and were to some degree repeated with similar methods when Leg 109 revisited the hole in June 1986 (Bryan, Juteau, e ta l . , 1988).
Borehole temperatures measured during Leg 78B indicated that ocean bottom water was flowing down Hole 395A into the upper part of basement, but the data did not allow good estimates of the rate of downhole flow nor the gradient in the sediments at the site (Becker et al., 1984). Temperatures measured during Leg 109 were of sufficient quality to allow both of these key parameters to be calculated, as is described below and by Kopietz et al. (this volume). The observation of downhole flow during Leg 78B suggested that the upper part of basement in Hole 395A is quite permeable. Hickman et al. (1984a) attempted to measure the permeability of this section with a drill-string packer, but were foiled by two torn packer inflation elements. In contrast, Hickman et al. measured an extremely low permeability in the deepest 81 m of the hole. During Leg 109, a different drill-string packer was set at two intermediate depths to document the variation in permeability with depth in Hole 395A.
METHODS—PACKER EXPERIMENTS
Equipment and Procedures During Leg 109, the permeability of two intervals of Hole
395A was measured using a resettable drill-string packer manufactured by TAM International and described by Becker (1986, 1988). This packer incorporates inflatable rubber elements to isolate a section of the hole, and can be configured as a single- or a straddle-packer. For the measurements in Hole
213

K.BECKER
22°52'N
22°42' 46°09'W 46°00'
Figure 1. The sediment pond in which Hole 395A is located (after Hussong et al., 1979). Bathymetry is shown in corrected meters, and sediment isopachs are given in seconds of two-way travel-time. Also shown are the boundaries of magnetic anomaly 4 and heat flow values in mW/m2.
395A, it was configured with two elements, and used as a double-seal packer (not as a straddle packer), to isolate the zone between the bottom of the hole and the dual seal (Fig. 2). This packer assembly was inflated twice, at 396 mbsf and at 516 mbsf, to determine the bulk permeability of the respective intervals between these depths and the bottom of the hole.
The packer is actuated using a "go-devil" that is dropped down the drill string into the packer inflation sub-assembly, where a rubber seal on the go-devil directs seawater pumped from the ship into the inflatable packer elements. Once the packer elements are fully inflated and gripping the borehole, the packer holds the bottom-hole assembly (BHA) in the hole, and the drill-string heave compensator is adjusted to transfer and maintain 10,000-20,000 lb weight (in the form of drill collars in the BHA immediately above the packer) onto the inflated packer. This weight shifts a sleeve in the inflation sub-assembly downward, closing the inflation-deflation port to the packer elements and opening the interval isolated by the packer to fluid pressure or flow applied by the shipboard pumps.
The go-devil also carries pressure recorders (in this case, two carefully calibrated mechanical Kuster K-3 recorders) to monitor downhole fluid pressures in the isolated, pressurized zone during the experiment. While it would have been possible to include a one-way check valve in the go-devil to restrict the pressurized zone to exactly the isolated zone, no such check valve was used during Leg 109. Therefore, the fluid in the entire drill string as well as the isolated zone was pressurized during testing, and a pressure transducer at the rig floor was also used to provide a real-time indication of downhole events. Volumes and rates of fluids pumped into the isolated zone were monitored by timing changes in the volume of the pump reservoir.
Figure 2. Sketches of inflatable drill-string packers. A. Single-element packer, which isolates the formation between the inflation element and the bottom of the hole. B. Straddle packer, which isolates the zone between the elements. For the measurements reported here, two inflation elements were used in series, not as a straddle packer, but as a dual-seal single packer that isolated the section between the dual seal and the bottom of the hole.
Before the packer was set, the drill string was filled with seawater, and air was vented from the drill string and the plumbing connecting it to the pump. Then the integrity of the closed system was tested to 15-20 MPa, over twice the pressure applied during any of the permeability measurements. Once the packer was set as described above, two kinds of experiments were used to determine the permeability of the isolated interval, pulse or "slug" tests and constant-rate injection tests. The methods used were similar to those described by Anderson and Zoback (1982), Hickman et al. (1984a), and Anderson et al. (1985) in conducting packer experiments in Holes 395A and 504B during the Deep Sea Drilling Project. Injection tests generally disturb the pressure field in the formation much more than slug tests, and were therefore conducted after the slug tests at each inflation depth.
Slug Test Procedures The slug tests were conducting following the methods for
the modified slug test of Bredehoeft and Papadopulos (1980), which is an adaptation of the slug test method of Cooper et al. (1967) and Papadopulos et al. (1973) for formations with relatively low permeabilities. The modified slug test involves applying a short pressure pulse to the fluid in the zone isolated by the packer, and monitoring the decay of this pulse as the pressurized fluid flows from the borehole into the isolated formation.
The decay of such a pressure pulse is analogous to the decay of the frictional heating pulse on penetration of an oceanographic heat flow probe into sediments (Bullard, 1954; Carslaw and Jaeger, 1959), and is described by virtually the
214

MEASUREMENTS OF PERMEABILITY OF UPPER OCEANIC CRUST, HOLE 395A
same equation (Cooper et al., 1967; Bredehoeft and Papadop-ulos, 1980):
P(X)/PQ = F(a,(3).
Here, P is pressure in excess of an initial reference value, t is time, PQ is the initial pressure increase, a is a dimensionless parameter that depends on the storage coefficient (S) and porosity ((f)) of the isolated formation, /3 is a dimensionless parameter that depends on the transmissivity (7) and permeability (k) of the formation, and F is a complicated infinite integral. More specifically,
a = m2S/VwCwpwg
(3 = 7rTt/VwCwpwg
S = b<f)C[Plg
T = bkpig/n,
where g is gravitational acceleration, a is the radius of the hole in the isolated zone, b is the height of the isolated zone, Cx, p„ and /x are respectively the compressibility, density, and dynamic viscosity of the fluid in the isolated zone, and Cw and pw are the compressibility and density of the fluid in the total pressurized volume Vw. The function F(a, /3) is given by
F(a,p) = (Sa/Ti2) j du exp(-0u2/a)/uf(u,a)
where f(u,a) = [uJ0(u) - 2aJ,(u)]2 + [uY0(u) - 2aY,(u)]2, u is the variable of integration, and JQ, /,, Y0, and F, are Bessel functions of the first and second kind.
To process the pressures measured during slug tests, we followed the standard curve-fitting method described by Cooper et al. (1967) and Papadopulos et al. (1973), as follows: A plot of measured pressures vs. log time was superposed on a family of type curves of F(a,/3) vs. log (3 calculated for various values of a spanning several orders of magnitude. The data plot was then shifted along the abscissa of the type-curve plot to visually determine the value of a for which the data best fit the type curve. Then the transmissivity and average permeability of the tested interval could be calculated from the correspondence between the values of time and (3 for the best-fit curve, using the definitions for (3 and transmissivity listed above.
As noted by Cooper et al. (1967), Papadopulos et al. (1973), and Hickman et al. (1984a), the calculated type curves are fairly similar over a wide range in values of a, and significant errors in the choice of a are likely in the curve-matching procedure. Fortunately, the large errors possible in determining a result in relatively small corresponding errors in the determination of transmissivity and permeability. Thus, this procedure yields relatively poor estimates of storage coefficient and porosity, but better determinations of transmissivity and average permeability.
To justify the application of this theory for an instantaneous pressure pulse to real slug test data, the rise time of the slug test should be short compared to the decay time. For each slug test conducted during Leg 109, the ship's cement pump was used to inject a small volume or "s lug" of seawater into the drill string (which was already full of seawater at hydrostatic pressure), and the decay of the resultant pressure pulse was monitored with recorders both downhole and on the rig floor. Typically, 500-1000 L was pumped into the drill string in 0.5-1 min, to produce a pulse with an initial pressure rise on the order of 1 MPa in the
isolated zone. Several of the pulses decayed very quickly, dropping to hydrostatic pressure within a few minutes; the data from these particular slug tests are therefore considered unreliable.
Constant-Rate Injection Tests In a relatively permeable formation, the pressure signal
from a slug test will decay quite rapidly, and a better determination of permeability can be obtained by conducting a constant-rate injection test. In such an experiment, fluid pressure in the borehole within the isolated zone is monitored as fluids are pumped into the formation at a constant rate. The rise of pressure in the borehole as injection proceeds for a fairly long time is analogous to the rise of temperature of a heated needle probe used to measure thermal conductivity of sediments (Jaeger, 1958; Von Herzen and Maxwell, 1959), and is described by nearly the same equation (Horner, 1951; Matthews and Russell, 1967):
P(a,t) = (<7/M/47rkb)ln(y</>AiCia2/4kt),
where q is the flux of injected fluids, assumed to originate as a line source at the borehole, y is Euler's constant, and the remaining parameters are defined above. Thus, the transmissivity and average permeability of the isolated zone can be determined directly from the slope of a plot of pressure vs. In time, given a measured constant injection rate.
For the four injection tests attempted in Hole 395A during Leg 109, seawater was pumped into the zones isolated by the packer, for 0.4-0.7 hr at fixed rates of about 5-7 L/s. During each of these tests, the rate of injection was kept constant within 5%-10%. The actual rates were determined by timing the withdrawal of seawater from the two 50-bbl pump reservoirs, which were graduated in 5-bbl (159 L) intervals. The two reservoirs were alternately filled and pumped from, so that there were no breaks in the continuous delivery of fluid to the isolated zone.
ASSUMPTIONS, APPROXIMATIONS, AND SOURCES OF ERROR AND UNCERTAINTY
In-situ Permeability vs. Calculated Bulk Permeability Both slug and injection tests involve an important assump
tion - that the permeability of the rock in the zone isolated by the packer is uniform and isotropic. This assumption is probably not valid for the upper oceanic crust, where permeability may be dominated by fractures and large-scale interconnected porosity at irregular scales. Nevertheless, it probably becomes more valid as the scale of the permeability tests (i.e., the length of the zone isolated by the packer) increases with respect to the spacing of the fractures (Parsons, 1966). The permeabilities computed here are Darcian or equivalent porous-media permeabilities, denoted as bulk permeabilities, obtained by applying the theory for uniformly permeable media. If the in-situ permeability is indeed dominated by isolated fractures, the actual hydraulic conductivities of such fractures may be orders of magnitude greater than the trans-missivities reported here.
Integrity of the Packer Seal The validity of results obtained with a packer obviously
depends on the hydraulic integrity of the seal made with the inflatable elements. However, given that the annulus of an ODP hole is open to an infinite reservoir of seawater at hydrostatic pressure, it would be extremely difficult to sense any possible leakage of fluids upward past the inflation elements) . If such leakage occurred past a packer that isolates
215

K. BECKER
an impermeable zone, it might be clear in the pressures measured in the isolated zone. However, if a packer isolated a relatively transmissive zone, as occurred during Leg 109, leakage past a partially effective seal would be difficult to distinguish in the measured pressures. Slight leakage past a packer would result in calculated transmissivities and permeabilities greater than the real values, so the values calculated here must be considered upper bounds on the transmissivities and bulk permeabilities of the zones isolated in Hole 395A. As is discussed below, it appears that the packer seal leaked during much of the testing at the second packer setting in Hole 395A, allowing only a crude upper bound on permeability to be calculated.
Model-Fitting Procedures For both slug tests and injection tests, the bulk permeabil
ity is derived from parameters determined from the best fit of measured pressures to those predicted by models valid for isotropically permeable formations. For injection tests, the bulk permeability is calculated from the slope of a plot of pressure vs. In time; this slope is calculated using standard least squares techniques, which then allow objective error estimates. However, as noted above, the analysis for slug tests involves fitting measured pressures to type curves subjectively, with no rigorous assessment of possible errors. In interpreting past slug test results in the upper oceanic crust, Anderson and Zoback (1982), Hickman et al. (1984a), and Anderson et al. (1985) have estimated the uncertainties in calculated transmissivities and bulk permeability values by deliberately mis-fitting the type curves by ± an order of magnitude in a. For bulk permeabilities typical of young oceanic crust, the uncertainties so estimated for the results of slug tests are about ± 30%.
Properties of the Fluids in the Pressurized System The equations listed above demonstrate that the transient
pressures measured during both slug and injection tests depend on the properties of the pressurized fluids, particularly viscosity and compressibility, which vary with both temperature and pressure. For the temperature-dependent viscosity of seawater, we follow Anderson et al. (1985) in using Gartling's (1977) equation, AI(10"3 Pa-s) = 16.68T-08987, with T in °C. For in-situ temperatures of 15°-20°C in the zones tested during Leg 109, this yields a viscosity of about 1.2-1.3 x 10"3 Pa-s. This value was used for all calculations reported here, and is consistent with the value of 1.21 x 10~3 Pa-s used by Hickman et al. (1984a) for the deeper, slightly warmer section of Hole 395A.
As noted by Neuzil (1982), the compressibility of the fluid in a shut-in hole is sometimes greater than that of the pure fluid (seawater in this case), because of (1) compliance of the drill string and test equipment and (2) air possibly trapped in the system. While every effort was made during Leg 109 to purge all air from the drill string, pump, and connecting plumbing, it was possible that air remained in the system. Such trapped air would affect the system compressibility, and the calculated transmissivity and bulk permeability, which are directly proportional to the compressibility. As recommended by Neuzil, during slug tests the pumped volumes were carefully recorded, to determine the effective compressibility of the pressurized fluid system by the definition of compressibility: C = dV/VdP. Our results (Table 1), like Neuzil's, showed actual compressibilities on the order of 5-10 times the tabulated values for seawater. Transmissivities and bulk permeabilities reported here are presented for two different values of compressibility, the average measured value and the value for seawater (about 4 x 10~10 Pa - 1) used by Hickman et al. (1984a).
Table 1. System compressibilities determined from the pressure increases measured in the isolated zones during the slug tests conducted in Hole 395A. Note the consistency of results obtained during the slug tests from each inflation, and the difference in the average values for the two inflations.
Slug aVolume aPeak downhole "Calculated test pumped pressure increase compressibility no. (m3) (MPa) (10~9 Pa"1)
Packer set at 396 mbsf, atotal pressurized volume = 66.1 m 3 0.72 1.57 6.87 4 0.56 1.48 5.67 5 0.56 1.54 5.47 Average value 6.0
Packer set at 516 mbsf, atotal pressurized volume = 56.3 m 12 0.72 6.16 2.06 13 0.72 6.28 2.02 Average value 2.04
aThe total pressurized volumes include the isolated zones, the drill-string, and the rig-floor plumbing. The pressurized volumes, pumped volumes, and resultant pressure increases were measured to accuracies of better than 5%, so the uncertainties in calculated compressibilities are on the order of 10%.
Uncertainties in the Total Depth of Hole 395A When using a single packer to measure bulk permeability,
the bottom of the hole becomes the bottom of the test interval, and the height of the test interval is defined obviously as the difference between the packer inflation depth and the bottom of the hole. When Hole 395A was reentered during Leg 78B, over 5 yr had passed since the hole had been drilled, and the deepest 55 m of the hole was blocked, presumably by cavings. When the hole was revisited again during Leg 109, over 10 yr after it had been drilled, an additional 3 m of the hole was blocked. Thus, during the Leg 109 experiments, 494 m of the hole was open, between the bottom of casing at 112 mbsf (or 19 m into basement) and the top of the blockage at 606 mbsf.
The 58 m of blocked hole have presumably been filled by cavings of uncertain permeability, and might be thought to introduce uncertainties of 58 m in the heights of the zones isolated by the packer—apparent uncertainties of 210-268 m for the packer inflation at 396 mbsf, and 90-148 m for the inflation at 516 mbsf. During Leg 78B, Hickman et al. (1984a) set a packer only 23 m above 55 m of blocked hole, and measured a very low transmissivity and permeability. They argued that the cavings were probably much more permeable than the isolated formation, and used the original hole depth (664 mbsf) for the bottom of their test interval. In contrast, the zones isolated during Leg 109 appeared to be relatively transmissive and permeable. Therefore, the 58 m section of impermeable hole blocked by cavings cannot have contributed in any significant way to the transmissivities of the zones isolated during Leg 109, and the bulk permeabilities and transmissivities reported here are calculated assuming that the blockage at 606 mbsf is the bottom of the test intervals.
Cement Pumped into Hole 395A during Leg 45 Drilling Operations
As Hickman et al. (1984a) discuss in detail, the zone now blocked by cavings had produced serious drilling problems during Leg 45, requiring an attempt to stabilize the hole by injecting about 20 bbl (3.2 m3) of cement with the bit held at 636 mbsf. No trace of this cement was recovered during subsequent Leg 45 clean-out operations, nor was any cement
216

MEASUREMENTS OF PERMEABILITY OF UPPER OCEANIC CRUST, HOLE 395A
sensed in the logs measured during Legs 78B and 109. Hickman et al. (1984a) were particularly concerned with the possible effects of cement solidified in the zone which they measured to be extremely impermeable. However, as was reasoned above, the zones isolated during Leg 109 were orders of magnitude more transmissive than the deeper section that was cemented, and it is therefore reasonable to assume that the cement could not have significantly affected the transmissive zones isolated during Leg 109.
RESULTS
Summary of Operations During Leg 109, the dual-seal packer was set at two
different depths in Hole 395A, 396 mbsf and 516 mbsf, and slug tests and injection tests were conducted at both depths. The packer setting depths were chosen for several reasons, based on results from Leg 78B and on logs run during Leg 109 immediately before the packer work. The packer was not set shallower than 396 mbsf because downhole temperatures indicated that a large flux of ocean bottom water was being drawn into the upper 250-300 m of quite permeable basement (Becker et al., 1984; Kopietz et al., this volume); from detailed analyses of these temperatures, it is possible to estimate the bulk permeability of this zone (e.g., Becker et al., 1983a).
Below this permeable zone, the borehole televiewer records of Hickman et al. (1984b) indicated that there were only a few depths with hole conditions good enough to set a packer. The logs from Leg 109 (Moos, this volume) indicate that much of this section is badly washed out and therefore might also be fairly permeable. The packer was set first at the intermediate depth of 396 mbsf to document the transition between the permeable zone above 396 mbsf to the section deeper than 583 mbsf which Hickman et al. (1984a) determined to be very impermeable. The results described below indicated that the
transmissivity and bulk permeability of the zone below 396 mbsf were quite high. The packer was then moved to 516 mbsf, below which hole conditions were fairly good, and which was closer to the impermeable zone below 583 mbsf. The packer measurements were suspended after the setting at 516 mbsf, when the go-devil lodged in the pipe on retrieval and the time allotted for downhole measurements at Site 395 expired. When the packer was brought on deck, the inflation elements were torn; they had apparently failed sometime before or during the testing at 516 mbsf. As a result, our interpretation of the results is governed by consideration of whether the packer was truly sealing the borehole at both setting depths.
Downhole Pressure Records
Figure 3 shows annotated pressures recorded in the isolated zones during both packer experiments. These plots and the subsequent analyses are based on about 500 points read from each original 5 x 10 cm analog record, using a microscopic caliper with a resolution of 0.0001 in., or about 4 kPa on the pressure axis. These records are considerably quieter than the records of Hickman et al. (1984a), which were noisy because of the action of the telescoping "bumper subs" in rough seas. While a single bumper sub was used during Leg 109, it never telescoped completely owing to the superior heave compensation on JOIDES Resolution.
The records from Leg 109 are spiky only during the times when the packer was being inflated, because of leakage past a go-devil seal, the only function of which is to direct fluids pumped from the rig floor into the packer elements during inflation. By maintaining pump pressure for 10-20 min, enough fluid was pumped into the elements for adequate inflation despite the leakage. As part of the normal mechanism to lock the packer in the inflated position, the go-devil was
A. 396 mbsf B. 516 mbsf 58
D Q_
56
5 4 -
5 2 -
0) en 3 50 D
O
V20
B io-D
° 0-
±
Time (hr)
-58
54
- 5 2
- 1 0
58-
D CL
■56 - > 5 6 -
54-
5 2 -
0 50 3 5 0 -
D O
r 2 0 - ^ 2 0
10
5 O 0 .
Time (hr]
58
- 5 6
54
■52
50
L 4 8
20
h 10
Figure 3. Pressures vs. time recorded in the zones isolated during the two packer inflations in Hole 395A, and rates at which fluids were pumped into the isolated zones during slug tests and injection tests. The spiky records as the packer was inflated at both depths are explained in the text; flow rates were not recorded during inflation. A. Packer inflation at 396 mbsf, where the calculated overburden stress is about 55.5 MPa, which was clearly not exceeded during the testing. Key: a = pressure increase as the go-devil dropped down the pipe to the packer; b = hydrostatic baseline recorded after the go-devil was pumped into position before packer inflation. B. Packer inflation at 516 mbsf, where the calculated overburden stress is about 59 MPa, which was approached but not exceeded during unexpected events described in the text. Key: a = as in A; b = attempted injection test that was aborted when pressures suddenly increased as in a slug test; c = go-devil stuck in pipe twice on retrieval.
217

K.BECKER
then shifted to a position in which this seal was completely within the isolated zone and was not required to function; the leaky seal then had no effect on pressures applied to the formation during slug tests and injection tests.
During the slug tests, the periods of decay of the pressure pulses were short relative to the resolution of the mechanical recorders, which were set to record 6 hr of data on an analog chart only 10 cm long. On the microscopic scale required to read these charts, the records during the periods of rapid decay of pressures are marred by slight sticking of the recorder stylus on the chart. As a result, the data shown below often show irregularities relative to the type curves, particularly the data from the first minute or so of the decay curves. As is discussed above, if the decay period of a slug test was very short, <5 min, the results were not considered reliable.
Testing with the Packer Inflated at 396 mbsf As Figure 3A shows, while the packer was inflated at 396
mbsf, five slug tests and one constant-rate injection test were applied to the zone isolated between 396 mbsf and the bottom of Hole 395A. This inflation of the packer was its first successful deployment, and events proceeded slowly for two major reasons. First, as is discussed above, the go-devil seal was leaking during inflation, and it was not clear from the only data available in real-time—the pump pressures measured at the rig floor—whether or not the packer was fully inflating. Thus, we pumped for about 20 min (down the drill string and then mostly back up the annulus) to try to hold inflation pressure in the packer elements before we finally attempted to lock the packer in its inflated position. The packer then held the weight applied to it, indicating that it was indeed inflated. Second, during subsequent slug tests, pressures decayed surprisingly rapidly in the context of our unrealized expectations of lower permeability based on the previous work of Hickman et al. (1984a). As a result, it was not clear whether the packer was sealing perfectly, even if it was inflated and supporting weight; however, as is discussed above, we could devise no physical means to test the seal.
Pressures measured during slug tests # 1 , #2 , and #5 fulfilled the criteria described above for a credible slug test. During slug tests #3 and #4 , pressures dropped within a few seconds to less than 20% of the initial pulse, possibly due to some combination of irregular pump operation, changes in system compressibility, and/or leakage at either the pump or past the packers. Figure 4 shows the best fits of pressures measured during the three credible slug tests at 396 mbsf to the appropriate type curves. Allowing for the effects of sticking of the recorder pen, these data are reasonably self-consistent. Using the average compressibility determined directly from the slug tests (Table 1), these decay curves indicate bulk permeabilities on the order of 1-2 x 10~14 m2
(10-20 mdarcy) and transmissivities on the order of 2-4 x 10~5 m2/s for the section of Hole 395A between 396 and 606 mbsf (Table 2).
These values were confirmed by the results of the constant-rate injection test, during which pressures closely approached the predicted linear relationship with the logarithm of time after about 5 min of injection (Fig. 5). The slope of this line yields a bulk permeability of 1.4 x 10"14 m2 and a transmis-sivity good agreement with the values obtained from slug tests # 1 , #2 , and #5 using the measured compressibilities (Table 2). As the permeability and transmissivity calculated from an injection test do not depend as strongly on compressibility as in a slug test, the results from the injection test provide some confirmation that the value for the system compressibility measured during the slug tests is more realistic than the published value for pure seawater (Neuzil, 1982).
Testing with the Packer Inflated at 516 mbsf
As Figure 3B shows, while the packer was inflated at 516 mbsf, eight slug tests and three constant-rate injection tests were attempted. The record is complicated because the overall character of the pressure response suddenly changed twice during the sequence, at about 2.6 and 3.2 hr. These changes are interpreted here to have resulted from changes in the quality of the hydraulic seal produced by the inflation elements—changes which probably invalidated the results of this packer inflation. When the packer was recovered afterward, the elements were found to be torn to the point that the borehole probably could not be properly sealed, although packer inflation could be maintained; the elements had probably been abused when the packer was moved from 396 to 516 mbsf between inflations.
In the first 2.6 hr, five slug tests and one injection test apparently proceeded smoothly. However, at about 2.7 hr, a second injection test was begun, but pressures did not smoothly increase as predicted. Instead, pressures reached an initial peak, then decreased (indicating significant leakage past the packer seal), and then suddenly, inexplicably increased to a sharp peak of 58 MPa. At the time, this was thought to have resulted from some malfunction or blockage of flow paths within the packer, although no evidence for these possibilities was found later when the packer was disassembled. The pump was shut down, and the pressure pulse was allowed to decay into the formation as in a slug test; this pressure pulse is therefore labeled slug test #11 . Two more slug tests (#12 and #13) were then attempted; between them the pump operator noted that the "obstruction" had disappeared. A third injection test was attempted, during which pressures clearly indicate serious leakage past the packer seal, and the packer experiments were terminated.
At the time, we concluded that the packer seal had failed at about 2.6 hr, so that only the tests before then were valid. However, the first five slug tests at 516 mbsf all failed to meet the criteria for a good slug test discussed above, having decayed very rapidly and returned to hydrostatic pressure much more quickly than the slug tests at 396 mbsf. When these data, and those from the apparently successful first injection test, were nevertheless processed in the standard manner, the results required a transmissivity for the interval 516-606 mbsf greater than the transmissivity of the zone 396-606 mbsf—which is impossible by definition. These observations indicate that the packer seal must have been leaking during most of the packer inflation at 516 mbsf, and that therefore none of the slug or injection tests can yield reliable permeability values.
However, the two so-called "slug tests" (#11 and #12) that were conducted during the hour when the inexplicable "obstruction" was sensed by the pump operator decayed more slowly than the other slug tests. This suggests the possibility that the apparent "obstruction" may actually resulted from a sudden sealing by the packer, and the pump operator's observation less than an hour later that the "obstruction" had disappeared—an observation based on the ease of pumping fluids, whether into the formation or past a leaking packer—may have indicated that the temporarily sealing packer had begun leaking again. It is not implausible that the hydraulic integrity of the seal of the inflated packer could have varied in response to such factors as heave and the resultant weight supported by the packer.
Therefore, the data from slug tests #11 and #12 were processed under the tenuous assumptions that the packer was indeed sealing during these tests and that the decay curves represent the effect of the transmissivity of the zone between
218

MEASUREMENTS OF PERMEABILITY OF UPPER OCEANIC CRUST, HOLE 395A
1.0
0.1
0.6
CL
Q. 0.4 -
0.2
0.0
Slug test #1 a = 0.001
1.75
1 1 2 3 4
Log time (s)
.0 -,
1.0 1.0 -i
-0.6
-0.4
o CL
CL
0.6
0.4
-0.2 0.2
0.0 0.0
Slug test #5 a = 0.01
0.0
0.0 2 3 4 Log time (s)
Figure 4. Best fits of the pressures recorded during the three valid slug tests conducted with the packer inflated at 396 mbsf to the type curves of Cooper et al. (1967). Note the poorer quality of the fit for slug test #5; the data from slug tests #3 and #4 were of much worse quality and are not considered valid. The arrow and number pointing to the abscissa indicate the amount (given as log time, with time in seconds) that the type curve was shifted to obtain the best fit. The quantity t, used in Table 2 in calculating permeability and transmissivity is given by 10 raised to this exponent.
516 and 606 mbsf. As the hypothesis that the packer may have sealed during these slug tests is untestable, and given the possibility that the packer might still have been leaking slightly even if the packer were indeed sealing during these tests, the results should be considered very crude upper bounds on the in-situ transmissivity and bulk permeability. Figure 6 shows the best fits of the pressure data from slug tests #11 and #12 to the appropriate type curves. Using the average measured compressibility, these slug tests indicate a maximum transmissivity < 1.5 x I0"14 m2 (8-14 mdarcy) for the section between 516 and 606 mbsf (Table 2). This estimate for the maximum transmissivity of the zone between 516 and 606 mbsf satisfies the physical constraint that this zone be less
transmissive than the larger section between 396 and 606 mbsf, in which it is completely contained.
SUMMARY OF PERMEABILITY DATA IN HOLE 395A
Figure 7 shows the existing permeability measurements from Hole 395A, plotted for reference against the profile of apparent bulk porosity determined from the large-scale resistivity experiment conducted during Leg 109 (Becker, this volume; see also Moos, this volume, for discussion of porosities determined from other logs run in the hole). The permeability data in Hole 395A include: (1) the extremely low value of 0.2-1.1 x I0 - 1 7 m2 in the section 583-664 mbsf measured by Hickman et al. (1984a), (2)
219

Table 2. Summary of calculations of permeability and transmissivity from results of slug tests conducted in Hole 395A. As discussed in the text, the underlined results using the average measured value are more realistic and are shown in Figure 7.
Slug test no.
1
2
5
11
12
aType curve
a
0.01 0.001 0.0001
0.01 0.001 0.0001
0.03 0.01 0.001
0.01 0.001 0.0001
0.001 0.0001 0.00001
b t . (s)
79 56 40
63 40 32
79 56 40
47 32 25
40 32 25
cPermeability (10" 1 5 m 2 )
r '"meas 9.2
12.9 18.3
11.5 18.3 23.0
9.2 12.9 18.3
7.9 11.8 14.8
9.3 11.8 14.8
c 0.61 0.86 1.22
0.77 1.22 1.53
0.61 0.86 1.22
1.56 2.31 2.90
1.83 2.31 2.90
t r a n s missivity
(10~6 m2/s) c '-meas 16.4 23.1 32.6
20.6 32.6 41.1
16.4 23.1 32.6
8.0 11.9 15.0
9.5 11.9 15.0
1.09 1.54 2.18
1.37 2.18 2.74
1.09 1.54 2.18
1.58 2.33 2.94
1.85 2.33 2.94
aFor each slug test, calculations are presented for curve fits corresponding to three values of a. The middle values of a yielded the best subjective fits of the slug test data to the F(a,/3) function, as shown in Figures 4 and 6; the results from the outer values of a are used to estimate the uncertainties in calculated permeabilities and transmissivities.
The parameters t| correspond to the amounts of the type curves must be shifted to produce the best fits, as in Figures 4 and 6; permeability (k) and transmissivity (T) are respectively calculated from tj by k = /w.CwVw/wbtj and T = VWCW p^gl-nt]. c Results are presented for two values of compressibility Cw, the average measured values (Cmeas; Table 1) and the tabulated value for seawater (Csw) used by Hickman et al. (1984a).
the value of 1-2 x 10"14 m2 in the section 396-606 mbsf reported here, (3) the rough upper value of 1.5 x 10~14 m2 for the section 516-606 mbsf suggested here, and (4) a qualitative estimate of the possible range of the average permeability of the section 112-350 mbsf based on the results of temperature logs (Becker et al., 1983a, 1984; Kopietz et al., this volume).
The permeabilities show no clear relationship with the apparent bulk porosities, but the data simply do not provide a good test of speculation by Becker et al. (1983b) and Anderson et al. (1985) that permeabilities in the oceanic crust might be predictable from logged estimates of bulk and/or fracture porosities. For example, it is quite possible that the permeability of the zone below 516 mbsf is much lower than the upper bound suggested here, and the transmissivity measured in the interval below 396 mbsf could be concentrated in the washed-out zone above 450 mbsf. In that case, the permeability profile in Hole 395A might follow the porosity curve much better than appears in Figure 7. (See Becker, 1989, and Pezard and Anderson, 1989, for further discussion in light of data from Hole 504B.)
In conclusion, the upper few hundred meters of crust penetrated by Hole 395A is relatively permeable, which is consistent with observations of low surface heat flow in the sediment pond (Fig. 2; Hussong et al., 1979) and with the models of Langseth et al. (1984) for hydrogeologic processes in the upper crust beneath the sediment pond. It is not clear from the existing data whether the very low value measured by Hickman et al. (1984a) in the deepest section also applies deeper than the hole now extends, or whether it represents only an isolated impermeable formation.
ACKNOWLEDGMENTS The permeability measurements reported here would not have
been possible without the expertise and hard work of the Sedco core technicians during Leg 109, W. Lee and T. McCown, the Sedco drill crew, and the ODP pump operator, A. Housley. Prior to Leg 109, the development of this packer had proceeded quickly, thanks to the expertise of Mr. CO. "Doc" Stokley of TAM International, and advice generously given by S. H. Hickman and the ODP engineering staff. The skillful assistance of J. Attryde, P. Esteves, and P. Thompson during Leg 102 testing of the packer is appreciated. This
1 2 l_n t ime (min)
Figure 5. Pressures vs. natural log of time recorded during the injection test conducted with the packer inflated at 396 mbsf at a constant rate of 6.8 L/s. Bulk permeability is calculated from the slope of the linear segment of this plot reached after about 3-5 min of injection. The equation describes the line shown, which was obtained by linear regression through the circled data points.

MEASUREMENTS OF PERMEABILITY OF UPPER OCEANIC CRUST, HOLE 395A
1.0
0.6 -
CL
0.4
0.2
0.0
Slug test #1 1 a = 0.001
r1 .0
1 2 3 4 Log time (s)
0.6
0.4
-0.2
0.0
Slug test #12 a = 0.0001
r 1 . 0
-0 .
-0 .6
0.4
0.2
■0.0 2 5 6 Log time (s)
Figure 6. Similar to Figure 4, but for the only two possibly valid slug tests conducted during the packer inflation at 516 mbsf. See text for further qualifications and interpretation.
study was carefully reviewed by S. H. Hickman, and was supported by NSF grants OCE 85-13537 and OCE 88-00077.
REFERENCES Anderson, R. N., and Zoback, M. D., 1982. Permeability, underpres
sures, and convection in the oceanic crust near the Costa Rica Rift, eastern equatorial Pacific. J. Geophys. Res., 87:2860-2868.
Anderson, R. N., Zoback, M. D., Hickman, S. H., and Newmark, R. L., 1985. Permeability versus depth in the upper oceanic crust: in situ measurements in DSDP Hole 504B, eastern equatorial Pacific. J. Geophys. Res, 90:3659-3669.
Becker, K., 1986. Special report: Development and use of packers in ODP. JOIDES Journal, 12(2):51-57.
, 1988. A guide to ODP tools for downhole measurements, ODP Tech. Note, 10.
., 1989. Measurements of the permeability of the sheeted dikes in Hole 504B, ODP Leg 111. In Becker, K., Sakai, H., et al.,
Proc. ODP, Sci. Results, 111: College Station, TX (Ocean Drilling Program).
Becker, K., Langseth, M. G., and Von Herzen, R. P., 1983a. Deep crustal geothermal measurements, Hole 504B, Deep Sea Drilling Project Legs 69 and 70. In Cann, J. R., Langseth, M. G., Hon-norez, J., Von Herzen, R. P., White, S. M., et al., Init.Repts. DSDP, 69: Washington (U.S. Govt. Printing Office), 223-236.
Becker, K., Langseth, M. G., Von Herzen, R. P., and Anderson, R. N., 1983b. Deep crustal geothermal measurements, Hole 504B, Costa Rica Rift. J. Geophys. Res., 88:3447-3457.
Becker, K., Langseth, M. G., and Hyndman, R. D., 1984. Temperature measurements in Hole 395A, Leg 78B. In Hyndman, R. D., Salisbury, M. H., et al., Init. Repts. DSDP, 78B: Washington (U.S. Govt. Printing Office), 689-698.
Bredehoeft, J. D., and Papadopulos, S. S., 1980. A method for determining the hydraulic properties of tight formations. Water Resour. Res., 16:223-238.
Bryan, W. B., Juteau, T., et al., 1988. Proc. ODP, Init. Repts., 109: College Station, TX (Ocean Drilling Program).
Bullard, E.C., 1954. The flow of heat through the floor of the Atlantic Ocean. Proc. R. Astron. Soc. London, Ser. A, 222:408-429.
Carslaw, H. S., and Jaeger, J. C , 1959. The Conduction of Heat in Solids: London (Oxford Univ. Press).
Cooper, H. H., Jr., Bredehoeft, J. D., and Papadopulos, I. S., 1967. Response of a finite diameter well to an instantaneous charge of water. Water Resour. Res., 3:267-269.
Gartling, D., K., 1977. Convective heat transfer analysis by the finite element method. Comput. Methods Appl. Mech. Eng., 12:365-382.
Hickman, S. H., Langseth, M. G., and Svitek, J. F. , 1984A. In-situ permeability and pore-pressure measurements near the mid-Atlantic Ridge, Deep Sea Drilling Project Hole 395A. In Hyndman, R. D., Salisbury, M. H., et al., Init. Repts. DSDP, 78B. Washington (U.S. Govt. Printing Office), 699-708.
Hickman, S. H., Svitek, J. F. , and Langseth, M. G., 1984b. Borehole televiewer log of Hole 395A. In Hyndman, R. D., Salisbury, M. H., et al., Init. Repts. DSDP, 78B: Washington (U.S. Govt. Printing Office), 709-715.
Horner, D. R., Pressure build-up in wells. Proc, Third World Pet. Cong., 11:501.
Hussong, D. M., Fryer, P. B.,Tuthill, J., D., and Wipperman, L. K., 1979. The geological and geophysical setting near DSDP Site 395, north Atlantic Ocean. In Melson, W. G., Rabinowitz, P. D., et al., Init. Repts. DSDP, 45: Washington (U.S. Govt. Printing Office), 23-37.
Hyndman, R. D., Salisbury, M. H., et al., 1984. Init. Repts. DSDP, 78B: Washington (U.S. Govt. Printing Office).
Jaeger, J. C , 1958. The measurement of thermal conductivity and diffusivity with cylindrical probes. Trans. Am. Geophys. Union, 39:708-710.
Langseth, M. G., Hyndman, R. D., Becker, K., Hickman, S. H., and Salisbury, M. H., 1984. The hydrogeological regime of isolated sediment ponds in mid-oceanic ridges. In Hyndman, R. D., Salisbury, M. H., et al., Init. Repts. DSDP, 78B: Washington (U.S. Govt. Printing Office), 825-837.
Matthews, C. S., and Russell, D. G., 1967. Pressure Buildup and Flow Tests in Wells, SPE Monograph 1, Dallas: Am. Inst. Min. Met. Pet. Eng.
Melson, W. G., Rabinowitz, P. D., et al., 1979. Init. Repts. DSDP, 45: Washington (U.S. Govt. Printing Office).
Neuzil, C. E., 1982. On conducting the modified slug test in tight formations. Water Resour. Res., 18:439-441.
Papadopulos, S. S., Bredehoeft, J. D., and Cooper, H. H., 1973. On the analysis of "slug test1 data. Water Resour. Res., 9:1087-1089.
Parsons, R. W., 1966. Permeability of idealized fractured rock. J. Soc. Petrol. Eng., 6:126-136.
Pezard, P. A., and Anderson, R. N. , 1989. Morphology and alteration of the upper oceanic crust from in-situ electrical experiments in DSDP Hole 504B. In Becker, K., Sakai, H., et al, Proc. ODP, Sci. Results, 111: College Station, TX (Ocean Drilling Program).
Von Herzen, R. P., and Maxwell, A. E., 1959. The measurement of thermal conductivity of deep-sea sediments by a needle-probe method. J. Geophys. Res., 64:1557-1563.
Date of initial receipt: 21 November 1988 Date of acceptance: 25 April 1989 Ms 106/109-146
221

K.BECKER
Poros i ty {%
00 _Q
CL CD
Q
4 0 0 -
500
600
700
2 4 6 8 10 12 14 16 i i i ' i i i i i i i i I i I
Sediment
1 0 0 -
2 0 0 -
3 0 0 -
breccia
cobbles A2
P2
P3
breccia
P4
P5
lottom of casing
breccia
washout
A3 breccia
)reccia A4 dolerite P4'
A4
19 15 - 1 3
100
200
300
400
o CD "O IX
15
O
CD" Q 00 CD
3 CD
- 5 0 0 3
600
Log permeab i l i t y (m Figure 7. Lithology in Hole 395A, bulk permeabilities (rectangles), and apparent bulk porosities (asterisks) estimated from large-scale resistivities (Becker, this volume). Lithology summarized from Melson, Rabinowitz et al. (1979), who identify 23 lithologic units (delimited by short horizontal lines on left), most of which belong to nine major chemical/magnetic types (delimited with long horizontal lines on left). These chemical types are composed mostly of aphyric (A2-A4) or phyric (P2-P5 and P4') pillow lavas, with some minor flows, and are sometimes separated by breccias or cobbles. The vertical extent of the rectangles indicates the interval over which average permeability was determined; the horizontal extent indicates the range of uncertainties in the calculated average permeability. The large uncertainty in the permeability estimated for 112-350 mbsf represents the range of possibilities allowed by downhole flow rates and the underpressure of the poor fluids (see Becker et al., 1983a; Hickman et al, 1984a; Kopietz et al, this volume). The question mark and dashed line for the interval 516-606 mbsf indicate that the plotted value can only be considered a crude upper bound, as is explained in the text.
222