Embed Size (px)
Citation preview
Introduction to Traditional Conjoint Analysis
(CVA)
Copyright Sawtooth Software, Inc.
What is Conjoint Analysis?
• Research technique developed in early 70s
• Measures how buyers value components of a product/service bundle
• Dictionary definition-- “Conjoint: Joined together, combined.”
• Marketer’s catch-phrase-- “Features CONsidered JOINTly”
Important Early Articles
• Luce, Duncan and John Tukey (1964), “Simultaneous Conjoint Measurement: A New Type of Fundamental Measurement,” Journal of Mathematical Psychology, 1, 1-27
• Green, Paul and Vithala Rao (1971), “Conjoint Measurement for Quantifying Judgmental Data,” Journal of Marketing Research, 8 (Aug), 355-363
• Johnson, Richard (1974), “Trade-off Analysis of Consumer Values,” Journal of Marketing Research, 11 (May), 121-127
• Green, Paul and V. Srinivasan (1978), “Conjoint Analysis in Marketing: New Development with Implications for Research and Practice,” Journal of Marketing, 54 (Oct), 3-19
• Louviere, Jordan and George Woodworth (1983), “Design and Analysis of Simulated Consumer Choice or Allocation Experiments,” Journal of Marketing Research, 20 (Nov), 350-367
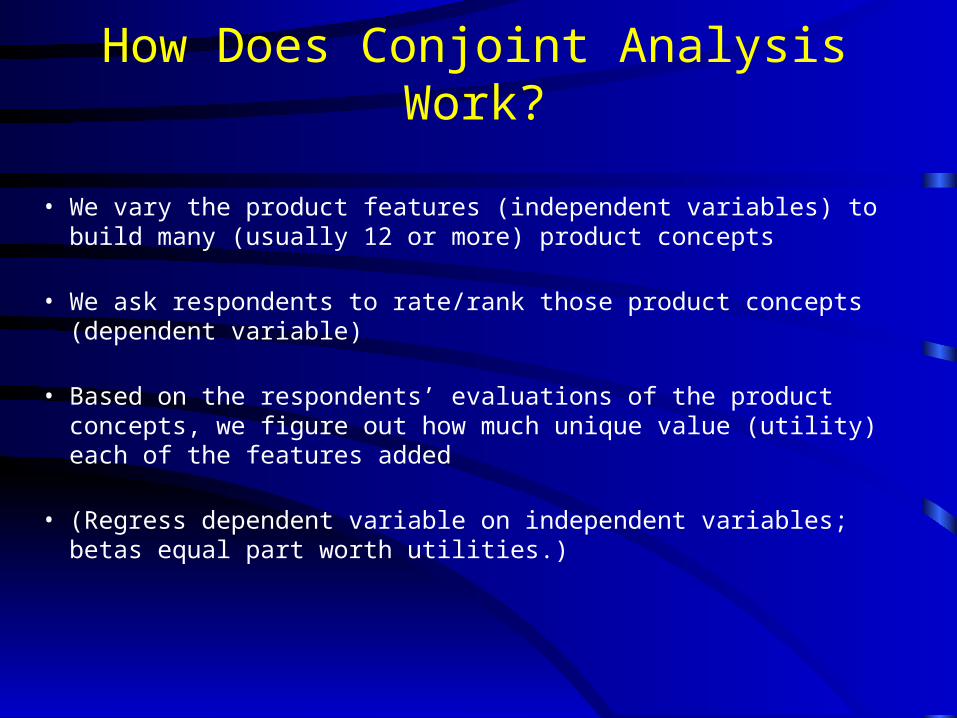
How Does Conjoint Analysis Work?
• We vary the product features (independent variables) to build many (usually 12 or more) product concepts
• We ask respondents to rate/rank those product concepts (dependent variable)
• Based on the respondents’ evaluations of the product concepts, we figure out how much unique value (utility) each of the features added
• (Regress dependent variable on independent variables; betas equal part worth utilities.)
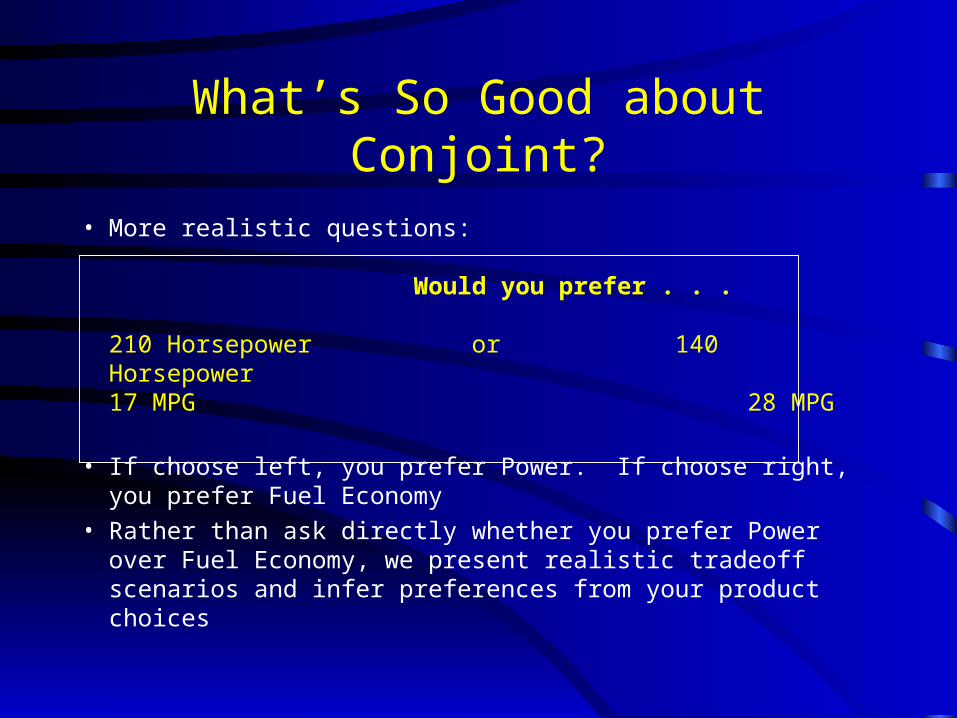
What’s So Good about Conjoint?
• More realistic questions:
Would you prefer . . .
210 Horsepower or 140 Horsepower17 MPG 28 MPG
• If choose left, you prefer Power. If choose right, you prefer Fuel Economy
• Rather than ask directly whether you prefer Power over Fuel Economy, we present realistic tradeoff scenarios and infer preferences from your product choices

What’s So Good about Conjoint? (cont)
• When respondents are forced to make difficult tradeoffs, we learn what they truly value
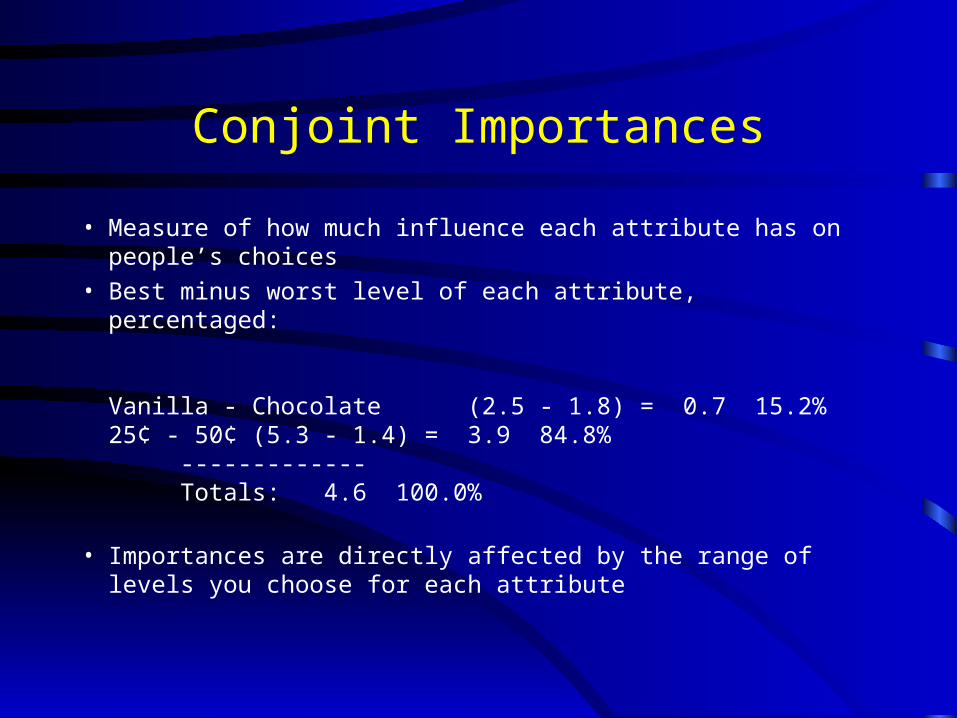
Conjoint Importances
• Measure of how much influence each attribute has on people’s choices
• Best minus worst level of each attribute, percentaged:
Vanilla - Chocolate (2.5 - 1.8) = 0.7 15.2%25¢ - 50¢ (5.3 - 1.4) = 3.9 84.8%
----- --------Totals: 4.6 100.0%
• Importances are directly affected by the range of levels you choose for each attribute
Market Simulations
• Make competitive market scenarios and predict which products respondents would choose
• Accumulate (aggregate) respondent predictions to make “Shares of Preference” (some refer to them as “market shares”)
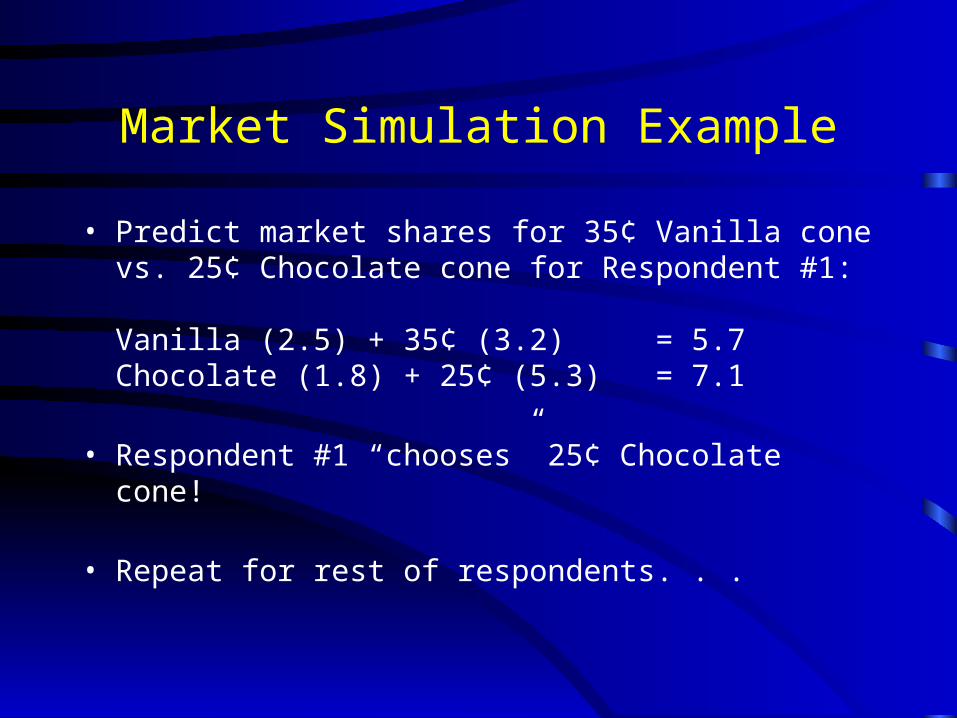
Market Simulation Example
• Predict market shares for 35¢ Vanilla cone vs. 25¢ Chocolate cone for Respondent #1:
Vanilla (2.5) + 35¢ (3.2) = 5.7Chocolate (1.8) + 25¢ (5.3) = 7.1
• Respondent #1 “chooses” 25¢ Chocolate cone!
• Repeat for rest of respondents. . .
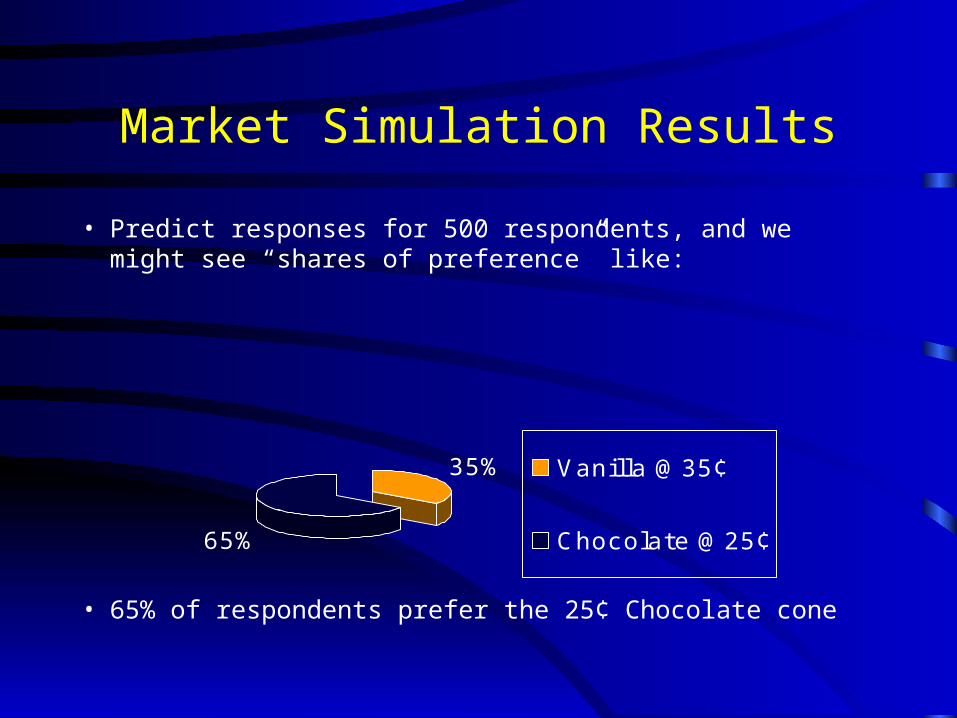
Market Simulation Results
• Predict responses for 500 respondents, and we might see “shares of preference” like:
• 65% of respondents prefer the 25¢ Chocolate cone
35%
65%
Vanilla @ 35¢
Chocolate @ 25¢
Conjoint Market Simulation Assumptions
• All attributes that affect buyer choices in the real world have been accounted for
• Equal availability (distribution)
• Respondents are aware of all products
• Long-range equilibrium (equal time on market)
• Equal effectiveness of sales force
• No out-of-stock conditions
Shares of Preference Don’t Always Match Actual Market Shares
• Conjoint simulator assumptions usually don’t hold true in the real world
• But this doesn’t mean that conjoint simulators are not valuable!
• Simulators turn esoteric “utilities” into concrete “shares”
• Conjoint simulators predict respondents’ interest in products/services assuming a level playing field
Value of Conjoint Simulators… Some Examples
• Lets you play “what-if” games to investigate value of modifications to an existing product
• Lets you estimate how to design new product to maximize buyer interest at low manufacturing cost
• Lets you investigate product line extensions: do we cannibalize our own share or take mostly from competitors?
• Lets you estimate demand curves, and cross-elasticity curves• Can provide an important input into demand forecasting
models
Different “Flavors” of Conjoint Analysis
• Traditional Full-Profile Conjoint
• Adaptive Conjoint Analysis (ACA)
• Choice-Based Conjoint (CBC), also known as Discrete Choice Modeling (DCM)
• Adaptive CBC (ACBC), a recent adaptive variation on the popular CBC method
Strengths of Traditional Conjoint
• Good for both product design and pricing issues
• Can be administered on paper, computer/internet
• Shows products in full-profile, which many argue mimics real-world
• Can be used even with small sample sizes
Weaknesses of Traditional Full-Profile Conjoint
• Limited ability to study many attributes (more than about six or so)
• Limited ability to measure interactions and other higher-order effects (cross-effects)
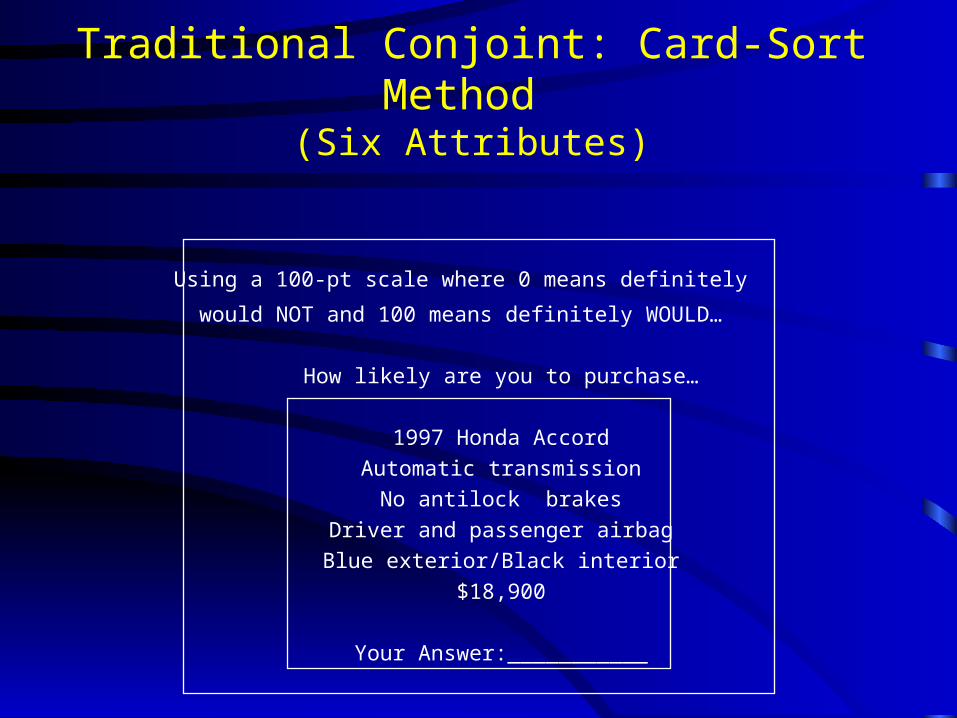
Traditional Conjoint: Card-Sort Method (Six Attributes)
Using a 100-pt scale where 0 means definitely
would NOT and 100 means definitely WOULD…
How likely are you to purchase…
1997 Honda Accord
Automatic transmission
No antilock brakes
Driver and passenger airbag
Blue exterior/Black interior
$18,900
Your Answer:___________
Six Attributes: Challenging
• Respondents find six attributes in full-profile challenging
– Need to read a lot of information to evaluate each card
– Each respondent typically needs to evaluate around 24-36 cards

Traditional Conjoint Designs
• Design (the product combinations shown to respondents--the independent variable matrix)
• Full-Profile (each product concept is defined using all attributes being studied)
• Full Factorial (a design in which all possible product combinations are shown)
• Fractional Factorial (a fraction of the full factorial that permits efficient estimation of the parameters of interest)
Why Not Ask the Full Factorial?
• Assume a conjoint study with:– 5 brands
– 4 styles
– 4 performance levels
– 5 prices
• There are 5x4x4x5=400 possible product combinations
• What respondent would want to evaluate all 400 in a survey?
Parsimonious Models
• Full factorials permit estimation of all main effects and interactions
• But, we seldom need to estimate so many parameters to get quite decent models of consumer behavior
• Often, just main effects are estimated (the value of each attribute level assuming everything else held constant)
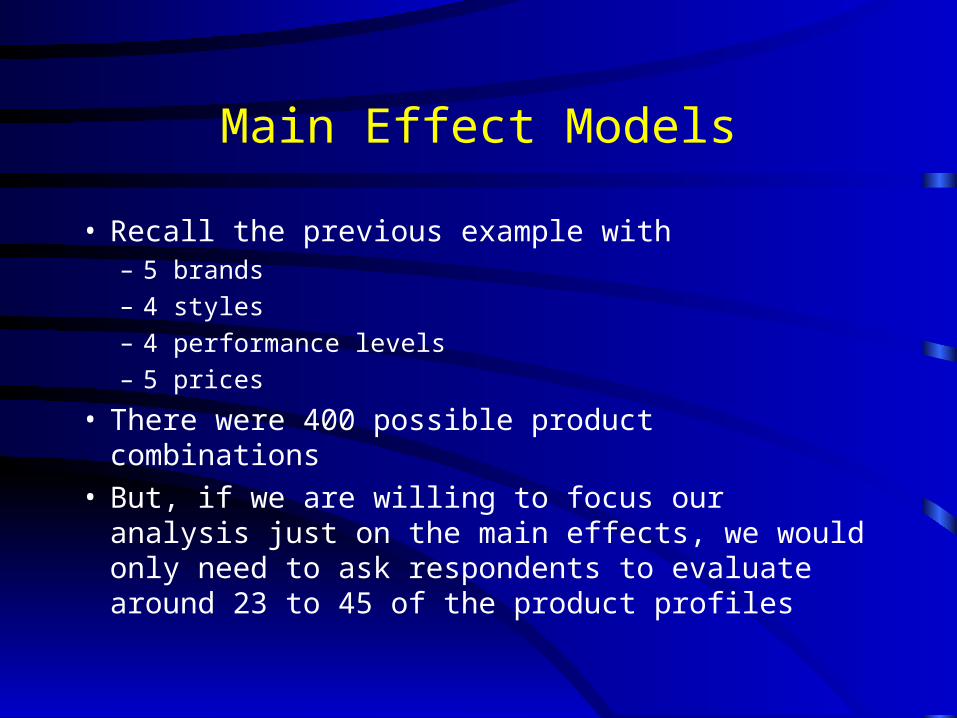
Main Effect Models
• Recall the previous example with – 5 brands
– 4 styles
– 4 performance levels
– 5 prices
• There were 400 possible product combinations• But, if we are willing to focus our analysis just on the
main effects, we would only need to ask respondents to evaluate around 23 to 45 of the product profiles
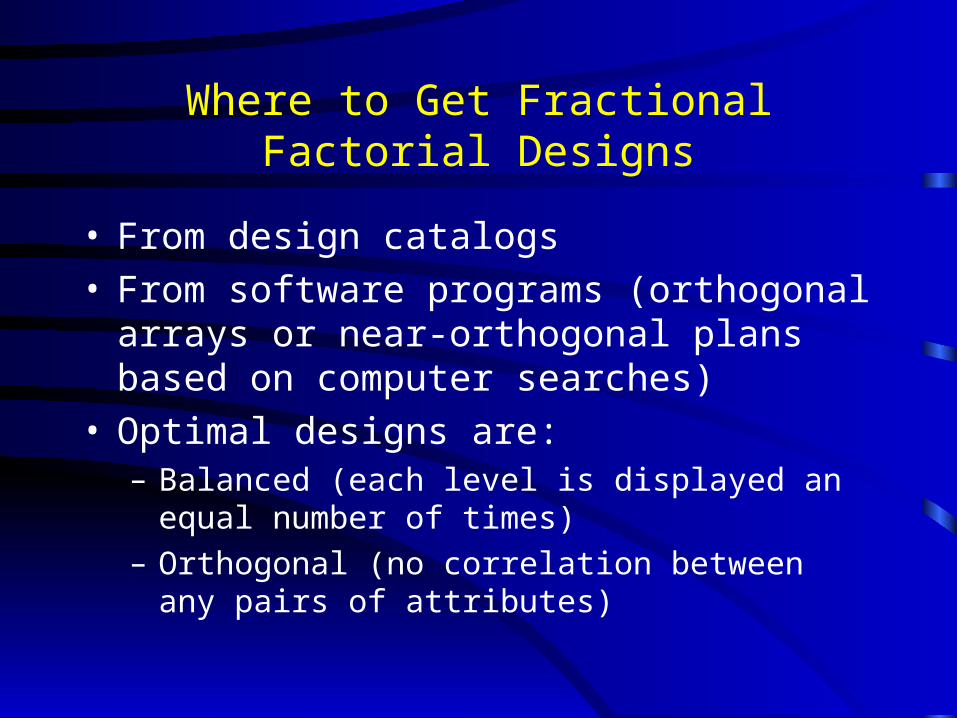
Where to Get Fractional Factorial Designs
• From design catalogs• From software programs (orthogonal arrays or
near-orthogonal plans based on computer searches)
• Optimal designs are:– Balanced (each level is displayed an equal number of
times)
– Orthogonal (no correlation between any pairs of attributes)
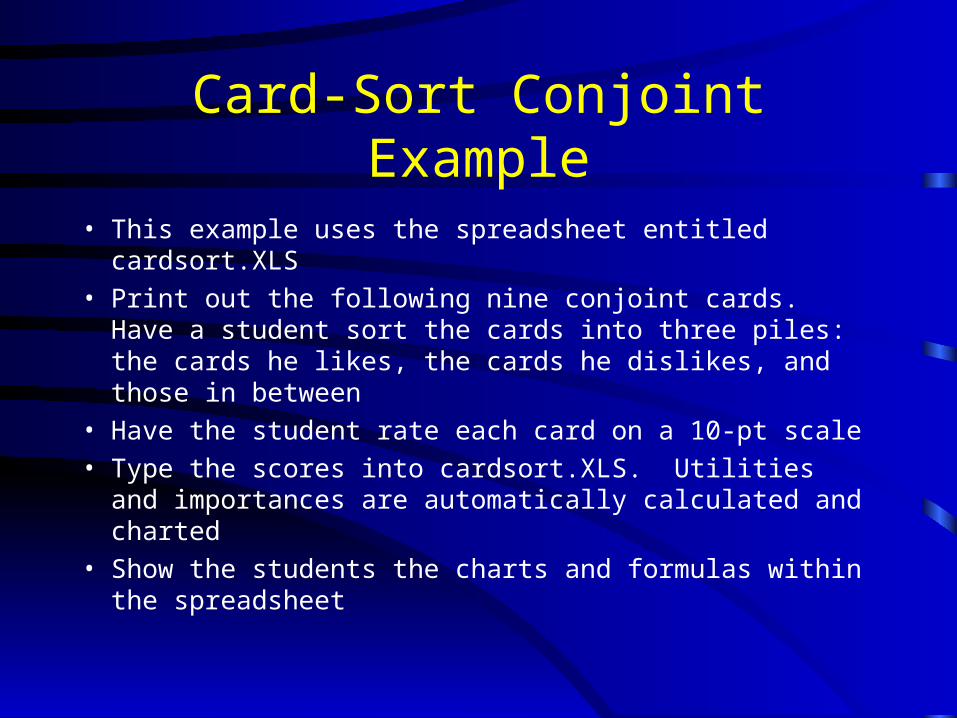
Card-Sort Conjoint Example
• This example uses the spreadsheet entitled cardsort.XLS
• Print out the following nine conjoint cards. Have a student sort the cards into three piles: the cards he likes, the cards he dislikes, and those in between
• Have the student rate each card on a 10-pt scale
• Type the scores into cardsort.XLS. Utilities and importances are automatically calculated and charted
• Show the students the charts and formulas within the spreadsheet

How much do you like this credit card offering? 0 = Terrible, 10 = Excellent
MasterCard
18% interest
No annual fee
$1000 credit limit
Score= ___________(1)

How much do you like this credit card offering? 0 = Terrible, 10 = Excellent
MasterCard
12% interest
$20 annual fee
$5000 credit limit
Score= ___________(2)
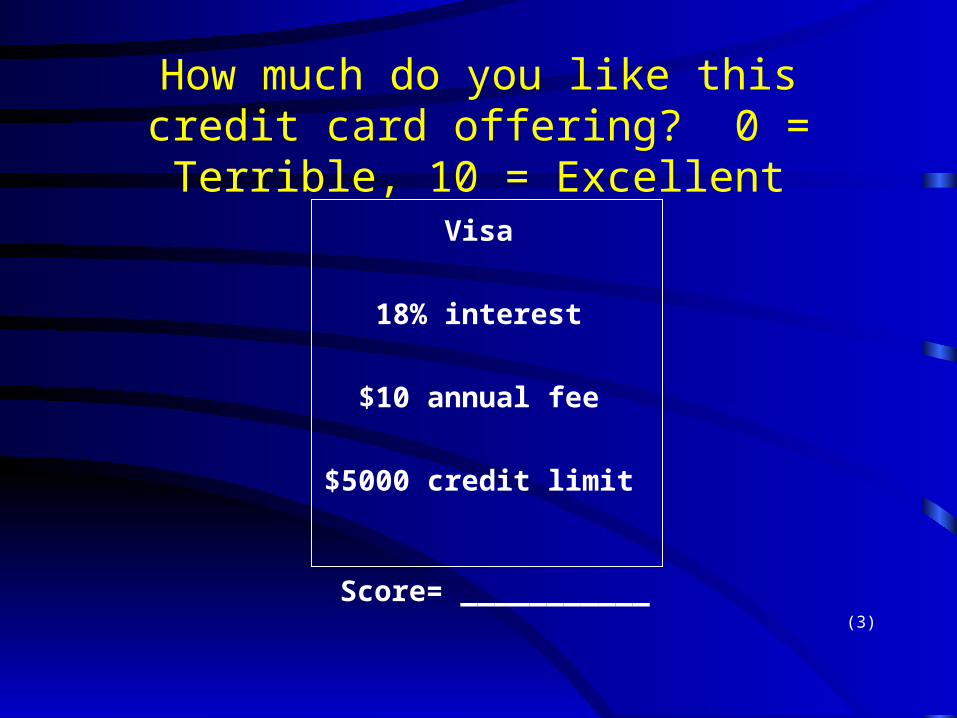
How much do you like this credit card offering? 0 = Terrible, 10 = Excellent
Visa
18% interest
$10 annual fee
$5000 credit limit
Score= ___________(3)
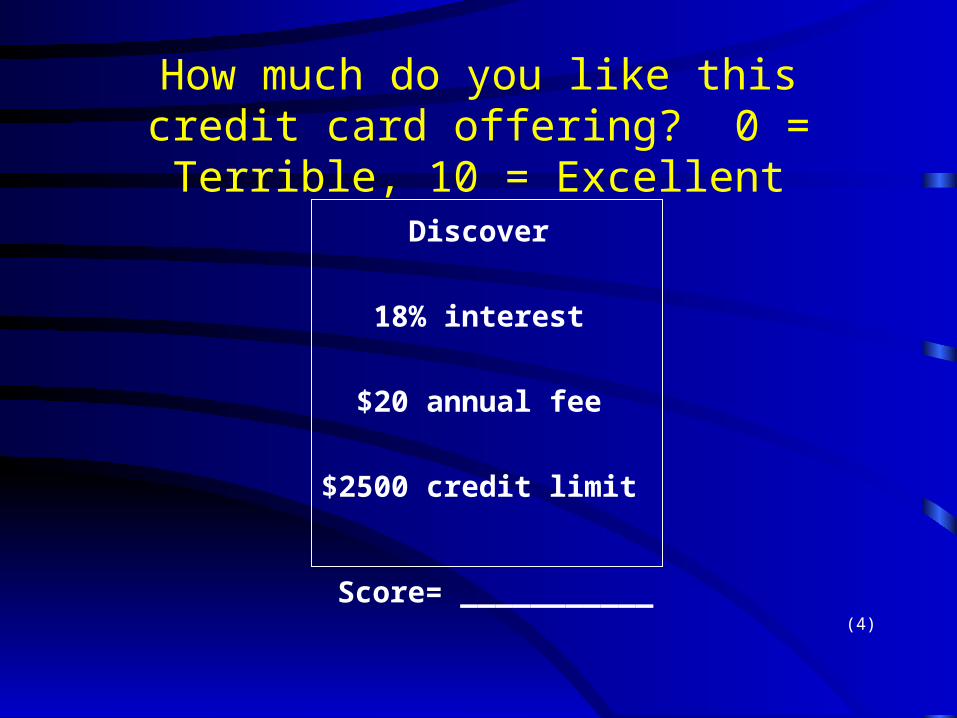
How much do you like this credit card offering? 0 = Terrible, 10 = Excellent
Discover
18% interest
$20 annual fee
$2500 credit limit
Score= ___________(4)

How much do you like this credit card offering? 0 = Terrible, 10 = Excellent
Discover
12% interest
$10 annual fee
$1000 credit limit
Score= ___________(5)

How much do you like this credit card offering? 0 = Terrible, 10 = Excellent
Discover
15% interest
No annual fee
$5000 credit limit
Score= ___________(6)

How much do you like this credit card offering? 0 = Terrible, 10 = Excellent
Visa
12% interest
No annual fee
$2500 credit limit
Score= ___________(7)

How much do you like this credit card offering? 0 = Terrible, 10 = Excellent
MasterCard
15% interest
$10 annual fee
$2500 credit limit
Score= ___________(8)

How much do you like this credit card offering? 0 = Terrible, 10 = Excellent
Visa
15% interest
$20 annual fee
$1000 credit limit
Score= ___________(9)