Embed Size (px)
Citation preview

A SunCam online continuing education course
Note: This course has been approved for 4 GBCI CE hours for LEED Professionals; GBCI Course ID: 0920018312
Introduction to Small-scale Wind Project Design
by
Leonard Greer, P.E. Certified Energy Manager, LEED AP O+M
Introduction This course is designed to address the needs of an engineer who has been approached by a client, employer, or facility manager to provide some sort of informed opinion as to whether or not a wind energy project would be a good idea. In other words, the goal is to equip the student to be able to provide a technically-sound response when an ecologically well-intentioned (but often non-technical) superior suggests “maybe we can add a wind turbine.”
Wind energy conversion technology is now a well-developed discipline and industry, and experts are available who have specialized in all aspects of this field. However, any competent engineer who is cognizant of the fundamentals of mathematics and aerodynamics should be able to apply these basics and rapidly assess if a proposed wind power project has enough potential of economic success to justify additional expenditures of time or dollars for detail evaluations.
Learning Objectives:
1. Summarize common terminology of the different types of wind turbines, as well as their relative merits and shortcomings.
2. Use the ‘Fundamental Equation of Wind Power’ for realistic back-of-the-envelope power output projections and identifying practical limitations.
3. Familiarization with the nature (but not the detailed mathematics) of typical wind distribution regimes, such as the Weibull and Raleigh distributions.
4. Cognizance of wind energy project planning issues and show-stoppers, which if initially overlooked, could result in project cancellations.
181.pdf

Introduction to Small-scale Wind Project Design
A SunCam online continuing education course
www.SunCam.com Copyright 2019 Leonard Greer Page 2 of 40
Table of Contents Introduction ......................................................................................................................................................................... 1 Table of Contents ................................................................................................................................................................. 2 Background .......................................................................................................................................................................... 3
Wind Turbines – Terminology and Groupings .............................................................................................................. 3 Wind Turbines and Wind Mills ............................................................................................................................... 3 HAWTs vs. VAWTs ............................................................................................................................................... 3 Drag vs. Lift Driven ................................................................................................................................................ 4
Theory (& Limits) ................................................................................................................................................................ 9 So how does a wind turbine work? ................................................................................................................................ 9
Problems with Turbulence ....................................................................................................................................... 11 Efficiency Factors .......................................................................................................................................................... 12
Wind Turbine Efficiency Limits .............................................................................................................................. 12 Wind Power Density................................................................................................................................................ 13 Other Operational Limits ......................................................................................................................................... 15 Practical Takeaways from the Theory ..................................................................................................................... 17
Resource Assessment (or how much does the wind blow?) ................................................................................................. 18 Again with the theory… ................................................................................................................................................ 20
Wind Speed Distribution ......................................................................................................................................... 20 Wind Elevation Effects ............................................................................................................................................ 22 Wind Energy Estimates (in theory) ......................................................................................................................... 23
Theory, but with practical applications .......................................................................................................................... 24 Sample Problem 1 – Estimate Average Wind Speed at a Remote Location ............................................................ 24 Sample Problem 2 – Power estimates using only an average wind speed ............................................................... 26 Sample Problem 3 – Further estimates with limited wind speed data ...................................................................... 27
Planning the Wind Project ................................................................................................................................................... 30 Local Site Wind Data (i.e., Anemometer Studies) ......................................................................................................... 30
How Long Do You Measure? .................................................................................................................................. 31 But what if you are pressed for time? ...................................................................................................................... 31
Potential Show-stoppers ................................................................................................................................................ 32 Zoning and Permitting Requirements ...................................................................................................................... 32 Requirements for Building/Grid Tie-in ................................................................................................................... 33
Summary & Conclusions ..................................................................................................................................................... 38 Table of Selected Image Credits .......................................................................................................................................... 39 GBCI CE Approval .............................................................................................................................................................. 40
181.pdf

Introduction to Small-scale Wind Project Design
A SunCam online continuing education course
www.SunCam.com Copyright 2019 Leonard Greer Page 3 of 40
Background
Wind Turbines – Terminology and Groupings
Wind Turbines and Wind Mills
Although the words “wind turbine” can refer to any a machine for converting the kinetic energy in wind into mechanical energy, the term “windmill” generally refers to machines that transform wind energy directly into mechanical energy for work such as pumping or some sort of grinding. On the other hand, those wind turbines coupled to a device that produces electricity are often called wind generators.
For our purposes here, the universe of wind turbines can be divided into two categories. The first way to look at wind turbines is to merely classify them into 2 simple groups based on their axes of rotation.
HAWTs vs. VAWTs
With this kind of thinking, wind turbines can be divided up as either horizontal-axis wind turbines (HAWT) like the traditional American farm windmills used for pumping water (Figure 1), or
the vertical-axis wind turbines (VAWT) designs, like the eggbeater-style Darrieus turbine, patented in 1931 by a French engineer with that name (Figure 2).
The HAWT’s axis of rotation must be aligned with the direction of the wind for optimum operation. This means that HAWTs have some form of direction (or yaw) control, such as a fantail in the simple case of low-power windmills. Larger or more sophisticated HAWT can have elaborate hydraulic or electronic steering that can react to signals from a wind direction detector. The VAWTs, however, can operate with winds coming from any direction without re-orientation. This simplifying operational advantage does come at a cost to wind energy efficiency, as
Figure 1 - This windmill with fantail in Texas is an example
of an HAWT. Photo by Scott Milder, NREL 10678
Figure 2 - This Darrieus turbine is an example of
a VAWT
181.pdf

Introduction to Small-scale Wind Project Design
A SunCam online continuing education course
www.SunCam.com Copyright 2019 Leonard Greer Page 4 of 40
each blade of a VAWT ends up operating “against the wind” for some portion of its rotation.
Drag vs. Lift Driven
Nevertheless, to appreciate the limitations and potentials of wind conversion devices, another important way to categorize wind turbines needs to be understood. This is the grouping of wind turbines into machines that literally catch the wind and use aerodynamic drag to spin their rotor and produce power, and those that use aerodynamic lift forces that are derived from the shape of their blades to generate the turning forces on the rotor. This distinction is not as cut and dry as that of the HAWT/VAWT categorization, since there are some wind devices that fall into a hybrid class that use both drag and lift.
Drag Drag power devices include the simple windmills used in China over 2,000 years ago for pumping water, as well as the vertical-axis windmills with woven reed sails employed in grinding grain in Persia and the Middle East at about the same time. Some versions
of the stereotypical Dutch-style windmill (Figure 3) as well as the American (or Chicago) style farm windmill (Figure 1) are both examples of drag driven devices.
Drag powered wind turbines have relatively slower rotational speeds, but higher torque capabilities. They have been used throughout history for the pumping, sawing or grinding work. However, they are not of just historical interest.
The Savonius wind turbine is a modern turbine that plainly catches the wind and is used in several applications. As can be seen in Figure 4, it has a simple “S” shaped blade design and can have two or more scoop-shaped blades. The smooth convex scoop surface of its blades experiences less drag when this surface faces the wind than when the opposite concave side of the blade catches the wind. It is this differential
Figure 3 - The blades of a Dutch-style windmill rely
on drag for moving.
Figure 4 - Rough sketch of a Savonius rotor, a drag driven device. Original by
Steffen Kuntoff – Ref. Table of Image Credits
181.pdf

Introduction to Small-scale Wind Project Design
A SunCam online continuing education course
www.SunCam.com Copyright 2019 Leonard Greer Page 5 of 40
drag which imparts a turning moment, and causing the turbine to spin.
A cup anemometer which is often used for measuring the wind can also be considered a version of the Savonius turbine. Generally, Savonius turbines are preferred when cost and reliability are more important than efficiency in harvesting energy from the wind.
Lift You probably recall that lift is an upward force that is generated when an object passes through a fluid. The lift experienced on an airfoil-shaped object (such as an airplane wing) is easy to visualize when looking at Figure 6. This image was produced for the general case where the air flowing over the airfoil is constricted as the air flows up and over the convex-shaped top surface of the airfoil. At the same time, the wider streamlines below the airfoil indicate relatively slower flow of air underneath the airfoil. This difference in the speed of air passing over the top and bottom surface of an airfoil results in a pressure difference. The Bernoulli principle predicts this, and the pressure on the upper surface (with the faster moving air) is lower than the pressure on the lower surface (where the air is moving slower, relative to the foil). The pressure difference thus creates a net aerodynamic force, with the component of the force perpendicular to the free stream being called lift.
Although the effect of lift on an airfoil (or an airplane wing) is fairly obvious to anyone who travels by commercial airlines, the contribution of lift to the harvesting of energy in a wind turbine can be a bit harder to see. This will be discussed later (in the section “So how does a wind
Figure 6 - Image of laminar streamlines around an airfoil in a wind tunnel, where the streamlines above the airfoil are narrowed.
Figure 5 - A cup anemometer, a version of a drag driven Savonius turbine, is used to measure wind
speed.
181.pdf

Introduction to Small-scale Wind Project Design
A SunCam online continuing education course
www.SunCam.com Copyright 2019 Leonard Greer Page 6 of 40
turbine work?”), since this point is critical to truly understanding why siting a wind turbine is something that should not be rushed and why wind turbines should never be located near objects that obstruct the upstream approaching air flow.
Almost all modern electricity-generating wind turbines use the lift force derived from their blades to drive the rotor. In fact, it is more accurate to say that the wind does not push these turbine’s blades as much as it pulls the blades with the generated lift forces. Machines that use lift range from the large utility scale wind turbines of Figure 7 to the smaller models that are popular with home owners or remote power applications (Figure 8). Both HAWT and VAWT can employ lift, and the
Darrieus turbine of Figure 2 is also a lift driven device.
The distinguishing feature of these turbines (the ones that use lift), is that their blades have an airfoil shape. These styles of turbines can be much more efficient and can be built to scales that are useful in industrial settings. Furthermore, the aerodynamics of such blades mean their tip speeds can operate at much faster speeds than the speed of the wind that is driving them. The ratio of the speed of the blade tips to the driving wind speed is called the tip-speed ratio, or “TSR.” In modern high efficiency lift-driven turbines, this tip speed/wind speed ratio can be as high as 6 or 7 to 1.
Figure 7 - Utility Scale wind turbines. Photo by Franzfoto
Figure 8 - Small wind turbine at a family
residence. Photo by Larry Gilliam, NREL 12560
181.pdf

Introduction to Small-scale Wind Project Design
A SunCam online continuing education course
www.SunCam.com Copyright 2019 Leonard Greer Page 7 of 40
Summarizing Table 1 attempts to summarize and organize the primary classifications of wind turbines. The horizontal rows provide typical “Pros & Cons” for HAWT & VAWT turbines, while the vertical columns do the same for drag verses lift-driven devices.
For example, the table shows that an advantage of HAWTs is that they can often be more easily installed on taller towers, which gives them generally access to higher wind speed regimes with more energy. This table also indicates a relative disadvantage of lift-driven devices (either VAWTs or HAWTs) in that they may encounter more high speed noise and vibration issues than a comparable drag-driven device.
Hence, this tabulation provides a thumbnail sketch of the general characteristics of wind turbines, and may be quite useful to a newcomer to the industry for keeping his or her bearings during the initial dealings with sales professionals of various wind turbine designs.
181.pdf

Introduction to Small-scale Wind Project Design
A SunCam online continuing education course
www.SunCam.com Copyright 2019 Leonard Greer Page 8 of 40
Summary Table – Relative Pros and Cons of Lift vs. Drag; VAWT vs. HAWT Wind Turbines
Table 1
181.pdf

Introduction to Small-scale Wind Project Design
A SunCam online continuing education course
www.SunCam.com Copyright 2019 Leonard Greer Page 9 of 40
Theory (& Limits)
So how does a wind turbine work? It may be a bit clarifying to first look at the relationship between a propeller used on small aircraft and the blades of a wind turbine.
Academically speaking, a propeller (or more precisely, an axial fan rotor) and a wind turbine rotor are reversible versions of each other. These devices are designed and described by the same basic theoretical considerations in the abstract. However, applications and functional considerations do produce variation in size and operation. Table 2 provides a quick orienting comparison of the principle differences between airplane propellers and wind turbine blades. It highlights the fact that the resulting dimensions and precise airfoil designs of each have to depend on the density of power (delivered or extracted) and the way the aerodynamic lift contributes to their function.
As suggested in the earlier Table 1, an implied advantage of lift-driven machines is that they rotate at speeds that have historically made the generation of electricity convenient. In general, the blades of a drag driven device (for those cases which are just being pushed by the wind) usually cannot go much faster than the speed of the wind itself. However, as amateur sailors may know, it is possible to move a sail powered boat at a speed greater than the wind speed by taking advantage of the “apparent wind” that the boat’s airfoil-shaped sail encounters. In the case of a wind turbine, this “apparent wind” is the vector sum of the true wind blowing toward the turbine’s hub and the tangential speed of the wind turbine’s blade as it rotates around the turbine’s hub.
Table 2
181.pdf

Introduction to Small-scale Wind Project Design
A SunCam online continuing education course
www.SunCam.com Copyright 2019 Leonard Greer Page 10 of 40
Figure 9 Isometric sketch with detail illustrating the geometry of how lift generated from the "apparent wind" over the blade has a component that acts to rotate the blade.
181.pdf

Introduction to Small-scale Wind Project Design
A SunCam online continuing education course
www.SunCam.com Copyright 2019 Leonard Greer Page 11 of 40
Figure 9 is a sketch which attempts to illustrate this apparent wind effect for a HAWT with blades spinning at a rotational speed ω, at a section of distance r from the rotating hub. The tangential speed of the blade at this point is therefore ωr, which when combined with the vector representing the true wind speed at this point, generates via vector addition an “apparent wind” vector that is “seen” by the airfoil-shaped blade.
The design of the wind turbine blade includes the necessary tapers and twists so that the apparent wind will contact the leading edge of the airfoil (as in Figure 6 on page 5) and then split, with part of the airstream going over the rear convex portion at a higher relative speed than that passing on the bottom (or front-side) of the airfoil. The resulting lift force has a component in the direction of rotation of the blade, and it is this component that spins the rotor and provides torque to any shafts or gear boxes used to turn generators.
Problems with Turbulence
A very important precondition for the generation of lift and the success of a wind turbine is that flow over an airfoil must remain attached to most of both of the top and bottom of the airfoil
surfaces (as is show on page 5 in the earlier Figure 6). However, if this airflow becomes “detached” as illustrated in Figure 10, the lift effect is destroyed, since the resulting turbulent flow modifies the smooth laminar flow of air over the airfoil.
Lift is also adversely affected if the turbulent flow begins BEFORE the wind even hits the blade. This happens when obstacles in front of the wind turbine (such as buildings or trees) disturb the approaching wind that reaches the
turbine. The affect is a great loss in energy output of the turbine because of the reduced aerodynamic effectiveness of its blades in turbulent air.
In fact, wind professionals often provide a clarifying analogy to clients by saying that “placing a wind turbine in the turbulent wake of an upwind obstacle is like placing solar panels in the shade.”
Figure 10 - Image of streamline flow “detachment” away from surface of an airfoil. This turbulence
destroys the lift effect.
181.pdf

Introduction to Small-scale Wind Project Design
A SunCam online continuing education course
www.SunCam.com Copyright 2019 Leonard Greer Page 12 of 40
Efficiency Factors
Wind Turbine Efficiency Limits
As indicated in Table 2 on page 9, a wind turbine extracts energy from the wind by slowing down the speed of the air that passes through it. This suggests that there must be a limit to the energy that can be extracted from a moving air stream. If the turbine were successful in extracting all of the air speed from the airstream, then air could not exit the turbine, and no more wind could get in to keep the turbine spinning.
The limit of the energy that can be extracted by an idealize wind turbine has been calculated by the German physicist Albert Betz using the principles of conservation of mass and momentum of the air stream. His work resulted in Betz's law, which states that no turbine (regardless of design1) can extract more than 16/27 (59.3%) of the kinetic energy in wind. The ratio of
1 Betz’s law applies to conventional open blade turbines (which means turbines that do not contain a shroud around their blades and do not employ a funnel or diffuser to collect extra wind).
Figure 11
181.pdf

Introduction to Small-scale Wind Project Design
A SunCam online continuing education course
www.SunCam.com Copyright 2019 Leonard Greer Page 13 of 40
16/27 (0.593) is often referred to as the “Betz limit” or “Betz’s coefficient.” In the real world, large utility-scale wind turbines have achieved peak energy extraction rates of between 75% and 80% of this Betz limit.
Efficiencies of wind turbines are usually expressed as a “Power Coefficient2” or “Cp.” This is a simple ratio:
Equation 1 The Power Coefficient (Cp) = 𝐄𝐄𝐄𝐄𝐄𝐄𝐄𝐄𝐄𝐄𝐄𝐄 𝐩𝐩𝐄𝐄𝐩𝐩𝐩𝐩𝐩𝐩𝐩𝐩𝐄𝐄𝐩𝐩 𝐛𝐛𝐄𝐄 𝐭𝐭𝐭𝐭𝐄𝐄 𝐰𝐰𝐰𝐰𝐄𝐄𝐩𝐩 𝐭𝐭𝐩𝐩𝐄𝐄𝐛𝐛𝐰𝐰𝐄𝐄𝐄𝐄
𝐓𝐓𝐩𝐩𝐭𝐭𝐓𝐓𝐓𝐓 𝐄𝐄𝐄𝐄𝐄𝐄𝐄𝐄𝐄𝐄𝐄𝐄 𝐰𝐰𝐄𝐄 𝐭𝐭𝐭𝐭𝐄𝐄 𝐰𝐰𝐰𝐰𝐄𝐄𝐩𝐩
Figure 11 shows how this indicator of efficiency (Cp) varies with the tip speed ratio (TSR) for the kinds of wind turbines presented earlier. Although Cp is affected by other factors besides just the TSR and turbine style, this illustration provides a graphical indication of a very general range of power conversion efficiencies.
Wind Power Density
The amount of energy in wind depends on three (3) factors.
1. The first of these factors is the volume of air of interest, which is the air that will pass though the wind turbine.
2. The second important factor is the speed that the wind is moving, since it is the kinetic energy of the wind which will be transformed into useful work by the turbine.
3. The final factor is the density of the air. The density of the air defines the mass of the volume of air, which determines ultimately the force the wind can exert.
Using the definition of kinetic energy, and the fact that power is kinetic energy per unit of time, and the definition of any fluid mass flow rate, the fundamental equation of wind power can be simply stated as:
Equation 2 Fundamental Equation of Wind Power (P) = ½ ρ A v3 (SI Units)
Where:
ρ is the density of the air (kg/m3) ; A is the swept area of the rotor blades (m2);
2 Also called the “Coefficient of Power” or the “Coefficient of Performance.”
181.pdf

Introduction to Small-scale Wind Project Design
A SunCam online continuing education course
www.SunCam.com Copyright 2019 Leonard Greer Page 14 of 40
v is the velocity of the wind (m/sec); P is power in watts3
EXAMPLE CALCULATION Using this Equation 2, an example of a theoretical wind energy resource of a little less than half a horsepower (or 306 watts) can be calculated to be available from a 12 miles per hour wind stream passing through a turbine with 40 inch blades (or 1 meter long blades measured from hub center to tip) at sea level.
Values used to calculate this theoretically available power in this example are tabulated in Table 3, and include the density ρ of sea-level air is 1.225 kg/m3 (or 0.080672 lbm/ft3) and the area swept by a 40 inch blade. This area is calculated the same way that the area of a circle is calculated given a radius r; in other words, πr2. In this case, π times 40 inches squared equals 5,026 square inches, or 3.24 square meters.
Parameters used in the above example using with Equation 2, (the Fundamental Equation of Wind Power). Value units
ρ Air density (at sea level and 59°F in this example) 1.225 kg/m3
A Swept Area of Rotor; equal to πr2 where r = 40 inches or 1.016 meters. 3.24 m2
v Velocity of the wind; 12 miles per hour or 5.364
meters per second (5.364)3 m3/sec3
Table 3 Values Used to Evaluate THEORETICAL Wind Energy using Equation 2
The theoretical power available in a circle described by a turbine with 40 inch blades during a 12 mile per hour (or 5.364 meters per second) wind is therefore:
Theoretical Power = ½ x 1.225 kg/m3 x 3.24 m2 x (5.364 m/s)3
= 306 watts or about 0.41 horsepower.
However, to harvest theoretical energy, practical wind machines must be use. Figure 11 shows that the Power Coefficient (Cp) of Equation 1 can never exceed 59% because of the Betz limit.
3 Recalling that 1 watt = 1 Newton-meter/sec, which can also be written as 1 (kg-m/sec2)(m/sec).
181.pdf
Introduction to Small-scale Wind Project Design
A SunCam online continuing education course
www.SunCam.com Copyright 2019 Leonard Greer Page 15 of 40
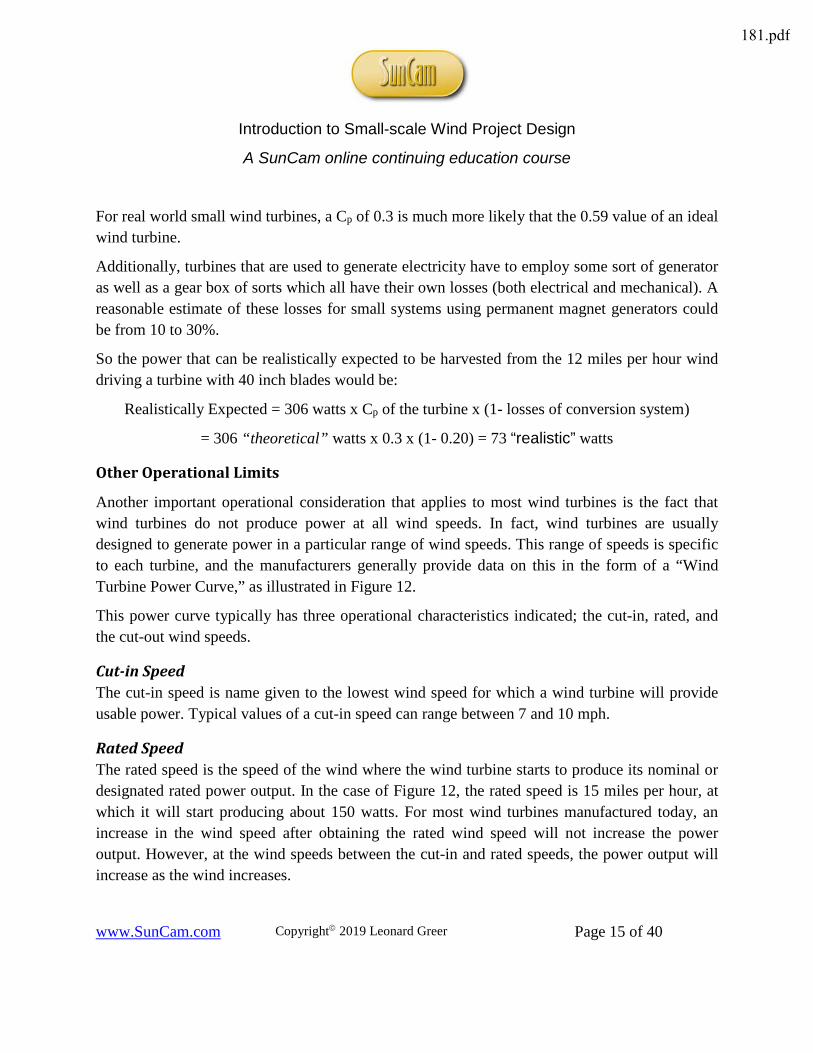
For real world small wind turbines, a Cp of 0.3 is much more likely that the 0.59 value of an ideal wind turbine.
Additionally, turbines that are used to generate electricity have to employ some sort of generator as well as a gear box of sorts which all have their own losses (both electrical and mechanical). A reasonable estimate of these losses for small systems using permanent magnet generators could be from 10 to 30%.
So the power that can be realistically expected to be harvested from the 12 miles per hour wind driving a turbine with 40 inch blades would be:
Realistically Expected = 306 watts x Cp of the turbine x (1- losses of conversion system)
= 306 “theoretical” watts x 0.3 x (1- 0.20) = 73 “realistic” watts
Other Operational Limits
Another important operational consideration that applies to most wind turbines is the fact that wind turbines do not produce power at all wind speeds. In fact, wind turbines are usually designed to generate power in a particular range of wind speeds. This range of speeds is specific to each turbine, and the manufacturers generally provide data on this in the form of a “Wind Turbine Power Curve,” as illustrated in Figure 12.
This power curve typically has three operational characteristics indicated; the cut-in, rated, and the cut-out wind speeds.
Cut-in Speed The cut-in speed is name given to the lowest wind speed for which a wind turbine will provide usable power. Typical values of a cut-in speed can range between 7 and 10 mph.
Rated Speed The rated speed is the speed of the wind where the wind turbine starts to produce its nominal or designated rated power output. In the case of Figure 12, the rated speed is 15 miles per hour, at which it will start producing about 150 watts. For most wind turbines manufactured today, an increase in the wind speed after obtaining the rated wind speed will not increase the power output. However, at the wind speeds between the cut-in and rated speeds, the power output will increase as the wind increases.
181.pdf

Introduction to Small-scale Wind Project Design
A SunCam online continuing education course
www.SunCam.com Copyright 2019 Leonard Greer Page 16 of 40
Cut-out Speed In order to prevent turbine damage due to high winds, most wind turbines stop producing power and shut down. This can typically occur between wind speeds of 45 and 80 miles per hour. The cut-out speed is the term for the wind speed at which shut down occurs. The actual shutdown can be produced in a variety of fashions, and is dependent on the design of the particular wind turbine. Some machines have an automatic brake which is activated by a wind speed sensor. Another alternative is to automatically twist or “pitch” the blades to spill the wind. There are also methods that use mechanically activated spring loaded devices that can turn a machine sideways to the wind stream in over-strong winds. Once the wind speeds drop to a safe level, operation of the turbine can usually resume in an automatic fashion.
Figure 12 A sample wind turbine power curve.
181.pdf

Introduction to Small-scale Wind Project Design
A SunCam online continuing education course
www.SunCam.com Copyright 2019 Leonard Greer Page 17 of 40
Practical Takeaways from the Theory
1. KEEP IN MIND Equation 2 (for calculating the theoretical available power = ½ ρ A v3) and the Betz limit (~59%) when doing early stage back-of-the envelope calculations to ensure that initial project discussions stay rooted in some sort of solid engineering.
2. THE MOST IMPORTANT FACTOR, per Equation 2 (for calculating the theoretical available power = ½ ρ A v3) in wind power is the sustained VELOCITY v of the wind. Power is a function of the CUBE of velocity. Finding a site for your turbine with twice (2x) the wind velocity gives you an energy resource that is 8 times larger from which to harvest power.
3. SIZE MATTERS: Equation 2 (for calculating the theoretical available power = ½ ρ A v3) also shows that size matters. The 2nd most important factor wind power is the area of the wind turbine. For HAWTs, the area A is a SQUARED function of the blade length r (A = πr2).
4. TURBULENCE IS BAD. If the turbine is near the ground, buildings or trees that affect the wind’s approach, then there will be an issue with turbulence. This will greatly affect the ability of the wind turbines blades to generate lift and hence power.
181.pdf

Introduction to Small-scale Wind Project Design
A SunCam online continuing education course
www.SunCam.com Copyright 2019 Leonard Greer Page 18 of 40
Resource Assessment (or how much does the wind blow?) The sample calculation for Equation 2 on page 13 assumed a 12 miles per hour wind, and demonstrated how to calculate an instantaneous power output. This is not very useful for sizing a wind turbine system, since it only provides an estimate of power availability when the wind is blowing at one particular speed. What is needed in the early stage of a wind energy project are engineering estimates of the range of wind speeds and their relative duration over an annual
Figure 13 Example of Wind Maps available via http://www.nrel.gov/. (Note 30 m ≈ 98 feet)
181.pdf

Introduction to Small-scale Wind Project Design
A SunCam online continuing education course
www.SunCam.com Copyright 2019 Leonard Greer Page 19 of 40
period. This is what “determining a wind resource” means for a given location, and it is critical to an assessment of the viability of a proposed wind project.
An obvious place to start looking is data available on the internet via the US Government. The National Renewable Energy Laboratory (NREL) is the U.S. Department of Energy's primary national laboratory for renewable energy and energy efficiency research and development. The main campus is in Golden, Colorado, and it also operates the National Wind Technology Center near Boulder, Colorado.
Figure 13 illustrates a kind of wind resource map available at NREL’s website. This 30-meter map shows a predicted mean annual wind speed available at 30 meters (or 98 feet) above the surface. This is a practical data set, as smaller wind turbines are generally installed between 50 and 130 feet. Nevertheless, it should be noted that the wind speeds presented on Figure 13 were generated using computer models, and the fine print on the related linked webpages cautions that
these kinds of estimates may not represent the real wind resource at a particular location. Furthermore, local effects, such as hills, trees, buildings, etc. can result in deviations of the true average wind speed from those indicated on the map.
Performing internet searches for terms such as “wind resource maps” or “wind energy atlas” will produce an up-to-date list of links Figure 14
Table 4
181.pdf

Introduction to Small-scale Wind Project Design
A SunCam online continuing education course
www.SunCam.com Copyright 2019 Leonard Greer Page 20 of 40
to other data and wind maps based on historical averages of wind speeds, calibrated wind energy models or other analytical techniques. Some maps do not illustrate average wind speed, as in Figure 13, but instead show areas with similar wind power classifications as tabulated in Figure 14. Maps focused on the state or county level may also be found, which could provide data at a higher resolution.
Nevertheless, translating data from wind resource estimates into parameters useful for preliminary feasibility calculations generally requires a bit of knowledge about how information on wind is represented mathematically.
Again with the theory…
Wind Speed Distribution
Ordinary common observation of wind shows that it does not blow at a steady rate, but it instead varies in intensity (or wind speed) from day to day, and even minute to minute. To take this unsteady wind and use it in a meaningful way with a wind turbines power curve (such as Figure 12 on page 16) means employing some sort of probability distribution of the wind speed.
In the most elementary sense, a probability distribution could be thought of as the proportion of time that the wind blows between narrow ranges of wind speed. Plotting data of winds speed measurements verses their frequency of measurement would produce the histogram similar to that of Figure 15. In this example Wind Speed Distribution (which could represent 48 hourly data points collected over two days), the most likely wind speed that was plotted in Figure 15 is between 6.1 and 8 miles per hour, since 8 of the 48 measurements were found within this range of speeds. However, by looking at this graph with its rather lop-sided asymmetrical shape, it is hard to figure out what the average wind speed would be.
Fortunately, there are two well-documented probability distributions that describe the typical distribution
Figure 15 Example Wind Speed Distribution
181.pdf

Introduction to Small-scale Wind Project Design
A SunCam online continuing education course
www.SunCam.com Copyright 2019 Leonard Greer Page 21 of 40
of wind speed measurements. “Well-documented” means that there are established mathematical formulae that describe these probability distributions shapes, and which can be used to extract information such as the most probable wind speed and the average wind speed.
These well-documented probability distributions are the Weibull distribution, and the Raleigh distribution (which itself is a specialized and simplified case of the Weibull distribution). Both of these distributions can be used to estimate the probability of the wind blowing within a range of speeds at a particular location.
The shape of a typical Weibull distribution is illustrated in Figure 16. This particular graph has been constructed for the case where the average wind speed was set to be 12 miles per hour (mph). In Figure 16, the left hand axis has also been adjusted so that the graph shows the number of hours every year the wind could be expected to blow at a particular speed. So, in this case in Figure 16, this Weibull distribution shows that the average 12 mph wind speed blows about 520 hours per year, however the most likely wind speed is almost 10 mph, blowing a bit over 550 hours per year.
Of course, actual wind speed data collected at any site has much more scatter and would not necessarily produce the neat illustrative shape seen in Figure 16. The standard deviation of the data from its theoretical distribution can be used in a regression analysis to generate a Weibull shape factor (known as ‘k’), which tells how squished or spread-out the true Weibull distribution is at a particular site. Indeed, you may have even noticed that this k factor is mentioned in the note at the lower part of Figure 14 on page 19. This was included in order to communicate precisely the wind’s distribution, something that is critical in estimating the energy that can be harvested from the wind.
In fact, many wind turbine manufacturers specify the output of their turbine using a Raleigh distribution of wind speeds. The Raleigh distribution is really just a Weibull distribution with a shape factor k = 2, and where the average wind speed is assumed to be 1.253 times the most
Figure 16 Shape of a Weibull Distribution
181.pdf

Introduction to Small-scale Wind Project Design
A SunCam online continuing education course
www.SunCam.com Copyright 2019 Leonard Greer Page 22 of 40
probable speed4. It turns out that the Raleigh distribution is a fairly typical distribution for many locations.
Wind Elevation Effects
The variation of horizontal wind speed with respect to elevation is called ‘wind shear.’ For the purposes of wind turbines, wind shear describes5 how the wind is slowed down when it is near the ground where the air speed is influence by friction and obstacles on the surface. Stated most simply, wind speed is slower close to the ground and becomes greater with increasing height above the ground. The wind shear effect is more pronounced over rough terrain and less over smoother terrain.
The elevation below which wind shear can be noted is often called the “boundary layer,” as it represents the interface (or boundary) of the flowing gaseous wind as it moves over the stationary solid ground. Since the power that can be extracted by a wind turbine is a function of the cube of the wind velocity (as indicated in Equation 2), the height of the turbine becomes quite critical in project estimates.
The equation illustrated in Figure 17 is useful for estimating the wind at different elevations. The wind shear profile α can be generalized for different types of terrain, and this will be discussed in a bit more detail with respect to Equation 3 and Table 5 on page 25.
However, in the case of most weather stations where wind speed is measured for meteorological records, the wind speeds are generally collected by anemometers mounted at 10 meters (or 33 feet) tall. Furthermore, the terrain at such sites is often
4 Or more precisely: (√2 √𝜋𝜋)2� times the most probable speed.
5 The more general meaning of “wind shear” is used in civil aviation to describe any change in wind speed over a relatively short distance in any direction (horizontal or vertical). As wind shear was a contributing factor for 26 major aircraft accidents in the U.S., modern aircraft now have on-board wind shear detection systems.
Figure 17 Wind Shear Effects
181.pdf

Introduction to Small-scale Wind Project Design
A SunCam online continuing education course
www.SunCam.com Copyright 2019 Leonard Greer Page 23 of 40
open flat country, with only scattered obstructions less than 10 meters (or 33 feet) tall. The wind shear profile α about weather stations in such a setting can be assumed to be 0.14.
Wind Energy Estimates (in theory)
The illustration in Figure 18 represents the general process for obtaining estimates of energy that can be produced from a given site with a given wind turbine. The data required are some sort of reasonable estimate of the site’s annual wind speed distribution (perhaps looking something similar to Figure 16), which will be combined with data from a turbine manufacturer’s power curve (such as in Figure 12) to generate an estimate of how much energy can be produced.
Obvious points that should be highlighted from the example sketched in Figure 18 include:
Figure 18 Generalize process of estimating wind energy
181.pdf

Introduction to Small-scale Wind Project Design
A SunCam online continuing education course
www.SunCam.com Copyright 2019 Leonard Greer Page 24 of 40
• Energy is only produced after reaching the cut-in wind speed of the turbine. • Although more energy can be generated by the turbine at higher wind speeds, there are
fewer hours per year of winds blowing at these speeds. This means most of the annual energy produced is near speeds slightly above the average wind speed of the site.
• The turbine (or its power curve) and the site’s particular wind distribution pattern should be carefully matched for the most successful projects.
Theory, but with practical applications In theory there is no difference between theory and practice. In practice there is. - Yogi Berra
Theory is ok if you have lots of data. With field data at the site and the elevation of consideration, it is possible to do a regression analysis on the deviation of the data, and then determine the proper scale factor k to produce the Weibull distribution. There are any number of software packages that can help you with this.
However, in the earliest discussion stages of a proposed project, often the luxury of data is not available. Furthermore, those data that are available may also not be directly applicable to the options under consideration.
The following examples will illustrate how to make best use of limited data to make a first order evaluation of the possible technical merit of the project. These are exercises in the thought process needed to assess if procurement of further expertise or the expenditure of more time is warranted.
Sample Problem 1 – Estimate Average Wind Speed at a Remote Location
Assume a downtown renovation project in Kansas City, Missouri is considering adding a wind turbine on a 100 foot tower. Provide a reasonable estimate of the average wind speed that could be experience in such a location.
Solution: A quick search of the internet could find information on city wind speeds (see Table 4 on page 19). Such information can usually be assumed to come from a nearby weather station or airport. As mentioned earlier, wind speeds from such sources can also generally be assumed to be collected by anemometers mounted at 10 meters (or 33 feet) tall. The issue is to translate the
181.pdf

Introduction to Small-scale Wind Project Design
A SunCam online continuing education course
www.SunCam.com Copyright 2019 Leonard Greer Page 25 of 40
10.6 miles per hour from Table 4 for Kansas City (which can be assumed to be collected at the airport meteorological station) to a reasonable estimate for a wind tower in downtown Kansas City at a height of 100 feet.
The equation included in Figure 17 on page 22 (for the discussion of wind shear) is actually a special and simple case of the following equation to translate wind speeds for different elevations and surface terrains:
Equation 3 V@location2 = (V@airport)�𝜹𝜹𝑯𝑯�@𝒂𝒂𝒂𝒂𝒂𝒂𝒂𝒂𝒂𝒂𝒂𝒂𝒂𝒂
𝜶𝜶 @𝒂𝒂𝒂𝒂𝒂𝒂𝒂𝒂𝒂𝒂𝒂𝒂𝒂𝒂�𝑯𝑯𝜹𝜹�
@𝒍𝒍𝒂𝒂𝒍𝒍𝒂𝒂𝒂𝒂𝒂𝒂𝒂𝒂𝒍𝒍𝒍𝒍
𝜶𝜶 @𝒍𝒍𝒂𝒂𝒍𝒍𝒂𝒂𝒂𝒂𝒂𝒂𝒂𝒂𝒍𝒍 𝒍𝒍
In Equation 3, δ represents the local atmospheric boundary layer, which is a function of the terrain types listed in Table 5. The reference “@airport” has been used since meteorological data
is usually easiest to get from an airport weather station. However, credible data from any other source can also be used.
So, applying Equation 3, the expected average wind speed at 100 feet in downtown Kansas City would be:
10.6 �𝟗𝟗𝟗𝟗𝟗𝟗𝟑𝟑𝟑𝟑�
@𝒂𝒂𝒂𝒂𝒂𝒂𝒂𝒂𝒂𝒂𝒂𝒂𝒂𝒂
𝟗𝟗.𝟏𝟏𝟏𝟏� 𝟏𝟏𝟗𝟗𝟗𝟗𝟏𝟏,𝟓𝟓𝟗𝟗𝟗𝟗
�@𝒍𝒍𝒂𝒂𝒍𝒍𝒂𝒂𝒂𝒂𝒂𝒂𝒂𝒂𝒍𝒍𝒍𝒍
𝟗𝟗.𝟑𝟑𝟑𝟑 = 6.7 mph
This case shows how local ground conditions can result in changes to the wind potential. Even though the computer generated map from NREL on page 18 would lead one to expect wind speeds of 10 to 12 mph at 100 feet in this part of America, the effects of the surface terrain can influence wind speeds.
Terrain Type
CharacterizationWind Shear Exponent α
Boundary Layer Thickness δ (feet)
A
Large city centers where atleast half of the buildings are over 80 feet tall for adistance of at least one halfmile upwind.
0.33 1,500
B
Urban, suburban, wooded orother areas where (for atleast one half mile upwind)there are numerous closelyspaced obstructions havingthe size of single familyhomes or larger.
0.22 1,200
C
Terrain that is open flatcountry, with only scatteredobstructions less than 10meters (or 33 feet) tall.Typical of areas surroundmeteorological stations.
0.14 900
D
Flat and unobstructed areas(up to 1500 feet inland) thatare exposed to wind blowingover water for at least onemile.
0.10 700
Wind Shear Profile α and Boundary Layer Parameters
Table 5
181.pdf

Introduction to Small-scale Wind Project Design
A SunCam online continuing education course
www.SunCam.com Copyright 2019 Leonard Greer Page 26 of 40
Sample Problem 2 – Power estimates using only an average wind speed
If the elevation of the site in Kansas City is 900 feet above sea level, what would be a reasonable estimate of the annual power output using a HAWT with 120 inch-long blades in a 6.7 miles per hour annual wind speed environment?
Solution: Ideally, a range of wind data needs to be collected so that a reasonable wind distribution curve can be produced. In reality, we are often called on to give an opinion on the viability of a wind project based on just an average speed record.
The US Government (Department of Energy) has published a recommended rule-of-thumb method of doing such an estimate based on an assessment of a rotor diameter. This applies best to HAWTs that are located at sea level.
Equation 4 Est. Energy Output per year (kW-hr/year) = 0.01328 x (Dia)2 x (Velocity)3
Where:
Dia = diameter of the rotor, in feet
Velocity = Annual Average Velocity in mph
Equation 4 can be seen to be another version of Equation 2 of page 13 with corrections made for unit conversions and an assumed Cp that is typical for smaller commerical turbines. Corrections to this Equation 4 can also be added to account for elevation effects, since the density of the air does vary with elevation, and this can effect the potential power output of a wind turbine. Table 6 has been provided to conveniently list elevations in feet with the anticipated relative reduction in atmospheric air density.
So, to complete the calculations with Equation 4 and Table 6:
A turbine with 120 inch long blades has a swept diameter of 2 x 120 inches (since a single blade would trace the radius of the turbine’s swept area). 120 inches x 2 divided by 12 inches per foot yields a diameter of 20 feet.
Elevation (ft)
Ratio of Air Density at elevation to Air Density
at Sea LevelSea Level 1.000
500 0.9821000 0.9641500 0.9472000 0.9302500 0.9133000 0.8963500 0.8804000 0.8644500 1.0685000 0.8325500 0.816
Table 6
181.pdf

Introduction to Small-scale Wind Project Design
A SunCam online continuing education course
www.SunCam.com Copyright 2019 Leonard Greer Page 27 of 40
Equation 4 is calculated as: 0.01328 x (20)2 x (6.7)3 = 1,598 kW-hrs/year.
Having a turbine on a 100 ft. tower at a site with a 900 ft. elevation means we can expect this power to be only 96.4% of the estimation of Equation 4 due to air density effects (see Table 6 for 1000 feet).
1,598 kW-hrs/year x 0.964 = 1,540 kW-hrs per year.
This is a very low power output, and it reflects the low average velocity which can reasonably be anticipated in a site with a large amount of buildings nearby.
Perhaps a better practical “feel” for this result could come about if one considers that the price of energy that commercial customers in Missouri are paying is 8.54 cents per kilowatt hour6. This means that the value of this wind energy from a 20 ft. diameter wind turbine on this site would only be about 1,540 kW-hr per year x $0.0854 per kW-hr, which equals about $132 per year.
Sample Problem 3 – Further estimates with limited wind speed data
Suppose you have been asked to “qualitatively” assess if it seems practical that a salvaged 5 kW wind turbine with at rated wind speed of 20 mph could power at least half of the load for a farm/residence. The turbine will be mounted on an existing 10 meter mast at the farm, and the nearby airport reportedly has recorded a 14 mph average annual wind velocity. Assume that the farm/residence consumes about 2,000 kW-hrs of energy per month, as this is a fairly standard residential load in the USA.
Solution: The proposed turbine and the meteorological wind-speed measurement elevations are identical and the terrain is the same at both the airport and the farm. This means that Equation 3 for translating a wind estimate from one elevation to another is not needed here.
Recall that the term “rated wind speed” is the speed of the wind where the wind turbine starts to produce its nominal or designated rated power output (see Figure 12 on page 16). This means that one can reasonable expect that at about 20 mph of wind, the turbine should produce about
6 Per the Energy Information Agency of the US Government (http://www.eia.gov/) – October, 2018.
181.pdf

Introduction to Small-scale Wind Project Design
A SunCam online continuing education course
www.SunCam.com Copyright 2019 Leonard Greer Page 28 of 40
5 kW of power. So, an important part of this question could simply become, “How many hours per year can we expect the wind to blow more than 20 mph?”
Although not adequate for the proper design of wind power systems or equipment, useful information on the general behavior of wind speeds and their distributions has been cataloged by civil and mechanical engineering societies (such as the ASCE and ASHRAE). Figure 19 consolidates this information.
To use Figure 19, one enters the graph with the value on the ordinate (or vertical axis) at about 1.43, which is the value of V/V-average for 20 mph/14 mph. The red line traced on Figure 19 intersects with a band of estimates for the percentage of time (traced up from the abscissa by the green lines) where the wind would be blowing at a value of less than or equal to 20 mph.
In this example, the range of estimates for wind speeds LESS than or equal to 20 mph can be seen to range from 75% to 90% of the time7.
This can be interpreted as indicating that the wind will blow MORE than 20 mph at this site an average of 17.5% (plus or minus 7.5%) of the time.
With a total of 8,760 hours per year, the energy produced per year when the wind is blowing at the turbine’s rated speed would be:
8,760 hours/yr x 17.5% x 5 kW = 7,665 kW-hours per year (plus or minus 3,285 kW-hours).
The farm/residence were assumed to need 2,000 kW-hrs per month x 12 months per year = 24,000 kW-hrs per year; half of that (12,000 kW-hrs) is what is desired from the wind turbine. This turbine, when the wind is blowing at greater than 20 mph, can provide between 4,380 to 10,950 kW-hrs per year (or 7,665 plus or minus 3,285 kW-hrs). This means that a “typical” 14 mph average wind speed environment (represented by the relationship in Figure 19) could have enough wind for a 5 kW, 20 mph rated turbine to perform at its rated output long enough each year to deliver about 7,665 kW-hours (or 63%) of the desired 12,000 kW-hrs.
Stepping back, one needs to recall the overall shape of a turbine power curve (see page 16). Power is also generated when the wind is blowing below the rated 20 mph rated speed, but above the cut-in speed. The amount of this power is a function of the individual manufacturer’s design.
7 Or, 82.5%, plus or minus 7.5%.
181.pdf

Introduction to Small-scale Wind Project Design
A SunCam online continuing education course
www.SunCam.com Copyright 2019 Leonard Greer Page 29 of 40
Even though this output will be less that the rated power, the total energy produced in this band is usually significant due to the shape of typical (Weibull) distributions of the number of hours the wind blows in this band of wind speeds.
Hence, it does seem possible that this turbine in this wind regime COULD deliver the power required.
Figure 19
181.pdf

Introduction to Small-scale Wind Project Design
A SunCam online continuing education course
www.SunCam.com Copyright 2019 Leonard Greer Page 30 of 40
Although this is not a precise calculation, it does show that taking further steps to evaluate this project idea are warranted.
These next steps would include:
1) Contacting the airport mentioned above and collecting a proper and detailed set of wind data.
2) Locate a copy of a wind turbine power curve for the turbine of interest. 3) Collect energy usage data from the farm house to better define the load requirements.
Planning the Wind Project If first-order general assessments of the wind energy and economics appear favorable, then the next step is to budget time or funds to evaluate the specifics of the proposed site.
In general, it is critical to keep in mind that local obstructions such as trees, buildings, etc., can affect the accuracy of wind speed estimates. The effects of an obstruction to wind flow can be detected up to four (4) times the height of the obstruction, and sometimes as far away as a mile or more down-wind. Furthermore, as indicated by Equation 2, variations in wind speed are amplified with a cubic power in actual energy or power output.
Because of this heighten sensitivity to local effects and obstructions, most wind energy professionals will recommend measuring the actual wind speeds AT THE PROPOSED TURBINE SITE as part of a credible feasibility study.
Local Site Wind Data (i.e., Anemometer Studies) To the maximum extent practical, measurements need to be made at the intended wind turbine location, as well as at the anticipated hub height of the wind turbine. It is best if the measurements are recorded in an open area, and not above the roof of a building, which is a place where the wind flow is likely to be disturbed. However, if the geometry of the site is such that a wind sensor must be located near an obstruction, the sensors should be located at a horizontal distance downwind of the obstruction no closer than 10 times its height.
181.pdf

Introduction to Small-scale Wind Project Design
A SunCam online continuing education course
www.SunCam.com Copyright 2019 Leonard Greer Page 31 of 40
Moving beyond the minimum, multiple measurement heights are often recommended by wind professionals as data collected in this way can reveal important details about the sites wind shear characteristics (discussed earlier on page 22). Table 7 shows the parameters and heights that NREL has published for a robust wind energy measurement program.
How Long Do You Measure?
In general, the longer, the better. Most any wind professional will tell you that the longer the monitoring period of the wind regime, the more confident one can be that the data collected will be of the quality needed for specifying the critical project parameters. One full year of site wind data is usually recommended, but ideally and preferably several years of wind measurements are optimal. Multi-year data delivers data for all the seasons, as well as several readings on inter-seasonal and/or annual changes.
Of course, cost and scheduling issues often preclude extensive and lengthy measurements. Measurements collected over a shorter period of time may still be valuable, although they will also have more significant limitations
But what if you are pressed for time?
The absolute minimum wind data collection period should never be less than three (3) months. The overwhelming preference, nevertheless, is 6 to 12 months. Such measurements on a truncated schedule should be timed to coincide with either the spring of the fall, which due to the change of seasons, have the best chance of measuring winds from all directions.
Of course, if only part of the year is to be measured, the data for the remainder of the year must be somehow estimated. One way that this can be done is by comparing the readings collected with those of a relatively proximate meteorological station that has long term wind records. The difference between the data collected at your site and that at the meteorological station may be assumed to represent the difference in the wind speeds at the two locations.
Measured Parameters
Measurement Elevation
Wind Speed (m/s)
40 m, 25 m, 10 m
Wind Direction (degrees)
40 m, 25 m, 10 m
Air Temperature (°C)
3 m
Recommended Windsite Data - NREL
Table 7
181.pdf
Introduction to Small-scale Wind Project Design
A SunCam online continuing education course
www.SunCam.com Copyright 2019 Leonard Greer Page 32 of 40
Care should be taken to select the elevation and the frequency of data collection for your wind measurements so that your collected records can be easily correlated with the existing meteorological records. The hope is that by comparing your own winds on an hourly or daily basis with the established station measurements, a relationship between the two sites may be observed.
Finally, the accuracy of the wind instruments needs to be checked before and after the measurement program. Some anemometers are susceptible to accuracy losses with prolonged operation.
Potential Show-stoppers
Zoning and Permitting Requirements
Prior to expending significant resources or time on the planning of a wind project, it is wise to assess if there are any restrictions related to zoning or permitting. If the project is in a residentially zoned area, there could be restrictions on the height of any structures, although variances may be obtainable. A typical residential zoning ordinance height limit is 35 feet (or 10.67 meters).
Zoning restrictions in the area of interest can be assessed by contacting the local building inspector, board of supervisors, and/or planning board. This should define the building permit and other obvious requirements.
It is also important to consider if there is any likelihood of the wind site neighbors or the local homeowners' association could object to a wind machine that affects the visual landscape. They also could be concerned about noise, since the sound level of most wind turbines is indeed slightly above noise level of the ambient wind. Practically, this means that it will be possible to detect the sound of the wind turbine out of surroundings when a conscious effort is made to hear it. However, these noise levels are also generally not considered at a nuisance level. Furthermore, wind turbine manufacturers usually can provide objective data about the acoustical performance of their machines, which can be quite useful in addressing the concerns of zoning officials or future neighbors.
181.pdf

Introduction to Small-scale Wind Project Design
A SunCam online continuing education course
www.SunCam.com Copyright 2019 Leonard Greer Page 33 of 40
Requirements for Building/Grid Tie-in
Stand-alone Systems Wind power for many people appeals to their environmental values, and the dream obtaining independence from the power company and displaying a commitment to non-polluting energy sources. This type of application is called a “stand-alone” system, and is popular in remote locations, especially at those places that are far from a utility electric power line. For this kind of application, the additional equipment beyond the wind turbine itself (called the “balance-of-system”) would include batteries, charge controllers, power conditioning equipment, and safety-&-operating devices.
Because of the inherit modularity of a stand-alone system, vendors can usually be found that will provide or recommend all the equipment/services needed for the installation and operation of the stand-alone wind energy conversion systems. It is therefore not really unreasonable to expect to find “one-stop” service or shopping for stand-alone systems.
Grid-Connected Systems On the other hand, the majority of wind energy conversion systems of interest today consists of those that tie-in to a facility already on a utility grid and provide renewable energy when it is available. This renewable energy can be directed to the home or business establishment, and then if there is any surplus energy, it can be fed back into the local utility’s electric grid. Alternatively, on those occasions when the wind energy is not available, this set up allows the electric grid to provide back-up power. This is extremely convenient, and also removes the need for batteries from the balance-of-system equipment.
Of course, even grid-connected systems will still require some balance-of-system equipment, specifically power conditioning equipment, and safety-&-operating devices. These components include switches that can disconnect your system from the grid during power failures or power surges, which are critical to protecting repairmen who work on the grid that is receives power from your wind energy system. Additionally, the power conditioning equipment is necessary to ensure that the power your system generates matches the frequency and voltage of that on the grid.
These balance-of-system equipment items are not optional and their price needs to be included in cost estimates.
181.pdf

Introduction to Small-scale Wind Project Design
A SunCam online continuing education course
www.SunCam.com Copyright 2019 Leonard Greer Page 34 of 40
The precise requirements for your grid-connected system, however, are often defined by the electrical utility, and hence vary greatly from location to location.
Nevertheless, most utilities generally all have the same concerns when connecting a new power source to their grid, and the local regulations concerning safety, power quality, metering, and revenue collection are generally similar. In fact, several organizations have developed national guidelines for such grid-connected renewable energy systems, and your wind system vendor or utility can be consulted to ensure your system implements the required guidelines and regulations8. Even though there is no mandate from the Federal Government to adopt all of such codes and standards, some utility commissions and state legislatures require distributed generation systems (like wind energy conversion systems) to be regulated according to rules based on the IEEE, UL, and National Electrical Code (NEC) standards.
Metering and Rates The Public Utility Regulatory Policy Act of 1978 (PURPA) requires power providers in the United States to buy excess power from grid-connected small renewable energy systems (such as wind systems) at a rate that is equal to what it costs the utility to produce the power itself. Note that this rate is NOT necessarily the rate at which the utility sells power to its customers. There are now generally two (2) ways that utilities or power providers implement this PURPA requirement via metering arrangements:
1. Net Purchase and Sale -- Under this kind of arrangement, two uni-directional (or regular) meters are installed at the facility with the wind turbine. One meter records electricity drawn from the grid, and the other records excess electricity generated and fed back into the grid. With this kind of set-up, you will pay the normal retail rate for the electricity you use. However, the utility company will buy power back from you (your excess wind generation) at the utility company’s avoided cost (which is sometimes called the “wholesale rate”). It is possible that there may be a significant difference between the retail rate you pay and the power provider's avoided cost. As with most retail/wholesale pricing schemes, the retail rate is normally greater than the wholesale rate.
8 Examples include the Institute of Electrical and Electronics Engineers’ IEEE 1547, Standard for Interconnecting Distributed Resources with Electric Power Systems, and the Underwriters Laboratories’ UL 1741, The Standard for Inverters, Converters and Controllers for Use In Independent Power Systems
181.pdf

Introduction to Small-scale Wind Project Design
A SunCam online continuing education course
www.SunCam.com Copyright 2019 Leonard Greer Page 35 of 40
This means your site will buy power from the utility company at the “normal” price, but sell it back to the utility at a lower price. This arrangement must be recognized and understood in advance, or seriously errors in project cash flow estimates may result.
2. Net Metering – With this arrangement, a single, special bi-directional meter (Figure 20) is used to record both electricity that is drawn from the grid and the excess electricity the wind turbine feeds back into the grid. Because this kind of metering scheme provides the greatest benefit to renewable energy suppliers, it has been implemented in many states. This kind of set-up means when your wind energy conversion system produces more energy than is needed by your site, the excess electricity generated acts to effectively "run your electricity meter backward" as the wind generated energy is fed back into the grid. The result of this is that if you use more electricity at your facility than what your wind system feeds into the utility grid over a billing cycle, your utility bill will be calculated to an amount that represents the difference between what your facility used and what your wind system produced. The bottom line with net metering is that the utility company is effectively paying the retail price for the wind generated electricity fed back into the grid.
Figure 20 Utility meter provided for Net Metering including an affixed label that reads “Meter Runs Both Directions (Net Meter)”
- photo by Brian Kusler
181.pdf

Introduction to Small-scale Wind Project Design
A SunCam online continuing education course
www.SunCam.com Copyright 2019 Leonard Greer Page 36 of 40
Some electricity providers have special provisions of net metering that allow the wind generating station to carry over a balance of any net extra electricity the system generates from month to month (for a limited term). This can prove to be beneficial if the wind resource at the site is very seasonal. As with any contract, this kind of agreement between the wind generator site and the utility needs to be careful reviewed and understood for impacts on project revenues estimates.
Other Contractual Issues If a wind energy system is going to be connected to the grid, then an interconnection agreement will most likely need to be signed with your electricity provider. These kinds of agreements vary from utility to utility, but it is reasonable to anticipate the following requirements:
• Liability insurance – Liability insurance is insurance that protects the electrical power provider in case of accidents resulting from the operation the wind energy system. The power provider may even specify the amount of coverage that is required, and for which the wind facility owner should pay. Furthermore, some power providers may additionally require you to indemnify them for any potential damage, loss, or injury caused by your system. This in itself may prove to be a significant cost.
• Costs, fees and other charges – The agreement could require payment of permitting fees, engineering/inspection costs, metering charges (for a new or a second meter), and even stand-by charges (to defray the power provider's cost of any locally mandated maintenance of your system as a backup power supply).
• Paperwork and submissions – Depending on the size of the system and the local rules, the owner of the wind system may have to commit to providing cost or usage data per pre-established deadlines to the power provider in order for the provider to complete its own regulatory submissions.
181.pdf

Introduction to Small-scale Wind Project Design
A SunCam online continuing education course
www.SunCam.com Copyright 2019 Leonard Greer Page 37 of 40
Table 8 is a summary of the potential “show-stoppers” that could affect the enthusiasm or momentum for a proposed wind project. Even though an early analysis of the wind resource seems promising, the issues discussed herein (and summarized in Table 8) should be acknowledged before time and money are expended on collecting more data or purchasing equipment or consulting services.
Siting issues
Contract issues
a)
b)
c)d)
e)
f)
determine if wind site owner MUST indemnify utility for faults onthe tied-in grid. ID and estimate contractual REQUIRED inter-tie fees, safetyinspection fees, etc.ID annual recurring paperwork (or reporting) burden that powersupplier may require of wind project owner.
ID and estimate price of REQUIRED balance-of-system components(e.g., safety disconnects, power conditioning equipment, extra ornew meters, etc.)ID type and general terms of the available purchase power (will it be "net purchase & sale" or "net metering"?)(will there be caps or limits on sale of energy to utility?)determine REQUIRED liability insurance for grid tie-ins;
Preliminary Planning IssuesInvestigate prior to recommending a wind project.
Are there zoning restrictions at the proposed site that limit the heightof structures?
Are there neighbors to the site that may file complaints due to noiseissues or impacts on the visual landscape?
Consult the local utility or power supplier, review standard terms ofgrid tie-in contract and:
Table 8 Summary of Potential Show-stoppers
181.pdf

Introduction to Small-scale Wind Project Design
A SunCam online continuing education course
www.SunCam.com Copyright 2019 Leonard Greer Page 38 of 40
Summary & Conclusions As mentioned at the outset, this course was designed to equip the student with the ability to evaluate generally available parameters, and then produce sound judgments as to whether or not more energy, time, or money should be devoted to investigating the feasibility of a wind project.
A brief introductory course like this cannot produce qualified wind technology experts, and its aim was instead to equip technically competent engineers with the background to assess if the situation really warrants hiring such consultants.
To this end, the course provided a quick introductory overview of the common types of wind turbines, and the way they are generally cataloged in technical or commercial literature. Table 1 provides a convenient summary of this terminology, as well as useful listings of the relative merits and short-comings of the kinds of turbines that could be discussed with wind industry sales professionals.
The physics of wind turbines were also reviewed, emphasizing the importance of lift-driven machines in modern applications. Equation 2 (the Fundamental Equation of Wind Power) also highlighted how critical velocity is to power production due to the fact that energy extracted from the wind is a function of the cube of the wind speed. The student was also reminded how turbulence is detrimental to the lift effect, and all efforts must be made to locate turbines away from any obstructions that could interfere with the wind’s smooth approach.
The course also dealt with characterization and evaluation of a wind resource, pointing out the nature (but not the detailed mathematics) of typical wind distribution regimes, such as the Weibull and Raleigh distributions. This, along with sample problems, allowed the student to gauge the comparative value of estimates made with only partial data, such as an average wind speed at a remote location or elevation.
Finally, topics that could prove to be show-stoppers were discussed. These represented items which, if over-looked in the early stage, could in the future9 result in cancelling the project after funds have been spent on consultants and detailed wind profile data collection.
9 and have in the past, in some sad cases.
181.pdf

Introduction to Small-scale Wind Project Design
A SunCam online continuing education course
www.SunCam.com Copyright 2019 Leonard Greer Page 39 of 40
Table of Selected Image Credits
Table 9
181.pdf

Introduction to Small-scale Wind Project Design
A SunCam online continuing education course
www.SunCam.com Copyright 2019 Leonard Greer Page 40 of 40
GBCI CE Approval The Green Building Certification Institute (GBCI) has approved this course for Continuing Education. Continuing education (or CE) hours are the hours Leadership in Energy and Environmental Design (LEED) professionals spend in credential maintenance activities. The GBCI course ID for this course is 0920018312.
181.pdf