Embed Size (px)
Citation preview
Introduction to Network Design

e 2
Acknowledgement
• Edward Chow• Robert Cahn

e 3
Introduction to Network Design
Network design is • Create network structure (blue print)• Decide how to allocate resource and spend moneyTwo basic questions:• How much it cost to build a usable network?• How much improvement does $x buy?Answer:• Depend on network services and components
available• We will concentrate the techniques and algorithms

e 4
Network Evaluation
• Every network has three characteristics:– Cost– Performance– Reliability
• First we need to find agree-upon quantitative numbers.
• Based on the quantitative numbers of these characteristics, we can evaluate different design alternative by ordering them and ruling out losers.

e 5
Example 1
• Four designs for a network design problem

e 6
Cheap Network (by Intrepid)

e 7
Messy Network

e 8
Rank Designs by Attributes

e 9
Justify the Designs
• There can be factors that decides the final choice:Whether the company is expanding
• Maybe the proposed designs are not as expected.• In outsourcing situation, you may ask for redesign• You may not have to serve as designer but as an
evaluator.

e 10
Compare Designs

e 11
What is more important, Performance or Cost?
•150 cashiers $13,725/month
•CEO $152,500/month
•One user my justify the building a high performance network

e 12
Two-Location Problem
• It is called “Hello World” of Network Design.• It is undaunting yet interersting problem!• Design a network connecting two locations, 200km apart.• Anagon city with 5 employees, Bregen with 10.• Each employee
– call other site 4 times/day, avg. 5 min. each.4*5*15=300 min/day
– call others in the same office 10 times/day about joint work, each last avg. 3 min. 10*3*15=450 min/dayNote here we are not using C(10,2)+C(5,2) for the # of calls
• How can we best provide the communications between the two cities

e 13
Cost of Network Services and Components
• Network equipment purchase is typically amortized at 3% per month.
• The PBX Private Branch Exchange would cost $60/month

e 14
Public Switched Telephone NetworkSolution

e 15
Cost of PSTN Solution
Assume 21 2/3 work days=65/3 daysLocal call: 450min/day*0.05$/min*65/3day=487.5$
Long distance call; 300min/day*0.4$/min*65/3day=2600$

e 16
Utilization Analysis
• 5 employees at Anagon place 4*5min*5=100 min calls/day to Bregen
• 10 employee at Bregen place 4*5min*10=200 min calls/day to Anagon
• 300 min long distance calls are shared among 5 employee at Anagon.
• That is 300min/5=1 hour/employee/day on long distance.• For 8 hour day, each phone at Anagon is busy 25%=2/8? of the
time. While phone at Bregen is busy 18.75%=1.5/8? Low Utilization
• Resaon: Each employee at Anagon makes 10*3min/day=30min local call, but it will tie up other employee’s line. Assume no conference call. Therefore each line is 30min*2=1hour/day is busy on local call.

e 17
Design Principle 2.1
• Good network designs tend to have many well-utilized components.

e 18
PBX Solution
$487.5/month for local calls savedWith$60*2=$120 amortized PBX cost,
we actually save $367.5/month
Reliability degraded?!Performance?

e 19
Reducing Trunks at Bregen
• There can be 5 intersite simultaneous calls.• Reduce 10 outgoing trunks at Bregen to 5.• $25/month*5=$125/month access fee saving.• How can we reduce the cost further?• Clue Study the usage pattern

e 20
Famous 2 camel hump Telephone Traffic Daily Pattern
• Traffic measured in Erlangs.
e 21
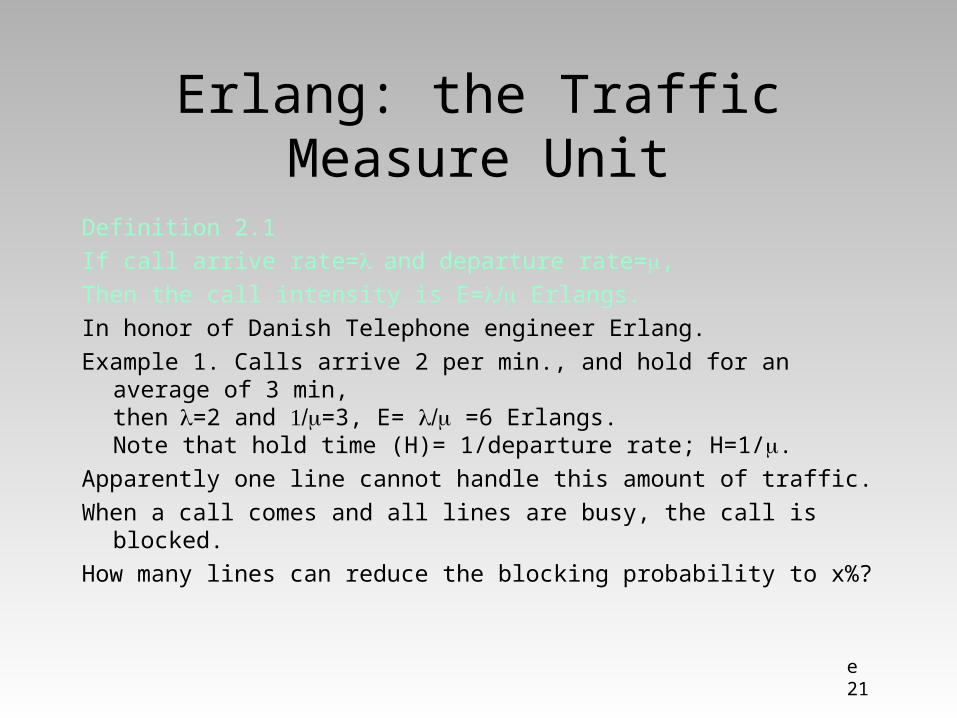
Erlang: the Traffic Measure Unit
Definition 2.1
If call arrive rate=and departure rate=,
Then the call intensity is E= Erlangs.
In honor of Danish Telephone engineer Erlang.
Example 1. Calls arrive 2 per min., and hold for an average of 3 min, then=2 and =3, E= =6 Erlangs.Note that hold time (H)= 1/departure rate; H=1/.
Apparently one line cannot handle this amount of traffic.
When a call comes and all lines are busy, the call is blocked.
How many lines can reduce the blocking probability to x%?

e 22
Erlang Calculation
• In our 2-location case, 15 places 4 long distance calls/day, each call last avg. 5min. Assume 8 hr day
• What is the call (traffic) intensity for the day?=15*4 calls/8 hr = 15/2 calls/hrH=5 min/call =1/12 hr/call=1/H=12 calls/hr = 0.2 calls/minE==(15/2)/12=15/24=5/8 Erlangs.
• Assume 20% of the traffic in the busy hour. What is the call intensity in the busy hour?=60 calls/day * 0.2 = 12 calls/hr = 0.2 calls/min=1/H=12 calls/hr = 0.2 calls/minE==12/12=1 Erlang.

e 23
Queueing Theory for System with Loss
• Assume a telephone system with multiple lines.– When a call comes and all lines are busy, the call
is blocked. Unlike data network, calls are not buffered or queued if lines are not available.
– Or, you can consider it is a finite queue, i.e., after queue full (line busy), further call are blocked.
How many lines can reduce the blocking probability to x% for a given traffic density?
• Queueing theory can be used analyzed the telephone system’s performance, specifically the blocking probability.

e 24
M/M/2 Queue

e 25
Loss with m Lines (m servers, no queue)
A: Arrive Rate; D: Departure Rate; E=A/DAPk-1=kDPk Pk=E/k * Pk-1

e 26
Erlang-B Function

e 27
Calculating the Blocking• In 2-location case, with busy hour, A=0.2 calls/min,
D=0.2calls/min.• When 1 call in progress, departure rate is 0.2
calls/min• When 2 calls in progress, departure rate is 0.4.

e 28
Design Intersite Link
• Given we can tolerate x% blocking, how many lines we actually need?
• Here E=1 (busy hour). Carried load=E(1-B(E,m)). qi=fraction of load on link i.

e 29
Simplified Traffic Profile
• Instead of 2 camel hump traffic pattern, simplify it to two levels: peak and off-peak.
• 60min*2*0.4*(21+2/3)=104030min*6*0.4*(21+2/30=1560

e 30
Reduce Cost by Using Leased Lines
• Instead of charged by # of calls, pay monthly cost.• The leased line costs $275/month replacing two
PSTN lines, one on each end, for a total of $50.• The calls placed on the leased line save $0.4/min.• Strategy: Place calls on leased lines first.• Question: How many released lines should we use?• Let us figure out the cost saving of each leased line.• First focus on busy-hour analsys

e 31
Busy Hours Analysis for Leased Line Saving
• What is the value of busy-hours traffic carried by a single leased line?
• With 60min/hour usage, traffic is E=60/60=1 Erlang.• From table 2.3, the fraction of calls on a single leased
line is 0.5. The other half got blocked.• Saving on dialup cost: 0.5*$1040=$520/month• The net equipment cost of leased line=$275-$50
(replaced two PSTN lines)= $225/month.• The net cost saving = $520-$225=$295/month• It is justifiable.

e 32
2nd Leased Line Saving
• For busy hours, the 2nd leased line will carry 0.3 traffic.
• Dialup cost saving = 0.3*$1040=$312/month.• $312 > $225 still justified.• The third leased line only carries 0.1325 busy hour
traffic. • Dialup cost saving = 0.1325*$1040=$143/month.• We need to see if the cost saving of off-peak hour
usage of the 3rd leased line adds adds up to $225.

e 33
Off-Peak Analysis of 3rd Leased Line
• Off-Peak hours traffic = 30/60= 0.5 Erlang.• The fraction of calls carried by the first leased line
=B(0.5,0)-B(0.5,1)=1-(0.5*B(0.5,0))/(0.5*B(0.5,0)+1)=2/3.• Cost saving for the 1st leased
line=(2/3)*$1560=$1040/month.• The fraction of calls carried by the 3rd leased line
=B(0.5,2)-B(0.5,3)=(1/13)-(0.5*B(0.5,2))/(0.5*B(0.5,2)+1)=1/13-1/79=0.0643.
• Cost saving for the 3RD leased line during off-peak hours =(0.0643)*$1560=$100.25/month.
• $100.25+$143=$243.25> $225 justified!

e 34
Final Design

e 35
Cost of Final Design
2PBX’3 leased lines4 PSTN lines
$3462.5-$1129.75=$2332.75/month saving