Embed Size (px)
Citation preview
Dartmouth College | Research Computing
INTRODUCTION TO GIS

• Workshops
• GIS at Dartmouth
• What is GIS?
• Types of Data
• Referencing data to the earth: Datums, Map Projections, and Coordinate Systems
• Working with GIS
• Hands-on practice
• Data Sources, Data Formats & Metadata
• Software – Desktop & Web
• Data Management
OVERVIEW
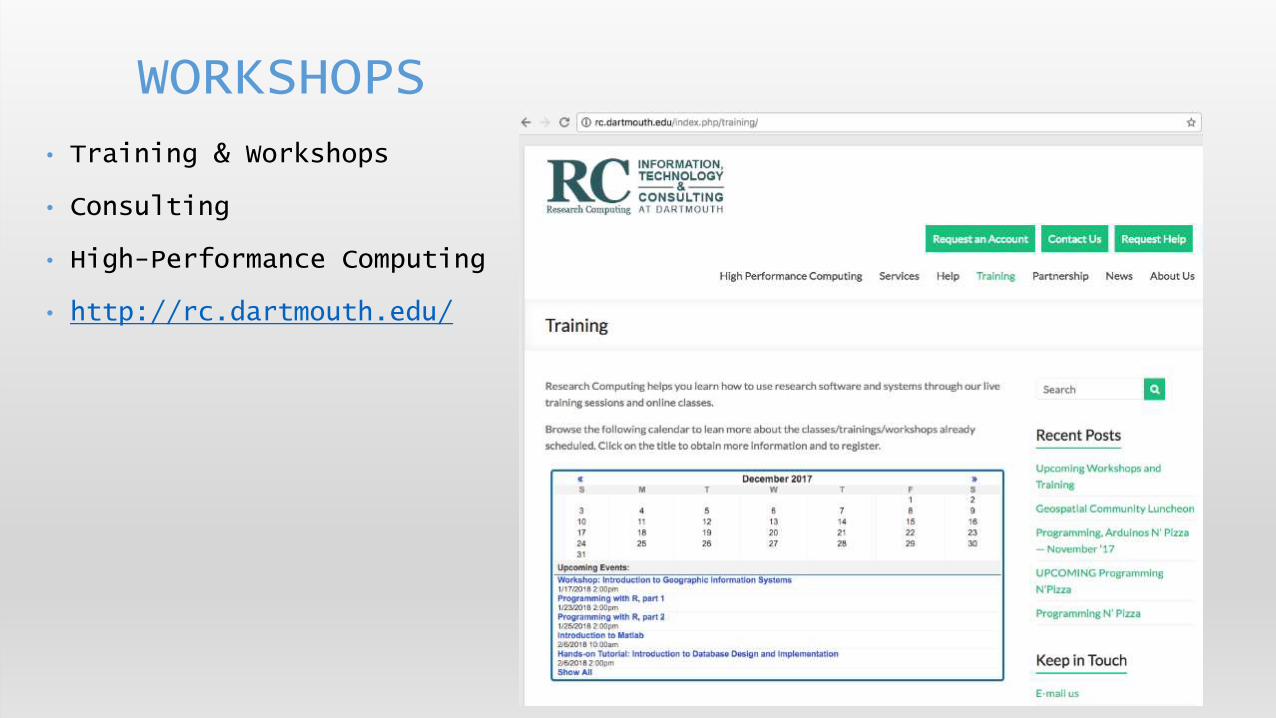
• Training & Workshops
• Consulting
• High-Performance Computing
• http://rc.dartmouth.edu/
WORKSHOPS

• Geography Department, Earth Sciences Department
• Geography http://geography.dartmouth.edu/ Earth Sci: http://earthsciences.dartmouth.edu/
• Geog 50 Geographic Information Systems (Fall 2018)
• Geog 57 Urban Applications of GIS (Fall 2018)
• Geog 51 / Ears 65: Remote Sensing
• Geog 54 Geovisualization (Winter 2019)
• Geog 59/Ears 77 Environmental Applications of GIS
• Resources in the Library Reference Research Guides and Evans Map Room
• http://researchguides.dartmouth.edu/gis
• https://researchguides.dartmouth.edu/webmapping
• Research Computing: Promoting the advancement of research through the use of high-performance computing (HPC), GIS and Life Sciences applications consulting, services and workshops.
• http://rc.dartmouth.edu/
• Accounts for researchers (50 GB for graduate students, 1TB for faculty)
• List of workshops & events
• Contact Info: [email protected]
GIS AT DARTMOUTH

GIS AT DARTMOUTH

• Commonly used Desktop GIS Software:• ArcGIS Desktop (Windows only, Mac users can use through Parallels or Bootcamp virtual machines
running windows)
• QGIS (Open-source, runs on a Mac)
• ArcGIS Pro (new software from ESRI, with optimizations for 3-D viewing)
• Common web-based mapping & GIS tools• ArcGIS Online
• Carto (formerly CartoDB), online mapping platform
• Google Maps – sign up for a gmail account, allows you to make your own maps on top of Google Maps basemaps and imagery
• Google Earth Pro
• Other• R Statistical package with GIS libraries
• Python with GIS libraries
• Some data resources, producers & warehouses• https://researchguides.dartmouth.edu/gisdata/usdata
• www.data.gov and https://www.data.gov/geospatial/
• https://www.openstreetmap.org/ and https://www.openstreetmap.org/export
• State government GIS clearinghouses
• Social Explorer, Simply Map, PolicyMap, American Factfinder, Census Bureau
GIS AT DARTMOUTH: SOFTWARE & DATA

• Geographic Information Systems allow us to interactively work with geographic data.
• This includes creating, editing, displaying, analyzing and printing geographic information
• Most GIS’s allow for both spatial viewing in a map and tabular viewing in a database tables.
• Some basic GIS work can be done in a web browser
• More advanced GIS analysis and editing can be done with Desktop GIS software on basic PC’s and Mac’s.
• Often GIS research and analysis requires very powerful desktop computers or high-performance servers.
WHAT IS GIS?
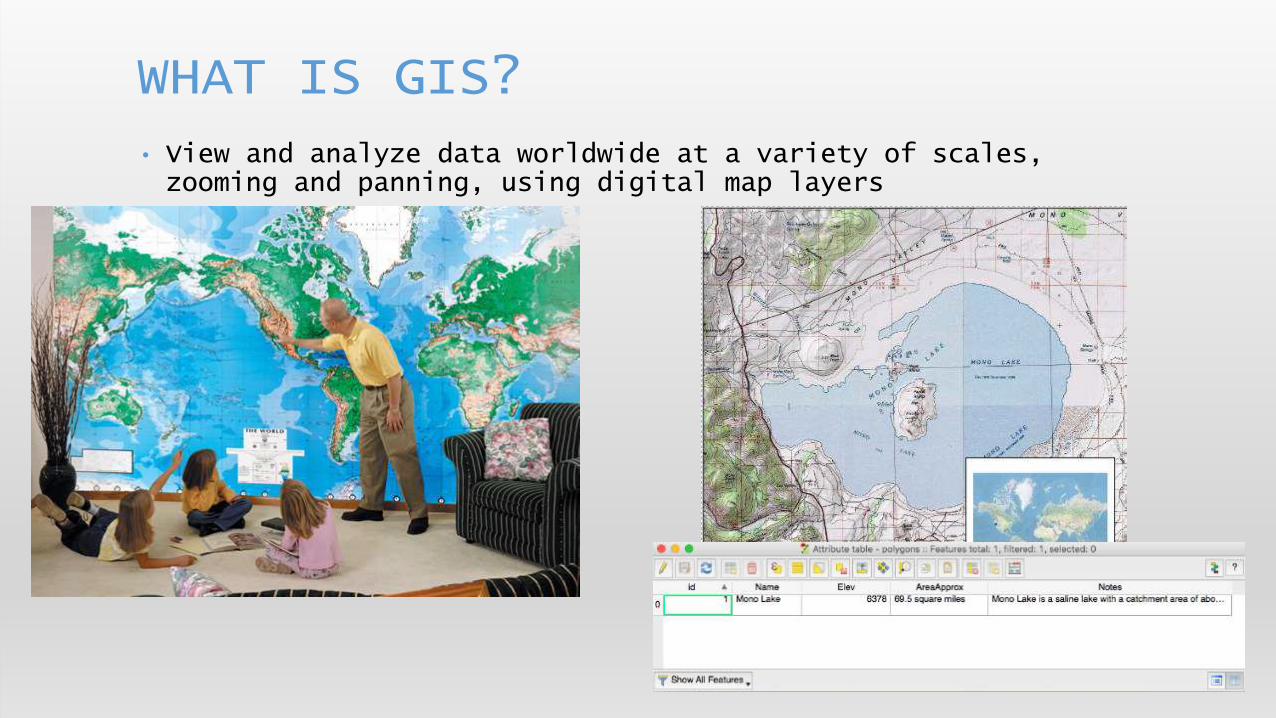
• View and analyze data worldwide at a variety of scales, zooming and panning, using digital map layers
WHAT IS GIS?
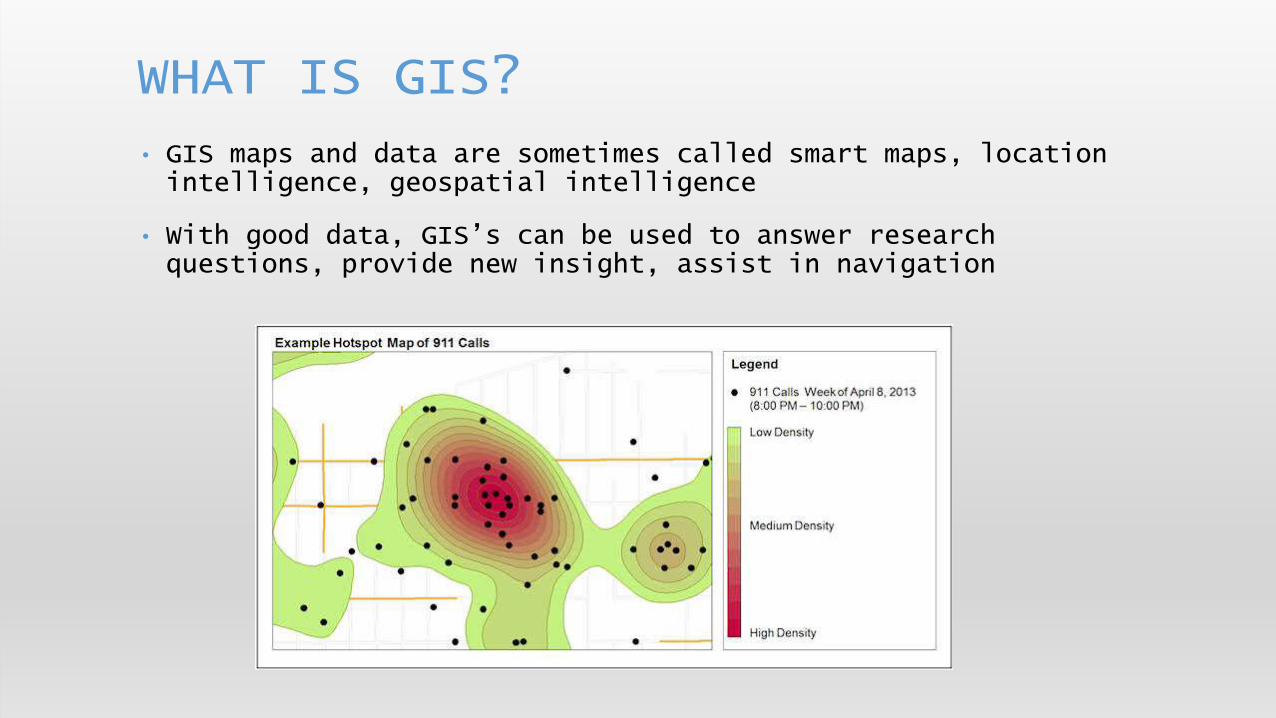
• GIS maps and data are sometimes called smart maps, location intelligence, geospatial intelligence
• With good data, GIS’s can be used to answer research questions, provide new insight, assist in navigation
WHAT IS GIS?
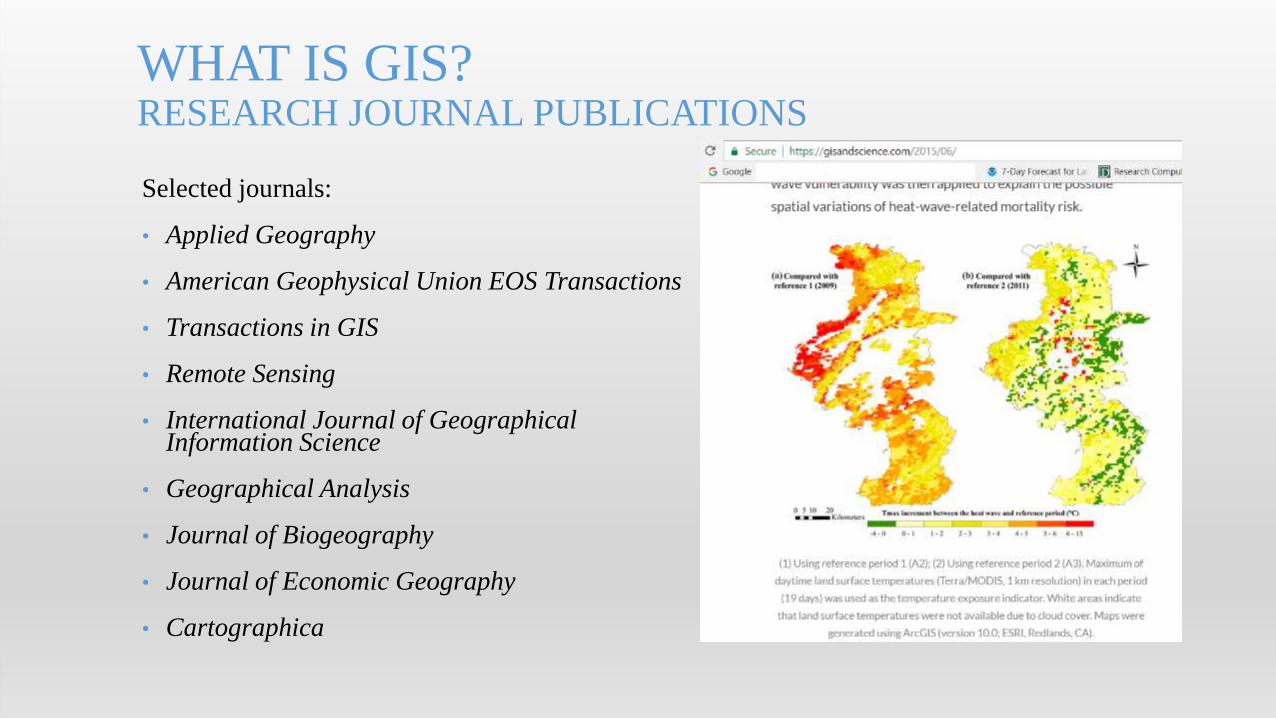
Selected journals:
• Applied Geography
• American Geophysical Union EOS Transactions
• Transactions in GIS
• Remote Sensing
• International Journal of Geographical Information Science
• Geographical Analysis
• Journal of Biogeography
• Journal of Economic Geography
• Cartographica
WHAT IS GIS?RESEARCH JOURNAL PUBLICATIONS

• Basic Data Types and Formats:
• Spatial:
• Vector
• Raster
• Tabular
• Common Data File Formats
• Vector: Geodatabase, Shapefile, KML, KMZ, xyz,
• Raster: IMG, TIFF, JPEG, GRID
• Tabular: Excel, database tables, csv
TYPES OF GIS DATA
• Polygons
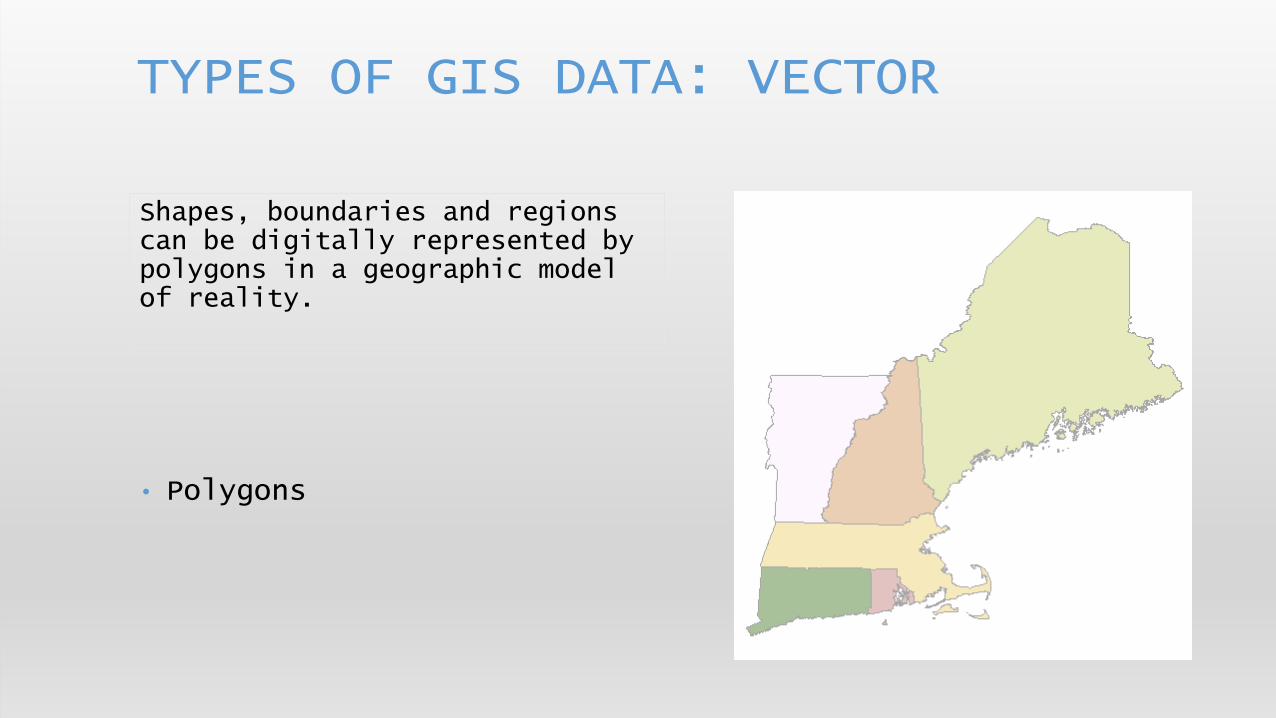
TYPES OF GIS DATA: VECTOR
Shapes, boundaries and regions can be digitally represented by polygons in a geographic model of reality.
• Polygons
• Lines
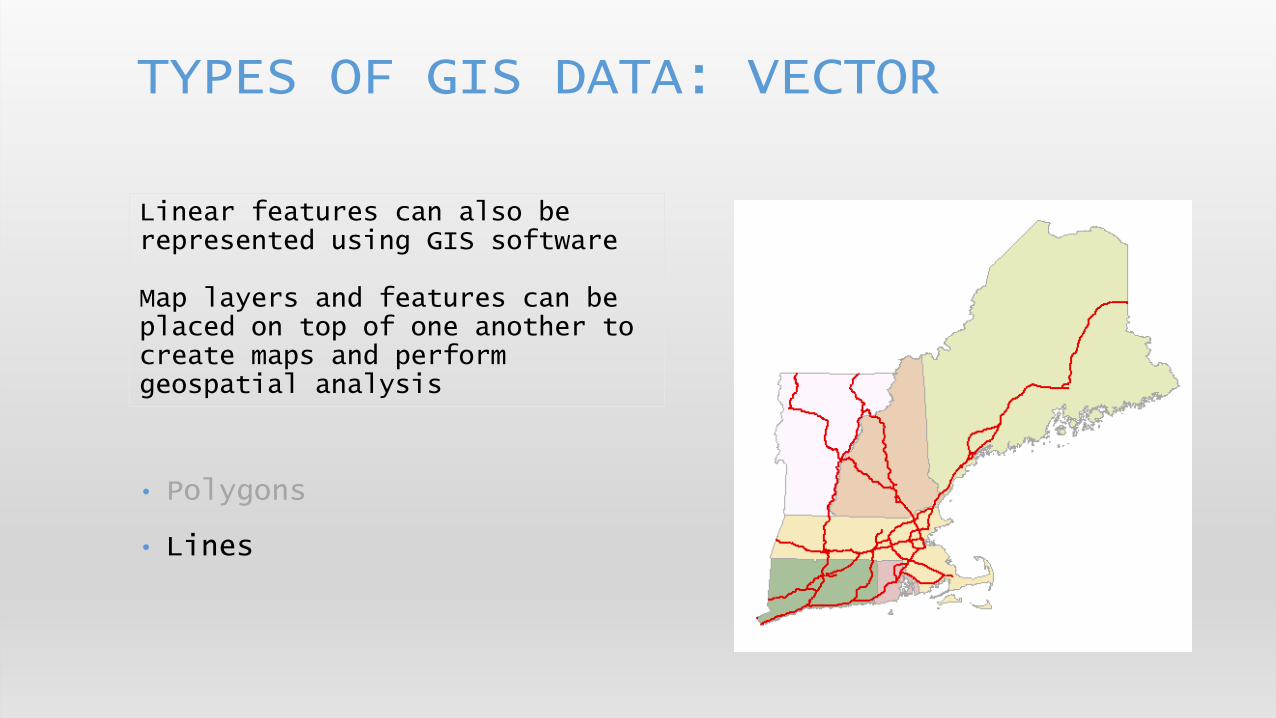
TYPES OF GIS DATA: VECTOR
Linear features can also be represented using GIS software
Map layers and features can be placed on top of one another to create maps and perform geospatial analysis

• Polygons
• Lines
• Points
TYPES OF GIS DATA: VECTORAn individual point, line or polygon is known as a “Feature”
Features such as state capitals and cities can be represented by points
Notice how the GIS system uses a “stack” of map layers. The layers are also sometimes known as themes.
• Polygons
• Lines
• Points
• Raster
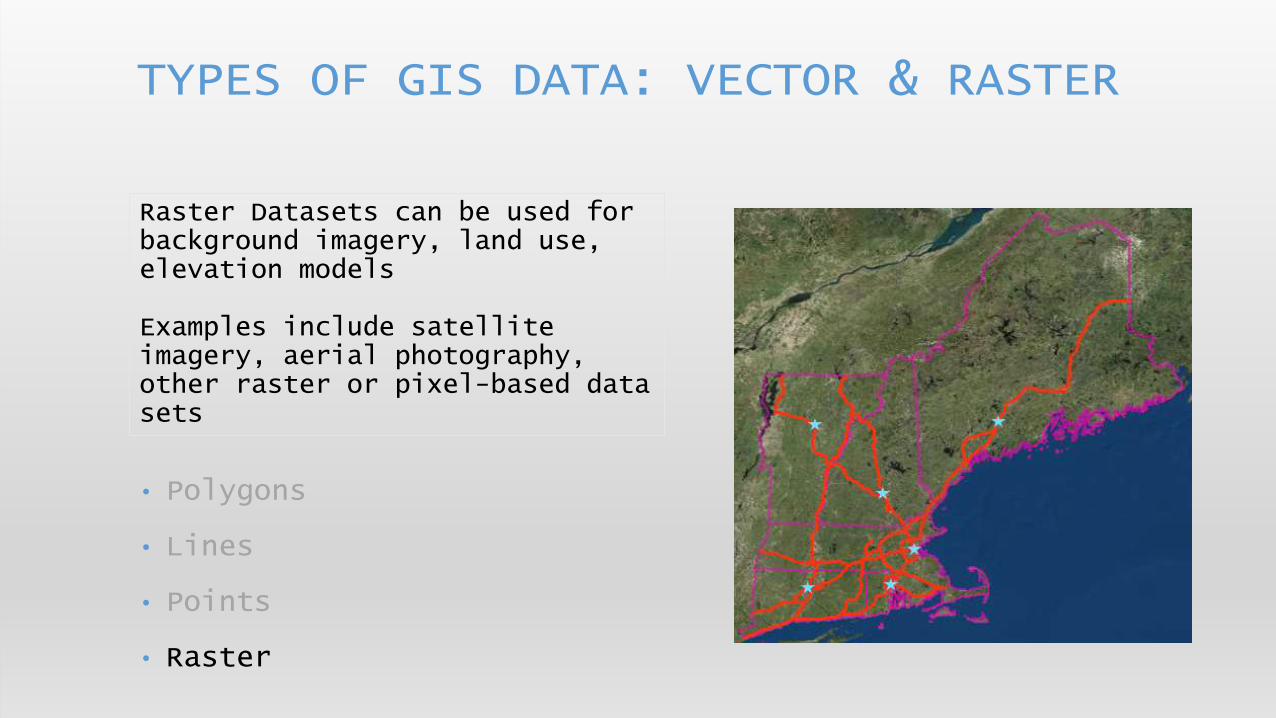
TYPES OF GIS DATA: VECTOR & RASTER
Raster Datasets can be used for background imagery, land use, elevation models
Examples include satellite imagery, aerial photography, other raster or pixel-based data sets
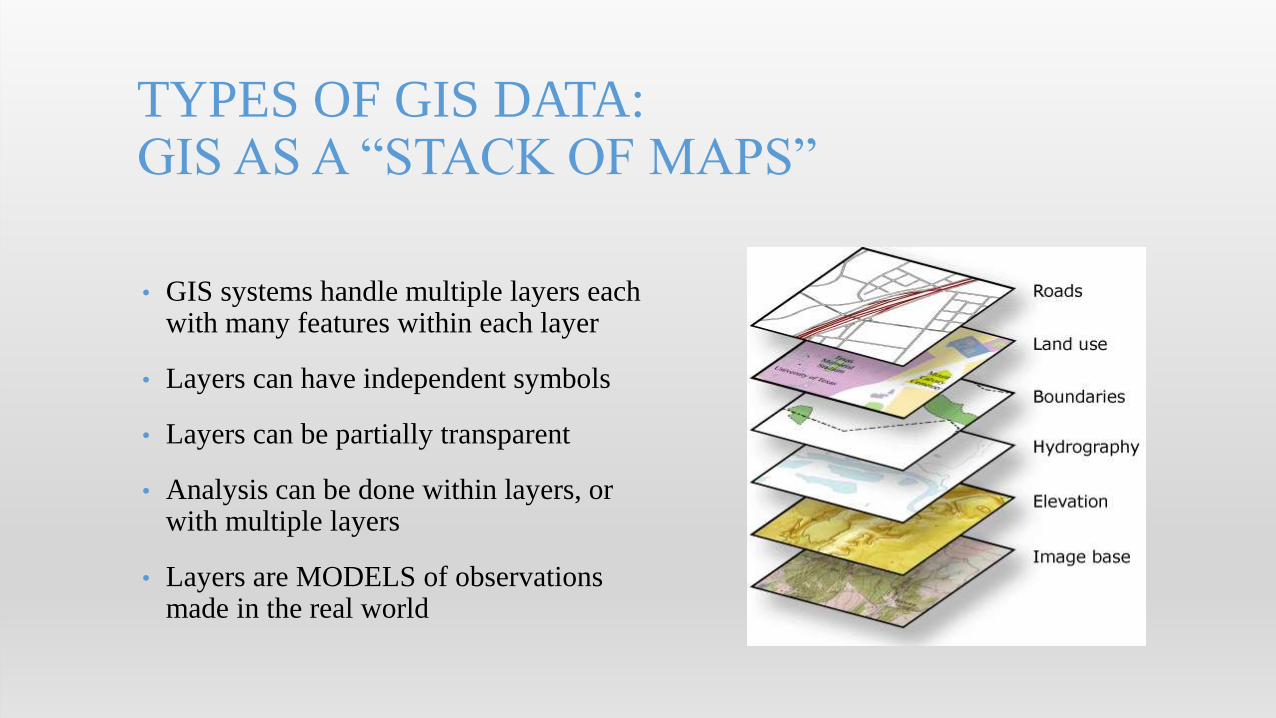
• GIS systems handle multiple layers each with many features within each layer
• Layers can have independent symbols
• Layers can be partially transparent
• Analysis can be done within layers, or with multiple layers
• Layers are MODELS of observations made in the real world
TYPES OF GIS DATA:GIS AS A “STACK OF MAPS”

• Imagery, elevation models, scanned maps, surfaces
• A regular grid of cells in rows and columns
• Each cell has a value
TYPES OF DATA: RASTER
Imagery Scanned Maps
Raster Models
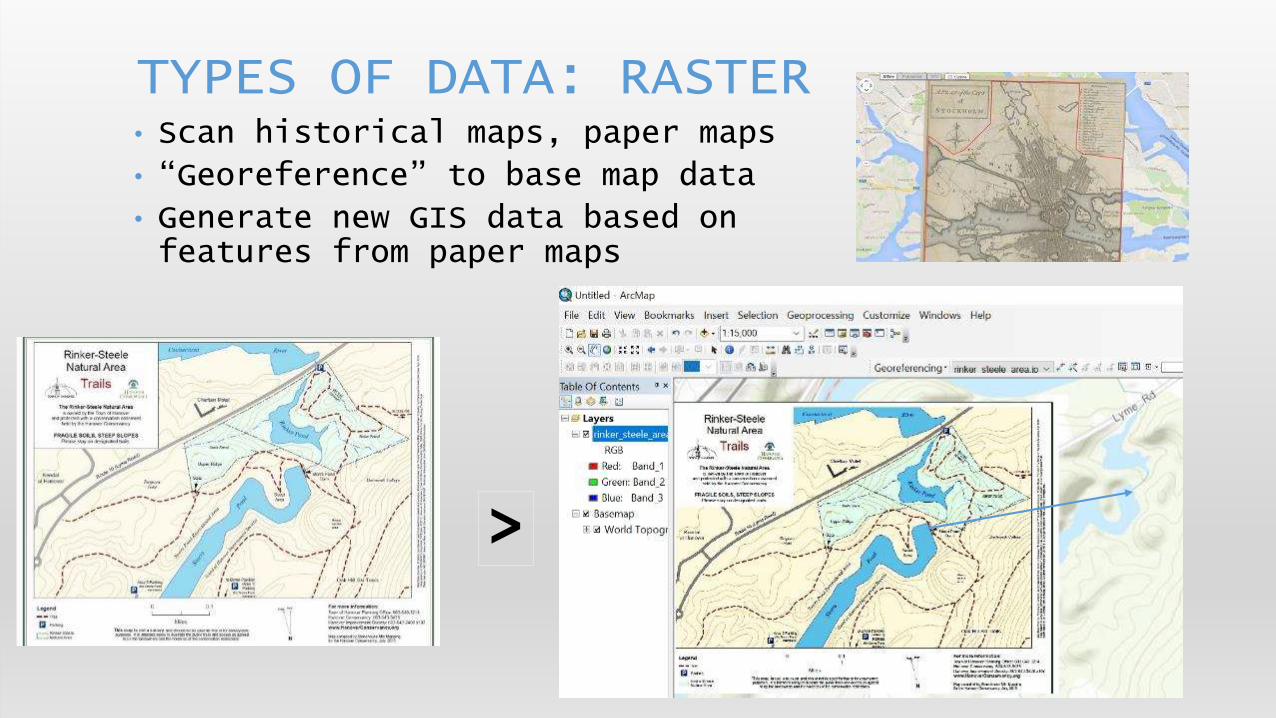
• Scan historical maps, paper maps
• “Georeference” to base map data
• Generate new GIS data based on features from paper maps
TYPES OF DATA: RASTER
Scanned Maps
>
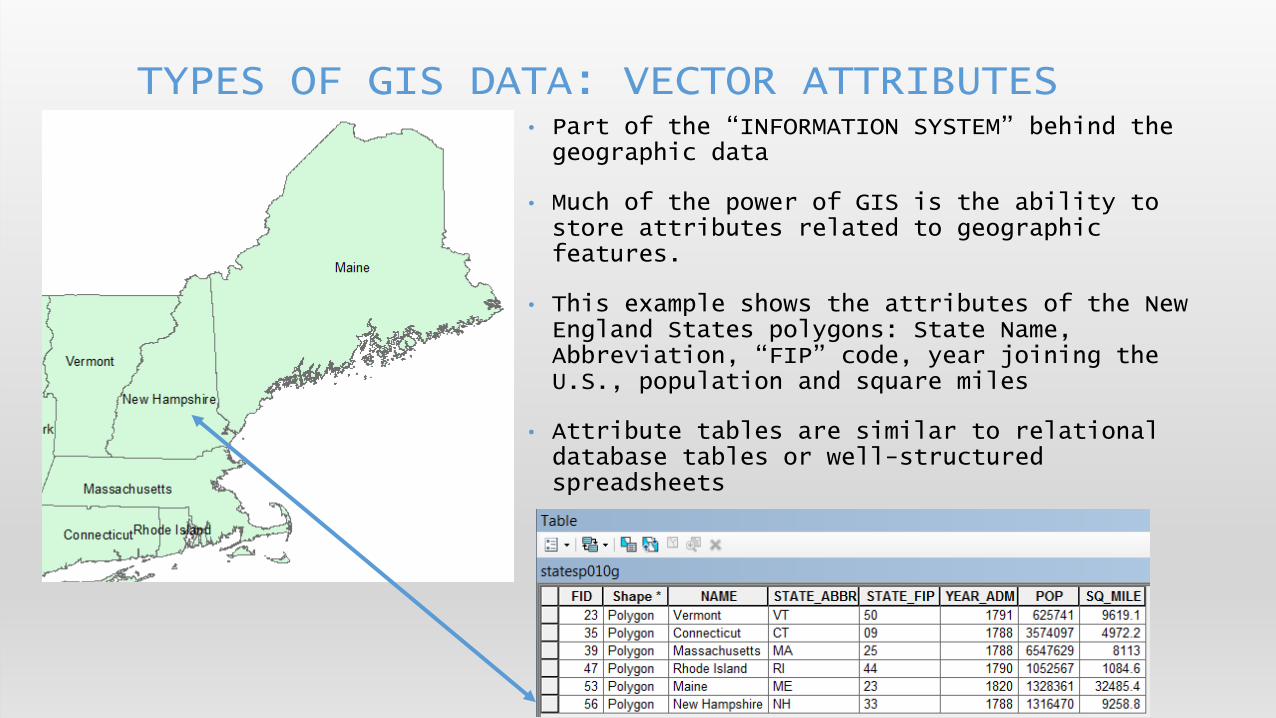
• Part of the “INFORMATION SYSTEM” behind the geographic data
• Much of the power of GIS is the ability to store attributes related to geographic features.
• This example shows the attributes of the New England States polygons: State Name, Abbreviation, “FIP” code, year joining the U.S., population and square miles
• Attribute tables are similar to relational database tables or well-structured spreadsheets
TYPES OF GIS DATA: VECTOR ATTRIBUTES

• Raster structure and attribution
TYPES OF DATA: RASTER DATASET STRUCTURE
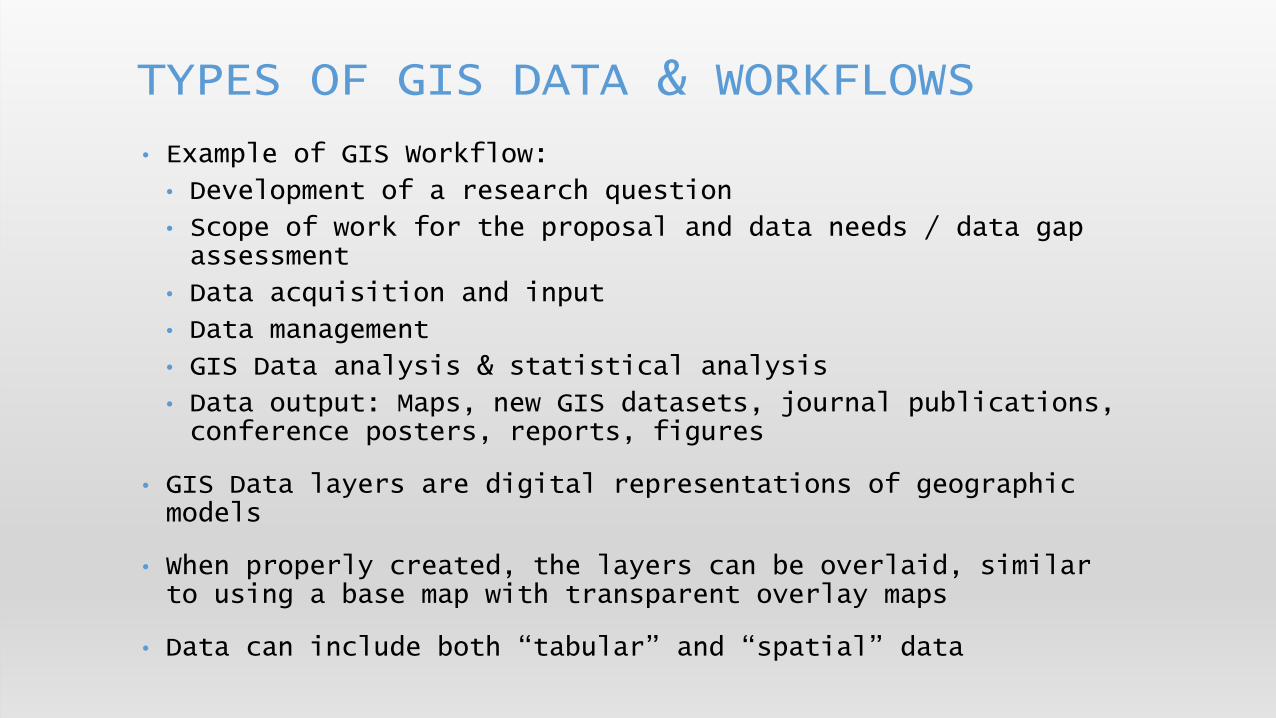
• Example of GIS Workflow:
• Development of a research question
• Scope of work for the proposal and data needs / data gap assessment
• Data acquisition and input
• Data management
• GIS Data analysis & statistical analysis
• Data output: Maps, new GIS datasets, journal publications, conference posters, reports, figures
• GIS Data layers are digital representations of geographic models
• When properly created, the layers can be overlaid, similar to using a base map with transparent overlay maps
• Data can include both “tabular” and “spatial” data
TYPES OF GIS DATA & WORKFLOWS
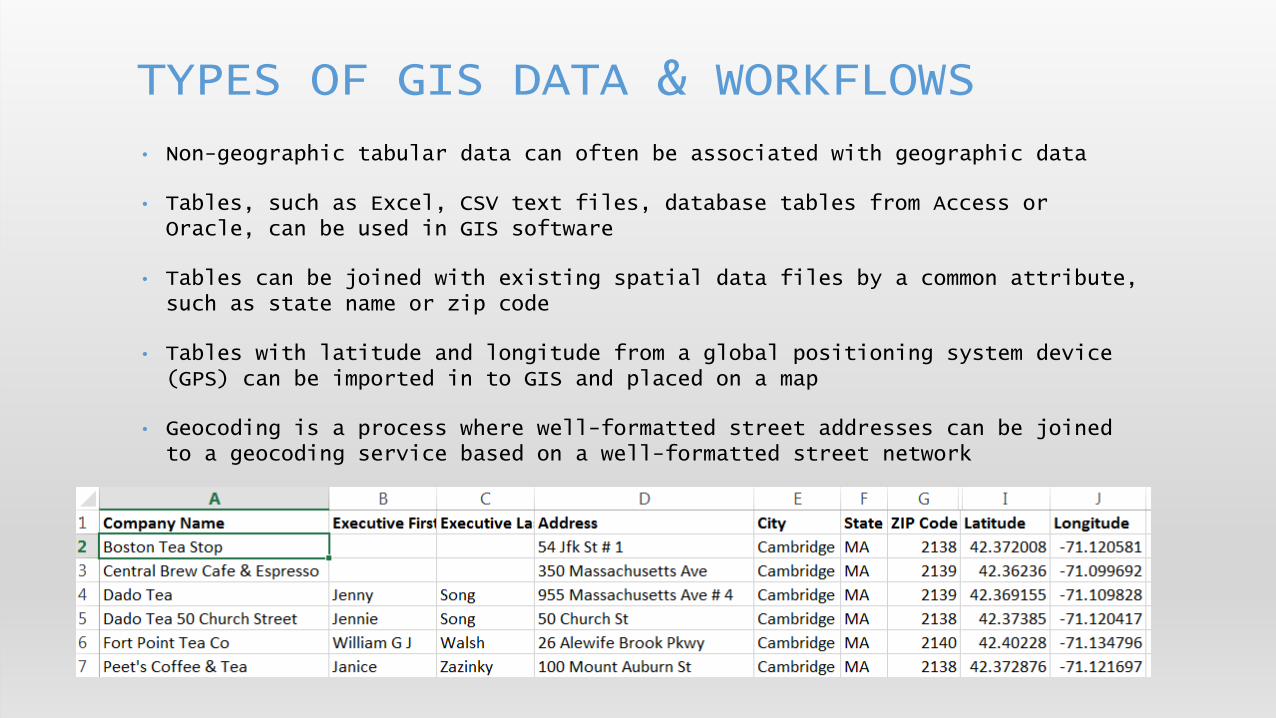
• Non-geographic tabular data can often be associated with geographic data
• Tables, such as Excel, CSV text files, database tables from Access or Oracle, can be used in GIS software
• Tables can be joined with existing spatial data files by a common attribute, such as state name or zip code
• Tables with latitude and longitude from a global positioning system device (GPS) can be imported in to GIS and placed on a map
• Geocoding is a process where well-formatted street addresses can be joined to a geocoding service based on a well-formatted street network
TYPES OF GIS DATA & WORKFLOWS

• Geographic Information Systems rely on reference system for data input, display and analysis
• Locations on the earth’s surface can be represented by a geographic coordinate system that includes an approximation of the earth’s surface, and a coordinate pair (latitude and longitude)
• A “datum” is a mathematical model of the earth’s surface
• A “map projection” allows us to project all or part of the earth’s (spherical) surface on to a flat surface such as a computer screen or a piece of paper
• A “coordinate system” is used to identify locations based on the datum and map projection
REFERENCING DATA TO THE EARTH: DATUMS, MAP PROJECTIONS, COORDINATE SYSTEMS

• To project a 3-dimension spheroid in to two dimensions (paper, computer screen, etc), at least some of the following will be distorted by the map projection:
• Area
• Direction
• Shape
• Distance
REFERENCING DATA TO THE EARTHDATUMS, MAP PROJECTIONS & COORDINATE SYSTEMS
Source: http://egsc.usgs.gov/isb//pubs/MapProjections/projections.html
Coordinate systems can use other units, such as feet and meters
Read more and see more at http://egsc.usgs.gov/isb//pubs/MapProjections/projections.html

REFERENCING DATA TO THE EARTH DATUMS, MAP PROJECTIONS & COORDINATE SYSTEMS

REFERENCING DATA TO THE EARTH MAP PROJECTIONS
ROBINSON
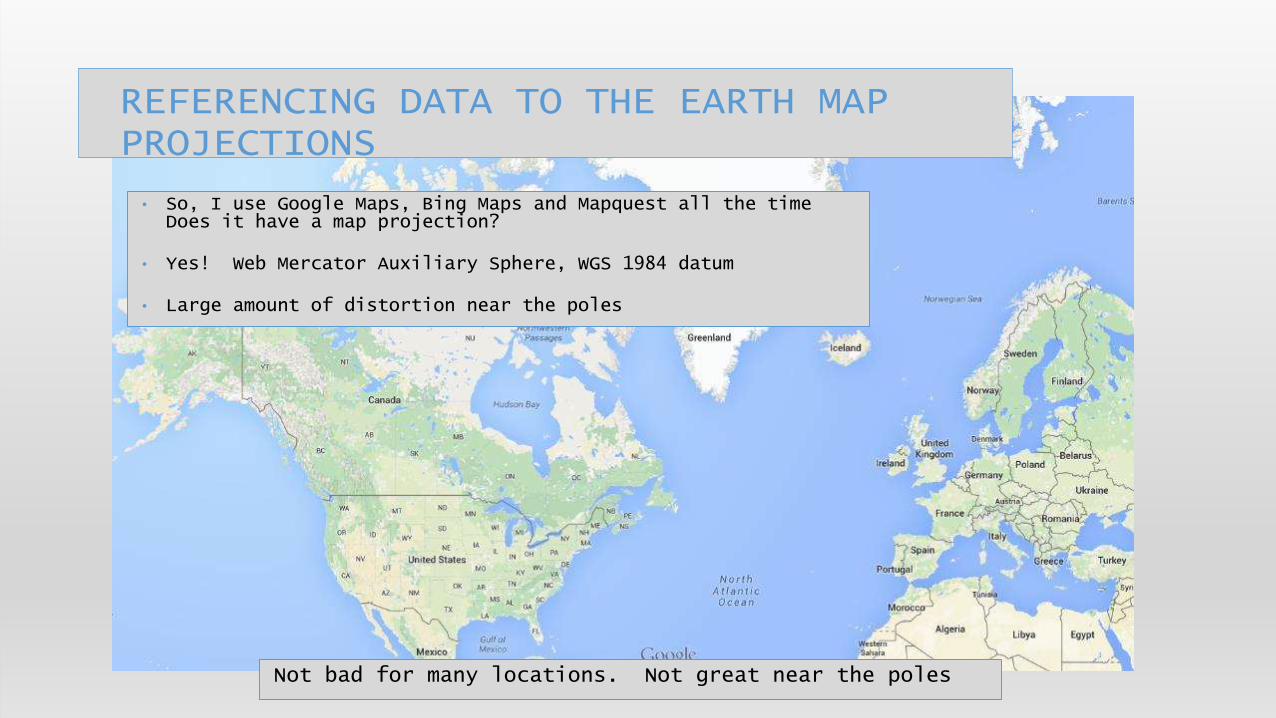
• So, I use Google Maps, Bing Maps and Mapquest all the time Does it have a map projection?
• Yes! Web Mercator Auxiliary Sphere, WGS 1984 datum
• Large amount of distortion near the poles
REFERENCING DATA TO THE EARTH MAP PROJECTIONS
Not bad for many locations. Not great near the poles
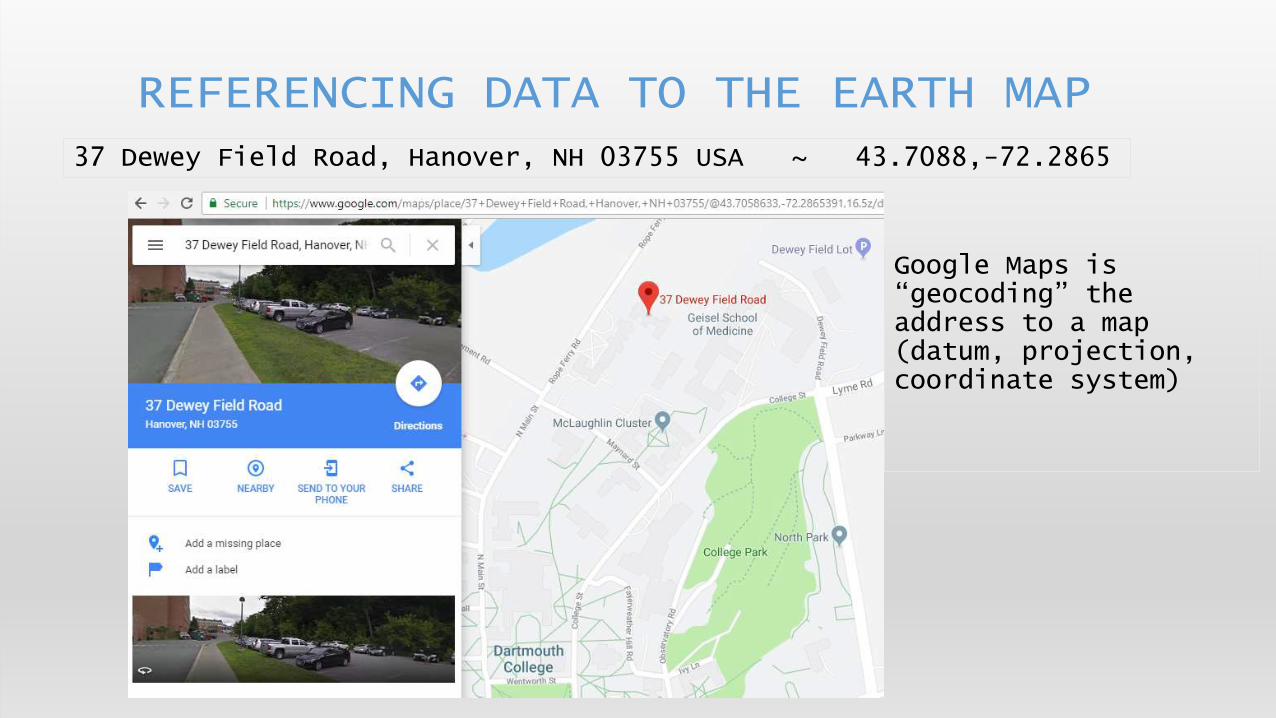
REFERENCING DATA TO THE EARTH MAP37 Dewey Field Road, Hanover, NH 03755 USA ~ 43.7088,-72.2865
Google Maps is “geocoding” the address to a map (datum, projection, coordinate system)
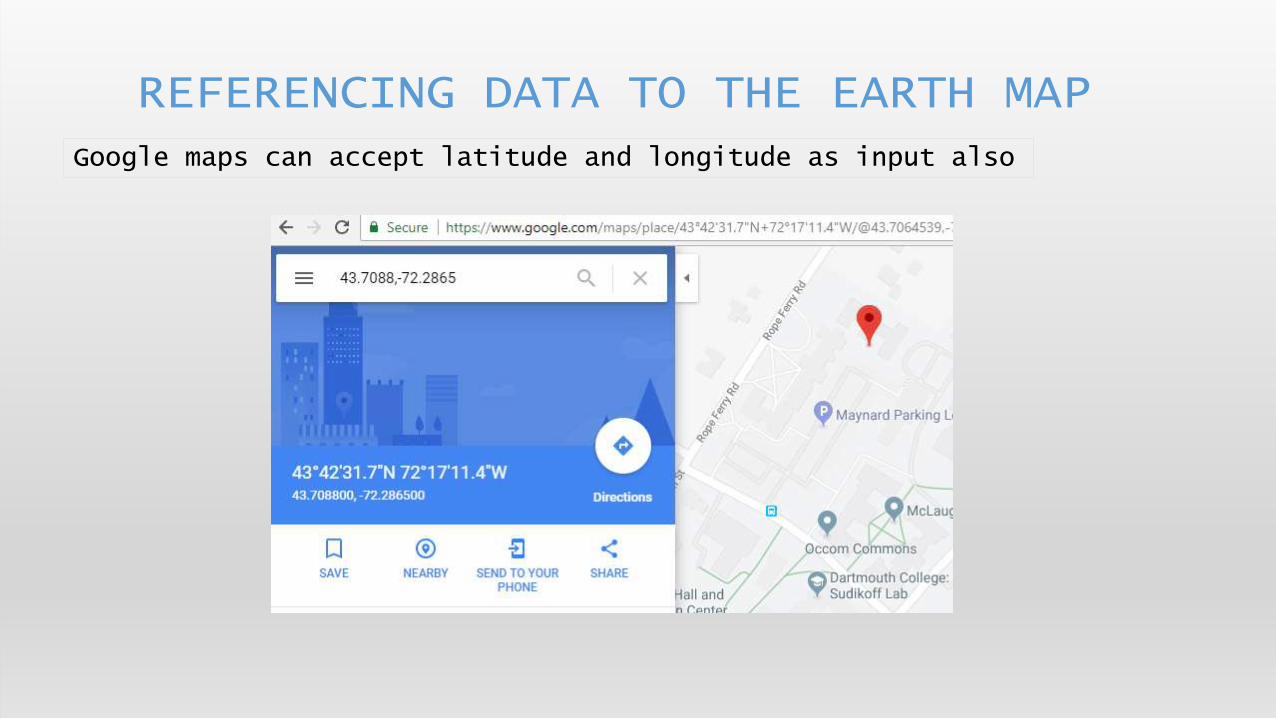
REFERENCING DATA TO THE EARTH MAPGoogle maps can accept latitude and longitude as input also
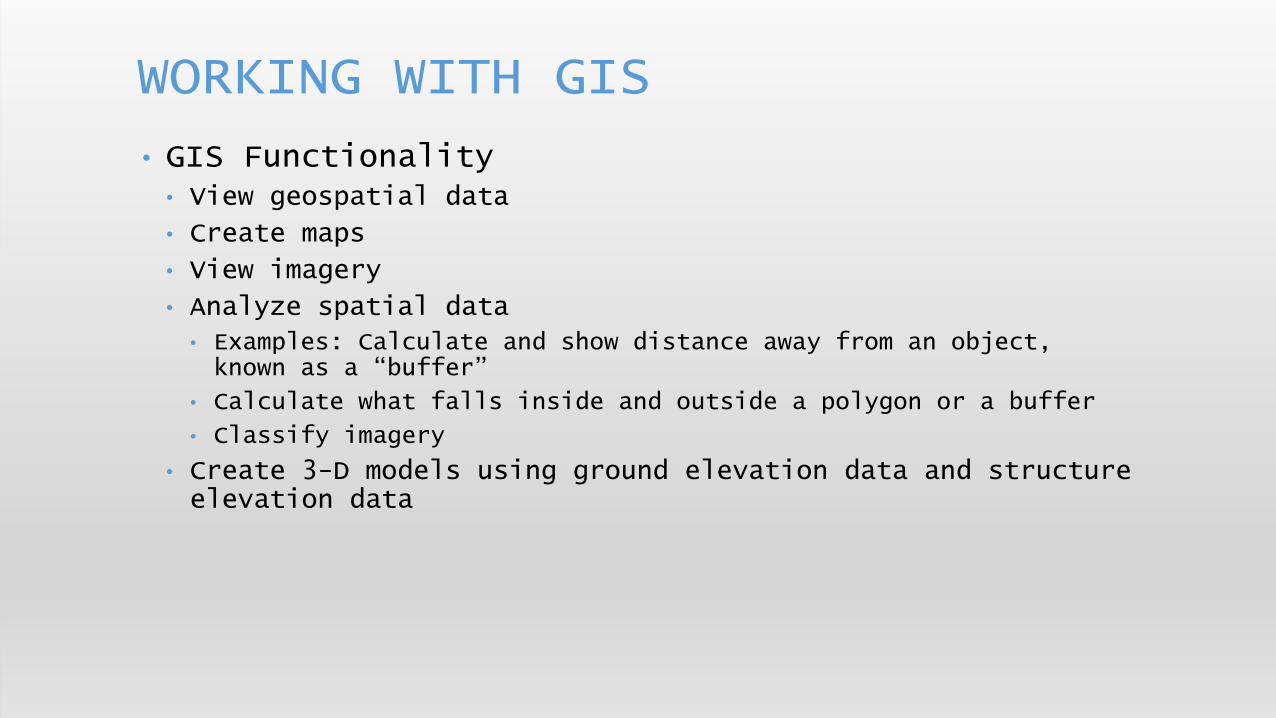
• GIS Functionality • View geospatial data
• Create maps
• View imagery
• Analyze spatial data
• Examples: Calculate and show distance away from an object, known as a “buffer”
• Calculate what falls inside and outside a polygon or a buffer
• Classify imagery
• Create 3-D models using ground elevation data and structure elevation data
WORKING WITH GIS
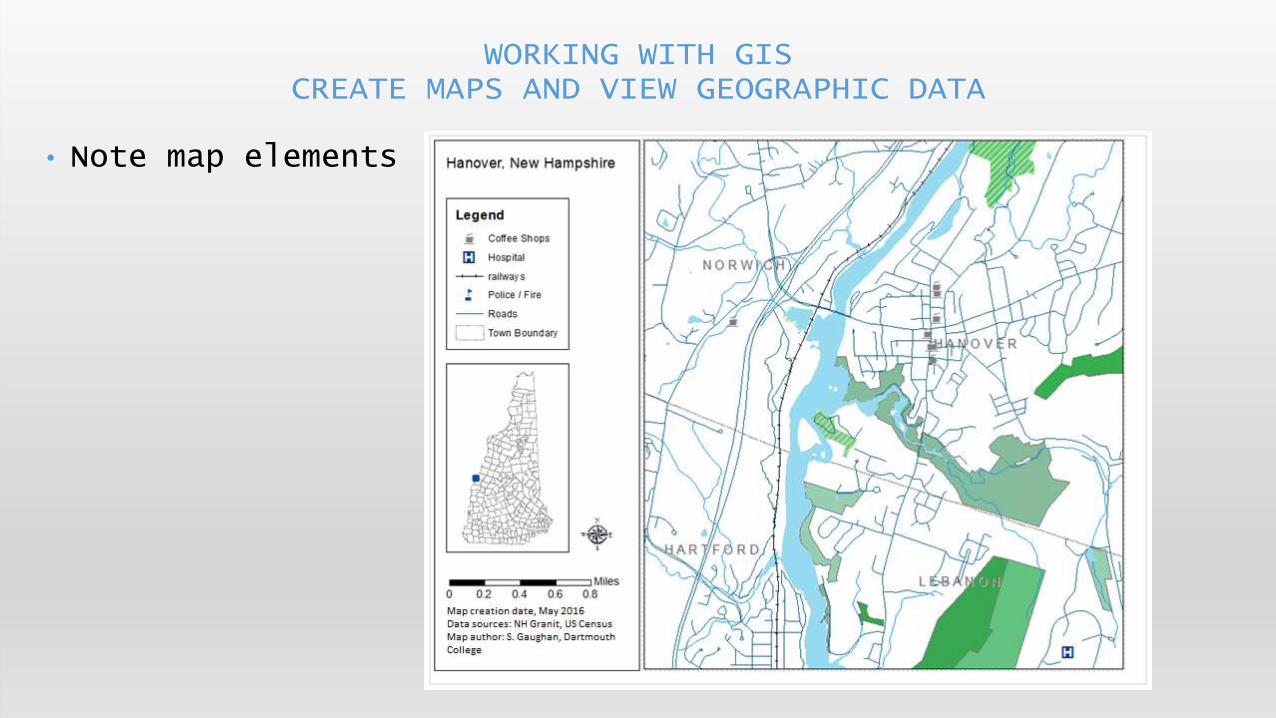
• Note map elements
WORKING WITH GISCREATE MAPS AND VIEW GEOGRAPHIC DATA

• MAP OF US POPULATION DENSITY IN 2000 BY COUNTY
WORKING WITH GISCREATE MAPS

• Imagery sources and vendors include:
• USGS Digital Orthoquads (DOQs)
• NOAA imagery
• USDA National Agricultural Imagery Program (NAIP)
• US Navy, NGA
• Geoeye, Google, LandSat, i-cubed
• State Agencies
WORKING WITH GISVIEW IMAGERY
• Web GIS systems• Google Maps (mymaps)
• ArcGIS Online
• Carto
• Desktop GIS• ArcGIS Desktop
• QGIS
• MapWindow
• Grass GIS
• Analytical GIS tools• ArcGIS Desktop with ArcToolbox, Modelbuilder, Python scripting
• R with geospatial analysis libraries
• Python with geospatial data abstraction libraries (GDAL)
WORKING WITH GISWEB, DESKTOP, DESKTOP ANALYSIS
• GIS synonyms = location intelligence, smart maps, geospatial intelligence
• What question(s) are you trying to answer? What problem(s) are we trying to solve?
• How many of the nesting sites are in the boreal forest?
• How can I get from A to B along the road network?
• How many of the hospitals are in flood zones?
• Are there “hot spots” of contaminants in certain areas?
WORKING WITH GIS

• Google Maps – quick & easy
• Google Fusion Tables
• AGOL – web-based, some analysis possible
• ESRI Maps for office
• ArcGIS Desktop
• ArcGIS Pro
• ArcGIS Enterprise / Server
WORKING WITH GIS
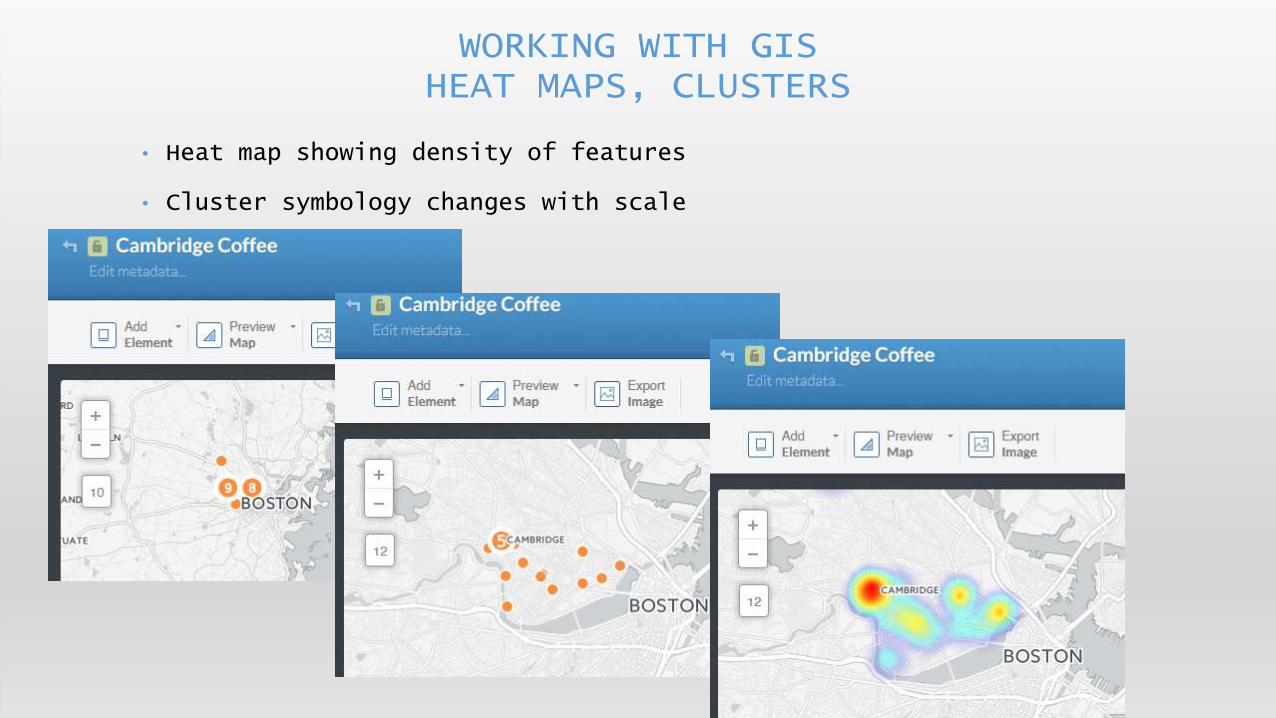
• Heat map showing density of features
• Cluster symbology changes with scale
WORKING WITH GIS HEAT MAPS, CLUSTERS
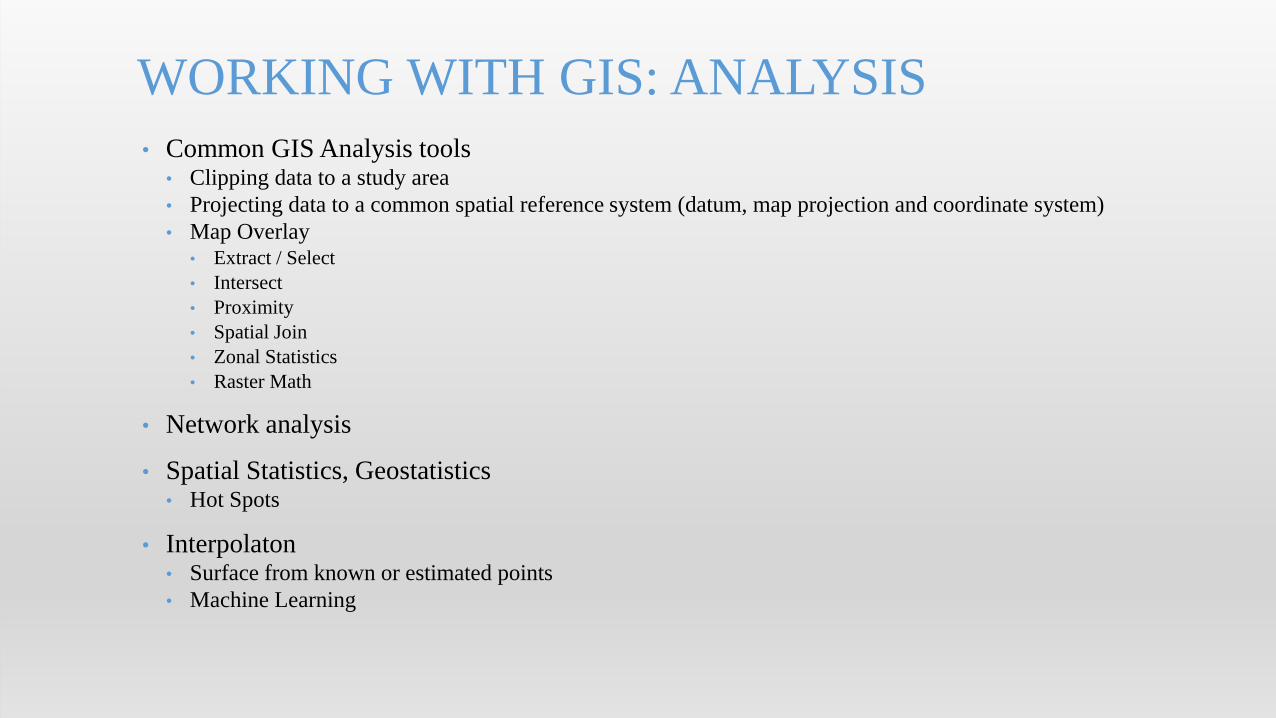
• Common GIS Analysis tools• Clipping data to a study area
• Projecting data to a common spatial reference system (datum, map projection and coordinate system)
• Map Overlay• Extract / Select
• Intersect
• Proximity
• Spatial Join
• Zonal Statistics
• Raster Math
• Network analysis
• Spatial Statistics, Geostatistics• Hot Spots
• Interpolaton• Surface from known or estimated points
• Machine Learning
WORKING WITH GIS: ANALYSIS
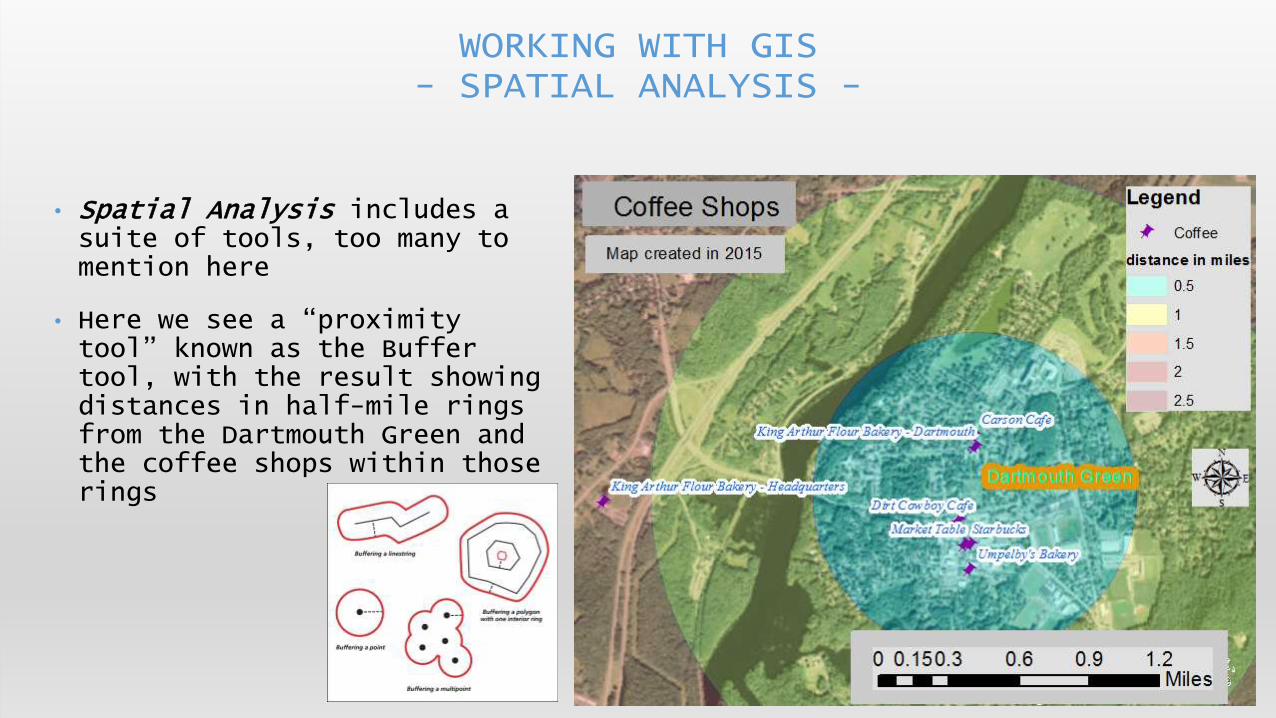
• Spatial Analysis includes a suite of tools, too many to mention here
• Here we see a “proximity tool” known as the Buffer tool, with the result showing distances in half-mile rings from the Dartmouth Green and the coffee shops within those rings
WORKING WITH GIS- SPATIAL ANALYSIS -

• The “Clip” tool can be used to extract a dataset to a study area, reduce overall dataset size (86,000 records statewide down to less than 500 for Hanover)
• Clipping larger datasets allows us to reduce the storage size, focus on certain areas, and perform calculations such as the “area of surface water within Hanover town boundary”
WORKING WITH GIS- SPATIAL ANALYSIS TOOLS -

• Perform Data Queries and Answer Research Questions: analyze spatial distributions, patterns, relationships
• What percent occurrence of nesting sites within 500 feet of deciduous forests?
• What percent of the population lives within twenty miles of a farmers’ market?
• What would be a good site for a new neighborhood park?
• What is the average number of health centers per square mile in the state?
WORKING WITH GIS- SPATIAL ANALYSIS & SPATIAL STATISTICS -
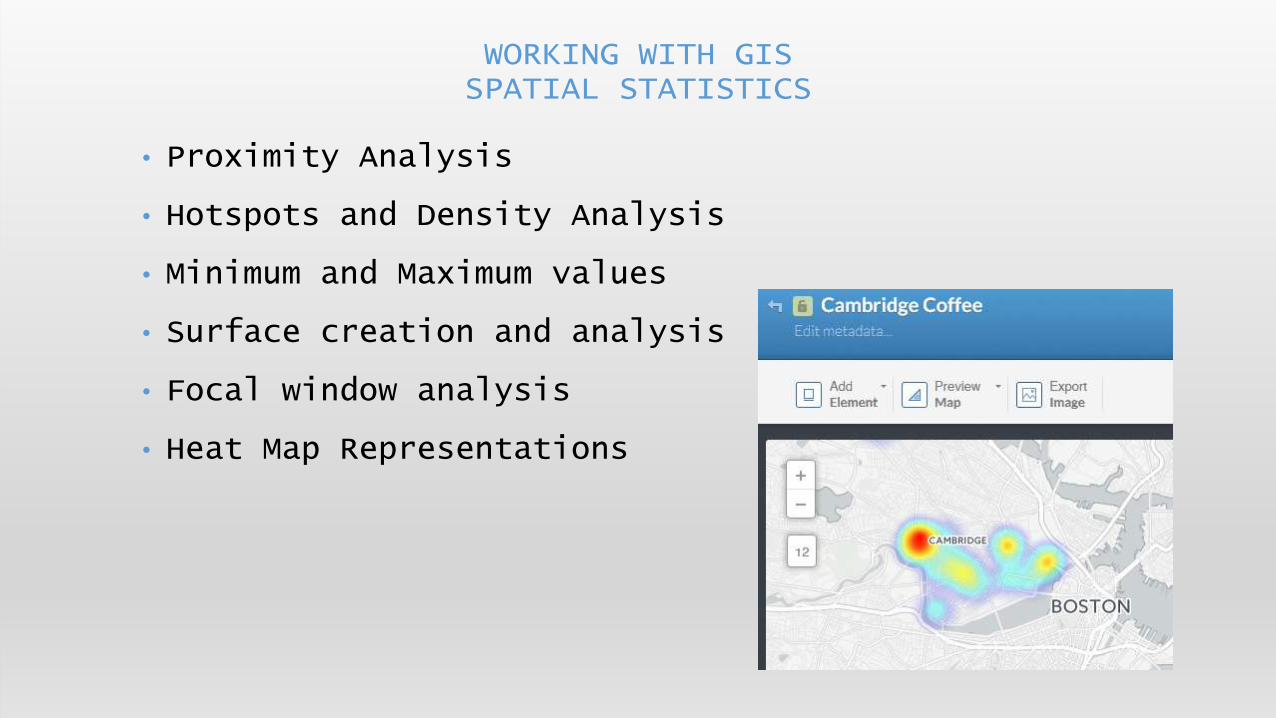
• Proximity Analysis
• Hotspots and Density Analysis
• Minimum and Maximum values
• Surface creation and analysis
• Focal window analysis
• Heat Map Representations
WORKING WITH GISSPATIAL STATISTICS

• Elevation models can be used to: • Determine how water will drain from the surface
• Create contour lines for elevation
• Determine watershed boundaries
• Calculate area and volume
• Calculate Slope
• “Hillshade” model creation for viewing terrain
DIGITAL ELEVATION MODELS

• DEM’s can also be used for cut/fill analysis, volume calculations, generation of hillshade models, slope models and aspect models
ANALYZE RASTER DATA: SURFACES AND DIGITAL ELEVATION MODELS
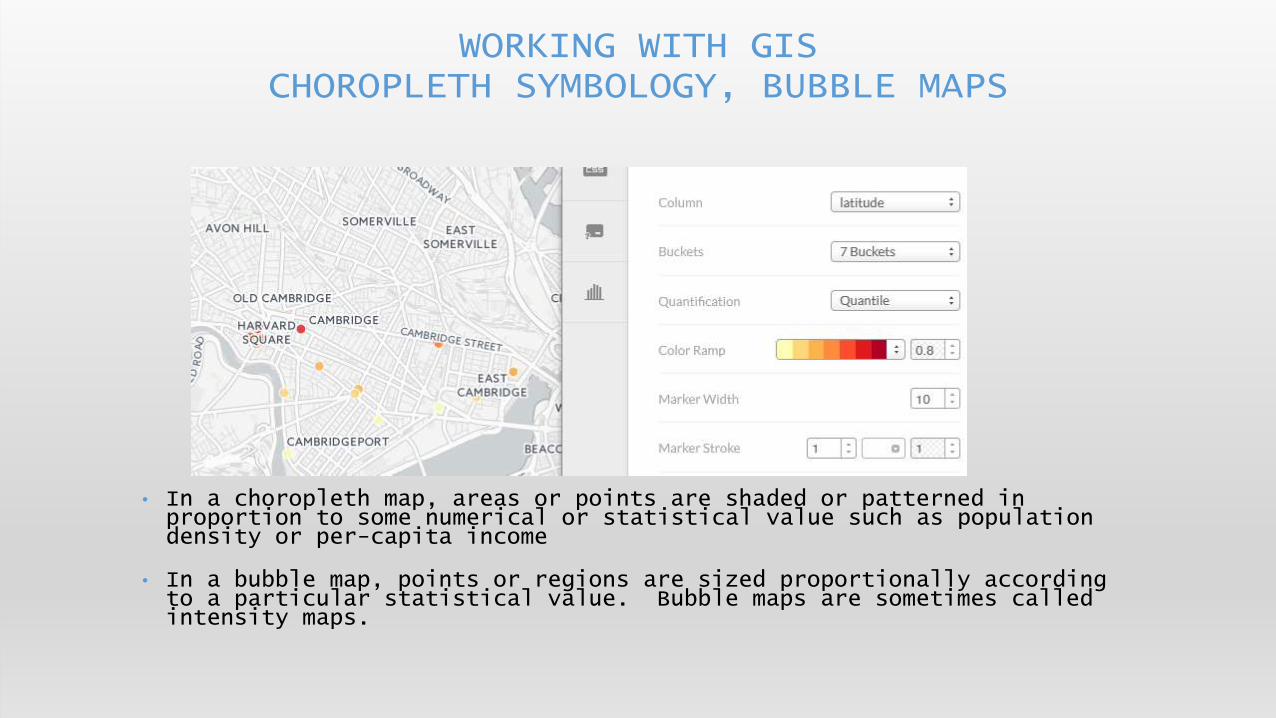
• In a choropleth map, areas or points are shaded or patterned in proportion to some numerical or statistical value such as population density or per-capita income
• In a bubble map, points or regions are sized proportionally according to a particular statistical value. Bubble maps are sometimes called intensity maps.
WORKING WITH GISCHOROPLETH SYMBOLOGY, BUBBLE MAPS
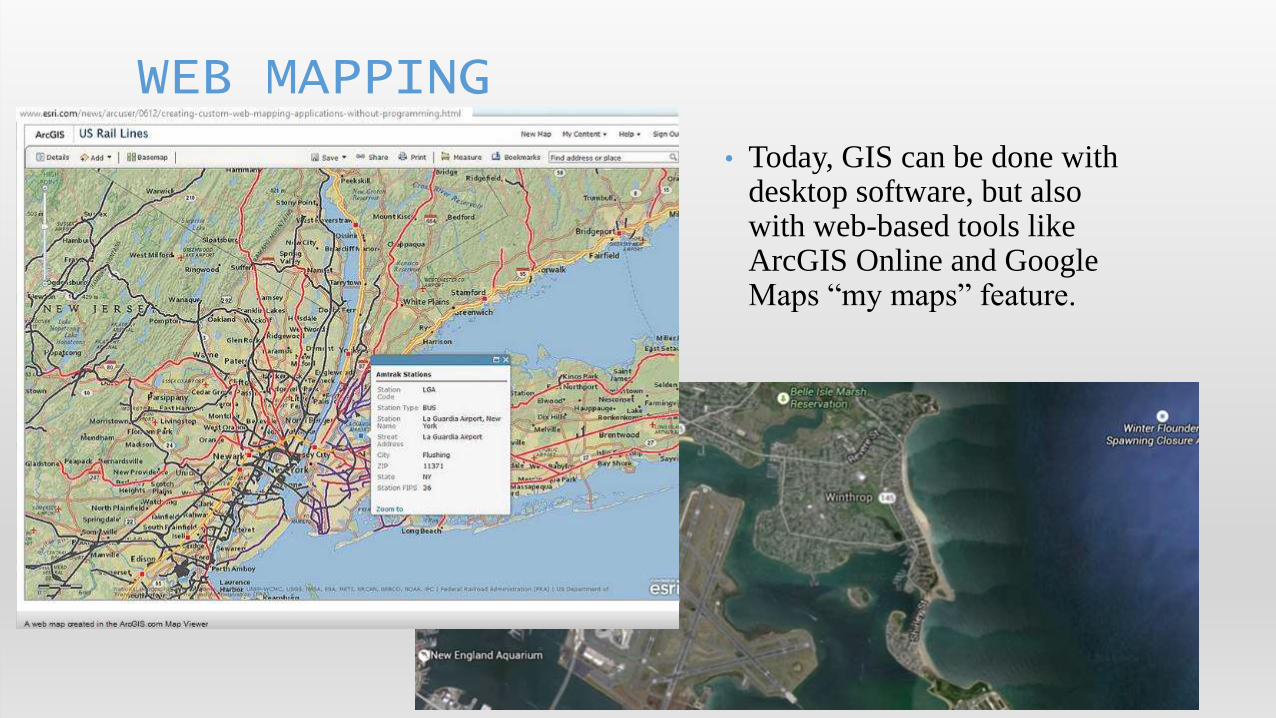
• Today, GIS can be done with desktop software, but also with web-based tools like ArcGIS Online and Google Maps “my maps” feature.
WEB MAPPING
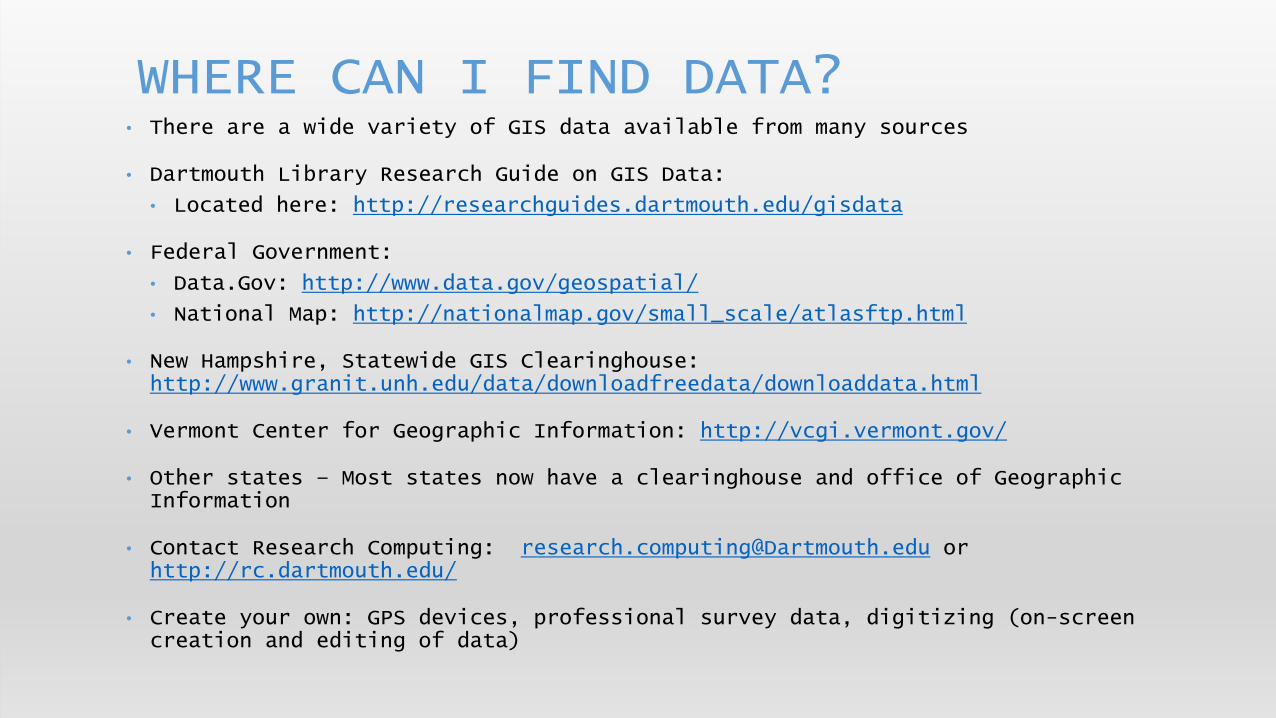
• There are a wide variety of GIS data available from many sources
• Dartmouth Library Research Guide on GIS Data:
• Located here: http://researchguides.dartmouth.edu/gisdata
• Federal Government:
• Data.Gov: http://www.data.gov/geospatial/
• National Map: http://nationalmap.gov/small_scale/atlasftp.html
• New Hampshire, Statewide GIS Clearinghouse: http://www.granit.unh.edu/data/downloadfreedata/downloaddata.html
• Vermont Center for Geographic Information: http://vcgi.vermont.gov/
• Other states – Most states now have a clearinghouse and office of Geographic Information
• Contact Research Computing: [email protected] or http://rc.dartmouth.edu/
• Create your own: GPS devices, professional survey data, digitizing (on-screen creation and editing of data)
WHERE CAN I FIND DATA?
• Data, depending on its source and the methods used to collect and process, can vary widely.• GIS datasets are collected at varying scales and accuracies.
• “Metadata” is the term used for the file that should accompany the dataset. This file helps to explain what is in the dataset, who produced the dataset, and what its intended purpose was for producing the data
• Common Vector formats: geodatabase, shapefile, KML, KMZ, geojson, xyz, comma-separated (csv)
• Common Raster formats: JPG, TIFF, IMG, GRID
DATA SOURCES, FORMATS & METADATA
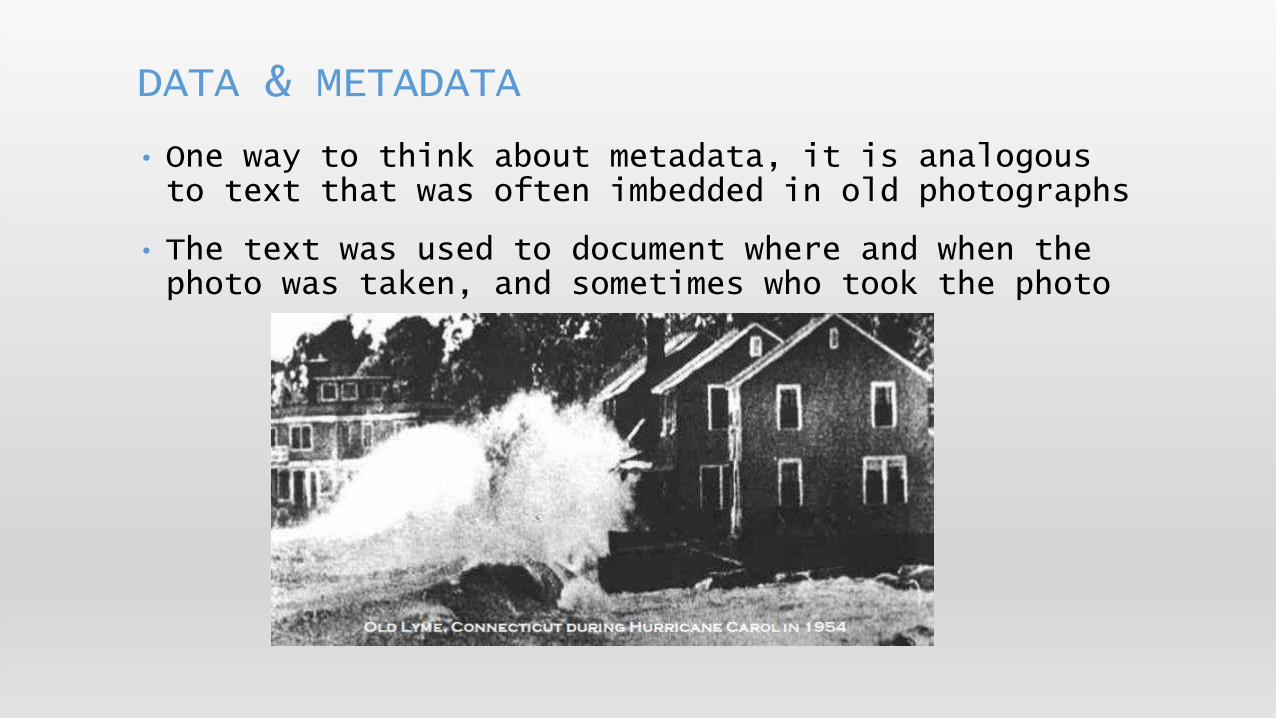
• One way to think about metadata, it is analogous to text that was often imbedded in old photographs
• The text was used to document where and when the photo was taken, and sometimes who took the photo
DATA & METADATA
• Information that describes a dataset, including but not limited to how the data was collected, who collected it, when it was collected
• “Data about data”
• ALWAYS ask for Metadata, and read it to understand the dataset
• Metadata is often included with a downloaded dataset, but not always. Look for metadata in html, xml, txt or doc format.
• At times you may need to contact the data producer or data steward for metadata.
METADATA
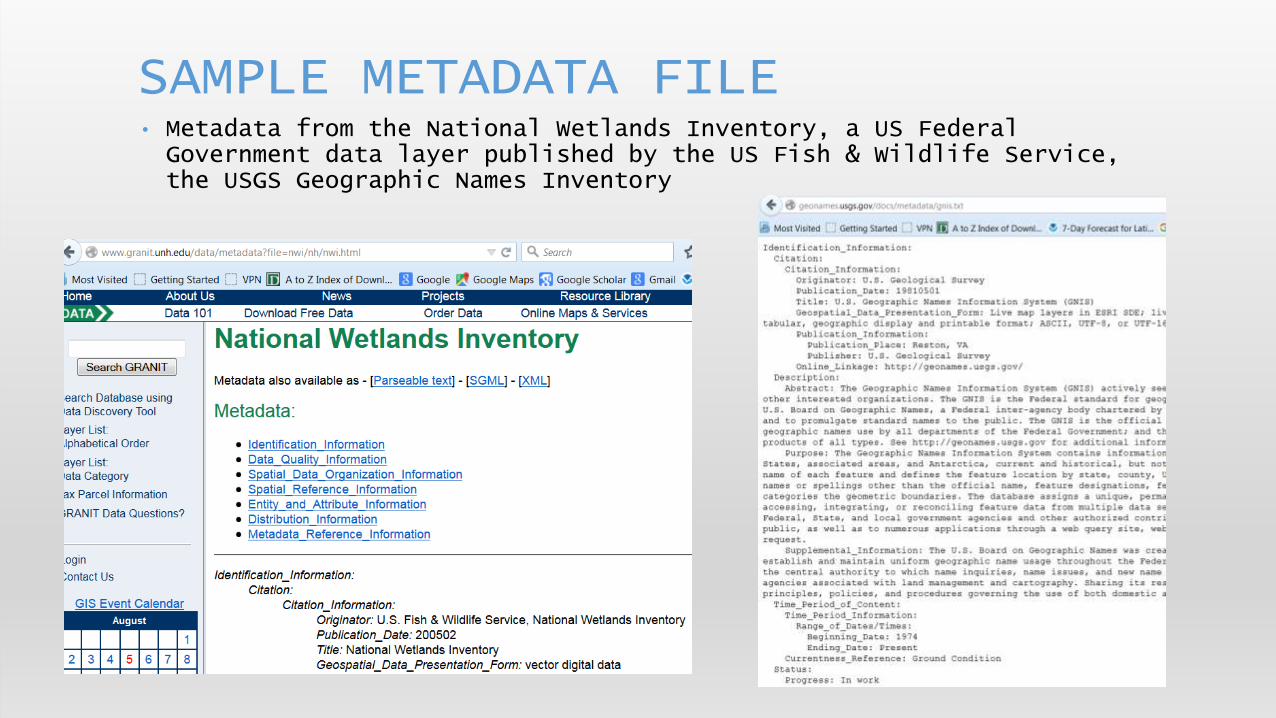
• Metadata from the National Wetlands Inventory, a US Federal Government data layer published by the US Fish & Wildlife Service, the USGS Geographic Names Inventory
SAMPLE METADATA FILE
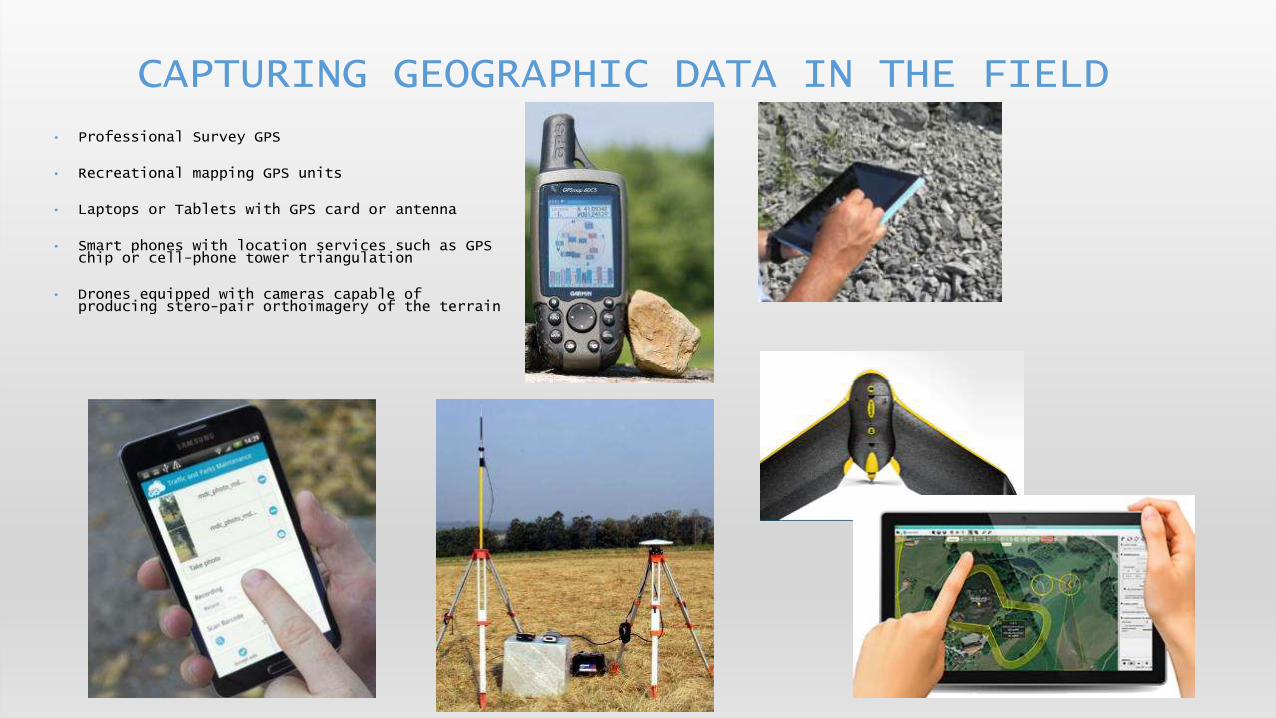
• Professional Survey GPS
• Recreational mapping GPS units
• Laptops or Tablets with GPS card or antenna
• Smart phones with location services such as GPS chip or cell-phone tower triangulation
• Drones equipped with cameras capable of producing stero-pair orthoimagery of the terrain
CAPTURING GEOGRAPHIC DATA IN THE FIELD
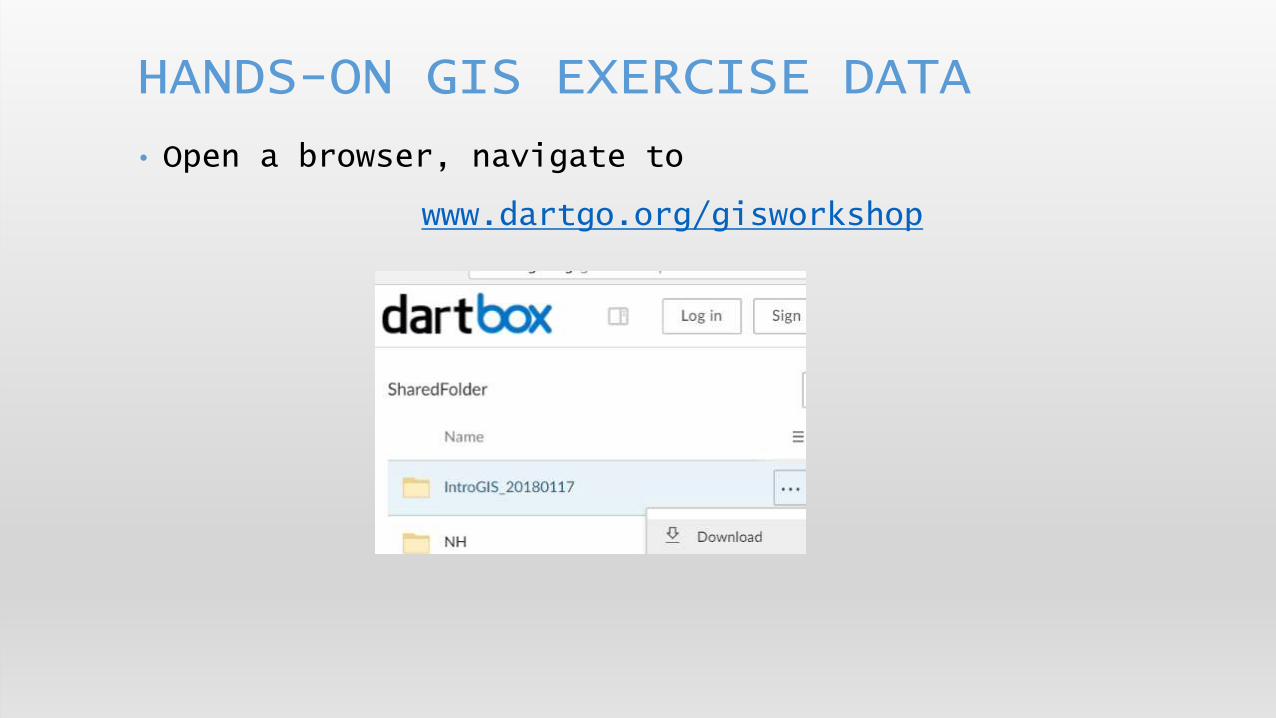
• Open a browser, navigate to
www.dartgo.org/gisworkshop
HANDS-ON GIS EXERCISE DATA

READY TO MAKE A MAP?
• Pan, Zoom, Search, Identify, layer transparency
• Add base map, add data
• Select, filter
• Open ArcMap, open a new, blank map

• Add data from local drive, or from the web
ADDING DATA

Make a map to add to a publication or poster, export to PDF, JPG or to send to a printer or plotter
• Map title
• North arrow or compass rose
• Scale bar
• Legend
• Sources of data (abbreviated metadata)
• Reference map
• Date of publication, author(s)
• Funding Info & disclaimers (for planning purposes only, not intended for legal boundary use…)
PUBLISHING MAPS – LAYOUT VIEW

• Using “ArcToolbox”
SPATIAL ANALSYIS
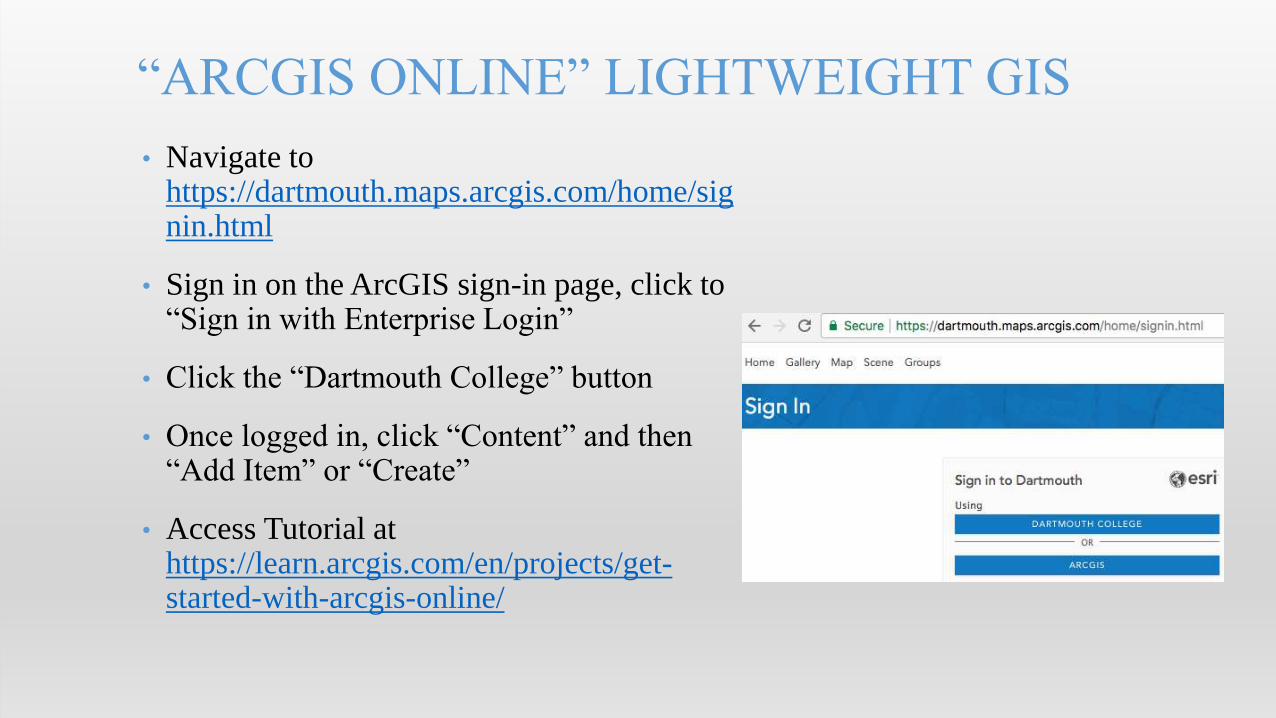
• Navigate to https://dartmouth.maps.arcgis.com/home/signin.html
• Sign in on the ArcGIS sign-in page, click to “Sign in with Enterprise Login”
• Click the “Dartmouth College” button
• Once logged in, click “Content” and then “Add Item” or “Create”
• Access Tutorial at https://learn.arcgis.com/en/projects/get-started-with-arcgis-online/
“ARCGIS ONLINE” LIGHTWEIGHT GIS

• Preview GIS data layers in ArcCatalog
• Read Metadata
• Manage data layers
• Use ArcToolbox tools
• Write metadata
ARCGIS DESKTOP -ARCCATALOG

QUESTIONS?

SUPPLEMENTAL INFORMATION
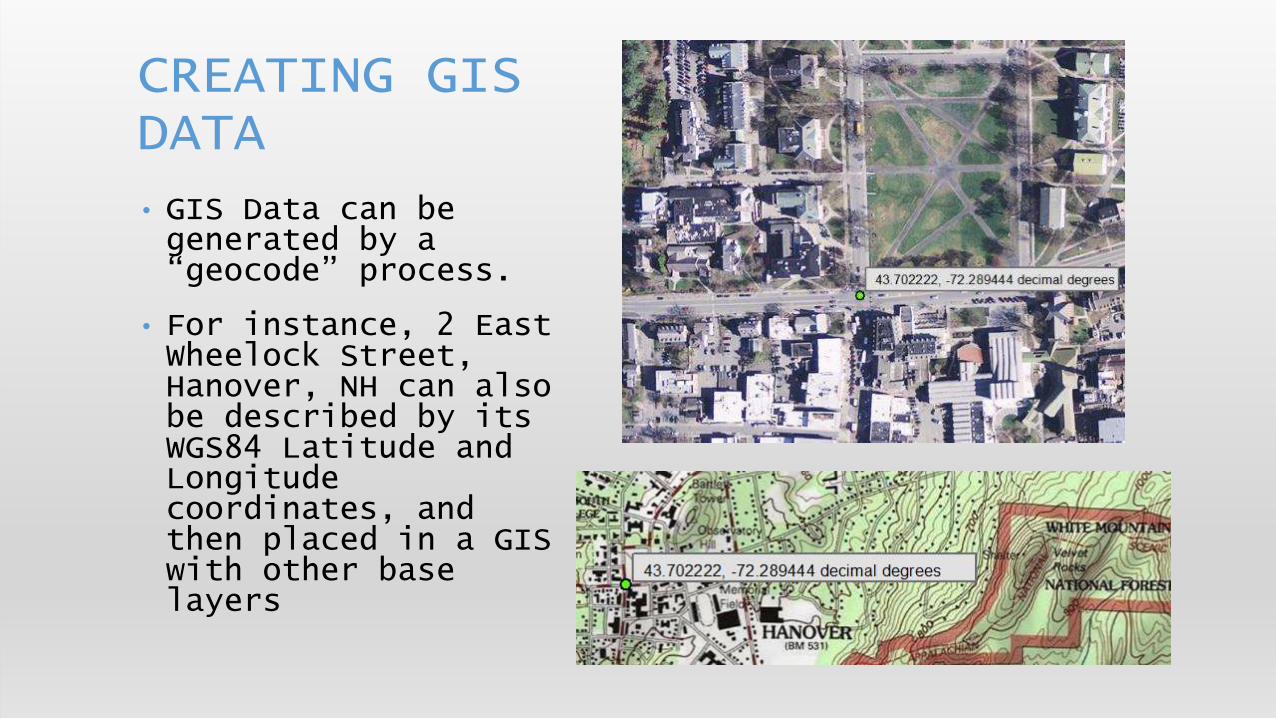
• GIS Data can be generated by a “geocode” process.
• For instance, 2 East Wheelock Street, Hanover, NH can also be described by its WGS84 Latitude and Longitude coordinates, and then placed in a GIS with other base layers
CREATING GIS DATA

• Have an old map or image? They can be scanned and brought in to approximate alignment with other GIS data layers through the process of “georeferencing”
SCAN AND GEOREFERENCE OLD MAPS, AERIAL PHOTOS
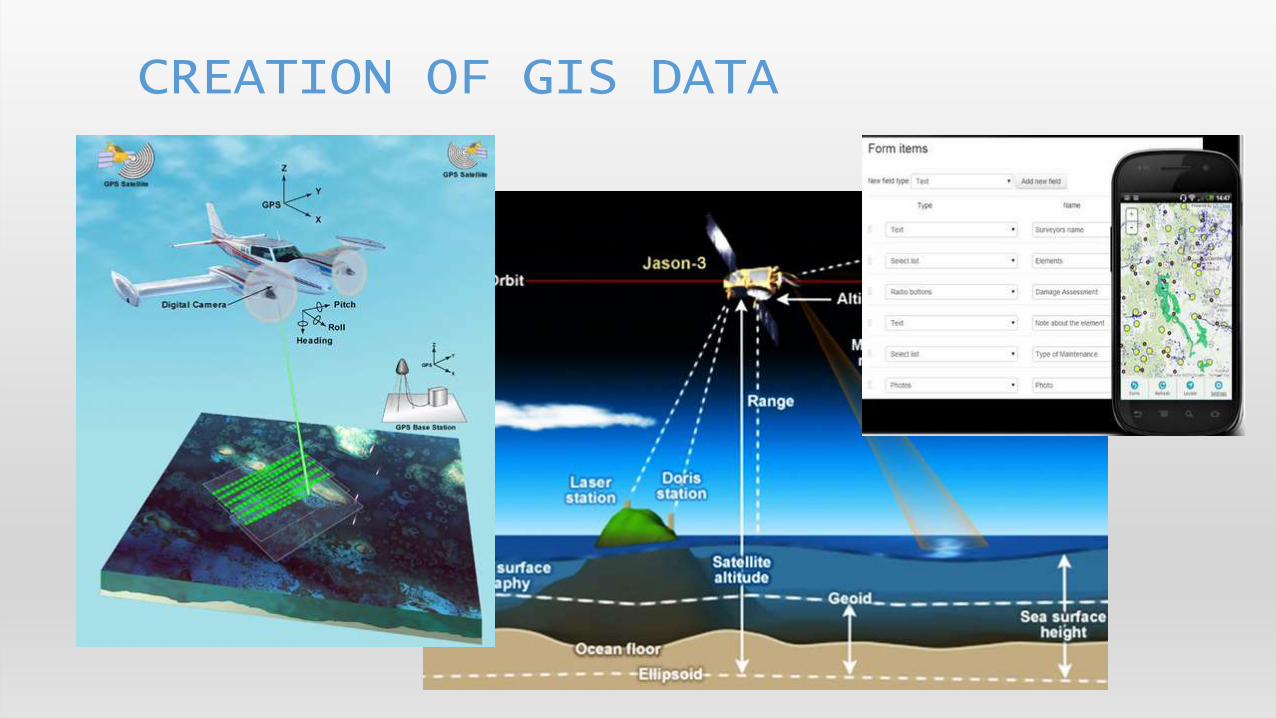
CREATION OF GIS DATA
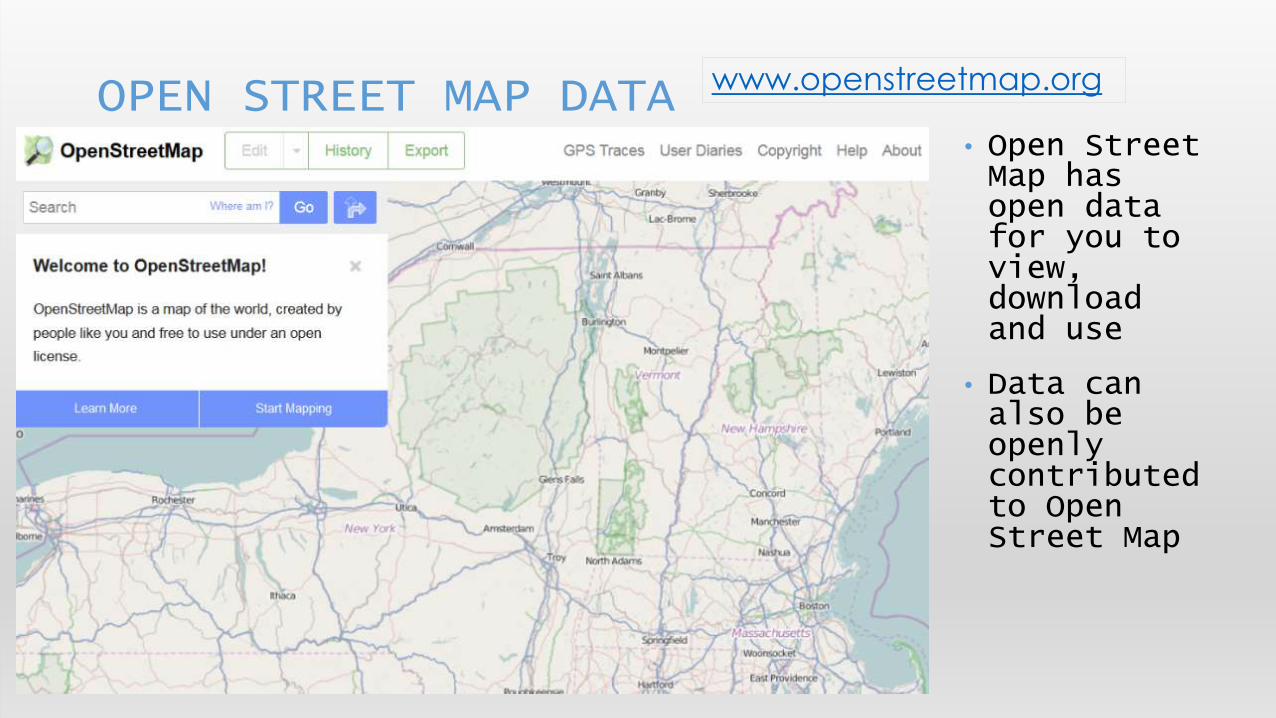
• Open Street Map has open data for you to view, download and use
• Data can also be openly contributed to Open Street Map
OPEN STREET MAP DATA www.openstreetmap.org
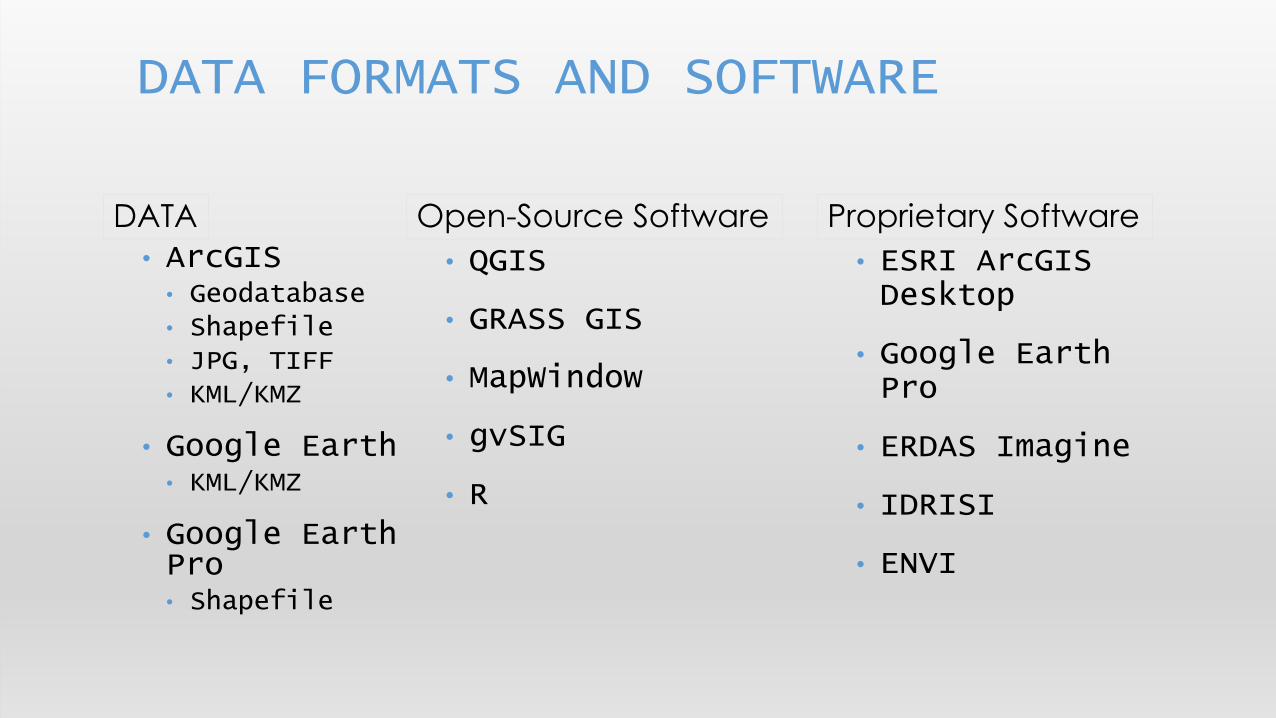
• ArcGIS• Geodatabase
• Shapefile
• JPG, TIFF
• KML/KMZ
• Google Earth• KML/KMZ
• Google Earth Pro• Shapefile
DATA FORMATS AND SOFTWARE
DATA
• QGIS
• GRASS GIS
• MapWindow
• gvSIG
• R
Open-Source Software
• ESRI ArcGIS Desktop
• Google Earth Pro
• ERDAS Imagine
• IDRISI
• ENVI
Proprietary Software
• GIS datasets can be very large in size
• A single dataset can at times be comprised of many files on your computer’s file system
• Structure your project data in a way that makes sense to you. Use file names that make sense, and fill out metadata descriptions for files you generate and plan to keep. Keep detailed notes about data sources and data storage
• Take notes on your processing steps
• Back up data that can’t be recreated easily, storing a copy on a server or external drive, keeping careful track of the “authoritative” copy of the data.
DATA MANAGEMENT TIPS AND TECHNIQUES
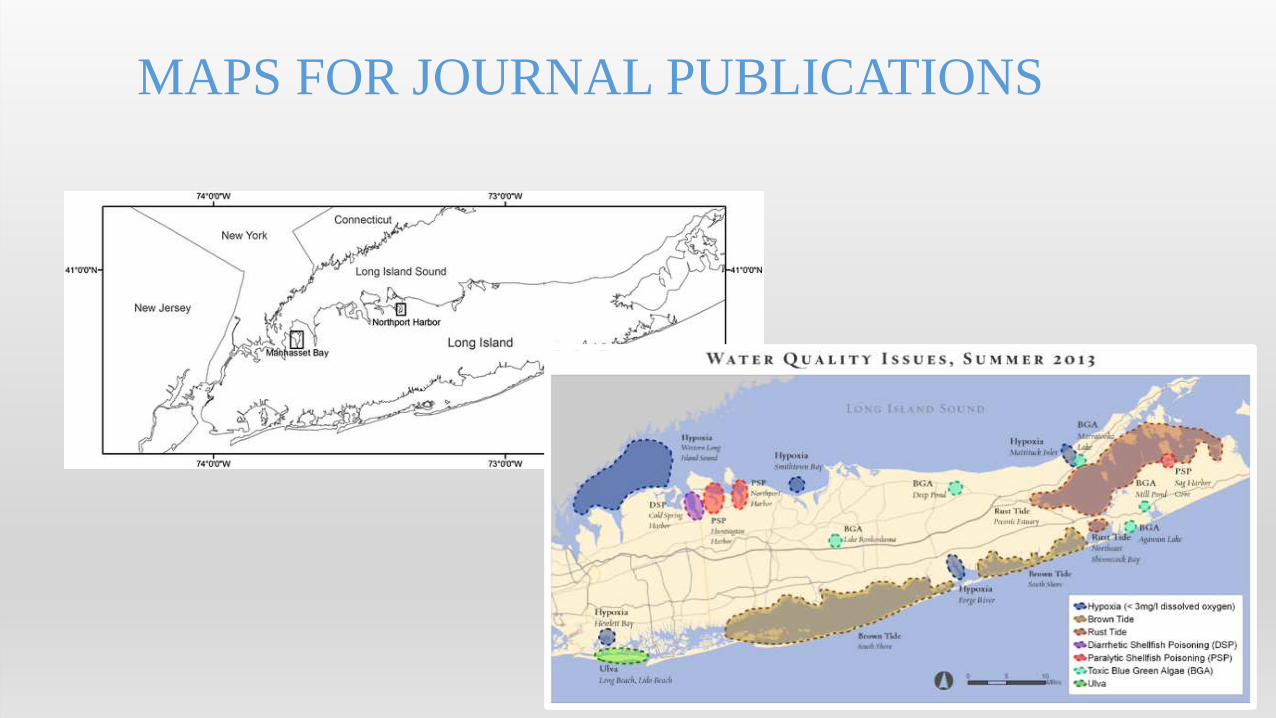
MAPS FOR JOURNAL PUBLICATIONS

• Date of map production
• Author of map
• Inset locational map
• Compass Rose or North Arrow
• Scale bar
• Legend / Key
• Title
• Data Sources
COMMON MAP ELEMENTS
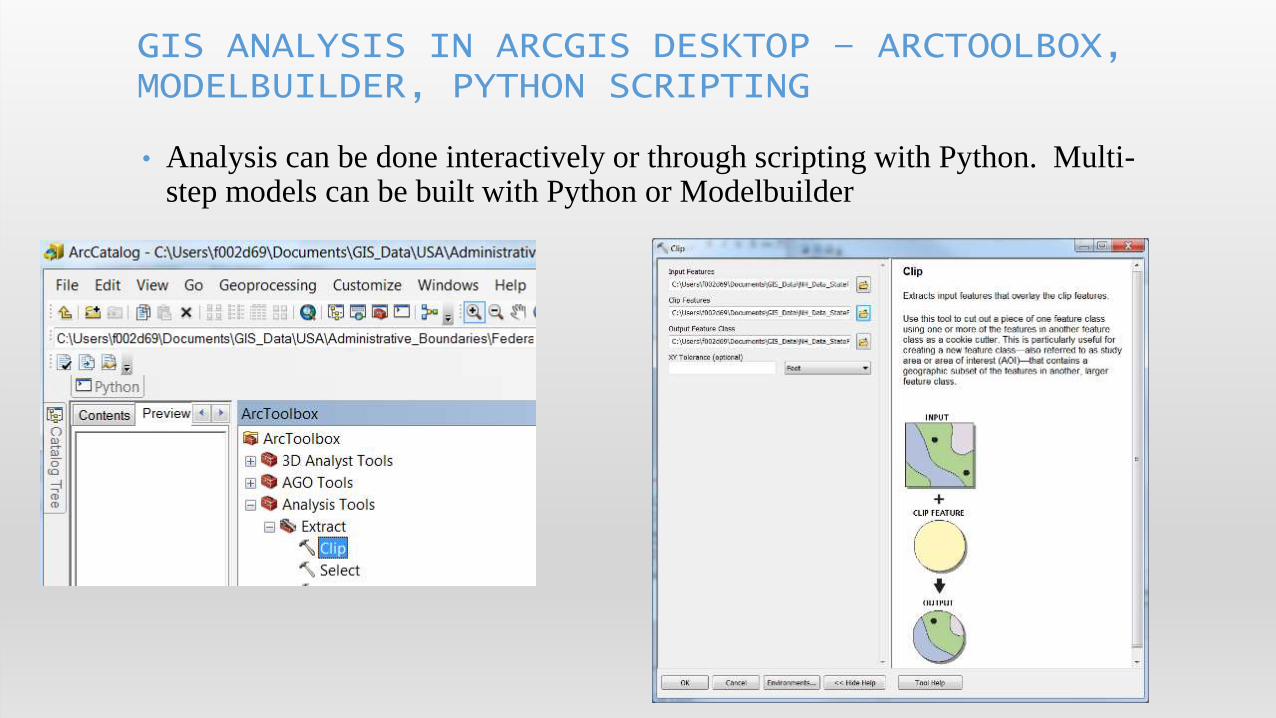
• Analysis can be done interactively or through scripting with Python. Multi-step models can be built with Python or Modelbuilder
GIS ANALYSIS IN ARCGIS DESKTOP – ARCTOOLBOX, MODELBUILDER, PYTHON SCRIPTING

• The project scope of work should drive the type of device required
• For 2-5 meter accuracy, a $100 GPS device might do the trick if used properly
• For high accuracy applications such as surveying and construction, device kits can run over $10,000 and require specialized training to use the devices properly.
• GPS units require the acquisition of signals from at least four GPS satellites, that must be widely distributed in the sky, in order for your device to estimate your position using trilateration
• Allowing the unit to remain in one location for a longer period of time may improve the trilateration process
GPS
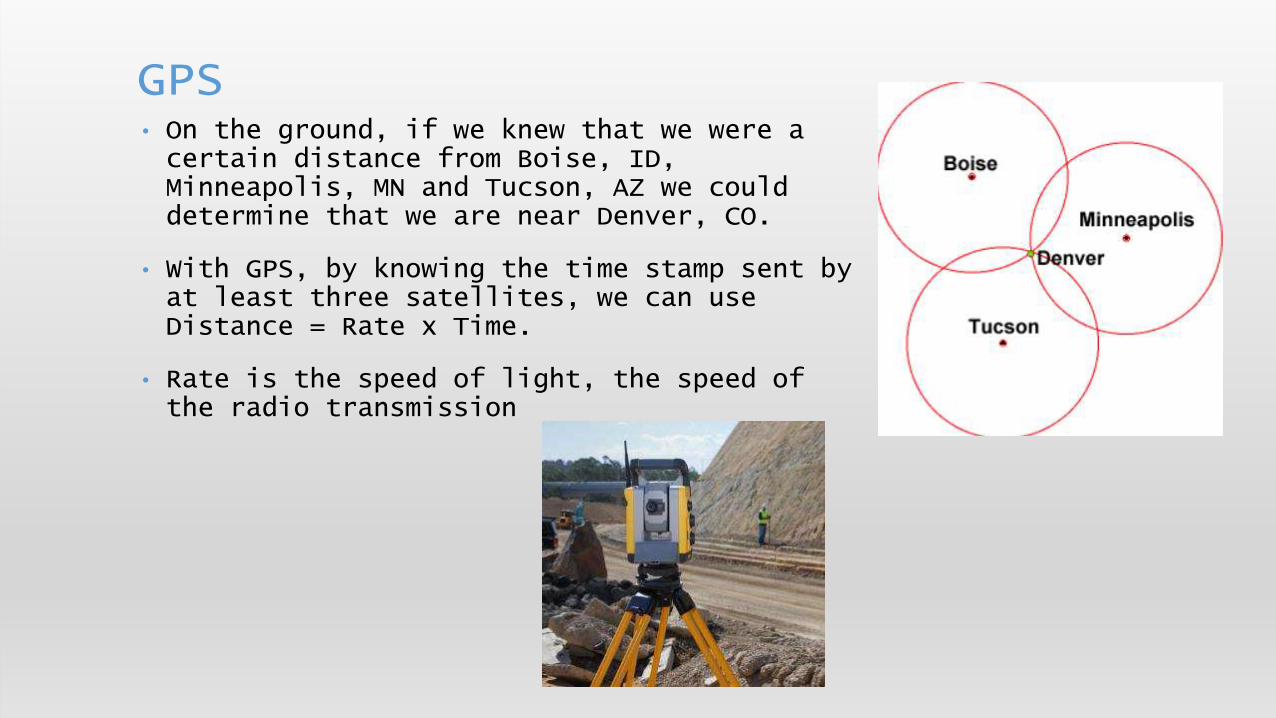
• On the ground, if we knew that we were a certain distance from Boise, ID, Minneapolis, MN and Tucson, AZ we could determine that we are near Denver, CO.
• With GPS, by knowing the time stamp sent by at least three satellites, we can use Distance = Rate x Time.
• Rate is the speed of light, the speed of the radio transmission
GPS

• Recently, a variety of GIS data collection tools have been developed for mobile devices such as phones and tablets
• These use the mobile device’s GPS chip and tower-signal proximity for location
• Collector For ArcGIS
• GIS Cloud MDC (mobile data collector)
• QGIS for Android
• Often difficult to know, record or assess positional accuracy metrics such as PDOP
• Examples include Collector for ArcGIS, Mobile Data Collector-MDC GIS Cloud, ArcGIS Survey 123
GIS COLLECTOR APPS FOR MOBILE