Embed Size (px)
Citation preview
S1JANUARY 2018AMERICAN METEOROLOGICAL SOCIETY |
1. INTRODUCTION TO EXPLAINING EXTREME EVENTS OF 2016 FROM A CLIMATE PERSPECTIVE
Stephanie C. herring, nikolaoS ChriStidiS, andrew hoell, JameS p. koSSin, Carl J. SChreCk iii, and peter a. Stott
Over the past six years, more than 130 peer-reviewed papers evaluating the potential connection between extreme weather and anthropogenic climate change have been presented in this annual special edition of the Bulletin of the American Meteorological Society. Of the roughly 89 papers that did identify a climate change signal in the authors’ analysis of an extreme event, each found climate change had shifted the odds of an event happening. Prior to this year, however, none had determined that human-caused climate change was an essential factor in the occurrence of the event. In this year’s report, for the first time, we present three new research papers that conclude the extreme magnitude of a particular weather event was not possible without the influence of human-caused climate change.
• In a paper analyzing the 2016 global heat record by NOAA scientist Tom Knutson et al., the authors concluded that record global warmth “was only possible due to substantial centennial-scale human-caused warming.”
• Similarly, a study of the record heat over Asia led by Yukiko Imada of the Japanese Meteorological Agency found that the extreme warmth across Asia in 2016 “would not have been possible without climate change.”
• In addition to these two papers looking at atmospheric temperatures, a team led by John Walsh of the University of Alaska determined that a large, persistent area of anomalously warm ocean water off the coast of Alaska (often referenced as “the Blob”) found “no instances of 2016-like anomalies in the preindustrial climate” for sea surface temperatures in the Bering Sea.
These results are novel, and we would argue, sig-
nificant for two reasons. First, it is important to note that climate scientists have been predicting that, based on the ongoing global warming of Earth’s climate, the influence of human-caused climate change would at some point become sufficiently strong and emergent to push an extreme event beyond the bounds of natural variability alone. It was also anticipated that we would likely first see this result for heat events where the human-caused influences are most strongly observed. It is striking how quickly we are now start-ing to see such results, though their dependence on model-based estimates of natural variability in the absence of human-induced change will require ongo-ing validation of the time-of-emergence for extreme event magnitudes at local scales. Second, because of the small sample size of events shown in this report, it is possible that other temperature-related extreme events occurring in prior years may also have been impossible to achieve without human-induced cli-mate change. Retrospective studies would be needed to explore this possibility. The 2016 results do not necessarily indicate that some climate threshold or tipping point has been reached.
It is helpful to consider the methodology used in these studies to understand the conclusions. Each used the commonly accepted event attribution tech-nique of calculating the fraction of attributable risk (FAR) for the event, a statistical approach borrowed from epidemiology and public health, establishing the probability of the event happening with greenhouse gas emissions at current levels due to human activity. For heat events, this probability relies in large part on the observational record. This result is compared with model runs of a “control” world that only include natural forcing mechanisms and ignore the changes to atmospheric composition driven by human green-house gas emissions.
All three papers concluded that the FAR was 1, meaning that the event was not possible in the “control” planet, and only possible in a world with human-emitted greenhouse gases. It should also be recognized that although FAR = 1 in relation to a human-induced impact in these cases, other climate drivers that also affect the probability of such ex-
AFFILIATIONS: herring—NOAA/National Centers for Environmental Information, Boulder, Colorado; hoell—NOAA/Earth System Research Laboratory, Physical Sciences Division, Boulder, Colorado; koSSin—NOAA/National Centers for Environmental Information, Madison, Wisconsin; SChreCk—Cooperative Institute for Climate and Satellites–North Carolina, North Carolina State University, Asheville, North Carolina; ChriStidiS and Stott—Met Office Hadley Centre, and University of Exeter, Exeter, United Kingdom
DOI:10.1175/BAMS-D-17-0284.1
S2 JANUARY 2018|
tremes may have been major additional contributors to the likelihood of the event occurring. Each of these papers applied large model ensembles (CMIP5 for both the global heat and Alaska marine heat wave analyses and the atmospheric general circulation model MIROC5 for the Asia heat study) to determine the FAR for these events.
As in past years, this sixth edition of Explaining Extreme Events from a Climate Perspective includes studies of extreme events from around the world that did not find a role for climate change in influencing the magnitude or frequency of an event. It is impor-tant to note that papers are selected for consideration in this report by reviewing author proposals that do not indicate whether a role for climate change will or will not be found. Thus, there is no selection bias on the part of the editorial team toward one particular conclusion, and this publication prides itself as a venue that accepts papers without consideration for whether a role for climate change is found. This year there may be a slight bias toward events that do not find a signal relative to previous years because the editors have begun to limit the number of heat papers in the report which is the event type where a signal is most commonly found. Given that the majority of heat papers now use a widely established and accepted
methodology, the scientific value of continuing to include a large number of heat studies began to seem limited.
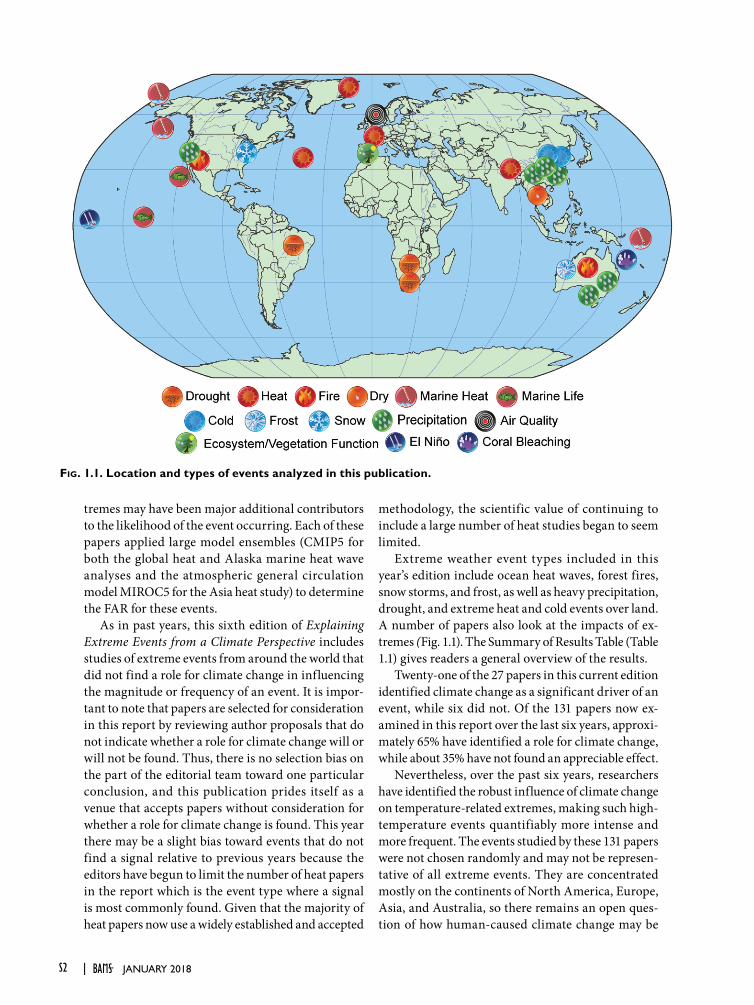
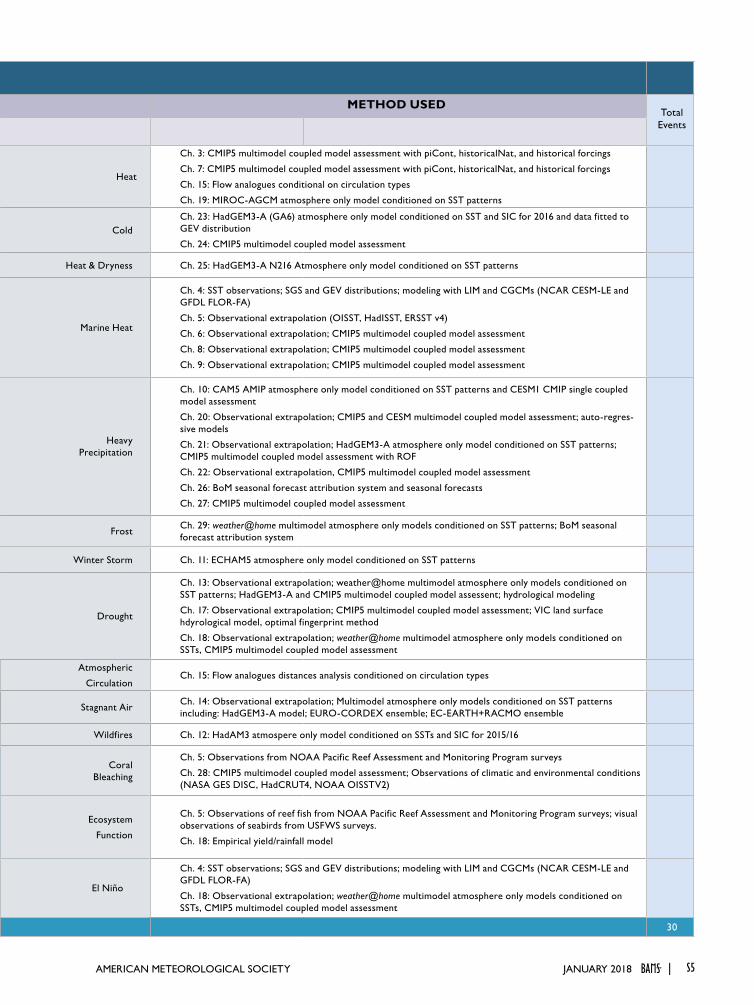
Extreme weather event types included in this year’s edition include ocean heat waves, forest fires, snow storms, and frost, as well as heavy precipitation, drought, and extreme heat and cold events over land. A number of papers also look at the impacts of ex-tremes (Fig. 1.1). The Summary of Results Table (Table 1.1) gives readers a general overview of the results.
Twenty-one of the 27 papers in this current edition identified climate change as a significant driver of an event, while six did not. Of the 131 papers now ex-amined in this report over the last six years, approxi-mately 65% have identified a role for climate change, while about 35% have not found an appreciable effect.
Nevertheless, over the past six years, researchers have identified the robust influence of climate change on temperature-related extremes, making such high-temperature events quantifiably more intense and more frequent. The events studied by these 131 papers were not chosen randomly and may not be represen-tative of all extreme events. They are concentrated mostly on the continents of North America, Europe, Asia, and Australia, so there remains an open ques-tion of how human-caused climate change may be
Fig. 1.1. Location and types of events analyzed in this publication.
S3JANUARY 2018AMERICAN METEOROLOGICAL SOCIETY |
influencing extreme weather in parts of the world that are not as well studied.
Last year, the editors called on scientists submit-ting research proposals to investigate potential links between an extreme event and its subsequent impact, and we were excited to see five research teams take on this challenge in this year’s report. Lewis and Mallela concluded that the risk of the extreme Great Barrier Reef bleaching event was increased through anomalously high sea surface temperature and the accumulation of thermal stress caused by human-caused climate change. Jacox et al. and Brainard et al. both examined how high ocean temperatures caused in part by human-caused climate change im-pacted living marine resources like coral bleaching, reduced fish stocks, and a decrease in seabird counts in the California current and the equatorial Pacific, respectively. On land, Sippel et al. found that human-caused climate change is causing warmer winters on the Iberian Peninsula and, when coupled with a wet spring, drove higher ecosystem productivity in the region in 2016. However, these papers represent early approaches, and more work is needed to develop impact attribution methodologies.
As is always the case, we would caution that the results of any single study should not be interpreted as the final word on the matter for that event, nor be generalized to a broader class of extremes. For example, authors of these papers selected specific modeling approaches and made other choices about factors that are important in how the models replicate extreme events, such as terrestrial heat or sea surface temperatures. If other study designs were applied to these events, it is possible a different result would be reached. The importance of the methodological ap-proach in attribution research is further discussed in the summary of this report (Stott et al.).
A big question raised by this collection of research is whether these findings undermine the axiom that “no event is caused by climate change alone and that natural variability always plays some role.” The short answer is no. While several of the studied events were found not to be possible without climate change, natural variability still laid the foundation for the events to occur, and the authors acknowledge this in their papers. Extreme events are always the result of a cumulative set of factors. The building blocks that form the foundation of any event continue to include natural variability, with factors such as El Niño potentially adding to the strength of the event. These temperature-related extremes would likely still have been warm events even without human-caused
climate change, but according to these analyses, the events could not have surpassed the extreme warm thresholds that they did without climate change. This was especially the case for the record-setting globally averaged temperature. At the global scale, the natural variations of Earth’s temperature are increasingly seen to pale in comparison to the growing intensity of human-induced warming. Overall, human-caused climate change allowed them to pass a threshold that they could not otherwise have exceeded.
These papers also emphasize why clearer under-standing of how human-caused climate change im-pacts extreme events is an important area of research. Retrospective analysis of previous extreme events may yield new insights into the history of human-caused climate change impacts, and we can expect to see insights into the extent and timing of the changes in the future.

S4 JANUARY 2018|
Table 1.1. SUMMARY of RESULTSANTHROPOGENIC INFLUENCE ON EVENT METHOD USED
Total Events
INCREASE DECREASE NOT FOUND OR UNCERTAIN
Heat
Ch. 3: Global
Ch. 7: Arctic
Ch. 15: France
Ch. 19: Asia
Heat
Ch. 3: CMIP5 multimodel coupled model assessment with piCont, historicalNat, and historical forcings
Ch. 7: CMIP5 multimodel coupled model assessment with piCont, historicalNat, and historical forcings
Ch. 15: Flow analogues conditional on circulation types
Ch. 19: MIROC-AGCM atmosphere only model conditioned on SST patterns
ColdCh. 23: China
Ch. 24: ChinaCold
Ch. 23: HadGEM3-A (GA6) atmosphere only model conditioned on SST and SIC for 2016 and data fitted to GEV distribution
Ch. 24: CMIP5 multimodel coupled model assessment
Heat & Dryness Ch. 25: Thailand Heat & Dryness Ch. 25: HadGEM3-A N216 Atmosphere only model conditioned on SST patterns
Marine Heat
Ch. 4: Central Equatorial Pacific
Ch. 5: Central Equatorial Pacific
Ch. 6: Pacific Northwest
Ch. 8: North Pacific Ocean/Alaska
Ch. 9: North Pacific Ocean/Alaska
Ch. 9: Australia
Ch. 4: Eastern Equatorial Pacific Marine Heat
Ch. 4: SST observations; SGS and GEV distributions; modeling with LIM and CGCMs (NCAR CESM-LE and GFDL FLOR-FA)
Ch. 5: Observational extrapolation (OISST, HadISST, ERSST v4)
Ch. 6: Observational extrapolation; CMIP5 multimodel coupled model assessment
Ch. 8: Observational extrapolation; CMIP5 multimodel coupled model assessment
Ch. 9: Observational extrapolation; CMIP5 multimodel coupled model assessment
Heavy Precipitation
Ch. 20: South China
Ch. 21: China (Wuhan)
Ch. 22: China (Yangtze River)
Ch. 10: California (failed rains)
Ch. 26: Australia
Ch. 27: Australia
Heavy Precipitation
Ch. 10: CAM5 AMIP atmosphere only model conditioned on SST patterns and CESM1 CMIP single coupled model assessment
Ch. 20: Observational extrapolation; CMIP5 and CESM multimodel coupled model assessment; auto-regres-sive models
Ch. 21: Observational extrapolation; HadGEM3-A atmosphere only model conditioned on SST patterns; CMIP5 multimodel coupled model assessment with ROF
Ch. 22: Observational extrapolation, CMIP5 multimodel coupled model assessment
Ch. 26: BoM seasonal forecast attribution system and seasonal forecasts
Ch. 27: CMIP5 multimodel coupled model assessment
Frost Ch. 29: Australia Frost Ch. 29: weather@home multimodel atmosphere only models conditioned on SST patterns; BoM seasonal forecast attribution system
Winter Storm Ch. 11: Mid-Atlantic U.S. Storm "Jonas" Winter Storm Ch. 11: ECHAM5 atmosphere only model conditioned on SST patterns
DroughtCh. 17: Southern Africa
Ch. 18: Southern AfricaCh. 13: Brazil Drought
Ch. 13: Observational extrapolation; weather@home multimodel atmosphere only models conditioned on SST patterns; HadGEM3-A and CMIP5 multimodel coupled model assessent; hydrological modeling
Ch. 17: Observational extrapolation; CMIP5 multimodel coupled model assessment; VIC land surface hdyrological model, optimal fingerprint method
Ch. 18: Observational extrapolation; weather@home multimodel atmosphere only models conditioned on SSTs, CMIP5 multimodel coupled model assessment
Atmospheric Circulation Ch. 15: Europe
Atmospheric
CirculationCh. 15: Flow analogues distances analysis conditioned on circulation types
Stagnant Air Ch. 14: Western Europe Stagnant Air Ch. 14: Observational extrapolation; Multimodel atmosphere only models conditioned on SST patterns including: HadGEM3-A model; EURO-CORDEX ensemble; EC-EARTH+RACMO ensemble
Wildfires Ch. 12: Canada & Australia (Vapor Pressure Deficits)
Wildfires Ch. 12: HadAM3 atmospere only model conditioned on SSTs and SIC for 2015/16
Coral
Bleaching
Ch. 5: Central Equatorial Pacific
Ch. 28: Great Barrier ReefCoral
Bleaching
Ch. 5: Observations from NOAA Pacific Reef Assessment and Monitoring Program surveys
Ch. 28: CMIP5 multimodel coupled model assessment; Observations of climatic and environmental conditions (NASA GES DISC, HadCRUT4, NOAA OISSTV2)
Ecosystem Function
Ch. 5: Central Equatorial Pacific (Chl-a and primary production, sea bird abun-dance, reef fish abundance)
Ch. 18: Southern Africa (Crop Yields)
Ecosystem
Function
Ch. 5: Observations of reef fish from NOAA Pacific Reef Assessment and Monitoring Program surveys; visual observations of seabirds from USFWS surveys.
Ch. 18: Empirical yield/rainfall model
El Niño Ch. 18: Southern Africa Ch. 4: Equatorial Pacific (Amplitude) El Niño
Ch. 4: SST observations; SGS and GEV distributions; modeling with LIM and CGCMs (NCAR CESM-LE and GFDL FLOR-FA)
Ch. 18: Observational extrapolation; weather@home multimodel atmosphere only models conditioned on SSTs, CMIP5 multimodel coupled model assessment
total 18 3 9 30
S5JANUARY 2018AMERICAN METEOROLOGICAL SOCIETY |
Table 1.1. SUMMARY of RESULTSANTHROPOGENIC INFLUENCE ON EVENT METHOD USED
Total Events
INCREASE DECREASE NOT FOUND OR UNCERTAIN
Heat
Ch. 3: Global
Ch. 7: Arctic
Ch. 15: France
Ch. 19: Asia
Heat
Ch. 3: CMIP5 multimodel coupled model assessment with piCont, historicalNat, and historical forcings
Ch. 7: CMIP5 multimodel coupled model assessment with piCont, historicalNat, and historical forcings
Ch. 15: Flow analogues conditional on circulation types
Ch. 19: MIROC-AGCM atmosphere only model conditioned on SST patterns
ColdCh. 23: China
Ch. 24: ChinaCold
Ch. 23: HadGEM3-A (GA6) atmosphere only model conditioned on SST and SIC for 2016 and data fitted to GEV distribution
Ch. 24: CMIP5 multimodel coupled model assessment
Heat & Dryness Ch. 25: Thailand Heat & Dryness Ch. 25: HadGEM3-A N216 Atmosphere only model conditioned on SST patterns
Marine Heat
Ch. 4: Central Equatorial Pacific
Ch. 5: Central Equatorial Pacific
Ch. 6: Pacific Northwest
Ch. 8: North Pacific Ocean/Alaska
Ch. 9: North Pacific Ocean/Alaska
Ch. 9: Australia
Ch. 4: Eastern Equatorial Pacific Marine Heat
Ch. 4: SST observations; SGS and GEV distributions; modeling with LIM and CGCMs (NCAR CESM-LE and GFDL FLOR-FA)
Ch. 5: Observational extrapolation (OISST, HadISST, ERSST v4)
Ch. 6: Observational extrapolation; CMIP5 multimodel coupled model assessment
Ch. 8: Observational extrapolation; CMIP5 multimodel coupled model assessment
Ch. 9: Observational extrapolation; CMIP5 multimodel coupled model assessment
Heavy Precipitation
Ch. 20: South China
Ch. 21: China (Wuhan)
Ch. 22: China (Yangtze River)
Ch. 10: California (failed rains)
Ch. 26: Australia
Ch. 27: Australia
Heavy Precipitation
Ch. 10: CAM5 AMIP atmosphere only model conditioned on SST patterns and CESM1 CMIP single coupled model assessment
Ch. 20: Observational extrapolation; CMIP5 and CESM multimodel coupled model assessment; auto-regres-sive models
Ch. 21: Observational extrapolation; HadGEM3-A atmosphere only model conditioned on SST patterns; CMIP5 multimodel coupled model assessment with ROF
Ch. 22: Observational extrapolation, CMIP5 multimodel coupled model assessment
Ch. 26: BoM seasonal forecast attribution system and seasonal forecasts
Ch. 27: CMIP5 multimodel coupled model assessment
Frost Ch. 29: Australia Frost Ch. 29: weather@home multimodel atmosphere only models conditioned on SST patterns; BoM seasonal forecast attribution system
Winter Storm Ch. 11: Mid-Atlantic U.S. Storm "Jonas" Winter Storm Ch. 11: ECHAM5 atmosphere only model conditioned on SST patterns
DroughtCh. 17: Southern Africa
Ch. 18: Southern AfricaCh. 13: Brazil Drought
Ch. 13: Observational extrapolation; weather@home multimodel atmosphere only models conditioned on SST patterns; HadGEM3-A and CMIP5 multimodel coupled model assessent; hydrological modeling
Ch. 17: Observational extrapolation; CMIP5 multimodel coupled model assessment; VIC land surface hdyrological model, optimal fingerprint method
Ch. 18: Observational extrapolation; weather@home multimodel atmosphere only models conditioned on SSTs, CMIP5 multimodel coupled model assessment
Atmospheric Circulation Ch. 15: Europe
Atmospheric
CirculationCh. 15: Flow analogues distances analysis conditioned on circulation types
Stagnant Air Ch. 14: Western Europe Stagnant Air Ch. 14: Observational extrapolation; Multimodel atmosphere only models conditioned on SST patterns including: HadGEM3-A model; EURO-CORDEX ensemble; EC-EARTH+RACMO ensemble
Wildfires Ch. 12: Canada & Australia (Vapor Pressure Deficits)
Wildfires Ch. 12: HadAM3 atmospere only model conditioned on SSTs and SIC for 2015/16
Coral
Bleaching
Ch. 5: Central Equatorial Pacific
Ch. 28: Great Barrier ReefCoral
Bleaching
Ch. 5: Observations from NOAA Pacific Reef Assessment and Monitoring Program surveys
Ch. 28: CMIP5 multimodel coupled model assessment; Observations of climatic and environmental conditions (NASA GES DISC, HadCRUT4, NOAA OISSTV2)
Ecosystem Function
Ch. 5: Central Equatorial Pacific (Chl-a and primary production, sea bird abun-dance, reef fish abundance)
Ch. 18: Southern Africa (Crop Yields)
Ecosystem
Function
Ch. 5: Observations of reef fish from NOAA Pacific Reef Assessment and Monitoring Program surveys; visual observations of seabirds from USFWS surveys.
Ch. 18: Empirical yield/rainfall model
El Niño Ch. 18: Southern Africa Ch. 4: Equatorial Pacific (Amplitude) El Niño
Ch. 4: SST observations; SGS and GEV distributions; modeling with LIM and CGCMs (NCAR CESM-LE and GFDL FLOR-FA)
Ch. 18: Observational extrapolation; weather@home multimodel atmosphere only models conditioned on SSTs, CMIP5 multimodel coupled model assessment
total 18 3 9 30
S6 JANUARY 2018|
REFERENCES
Brainard, R., and Coauthors, 2018: Ecological impacts of the 2015/16 El Niño in the central equatorial Pa-cific [in “Explaining Extreme Events of 2016 from a Climate Perspective”]. Bull. Amer. Meteor. Soc., 99 (1), S21–S26, doi:10.1175/10.1175/BAMS-D-17-0128.1.
Imada, Y., H. Siogama, C. Takahashi, M. Watanabe, M. Mori, Y. Kamae, and S. Maeda, 2018: Climate change increased the likelihood of the 2016 heat extremes in Asia [in “Explaining Extreme Events of 2016 from a Climate Perspective”]. Bull. Amer. Meteor. Soc., 99 (1), S97–S101, doi:10.1175/BAMS-D-17-0109.1.
ACRONYMS
AMIP: Atmospheric Model Intercomparison Project
BOM: Bureau of Meteorology, Australia
CAM: Community Atmosphere Model, www.cesm .ucar.edu/
CESM: Community Earth System Model
CMIP: Coupled Model Intercomparison Project
GEV: Generalized extreme value
GFDL FLOR: Geophysical Fluid Dynamics Laboratory Forecast-Oriented Low Ocean Resolution
HadGEM3-A: Hadley Centre Global Environmental Model version 3-A
LIM: Linear inverse model
MIROC5-AGCM: Model for Interdisciplinary Research on Climate - Atmospheric General Circulation Model
ROF: Regularized optimal fingerprinting
SGS: Stochastically-generated skewed
SIC: Sea ice concentration
SST: Sea Surface Temperature
USFWS: U.S. Fish and Wildlife Service
VIC: Variable infiltration capacity
weather@home: www.climateprediction.net /weatherathome/
Jacox, M. G., M. A. Alexander, N. J. Mantua, J. D. Scott, G. Hervieux, R. S. Webb, and F. E. Werner, 2018: Forcing of multiyear extreme ocean temperatures that impacted California Current living marine resources in 2016 [in “Explaining Extreme Events of 2016 from a Climate Perspective”]. Bull. Amer. Meteor. Soc., 99 (1), S27–S33, doi:10.1175/BAMS -D-17-0119.1
Knutson, T. R., J. Kam, F. Zeng, and A. T. Wittenberg, 2018: CMIP5 model-based assessment of anthro-pogenic influence on record global warmth during 2016 [in “Explaining Extreme Events of 2016 from a Climate Perspective”]. Bull. Amer. Meteor. Soc., 99 (1), S11–S15, doi:10.1175/BAMS-D-17-0104.1
Lewis, S. C., and J. Mallela, 2018: A multifactor risk analysis of the record 2016 Great Barrier Reef bleach-ing [in “Explaining Extreme Events of 2016 from a Climate Perspective”]. Bull. Amer. Meteor. Soc., 99 (1), S144–S149, doi:10.1175/BAMS-D-17-0074.1.
Sippel, S., and Coauthors, 2018: Warm winter, wet spring, and an extreme response in ecosystem func-tioning on the Iberian Peninsula [in “Explaining Extreme Events of 2016 from a Climate Perspective”]. Bull. Amer. Meteor. Soc., 99 (1), S80–S85, doi:10.1175/BAMS-D-17-0135.1.
Stott, P. A., N. Christidis, S. C. herring, A. Hoell, M. P. Hoerling, J. P. Kossing, C. J. Schreck III, 2018: Future challenges in event attribution methodologies [in “Explaining Extreme Events of 2016 from a Climate Perspective”]. Bull. Amer. Meteor. Soc., 99 (1), S155–S159, doi:10.1175/BAMS-D-17-0265.1.
Walsh, J. E., and Coauthors, 2018: The high lati-tude marine heat wave of 2016 and its impacts on Alaska [in “Explaining Extreme Events of 2016 from a Climate Perspective”]. Bull. Amer. Meteor. Soc . , 9 9 (1), S39 –S 43, doi :10.1175 /BAMS-D-17-0105.1.