Embed Size (px)
Citation preview
Introduction to Experiment: Part 1
Nate Saffold [email protected]
Office Hours: Mondays 5-6PM Pupin 1216
INTRO TO EXPERIMENTAL PHYS-LAB 1493/1494/2699
PHYS 1493/1494/2699: Introduction to Experiment - Part 1
2
General Announcements● Labs will commence February 6th
● Lab room assignments change from week to week, will be posted on 5th floor bulletin board
● Waitlist Protocol ● First quiz on January 30th
PHYS 1493/1494/2699: Introduction to Experiment - Part 1
3
General info● At the beginning of each lecture I will give you a 10 minute long
quiz about the topic covered in the previous week ● The quizzes are graded and they will contribute to 10% of the
final grade ● These lectures have essentially three goals:
1. Introduce you to the basics of error analysis. The aim is to provide the tools to have an idea of how errors work and what they mean (useful in many different circumstances)
2. Review the main concepts of physics needed to perform the weekly experiments
3. Introduce the weekly experiments and describe the procedures
● Do not hesitate to stop me and ask questions!
4
Useful resources
• Some useful resources like the pdf version of the lab manual and the calendar of the weekly experiments can be found on the preceptors’ website:
http://phys.columbia.edu/~preceptor/
(you can also simply Google “columbia physics preceptor”)
• I will post lecture slides and Mathematica tutorials on the course website:
http://www.columbia.edu/~nas2173/1493.html
PHYS 1493/1494/2699: Introduction to Experiment - Part 1
5
What is an experiment?● Essentially two types: (often both at the same time)
● Parameter determination − Examples include: measurement of g, e/m, speed
of light, etc... ● Hypothesis testing
− Examples include: Newton’s gravity, quantum mechanics, Maxwell's equations (E&M), etc...
● Experiments must be reproducible! ● You cannot be the only one to ever make a particular
observation ● The scientific description of the experiment must allow
other scientists to check your results independently
You will mostly
perform this kind
PHYS 1493/1494/2699: Introduction to Experiment - Part 1
6
Reproducible experiments● Bad Science:
● 1989: Cold fusion experiment. Created lots of hope and excitement. Nobody has been able to reproduce the results again
● Good Science: ● 1798: Cavendish Experiment: Measured gravitational
constant G. Confirmed Newton’s Theory of Gravitation ● 1887: Michelson-Morley experiment. Attempted to find “ether”
for E&M waves. Surprisingly, they found no evidence of the “ether”. Later explained by the Theory of Special Relativity
● 2012: LHC@CERN discovers the Higgs boson. This confirms the Standard Model of particle physics
● What can we do to avoid misinterpreting our results? ● CAREFUL ERROR ANALYSIS
PHYS 1493/1494/2699: Introduction to Experiment - Part 1
7
Error Analysis● Unfortunately, in most classes we are led to believe that we are
done after obtaining a numerical value
● Equally important as your results are the errors of your results! ● Quantification of confidence in experiment
Where is the uncertainty in the result (Also note significant figures in reporting the value!)
● An experimental value without an error does not make sense! ● Errors determine the boundaries of our ignorance on the
measured quantity ● Much of the data analysis will be spent trying to quantify errors
U = mgh = 19.3489043 J
U ± �U = 19.3± 0.8 J�U
PHYS 1493/1494/2699: Introduction to Experiment - Part 1
8
Types of Errors● Essentially fall into two categories: ● Statistical Errors:
● Due to random fluctuations from measurement to measurement ● They are unavoidable ● Can be reduced by taking more measurements ● They can be quantified using statistical analysis
● Systematic Errors:
● Always bias the data in one direction ● Should be identified and corrected ● Hard to quantify
PHYS 1493/1494/2699: Introduction to Experiment - Part 1
9
Statistical Errors● A statistical (random) error defines a typical spread in a
measurement caused by random effects ● Governed by probability and statistics ● Could have a real physical value
− e.g. Thermal fluctuations in the room temperature make rulers contract/expand a little bit at every measure
● It can also be a result of the measurement technique − Timing experiment: random fluctuations in reaction
time − Use of a ruler: starting position is different at every trial
because of hands shaking ● Statistical errors are quantifiable. Math allows us to go from
fluctuations on the measured quantities to uncertainties on the final results
PHYS 1493/1494/2699: Introduction to Experiment - Part 1
10
Systematic Errors● They can be caused by many factors. This makes hard their identification ● Wrong calibration of instrument
● Examples: − Faulty meter stick: Shorter or longer than one meter − Scales: not calibrated to zero
● Observer bias: ● Parallax error in reading angle on analog display ● Timing: “Jumping” the gun
● Use of approximate equations: ● Neglecting some piece of math in the data analysis
● Ideally, systematic errors should be small correct them if possible
● If unable to remove, identify source and acknowledge it in lab report and state how this effects the measurement
PHYS 1493/1494/2699: Introduction to Experiment - Part 1
11
Accuracy vs. Precision● Attention: accuracy and precision of a measure are two different
things! ● Accuracy: How close your measure is to the “true” value of the
quantity of interest
● Precision: How close the measured values are to each other ● The smaller the spread, the more precise a measurement.
● Very often one has measurements that are: ● Accurate but imprecise or precise but not accurate
● The best experiment aims for both!
PHYS 1493/1494/2699: Introduction to Experiment - Part 1
12
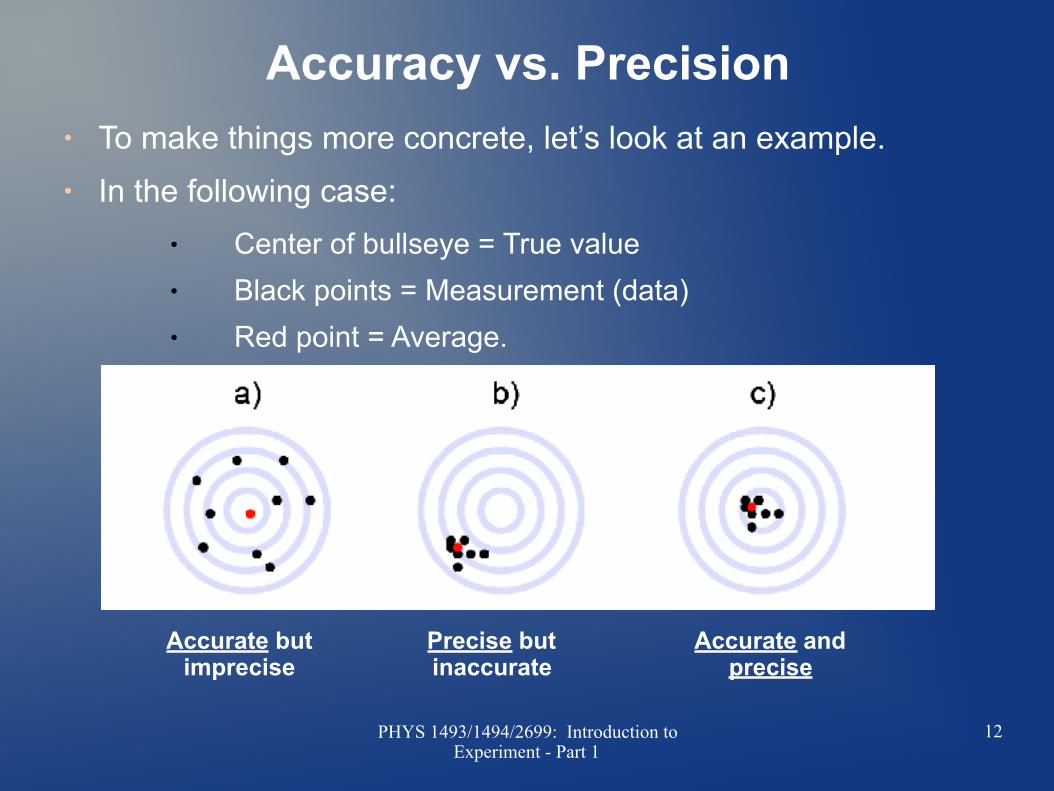
Accuracy vs. Precision● To make things more concrete, let’s look at an example. ● In the following case:
● Center of bullseye = True value ● Black points = Measurement (data) ● Red point = Average.
Accurate but imprecise
Precise but inaccurate
Accurate and precise
PHYS 1493/1494/2699: Introduction to Experiment - Part 1
13
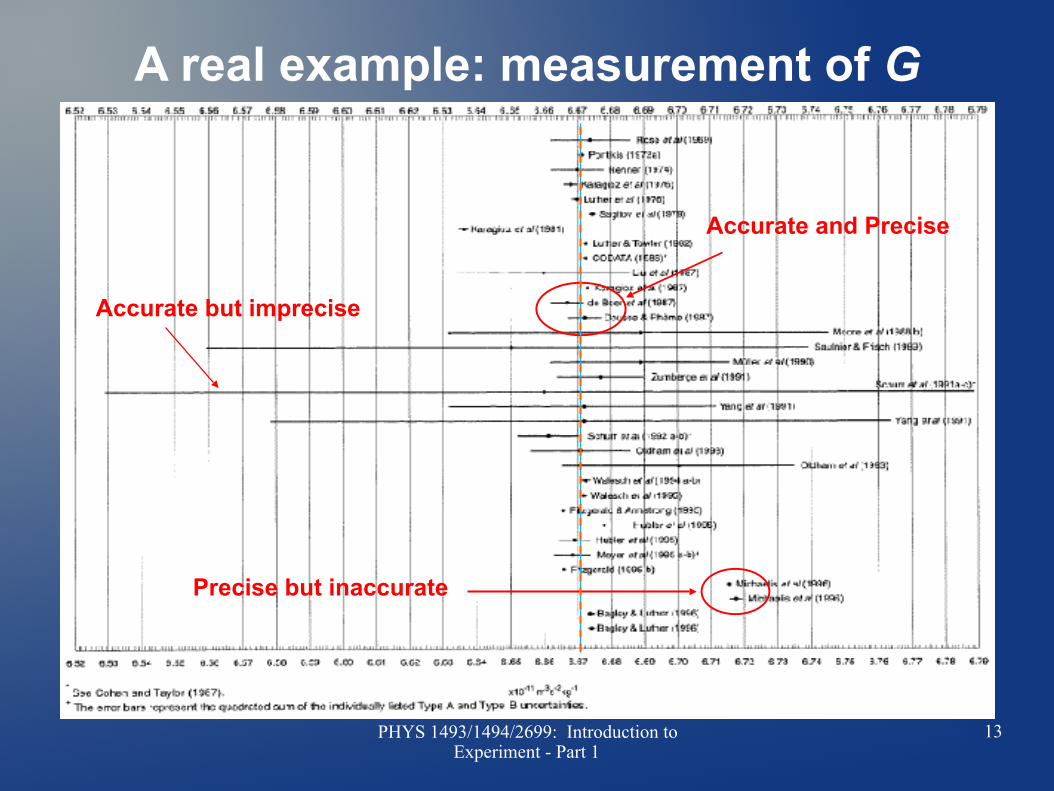
A real example: measurement of G
Accurate and Precise
Accurate but imprecise
Precise but inaccurate
PHYS 1493/1494/2699: Introduction to Experiment - Part 1
14
Quantifying statistical errors● How do we quantify statistical errors?
● Values from different measurements fluctuate. However, they tend to fluctuate around a certain value.
● The tools to help us in quantifying statistical errors (random fluctuations in measurement) are:
● Mean: Average of measurementsThe measurements will fluctuate around this value.
● Standard deviation: It is the average distance between a measure and the mean
● Standard error of the mean: Given N measurements, it is the expected distance between the mean and the true value
PHYS 1493/1494/2699: Introduction to Experiment - Part 1
15
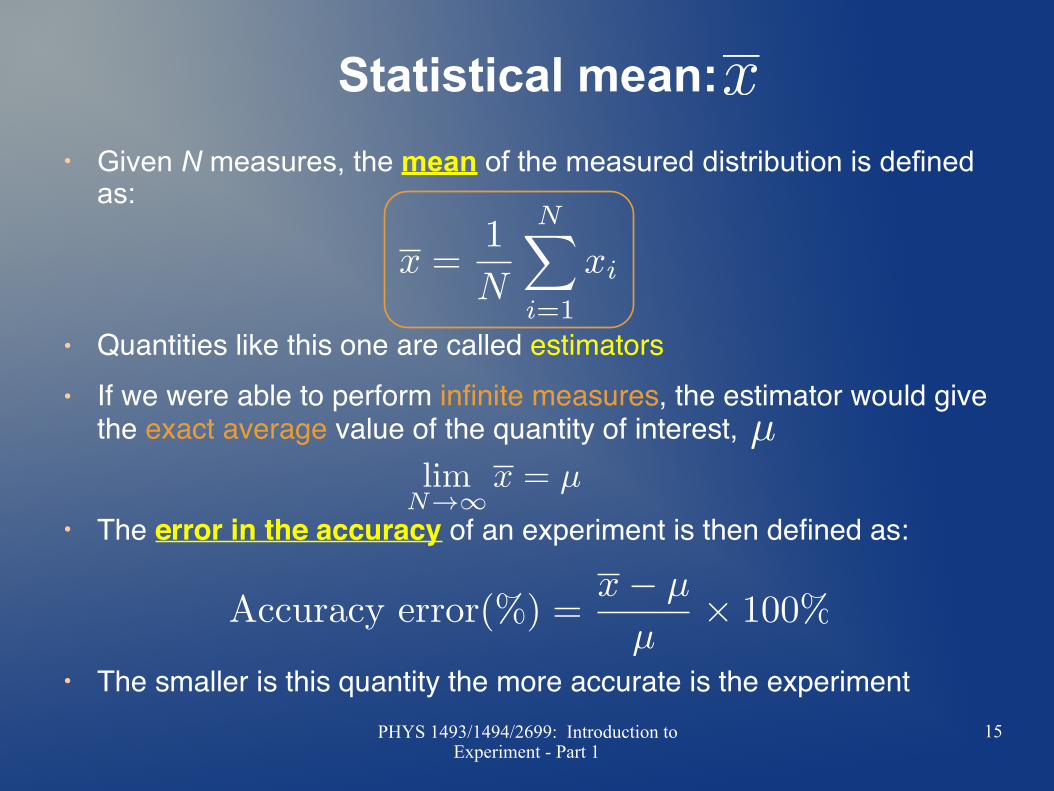
Statistical mean: ● Given N measures, the mean of the measured distribution is defined
as:
● Quantities like this one are called estimators● If we were able to perform infinite measures, the estimator would give
the exact average value of the quantity of interest,
● The error in the accuracy of an experiment is then defined as:
● The smaller is this quantity the more accurate is the experimentPHYS 1493/1494/2699: Introduction to
Experiment - Part 1
16
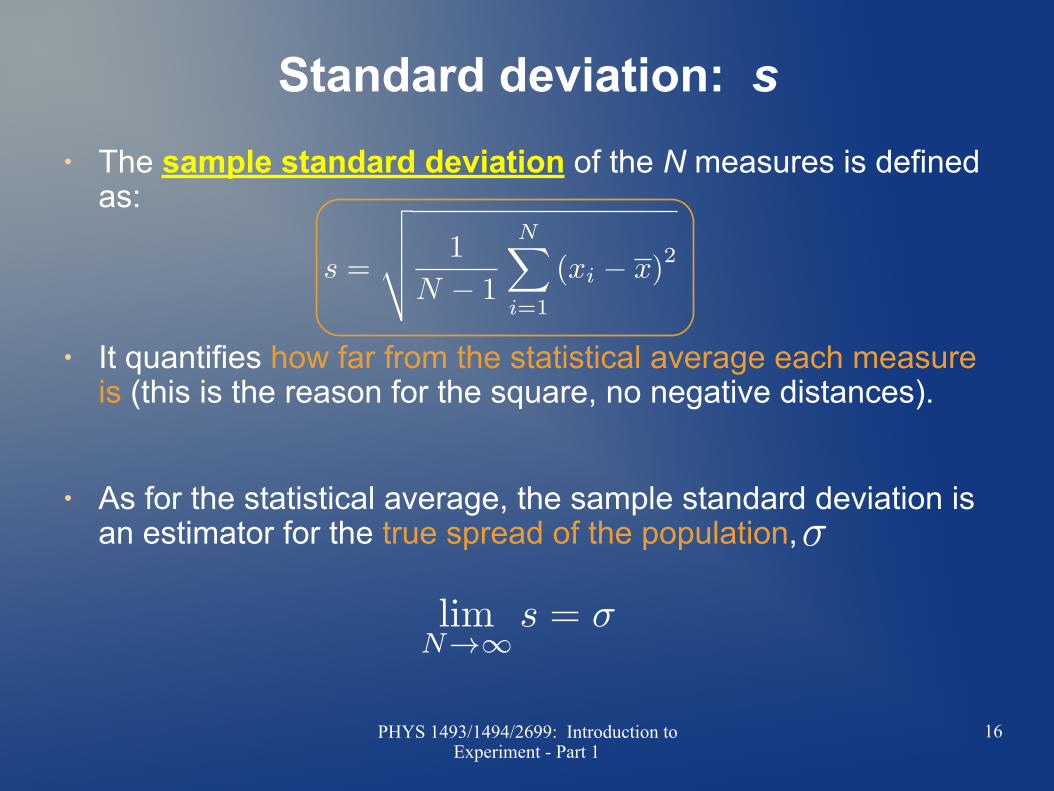
Standard deviation: s● The sample standard deviation of the N measures is defined
as:
● It quantifies how far from the statistical average each measure is (this is the reason for the square, no negative distances).
● As for the statistical average, the sample standard deviation is an estimator for the true spread of the population,
PHYS 1493/1494/2699: Introduction to Experiment - Part 1
17
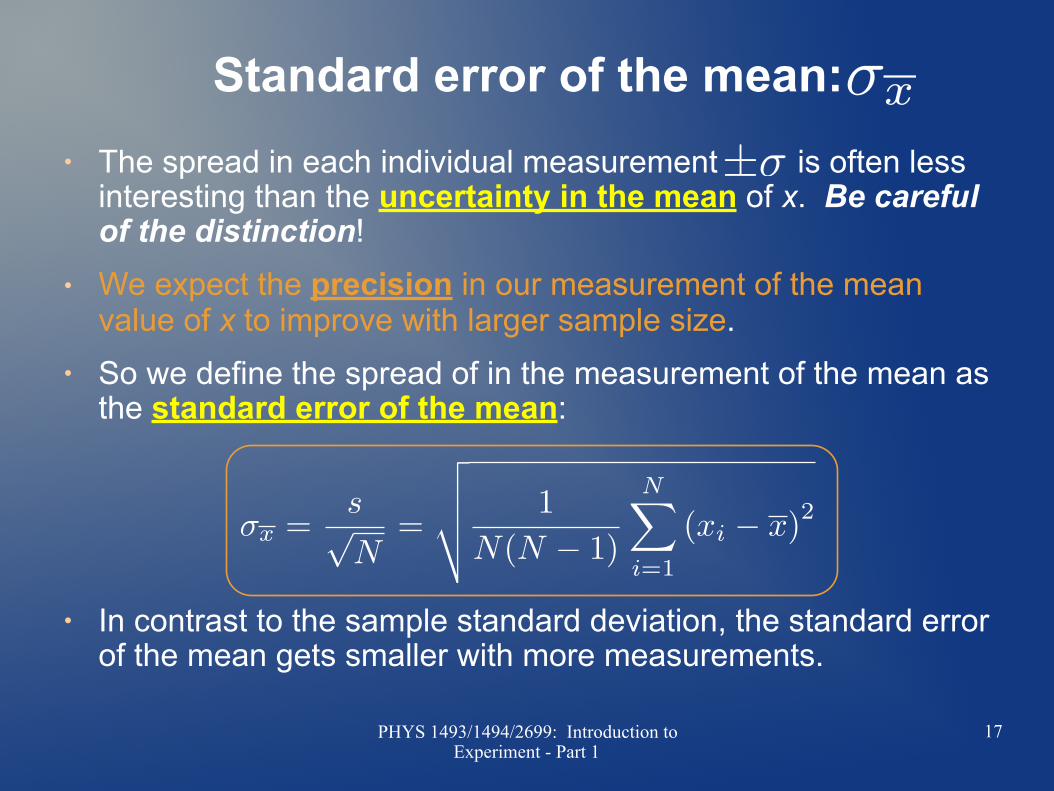
Standard error of the mean: ● The spread in each individual measurement is often less
interesting than the uncertainty in the mean of x. Be careful of the distinction!
● We expect the precision in our measurement of the mean value of x to improve with larger sample size.
● So we define the spread of in the measurement of the mean as the standard error of the mean:
● In contrast to the sample standard deviation, the standard error of the mean gets smaller with more measurements.
PHYS 1493/1494/2699: Introduction to Experiment - Part 1
18
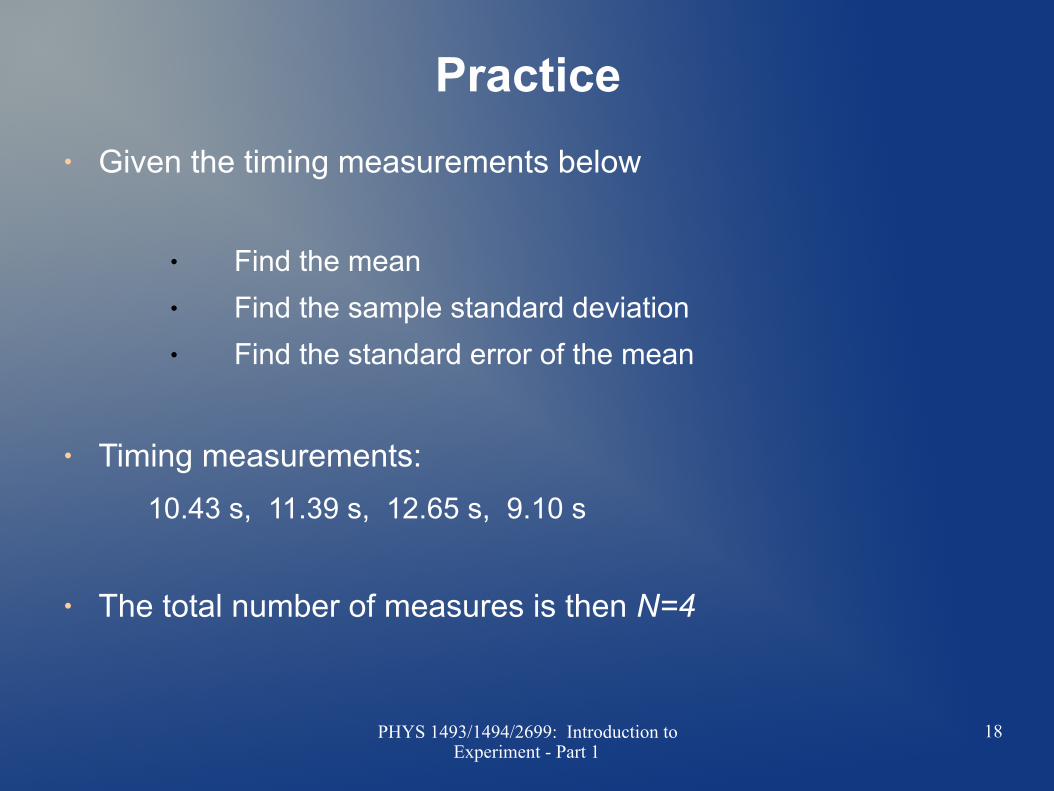
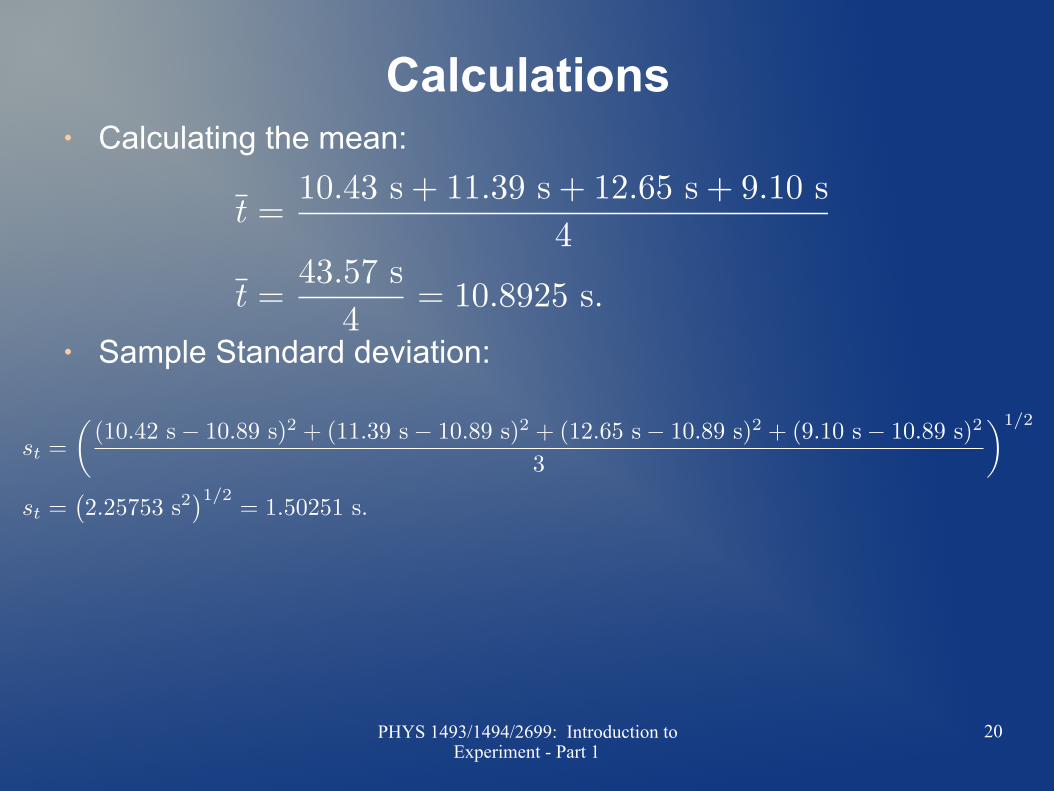
Practice● Given the timing measurements below
● Find the mean ● Find the sample standard deviation ● Find the standard error of the mean
● Timing measurements: 10.43 s, 11.39 s, 12.65 s, 9.10 s
● The total number of measures is then N=4
PHYS 1493/1494/2699: Introduction to Experiment - Part 1
19
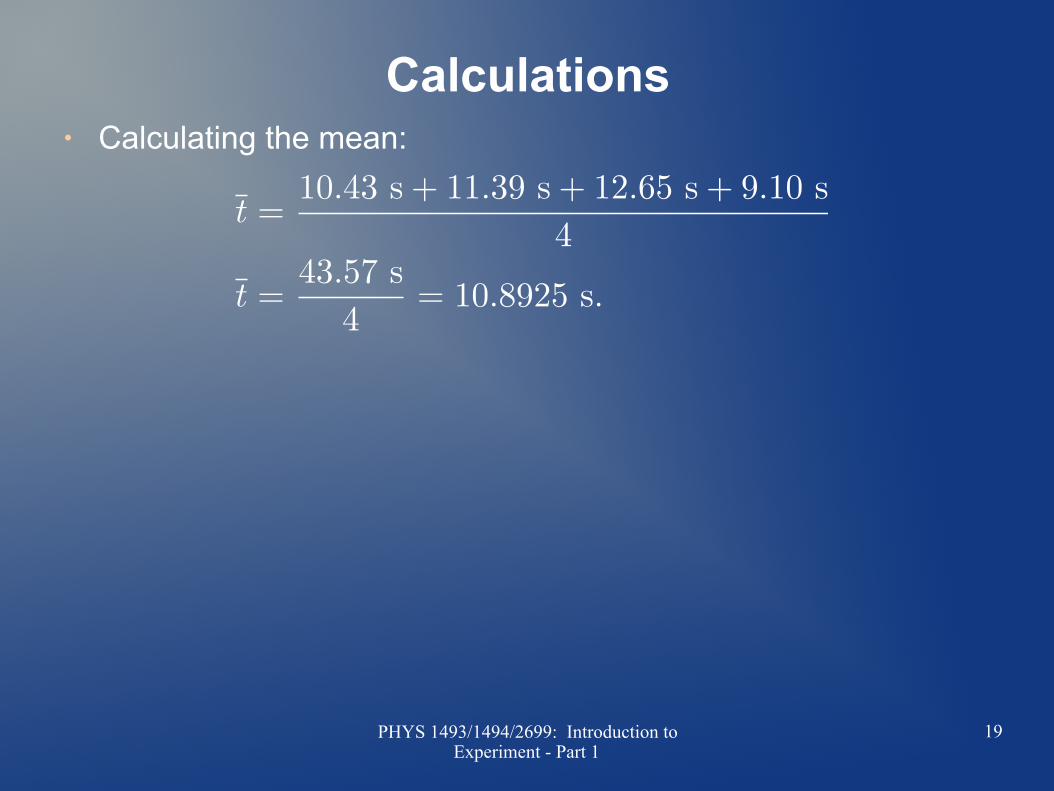
Calculations● Calculating the mean:
PHYS 1493/1494/2699: Introduction to Experiment - Part 1
20
Calculations● Calculating the mean:
● Sample Standard deviation:
PHYS 1493/1494/2699: Introduction to Experiment - Part 1
21
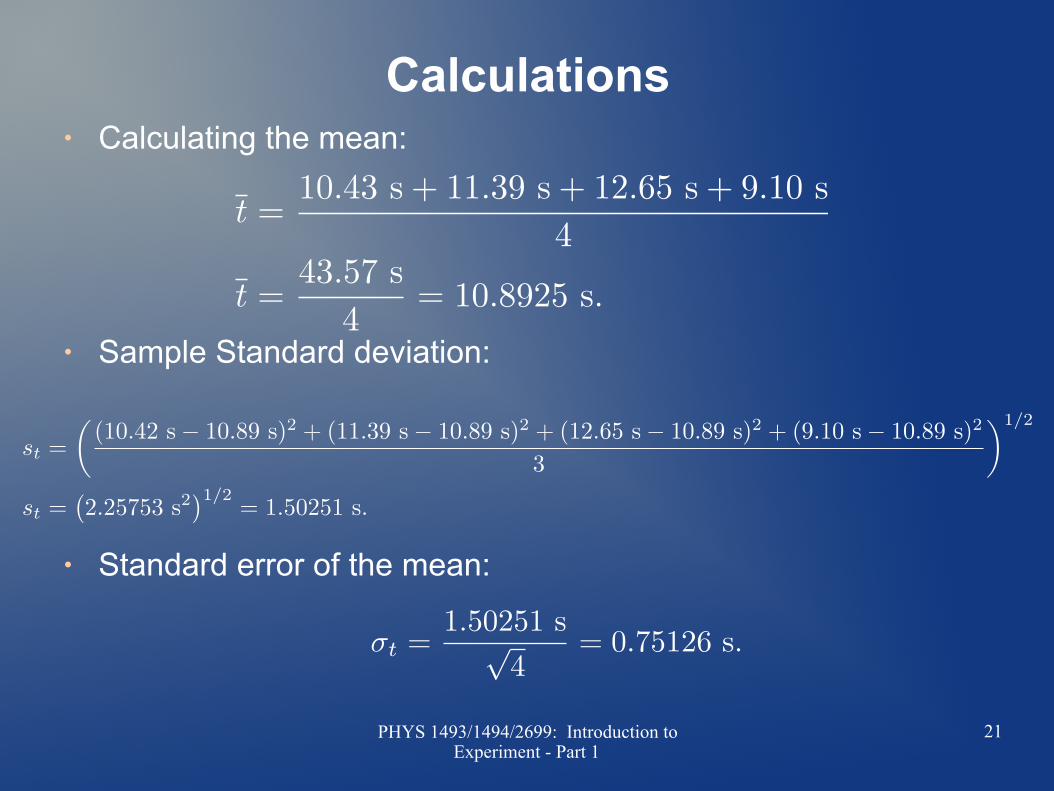
Calculations● Calculating the mean:
● Sample Standard deviation:
● Standard error of the mean:
PHYS 1493/1494/2699: Introduction to Experiment - Part 1
22
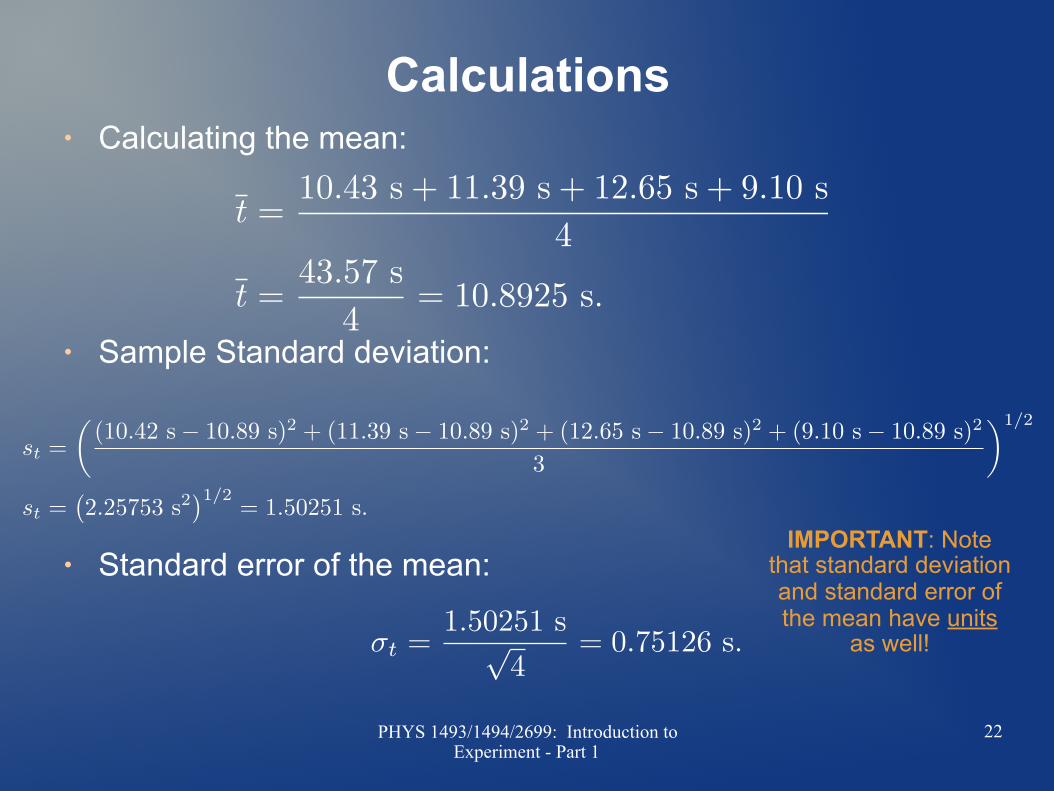
Calculations● Calculating the mean:
● Sample Standard deviation:
● Standard error of the mean:IMPORTANT: Note
that standard deviation and standard error of the mean have units
as well!
PHYS 1493/1494/2699: Introduction to Experiment - Part 1
23
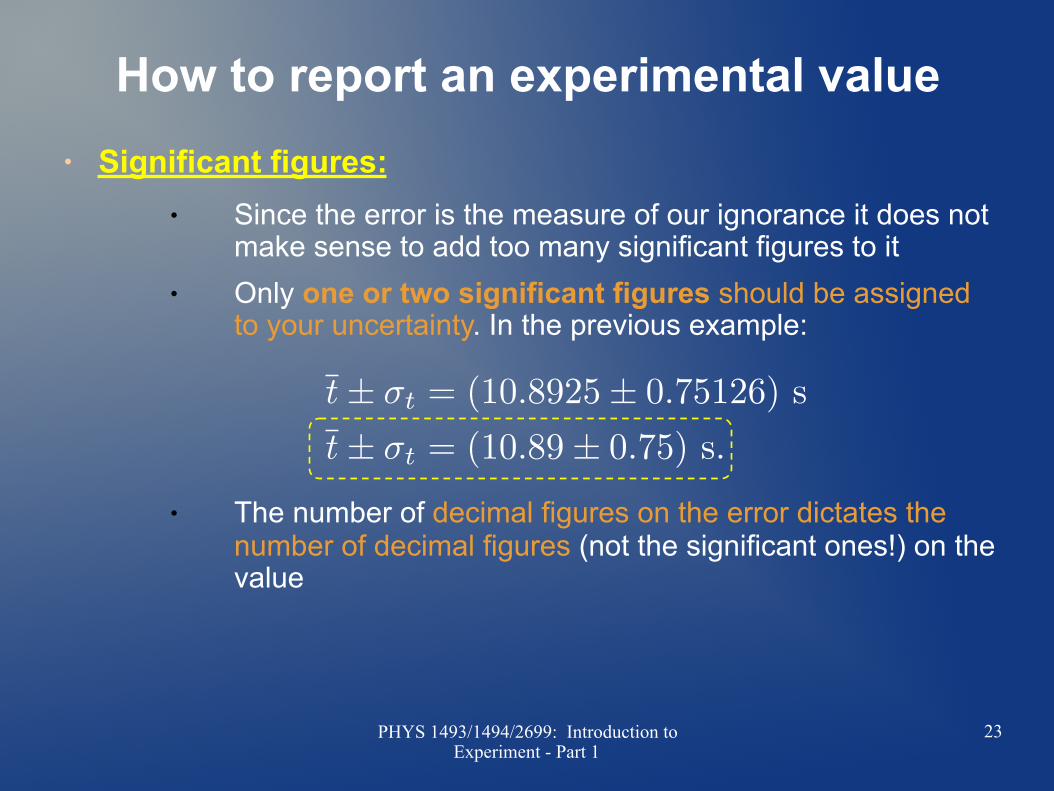
How to report an experimental value● Significant figures:
● Since the error is the measure of our ignorance it does not make sense to add too many significant figures to it
● Only one or two significant figures should be assigned to your uncertainty. In the previous example:
● The number of decimal figures on the error dictates the number of decimal figures (not the significant ones!) on the value
PHYS 1493/1494/2699: Introduction to Experiment - Part 1

24
Gaussian distribution and confidence intervals
PHYS 1493/1494/2699: Introduction to Experiment - Part 1
25
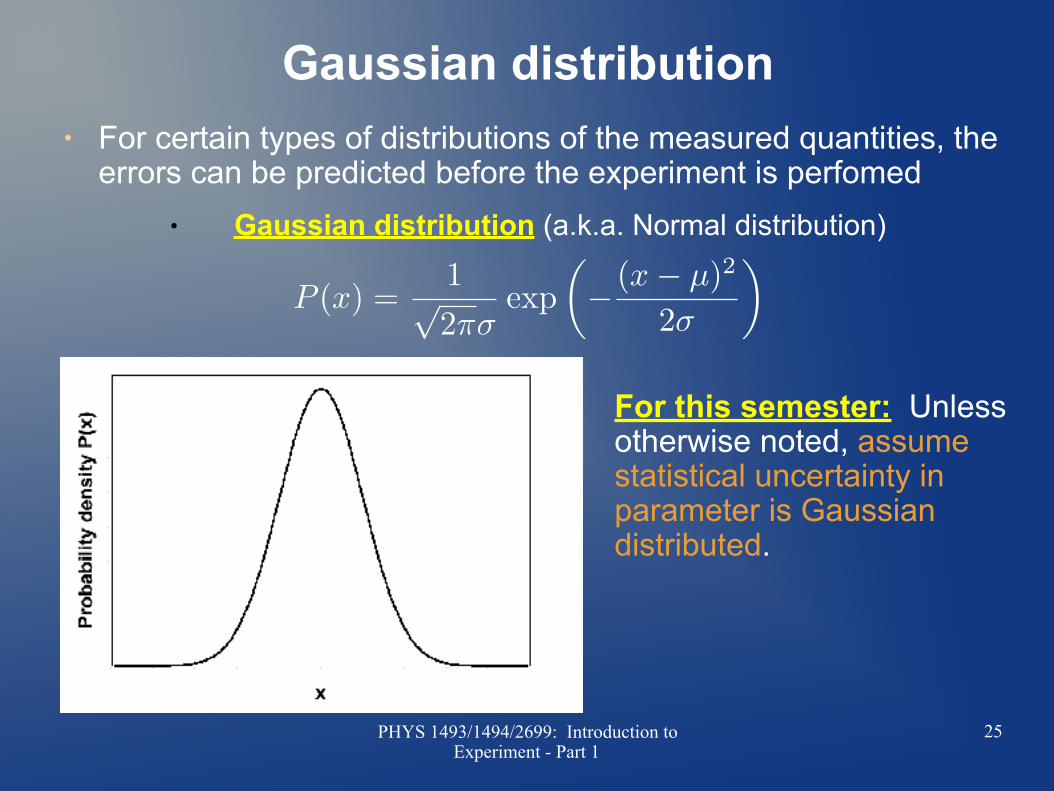
Gaussian distribution● For certain types of distributions of the measured quantities, the
errors can be predicted before the experiment is perfomed ● Gaussian distribution (a.k.a. Normal distribution)
For this semester: Unless otherwise noted, assume statistical uncertainty in parameter is Gaussian distributed.
PHYS 1493/1494/2699: Introduction to Experiment - Part 1
26
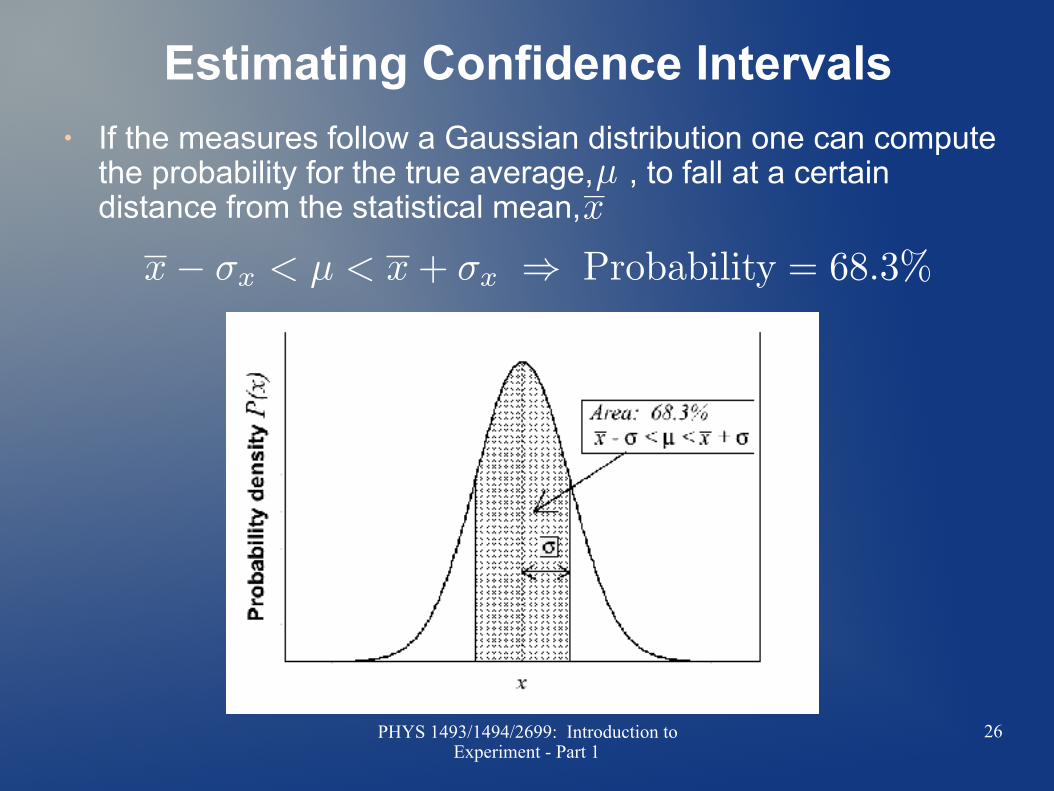
Estimating Confidence Intervals● If the measures follow a Gaussian distribution one can compute
the probability for the true average, , to fall at a certain distance from the statistical mean,
PHYS 1493/1494/2699: Introduction to Experiment - Part 1
27
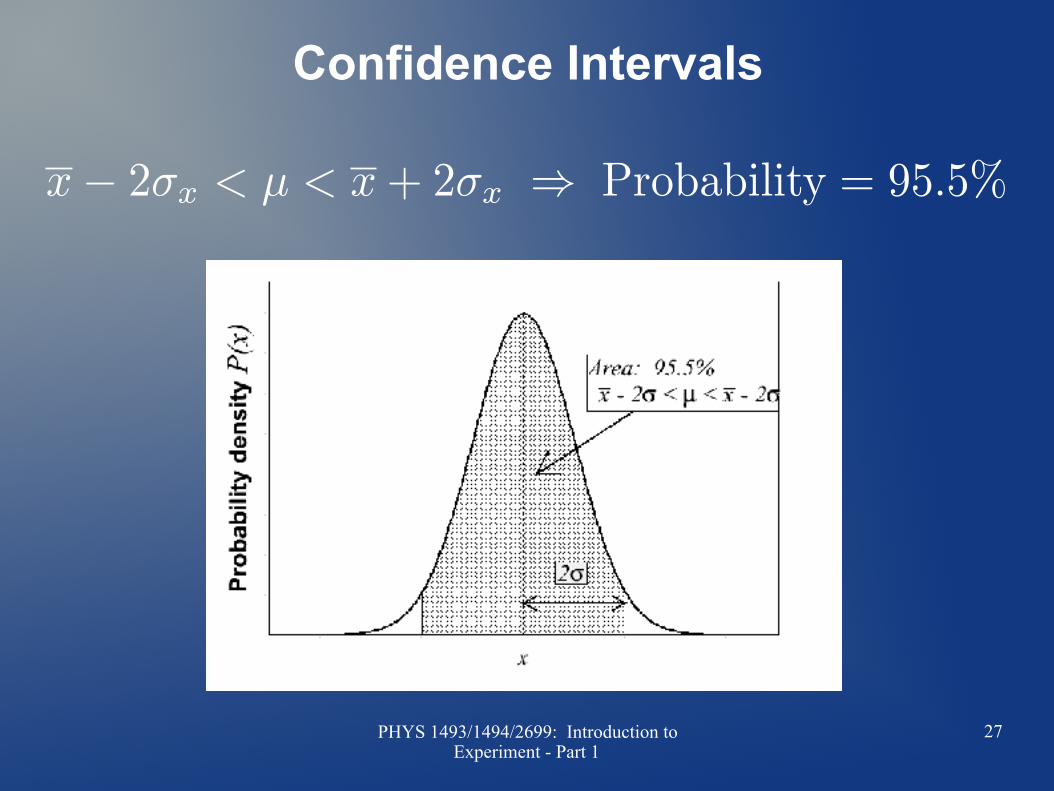
Confidence Intervals
PHYS 1493/1494/2699: Introduction to Experiment - Part 1
28
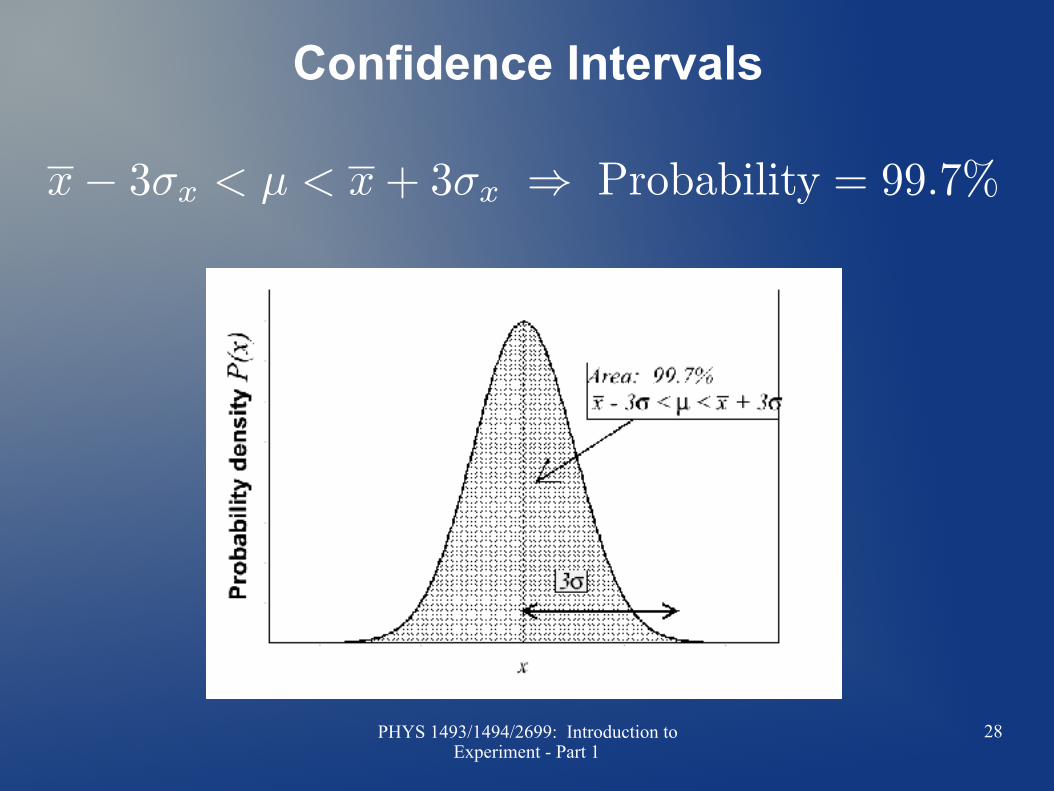
Confidence Intervals
PHYS 1493/1494/2699: Introduction to Experiment - Part 1
29
Uncertainties and Experiment
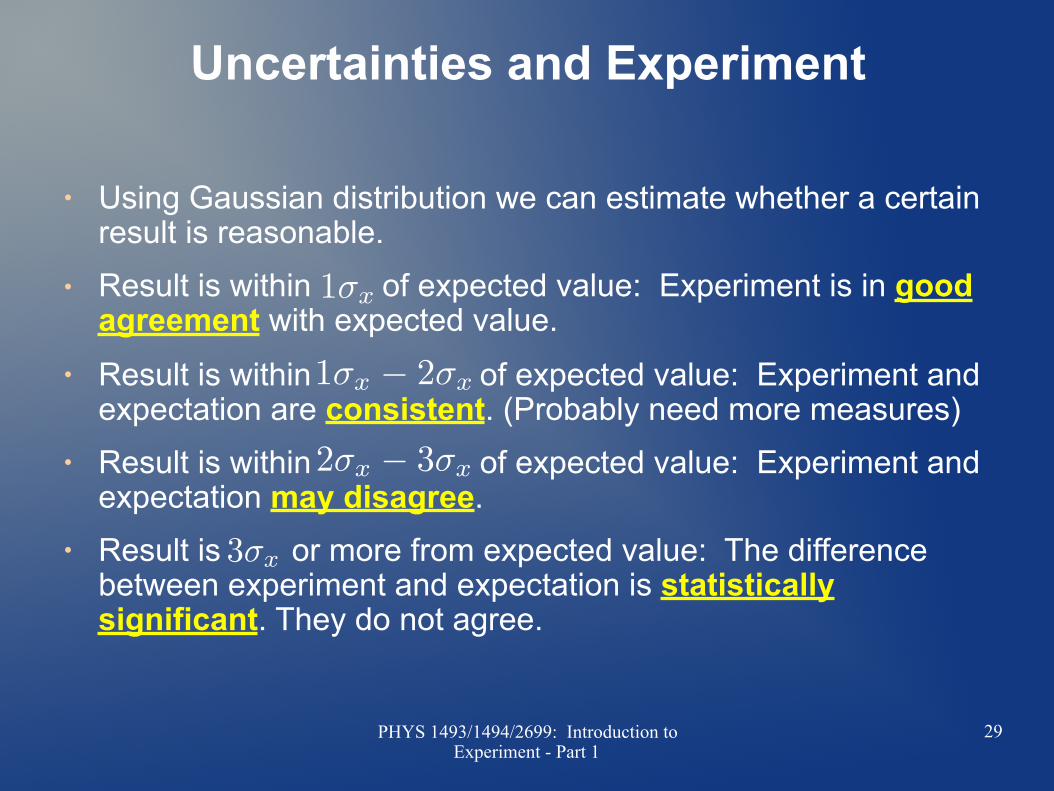
● Using Gaussian distribution we can estimate whether a certain result is reasonable.
● Result is within of expected value: Experiment is in good agreement with expected value.
● Result is within of expected value: Experiment and expectation are consistent. (Probably need more measures)
● Result is within of expected value: Experiment and expectation may disagree.
● Result is or more from expected value: The difference between experiment and expectation is statistically significant. They do not agree.
PHYS 1493/1494/2699: Introduction to Experiment - Part 1
30
Summary
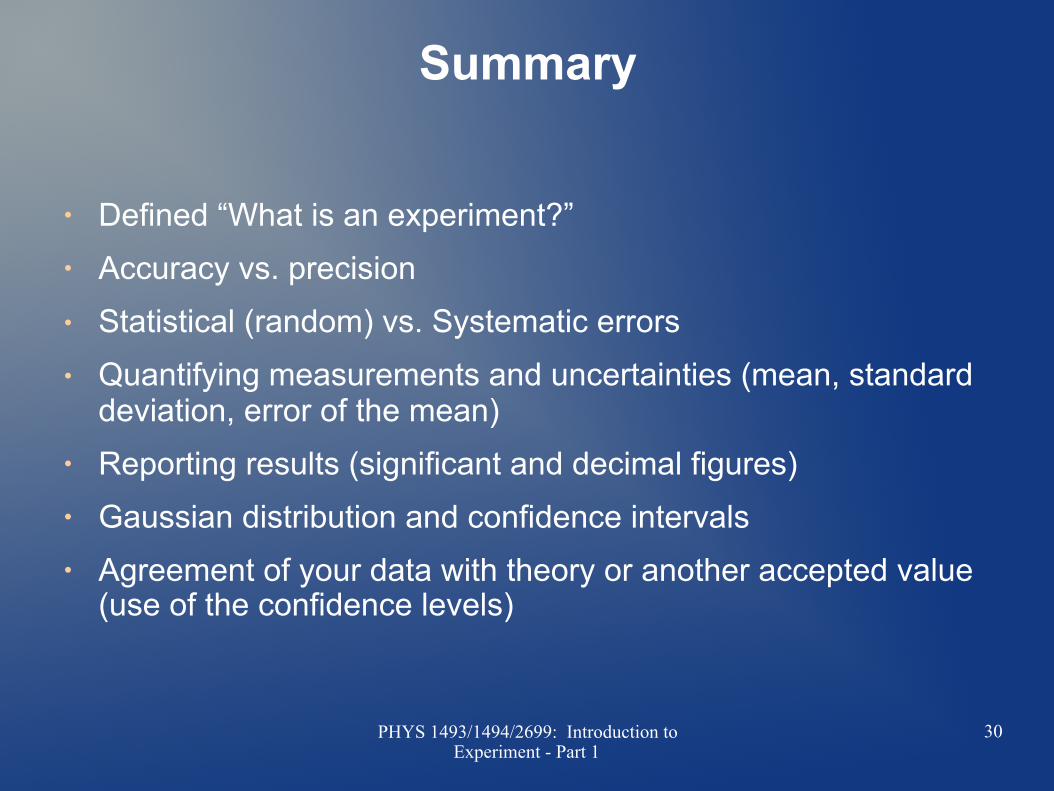
● Defined “What is an experiment?” ● Accuracy vs. precision ● Statistical (random) vs. Systematic errors ● Quantifying measurements and uncertainties (mean, standard
deviation, error of the mean) ● Reporting results (significant and decimal figures) ● Gaussian distribution and confidence intervals ● Agreement of your data with theory or another accepted value
(use of the confidence levels)
PHYS 1493/1494/2699: Introduction to Experiment - Part 1


![Alfraganus - De Scientia Astrorum (Ferrara 1493) [Low Quality]](https://img.pdfslide.us/doc/110x75/55cf984b550346d03396cb14/alfraganus-de-scientia-astrorum-ferrara-1493-low-quality.jpg)