Embed Size (px)
Citation preview
1
Introduction to Electricity 101

2
“ Is it a fact—or have I dreamt it—that, by means of electricity, the world of matter has become a great nerve, vibrating thousands of miles in a breathless point of time?‖
– Nathaniel Hawthorne, 1804-1864American Novelist
2
Introduction

33

4
• Mid-1700s—Interest in harnessing power of electricity
• 1882––First workable electric system built by Edison
at Pearl Street Station
Pearl Street Station, New York
Schenectady Museum:
Hall of Electrical History Foundation
4
The Early Years

5
Industry Formation
• 1890s—Electric utilities began to develop primarily inurban areas because of economies of scale
• Industry had characteristics of a ―natural monopoly‖
—A natural monopoly is where, for technical and social reasons, it is most efficient to have only one provider of a good or service
• Provided service regarded as vital to economic and social fabric of community (i.e., a “public utility”)
• Operated through large, integrated networks
• Highly capital-intensive
• 1907—State regulation of electric utilities began in New York and Wisconsin
– Regulation spreads to two-thirds of states by 1920
5

6
Industry Formation
• By 1920s—Most urban areas are electrified
• Exclusive utility franchises (monopoly rights) also came with an ―obligation to serve‖ all customers in the defined regions
• Limited federal regulation of multi-state utilities
Times Square, New York, 1920s6
© Corbis

7
Holding Companies
• 1920s—Many small utilities were consolidated and became parts of
larger ―holding companies‖
– Holding companies own other holding companies and operating
companies. This is a common corporate structure in many industries.
– The rapid growth, consolidation, and complexity of the utility industry
outpaced the ability of many local regulators at the time.
• 1929—Stock market crash revealed that many holding companies
were over-leveraged
– As a result, federal and state governments strengthened utility
regulation.
7
88
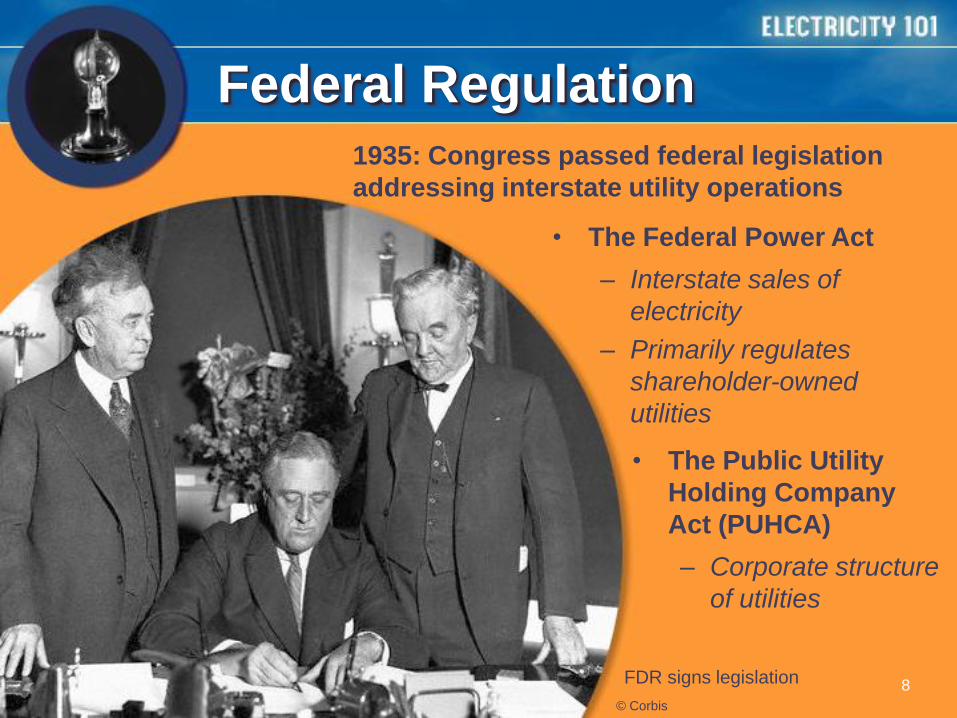
• The Federal Power Act
– Interstate sales of
electricity
– Primarily regulates
shareholder-owned
utilities
FDR signs legislation
© Corbis
1935: Congress passed federal legislation
addressing interstate utility operations
Federal Regulation
• The Public Utility
Holding Company
Act (PUHCA)
– Corporate structure
of utilities

9
Federal Regulation
• Federal and state regulatory scrutiny has grown
significantly since 1935
– The federal government regulates interstate power
sales and services; mergers; corporate structure
– State governments regulate retail electric service;
mergers; facility planning and siting
• Other federal and state laws, rules, and regulations
also apply to the electric utility industry, including,
but not limited to:
– Anti-trust laws / Dept. of Justice / FTC
– SEC requirements, including Sarbanes-Oxley
– Environmental regulations/EPA
9

10
America Electrifies 1930-1970
• Electricity finds many new applications in homes and
businesses
• New power plants are built to meet customer needs
– Because of economies of scale, electricity prices
actually go down as larger and more efficient power
plants come on line
• Transmission lines begin to connect utilities to one
another
– What we refer to today as "the grid" begins to take
shape
10
11
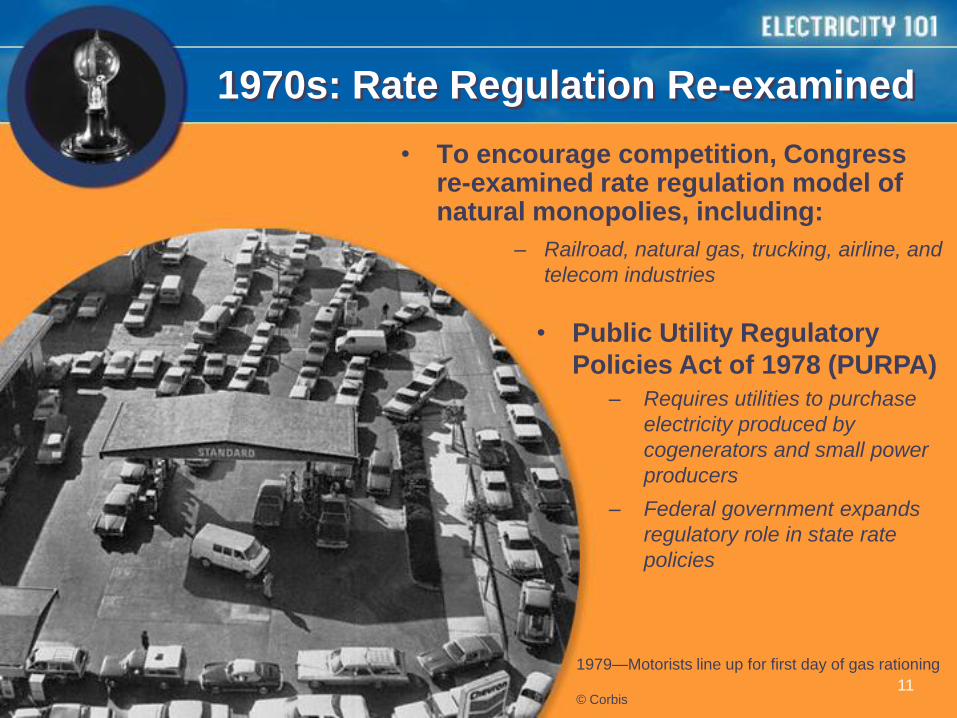
• To encourage competition, Congress re-examined rate regulation model of natural monopolies, including:
– Railroad, natural gas, trucking, airline, and
telecom industries
1979—Motorists line up for first day of gas rationing
11© Corbis
1970s: Rate Regulation Re-examined
• Public Utility Regulatory
Policies Act of 1978 (PURPA)
– Requires utilities to purchase
electricity produced by
cogenerators and small power
producers
– Federal government expands
regulatory role in state rate
policies

12
Energy Policy Act of 1992
• Creates new class of ―exempt wholesale generators‖ to sell power in competitive wholesale markets
• Expands FERC’s authority to order transmission-owning utilities to provide transmission access to other wholesale market players
• Increases energy-efficiency standards for buildings, appliances, and federal government
• Encourages development of alternative fuels and renewable energy
• Expands clean coal programs
• Reforms and streamlines nuclear plant licensing
12

13
1990s: Some States Move to Retail Choice
• During the 1990s,
a number of
states adopted
different models
to encourage
competition
among generators
to serve retail
customers
13
Status of Retail Electric Competition

14
Energy Policy Act of 2005
• Requires mandatory reliability standards
• Promotes transmission investment and facilitates
transmission siting
• Repeals PUHCA and reforms PURPA
• Promotes fuel diversity
• Increases energy efficiency
• Gives FERC stronger consumer protection,
anti-market manipulation authority
14
Electricity Initiatives:

15
Energy Independence and Security Act of 2007
• Establishes stricter efficiency standards for variety of
appliances; includes initiatives to strengthen building codes
for commercial buildings
• Includes incentives to encourage development and
production of electric drive transportation technologies,
including plug-in hybrid electric vehicles
• Expands federal RD&D program for carbon capture and
storage technologies
• Encourages deployment of smart grid technologies with
federal matching funds for investment costs
• Directs FERC to create action plan on demand response 15
Electricity Initiatives:

16
How Does the System Work?
16

1717
Electricity: It’s All About Conversions
• Energy can neither be created nor destroyed - it can only be transformed (converted) from one form to another
• Our lives are surrounded by energy conversion technologies:
– Chemical to thermal
• Home furnace using fuel oil, natural gas, or wood
– Chemical to thermal to mechanical
• Automobile engine
– Chemical to electrical
• Fuel cell
– Electrical to mechanical
• Electric motor
– Electrical to radiant
• Toaster, light bulb
• Power plants are simply energy-conversion facilities converting fuel and energy sources into electricity

18
Mega What?
• Watt (W)—The basic unit of measure of electric power. The power dissipated by a current of 1 ampere flowing across a resistance of 1 ohm.
• Kilowatt (kW)—A unit of power equal to 1,000 watts.
• Kilowatt Hour (kWh)—A unit by which residential and most business customers are billed for monthly electric use. It represents the use of one kilowatt of electricity for one hour.
– A 100-watt light bulb burning for 10 hours would use 1 kilowatt-hour of electricity.
• Megawatt (MW)—A unit of power equal to one million watts.
• Megawatt Hour (MWh)—The use of 1 million watts (or 1,000 kilowatts) of electricity for one hour. This term is used most often for large-scale industrial facilities and large population centers.
– The average U.S. household uses 11.2 MWh (11,202 kWh) of electricity every year.
• Power (measured in Watts) equals its current (measured in Amps) times its voltage (measured in Volts) or Volts X Amps = Watts.
18
19
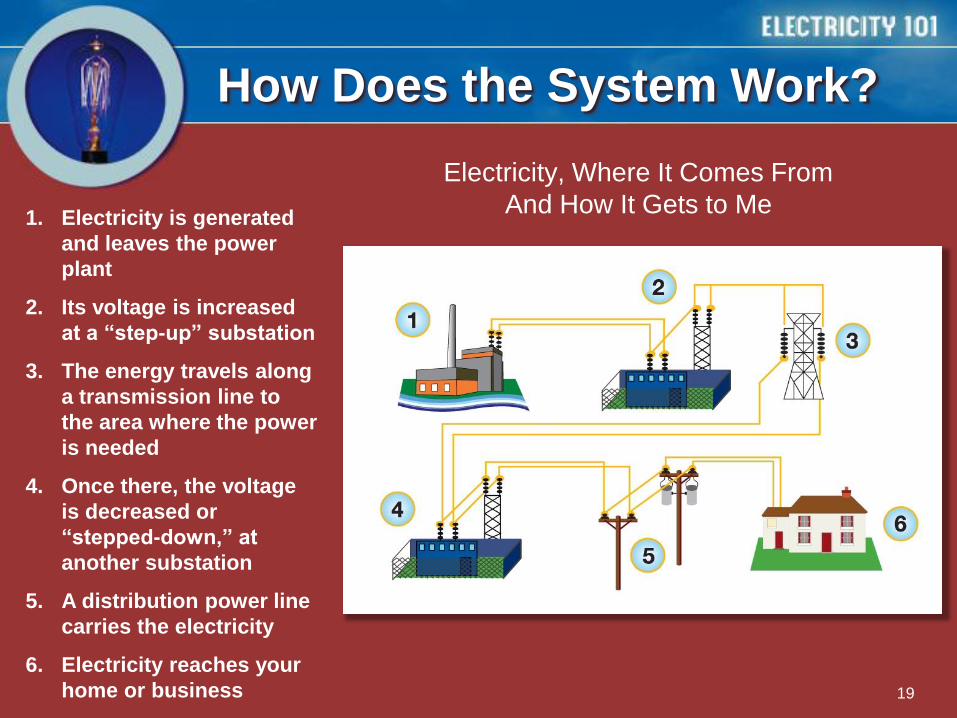
How Does the System Work?
Electricity, Where It Comes From
And How It Gets to Me
19
1. Electricity is generated
and leaves the power
plant
2. Its voltage is increased
at a ―step-up‖ substation
3. The energy travels along
a transmission line to
the area where the power
is needed
4. Once there, the voltage
is decreased or
―stepped-down,‖ at
another substation
5. A distribution power line
carries the electricity
6. Electricity reaches your
home or business

20
Generation
20
Generating Power and Getting It to the Consumer

21
Transmission
• Thick wires on tall towers carry high-voltage electricity from power plants to local communities and connect one region to another
21
22
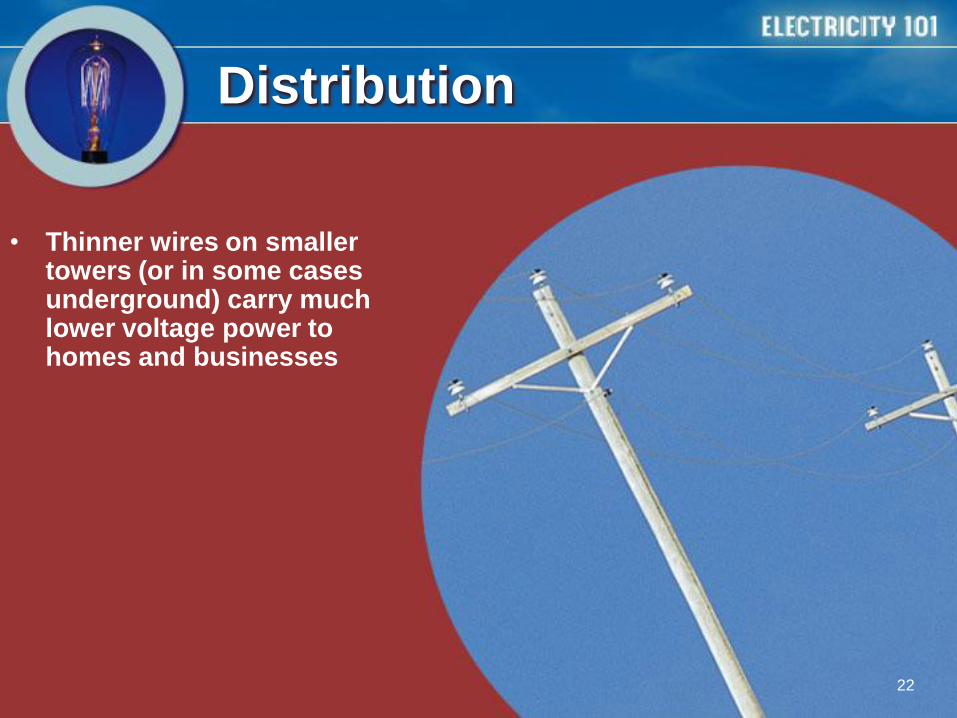
• Thinner wires on smaller towers (or in some cases underground) carry much lower voltage power to homes and businesses
22
Distribution

23
Sounds Simple, What’s the Catch?
• Electricity cannot be stored, so supply (generation) must be produced exactly when needed to meet customer demand and to avoid system failure
• Level in ―lake‖ must be kept constant at all times
• Laws of physics dictate that power flows on path of least resistance, not necessarily where we’d like it to
23
Individual ―Lake‖ Model

24
Sounds Simple, What’s the Catch?
24
―Lakes‖ Network Model

25
Industry Overview
2125

2626
• Shareholder-Owned Utilities
• Cooperatively Owned Utilities
• Government-Owned Utilities
– Federally Owned Utilities
– State-Owned
– Municipally Owned
– Political Subdivisions
Different Types of Ownership-Structure

27
Percentage of Customers Served
By Each Type of Provider
27

28
Capital Expenditures of the Shareholder-Owned
Electric Industry
• Industry continues to increase capital spending to keep pace with growing demand for electricity.
28

29
The Industry’s Record
2529

3030
Electricity & GDP
U.S. Economic Growth Is Linked to Electricity Growth

31
Increasingly Clean
31
Power Plants Reduce Emissions Despite Increasing Electricity Demand

32
Fuel Sources for Electricity Generation
Following section would incorporate Tim’s
graphics that come from the Fuel Diversity pie
chart that appears on slide 10
2832

3333
2007
National Fuel Mix
What Are the Fuels Used to Generate Electricity?
*Includes generation by agricultural waste, landfill
gas recovery, municipal solid waste, wood,
geothermal, non-wood waste, wind, and solar.
** Includes generation by tires, batteries,
chemicals, hydrogen, pitch, purchased steam,
sulfur, and miscellaneous technologies.
Sum of components may not add to 100% due to
independent rounding.
Sources: U.S. Department of Energy, Energy
Information Administration, Power Plant Report
(EIA-906), and Combined Heat and Power Plant
Report (EIA-920).
© 2008 by the Edison Electric Institute.
All rights reserved.

3434
Different Regions of the Country Use
Different Fuel Mixes to Generate Electricity
*Includes generation by
agricultural waste, landfill gas
recovery, municipal solid
waste, wood, geothermal,
non-wood waste, wind, and
solar.
** Includes generation by
tires, batteries, chemicals,
hydrogen, pitch, purchased
steam, sulfur, and mis-
cellaneous technologies.
Sum of components may not
add to 100% due to
independent rounding.
Sources: U.S. Department of
Energy, Energy Information
Administration, Power Plant
Report (EIA-906), and
Combined Heat and Power
Plant Report (EIA-920).
© 2008 by the Edison Electric
Institute. All rights reserved.

35
Fuel Diversity:
Key to Affordable and Reliable Electricity
• No individual fuel is capable of meeting all of our nation’s
electricity demands
• Maintaining the diversity of available fuel resources helps to
ensure that we do not become too dependent on one fuel
source
• Fuel diversity protects consumers from contingencies such as
fuel unavailability, price fluctuations, and changes in regulatory
practices
• Fuel prices greatly affect the price of electricity—today, fuel
costs are on the rise
35

36
• Fuel choices allow environmental impacts to be balanced and
still assure reliable, cost-effective power supply to consumers
• Any fuel source for generating electricity involves some
environmental impact
• Environmental effects can be air emissions, water quality
impacts, fish and wildlife impacts, waste disposal concerns,
and aesthetics
• Environmental impacts are significantly less than they were a
decade ago
36
Environmental Aspects of Fuel Diversity

37
Electricity Generation from Coal
• Coal is a fuel source for almost 49% of electricity generated in the United States
• Most abundant domestic energy resource—U.S. has about 25% of world’s total coal reserves (275 billion tons) and consumes 25% of world’s coal used annually
• Significant improvements in pre- and post-combustion emission reduction technology
• Like prices for other fossil fuels, coal prices are increasing, rising from $1.25/million Btu in 1999 to $1.78/million Btu in 2007
• Developing clean coal technologies, including carbon capture and storage technologies; resolving coal delivery problems; and maintaining coal’s ability to compete on costs are key drivers to future use of coal
37

38
• 21.5% of total current generation is natural gas-based; in past decade, almost 95% of new plants have been natural gas-based
• Lower emissions than other fossil fuels
• Low capital costs and regulatory barriers for other fuels make natural gas-based generation easier to site and build
• Declining production, limited access to natural gas supplies, and rising demand are causing natural gas prices to increase dramatically
• The average price electric utilities paid for natural gas rose from $2.38/million Btu in 1998 to $7.50/million Btu in 2007
• Large volumes of onshore and offshore natural gas are off limits due to moratoria, regulation
• U.S. isolated from global market and its plentiful supply and lower prices
38
Electricity Generation from Natural Gas
39
• 104 nuclear power plants in the U.S. provide 19.4% of this nation’s electricity
• Nuclear power produces no sulfur dioxide, nitrogen oxides, mercury, or carbon dioxide emissions
• Uranium is plentiful and efficient. One pellet of enriched uranium—the size of the tip of your little finger—is the equivalent of 17,000 cubic feet of natural gas, 1,780 pounds of coal, or 149 gallons of oil
• Existing nuclear power plant performance continues to improve
• High construction costs and used fuel disposal are two major challenges to building new plants
39
Electricity Generation from Nuclear

40
• 5.8% of electricity generation is from hydro—largest source of renewable energy
• Low-cost domestic fuel, emissions free, abundant in some regions, helps contribute to system reliability
• Provides flood control, navigation, irrigation, recreational opportunities, and fish and wildlife benefits
• Difficult licensing renewal process often results in generating capacity reductions and loss of flexibility to operate facility for electric reliability purposes. Energy Policy Act of 2005 contains provisions to improve the hydropower licensing process
40
Electricity Generation from Hydropower
41
• Generation from non-hydro renewables and other sources is 3.2%
• Biomass produces 1.3% of generation; wind, 0.8%; geothermal, 0.4%
• Largely CO2 emission free. (Emissions from biomass combustion are CO2-neutral to the extent that they represent atmospheric carbon fixed in plant material through photosynthesis, a process that can be repeated indefinitely.)
• Renewable technologies face high initial capital costs
• Current and future challenges include geographic limitations, intermittent nature, transmission availability, frequent expiration of production tax credit, environmental and aesthetic challenges
41
Electricity Generation from Non-Hydro Renewables

4242

43
Electricity: A Great Value
43
• The national average
price for electricity
today is less than what
it was in 1987, when
adjusted for inflation
• Even with recent price
increases, the growth
rate for electricity prices
remains comparable to,
and even lower than,
other important
consumer goods
Changes in Electricity Prices Compared
To Other Consumer Products

4444
• Fuel prices greatly
affect the price of
electricity
• Fuel prices have
risen considerably
since 1999,
particularly for
natural gas
• At the same time,
demand for
electricity continues
to grow
The Costs to Generate Electricity Are Rising
Average Cost of Fossil Fuels

45
Demand for Electricity Is Growing
• While efficiency improvements have had a major impact in
meeting national electricity needs relative to new supply,
the demand for electricity continues to increase
– According to EIA, electricity consumption is expected to increase at least 30
percent by 2030
• To meet this increasing demand, electric utilities must
invest in a new generation of baseload power plants, those
that run continuously to meet the country’s minimum
demand
– According to EIA, 240 gigawatts (GW) of new capacity will be needed by
2030
45

46
Infrastructure Investment Costs Are Growing
46
• Significant increase in investment coinciding with surge in generating capacity
– Since 2000, the electric power industry has invested more than $46 billion in nation’s transmission system
– Preliminary data indicate shareholder-owned electric companies are planning to invest $37 billion from 2007-2010
• Benefits include newer technologies, bigger markets, lower prices, reliability
Actual and Planned Transmission Investment
By Shareholder-Owned Electric Utilities

47
Environmental Compliance Costs
Are Significant
47
• All electric utilities are subject to hundreds of environmental rules, including dozens of federal and state air and water quality requirements created in the wake of the Clean Air Act and Clean Water Act
• According to the U.S. Environmental Protection Agency, complying with two federal regulations—the Clean Air Interstate Rule and the Clean Air Mercury Rule—would have cost the electric utility industry almost $50 billion between the years 2007 to 2025
– These rulemakings were recently overturned. As a result, actual costs will almost certainly be higher since replacement regulatory programs at the federal and state levels will likely be at least as stringent and likely less flexible.
• The research, design, development, and deployment of new technologies needed to reduce greenhouse gas emissions will require additional investments.

48
Price Caps Set During Industry
Restructuring Are Expiring
48
• As part of the transition to competition, many state policymakers decreed that customers’ bills would be frozen, and in many cases reduced, typically for a period ranging from two to ten years
• The first rate caps were put in place in 1997, and the last are set to expire in 2011
• As rate freezes and reductions are being phased out, many customers perceive that their rates are being ―increased,‖ when in fact they are reflecting the costs already incurred by utilities

49
What Are Utilities Doing
To Help Control Rising Prices?
• Many utilities try to ―hedge‖ or enter into long-term, fixed
contracts for fuel at set prices
– Not all companies have this option, and such forward contracts cannot
cover all fuel needs
• Utilities have increased the productivity (capacity factors)
of their power plants while at the same time decreasing
their operations and maintenance costs
• Electric utilities have taken a leading role in developing
energy efficiency and demand response programs for
residential, commercial, and industrial customers
– Between 1989 and 2006, electric utility efficiency programs saved about
860 billion kilowatt-hours of electricity—enough electricity to power nearly
76 million average U.S. homes for one year
49

5050

5151
Electricity Use in the Typical U.S. Home
Annual Electricity Use in the Typical U.S. Home
Has Increased 60% Since 1970

5252
Residential Electricity Use by End Use
• A typical U.S. household
uses 934 kilowatt-hours
of electricity a month.

5353
• Greater demand for electric power does not translate
directly into higher household expenditures
• The average American household’s total spending on
electricity has fallen steadily over time
Average Household Expenditures

54
Key Challenges
• Natural gas supply
• Fuel diversity
• Environmental policy
• Coal transportation
• Rising costs of doing business
• Need for increasing infrastructure investment
54

55
• Electric utilities are entering a new cycle of growth
and investment, and a new era of ratemaking
• If utilities are able to make investments in
infrastructure improvements, benefits will include:
– Long-term reductions in operating costs
– Enhancements of reliability and power quality
– Improvements in competitive power markets
– Cleaner generation
– Increased customer choice and control over energy use
55
Investing in America’s Electric Future

56
Edison Electric Institute (EEI) is the association of U.S.
shareholder-owned electric companies. Our members serve 95
percent of the ultimate customers in the shareholder-owned
segment of the industry, and represent approximately 70 percent of
the U.S. electric power industry. We also have more than 65
International electric companies as Affiliate members, and more than
170 industry suppliers and related organizations as Associate
members.
Organized in 1933, EEI works closely with all of its members,
representing their interests and advocating equitable policies in
legislative and regulatory arenas. In its leadership role, EEI
provides advocacy, authoritative analysis, and critical industry data
to its members, Congress, government agencies, the financial
community and other opinion-leader audiences. EEI provides
forums for member company representatives to discuss issues and
strategies to advance the industry and to ensure a competitive
position in a changing marketplace.
For more information on EEI programs and activities, products and
services, or membership, visit our Web site at www.eei.org.
56