Embed Size (px)
Citation preview

Introduction to Developers DiversifiedNovember 2006

2
Developers Diversified (NYSE: DDR)
Large and growing retail shopping center platform
Outstanding financial performance
Major landlord to nation’s leading retailers
Excellence in design, retail mix and tenant relations
The leading owner, developer and manager of market-dominant community shopping centers

3

4
Joe PadanilamSVP of
Acquisitions &Dispositions
Scott WolsteinCEO
David JacobsteinPresident & COO
Bill SchaferExecutive VP and
CFO
Joan AllgoodExecutive VP
CorporateTransactions &Governance
Richard BrownExecutive VP of
International
David WeissSVP and General
Counsel
Michelle DawsonVP of Investor
Relations
Daniel HurwitzSenior Executive
VP & CIO
TBDVP of NewBusiness
Development
Scott SchroederVP of Marketing &
CorporateCommunications
Robin Walker-GibbonsExecutive VP of Leasing
Ken SternVP of Peripheral
Development
Dan HermanSVP of
Development East
Stan HoffmanVP of
Development West
John SabatosVP of Construction
Dale JohnsonVP & Corp.Controller
Francine GlandtVP of Capital
Markets &Treasury
Craig SchultzVP of Tax
David FavoriteVP of PropertyManagement/Community
Centers
John KokinchakSVP of Property
Management
LorraineMcGlone
VP of InformationTechnology
Neal InfanteVP & Property
Controller
Tim BruceExecutive VP ofDevelopment
Nan ZieleniecSVP of Human
Resources
Marc HaysSVP of Leasing
Specialty Centers
Erik ChristopherVP of Development
Leasing
Bill ReadVP of Leasing
Southeast Region
Francis GonzalezVP of PropertyManagementPuerto Rico
Eddie SullivanVP of PropertyManagement
Mid Atlantic Region
Christa VesySVP and Chief
Accounting Officer
David DieterleSteven Dorsky
Anthony VodickaSVPs of Leasing
Management TeamDeep executive bench with broad industry expertise

5
Management Team Average tenure for EVPs and above is 12 years with Developers Diversified and 23 years in retail real estate
(1) Affiliated with pre-IPO entity. IPO in February 1993.
Scott A. Wolstein CEO & Chairman 25 25David M. Jacobstein Pres. & COO 7 21Daniel B. Hurwitz Sr. EVP & CIO 7 20Joan U. Allgood EVP-Corporate 19 24
Transactions & Governance Richard E. Brown EVP-International 7 26Timothy J. Bruce EVP-Development 4 20William H. Schafer EVP & CFO 14 22Robin R. Walker-Gibbons EVP-Leasing 11 25
Name TitleYears with Company
Years in Industry
(1)
(1)
(1)
Total Years 94 183

6
Developers Diversified - Post IRRETI MergerKey Facts
Total Market Cap $15.3B
Total Franchise Value $21.8B
Corporate Credit Ratings BBB/Baa2
Number of Retail Properties 809
GLA 162 msf
Number of States 45 plus Puerto Rico and Brazil
Development Pipeline $3.5B plus additional $1.5B under
preliminary pursuit
Long Term Avg. Leased Rate 96%
5 Year Annualized Total Return as of 3Q06 33%
Dividend Growth (2002-2006) 55%
Included in S&P 400

7
1965 Developers Diversified began as Developers Diversified Group (DDG) in 1965 when Bert L. Wolstein formed the Company to develop community shopping centers anchored by Kmart.
1977 DDG expanded its activities to include the development of community shopping centers anchored by JCPenney in the upper Midwest.
1981 The Company’s principals formed Diversified Equities Limited Partnership, which led DDG into an era of acquisition and equity capital formation.
1993 On February 2, 1993, Developers Diversified Realty Corporation began operating as a publicly traded Real Estate Investment Trust (REIT).
1995 Developers Diversified’s portfolio dramatically increased when it acquired a community shopping center portfolio previously owned by Homart Development.
1998 The portfolio received another boost In 1998 when the Company acquired three more community center portfolios, expanding its presence in Ohio, Utah and Missouri.
Developers Diversified Company History
GLA: 27 msf
Properties: 106
Employees: 133
GLA: 17 msf
Properties: 53
Employees: 75
GLA: 42 msf
Properties: 159
Employees: 230

8
2001 The Company announced the acquisition of 10 properties from Burnham Pacific (NYSE: BPP). Developers Diversified also acted as liquidation agent for the remainder of the BPP portfolio.
2002 Developers Diversified and joint venture partners KlaffRealty and Lubert Adler Funds were awarded designation rights to the Service Merchandise retail assets.
2003 In March 2003, Developers Diversified and JDN Realty (NYSE: JDN) merged, creating one of the largest open-air shopping center companies in the country.
2004 Developers Diversified acquired a portfolio of 107 shopping centers from Benderson Development, positioning it as the largest owner and operator of community shopping centers in the U.S. The Company was also added to the S&P 400 index of mid cap stocks.
2005 Developers Diversified celebrated its 40th anniversary. The Company acquired 15 shopping centers in Puerto Rico. Also, Developers Diversified and joint venture partner Macquarie DDR Trust acquired 37 Mervyns stores.
2006 Developers Diversified acquired a 50% interest in Sonae Sierra Brazil, a fully integrated retail real estate company based in Sao Paulo. Announced $6.2B acquisition of Inland Retail Real Estate Trust, $3.0B to be placed in new JV with TIAA-CREF.
Developers DiversifiedCompany History
GLA: 57 msf
Properties: 228
Employees: 353
GLA: 58 msf
Properties: 286
Employees: 368
GLA: 83 msf
Properties: 362
Employees: 461
GLA: 103 msf
Properties: 458
Employees: 551
GLA: 113 msf
Properties: 496
Employees: 574
GLA: 162 msf
Properties: 809
Employees: 649

9
Successful financing, execution and integration of large portfolio acquisitions is a core competency
$3
$5
$7
$9
$11
$13
$15
$17
$19
$21
$23
4Q02 4Q03 4Q04 4Q05 Post IRRETIMerger
280
360
440
520
600
680
760
840
Total Franchise ValueNumber of Properties
• 286 Assets • 58 MSF • $5.0B TFV
• 362 Assets • 83 MSF • $7.6B TFV
• 458 Assets • 103 MSF • $11.4B TFV
• 496 Assets • 113 MSF • $13.9B TFV
Tota
l Fra
nchi
se V
alue
($ B
illion
s)
Num
ber of Properties
Caribbean Property
Group
Mervyns
BendersonDevelopment
JDN Realty
• March 2003 • $1.0 Billion • 81 Properties 15MSF • 21 Developments
7MSF
• 809 Assets • 162 MSF • $21.8B TFV
Sonae Sierra Brazil
• May-Dec. 2004 • $2.3 Billion • 107 Properties • 18 MSF
• January 2005• $1.2 Billion• 15 Properties • 5 MSF
• September 2005 • $396 Million• 36 Properties • 3 MSF
• October 2006 • $150 Million• 9 Properties • 3 MSF
Inland RetailReal Estate Trust, Inc.
• 1Q07 • $6.2 Billion • 307 Properties • 44 MSF

10
Although we have sometimes moved against conventional wisdom, our investment strategy has paid off
Pursue market-dominant community centersConsumers’ preferred retail venueRetail format with strongest tenant demandStrongest combination of value and convenience
Pursue developmentGreatest opportunity to create valueIn-house expertise creates control and flexibility
Pursue joint venturesPreserves capital and enhances financial flexibilityCreates fee streams and promoted interestsGenerates higher ROE than on-balance sheet structures

11
Our community center portfolio quality leads our peer group, based on quality real estate and premier tenancy
Portfolio is comprised of many of the most successful community center assets in the U.S.
Strong asset demographics Nearly 80% of space is located in the top 50 U.S. metro markets
Top landlord to the nation’s most successful retailersHighest credit quality tenancy among shopping center REITs

12
Developers Diversified – Post IRRETI Merger Over 800 shopping centers comprising 162 msf, located in 45 states plus Puerto Rico and Brazil
Puerto Rico
15.7 msf9.7%
10.7 msf6.6%
17.6 msf10.9%
16.2 msf10.0%
10.5 msf6.5%
4.9 msfTotal GLA by State
More than 5.0 MSF+1.0 – 5.0 MSF Less than 1.0 MSF
Brazil
3.4 msf

13
RemarksPlanned opening stores in 2006 (Store Growth)Tenant
Plan to increase store count from 750 to 1,300
80 stores (11%)Bed Bath & Beyond
Will open 100 stores in 2007100 stores (12%)PETsMART
Will open 500 stores over the next 5 years80 stores (11%)Kohl’s
Will open 500 stores by 2010N/AHome Depot
Will open 150 stores in 2007150 stores (12%) Lowe’s
Will open 80 stores in 4Q06 through 2Q07 110 stores (8%)Target
Real estate committee approved 1,500 new locations; plan to remodel 1,800 existing stores
340 stores (11%)Wal-Mart
We are the largest landlord to the nation’s most successful retailers
JC Penney N/A Will open 170 stores and renovate 250 others over the next 4 years

14
Wal-Mart / Sam’s Club 114 17.7 54 7.7 60 10.0 Target 64 8.4 10 1.3 54 7.1Lowe’s Home Imp. 43 5.4 23 2.8 20 2.6Home Depot 44 4.7 17 1.6 27 3.1 Kohl’s 41 3.5 37 3.2 4 0.3The TJX Companies 96 3.1 96 3.1 0 0.0Mervyns 40 3.1 39 3.0 1 0.1Kmart / Sears 27 2.8 25 2.4 2 0.4Publix 59 2.7 58 2.7 1 0.0Tops Markets 40 2.5 39 2.4 1 0.1Total Top 10 Tenants 53.9 30.1 23.7
Total Units
Total GLA (millions)
Owned Units
Owned GLA (millions)
UnownedUnits
Unowned GLA (millions)
Developers Diversified – Post IRRETI MergerLargest Tenants by Total GLA

15
Developers Diversified – Post IRRETI MergerLargest Tenants by Pro Rata Rents
Wal-Mart / Sam’s Club 54 $41.4 4.1%
Publix 58 21.9 2.1%
PETsMART 101 19.7 1.9%
The TJX Companies 96 18.5 1.8%
Tops Markets 39 17.0 1.7%
Mervyns 39 17.0 1.7%
Lowe’s Home Imp. 23 15.5 1.5%
Circuit City 42 15.2 1.5%
Kohl’s 37 14.5 1.4%
Bed Bath & Beyond 55 14.3 1.4%
Top Ten Tenants $194.9 19.1%Total Portfolio $1,021.4 100.0%
Owned Units
Total Base Rent ($m)
% ofTotal Rent

16
Base Rent: Total Portfolio & Inline Shops (< 20,000 sf)
Our portfolio is resistant to economic changes, store closings and tenant bankruptcies
$3.00
$6.00
$9.00
$12.00
$15.00
$18.00
19871991
19951999
2003
80%
85%
90%
95%
100%
19871991
19951999
2003
Percentage Leased
3Q06
3Q06
Total PortfolioInline Shops

17
$18.0$20.0
$14.6
$0.7
$6.2$4.8
$3.4$2.8
$1.6
$0.0
$2.0
$4.0
$6.0
$8.0
$10.0
$12.0
$14.0
$16.0
$18.0
$20.0
1999 2000 2001 2002 2003 2004 2005 2006 2007
Ancillary IncomePuerto Rico assets anticipated to contribute +$7.0M annually
Rev
enue
s ($
Mill
ions
)
(Estimated)Department Created
CompoundAnnualized
Growth Rate +50%

18
Total Market Capitalization
$0
$2
$4
$6
$8
$10
$12
$14
$16
1993
1994
1995
1996
1997
1998
1999
2000
2001
2002
2003
2004
2005
Has grown 25.5x, from $0.6 million at IPO to over $15 billion
Mar
ket C
apita
lizat
ion
(Bill
ions
)$15.3
Post IR
RETI
Merge
r

19
(1) Based on publicly disclosed earnings guidance.(2) Based on annualized 3Q06 dividend of $0.59 per share.
Earnings and Dividend Per Share GrowthFFO per share has grown by 4x and dividends have grown by 3x since IPO
1993
1994
1995
1996
1997
1998
1999
2000
2001
2002
2003
2004
2005
2006
$0.00
$0.50
$1.00
$1.50
$2.00
$2.50
$3.00
$3.50
FFO (diluted) / Share
Dividends / Share
$3.38 - $3.42 (1)
$2.36 (2)

20IPO
2/9
3
4Q93
4Q94
4Q95
4Q96
4Q97
4Q98
4Q99
4Q00
4Q01
4Q02
4Q03
4Q04
4Q05
Cur
rent
$10.00
$15.00
$20.00
$25.00
$30.00
$35.00
$40.00
$45.00
$50.00
$55.00
Stock PriceReaches 5xIPO Price
Sto
ck P
rice
Developers Diversified Stock Price(NYSE: DDR)
2x1 Stock Split
August 1998
$60.00
$65.00

21
Competitive Performance

22
Five Year Annualized Total Returnas of December 31, 2005
(1) Strip center peer group includes FRT, KIM, NXL, PNP, REG, WRI. HTG does not have a five year history.
37.0%
26.8%
20.0% 25.0% 30.0% 35.0% 40.0%
DevelopersDiversified
PeerGroup (1)
(1)

23
Five Year Annualized Dividend Growthas of December 31, 2005
8.5%
3.9%
0.0% 2.0% 4.0% 6.0% 8.0% 10.0%
DevelopersDiversified
PeerGroup

24
Five Year Annualized FFO Growthas of December 31, 2005
8.0%
5.7%
4.0% 5.0% 6.0% 7.0% 8.0%
DevelopersDiversified
(1)Peer
Group

25
AFFO as a Percentage of FFO High tenant recovery of building maintenance costs, limited T.I.’s and a salaried, in-house leasing staff
AFFO as a % of FFO
94%
84%
75% 85% 95%
DevelopersDiversified
(1) Reflects adjustments for straight line rent and recurring capital expenditures. Developers Diversified’sfigures include amounts for joint ventures. Source: company reports.
(1)
PeerGroup

26
22.0%
17.0%
12.0% 16.0% 20.0% 24.0%
DevelopersDiversified
Five Year Annualized NAV Growthas of December 31, 2005
Source: Greenstreet Advisors, as reported by Forbes, SNL Financial, Realty Stock Review.
PeerGroup

27
23.7%
13.4%
10.0% 15.0% 20.0% 25.0%
DevelopersDiversified
Five Year Annualized Growth in Gross Book Value of Real Estate Assetsas of December 31, 2005
(1) Gross book value of consolidated and unconsolidated joint venture real estate assets. If gross figureswere not available, net book values were used.
(1)
PeerGroup

28
Development Expertise

29
Development has always been one of our core competencies
Our development pipeline is driven by tenant demand for new product
Mall-based retailers are migrating to open air format, where occupancy costs are significantly lowerTraditional community center tenants continue to grow their portfolios by 8% - 12% annually
Our national platform effectively sources and evaluates potential opportunities
In-house development team manages risk throughout development process
Our tenant relationships efficiently provide market intelligenceLeasing and development teams collaborate throughout development process

30
Developments Over the last five years alone, we have developed 39 projects across the U.S. representing a variety of retail formats
2005 $157.9 3,002,9872004 312.9 1,963,4202003 330.2 3,250,8922002 216.4 2,092,9622001 384.1 3,732,996
14,043,257Total
Year Substantially
Completed GLANet Project Cost
(Millions)
$1,401.5

31
Lifestyle and Hybrid Center Portfolio Growing demand driven by migration of tenants to open air format
1. Los Angeles (Pasadena), CA 556,9612. Denver (Littleton), CO 255,1843. Kansas City (Leawood), KS 490,0304. Chicago (Deer Park), IL 471,0845. San Antonio, TX - construction in progress 665,2296. Dallas (Allen), TX - construction in progress 429,8737. Detroit (Bloomfield Hills), MI - pipeline 602,1378. Guilford, CT - pipeline 154,9119. Southern Pines, NC - pipeline 635,700
4,261,109Total
Location GLA
(1)
(1) Acquired through joint venture.

Paseo Colorado - Pasadena, CA

Aspen Grove - Littleton, CA

Aspen Grove - Littleton, CA

Town Center Plaza - Leawood, KS

Town Center Plaza - Leawood, KS

Deer Park Town Center - Deer Park, IL

Village at Stone Oak - San Antonio, TX

39
Mixed Use Developments Land scarcity in key markets is creating increased focus on efficient land use
1. Los Angeles (Long Beach, CityPlace), CA Residential (complete) 2. Los Angeles (Long Beach, The Pike), CA Residential (complete), Hotel (pipeline)3. Miami, FL Residential (in progress)4. Raleigh (Apex), NC Office and Residential (pipeline)5. Seattle (Kirkland), WA Office, Residential, Hotel (pipeline)6. Columbus (Dublin), OH Office, Residential, Hotel (pipeline)7. Chicago (Deer Park), IL Office (pipeline)8. Southern Pines, NC Office and Residential (pipeline)9. Dallas (Allen), TX Office, Residential, Hotel (pipeline)10. Detroit (Bloomfield Hills), MI Office and Residential (pipeline)11. Pittsburgh (Mt. Nebo), PA Hotel (pipeline)12. Freehold, NJ Hotel (pipeline)13. Boise (Nampa), ID Hotel (pipeline)14. Kansas City (Merriam), KS Hotel (pipeline)
Location Uses (Status)

CityPlace - Long Beach, CA

The Pike at Rainbow Harbor - Long Beach, CA

The Shops at Midtown Miami - Miami, FL

The Shops at Midtown Miami - Miami, FL

Beaver Creek Commons - Apex, NC

Nampa Gateway Center - Nampa, ID

46
Urban Infill and Brownfield Developments Complex developments require expertise in entitlements and public assistance
1. Los Angeles (Long Beach - CityPlace), CA 295,3092. Los Angeles (Long Beach - The Pike), CA 215,9123. Boston (Everett), MA 639,8074. Miami, FL - construction in progress 634,2115. Horseheads, NY - construction in progress 699,1636. Seabrook, NH - pipeline 398,8057. Ukiah, CA - pipeline 665,3998. Boston (Norwood), MA - pipeline 95,242
Location GLA
3,643,848Total

47
International/Offshore Investments

48
Puerto Rico PortfolioOffshore experience has been highly successful
Portfolio Overview$1.2 billion acquisition (Jan. 2005)15 operating retail assets (4.9 MSF)3 of the 10 largest shopping centers and 13 of the 50largest shopping centers in Puerto Rico
Profitable component of overall portfolio (based on proportionateshare ownership of JV assets)
14% of Total Revenues 15% of Net Asset Value8% of Total GLA

49
Brazil Portfolio
Portfolio Overview$150 million acquisitionNine shopping malls (3.4 msf) and property management companySecond largest retail portfolio in Brazil66% of investment concentrated in the largest shopping mall under one roof in South AmericaIntent to double investment through development and third party acquisitions over the next three years
Retail Market OverviewFavorable economic, demographic and consumer trends Highly fragmented retail real estate ownershipSignificant cap rate compression anticipated as market evolves
50% joint venture interest in Sonae Sierra Brazil, a fully integrated retail real estate company based in Sao Paulo

50
Joint Venture Relationships
51
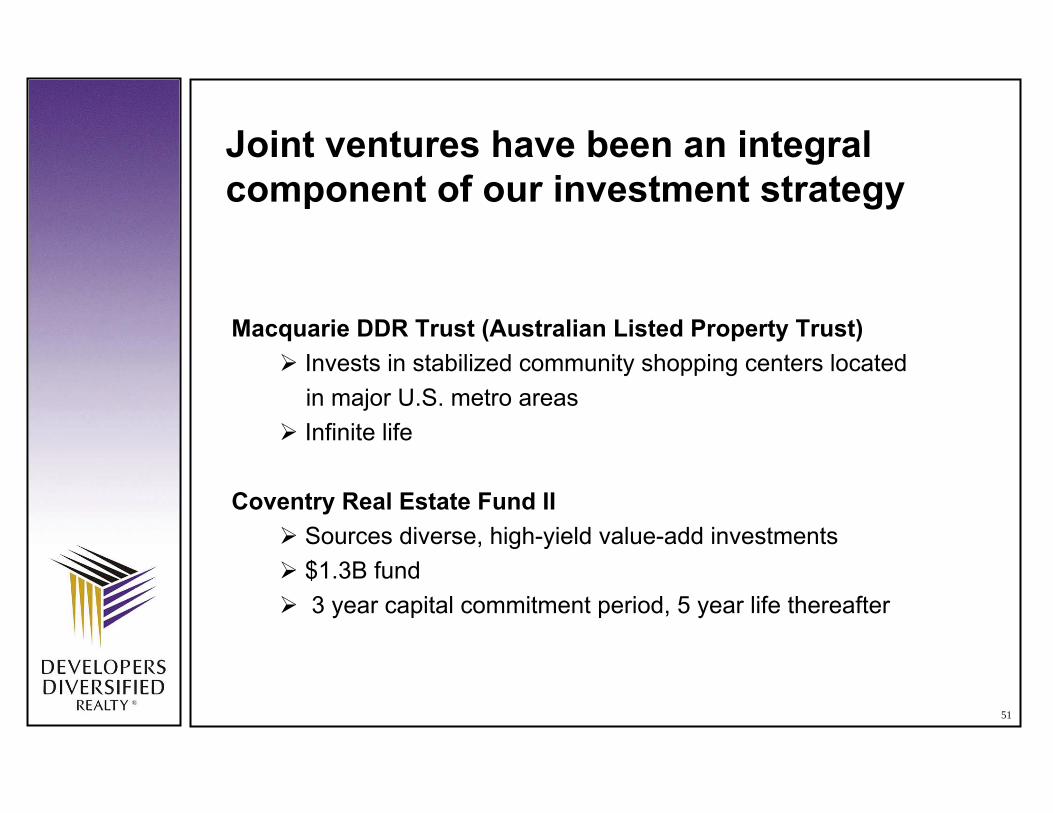
Joint ventures have been an integral component of our investment strategy
Macquarie DDR Trust (Australian Listed Property Trust)Invests in stabilized community shopping centers locatedin major U.S. metro areas Infinite life
Coventry Real Estate Fund II Sources diverse, high-yield value-add investments $1.3B fund3 year capital commitment period, 5 year life thereafter
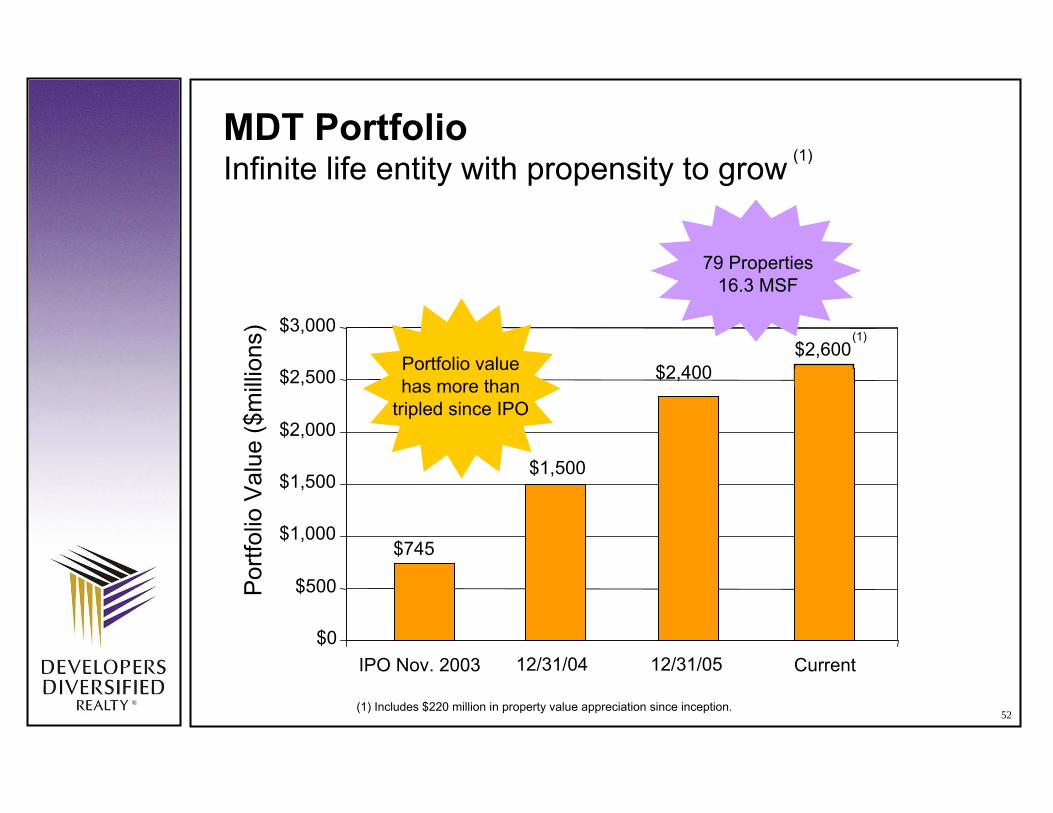
52
$745
$1,500
$0
$500
$1,000
$1,500
$2,000
$2,500
$3,000
IPO Nov. 2003 12/31/04 12/31/05
Por
tfolio
Val
ue ($
mill
ions
)
(1) Includes $220 million in property value appreciation since inception.
Portfolio value has more than
tripled since IPO
79 Properties16.3 MSF
$2,400
MDT PortfolioInfinite life entity with propensity to grow
Current
(1) $2,600
(1)

53
Our Coventry Fund II investments aggregate $1.3Bin anticipated project costs and over 8.4 MSF
TOTAL
535353
$1,2758,435,000
200$2,748,000Re-positioningNationwide10. Service Merchandise
270$730,000Development JVBloomfield Hills, MI
$
$
$
$
$
$
$
$
$
130420,000Development JVDallas, TX9. Watters Creek
39220,000Asset Re-positioningBenton Harbor, MI8. Fairplain Plaza
2201,300,000Mall Re-positioningCincinnati, OH7. Tri-County Mall
35308,000Development JVKansas City, MO6. Merriam Village
96737,000Mall Re-positioningAnaheim, CA5. Buena Park Downtown
40230,000Development JVSan Antonio, TX4. Westover Marketplace
85715,000Mall Re-developmentPhoenix, AZ3. Phoenix Spectrum
80290,000Mall Re-developmentSeattle, WA2. Totem Lakes Malls
66737,000Mall Re-developmentKansas City, MO1. Ward Parkway
Anticipated Project Cost ($Millions)SFInvestment TypeLocationAsset
11. Bloomfield Park
14$PendingPending12. Pending

54
Kuwait Financial Centre (80%)
$ 27.5Paradise Village; Phoenix, AZ
Churchill Family Trust (33%)
$ 202.413 grocery-anchored centers
$ 167.47 centers in CA, FL, IN, OH and VA
Kuwait Financial Centre (80%)
$ 6.61 MO centerSansone Group (50%)
$ 25.51 OH centerState Teachers Retirement Board of Ohio (50%)
$ 25.91 OH centerCasto Properties (20.55%)
$ 21.01 OH centerCasto Properties (50%)
$ 266.26 centers in AZ, MN, OR and TXDRA Advisors (50%)
$ 130.412 grocery-anchored centersPrudential Real Estate Investors (90%)
$ 33.9Shops at Techridge; Austin, TXPrudential Real Estate Investors (74.25%)
Coventry Real Estate Partners (1%)
$ 121.03 centers in CA and WA Prudential Real Estate Investors (79%)
Coventry Real Estate Partners (1%)
$ 84.0 Deer Park Town Center; Deer Park, IL
Prudential Real Estate Investors (74.25%)
Coventry Real Estate Partners (1%)
UndepreciatedBook Value
(in millions)AssetsPartner & Ownership %
Other Joint Ventures
$ 71.1
$ 224.5
$ 240.0
$ 7.1
$ 49.9
$ 54.0
$ 59.9
$ 398.0
$ 145.6
$ 62.0
$ 160.0
$ 140.0
158.55%
10.92%
43.37%
6.82%
95.69%
108.49%
185.24%
49.51%
11.66%
82.98%
32.23%
66.67%
FMV (in millions)
TOTALS $ 1,111.80 $ 1,612.10 45.00%
% Change(1)
(1) Fair market value is based on market-based cap rates.


56
We have strengthened our competitive position through a series of strategic acquisitions
$3
$5
$7
$9
$11
$13
$15
$17
$19
$21
$23
4Q02 4Q03 4Q04 4Q05 Post IRRETIMerger
280
360
440
520
600
680
760
840
Total Franchise ValueNumber of Properties
• 286 Assets • 58 MSF • $5.0B TFV
• 362 Assets • 83 MSF • $7.6B TFV
• 458 Assets • 103 MSF • $11.4B TFV
• 496 Assets • 113 MSF • $13.9B TFV
Tota
l Fra
nchi
se V
alue
($ B
illion
s)
Num
ber of Properties
BendersonDevelopment
Caribbean Property Group
JDN Realty
• 809 Assets • 162 MSF • $21.8B TFV
• March 2003 • $1.0 Billion • 81 Properties, 15 MSF • 21 Development
Properties, 7 MSF
• May-December 2004 • $2.3 Billion • 107 Properties • 18 MSF
• January 2005• $1.2 Billion• 15 Properties • 5 MSF
Inland Retail 1Q07
• $6.2 Billion • 307 Properties • 43.6 MSF