Embed Size (px)
Citation preview
SECURITY ANALYSIS:Developers Diversified
September 2003
James W. Sullivan
Managing Director
Senior Real Estate Analyst
Prudential Equity Group, Inc.
2
• Funds Flow Operations (FFO) = net income plus real estate depreciation.
• Funds Available For Distribution (FAD) = FFO less non-revenue generating capex.
• Retained Free Cash Flow (FCF) = FAD less dividends on common and dilutive convertible preferred.
REIT METRICS
Security Analysis
Developers Diversified
Security Analysis
3
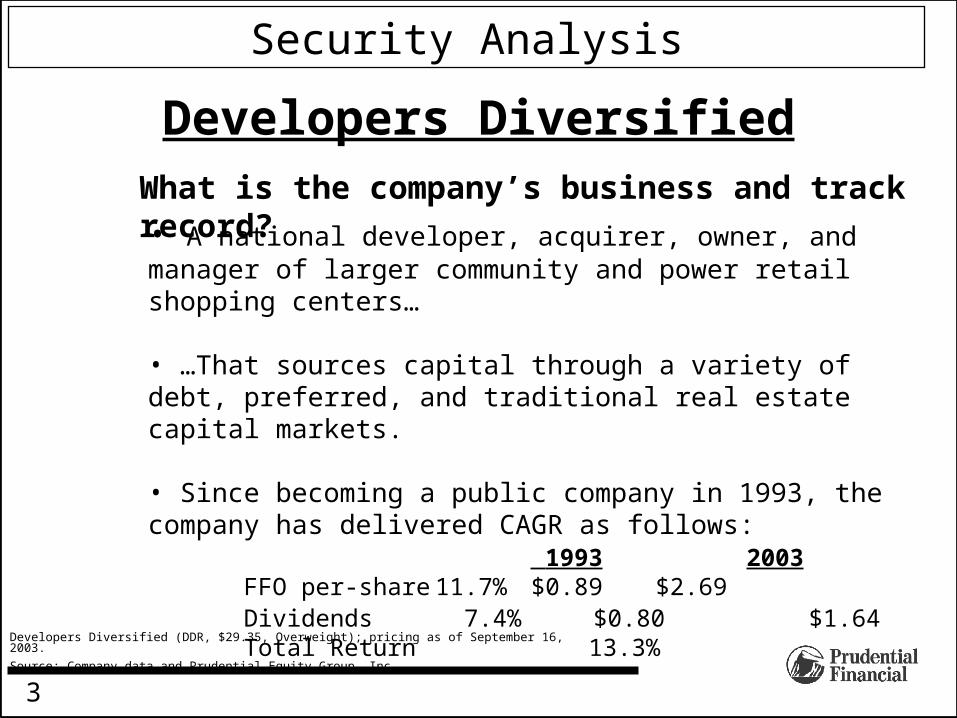
What is the company’s business and track record?
Developers Diversified (DDR, $29.35, Overweight); pricing as of September 16, 2003.
Source: Company data and Prudential Equity Group, Inc.
• A national developer, acquirer, owner, and manager of larger community and power retail shopping centers…
• …That sources capital through a variety of debt, preferred, and traditional real estate capital markets.
• Since becoming a public company in 1993, the company has delivered CAGR as follows:
1993 2003FFO per-share 11.7% $0.89 $2.69Dividends 7.4% $0.80 $1.64Total Return 13.3%
Growth Model
4
Security Analysis
• Internal Growth
• FCF
• External growth
• Ancillary and other income sources
• Net Operating Margins
• Financing activities
Developers Diversified
5
Real Estate Investment Trust (REITs)Security Analysis
Developers Diversified
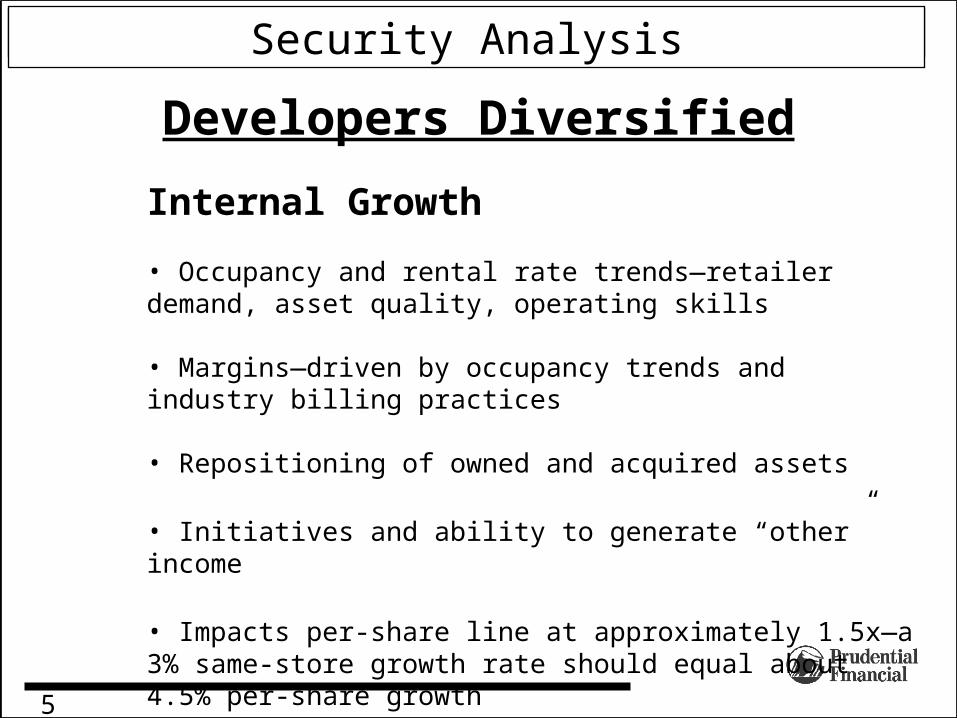
Internal Growth
• Occupancy and rental rate trends—retailer demand, asset quality, operating skills
• Margins—driven by occupancy trends and industry billing practices
• Repositioning of owned and acquired assets
• Initiatives and ability to generate “other” income
• Impacts per-share line at approximately 1.5x—a 3% same-store growth rate should equal about 4.5% per-share growth
6
Security Analysis
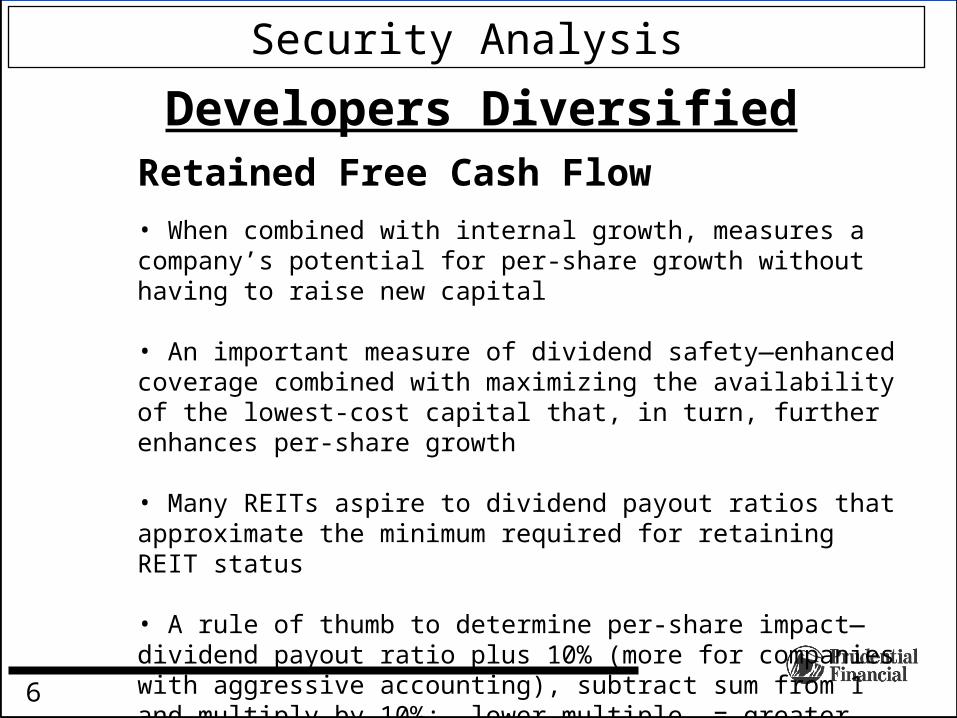
Developers DiversifiedRetained Free Cash Flow
• When combined with internal growth, measures a company’s potential for per-share growth without having to raise new capital
• An important measure of dividend safety—enhanced coverage combined with maximizing the availability of the lowest-cost capital that, in turn, further enhances per-share growth
• Many REITs aspire to dividend payout ratios that approximate the minimum required for retaining REIT status
• A rule of thumb to determine per-share impact—dividend payout ratio plus 10% (more for companies with aggressive accounting), subtract sum from 1 and multiply by 10%; lower multiple = greater impact

7
Security Analysis
Developers DiversifiedExternal Growth
The Skill Set—Not for every season
• Acquisitions—a consolidating industry offers opportunities both for assets and companies.
• Repositioning and Recycling—sell the losers and enhance the keepers.
• Development—higher risk, higher reward.
• Identifying sites• Land assemblage• Permitting• Leasing• Underwriting• Completing construction
8
Security Analysis
Developers Diversified
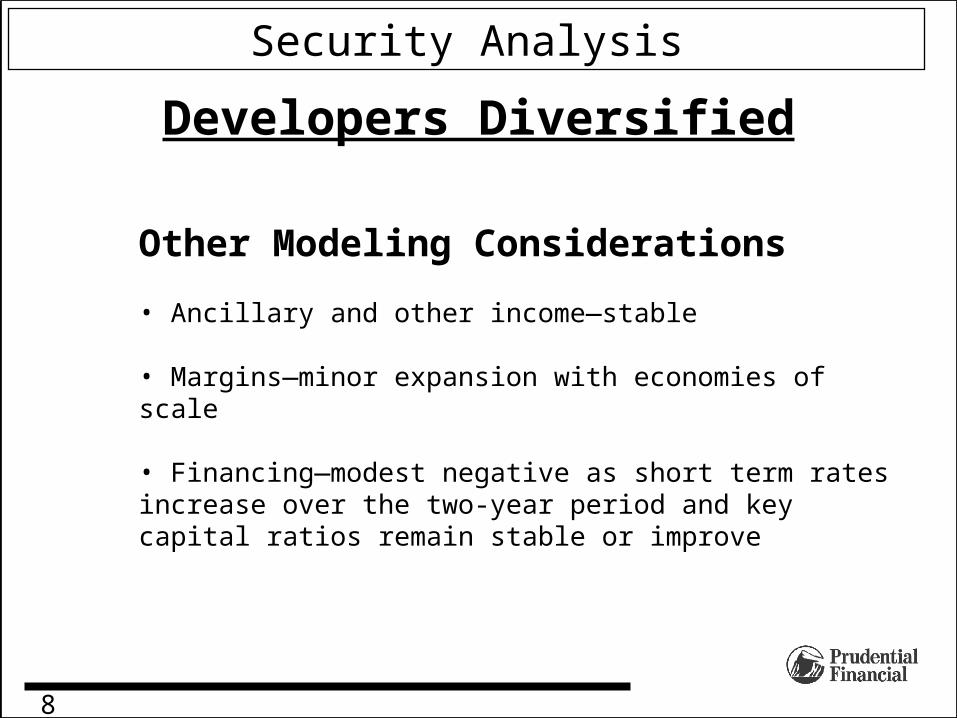
Other Modeling Considerations
• Ancillary and other income—stable
• Margins—minor expansion with economies of scale
• Financing—modest negative as short term rates increase over the two-year period and key capital ratios remain stable or improve
9
Source: Company data and Prudential Equity Group, Inc.
Security Analysis
Developers Diversified
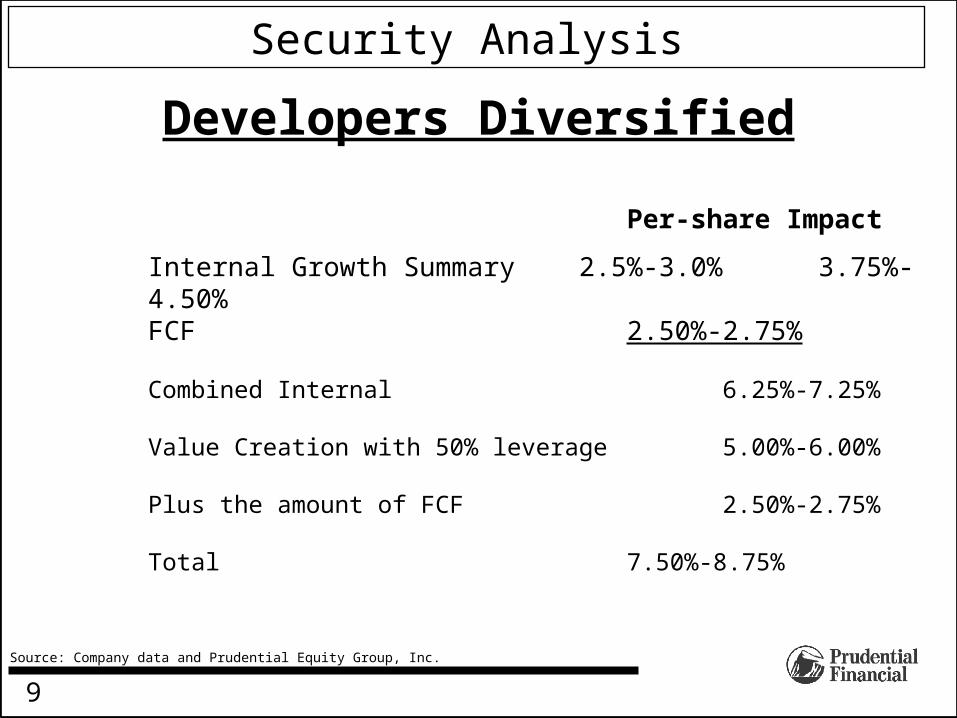
Per-share Impact
Internal Growth Summary 2.5%-3.0% 3.75%-4.50%FCF 2.50%-2.75%
Combined Internal 6.25%-7.25%
Value Creation with 50% leverage 5.00%-6.00%
Plus the amount of FCF 2.50%-2.75%
Total 7.50%-8.75%
10
Source: Company data, First Call, and Prudential Equity Group, Inc.
Security Analysis
Developers Diversified
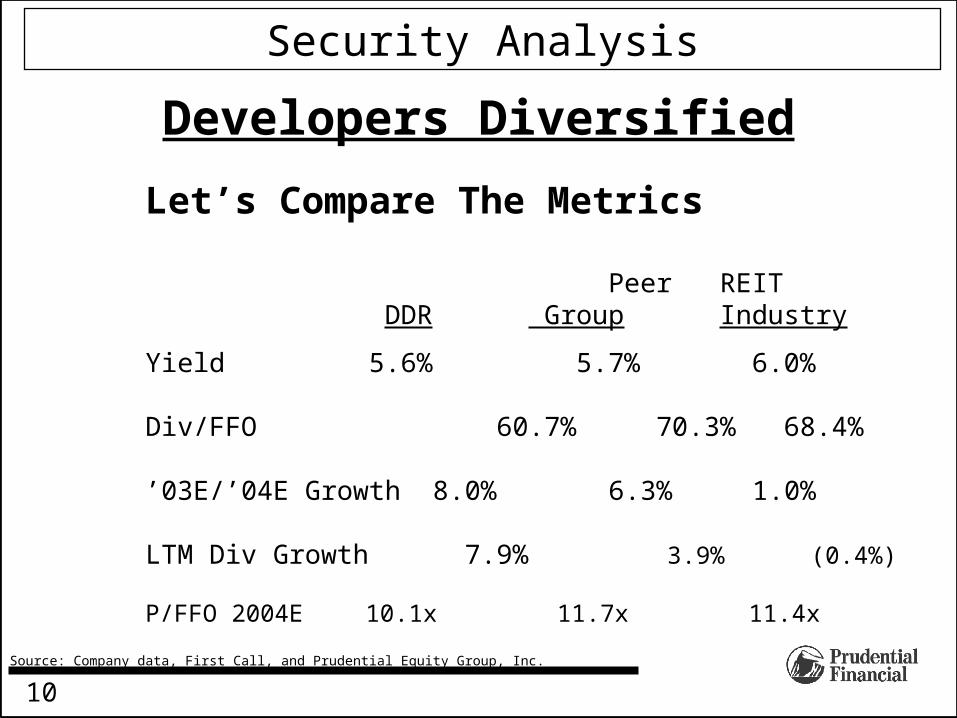
Let’s Compare The Metrics
Peer REIT DDR Group Industry
Yield 5.6% 5.7% 6.0%
Div/FFO 60.7% 70.3% 68.4%
’03E/’04E Growth 8.0% 6.3% 1.0%
LTM Div Growth 7.9% 3.9% (0.4%)
P/FFO 2004E 10.1x 11.7x 11.4x
11
Source:Company data, First Call, and Prudential Equity Group, Inc.
Security Analysis
Developers Diversified
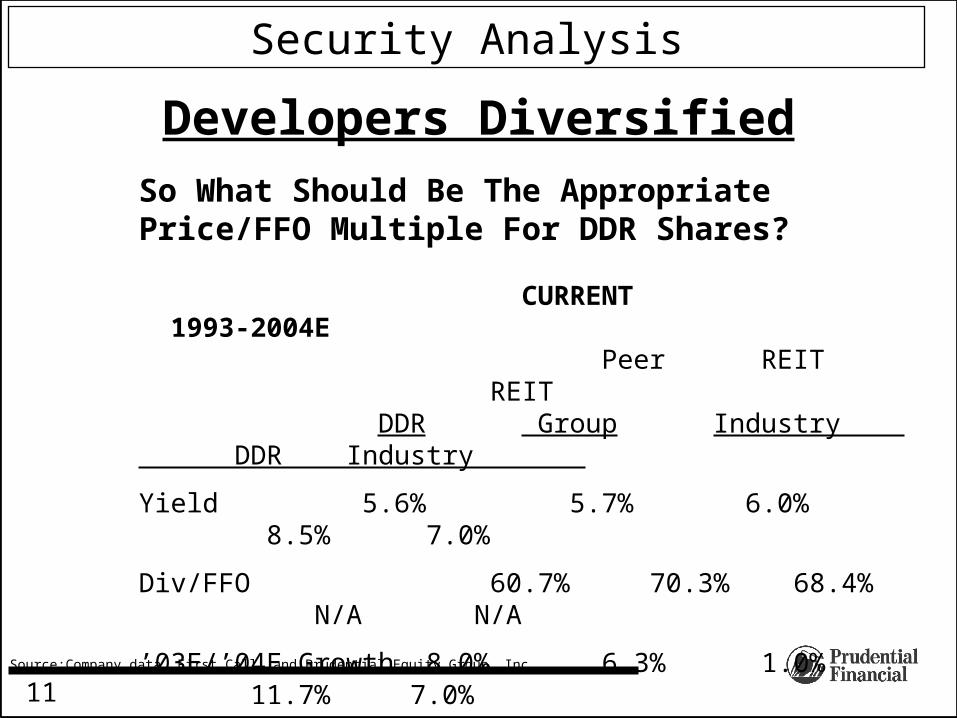
So What Should Be The Appropriate Price/FFO Multiple For DDR Shares?
CURRENT 1993-2004E Peer REIT REIT DDR Group Industry DDR Industry
Yield 5.6% 5.7% 6.0% 8.5% 7.0%
Div/FFO 60.7% 70.3% 68.4% N/A N/A
’03E/’04E Growth 8.0% 6.3% 1.0% 11.7% 7.0%
LTM Div Growth 7.9% 3.9% (0.4%) 7.4% 5.3%
P/FFO 2004E 10.1x 11.7x 11.4x 11.1x 11.0x
12
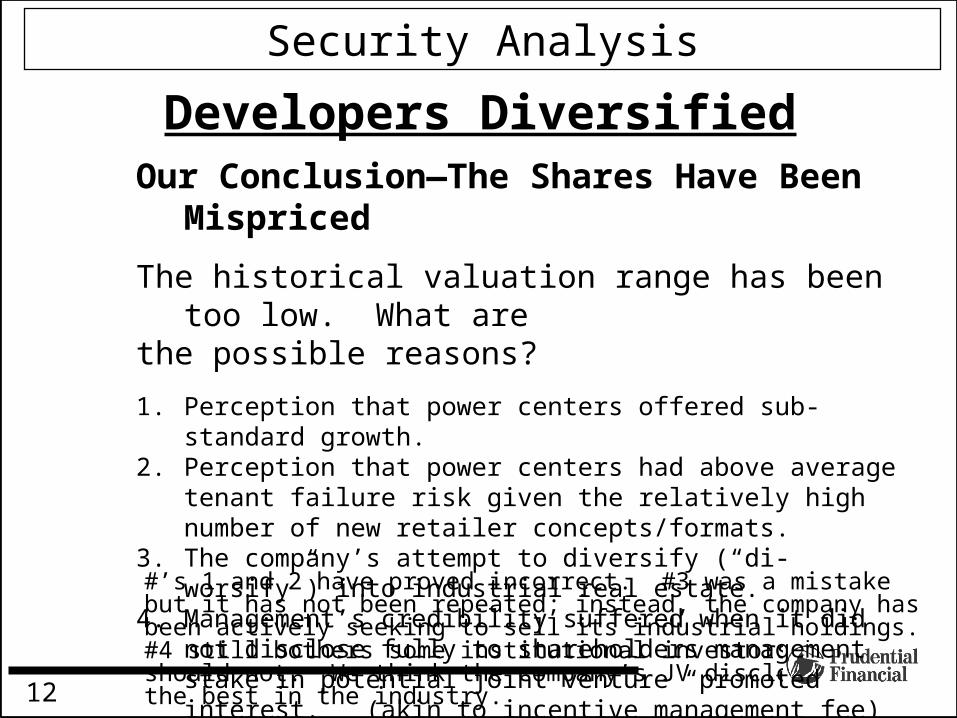
#’s 1 and 2 have proved incorrect. #3 was a mistake but it has not been repeated; instead, the company has been actively seeking to sell its industrial holdings. #4 still bothers some institutional investors but should not. We think the company’s JV disclosure is the best in the industry.
Security Analysis
Developers DiversifiedOur Conclusion—The Shares Have Been Mispriced
The historical valuation range has been too low. What arethe possible reasons?
1. Perception that power centers offered sub-standard growth.2. Perception that power centers had above average tenant failure risk
given the relatively high number of new retailer concepts/formats.3. The company’s attempt to diversify (“di-worsify”) into industrial real
estate.4. Management’s credibility suffered when it did not disclose fully to
shareholders management stake in potential joint venture “promoted interest.” (akin to incentive management fee)
13
Security Analysis
Source: Prudential Equity Group, Inc. estimates.
Developers Diversified
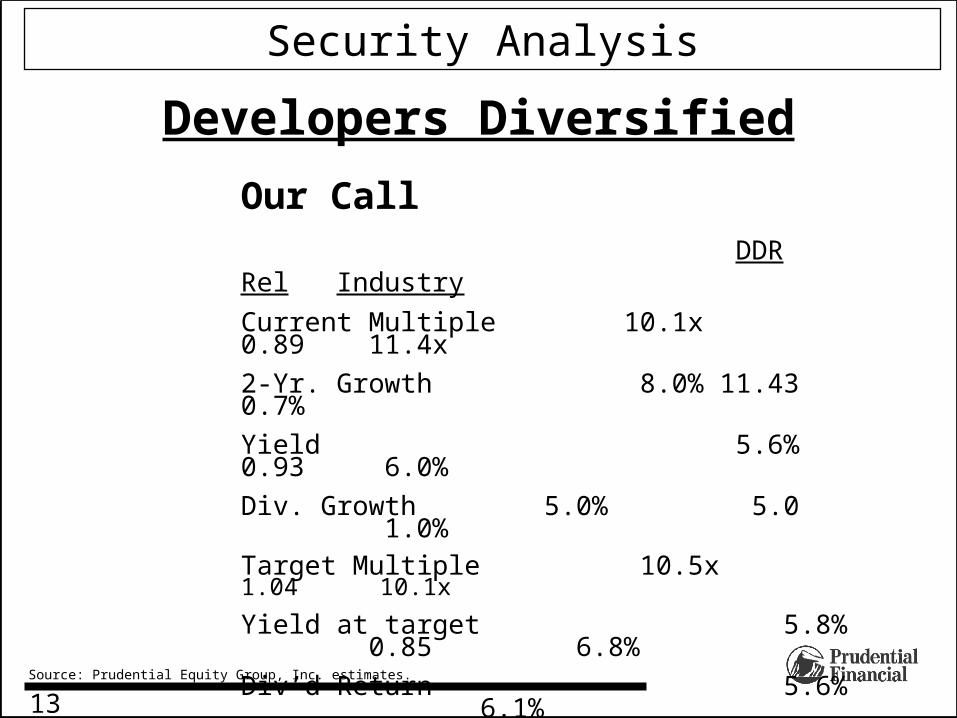
Our Call DDR Rel Industry
Current Multiple 10.1x 0.89 11.4x
2-Yr. Growth 8.0% 11.43 0.7%
Yield 5.6% 0.93 6.0%
Div. Growth 5.0% 5.0 1.0%
Target Multiple 10.5x 1.04 10.1x
Yield at target 5.8% 0.85 6.8%
Div’d Return 5.6% 6.1%
Price Change 2.3% (12.5%)
Total Return Potential 7.9% (6.4%)
14
Security Analysis
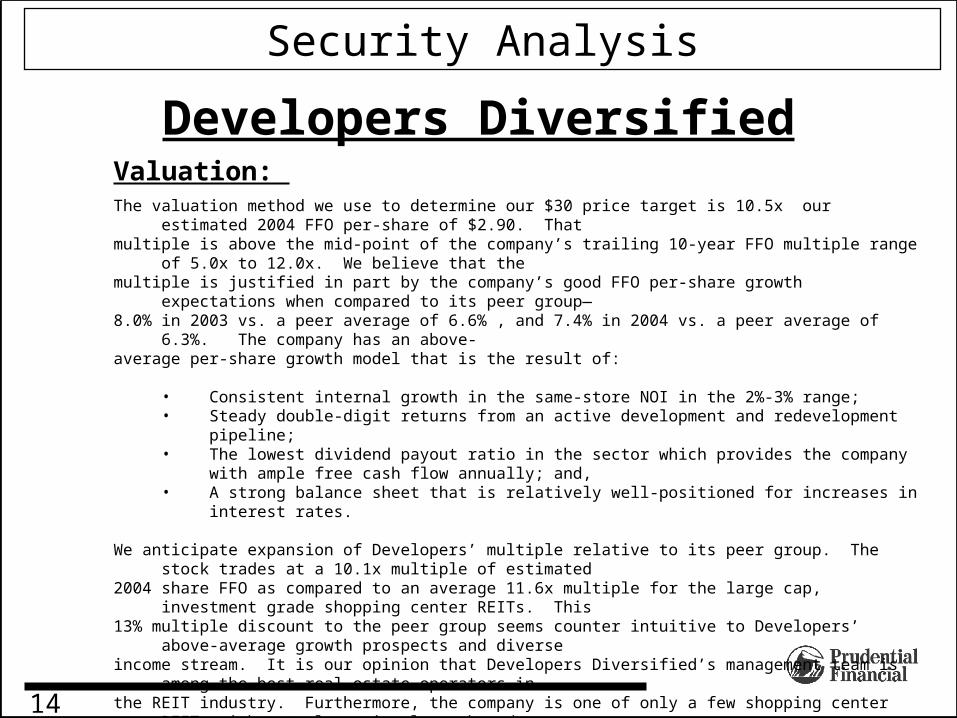
Developers DiversifiedValuation: The valuation method we use to determine our $30 price target is 10.5x our estimated 2004 FFO per-share of $2.90. Thatmultiple is above the mid-point of the company’s trailing 10-year FFO multiple range of 5.0x to 12.0x. We believe that themultiple is justified in part by the company’s good FFO per-share growth expectations when compared to its peer group—8.0% in 2003 vs. a peer average of 6.6% , and 7.4% in 2004 vs. a peer average of 6.3%. The company has an above- average per-share growth model that is the result of:
• Consistent internal growth in the same-store NOI in the 2%-3% range;• Steady double-digit returns from an active development and redevelopment pipeline;• The lowest dividend payout ratio in the sector which provides the company with ample free cash flow annually;
and,• A strong balance sheet that is relatively well-positioned for increases in interest rates.
We anticipate expansion of Developers’ multiple relative to its peer group. The stock trades at a 10.1x multiple of estimated2004 share FFO as compared to an average 11.6x multiple for the large cap, investment grade shopping center REITs. This 13% multiple discount to the peer group seems counter intuitive to Developers’ above-average growth prospects and diverse income stream. It is our opinion that Developers Diversified’s management team is among the best real estate operators in the REIT industry. Furthermore, the company is one of only a few shopping center REITs with a truly national reach andmulti-faceted capabilities. It is the only one with such reach in the power center category of the sector. We note, however, that the stock is up 34% this year and has outperformed the shopping center REIT sector by approximately 50%. We confirm our Overweight rating.
Risks: The risks that may impede achievement of the price target include: additional store closings by tenants such as Kmart; unexpectedly poor returns on development projects; and the negative impact of slowing retail sales levels on tenant demand for space and overall rental levels.
15
Security Analysis
Developers Diversified
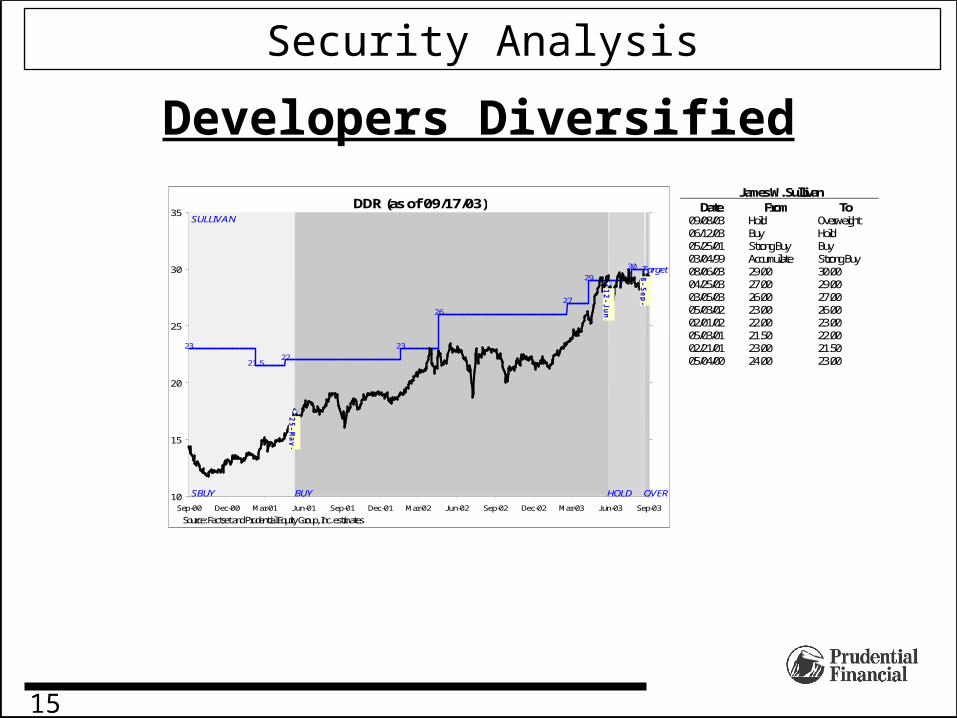
James W. Sullivan Date From To
09/08/03 Hold Overweight 06/12/03 Buy Hold 05/25/01 Strong Buy Buy 03/04/99 Accumulate Strong Buy 08/06/03 29.00 30.00 04/25/03 27.00 29.00 03/05/03 26.00 27.00 05/03/02 23.00 26.00 02/01/02 22.00 23.00 05/03/01 21.50 22.00 02/21/01 23.00 21.50 05/04/00 24.00 23.00
DDR (as of 09/17/03)
25-May-01
12-Jun-03
8-Sep-03
23
21.522
23
26
27
29
30
10
15
20
25
30
35
Sep-00 Dec-00 Mar-01 Jun-01 Sep-01 Dec-01 Mar-02 Jun-02 Sep-02 Dec-02 Mar-03 Jun-03 Sep-03
Source: Factset and Prudential Equity Group, Inc. estimates.
0
0.2
0.4
0.6
0.8
1
SBUY
SULLIVAN
BUY HOLD OVER
Target
16
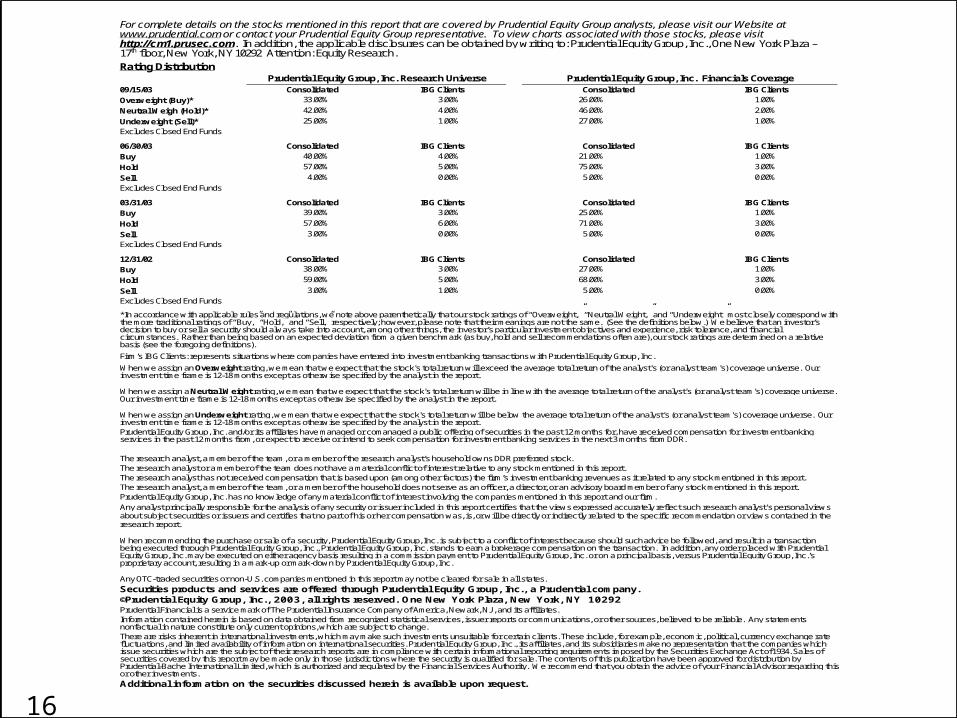
For complete details on the stocks mentioned in this report that are covered by Prudential Equity Group analysts, please visit our Website at www.prudential.com or contact your Prudential Equity Group representative. To view charts associated with those stocks, please visit http://cm1.prusec.com. In addition, the applicable disclosures can be obtained by writing to: Prudential Equity Group, Inc., One New York Plaza – 17th floor, New York, NY 10292 Attention: Equity Research. Rating Distribution
Prudential Equity Group, Inc. Research Universe Prudential Equity Group, Inc. Financials Coverage 09/15/03 Consolidated IBG Clients Consolidated IBG Clients Overweight (Buy)* 33.00% 3.00% 26.00% 1.00%
Neutral Weigh (Hold)* 42.00% 4.00% 46.00% 2.00%
Underweight (Sell)* 25.00% 1.00% 27.00% 1.00% Excludes Closed End Funds
06/30/03 Consolidated IBG Clients Consolidated IBG Clients Buy 40.00% 4.00% 21.00% 1.00%
Hold 57.00% 5.00% 75.00% 3.00%
Sell 4.00% 0.00% 5.00% 0.00% Excludes Closed End Funds
03/31/03 Consolidated IBG Clients Consolidated IBG Clients Buy 39.00% 3.00% 25.00% 1.00%
Hold 57.00% 6.00% 71.00% 3.00%
Sell 3.00% 0.00% 5.00% 0.00% Excludes Closed End Funds
12/31/02 Consolidated IBG Clients Consolidated IBG Clients Buy 38.00% 3.00% 27.00% 1.00%
Hold 59.00% 5.00% 68.00% 3.00%
Sell 3.00% 1.00% 5.00% 0.00% Excludes Closed End Funds
*In accordance with applicable rules and regulations, we note above parenthetically that our stock ratings of “Overweight,” “Neutral Weight,” and “Underweight” most closely correspond with the more traditional ratings of “Buy,” “Hold,” and “Sell,” respectively; however, please note that their meanings are not the same. (See the definitions below.) We believe that an investor’s decision to buy or sell a security should always take into account, among other things, the investor’s particular investment objectives and experience, risk tolerance, and financial circumstances. Rather than being based on an expected deviation from a given benchmark (as buy, hold and sell recommendations often are), our stock ratings are determined on a relative basis (see the foregoing definitions).
Firm’s IBG Clients: represents situations where companies have entered into investment banking transactions with Prudential Equity Group, Inc.
When we assign an Overweight rating, we mean that we expect that the stock's total return will exceed the average total return of the analyst's (or analyst team's) coverage universe. Our investment time frame is 12-18 months except as otherwise specified by the analyst in the report.
When we assign a Neutral Weight rating, we mean that we expect that the stock's total return will be in line with the average total return of the analyst's (or analyst team's) coverage universe. Our investment time frame is 12-18 months except as otherwise specified by the analyst in the report.
When we assign an Underweight rating, we mean that we expect that the stock's total return will be below the average total return of the analyst's (or analyst team's) coverage universe. Our investment time frame is 12-18 months except as otherwise specified by the analyst in the report. Prudential Equity Group, Inc. and/or its affiliates have managed or comanaged a public offering of securities in the past 12 months for, have received compensation for investment banking services in the past 12 months from, or expect to receive or intend to seek compensation for investment banking services in the next 3 months from DDR. The research analyst, a member of the team, or a member of the research analyst’s household owns DDR preferred stock. The research analyst or a member of the team does not have a material conflict of interest relative to any stock mentioned in this report. The research analyst has not received compensation that is based upon (among other factors) the firm’s investment banking revenues as it related to any stock mentioned in this report. The research analyst, a member of the team, or a member of the household does not serve as an officer, a director, or an advisory board member of any stock mentioned in this report. Prudential Equity Group, Inc. has no knowledge of any material conflict of interest involving the companies mentioned in this report and our firm. Any analyst principally responsible for the analysis of any security or issuer included in this report certifies that the views expressed accurately reflect such research analyst's personal views about subject securities or issuers and certifies that no part of his or her compensation was, is, or will be directly or indirectly related to the specific recommendation or views contained in the research report.
When recommending the purchase or sale of a security, Prudential Equity Group, Inc. is subject to a conflict of interest because should such advice be followed, and result in a transaction being executed through Prudential Equity Group, Inc., Prudential Equity Group, Inc. stands to earn a brokerage compensation on the transaction. In addition, any order placed with Prudential Equity Group, Inc. may be executed on either agency basis resulting in a commission payment to Prudential Equity Group, Inc. or on a principal basis, versus Prudential Equity Group, Inc.’s proprietary account, resulting in a mark-up or mark-down by Prudential Equity Group, Inc.
Any OTC-traded securities or non-U.S. companies mentioned in this report may not be cleared for sale in all states. Securities products and services are offered through Prudential Equity Group, Inc., a Prudential company. ©Prudential Equity Group, Inc., 2003, all rights reserved. One New York Plaza, New York, NY 10292 Prudential Financial is a service mark of The Prudential Insurance Company of America, Newark, NJ , and its affiliates. Information contained herein is based on data obtained from recognized statistical services, issuer reports or communications, or other sources, believed to be reliable. Any statements nonfactual in nature constitute only current opinions, which are subject to change. There are risks inherent in international investments, which may make such investments unsuitable for certain clients. These include, for example, economic, political, currency exchange rate fluctuations, and limited availability of information on international securities. Prudential Equity Group, Inc., its affiliates, and its subsidiaries make no representation that the companies which issue securities which are the subject of their research reports are in compliance with certain informational reporting requirements imposed by the Securities Exchange Act of 1934. Sales of securities covered by this report may be made only in those jurisdictions where the security is qualified for sale. The contents of this publication have been approved for distribution by Prudential-Bache International Limited, which is authorized and regulated by the Financial Services Authority. We recommend that you obtain the advice of your Financial Advisor regarding this or other investments. Additional information on the securities discussed herein is available upon request.
17
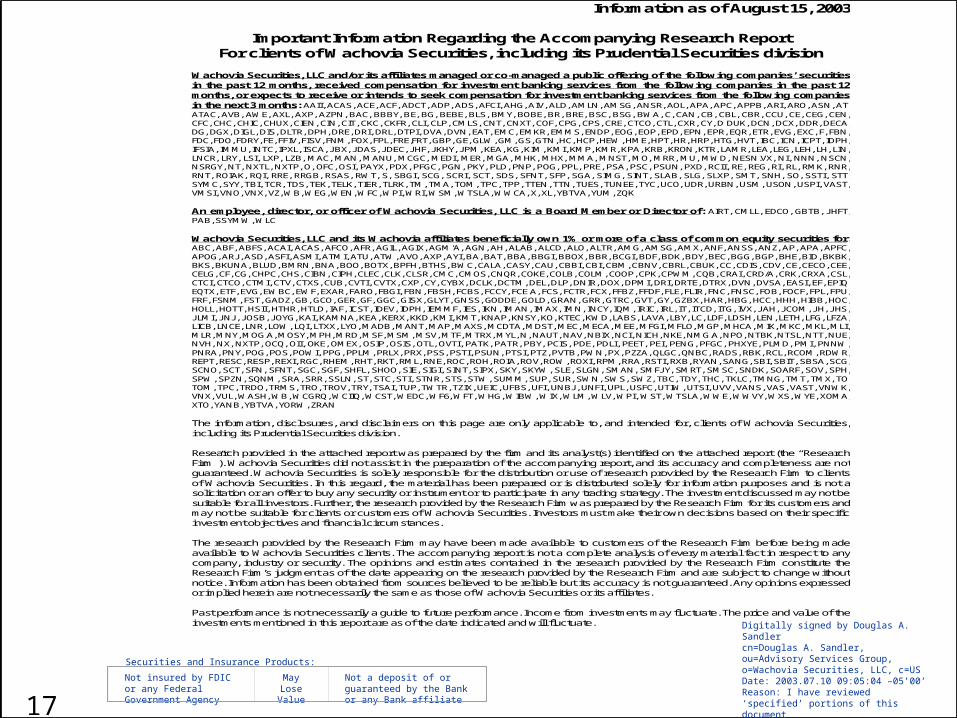
Digitally signed by Douglas A. Sandlercn=Douglas A. Sandler, ou=Advisory Services Group, o=Wachovia Securities, LLC, c=USDate: 2003.07.10 09:05:04 –05’00’Reason: I have reviewed ‘specified’ portions of this document
Securities and Insurance Products:
Not insured by FDIC or any Federal Government Agency
May Lose Value
Not a deposit of or guaranteed by the Bank or any Bank affiliate
Information as of August 15, 2003
Important Information Regarding the Accompanying Research Report For clients of Wachovia Securities, including its Prudential Securities division
Wachovia Securities, LLC and/or its affiliates managed or co-managed a public offering of the following companies’ securities in the past 12 months, received compensation for investment banking services from the following companies in the past 12 months, or expects to receive or intends to seek compensation for investment banking services from the following companies in the next 3 months: AAII, ACAS, ACE, ACF, ADCT, ADP, ADS, AFCI, AHG, AIV, ALD, AMLN, AMSG, ANSR, AOL, APA, APC, APPB, ARI, ARO, ASN, AT, ATAC, AVB, AWE, AXL, AXP, AZPN, BAC, BBBY, BE, BG, BEBE, BLS, BMY, BOBE, BR, BRE, BSC, BSG, BWA, C, CAN, CB, CBL, CBR, CCU, CE, CEG, CEN, CFC, CHC, CHIC, CHUX, CIEN, CIN, CIT, CKC, CKFR, CLI, CLP, CMLS, CNT, CNXT, COF, CPG, CPS, CRE, CTCO, CTL, CXR, CY, D DUK, DCN, DCX, DDR, DECA, DG, DGX, DIGL, DIS, DLTR, DPH, DRE, DRI, DRL, DTPI, DVA, DVN, EAT, EMC, EMKR, EMMS, ENDP, EOG, EOP, EPD, EPN, EPR, EQR, ETR, EVG, EXC, F, FBN, FDC, FDO, FDRY, FE, FFIV, FISV, FNM, FOX, FPL, FRE,FRT, GBP, GE, GLW, GM, GS, GTN, HC, HCP, HEW, HME, HPT, HR, HRP, HTG, HVT, IBC, ICN, ICPT, IDPH, IFSIA, IMMU, INTC, IPXL, ISCA, J BX, J DAS, J DEC, J HF, J KHY, J PM, KEA, KG, KIM, KMI, KMP, KMR, KPA, KRB, KRON, KTR, LAMR, LEA, LEG, LEH, LH, LIN, LNCR, LRY, LSI, LXP, LZB, MAC, MAN, MANU, MCGC, MEDI, MER, MGA, MHK, MHX, MMA, MNST, MO, MRR, MU, MWD, NESN.VX, NI, NNN, NSCN, NSRGY, NT, NXTL, NXTP, O, OFC, OSI, PAYX, PDX, PFGC, PGN, PKY, PLD, PNP, POG, PPL, PRE, PSA, PSC, PSUN, PXD, RCII, RE, REG, RI, RL, RMK, RNR, RNT, ROIAK, RQI, RRE, RRGB, RSAS, RWT, S, SBGI, SCG, SCRI, SCT, SDS, SFNT, SFP, SGA, SIMG, SINT, SLAB, SLG, SLXP, SMT, SNH, SO, SSTI, STT, SYMC, SYY, TBI, TCR, TDS, TEK, TELK, TIER, TLRK, TM, TMA, TOM, TPC, TPP, TTEN, TTN, TUES, TUNEE, TYC, UCO, UDR, URBN, USM, USON, USPI, VAST, VMSI, VNO, VNX, VZ, WB, WEG, WEN, WFC, WPI, WRI, WSM, WTSLA, WWCA, X, XL, YBTVA, YUM, ZQK An employee, director, or officer of Wachovia Securities, LLC is a Board Member or Director of: AIRT, CMLL, EDCO, GBTB, J HFT, PAB, SSYMW, WLC Wachovia Securities, LLC and its Wachovia affiliates beneficially own 1% or more of a class of common equity securities for: ABC, ABF, ABFS, ACAI, ACAS, AFCO, AFR, AGIL, AGIX, AGM'A, AGN, AH, ALAB, ALCD, ALO, ALTR, AMG, AMSG, AMX, ANF, ANSS, ANZ, AP, APA, APFC, APOG, ARJ , ASD, ASFI, ASMI, ATMI, ATU, ATW, AVO, AXP, AYI, BA, BAT, BBA, BBGI, BBOX, BBR, BCGI, BDF, BDK, BDY, BEC, BGG, BGP, BHE, BID, BKBK, BKS, BKUNA, BLUD, BMRN, BNA, BOO, BOTX, BPFH, BTHS, BWC, CALA, CASY, CAU, CBBI, CBI, CBM, CBNV, CBRL, CBUK, CC, CDIS, CDV, CE, CECO, CEE, CELG, CF, CG, CHPC, CHS, CIBN, CIPH, CLEC, CLK, CLSR, CMC, CMOS, CNQR, COKE, COLB, COLM, COOP, CPK, CPWM, CQB, CRAI, CRD/A, CRK, CRXA, CSL, CTCI, CTCO, CTMI, CTV, CTXS, CUB, CVTI, CVTX, CXP, CY, CYBX, DCLK, DCTM, DEL, DLP, DNIR, DOX, DPMI, DRI, DRTE, DTRX, DVN, DVSA, EASI, EF, EPIQ, EQTX, ETF, EVG, EWBC, EWF, EXAR, FARO, FBGI, FBN, FBSH, FCBS, FCCY, FCE.A, FCS, FCTR, FCX, FFBZ, FFDF, FLE, FLIR, FNC, FNSC, FOB, FOCF, FPL, FPU, FRF, FSNM, FST, GADZ, GB, GCO, GER, GF, GGC, GISX, GLYT, GNSS, GODDE, GOLD, GRAN, GRR, GTRC, GVT, GY, GZBX, HAR, HBG, HCC, HHH, HIBB, HOC, HOLL, HOTT, HSII, HTHR, HTLD, IAF, ICST, IDEV, IDPH, IEMMF, IES, IKN, IMAN, IMAX, IMN, INCY, IQM, IRIC, IRL, IT, ITCD, ITG, IVX, J AH, J COM, J H, J HS, J LMI, J NJ , J OSB, J OYG, KAI, KAMNA, KEA, KERX, KKD, KMI, KMT, KNAP, KNSY, KO, KTEC, KWD, LABS, LAVA, LBY, LC, LDF, LDSH, LEN, LETH, LFG, LFZA, LICB, LNCE, LNR, LOW, LQI, LTXX, LYO, MADB, MANT, MAP, MAXS, MCDTA, MDST, MEC, MECA, MEE, MFGI, MFLO, MGP, MHCA, MIK, MKC, MKL, MLI, MLR, MNY, MOG.A, MOSY, MPH, MRD, MSF, MSM, MSV, MTF, MTRX, MYL, N, NAUT, NAV, NBIX, NCI, NICH, NKE, NMG.A, NPO, NTBK, NTSL, NTT, NUE, NVH, NX, NXTP, OCQ, OII, OKE, OMEX, OSIP, OSIS, OTL, OVTI, PATK, PATR, PBY, PCIS, PDE, PDLI, PEET, PEI, PENG, PFGC, PHXYE, PLMD, PMI, PNNW, PNRA, PNY, POG, POS, POWI, PPG, PPLM, PRLX, PRX, PSS, PSTI, PSUN, PTSI, PTZ, PVTB, PWN, PX, PZZA, QLGC, QNBC, RADS, RBK, RCL, RCOM, RDWR, REPT, RESC, RESP, REXI, RGC, RHEM, RHT, RKT, RML, RNE, ROC, ROH, ROIA, ROV, ROW, ROXI, RPM, RRA, RSTI, RXB, RYAN, SANG, SBI, SBIT, SBSA, SCG, SCNO, SCT, SFN, SFNT, SGC, SGF, SHFL, SHOO, SIE, SIGI, SINT, SIPX, SKY, SKYW, SLE, SLGN, SMAN, SMFJ Y, SMRT, SMSC, SNDK, SOARF, SOV, SPH, SPW, SPZN, SQNM, SRA, SRR, SSLN, ST, STC, STI, STNR, STS, STW, SUMM, SUP, SUR, SWN, SWS, SWZ, TBC, TDY, THC, TKLC, TMNG, TMT, TMX, TO, TOM, TPC, TRDO, TRMS, TRO, TROV, TRY, TSAI, TUP, TWTR, TZIX, UEIC, UFBS, UFI, UNBJ , UNFI, UPL, USFC, UTIW, UTSI, UVV, VANS, VAS, VAST, VNWK, VNX, VUL, WASH, WB, WCGRQ, WCIIQ, WCST, WEDC, WF6, WFT, WHG, WIBW, WIX, WLM, WLV, WPI, WST, WTSLA, WWE, WWVY, WXS, WYE, XOMA, XTO, YANB, YBTVA, YORW, ZRAN The information, disclosures, and disclaimers on this page are only applicable to, and intended for, clients of Wachovia Securities, including its Prudential Securities division. Research provided in the attached report was prepared by the firm and its analyst(s) identified on the attached report (the “Research Firm”). Wachovia Securities did not assist in the preparation of the accompanying report, and its accuracy and completeness are not guaranteed. Wachovia Securities is solely responsible for the distribution or use of research provided by the Research Firm to clients of Wachovia Securities. In this regard, the material has been prepared or is distributed solely for information purposes and is not a solicitation or an offer to buy any security or instrument or to participate in any trading strategy. The investment discussed may not be suitable for all investors. Further, the research provided by the Research Firm was prepared by the Research Firm for its customers and may not be suitable for clients or customers of Wachovia Securities. Investors must make their own decisions based on their specific investment objectives and financial circumstances. The research provided by the Research Firm may have been made available to customers of the Research Firm before being made available to Wachovia Securities clients. The accompanying report is not a complete analysis of every material fact in respect to any company, industry or security. The opinions and estimates contained in the research provided by the Research Firm constitute the Research Firm’s judgment as of the date appearing on the research provided by the Research Firm and are subject to change without notice. Information has been obtained from sources believed to be reliable but its accuracy is not guaranteed. Any opinions expressed or implied herein are not necessarily the same as those of Wachovia Securities or its affiliates. Past performance is not necessarily a guide to future performance. Income from investments may fluctuate. The price and value of the investments mentioned in this report are as of the date indicated and will fluctuate.