Embed Size (px)
Citation preview
1
Introduction to DeciBio
Immuno-Oncology Biomarker Analysis Platform (I/O BioMAP)
2018
DeciBio Consulting, LLC
725 Arizona Ave, Suite #202
Santa Monica, CA 90401
Phone: (310) 451-4510
Email: [email protected]
www.decibio.com
DeciBio Contacts:
Andrew Aijian; [email protected]

2
The DeciBio Immuno-Oncology Biomarker Analysis Platform (I/O BioMAP) is an interactive database of
biomarkers being explored in I/O clinical trials; the BioMAP is used to track biomarker and clinical trial
activity, monitor the competitive landscape, and identify emerging I/O biomarker strategies
I/O BioMAP Summary
• To date, we have captured biomarker data from >1,150 active
and ongoing immuno-oncology clinical trials
o I/O trials from clinicaltrials.gov are reviewed by
experienced immuno-oncology researchers and biomarker
data is extracted from each trial
o Biomarker data extracted from each trial includes:
▪ Biomarker
▪ Biomarker type (e.g., protein, DNA, cell)
▪ Analytical technology (e.g., ELISA, NGS)
▪ Purpose (e.g., predictive, monitoring)
▪ Sample type (e.g., tumor tissue, blood)
▪ Trial phase, start / completion dates, enrollment,
sponsors, therapies, etc.
• The biomarker data is imported into Tableau, which allows
granular interrogation and segmentation of biomarkers by type,
technology, sample type, purpose, sponsor, etc.
• The BioMAP enables pharma, diagnostic, and research tools
companies to identify emerging biomarkers of interest, assess
the I/O competitive landscape, and prioritize biomarker and
technology portfolio development
The database is updated
quarterly and currently
includes data from >1,150
clinical trials
3
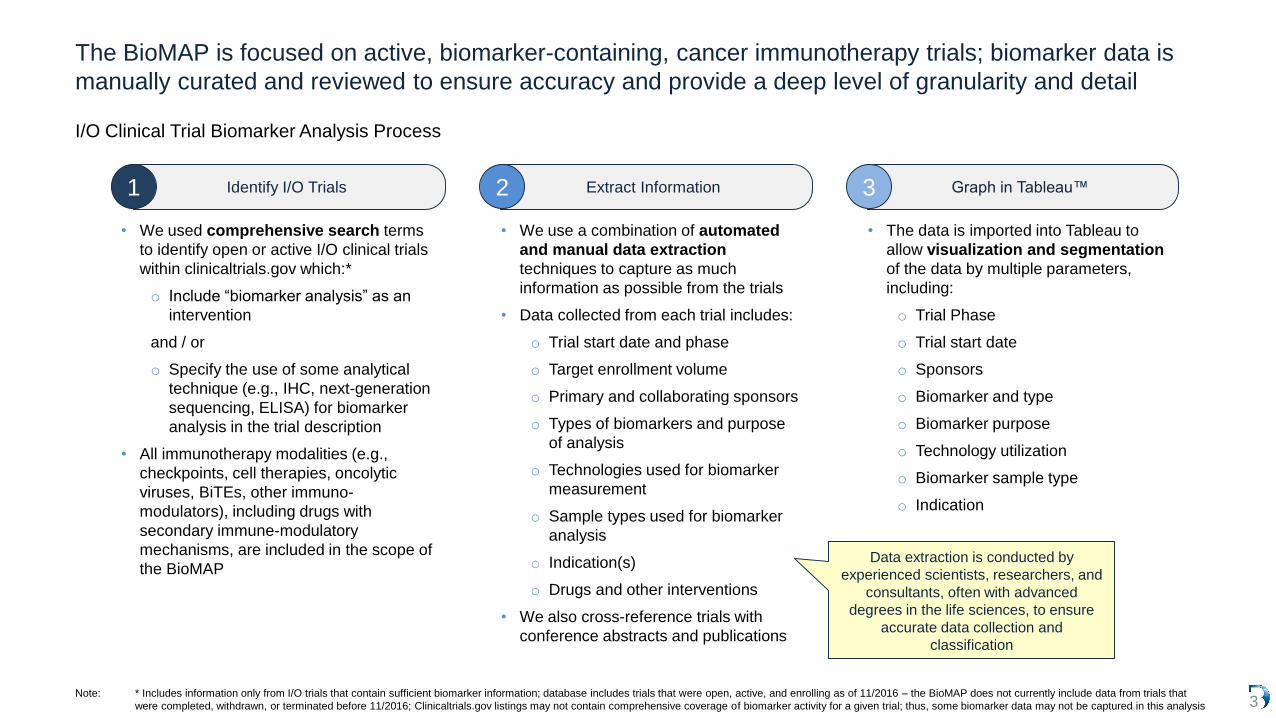
The BioMAP is focused on active, biomarker-containing, cancer immunotherapy trials; biomarker data is
manually curated and reviewed to ensure accuracy and provide a deep level of granularity and detail
I/O Clinical Trial Biomarker Analysis Process
Identify I/O Trials1
• We used comprehensive search terms
to identify open or active I/O clinical trials
within clinicaltrials.gov which:*
o Include “biomarker analysis” as an
intervention
and / or
o Specify the use of some analytical
technique (e.g., IHC, next-generation
sequencing, ELISA) for biomarker
analysis in the trial description
• All immunotherapy modalities (e.g.,
checkpoints, cell therapies, oncolytic
viruses, BiTEs, other immuno-
modulators), including drugs with
secondary immune-modulatory
mechanisms, are included in the scope of
the BioMAP
Extract Information2
• We use a combination of automated
and manual data extraction
techniques to capture as much
information as possible from the trials
• Data collected from each trial includes:
o Trial start date and phase
o Target enrollment volume
o Primary and collaborating sponsors
o Types of biomarkers and purpose
of analysis
o Technologies used for biomarker
measurement
o Sample types used for biomarker
analysis
o Indication(s)
o Drugs and other interventions
• We also cross-reference trials with
conference abstracts and publications
Graph in Tableau™3
• The data is imported into Tableau to
allow visualization and segmentation
of the data by multiple parameters,
including:
o Trial Phase
o Trial start date
o Sponsors
o Biomarker and type
o Biomarker purpose
o Technology utilization
o Biomarker sample type
o Indication
Data extraction is conducted by
experienced scientists, researchers, and
consultants, often with advanced
degrees in the life sciences, to ensure
accurate data collection and
classification
Note: * Includes information only from I/O trials that contain sufficient biomarker information; database includes trials that were open, active, and enrolling as of 11/2016 – the BioMAP does not currently include data from trials that
were completed, withdrawn, or terminated before 11/2016; Clinicaltrials.gov listings may not contain comprehensive coverage of biomarker activity for a given trial; thus, some biomarker data may not be captured in this analysis

4
Within each trial, every mention of a biomarker, along with potential combinations of sample-type,
technology, and purpose, is captured as a distinct “biomarker mention”
Example of Clinical Trial Data Extraction
Purpose Technology Sample TypeBiomarkerKey:
Biomarker Biomarker Type Sample Type Technology Purpose Indication
PD-L1 Protein Tumor Tissue IHC Predicting therapy response Bladder Cancer
CD8 Protein Tumor Tissue IHC Predicting therapy response Bladder Cancer
Unspecified biomarkers Protein Tumor Tissue IHC Predicting therapy response Bladder Cancer
Gene expression signature Nucleic Acid Tumor Tissue RNA-sequencing Predicting therapy response Bladder Cancer
Neoantigen burden (TMB) Nucleic Acid Tumor Tissue WES Predicting therapy response Bladder Cancer
dMMR Nucleic Acid Tumor Tissue Microsatellite Analysis Predicting therapy response Bladder Cancer
PD-L1 Protein Peripheral blood cells Flow cytometry Predicting therapy response Bladder Cancer
cfDNA Nucleic Acid Urine Not specified Therapy response monitoring Bladder Cancer
When appropriate, we use our
domain knowledge to make
inferences to fill in gaps in the data
To facilitate data and trend
analysis, some data is categorized
into standardized buckets
In instances in which a particular piece of information is not
provided in the trial listing and can not be confidently discerned,
we capture that data point as “Not specified”
5
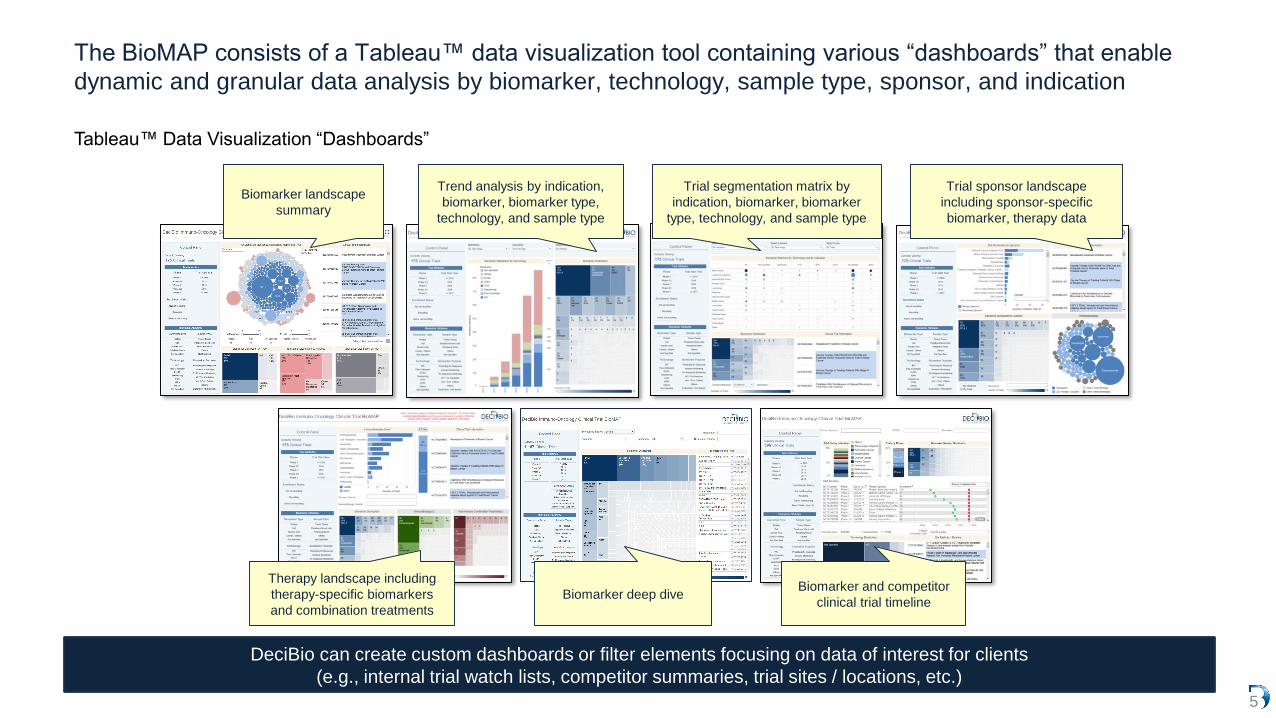
The BioMAP consists of a Tableau™ data visualization tool containing various “dashboards” that enable
dynamic and granular data analysis by biomarker, technology, sample type, sponsor, and indication
Tableau™ Data Visualization “Dashboards”
DeciBio can create custom dashboards or filter elements focusing on data of interest for clients
(e.g., internal trial watch lists, competitor summaries, trial sites / locations, etc.)
Biomarker landscape
summary
Trial segmentation matrix by
indication, biomarker, biomarker
type, technology, and sample type
Trial sponsor landscape
including sponsor-specific
biomarker, therapy data
Trend analysis by indication,
biomarker, biomarker type,
technology, and sample type
Therapy landscape including
therapy-specific biomarkers
and combination treatments
Biomarker and competitor
clinical trial timelineBiomarker deep dive

6
• The “Biomarker Landscape” dashboard is
useful for:
o Identifying top and emerging I/O
biomarkers (e.g., most-cited markers,
common late-stage markers), segmented
by biomarker type
o Identification of markers associated with a
particular sample type (e.g., blood-based
biomarkers for liquid biopsies)
o Digging deeper on clinical trials of interest,
by exploring external resources (e.g.,
conference abstracts, publications)
associated with particular trials
o Assessing the markers being explored
with various different technologies
o Identifying markers used for various
purposes (e.g., predicting response,
immune monitoring)
Use the “Control Panel on
the left to filter content on
the dashboard by each of
the filter parameters shown
Multiple filters can be
applied within a
particular filter-set by
using “Ctrl + click”
Any of the graphical or table elements in
figures with a yellow-shaded header can be
used to filter the dashboard accordingly (e.g.,
click on a biomarker bubble in this graph to
filter the dashboard by that biomarker)
Use the “Biomarker” free-
text search box to search
for specific biomarkers
Click on any NCT number to filter the
dashboard for that particular trial and
to access links to the
clinicaltrials.gov page and/or external
references (blue-shaded rows)
Apply ranges to filter the contents of the
dashboard by the number of biomarkers
mentions or the number of trials in
which markers are mentioned
The “Biomarker Landscape” dashboard provides a detailed summary of the different types of I/O biomarkers
7
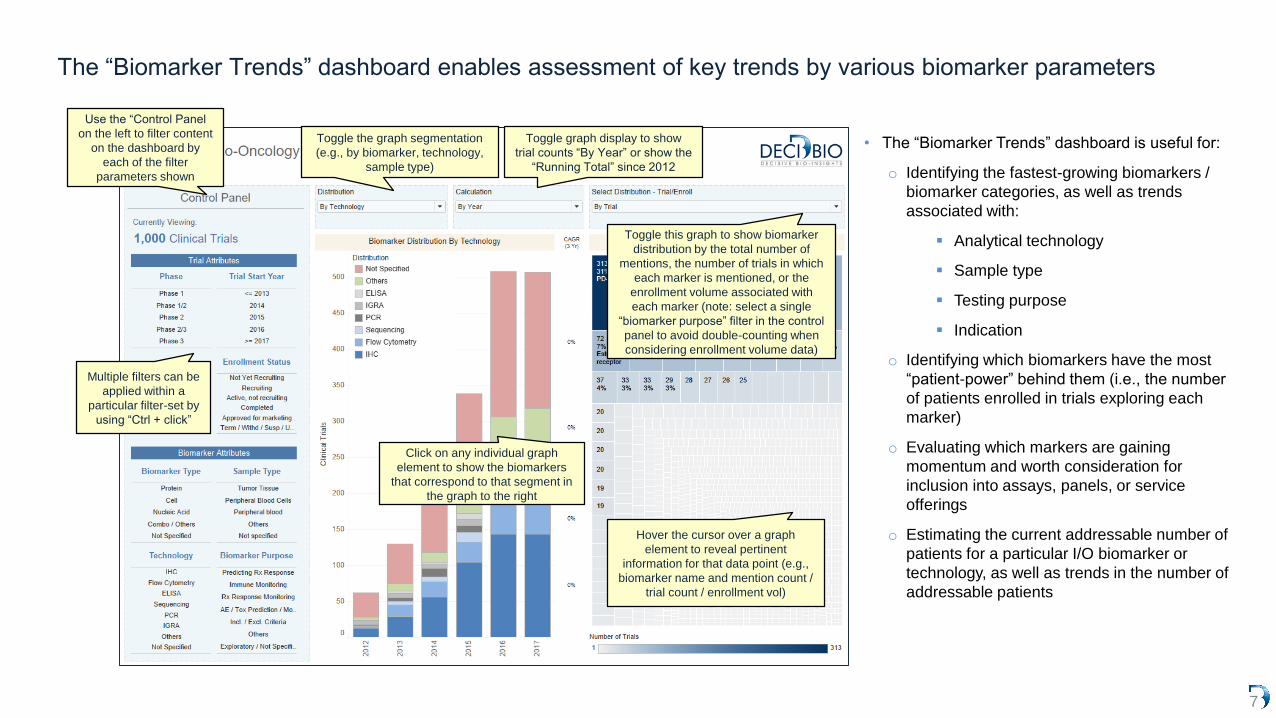
• The “Biomarker Trends” dashboard is useful for:
o Identifying the fastest-growing biomarkers /
biomarker categories, as well as trends
associated with:
▪ Analytical technology
▪ Sample type
▪ Testing purpose
▪ Indication
o Identifying which biomarkers have the most
“patient-power” behind them (i.e., the number
of patients enrolled in trials exploring each
marker)
o Evaluating which markers are gaining
momentum and worth consideration for
inclusion into assays, panels, or service
offerings
o Estimating the current addressable number of
patients for a particular I/O biomarker or
technology, as well as trends in the number of
addressable patients
The “Biomarker Trends” dashboard enables assessment of key trends by various biomarker parameters
Use the “Control Panel
on the left to filter content
on the dashboard by
each of the filter
parameters shown
Multiple filters can be
applied within a
particular filter-set by
using “Ctrl + click”
Toggle the graph segmentation
(e.g., by biomarker, technology,
sample type)
Toggle this graph to show biomarker
distribution by the total number of
mentions, the number of trials in which
each marker is mentioned, or the
enrollment volume associated with
each marker (note: select a single
“biomarker purpose” filter in the control
panel to avoid double-counting when
considering enrollment volume data)
Click on any individual graph
element to show the biomarkers
that correspond to that segment in
the graph to the right
Toggle graph display to show
trial counts “By Year” or show the
“Running Total” since 2012
Hover the cursor over a graph
element to reveal pertinent
information for that data point (e.g.,
biomarker name and mention count /
trial count / enrollment vol)
8
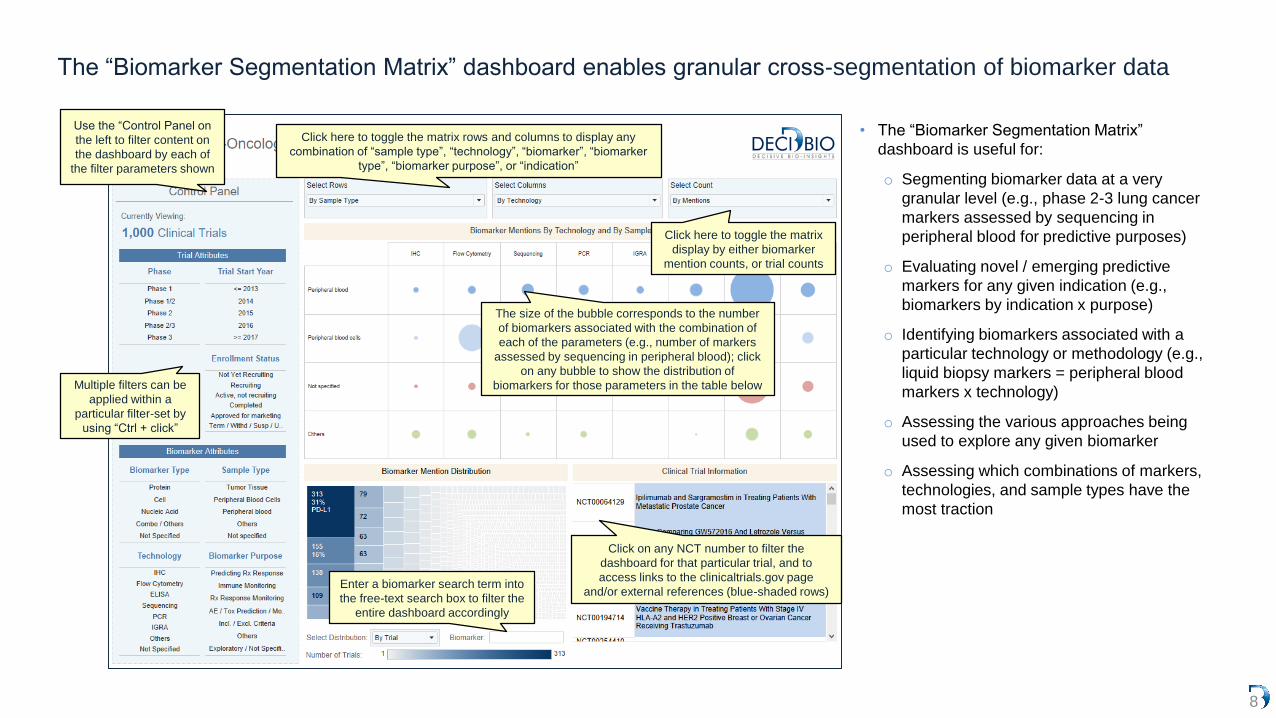
• The “Biomarker Segmentation Matrix”
dashboard is useful for:
o Segmenting biomarker data at a very
granular level (e.g., phase 2-3 lung cancer
markers assessed by sequencing in
peripheral blood for predictive purposes)
o Evaluating novel / emerging predictive
markers for any given indication (e.g.,
biomarkers by indication x purpose)
o Identifying biomarkers associated with a
particular technology or methodology (e.g.,
liquid biopsy markers = peripheral blood
markers x technology)
o Assessing the various approaches being
used to explore any given biomarker
o Assessing which combinations of markers,
technologies, and sample types have the
most traction
The “Biomarker Segmentation Matrix” dashboard enables granular cross-segmentation of biomarker data
Use the “Control Panel on
the left to filter content on
the dashboard by each of
the filter parameters shown
Multiple filters can be
applied within a
particular filter-set by
using “Ctrl + click”
Click here to toggle the matrix rows and columns to display any
combination of “sample type”, “technology”, “biomarker”, “biomarker
type”, “biomarker purpose”, or “indication”
Click here to toggle the matrix
display by either biomarker
mention counts, or trial counts
Enter a biomarker search term into
the free-text search box to filter the
entire dashboard accordingly
Click on any NCT number to filter the
dashboard for that particular trial, and to
access links to the clinicaltrials.gov page
and/or external references (blue-shaded rows)
The size of the bubble corresponds to the number
of biomarkers associated with the combination of
each of the parameters (e.g., number of markers
assessed by sequencing in peripheral blood); click
on any bubble to show the distribution of
biomarkers for those parameters in the table below

9
• The “Sponsor Data” dashboard is useful for:
o Identifying the key and emerging players
across I/O and/or for a particular biomarker
o Identifying and benchmarking against the
biomarker and immunotherapy activity for
a particular company / competitor of
interest
o Assessing which companies /
organizations are exploring particular
biomarkers
o Assessing which biomarkers / technologies
are highest priority for particular
companies (i.e., by segmenting by primary
sponsorship activity)
o Identifying potential biomarker / technology
partners
o Exploring the indications / applications
being pursued by academic / research
organizations that may have commercially-
relevant implications
The “Sponsor Data” dashboard shows biomarker and immunotherapy activity at the individual sponsor level
Use the “Control Panel on
the left to filter content on
the dashboard by each of
the filter parameters shown
Multiple filters can be
applied within a
particular filter-set by
using “Ctrl + click”
Click on an organization name to show their
biomarker activity in this chart and the graphs below
Enter a biomarker search term into
the free-text search box to show
which sponsors are exploring a
particular marker
This graph shows the types and
counts of different immunotherapies
being explored by the sponsors;
hover the cursor over a bubble to
see additional details
Click the light blue and darker blue parts of the bars to
show the data from the trials for which that company is
a secondary or primary sponsor, respectively
10
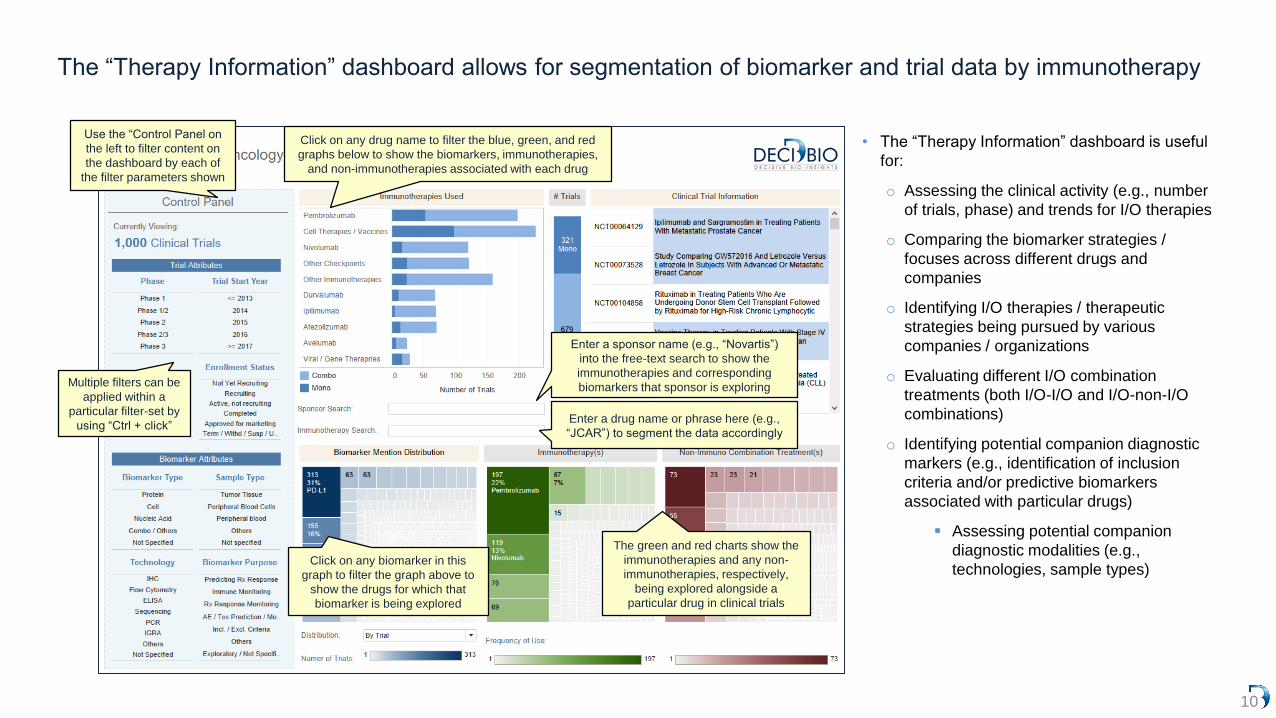
• The “Therapy Information” dashboard is useful
for:
o Assessing the clinical activity (e.g., number
of trials, phase) and trends for I/O therapies
o Comparing the biomarker strategies /
focuses across different drugs and
companies
o Identifying I/O therapies / therapeutic
strategies being pursued by various
companies / organizations
o Evaluating different I/O combination
treatments (both I/O-I/O and I/O-non-I/O
combinations)
o Identifying potential companion diagnostic
markers (e.g., identification of inclusion
criteria and/or predictive biomarkers
associated with particular drugs)
▪ Assessing potential companion
diagnostic modalities (e.g.,
technologies, sample types)
The “Therapy Information” dashboard allows for segmentation of biomarker and trial data by immunotherapy
Click on any drug name to filter the blue, green, and red
graphs below to show the biomarkers, immunotherapies,
and non-immunotherapies associated with each drug
Click on any biomarker in this
graph to filter the graph above to
show the drugs for which that
biomarker is being explored
The green and red charts show the
immunotherapies and any non-
immunotherapies, respectively,
being explored alongside a
particular drug in clinical trials
Enter a sponsor name (e.g., “Novartis”)
into the free-text search to show the
immunotherapies and corresponding
biomarkers that sponsor is exploring
Enter a drug name or phrase here (e.g.,
“JCAR”) to segment the data accordingly
Use the “Control Panel on
the left to filter content on
the dashboard by each of
the filter parameters shown
Multiple filters can be
applied within a
particular filter-set by
using “Ctrl + click”
11
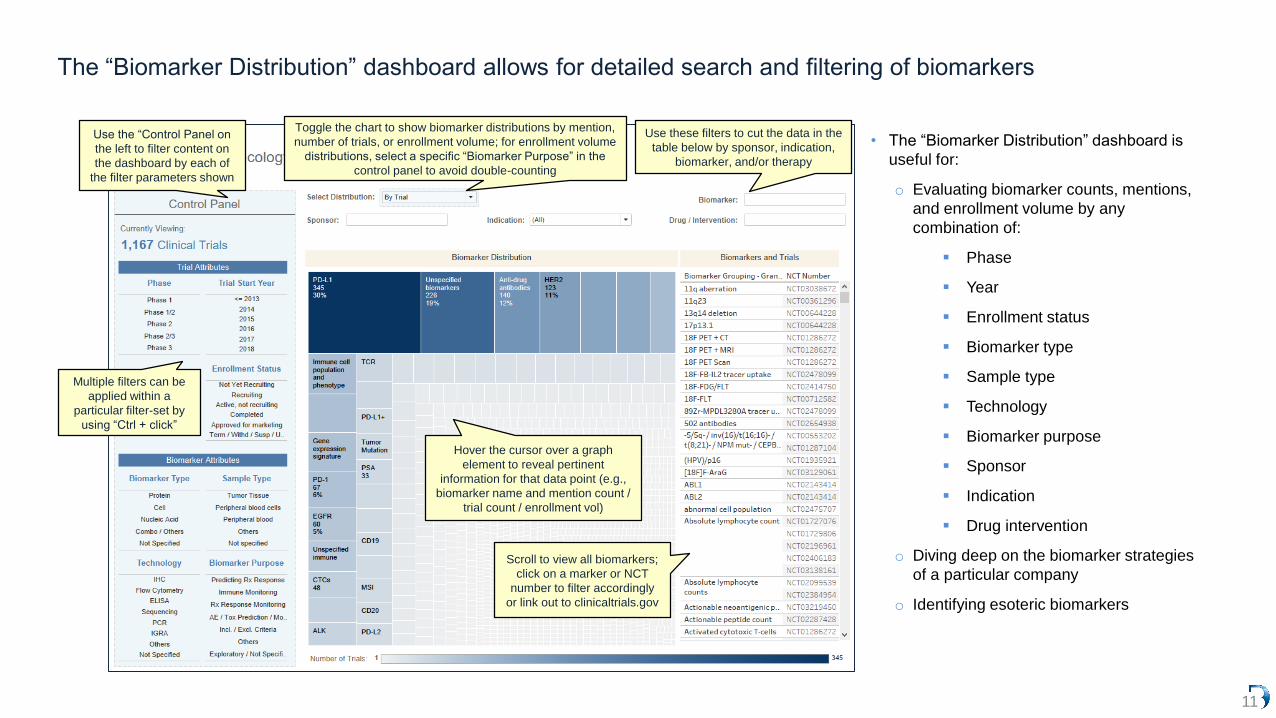
• The “Biomarker Distribution” dashboard is
useful for:
o Evaluating biomarker counts, mentions,
and enrollment volume by any
combination of:
▪ Phase
▪ Year
▪ Enrollment status
▪ Biomarker type
▪ Sample type
▪ Technology
▪ Biomarker purpose
▪ Sponsor
▪ Indication
▪ Drug intervention
o Diving deep on the biomarker strategies
of a particular company
o Identifying esoteric biomarkers
The “Biomarker Distribution” dashboard allows for detailed search and filtering of biomarkers
Use these filters to cut the data in the
table below by sponsor, indication,
biomarker, and/or therapy
Hover the cursor over a graph
element to reveal pertinent
information for that data point (e.g.,
biomarker name and mention count /
trial count / enrollment vol)
Use the “Control Panel on
the left to filter content on
the dashboard by each of
the filter parameters shown
Multiple filters can be
applied within a
particular filter-set by
using “Ctrl + click”
Toggle the chart to show biomarker distributions by mention,
number of trials, or enrollment volume; for enrollment volume
distributions, select a specific “Biomarker Purpose” in the
control panel to avoid double-counting
Scroll to view all biomarkers;
click on a marker or NCT
number to filter accordingly
or link out to clinicaltrials.gov

12
• The “Trial Timeline” dashboard is useful
for:
o Identifying and tracking key upcoming
trial read-outs, overall and for specific
companies
o Assessing the timeline of progression
for particular biomarkers or
technologies
▪ Identifying near-, mid-, and
long-term biomarker and
technology trends
o Monitoring the progress of particular
trials of interest (e.g., changes in
enrollment or completion dates)
The “Trial Timeline” dashboard enables assessment of trial and biomarker activity over specific time-frames
Use the “Control Panel on
the left to filter content on
the dashboard by each of
the filter parameters shown
Multiple filters can be
applied within a
particular filter-set by
using “Ctrl + click”
Enter a sponsor name to show a timeline of the trials
for that sponsor within the selected time frame
Click here to select the time frame over
which you want to explore trials (based on
the expected completion or primary
completion date); you can select any
number of days, weeks, months, or years
Toggle the graph to show either primary
completion dates or trial completion dates
Enter a biomarker here, or click on a biomarker in
the table below to show the timeline of trials
exploring that particular marker
Click on a graph element to
show the trial timelines for any
particular indication
Click on a graph element to
show the trial timelines for
any particular technology

13
Access to the BioMAP is provided via Tableau Online, a cloud-based data visualization program; the
BioMAP can also be provided as a packaged workbook for viewing with the Desktop Tableau Reader
Dashboard Navigation
• A fully-functional demo of the BioMAP, containing
information from a limited data set of 175 trials, can
be accessed via the following link and login
credentials:
o Link: https://goo.gl/hSgnD8
o Username: [email protected]
o Password: decibiodemo1
• Email [email protected] if you would like a live
demo of the full-version of the BioMAP

14
Access to the I/O BioMAP is provided via Tableau Online; BioMAP subscription pricing varies depending
on the desired number of dashboards and the desired update frequency; custom dashboards and analysis
can be scoped separately
I/O BioMAP License Rates
Number of Dashboards
Annual Data Update Rate
1x(Once annually)
2x(Every-other quarter)
4x(Every quarter)
1
3
All
All licenses are global, allowing anyone within a
customer organization to access the BioMAP
Custom dashboards, using existing BioMAP data
and/or proprietary data can be developed; pricing
varies based on scope
DeciBio is happy to explore ways to customize the BioMAP to best suit customer needs
The BioMAP can be often be offered at a discount
if bundled with a consulting engagement
Annual licenses range from $2,500 - $45,000
depending on number of dashboards, frequency of
data updates, and organization size; email
[email protected] for pricing information for your
organization


![Reproducibility and predictive value of scoring stromal ...tutorial from the immuno-oncology biomarker working group [19], links to the digitised slides, and a MS Excel template. Participants](https://img.pdfslide.us/doc/110x75/5fa294d099beef0a4e690b5c/reproducibility-and-predictive-value-of-scoring-stromal-tutorial-from-the-immuno-oncology.jpg)