Embed Size (px)
Citation preview
Introduction to Data Skills in Geography, funded by the Nuffield Foundation
Simon Pinfield
Data Skills in Geography -Main aims
To support teachers and students in their:
• understanding of data skills;
• confidence in their use and application, including integration
of the skills into lesson plans; and
• knowledge of their value to further study and employment.
The programme will also raise awareness in both Higher
Education and in schools about the current change in demand
for data skills within Geography GCSE, A Level and the
Geography QAA benchmark. We aim to upskill the teachers of
today and enhance the abilities of the teachers of tomorrow.
• CPD events, including partnership events, such as this one
• HE input / liaison and work with ITT institutions
• Strengthening existing networks and creating new ones
How will the RGS-IBG do this?
• Production of online teaching resources for
the new GCSE and A Level specifications,
based around topics and fieldwork skills, to
be published at www.rgs.org/dataskills
• Attending CPD events, like this one
• Using the RGS-IBG resources (visit www.rgs.org/dataskills),
when available, and collaborating with others to share good
practice
• Offering to work with other schools and perhaps leading a
cluster group (new or existing)
• Using the RGS-IBG short units of work / lesson plans for GCSE
and A Level, written by teachers / other experts
• Using the Edexcel website for further advice and resources
How to get involved…
Simon Pinfield
Project Coordinator: Data Skills in Geography
Royal Geographical Society (with IBG)
1 Kensington Gore
London
SW7 2AR
T: +44 (0)20 7591 3051
W: www.rgs.org/dataskills
Funded by the Nuffield Foundation
Contact
Session outline
1. This session will introduce the relevance and meaning of quantification skills in geography
2. We will think about how skills and data fit into the new GCSEs and AS/A level
3. There will also be an opportunity to consider the Pearson Progression Scale for Geography
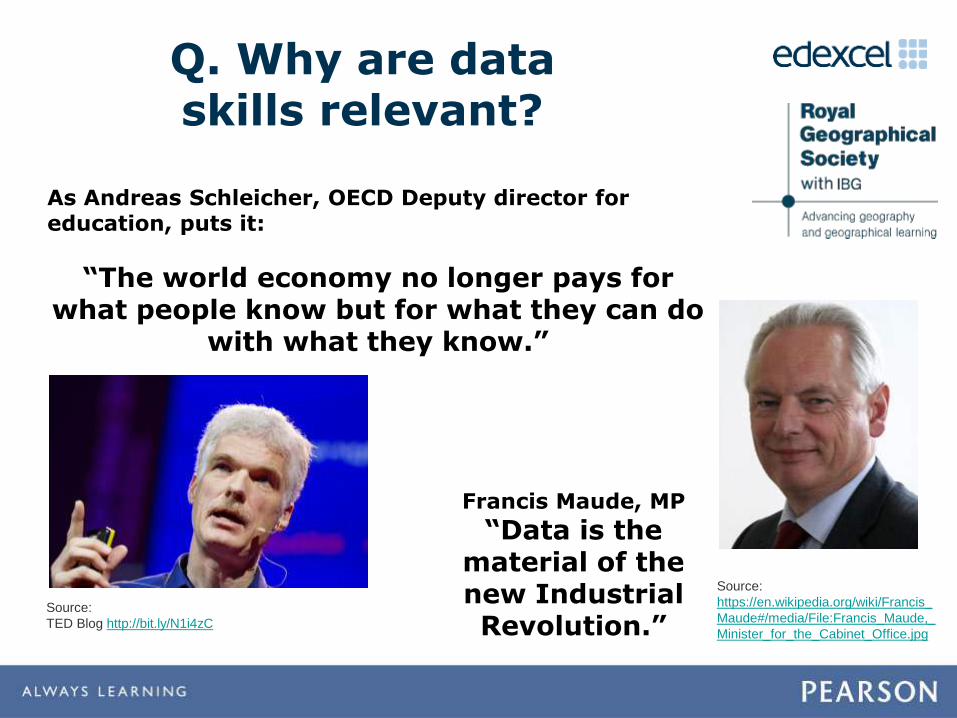
Q. Why are data skills relevant?
As Andreas Schleicher, OECD Deputy director for education, puts it:
“The world economy no longer pays for what people know but for what they can do
with what they know.”
Source:
TED Blog http://bit.ly/N1i4zC
Francis Maude, MP
“Data is the material of the new Industrial Revolution.”
Source:
https://en.wikipedia.org/wiki/Francis_
Maude#/media/File:Francis_Maude,_
Minister_for_the_Cabinet_Office.jpg
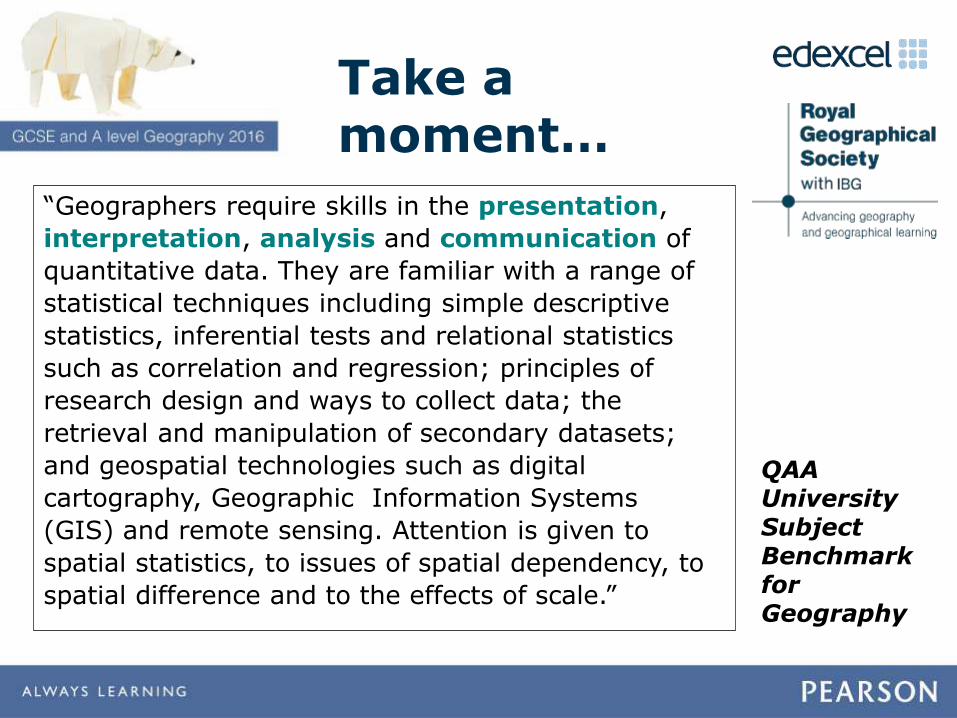
Take a moment….“Geographers require skills in the presentation,
interpretation, analysis and communication of
quantitative data. They are familiar with a range of
statistical techniques including simple descriptive
statistics, inferential tests and relational statistics
such as correlation and regression; principles of
research design and ways to collect data; the
retrieval and manipulation of secondary datasets;
and geospatial technologies such as digital
cartography, Geographic Information Systems
(GIS) and remote sensing. Attention is given to
spatial statistics, to issues of spatial dependency, to
spatial difference and to the effects of scale.”
QAA University Subject Benchmark for Geography
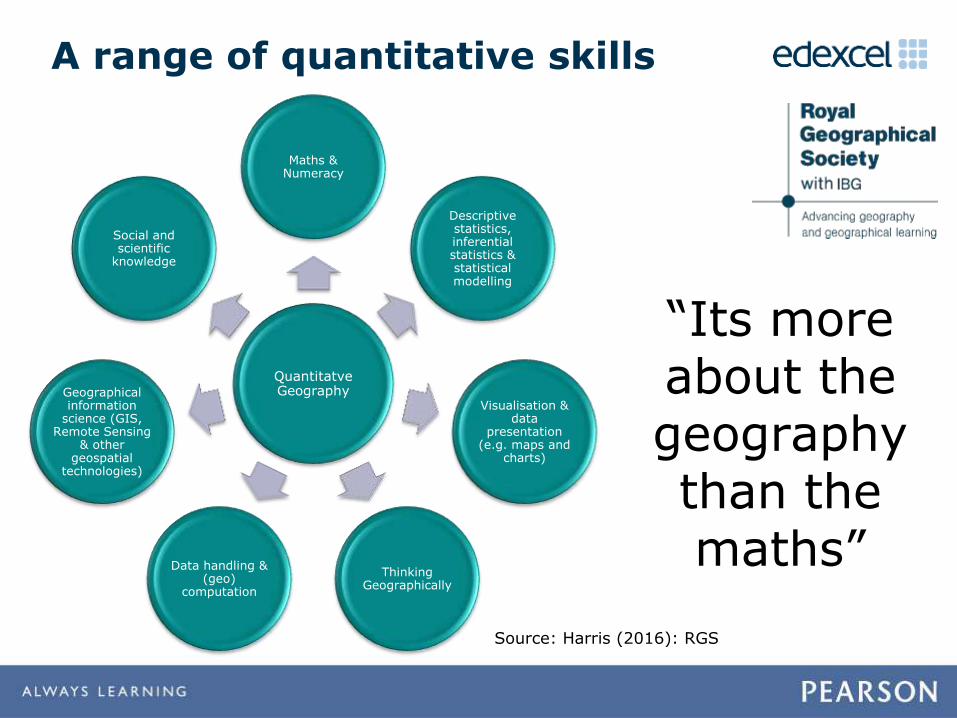
Quantitatve Geography
Maths & Numeracy
Descriptive statistics, inferential statistics & statistical modelling
Visualisation & data
presentation (e.g. maps and
charts)
Thinking Geographically
Data handling & (geo)
computation
Geographical information
science (GIS, Remote Sensing
& other geospatial
technologies)
Social and scientific
knowledge
Source: Harris (2016): RGS
A range of quantitative skills
“Its more about the geography than the maths”
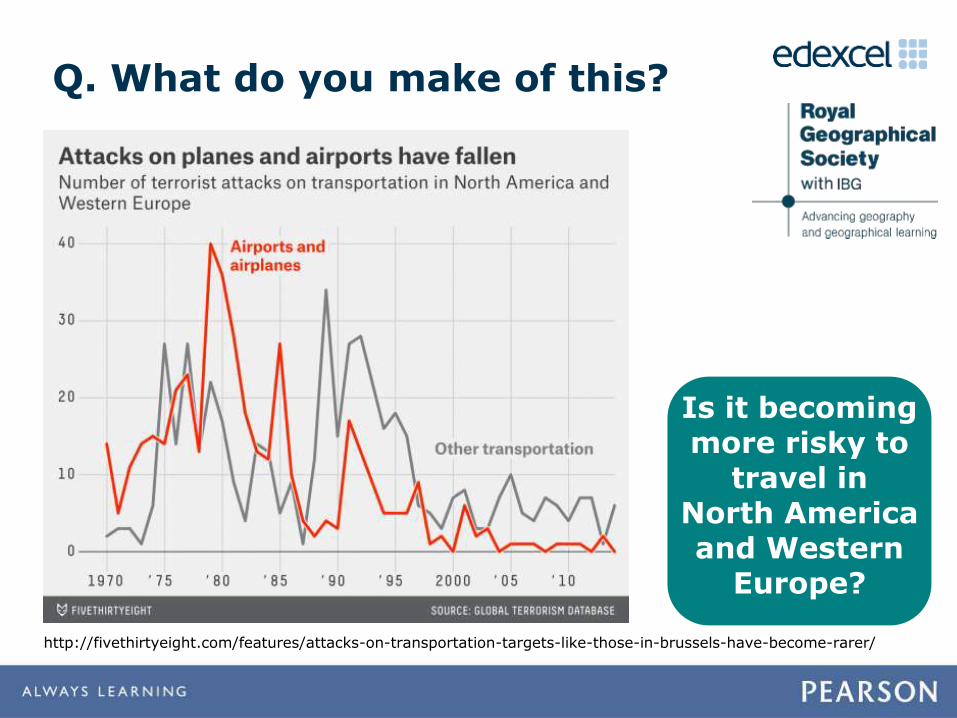
http://fivethirtyeight.com/features/attacks-on-transportation-targets-like-those-in-brussels-have-become-rarer/
Q. What do you make of this?
Is it becoming more risky to
travel in North America and Western
Europe?
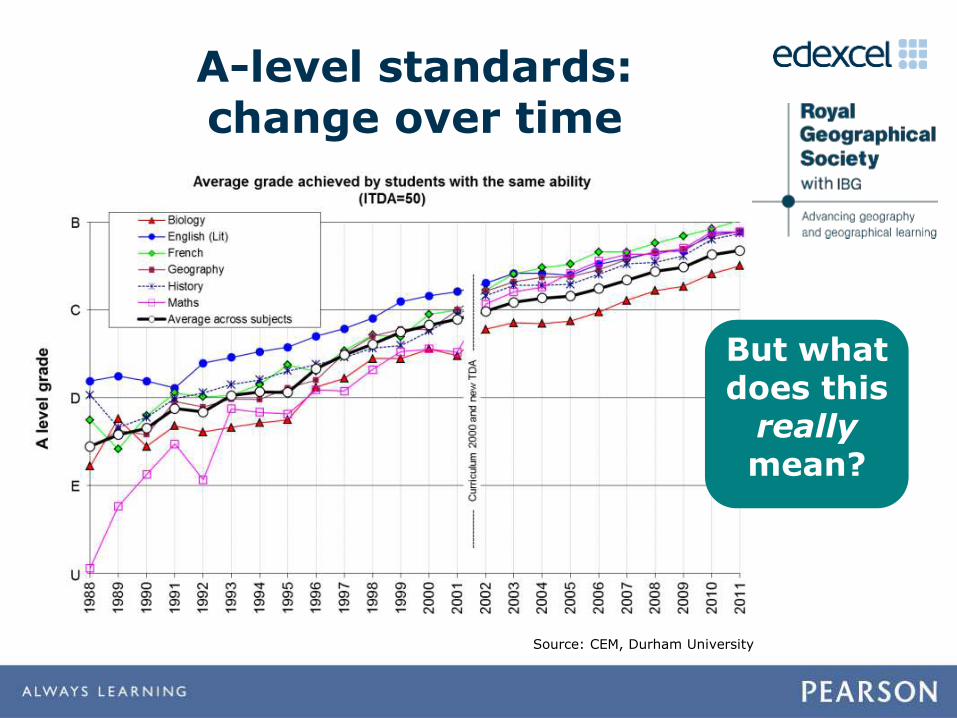
But what does this
reallymean?
Source: CEM, Durham University
A-level standards: change over time
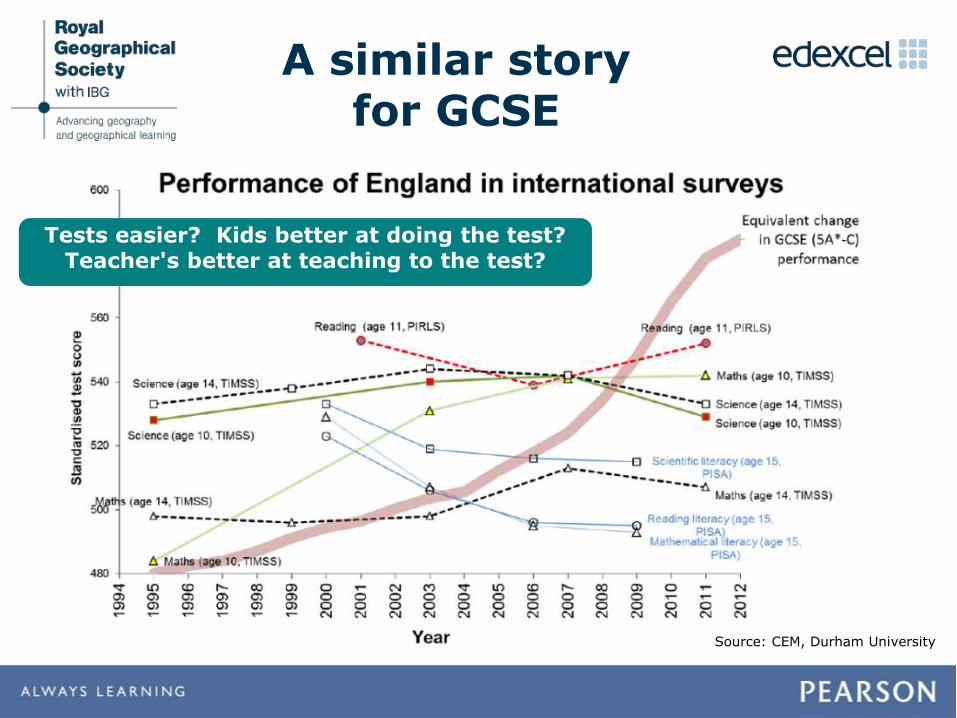
A similar story for GCSE
Tests easier? Kids better at doing the test? Teacher's better at teaching to the test?
Source: CEM, Durham University
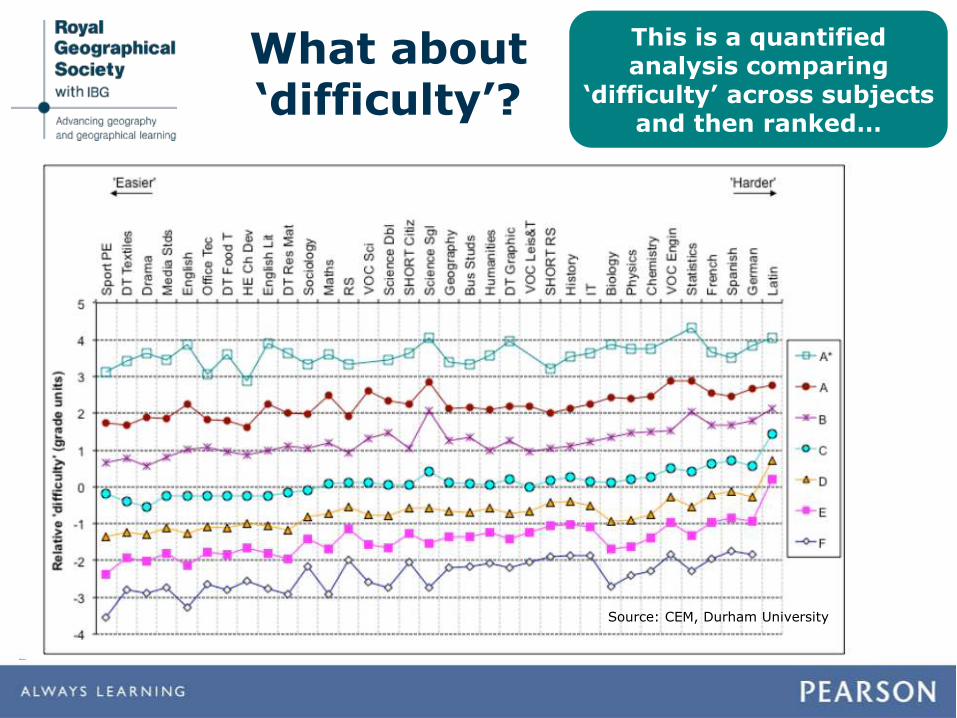
What about ‘difficulty’?
This is a quantified analysis comparing
‘difficulty’ across subjects and then ranked…
Source: CEM, Durham University
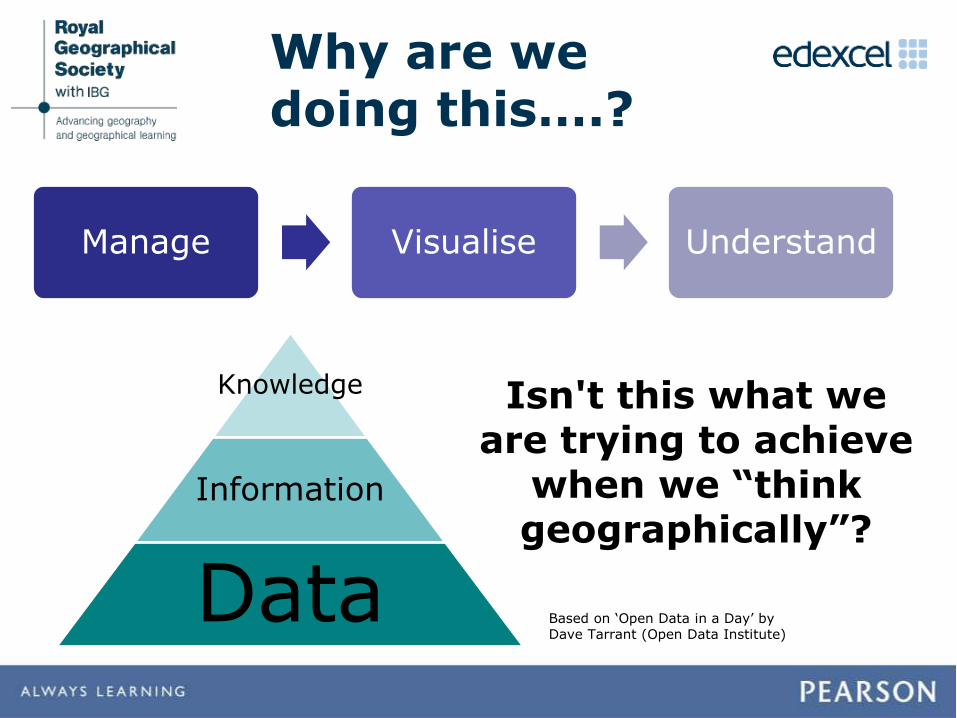
Why are we doing this….?
Manage Visualise Understand
Isn't this what we are trying to achieve
when we “think geographically”?
Based on ‘Open Data in a Day’ by Dave Tarrant (Open Data Institute)
Knowledge
Information
Data
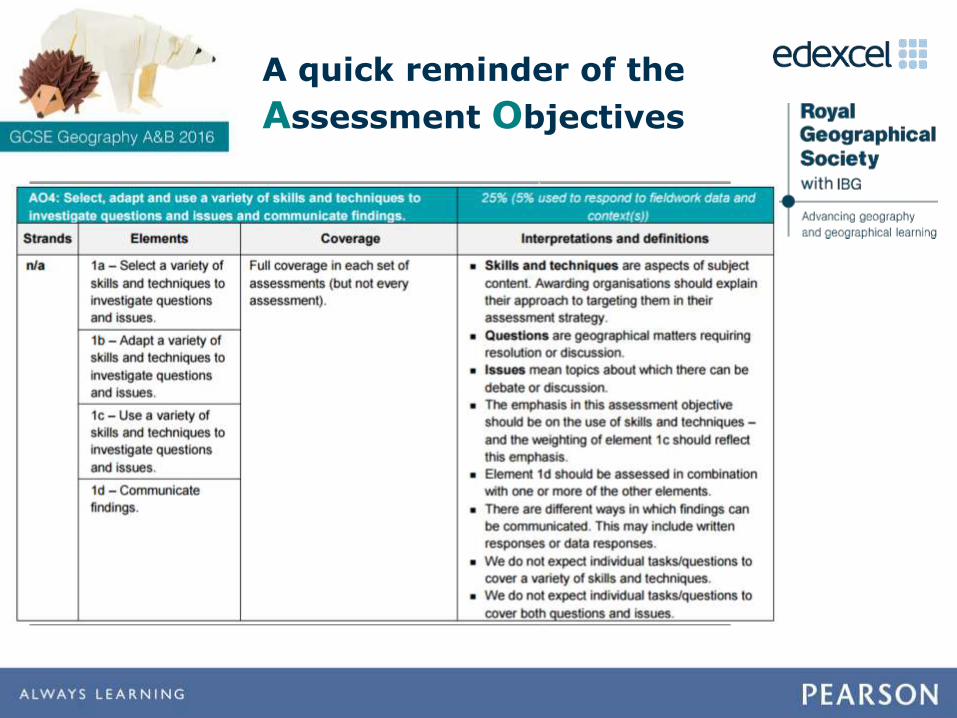
A quick reminder of the
Assessment Objectives
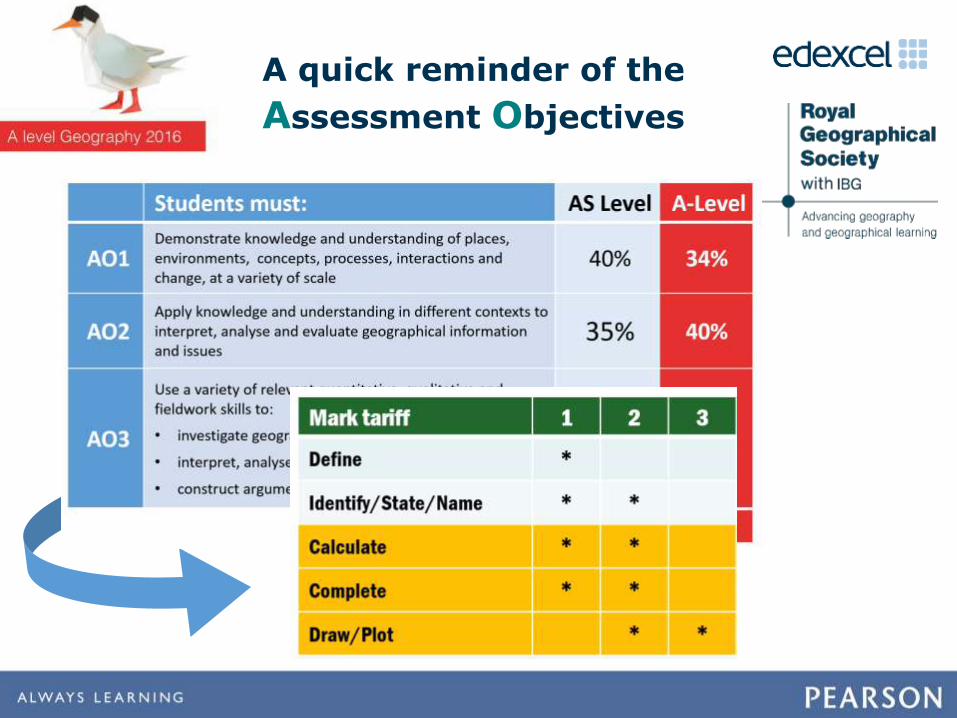
A quick reminder of the
Assessment Objectives
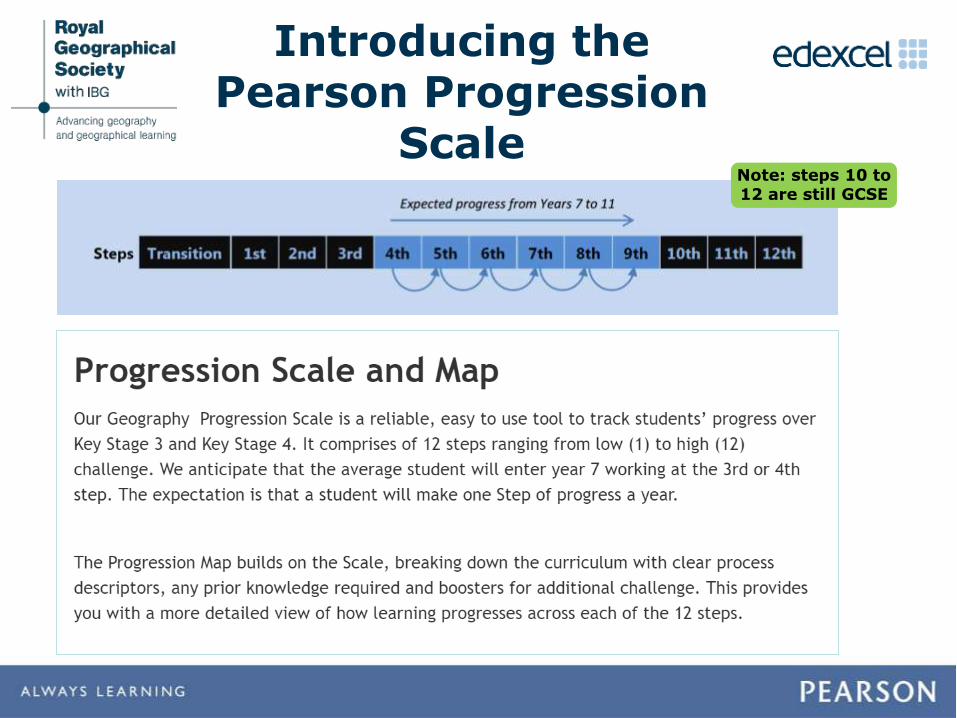
Introducing the Pearson Progression
ScaleNote: steps 10 to 12 are still GCSE
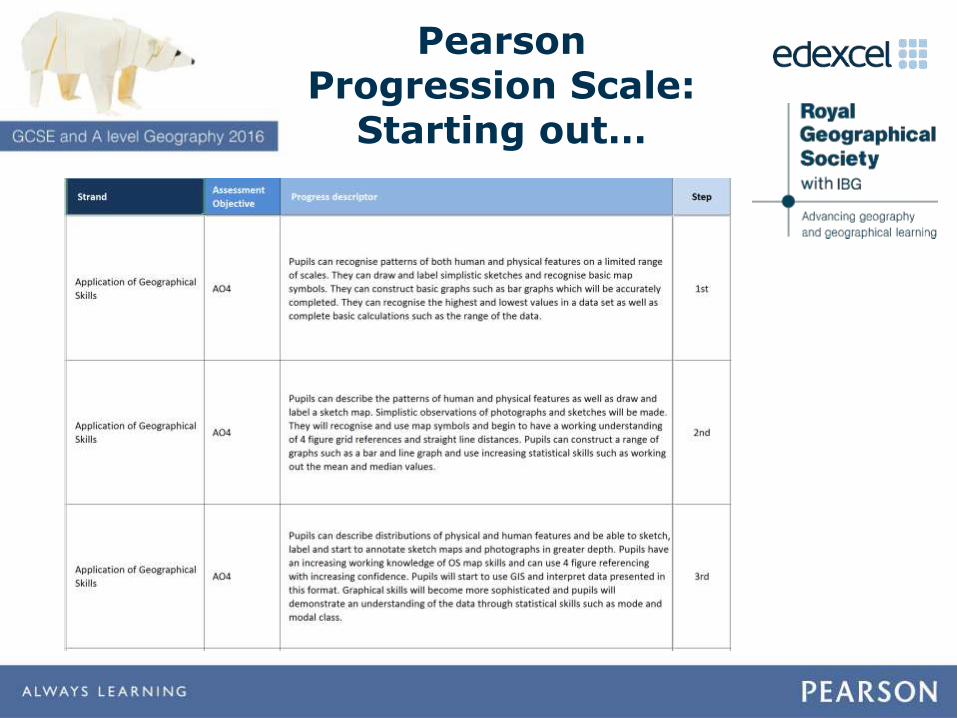
Pearson Progression Scale:
Starting out…
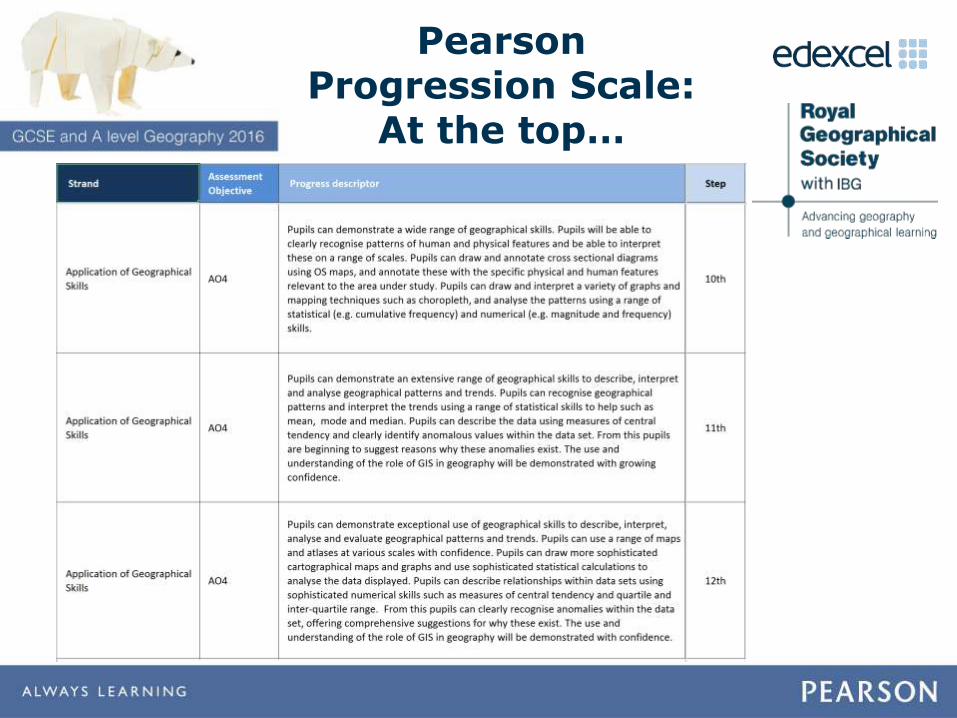
Pearson Progression Scale:
At the top…
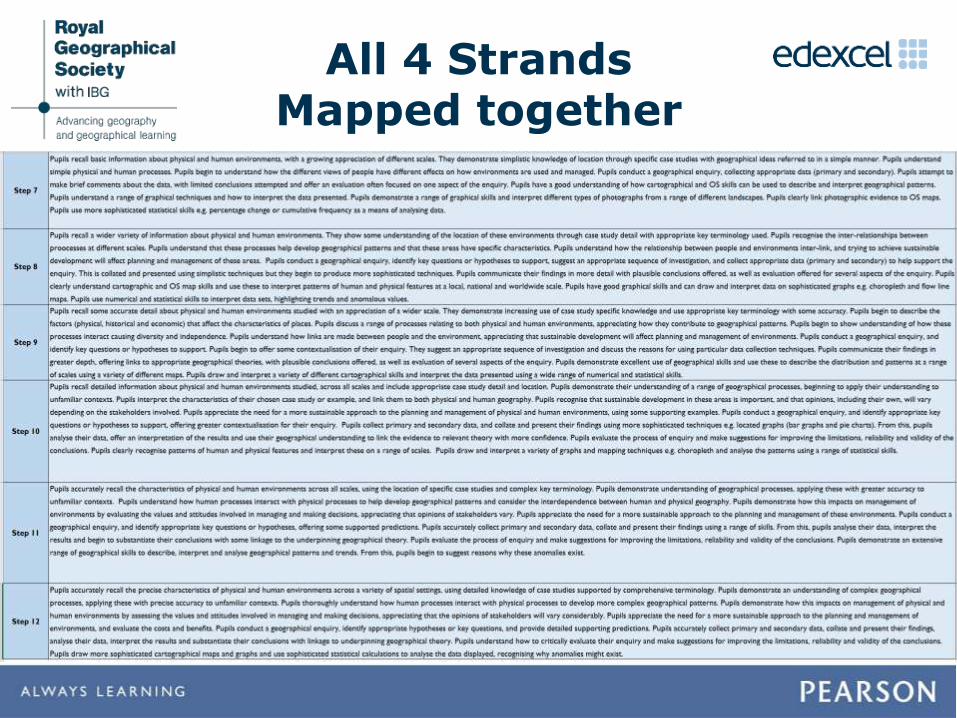
All 4 Strands Mapped together
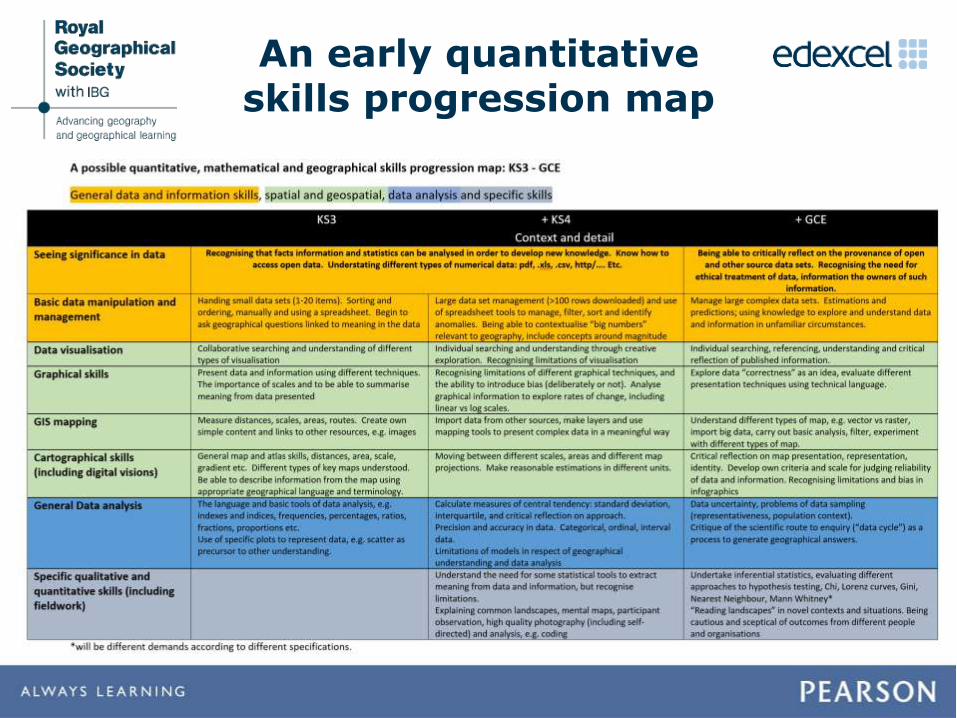
An early quantitative skills progression map
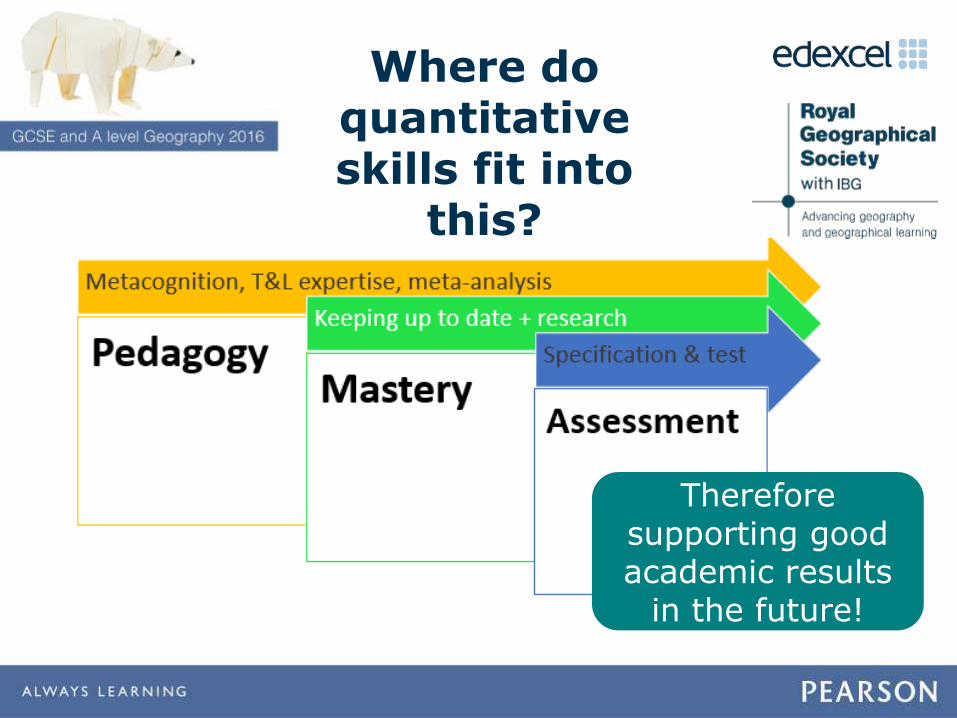
Where do quantitative skills fit into
this?
Therefore supporting good academic results
in the future!
David Holmes
@dave905947
Session 2
Edexcel Maths for Geographers Guide
4.00 – 4.30pm
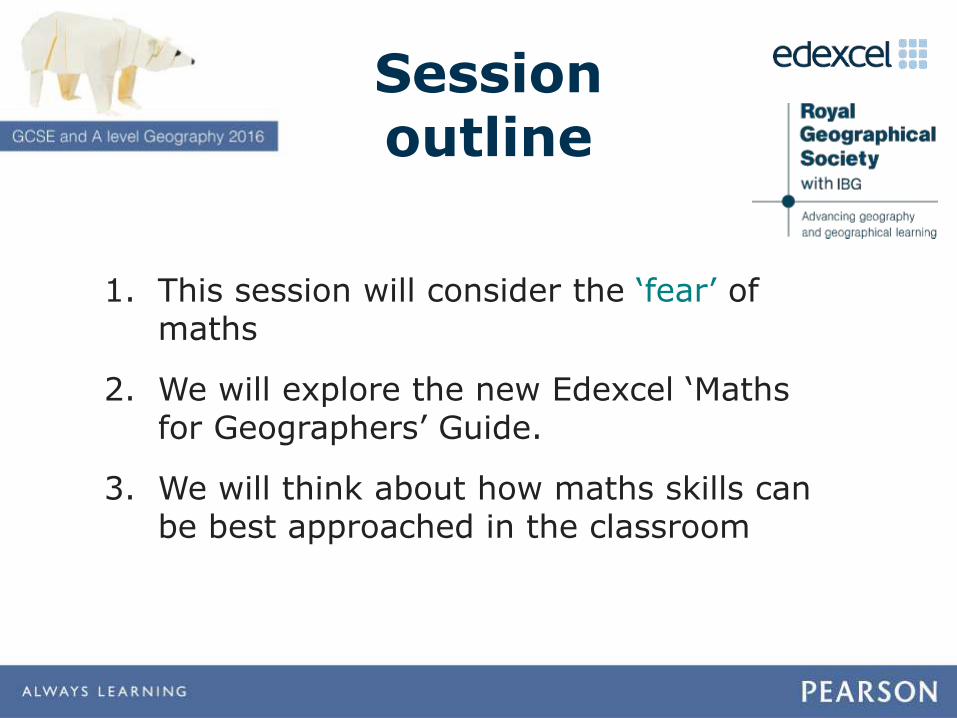
1. This session will consider the ‘fear’ of maths
2. We will explore the new Edexcel ‘Maths for Geographers’ Guide.
3. We will think about how maths skills can be best approached in the classroom
Session outline
https://www.heacademy.ac.uk/resources/detail/detail/disciplines/Maths_Stats_OR/Skills-in-Mathematics-and-
Statistics-in-geography
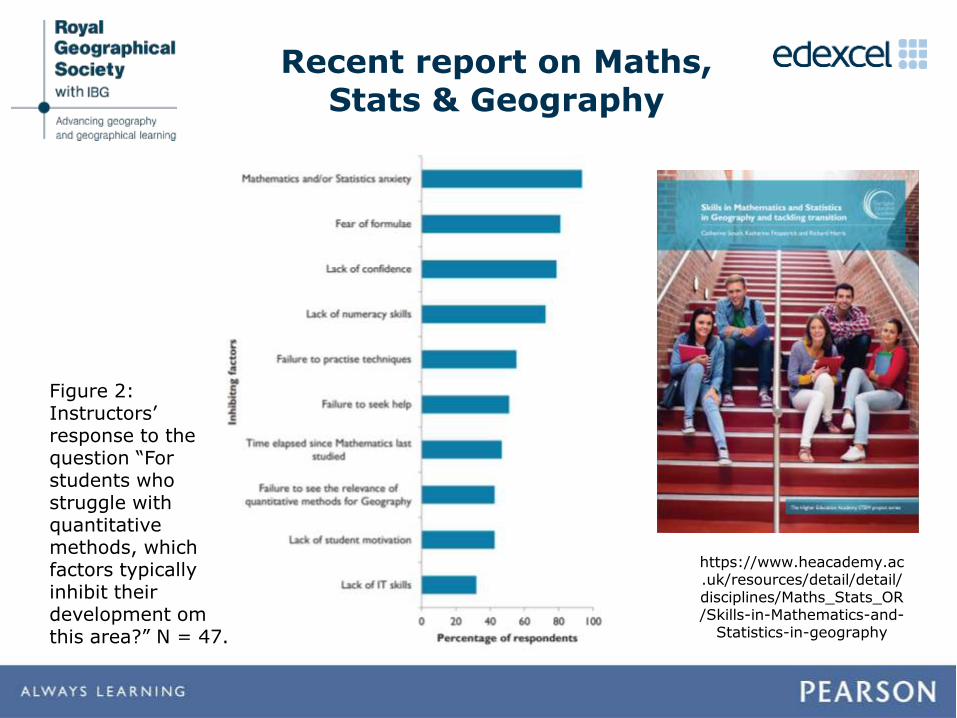
Recent report on Maths, Stats & Geography
Figure 2: Instructors’ response to the question “For students who struggle with quantitative methods, which factors typically inhibit their development om this area?” N = 47.
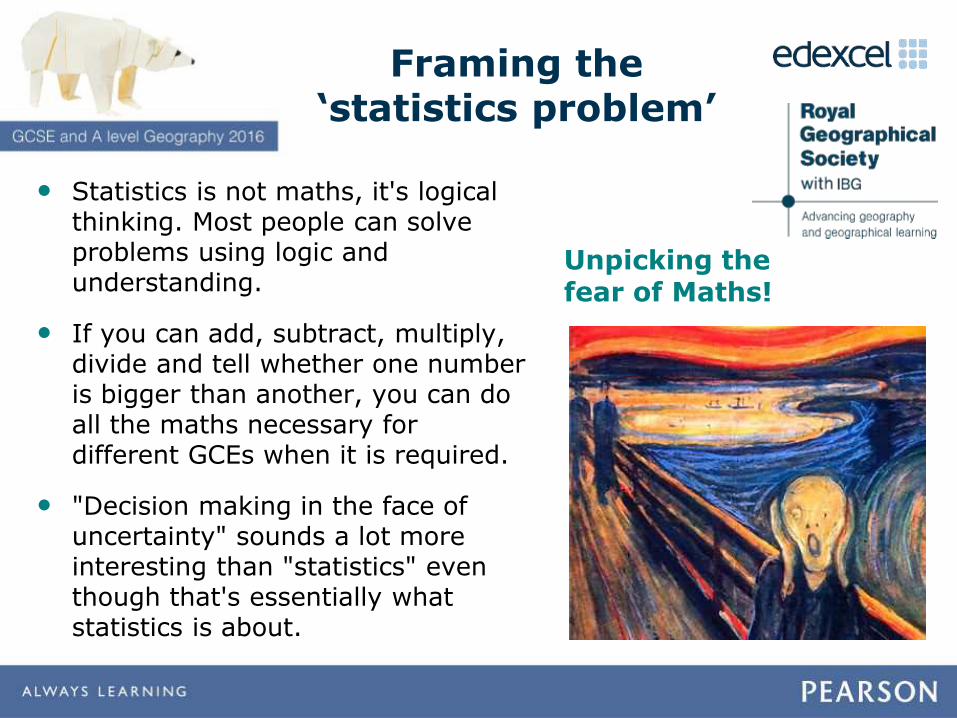
Framing the ‘statistics problem’
• Statistics is not maths, it's logical thinking. Most people can solve problems using logic and understanding.
• If you can add, subtract, multiply, divide and tell whether one number is bigger than another, you can do all the maths necessary for different GCEs when it is required.
• "Decision making in the face of uncertainty" sounds a lot more interesting than "statistics" even though that's essentially what statistics is about.
Unpicking the fear of Maths!
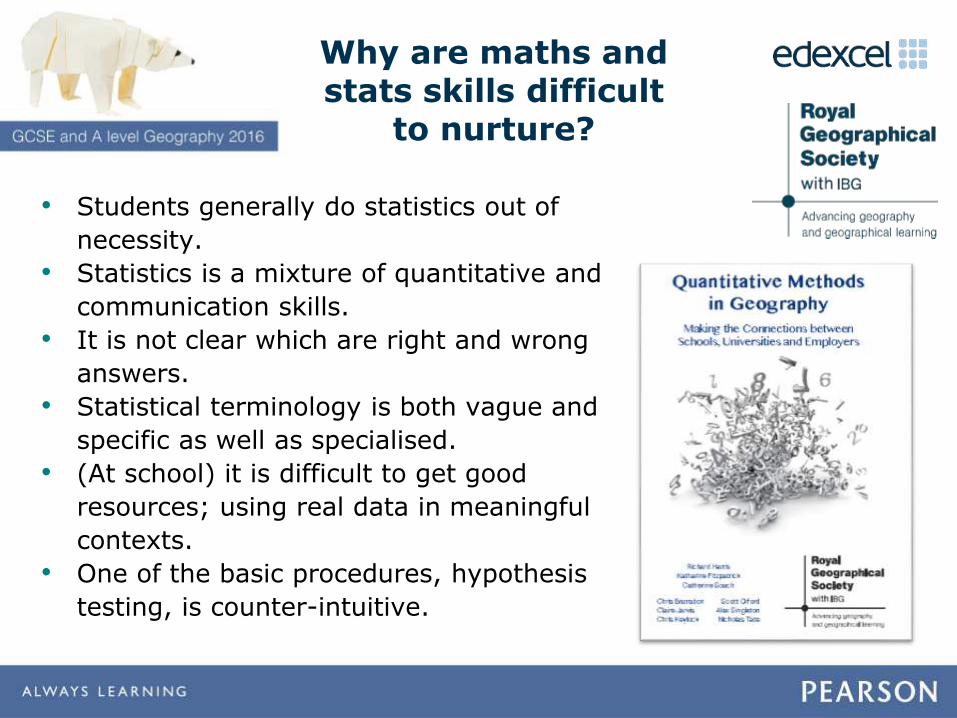
Why are maths and stats skills difficult
to nurture?
• Students generally do statistics out of
necessity.
• Statistics is a mixture of quantitative and
communication skills.
• It is not clear which are right and wrong
answers.
• Statistical terminology is both vague and
specific as well as specialised.
• (At school) it is difficult to get good
resources; using real data in meaningful
contexts.
• One of the basic procedures, hypothesis
testing, is counter-intuitive.
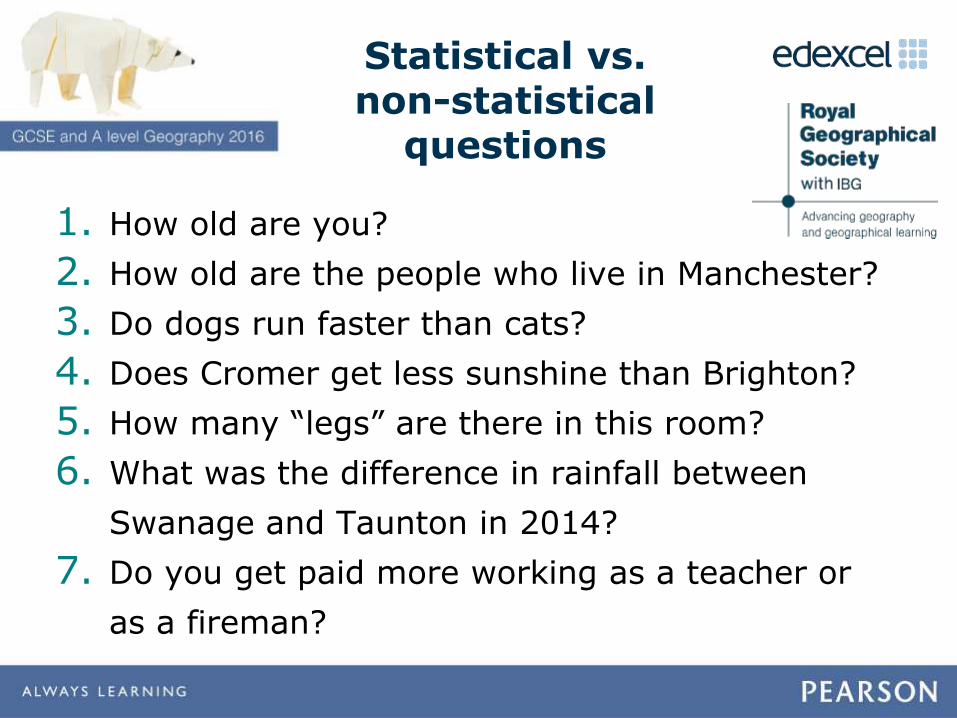
Statistical vs. non-statistical
questions
1. How old are you?
2. How old are the people who live in Manchester?
3. Do dogs run faster than cats?
4. Does Cromer get less sunshine than Brighton?
5. How many “legs” are there in this room?
6. What was the difference in rainfall between
Swanage and Taunton in 2014?
7. Do you get paid more working as a teacher or
as a fireman?
Edexcel Maths for Geographers Guide
Its about connecting maths and geography, using the Pearson Maths
approach
Free support provided on the Edexcel website
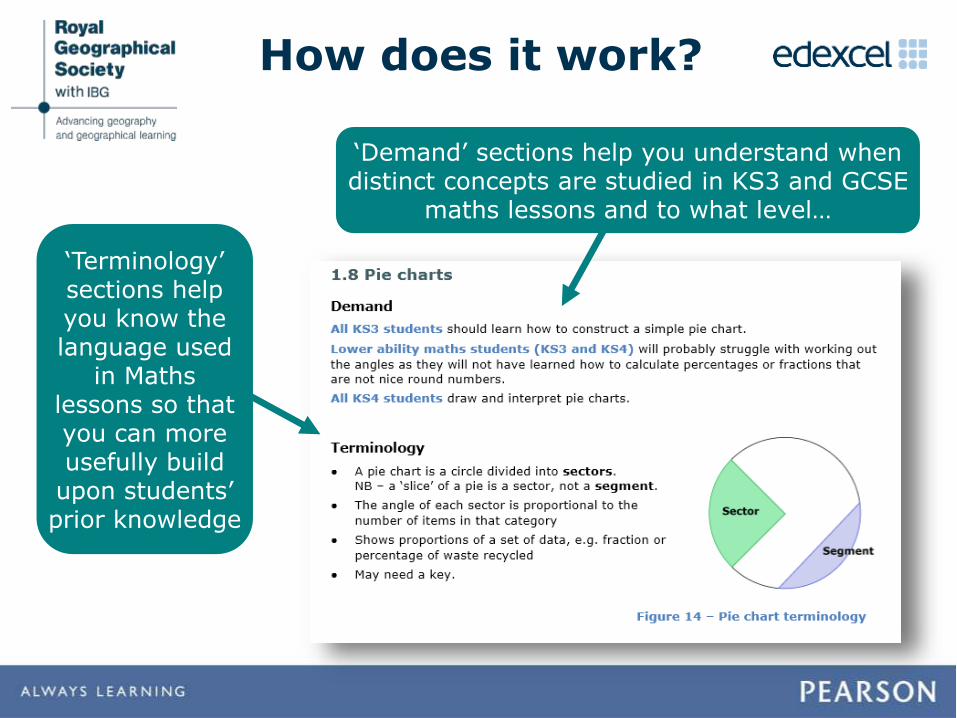
How does it work?
‘Demand’ sections help you understand when distinct concepts are studied in KS3 and GCSE
maths lessons and to what level…
‘Terminology’ sections help you know the language used
in Maths lessons so that you can more usefully build
upon students’ prior knowledge
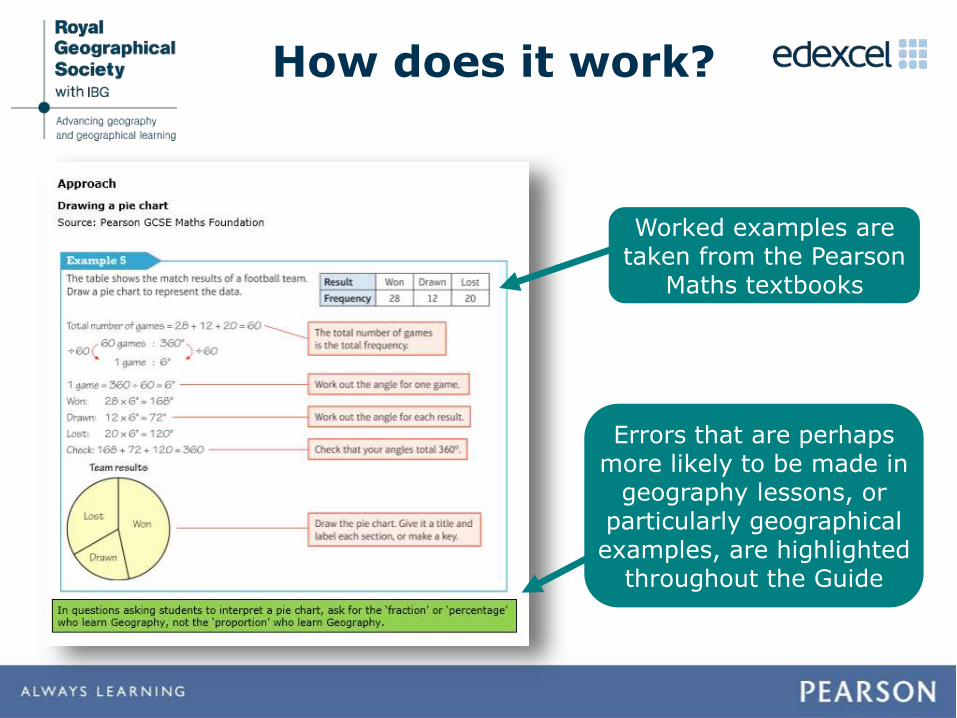
How does it work?
Worked examples are taken from the Pearson
Maths textbooks
Errors that are perhaps more likely to be made in
geography lessons, or particularly geographical examples, are highlighted
throughout the Guide
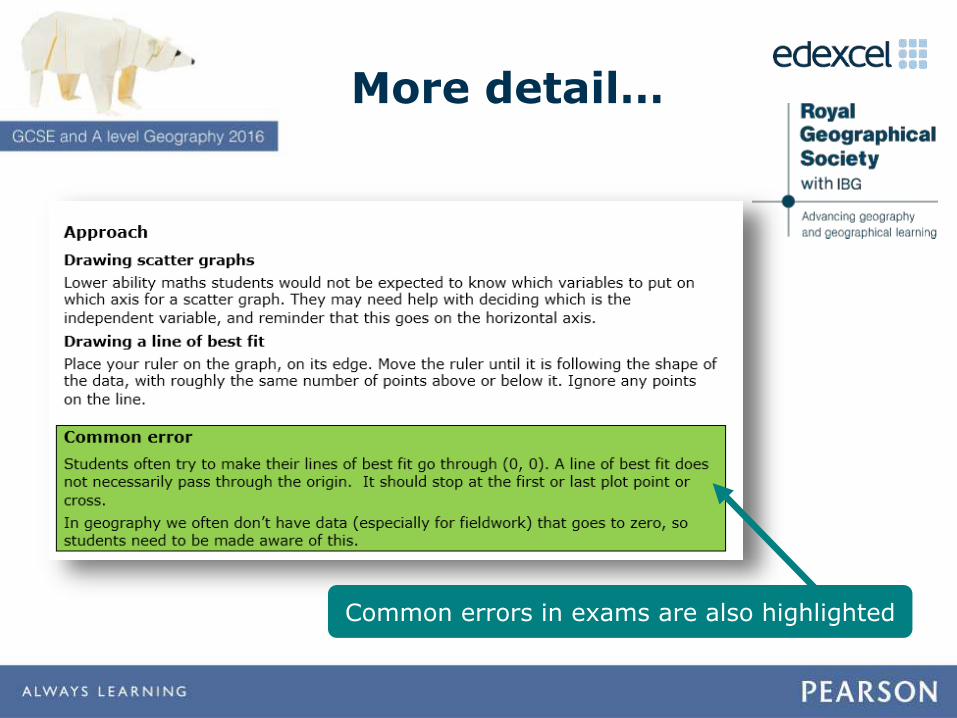
More detail…
Common errors in exams are also highlighted
DELEGATE Activity
(1) Specification
(2) Maths Guide
(3) Question
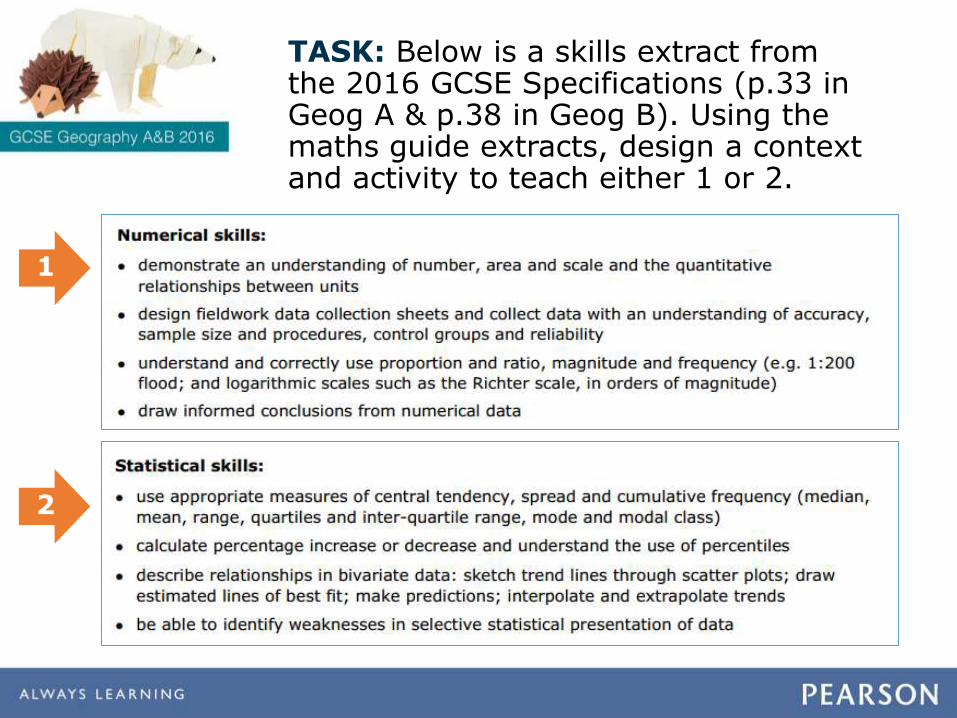
TASK: Below is a skills extract from the 2016 GCSE Specifications (p.33 in Geog A & p.38 in Geog B). Using the maths guide extracts, design a context and activity to teach either 1 or 2.
1
2
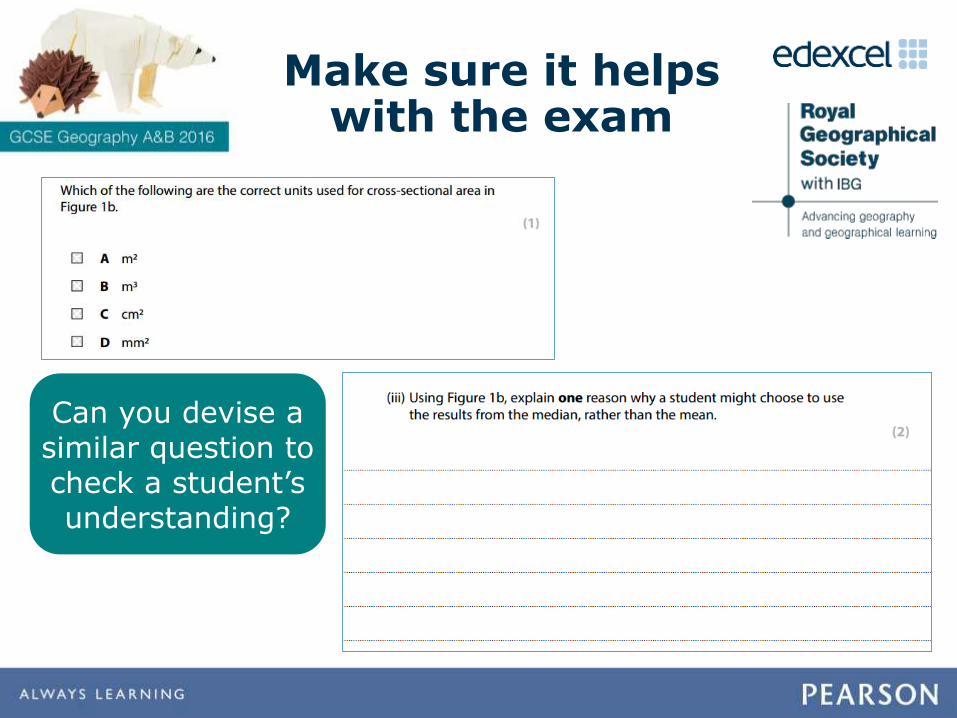
Make sure it helps with the exam
Can you devise a similar question to check a student’s understanding?
Session 3
Bringing quantitative data to life in geography
4.30 – 5.00pm
Simon Pinfield
• This session will introduce the relevance and meaning of quantitative skills in the context of the Edexcel GCSE geography topics.
• You will be shown examples of how to integrate skills into your lessons.
Session outline
GCSE topics & integrated skills
• Both of the new Edexcel specifications suggest
distinct geographical skills that might be integrated
within the teaching of each topic.
• The Royal Geographical Society (with IBG) is developing a
range of useful resources and lesson plans to help with this.
These resources will be available at www.rgs.org/dataskills.
• Visit the Edexcel webpage ‘Supporting our accredited Edexcel
GCSE (9–1) Geography A and Geography B’ for further details
and links to course materials http://bit.ly/25dgkld
• Further guidance can be found in spec-specific textbooks *
*You don’t need to purchase resources to deliver our qualifications.
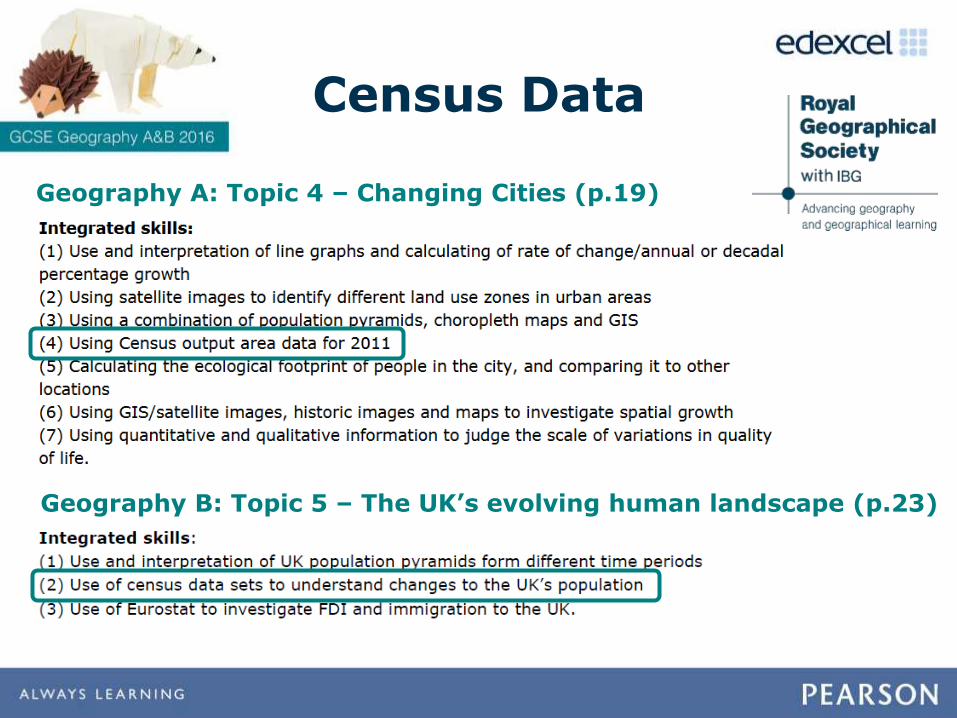
Census Data
Geography A: Topic 4 – Changing Cities (p.19)
Geography B: Topic 5 – The UK’s evolving human landscape (p.23)
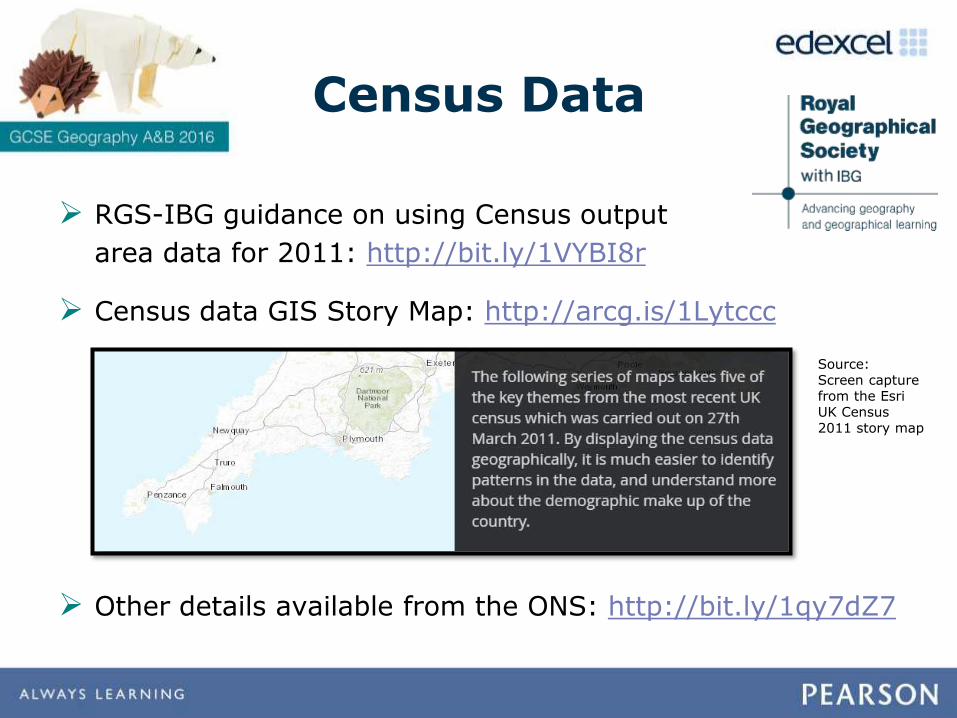
RGS-IBG guidance on using Census output
area data for 2011: http://bit.ly/1VYBI8r
Census data GIS Story Map: http://arcg.is/1Lytccc
Other details available from the ONS: http://bit.ly/1qy7dZ7
Source:Screen capture from the EsriUK Census 2011 story map
Census Data
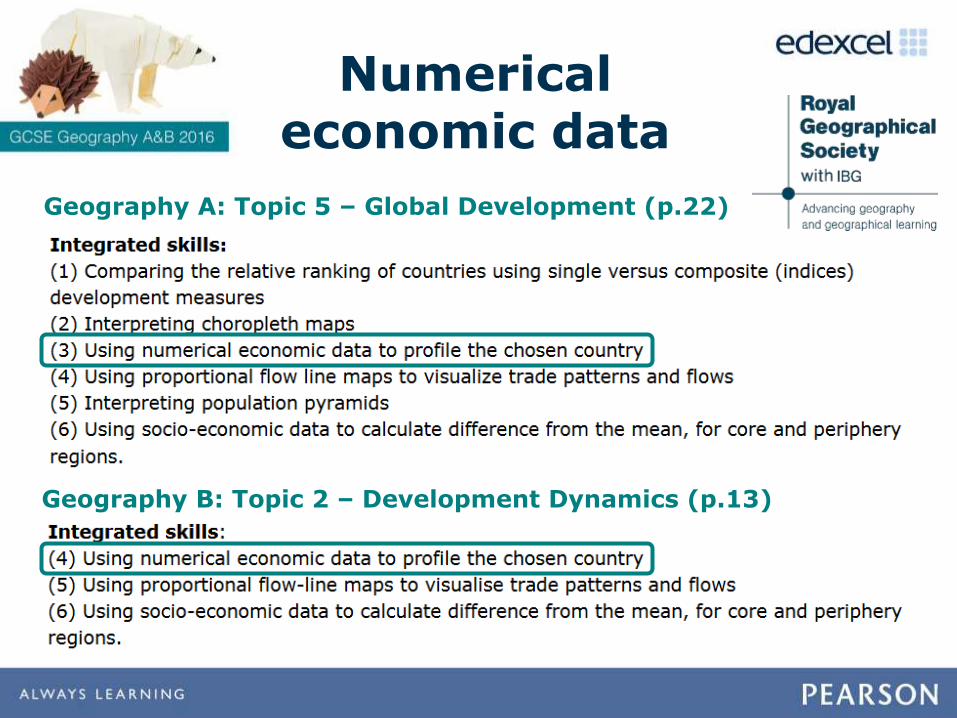
Numerical economic data
Geography A: Topic 5 – Global Development (p.22)
Geography B: Topic 2 – Development Dynamics (p.13)
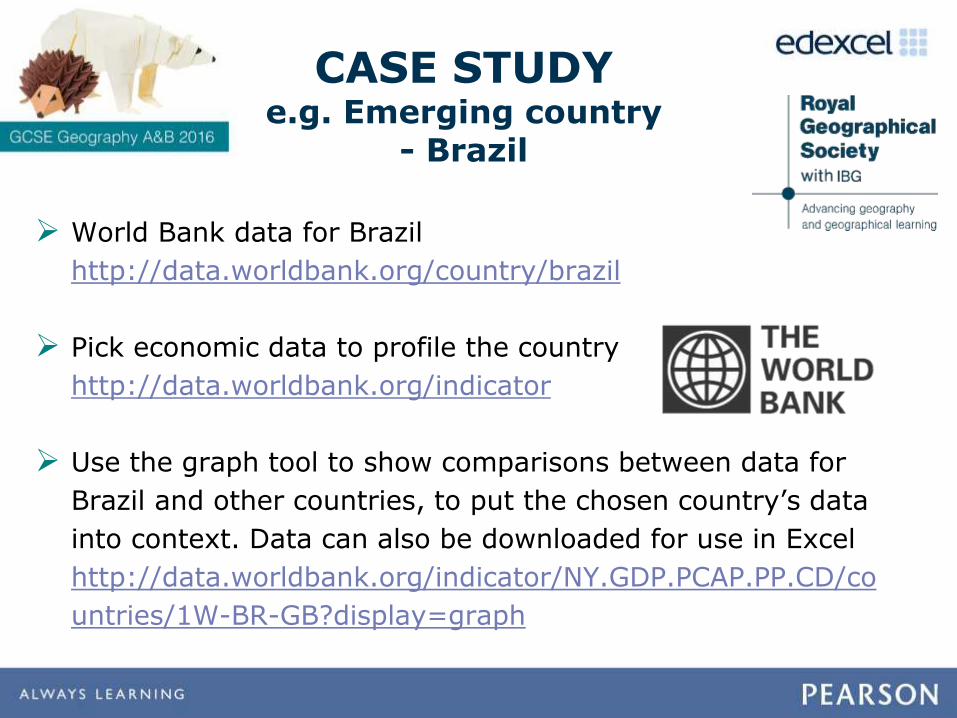
CASE STUDYe.g. Emerging country
- Brazil
World Bank data for Brazil
http://data.worldbank.org/country/brazil
Pick economic data to profile the country
http://data.worldbank.org/indicator
Use the graph tool to show comparisons between data for
Brazil and other countries, to put the chosen country’s data
into context. Data can also be downloaded for use in Excel
http://data.worldbank.org/indicator/NY.GDP.PCAP.PP.CD/co
untries/1W-BR-GB?display=graph
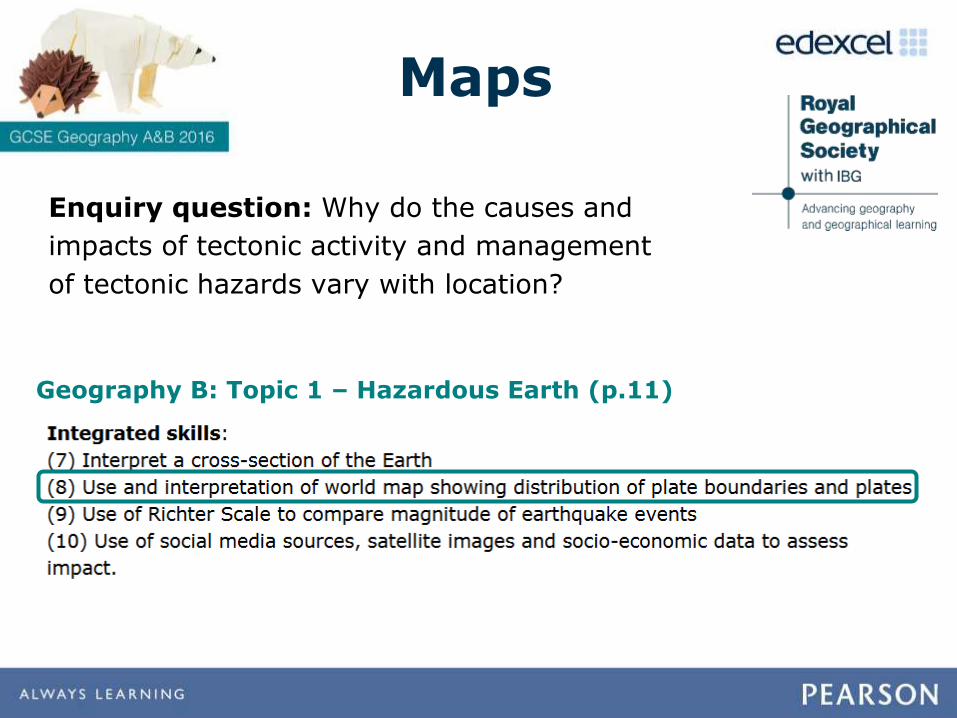
Enquiry question: Why do the causes and
impacts of tectonic activity and management
of tectonic hazards vary with location?
Maps
Geography B: Topic 1 – Hazardous Earth (p.11)
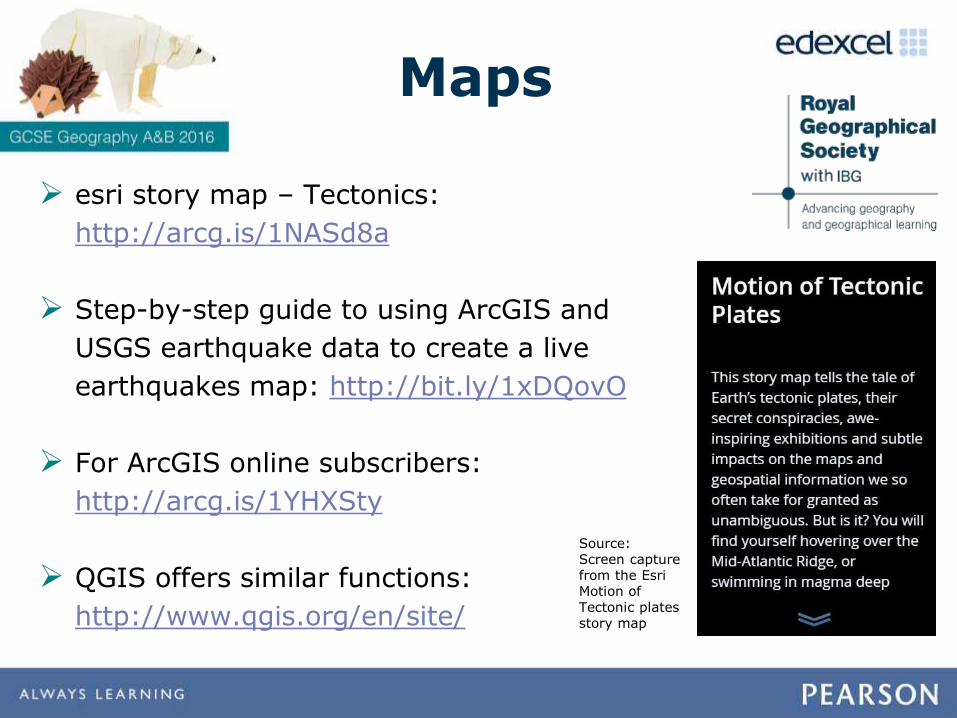
esri story map – Tectonics:
http://arcg.is/1NASd8a
Step-by-step guide to using ArcGIS and
USGS earthquake data to create a live
earthquakes map: http://bit.ly/1xDQovO
For ArcGIS online subscribers:
http://arcg.is/1YHXSty
QGIS offers similar functions:
http://www.qgis.org/en/site/
Maps
Source:Screen capture from the EsriMotion of Tectonic plates story map
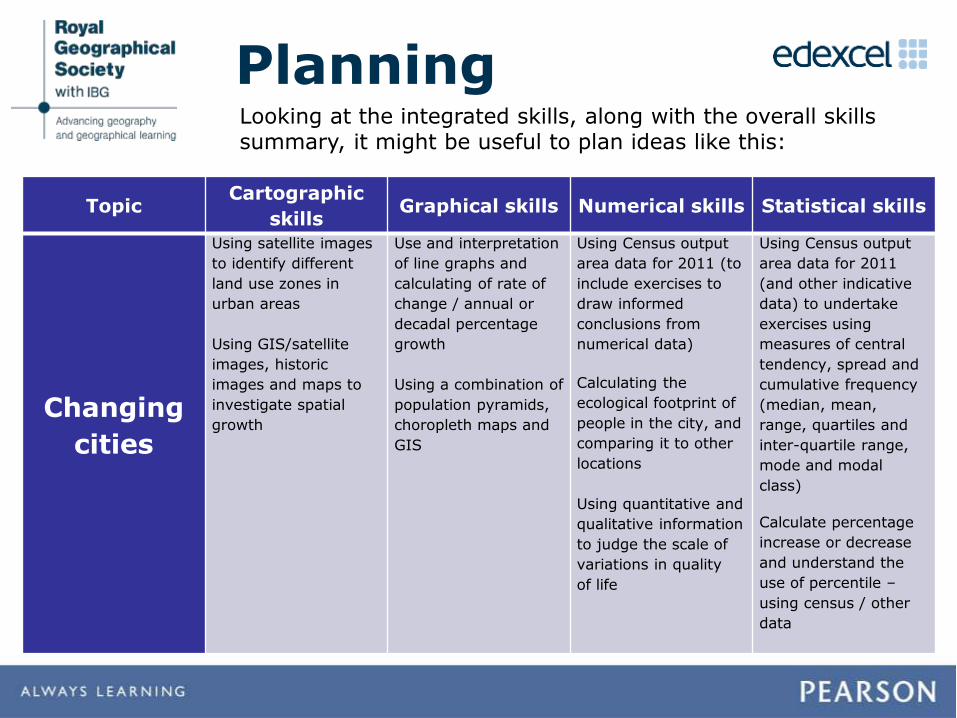
Planning
TopicCartographic
skillsGraphical skills Numerical skills Statistical skills
Changing
cities
Using satellite images
to identify different
land use zones in
urban areas
Using GIS/satellite
images, historic
images and maps to
investigate spatial
growth
Use and interpretation
of line graphs and
calculating of rate of
change / annual or
decadal percentage
growth
Using a combination of
population pyramids,
choropleth maps and
GIS
Using Census output
area data for 2011 (to
include exercises to
draw informed
conclusions from
numerical data)
Calculating the
ecological footprint of
people in the city, and
comparing it to other
locations
Using quantitative and
qualitative information
to judge the scale of
variations in quality
of life
Using Census output
area data for 2011
(and other indicative
data) to undertake
exercises using
measures of central
tendency, spread and
cumulative frequency
(median, mean,
range, quartiles and
inter-quartile range,
mode and modal
class)
Calculate percentage
increase or decrease
and understand the
use of percentile –
using census / other
data
Looking at the integrated skills, along with the overall skills summary, it might be useful to plan ideas like this:
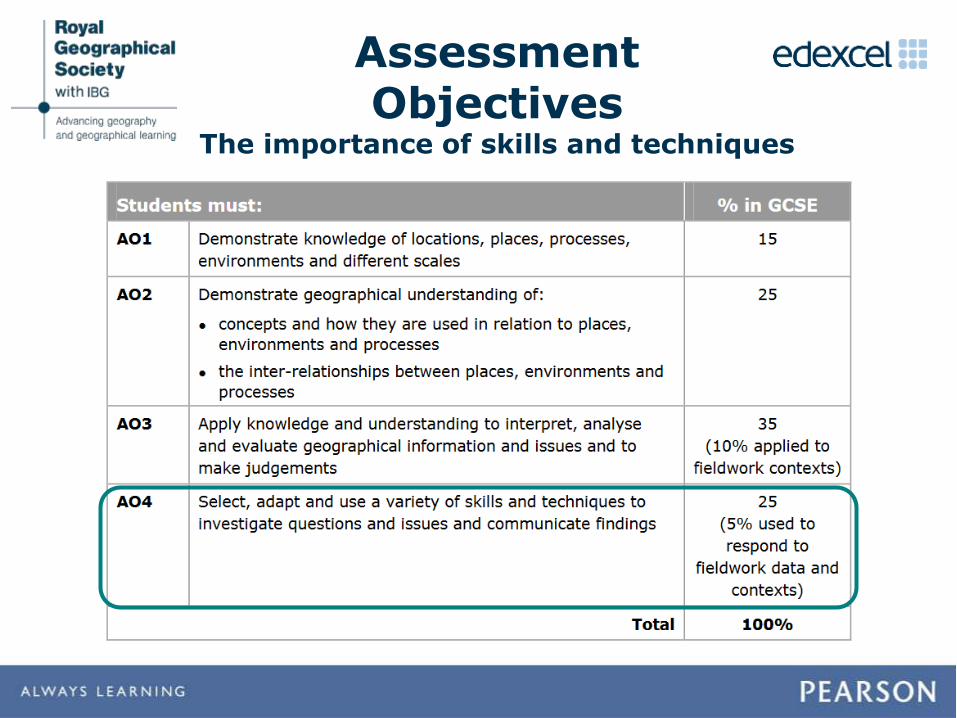
Assessment Objectives
The importance of skills and techniques
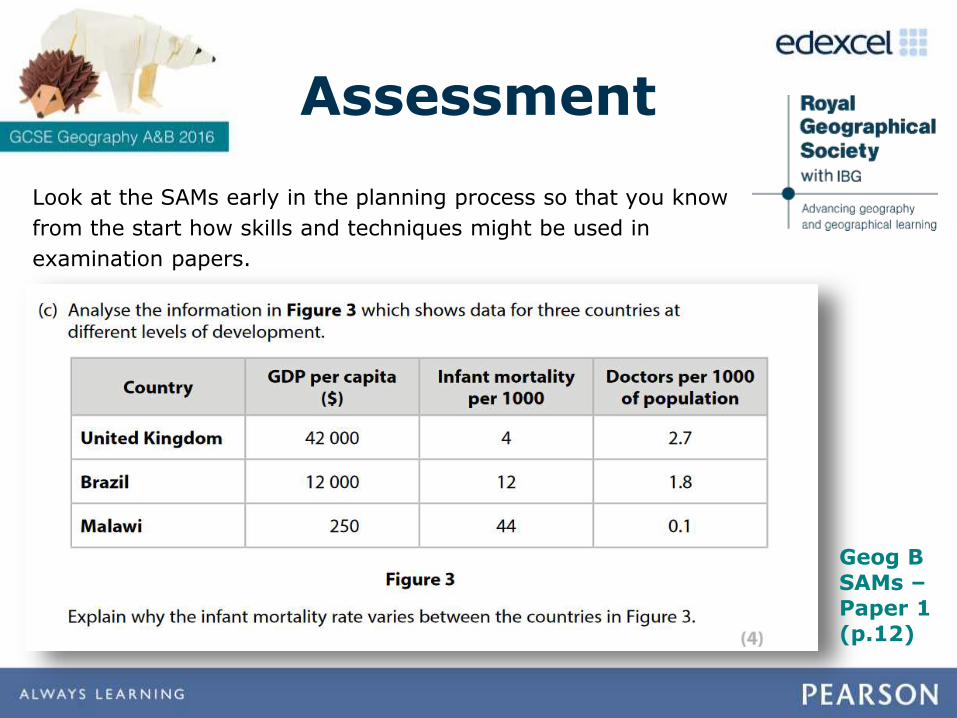
Assessment
Look at the SAMs early in the planning process so that you know
from the start how skills and techniques might be used in
examination papers.
Geog B SAMs –Paper 1 (p.12)
Closing comments…
• The development of skills and techniques should
be part of day-to-day teaching, rather than being a
standalone element or unit of work.
• There are many straightforward ways to integrate geographical
skills, as demonstrated today.
• Look out for separate guidance on fieldwork techniques, including
resources, which will be available at www.rgs.org/dataskills later
this year.
• Consult the Edexcel website for further support and documents
(e.g. SoWs, topic booklets & data/fieldwork worksheets are all free
to download)
Session 4
Exploring ‘Place’ through fieldwork
5.15 – 5.45pm
David Holmes
@dave905947
Session Outline
• This session will be a participatory workshop exploring question/hypothesis generation, contexts and methodologies for the A level Independent Investigation
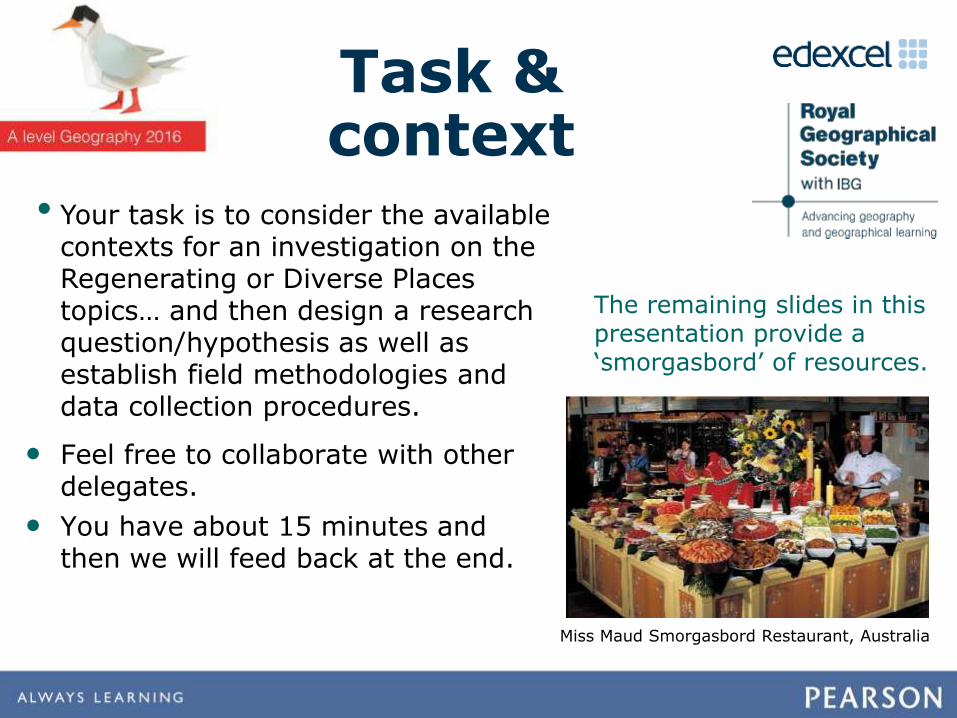
Task & context
• Your task is to consider the available contexts for an investigation on the Regenerating or Diverse Places topics… and then design a research question/hypothesis as well as establish field methodologies and data collection procedures.
The remaining slides in this presentation provide a ‘smorgasbord’ of resources.
• Feel free to collaborate with other delegates.
• You have about 15 minutes and then we will feed back at the end.
Miss Maud Smorgasbord Restaurant, Australia
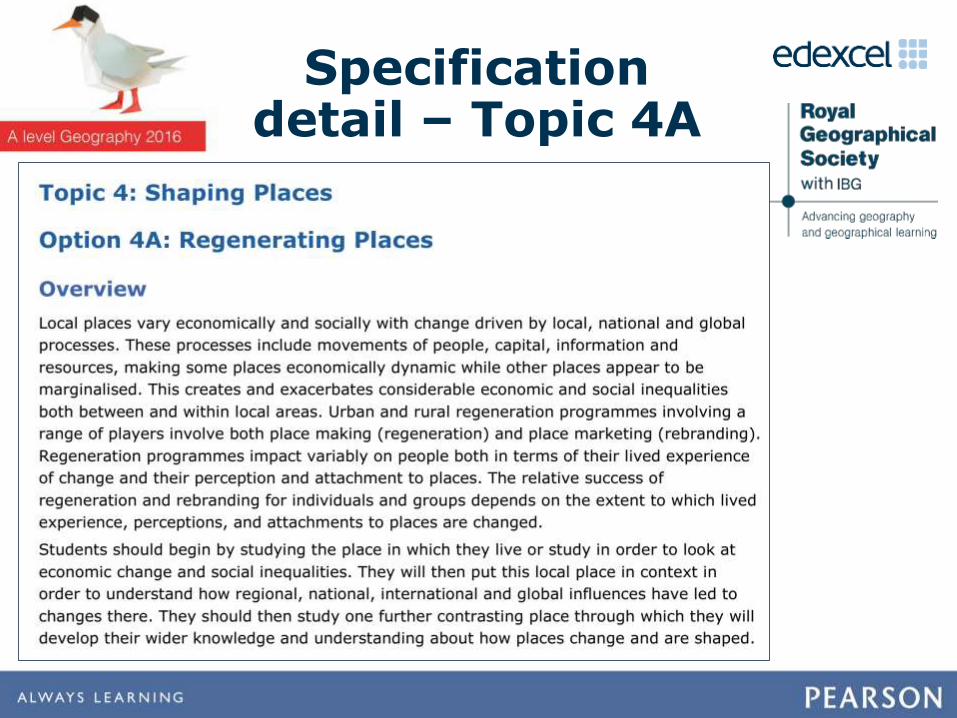
Specification detail – Topic 4A
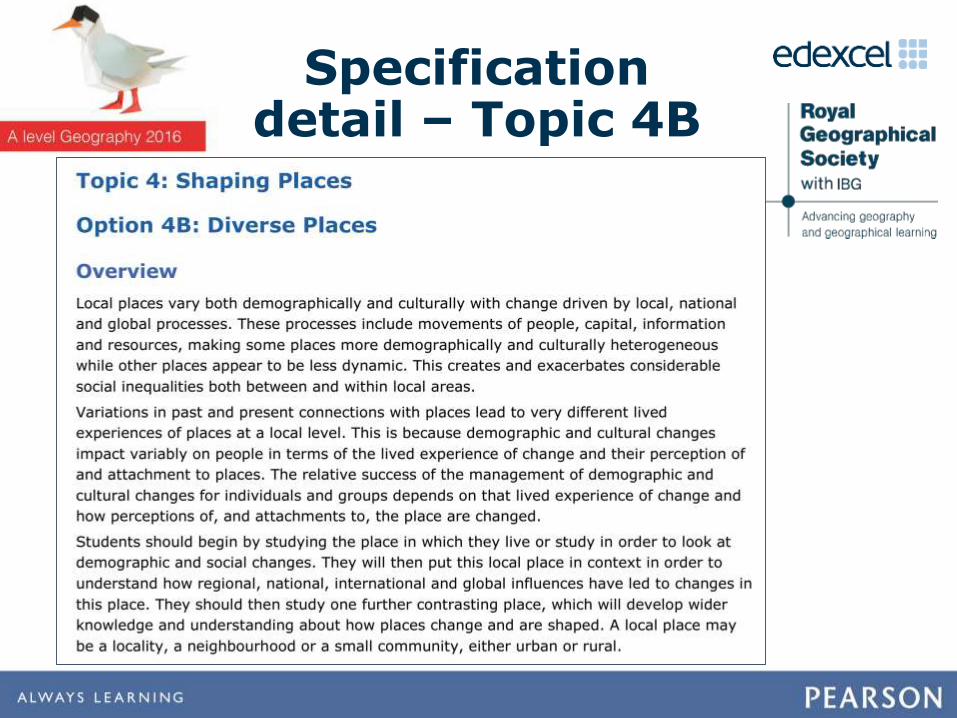
Specification detail – Topic 4B
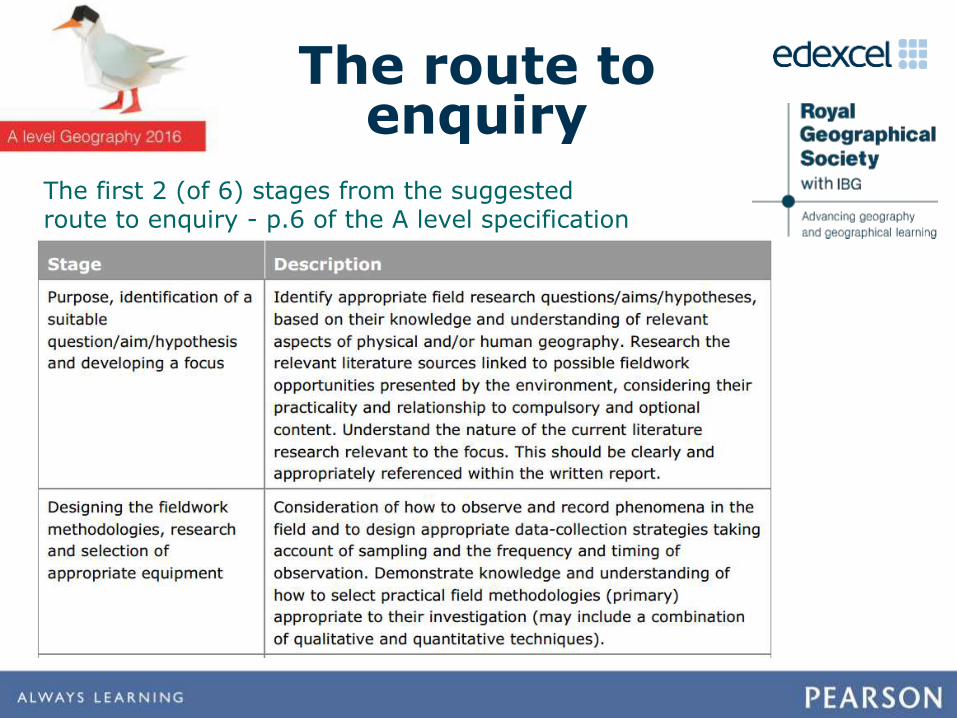
The route to enquiry
The first 2 (of 6) stages from the suggested route to enquiry - p.6 of the A level specification
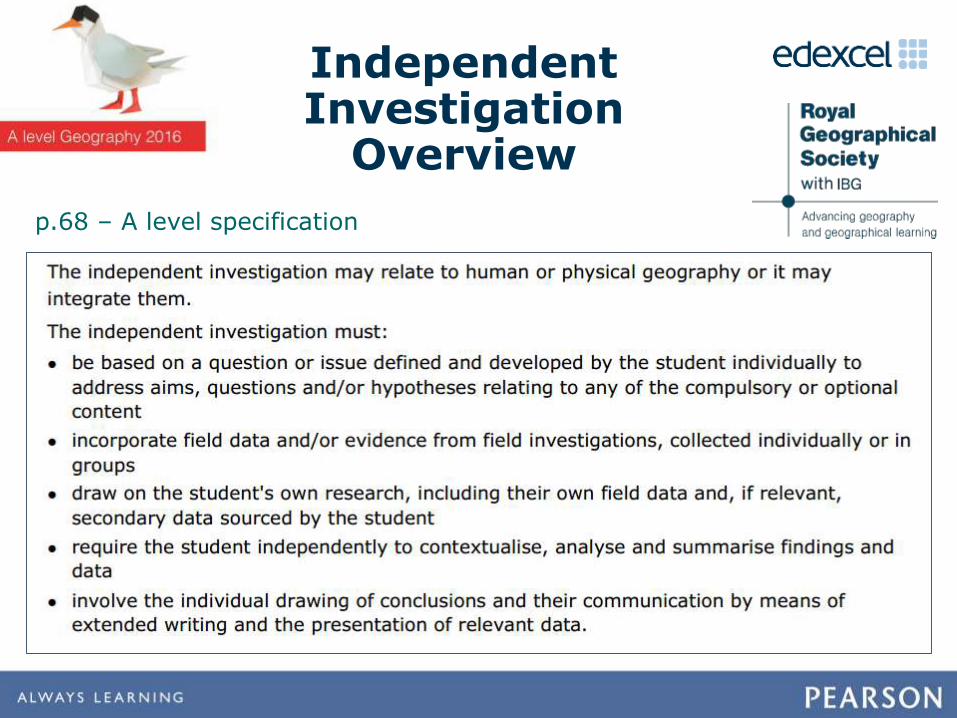
Independent Investigation
Overview
p.68 – A level specification
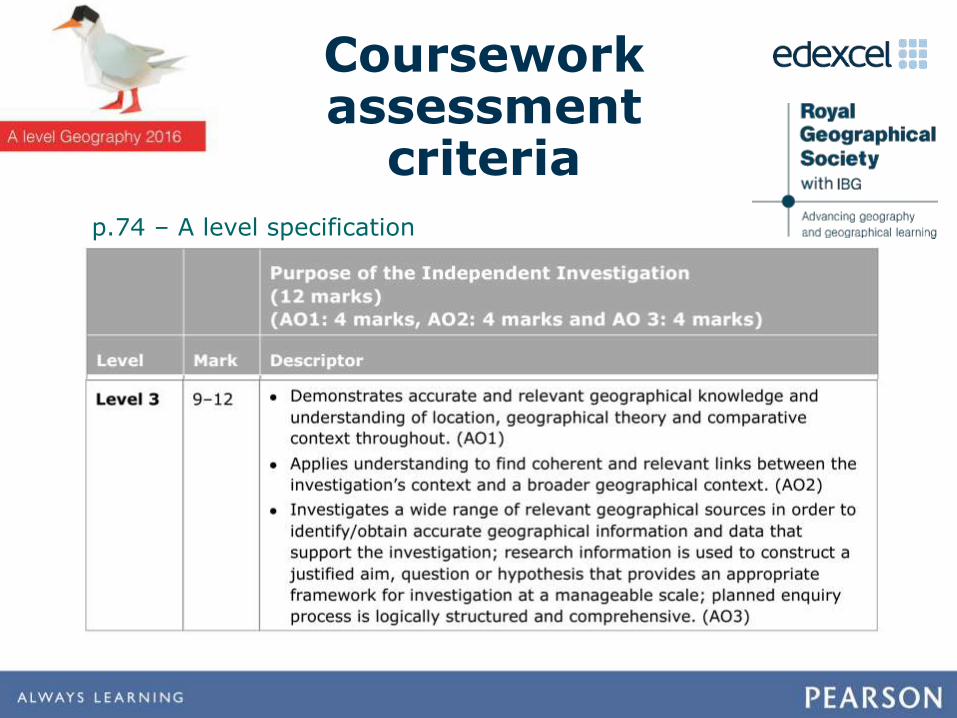
Coursework assessment
criteria
p.74 – A level specification
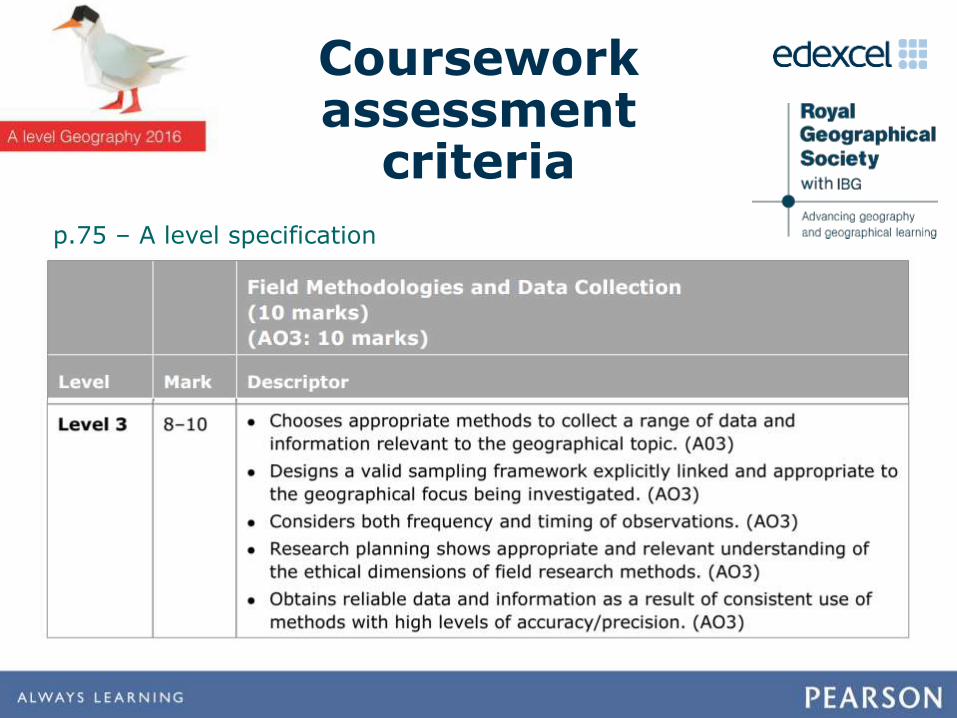
Coursework assessment
criteria
p.75 – A level specification
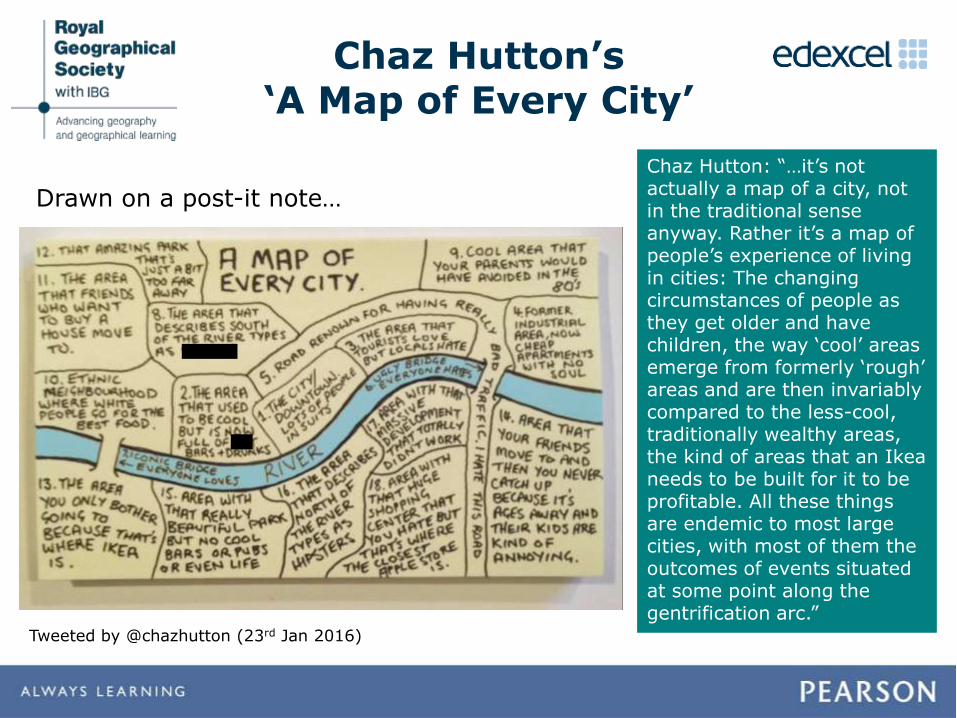
Chaz Hutton’s ‘A Map of Every City’
Tweeted by @chazhutton (23rd Jan 2016)
Chaz Hutton: “…it’s not actually a map of a city, not in the traditional sense anyway. Rather it’s a map of people’s experience of living in cities: The changing circumstances of people as they get older and have children, the way ‘cool’ areas emerge from formerly ‘rough’ areas and are then invariably compared to the less-cool, traditionally wealthy areas, the kind of areas that an Ikea needs to be built for it to be profitable. All these things are endemic to most large cities, with most of them the outcomes of events situated at some point along the gentrification arc.”
Drawn on a post-it note…
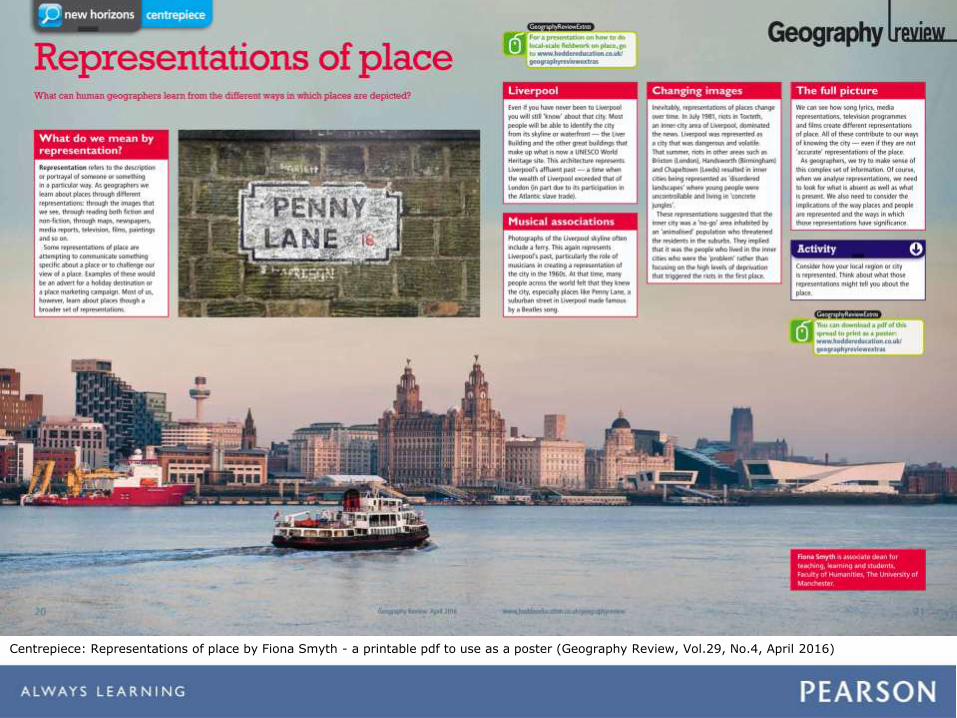
Centrepiece: Representations of place by Fiona Smyth - a printable pdf to use as a poster (Geography Review, Vol.29, No.4, April 2016)
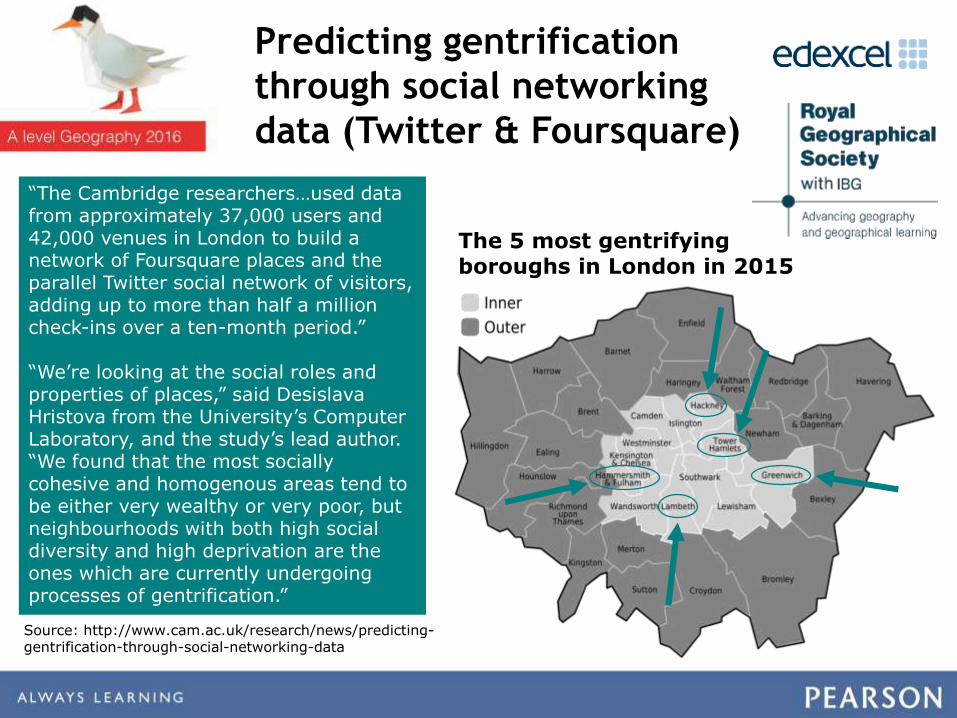
“The Cambridge researchers…used data from approximately 37,000 users and 42,000 venues in London to build a network of Foursquare places and the parallel Twitter social network of visitors, adding up to more than half a million check-ins over a ten-month period.”
“We’re looking at the social roles and properties of places,” said DesislavaHristova from the University’s Computer Laboratory, and the study’s lead author. “We found that the most socially cohesive and homogenous areas tend to be either very wealthy or very poor, but neighbourhoods with both high social diversity and high deprivation are the ones which are currently undergoing processes of gentrification.”
Predicting gentrification
through social networking
data (Twitter & Foursquare)
The 5 most gentrifying boroughs in London in 2015
Source: http://www.cam.ac.uk/research/news/predicting-gentrification-through-social-networking-data
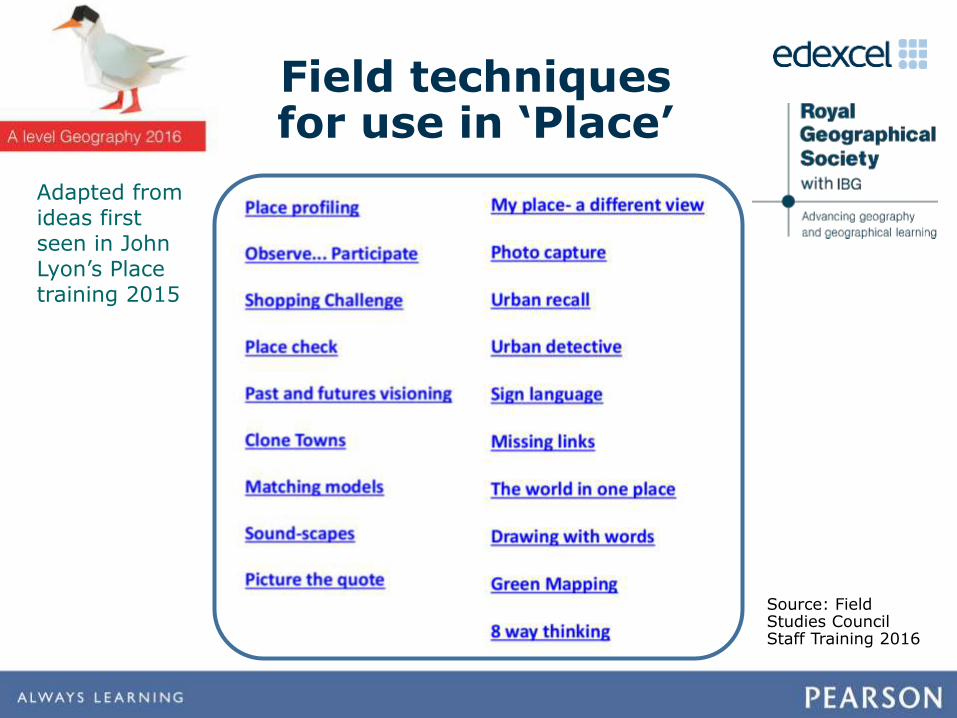
Source: Field Studies Council Staff Training 2016
Field techniques for use in ‘Place’
Adapted from ideas first seen in John Lyon’s Place training 2015
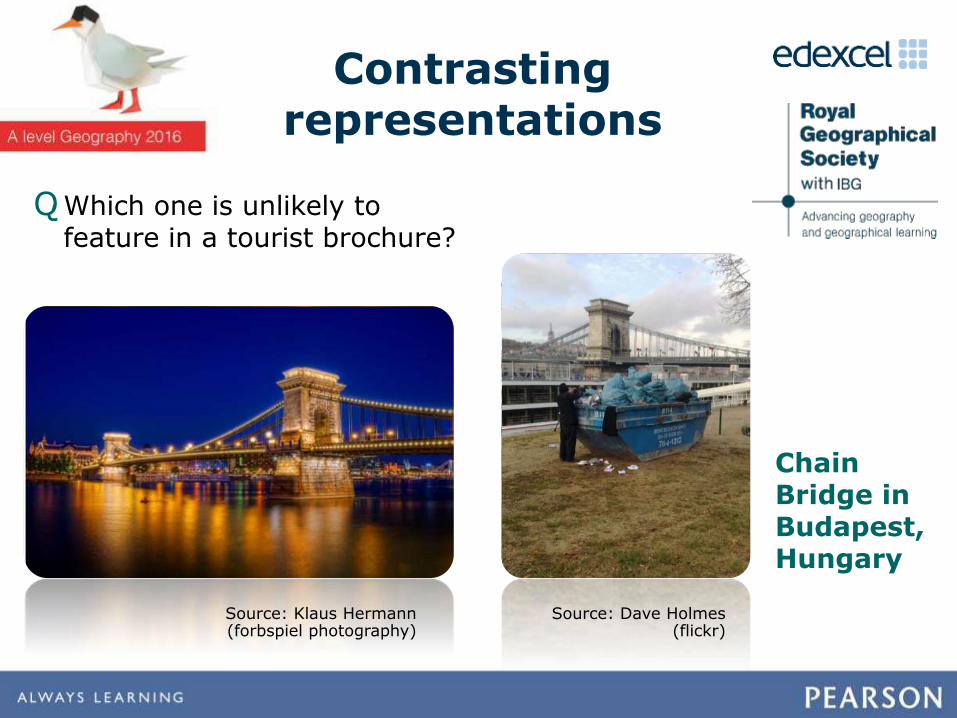
Contrasting representations
QWhich one is unlikely to feature in a tourist brochure?
Source: Klaus Hermann (forbspiel photography)
Source: Dave Holmes (flickr)
Chain Bridge in Budapest, Hungary
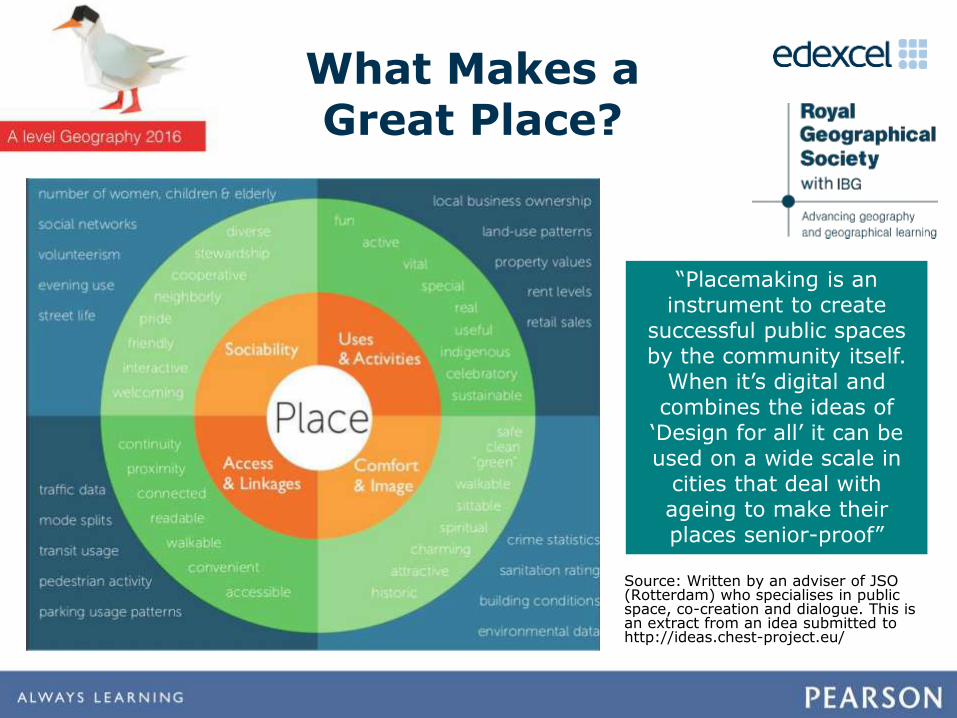
What Makes a Great Place?
“Placemaking is an instrument to create
successful public spaces by the community itself.
When it’s digital and combines the ideas of
‘Design for all’ it can be used on a wide scale in
cities that deal with ageing to make their places senior-proof”
Source: Written by an adviser of JSO (Rotterdam) who specialises in public space, co-creation and dialogue. This is an extract from an idea submitted to http://ideas.chest-project.eu/
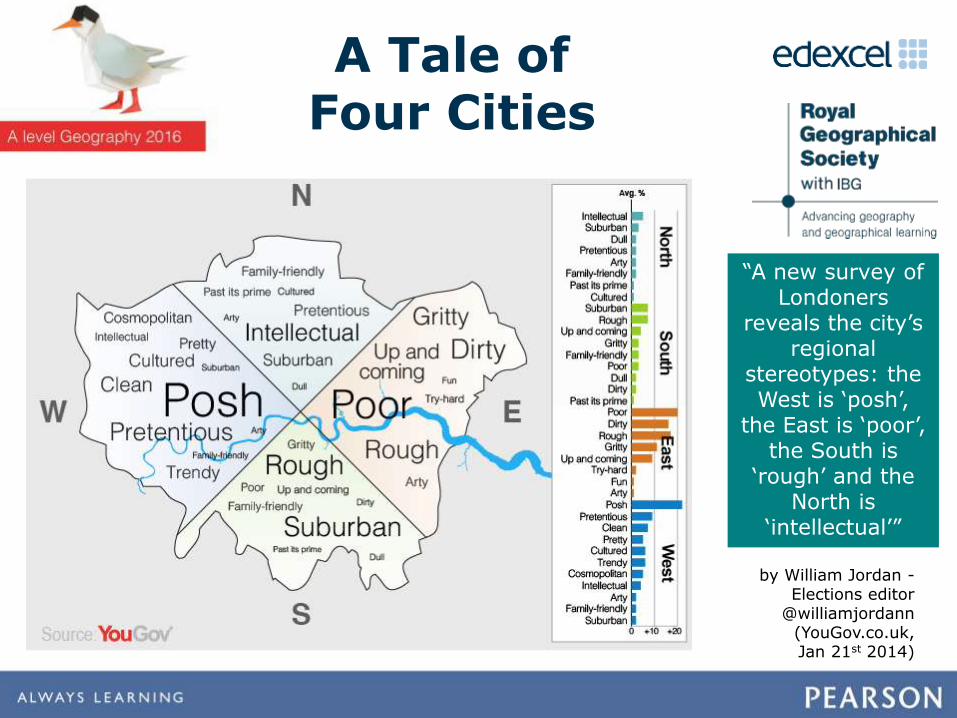
by William Jordan -Elections editor
@williamjordann(YouGov.co.uk, Jan 21st 2014)
A Tale of Four Cities
“A new survey of Londoners
reveals the city’s regional
stereotypes: the West is ‘posh’,
the East is ‘poor’, the South is
‘rough’ and the North is
‘intellectual’”
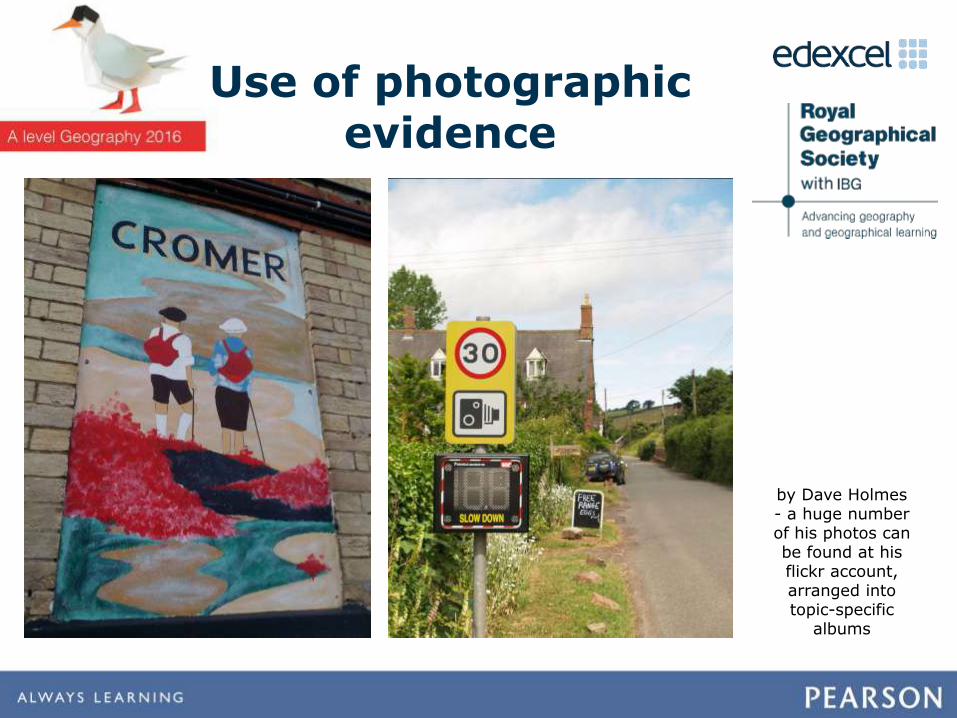
by Dave Holmes - a huge number of his photos can be found at his flickr account, arranged into topic-specific
albums
Use of photographic evidence
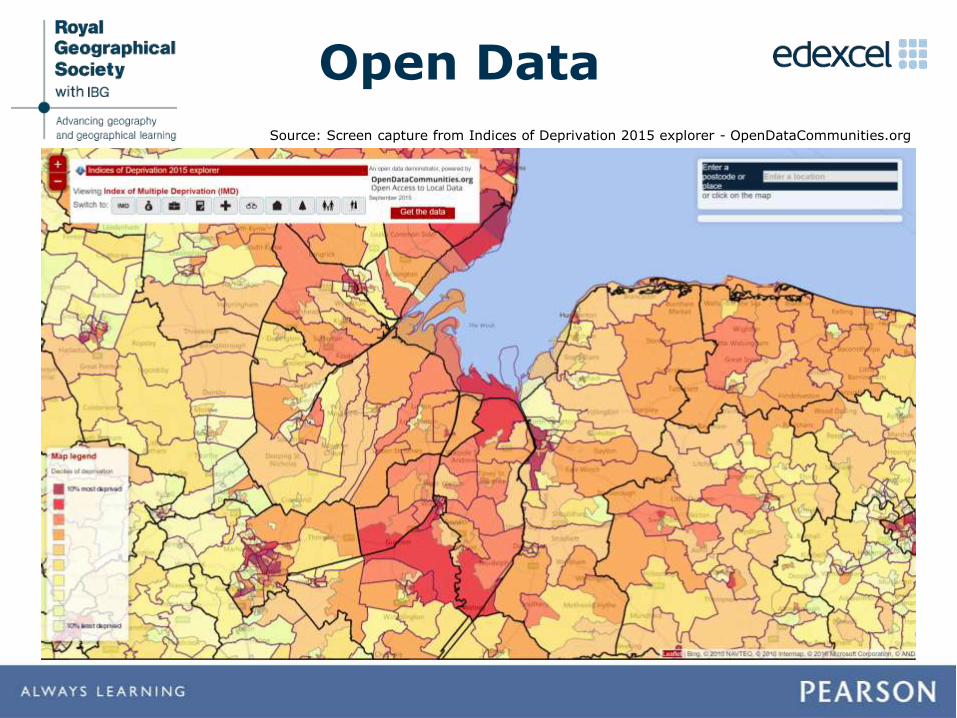
Source: Screen capture from Indices of Deprivation 2015 explorer - OpenDataCommunities.org
Open Data
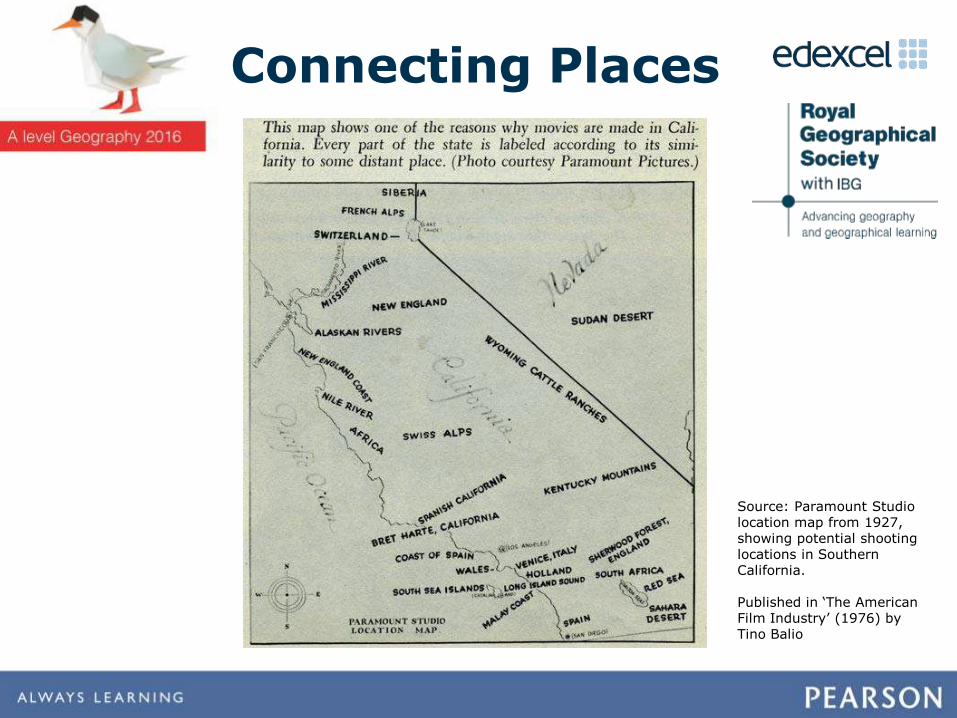
Source: Paramount Studio location map from 1927, showing potential shooting locations in Southern California.
Published in ‘The American Film Industry’ (1976) by Tino Balio
Connecting Places
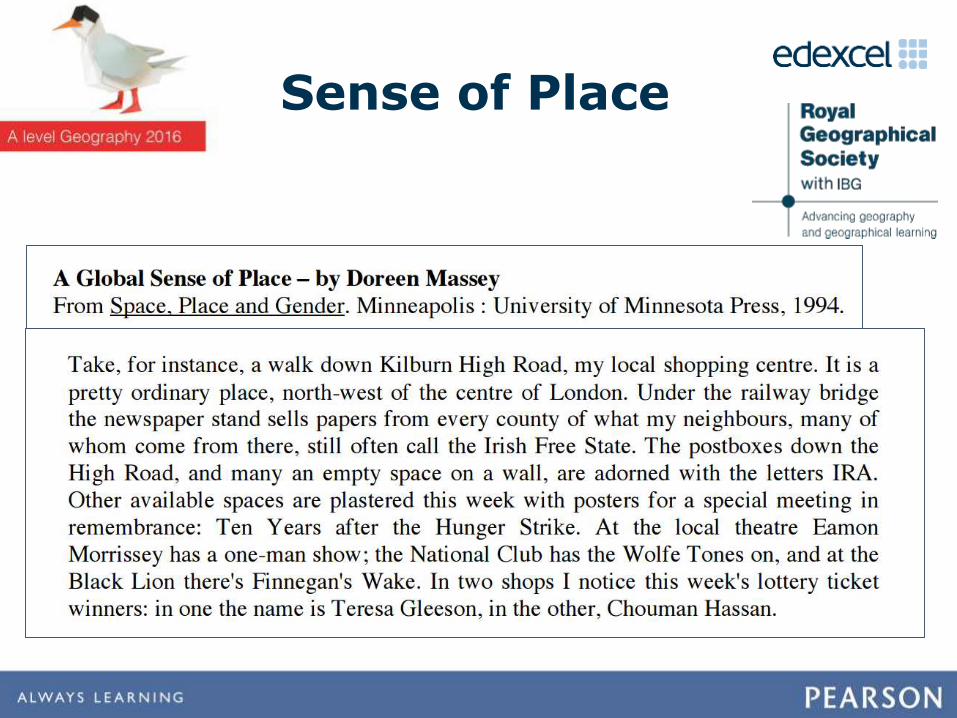
Sense of Place
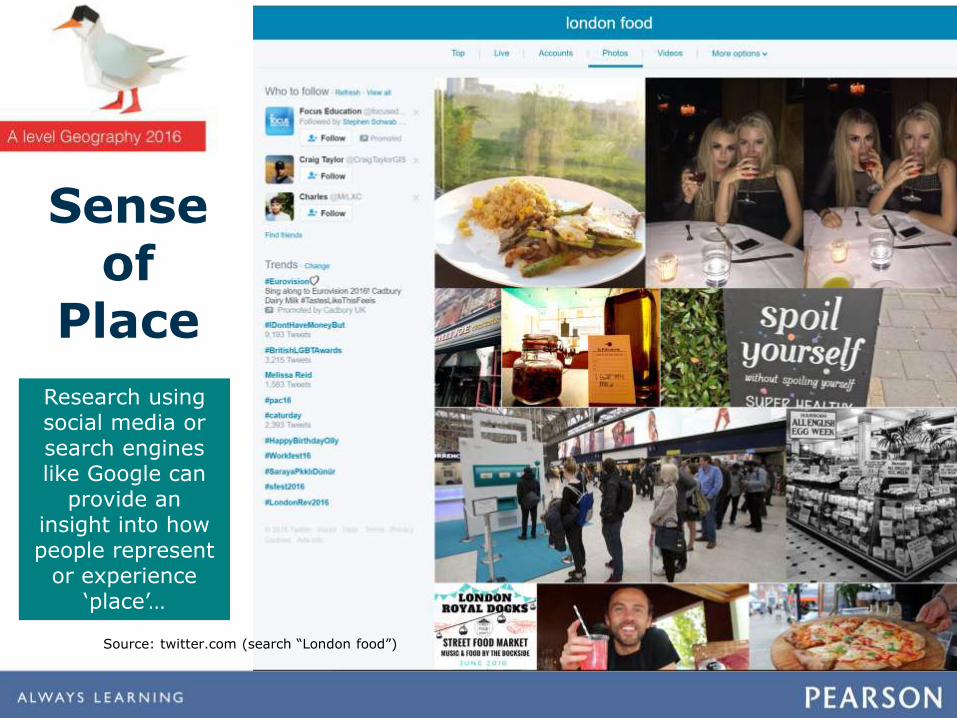
Source: twitter.com (search “London food”)
Sense of
Place
Research using social media or search engines like Google can
provide an insight into how people represent
or experience ‘place’…
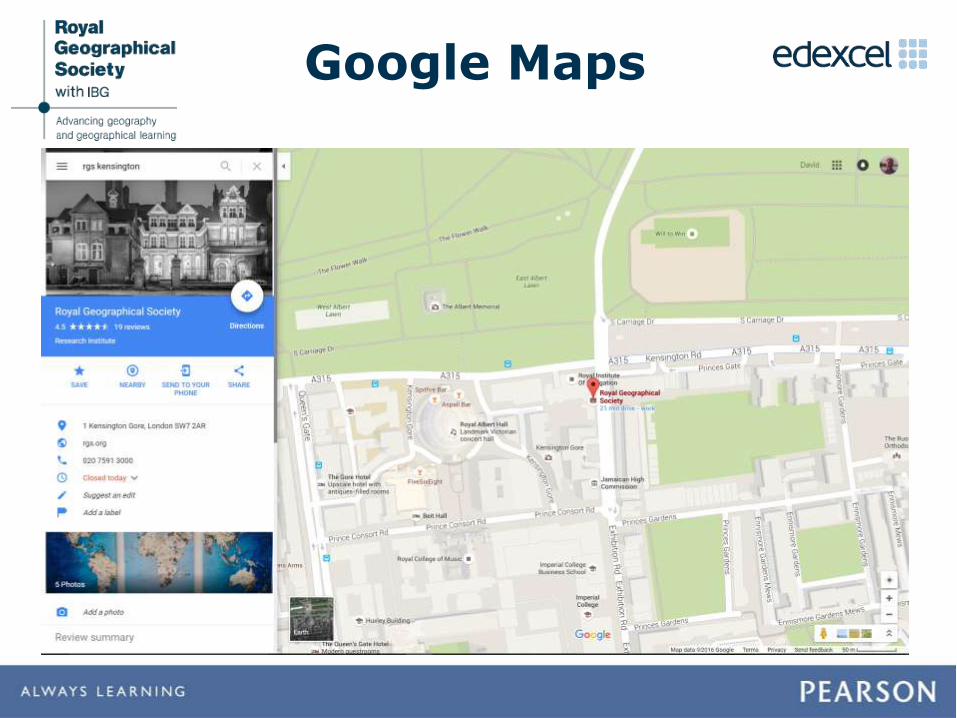
Google Maps
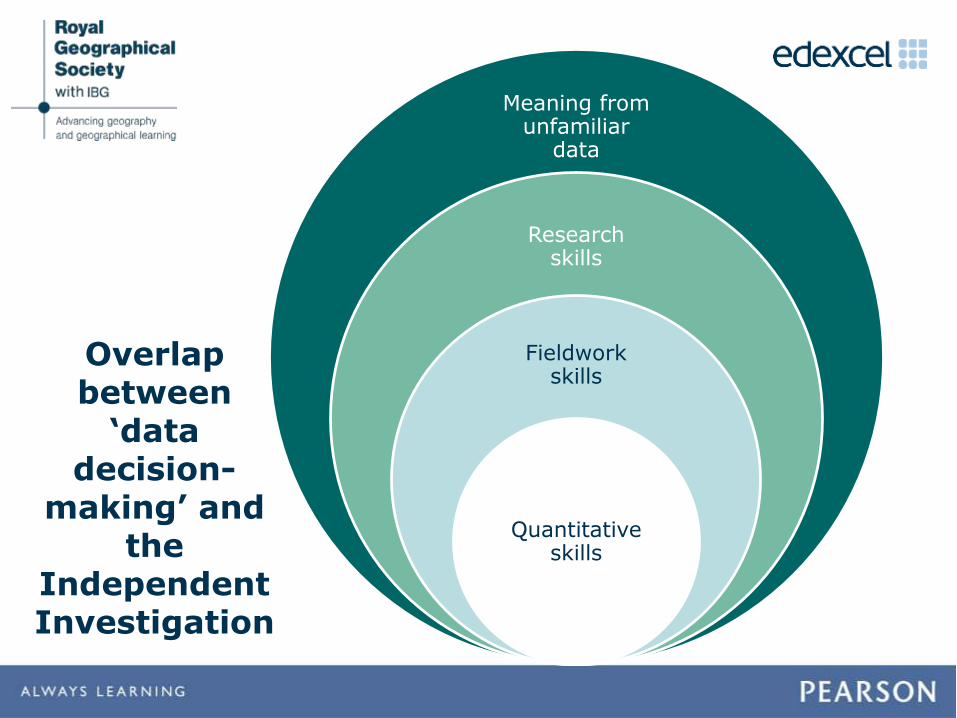
Overlap between
‘data decision-
making’ and the
Independent Investigation
Meaning from unfamiliar
data
Research skills
Fieldwork skills
Quantitative skills