Embed Size (px)
Citation preview

Introduction to
CompNet and the
CompNet Dataset

www.comp-net.org
Overview
2
The Competitiveness Research Network (CompNet)
The CompNet Dataset
Cross-Country Comparability
CompNet Data at Work: The 6th Vintage Cross Country Report
Concluding Remarks
1.
2.
3.
4.
5.
www.comp-net.org
1. The Competitiveness
Research Network (CompNet)
3

www.comp-net.org
The Competitiveness Research Network
4
• The EU system of Central Banks set up the CompetitivenessResearch Network (CompNet) in March 2012
• Expanded to become a network of academics and policypractitioners collaborating to:
1. Provide a robust theoretical and empirical link between driversof competitiveness and macroeconomic performance forresearch, policy analysis and country surveillance
2. Use cross-country benchmarking and adopting a multi-dimensional approach (i.e. a set of complementary macro,firm-level and cross-border indicators)

www.comp-net.org
Member Institutions: Partner Institutions
5
• European Central Bank (ECB)
• European Commission (EC)
• Halle Institute for Economic Research (IWH)
• European Bank of Reconstruction and Development (EBRD)
• European Investment Bank (EIB)
• Tinbergen Institute
www.comp-net.org
Member Institutions: Data Providers
6

www.comp-net.org
Governance Structure
7
Steering Committe Advisory Board
Executive Committe
CompNet Team
Research Team
Secretariat

www.comp-net.org
What Does CompNet Offer?
8
Dataset
Conferences
Trainings
Workshops
Exchange Forum
2 Working Paper Series
www.comp-net.org
• Enlargement of the Network:
• Statistical offices: INSEE (France), Swiss Statistical institute, possibly ONS (UK)
• Other institutions: Ministry of Economy Portugal
• Improvement of the codes
• Active in research …
• over 40 ongoing research projects based on CompNet data
• 7 Working Papers since 2016
• 22 refereed journal articles from members of the CompNet network
• … and in policy
• European Commission: Country Report Spain 2018
• EBRD: Transition Report 2017/18, chapter 2
• Articles in the ECB Economic Bulletin and in VOXEU.org
Latest achievements
9

www.comp-net.org
2. The CompNet Dataset
10
www.comp-net.org
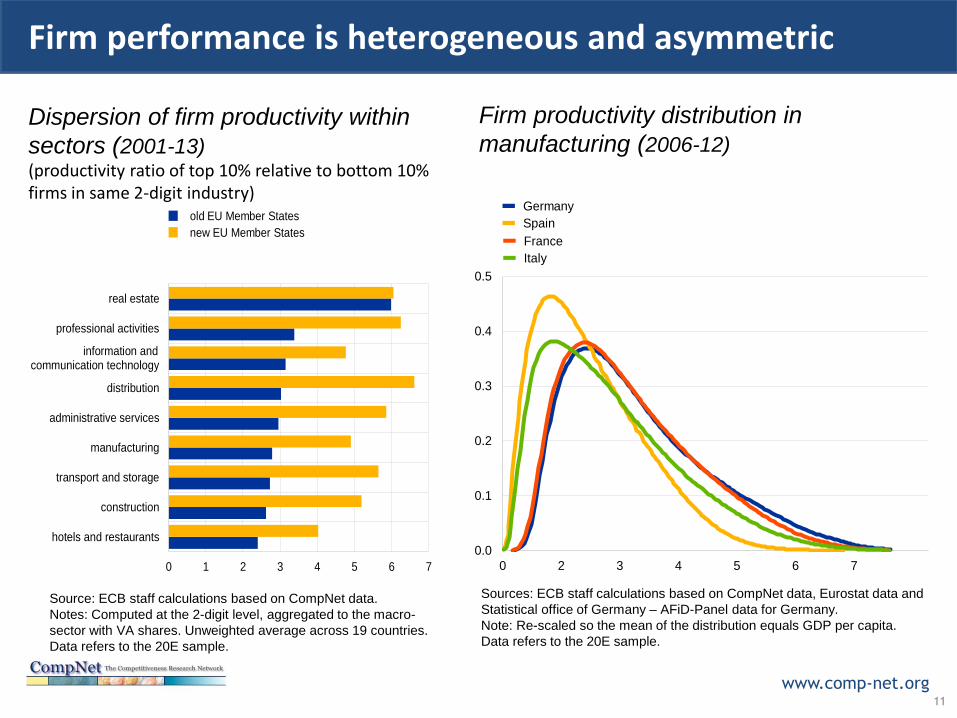
Firm performance is heterogeneous and asymmetric
11
0.0
0.1
0.2
0.3
0.4
0.5
0 2 3 4 5 6 7
Germany
Spain
France
Italy
Firm productivity distribution in
manufacturing (2006-12)
Sources: ECB staff calculations based on CompNet data, Eurostat data and
Statistical office of Germany – AFiD-Panel data for Germany.
Note: Re-scaled so the mean of the distribution equals GDP per capita.
Data refers to the 20E sample.
0 1 2 3 4 5 6 7
hotels and restaurants
construction
transport and storage
manufacturing
administrative services
distribution
information andcommunication technology
professional activities
real estate
old EU Member States
new EU Member States
Dispersion of firm productivity within
sectors (2001-13)(productivity ratio of top 10% relative to bottom 10% firms in same 2-digit industry)
Source: ECB staff calculations based on CompNet data.
Notes: Computed at the 2-digit level, aggregated to the macro-
sector with VA shares. Unweighted average across 19 countries.
Data refers to the 20E sample.
www.comp-net.org
1. Aggregate indicators alone risk to give partial
messages
2. Aggregate performance (e.g. exports) driven by
dynamics of few very large and productive players
3. Aggregate productivity can be boosted by better
allocating existing production resources
4. Impact of a macro shocks depend on the shape of the
underlying distribution of firm performance
Implications for research and policy
12
www.comp-net.org
• Country coverage and cross-country comparability is hindered
• We can focus on one-country analysis; or rely on commercialdatabases like Bureau van Dijk
- Important limitations concerning the analysis of competitiveness
• A third way is the micro-aggregated methodology: collectsmoments of the distribution of indicators in a harmonized wayacross countries
- No firm-level data but sufficient richness for many analyses
- Apply statistical methods to improve comparability within our possibilities
Micro-founded Analysis in a Cross-Country Set-Up
13

www.comp-net.org
Micro-aggregated Methodology
14
Write a code to compute different indicators of interest at the firm-level
Harmonise definitions, target samples and cleaning & treatment of the raw data
Collect results, aggregated at a country/sector/size/year level or country/region
/year level to preserve confidentiality…
…but keeping much of the richness of the firm-level data
www.comp-net.org
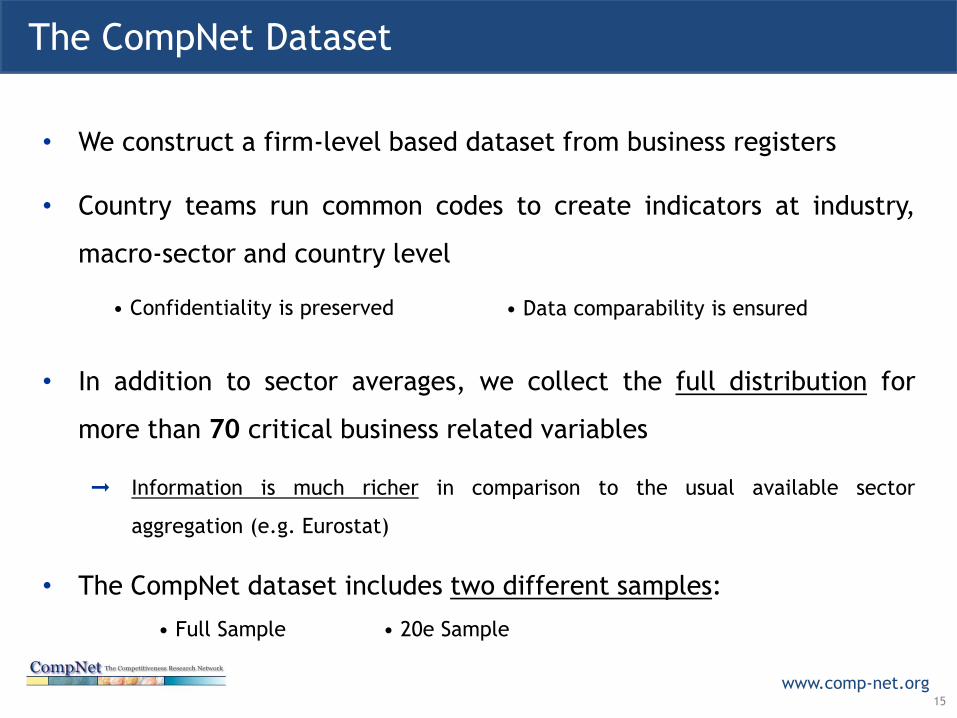
• We construct a firm-level based dataset from business registers
• Country teams run common codes to create indicators at industry,
macro-sector and country level
• In addition to sector averages, we collect the full distribution for
more than 70 critical business related variables
➞ Information is much richer in comparison to the usual available sector
aggregation (e.g. Eurostat)
• The CompNet dataset includes two different samples:
The CompNet Dataset
15
• Confidentiality is preserved • Data comparability is ensured
• Full Sample • 20e Sample
www.comp-net.org
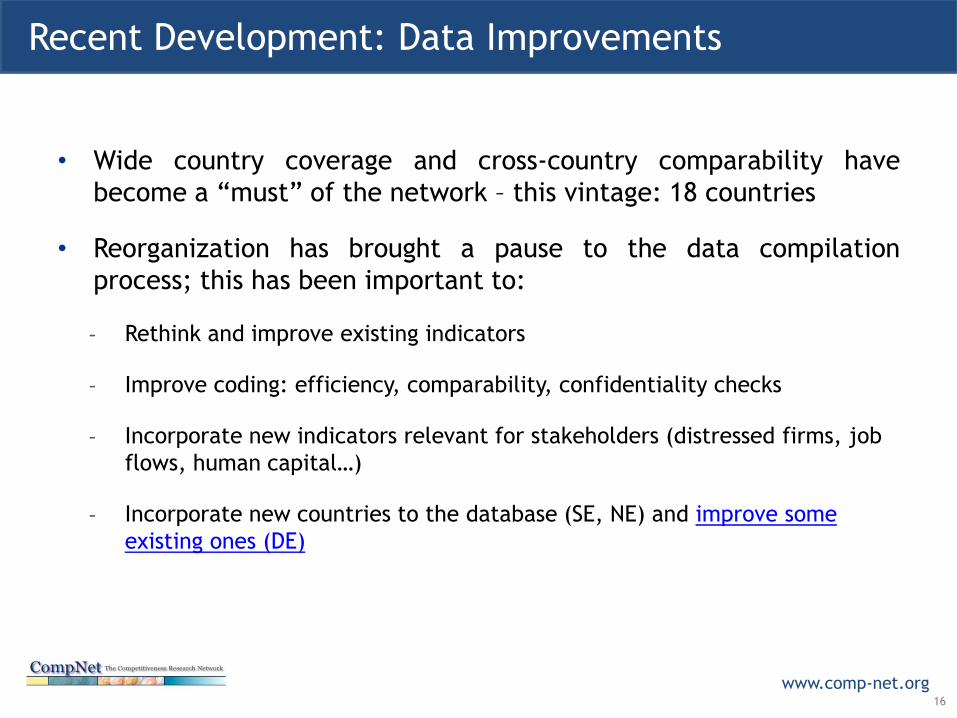
• Wide country coverage and cross-country comparability have
become a “must” of the network – this vintage: 18 countries
• Reorganization has brought a pause to the data compilation
process; this has been important to:
- Rethink and improve existing indicators
- Improve coding: efficiency, comparability, confidentiality checks
- Incorporate new indicators relevant for stakeholders (distressed firms, job
flows, human capital…)
- Incorporate new countries to the database (SE, NE) and improve some
existing ones (DE)
Recent Development: Data Improvements
16

www.comp-net.org
The 6th Vintage of the CompNet Dataset
17
• Time period:
• 1999 – 2016
• Data coverage:
• (up to) 90% in firms
• (up to) 86% in employees
• Geographical coverage:
• 18 EU countries
• Data collection:
• Richer set of variables
• More efficient codes
• Data are available:
• online for CompNet members
• upon request for all researchers

www.comp-net.org
Five Categories of Variables
1818
Productivity
and allocative
efficiency
Financial Trade Competition Labour
Labour
productivityInvestment ratio % permanent exp. Price-cost margins
% firms that change
employment
between t and t+3
(t+1)
ULC
Cash holdings Export intensity
Capital Intensity
Financing gap
Productivity
premium of
exporters
Job creation and job
destruction rates
Static and
dynamic allocative
efficiency
Equity to Debt
Interest coverage
ratio
Debt burden
VA and revenue TFP;
various estimation
techniques
Firm size
RoA % sporadic exp.
Leverage Characteristics of top
exporters
Marginal revenue
productivity of inputs
Collateral
Cash flow
Trade Credit/Debt
Credit constraint
index
Mark Ups
Share of high-growth
firms
Share of
“distressed” firms
Herfindahl index
Characteristics of
firms that export AND
import
Wage premium (proxy
for human capital)
Concentration of
sales in top 10 firms
of a sector

www.comp-net.org
Joint Distributions: One Example
19
Example type of question:Are low productive firms in a country-sector
characterized by higher credit constraints?

www.comp-net.org
Sample Representativeness: Employment by Macro-Sector
20
Country Manufacturing Construction Services
Belgium29.7%
(27.5%)
12.3%
(17.7%)
57.9%
(54.7%)
Croatia34.3%
(43.4%)
12.3%
(25.4%)
53.3%
(31.1%)
Denmark23.3%
(31.3%)
12.8%
(15.3%)
63.7%
(53.3%)
Finland30.6%
(31.0%)
13.7%
(16.9%)
55.6%
(51.9%)
France22.4%
(24.9%)
14.3%
(16.3%)
63.2%
(58.6%)
Hungary32.9%
(34.9%)
8.90%
(11.6%)
58.1%
(53.3%)
Italy37.8%
(33.1%)
10.3%
(15.5%)
51.8%
(51.3%)
Lithuania27.2%
(30.2%)
12.7%
(18.1%)
59.9%
(51.5%)
Netherlands19.5%
(17.1%)
10.7%
(13.7%)
69.6%
(69.1%)
Portugal28.4%
(24.1%)
13.7%
(15.6%)
57.8%
(60.2%)
Romania35.7%
(40.1%)
12.4%
(15.2%)
51.8%
(44.6%)
Slovenia45.9%
(43.6%)
9.23%
(18.5%)
44.7%
(37.8%)
Spain24.3%
(21.8%)
12.9%
(16.3%)
62.6%
(61.7%)
Sweden21.2%
(28.0%)
13.9%
(17.1%)
64.8%
(54.8%)
Czech Republic*52.3%
(56.2%)
6.88%
(9.34%)
40.8%
(34.3%)
Germany** - - -
Poland*44.9%
(54.7%)
8.21%
(11.5%)
46.8%
(33.6%)
Slovakia*50.2%
(64.3%)
5.95%
(9.43%)
43.7%
(26.1%)

www.comp-net.org
Sample Representativeness: Employment by Size Class
21
Country \ Size Classes1 - 9
Employees
10 - 19
Employees
20 - 49
Employees
50 - 249
Employees
> 250
Employees
Belgium21.5%
(26.3%)
12.8%
(7.78%)
20.3%
(12.4%)
24.4%
(16.8%)
20.8%
(36.5%)
Croatia27.2%
(9.29%)
13.9%
(13.0%)
17.4%
(15.1%)
26.4%
(27.8%)
14.9%
(34.6%)
Denmark41.1%
(23.0%)
14.0%
(9.55%)
17.8%
(12.6%)
19.3%
(21.6%)
7.57%
(33.1%)
Finland28.7%
(28.2%)
14.0%
(8.73%)
18.5%
(11.2%)
24.9%
(18.4%)
13.7%
(33.3%)
France30.4%
(25.7%)
14.5%
(8.05%)
19.2%
(11.3%)
24.9%
(15.9%)
10.8%
(38.9%)
Hungary37.2%
(37.1%)
15.1%
(8.58%)
15.4%
(9.34%)
20.5%
(16.7%)
11.6%
(28.1%)
Italy23.0%
(41.0%)
18.3%
(11.8%)
21.2%
(10.8%)
25.7%
(14.2%)
11.6%
(21.8%)
Lithuania23.4%
(28.8%)
13.9%
(11.1%)
20.2%
(15.7%)
29.4%
(23.0%)
12.8%
(21.1%)
Netherlands16.9%
(26.2%)
13.4%
(8.50%)
20.1%
(11.5%)
30.1%
(20.9%)
19.2%
(32.8%)
Portugal36.5%
(32.1%)
16.4%
(11.8%)
19.4%
(13.7%)
19.8%
(18.4%)
7.66%
(23.8%)
Romania29.3%
(21.7%)
13.3%
(8.17%)
18.4%
(12.4%)
28.2%
(23.3%)
10.5%
(34.2%)
Slovenia24.3%
(36.9%)
11.7%
(9.96%)
16.3%
(8.53%)
28.6%
(22.6%)
18.8%
(21.8%)
Spain33.3%
(37.7%)
17.2%
(9.54%)
20.2%
(11.4%)
17.2%
(14.6%)
11.8%
(26.6%)
Sweden39.8%
(21.9%)
17.7%
(9.72%)
22.3%
(13.4%)
17.9%
(20.0%)
2.01%
(34.8%)
Czech Republic* - -16.2%
(16.5%)
38.3%
(32.8%)
45.3%
(50.5%)
Germany* - -5.06%
(7.33%)
27.5%
(24.7%)
67.2%
(53.4%)
Poland* - -13.4%
(13.6%)
40.2%
(34.4%)
46.2%
(51.9%)
Slovakia* - -13.9%
(14.6%)
34.3%
(32.9%)
51.7%
(52.4%)

www.comp-net.org
• A cross-country report providing an overview of the main novelties of the
dataset
• A cross-country comparability report providing metadata and documenting
existing differences across countries
• A comparability tool for the user to track cross-country differences in each
indicator
• A user’s guide with detailed information on definitions of and methodology
used to compute some of the core indicators
• A “road-map” mapping indicators to data files and vice versa
6th Vintage: Complementary Reports
22

www.comp-net.org
3.Cross-Country Comparability
23
www.comp-net.org
Cross-Country Comparability Report
24
Data sources will never be fully comparable
important to know where differences lie and how they impact the result
• CompNet has set up a Working Group to analyze cross-countrycomparability
- Carlo Altomonte(Bocconi), Paloma Lopez-Garcia(ECB), Marc Melitz (Harvard), Sebastian Roux (INSEE), Michael Polder (Netherlands Statistics), Jan Paul van der Kerke (ECB)
• Cross-country differences stem from country, source and/orvariable specific factors.

www.comp-net.org
• The unit of observation: Some sources use the legal unit while others measure
economic activity at the enterprise level.
• Employment can be measured in Headcounts or FTE. Moreover only “persons
employed” or “employees only” can be included. Across countries we observed
differences.
• Longitudinal linking: the ability to adequately follow firms through changes in business
structure differs across sources.
• Outlier cleaning: Some sources apply alterations to the data, while the code does so as
well. Double and idiosyncratic outlier procedures introduce heterogeneity
• The valuation of output, intermediate inputs and labour costs differs across countries.
The Road Towards Full Comparability
25
CompNet is working on harmonizing these and other sources
of cross-country differences.

www.comp-net.org
4. CompNet Data at Work
26

www.comp-net.org
• Report coordinated and drafted by Paloma Lopez-Garcia
and the CompNet Team
– Documents the 6th vintage of CompNet dataset in terms of
coverage, representativeness, and indicators
– Highlights selected stylized facts of potential high value for
research and policy
6th Vintage CompNet Cross-Country Report
27
Productivity
Mark-Ups Wages
Distressed Firms TradeUnit Labor Costs
Job Flows
www.comp-net.org
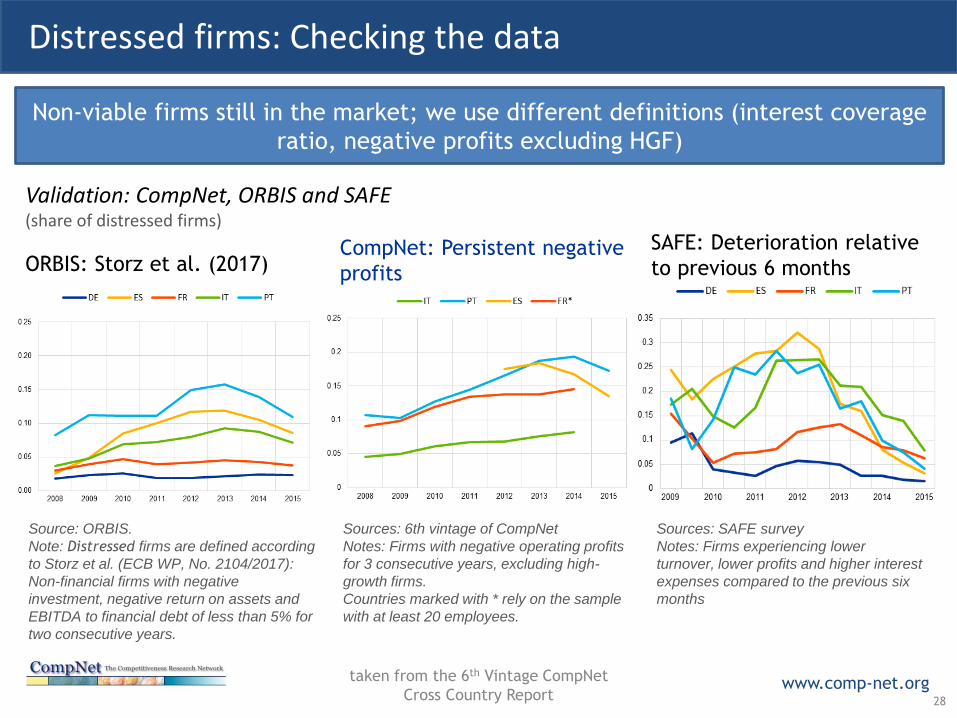
Distressed firms: Checking the data
28
Validation: CompNet, ORBIS and SAFE(share of distressed firms)
Source: ORBIS.
Note: Distressed firms are defined according
to Storz et al. (ECB WP, No. 2104/2017):
Non-financial firms with negative
investment, negative return on assets and
EBITDA to financial debt of less than 5% for
two consecutive years.
ORBIS: Storz et al. (2017)CompNet: Persistent negative
profits
SAFE: Deterioration relative
to previous 6 months
Sources: 6th vintage of CompNet
Notes: Firms with negative operating profits
for 3 consecutive years, excluding high-
growth firms.
Countries marked with * rely on the sample
with at least 20 employees.
Sources: SAFE survey
Notes: Firms experiencing lower
turnover, lower profits and higher interest
expenses compared to the previous six
months
Non-viable firms still in the market; we use different definitions (interest coverage
ratio, negative profits excluding HGF)
taken from the 6th Vintage CompNet
Cross Country Report

www.comp-net.org
Distressed firms: Zombie congestion?
29
Do distressed firms have a
sizeable economic impact?
– The chart shows median
investment in each
country-sector-year and
share of distressed firms
– Sector with a higher share
of distressed firms show
significantly lower
investment ration and job
creation rates
Sector investment and share of distressed
firms(median investment of the 2-digit industry and share
of distressed firms)
Source: 6th vintage of CompNet, full sample.
Notes: Firms with interest payments higher than operating profits
for 3 consecutive years, conditional on positive profits. Countries
included: BE, CZ, FI,HU, IT, LT, PT,RO, SP, SE. Binscatter controlling
for country FE.
taken from the 6th Vintage CompNet
Cross Country Report

www.comp-net.org
5. Concluding Remarks
30

www.comp-net.org
Concluding Remarks
31
CompNet
The CompNet Dataset
Cross-Country Comparability
Frontier Policy and Research Work
www.comp-net.org
Thank You!
32
www.comp-net.org
Background Slides
33

www.comp-net.org
Raw Variables and Definitions
34
Variables Common definition
Capital (Tangible fixed assets) Tangible fixed assets
Raw materials Consumption of materials + energy+ external services
Labour cost Gross employee compensation
Value added Turnover - material
Number of employees Average number of employees calculated in full-time equivalents
Turnover Total sales
Total assets Total assets
Cash and cash equivalents Cash and balances at banks
Cash flow (from profit/loss statement) Net income - depreciation+ extraodinary income
Profit/loss EBIT
Interest paid (or financial charges) Interest on financial debts + other financial expenses
Long term debt Loans due in more than 1 year
Short-term debt Loans due within 1 year
Total inventories Inventories and consumable biological assets
Depreciation Depreciation on intangible assets and tangible assets
Trade credit (accounts payable) Trade credit or Accounts payable (Liabilities related to
purchased goods and services)
Trade debt (accounts receivable) Trade debt or Accounts receivable
Current liabilities Current liabilities
Non-current liabilities Non-current liabilities
Shareholder funds (equity) Equity
Profits and losses before taxes Earnings before taxes (EBT)
Other current assets Current assets – Trade debtors – Total inventories
Other non-current liabilities Provisions
Other fixed assets Total fixed assets - tangible fixed assets - intangible fixed assets
Intangible fixed assets Total intangible fixed assets
Current assets Current assets
Other current liabilities Other current liabilities
Total fixed assets Tangible, intangible and other fixed assets
Dividends Dividends
Firm’s birth year Year of establishment of the firm

www.comp-net.org
• Amadeus data available at the DG-Statistics of the ECB
• Numbers refer to 2010
Sample coverage: AMADEUS
35
Number of
firm ids
% with
employment
and turnover
% with
employment,
material costs,
fixed assets
and turnover
Number of
firm ids
% with
employment
and turnover
% with
employment,
material costs,
fixed assets
and turnover
Number of
firm ids
% with
employment
and turnover
% with
employment,
material costs,
fixed assets
and turnover
Number of
firm ids
% with
employment
and turnover
% with
employment,
material costs,
fixed assets
and turnover
Manufacturing 26093 18% 11% 99855 9% 6% 101477 78% 77% 137170 42% 42%
Construction 42725 10% 2% 89946 5% 2% 137877 54% 51% 105775 26% 26%
Wholesale and retail trade 73194 13% 6% 146514 6% 3% 172781 71% 69% 163278 31% 30%
Transport and storage 10087 19% 8% 29964 7% 3% 28288 71% 61% 27487 33% 29%
Hotels and restaurants 17910 11% 1% 18719 4% 1% 47637 67% 66% 44300 25% 24%
ICT 14319 9% 4% 35928 5% 2% 19169 61% 52% 33778 30% 26%
Professional services 55437 5% 1% 203817 2% 1% 70847 59% 39% 52290 24% 20%
Administrative services 15033 11% 3% 50874 5% 1% 27553 63% 51% 34137 26% 24%
Business economy
(excluding real state and
financial sector)
254798 11% 4% 675617 5% 2% 605629 66% 61% 598215 31% 30%
BELGIUM SPAINGERMANY ITALY
Table 1: share of firms in Amadeus with data to construct productivity and TFP
Although AMADEUS includes many firms, only a small share of them have
employment information

www.comp-net.org
• Amadeus data available at the DG-Statistics of the ECB
• Numbers refer to 2010
Sample coverage: AMADEUS
36
Table 2: Coverage of micro-firms with employment data in AMADEUS
Selection into the sample is not random in AMADEUS: better in manufacturing
and large firms
Coverage of
micro-firms
Coverage of
firms with
employees
Coverage of
micro-firms
Coverage of
firms with
employees
Coverage of
micro-firms
Coverage of
firms with
employees
Coverage of
micro-firms
Coverage of
firms with
employees
Manufacturing 14% 25% 1% 5% 49% 61% 14% 23%
Construction 11% 15% 1.2% 2.3% 28% 36% 8% 12%
Trade 11% 16% 1.2% 2.7% 25% 33% 10% 14%
Transport and storage 15% 24% 1.0% 2.9% 15% 22% 11% 18%
Hotels & restaurants 8% 9% 0.2% 0.6% 13% 18% 4% 6%
ICT 14% 24% 1.9% 4.2% 43% 59% 23% 32%
Professional services 11% 16% 1.3% 2.7% 30% 39% 9% 13%
Administrative services 11% 16% 1.2% 2.8% 18% 27% 12% 19%
Business economy
(excluding real state and
financial sector)
11% 17% 1.1% 2.9% 25% 34% 10% 15%
BELGIUM GERMANY SPAIN ITALY