Embed Size (px)
Citation preview
Introduction to Economic Development
- Reading assignment: D. Weil Economic Growth Ch. 1
- Key questions the course is concerned with:
- Why are some countries rich while others are poor?
- How do poor and rich country economies differ? Why?
- Why do some countries grow faster than others?
- What do economic methods and historical experience suggest drive economic growth and development?
- Will current poor countries catch up to the rich countries?(“convergence” or not)
- To start: a description of what we hope to explain.
Two parts:
(1) The World Economy today (this set of notes)
(2) How did we get here? A brief survey of economic history (next set of notes and Assignment 1)
1

The World Economy Today
- Some questions:
- How big are the disparities between rich and poor countries?
- Who are the rich and poor countries?
Rich: more developed countries (MDCs) Poor: less developed countries (LDCs)
- How do rich and poor economies differ?
- Growth performance: how does it compare across countries? what is a fast rate of growth?
- Some data sources (see website links):
World Bank: http://www.worldbank.org/- see Data and Publications tab.
- annuals: World Development Indicators World Development Report
Penn World Tables (https://www.rug.nl/research/ggdc/data/pwt )
2
A Measure of Living Standards: Problems and Issues
- Monetary measures of well-being?
- Usual measures: based on national accounts data
i.e. data used to measure the value of a country’s output and incomes.
- There are several closely related measures:
Gross Domestic Product (GDP) – value of the (final) goods and services produced in a country in a year.
- measured by either:- summing value-added across goods and services;- summing spending on goods and services;- summing incomes.
(equivalent after minor adjustments to the value of output, value of expenditure and the value of income)
- World Bank uses a real Gross National Income (GNI) per capita measure to rank countries.
- GNI and GDP:
- Both measure total incomes.
- main difference: GNI adjusts for net income from abroad.
- Both sources use per capita measures
- Per capita: scale for population.
- For comparisons across time “real” or “constant price” measures that adjust for price level changes across time are used.
3

- For comparisons across countries?
- Measures above are in national currency units, e.g. Cdn $’s
- Use exchange rates to convert into common currency. e.g. World Bank uses US $’s
- But which exchange rate?
- What if exchange rates are volatile over time?- rate chosen could distort comparisons.
- Countries with fixed exchange rates:At any time there could be multiple exchange rates
e.g., official vs. black market ; multiple official rates for different uses.
- Options?
- could average possible exchange rates.e.g. multi-year average to deal with volatility.
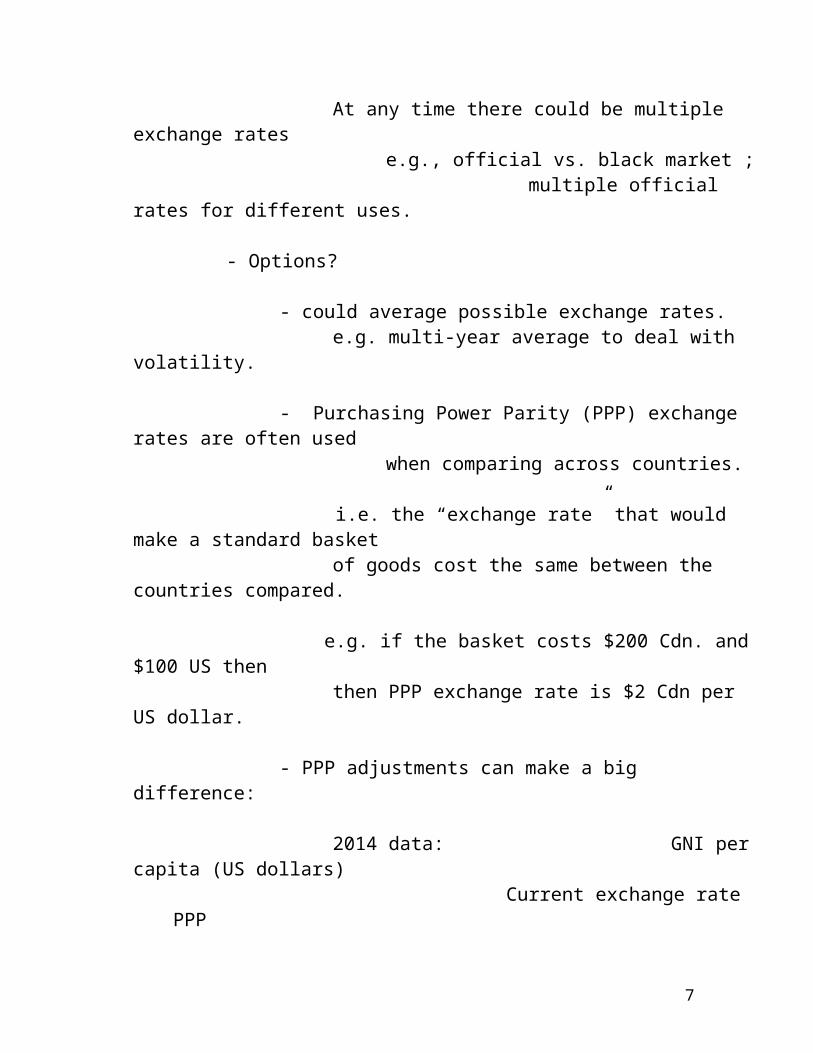
- Purchasing Power Parity (PPP) exchange rates are often used when comparing across countries.
i.e. the “exchange rate” that would make a standard basket of goods cost the same between the countries compared.
e.g. if the basket costs $200 Cdn. and $100 US then then PPP exchange rate is $2 Cdn per US dollar.
- PPP adjustments can make a big difference:
2014 data: GNI per capita (US dollars) Current exchange rate PPP
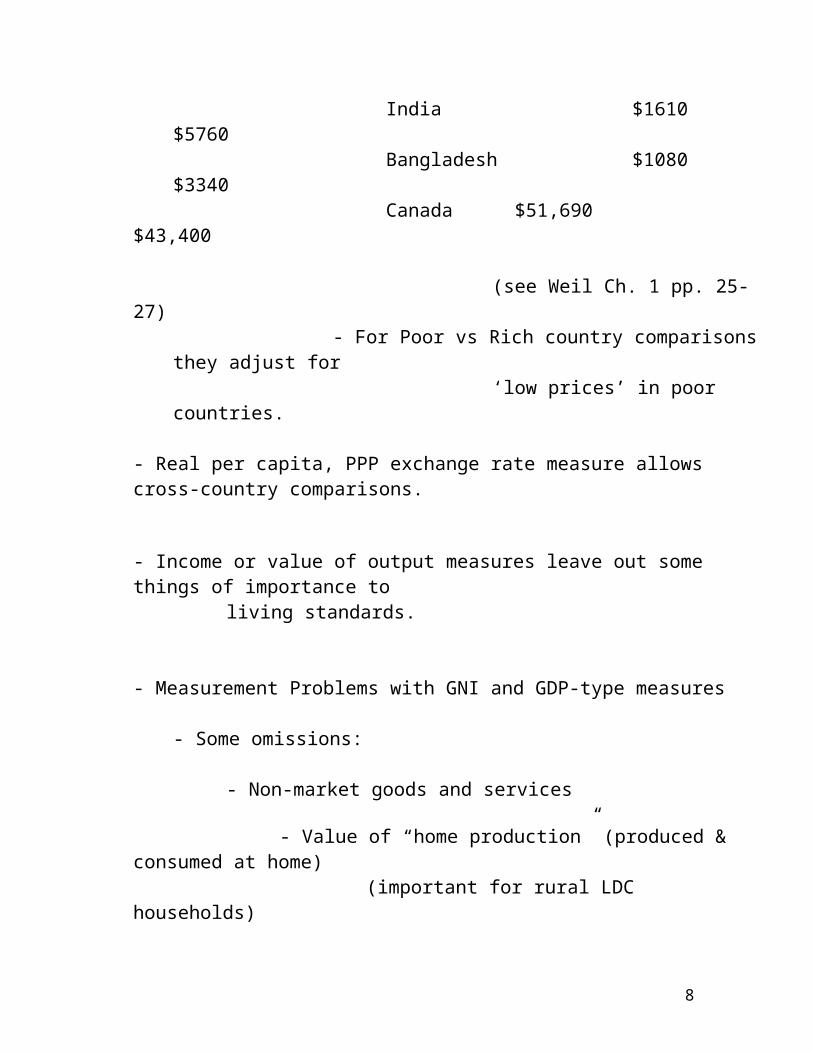
India $1610 $5760Bangladesh $1080 $3340Canada $51,690 $43,400
(see Weil Ch. 1 pp. 25-27)
4
- For Poor vs Rich country comparisons they adjust for ‘low prices’ in poor countries.
- Real per capita, PPP exchange rate measure allows cross-country comparisons.
- Income or value of output measures leave out some things of importance to living standards.
- Measurement Problems with GNI and GDP-type measures
- Some omissions:
- Non-market goods and services
- Value of “home production” (produced & consumed at home) (important for rural LDC households)
- Environment, leisure and other "goods" that are not marketed.
- Illegal and “underground” economic activity: not reported (tax or legal reasons).
- Even with omissions accounted for income is an imperfect measure of well-being.
- happiness instead? - life expectancy?
- Distribution of income can be an important indicator.- Per capita income: an average.
- How is income distributed? inequality a factor in national well-being.
- So? Income measures are a proxy for what we really want.
Still they are the best readily measures that we have.
5
Comparing Living Standards: What does the Data Say?
- World Bank website (GNI per capita PPP versions):
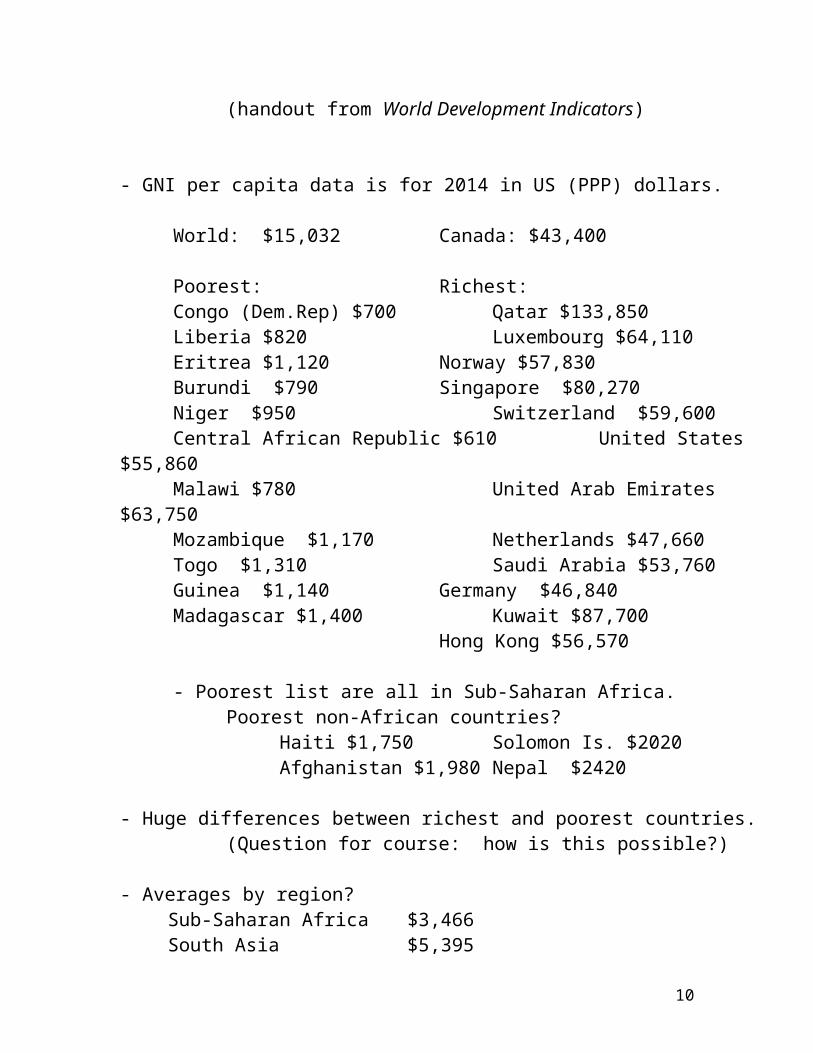
(handout from World Development Indicators)
- GNI per capita data is for 2014 in US (PPP) dollars.
World: $15,032 Canada: $43,400
Poorest: Richest:Congo (Dem.Rep) $700 Qatar $133,850Liberia $820 Luxembourg $64,110Eritrea $1,120 Norway $57,830Burundi $790 Singapore $80,270Niger $950 Switzerland $59,600Central African Republic $610 United States $55,860Malawi $780 United Arab Emirates $63,750Mozambique $1,170 Netherlands $47,660Togo $1,310 Saudi Arabia $53,760Guinea $1,140 Germany $46,840Madagascar $1,400 Kuwait $87,700
Hong Kong $56,570
- Poorest list are all in Sub-Saharan Africa.Poorest non-African countries?
Haiti $1,750 Solomon Is. $2020Afghanistan $1,980 Nepal $2420
- Huge differences between richest and poorest countries.(Question for course: how is this possible?)
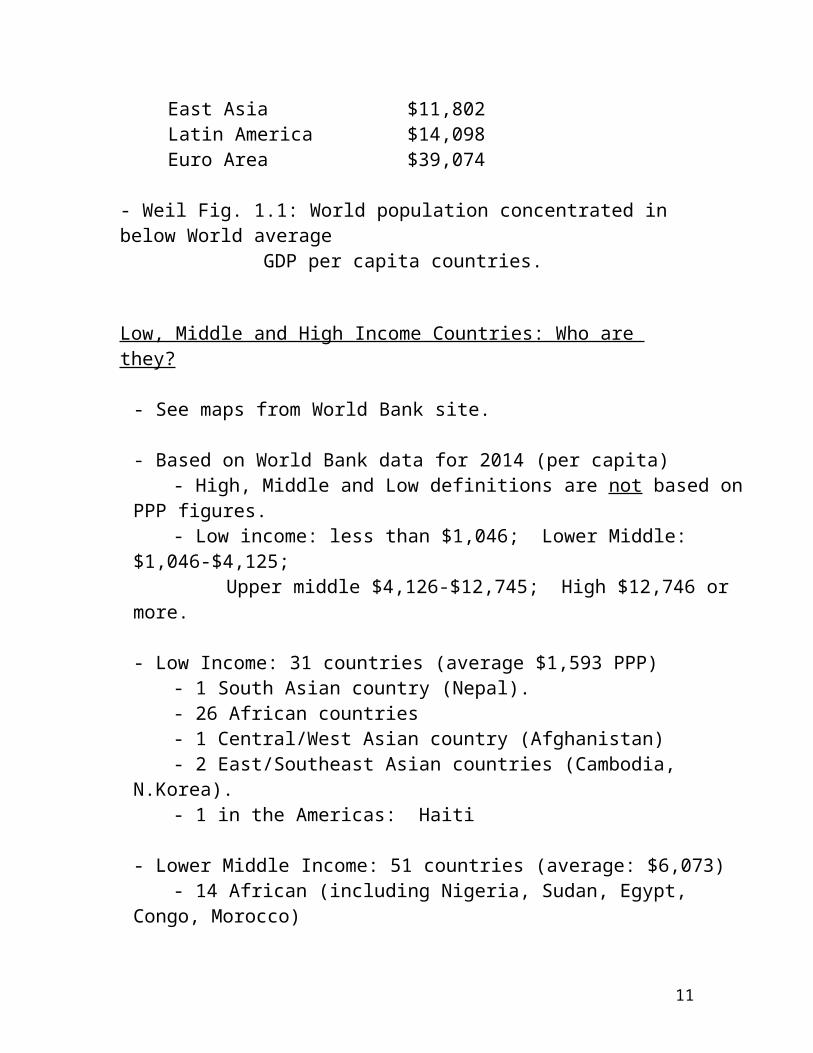
- Averages by region? Sub-Saharan Africa $3,466South Asia $5,395East Asia $11,802Latin America $14,098Euro Area $39,074
6
- Weil Fig. 1.1: World population concentrated in below World average GDP per capita countries.
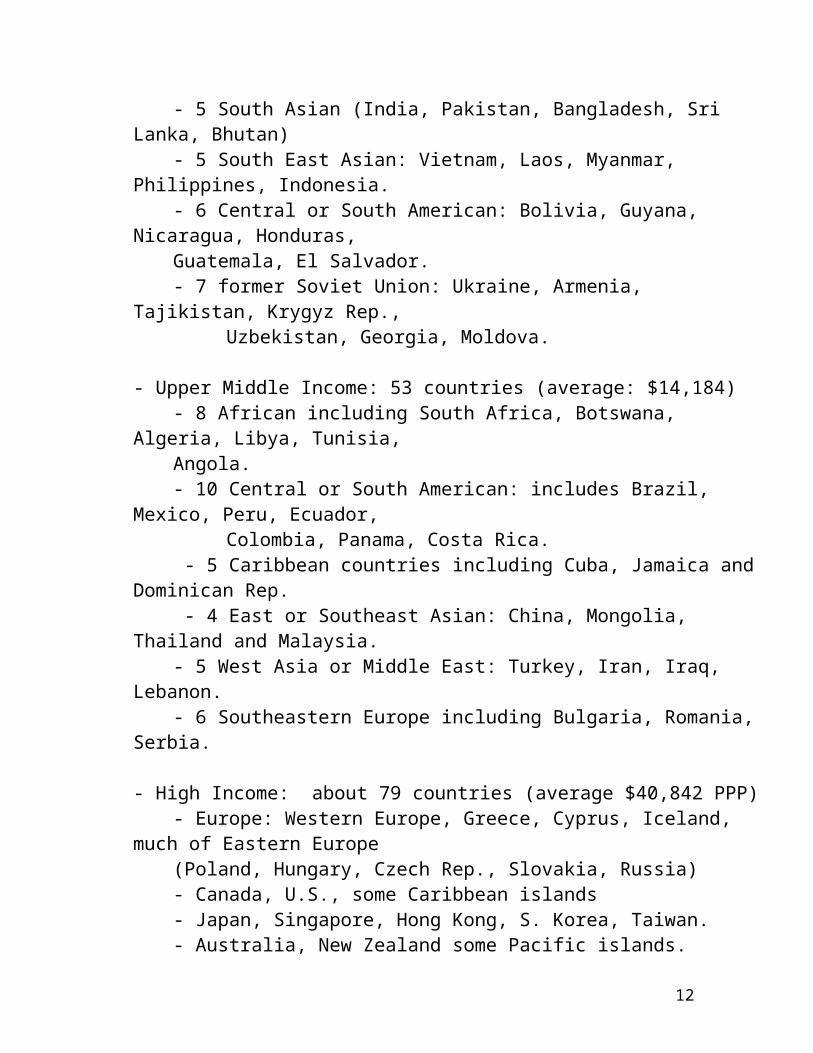
Low, Middle and High Income Countries: Who are they?
- See maps from World Bank site.
- Based on World Bank data for 2014 (per capita)- High, Middle and Low definitions are not based on PPP figures.- Low income: less than $1,046; Lower Middle: $1,046-$4,125;
Upper middle $4,126-$12,745; High $12,746 or more.
- Low Income: 31 countries (average $1,593 PPP)- 1 South Asian country (Nepal).- 26 African countries- 1 Central/West Asian country (Afghanistan)- 2 East/Southeast Asian countries (Cambodia, N.Korea).- 1 in the Americas: Haiti
- Lower Middle Income: 51 countries (average: $6,073)- 14 African (including Nigeria, Sudan, Egypt, Congo, Morocco)- 5 South Asian (India, Pakistan, Bangladesh, Sri Lanka, Bhutan)- 5 South East Asian: Vietnam, Laos, Myanmar, Philippines, Indonesia. - 6 Central or South American: Bolivia, Guyana, Nicaragua, Honduras,
Guatemala, El Salvador. - 7 former Soviet Union: Ukraine, Armenia, Tajikistan, Krygyz Rep.,
Uzbekistan, Georgia, Moldova.
- Upper Middle Income: 53 countries (average: $14,184)- 8 African including South Africa, Botswana, Algeria, Libya, Tunisia,
Angola.- 10 Central or South American: includes Brazil, Mexico, Peru, Ecuador,
Colombia, Panama, Costa Rica. - 5 Caribbean countries including Cuba, Jamaica and Dominican Rep. - 4 East or Southeast Asian: China, Mongolia, Thailand and Malaysia.- 5 West Asia or Middle East: Turkey, Iran, Iraq, Lebanon.- 6 Southeastern Europe including Bulgaria, Romania, Serbia.
7
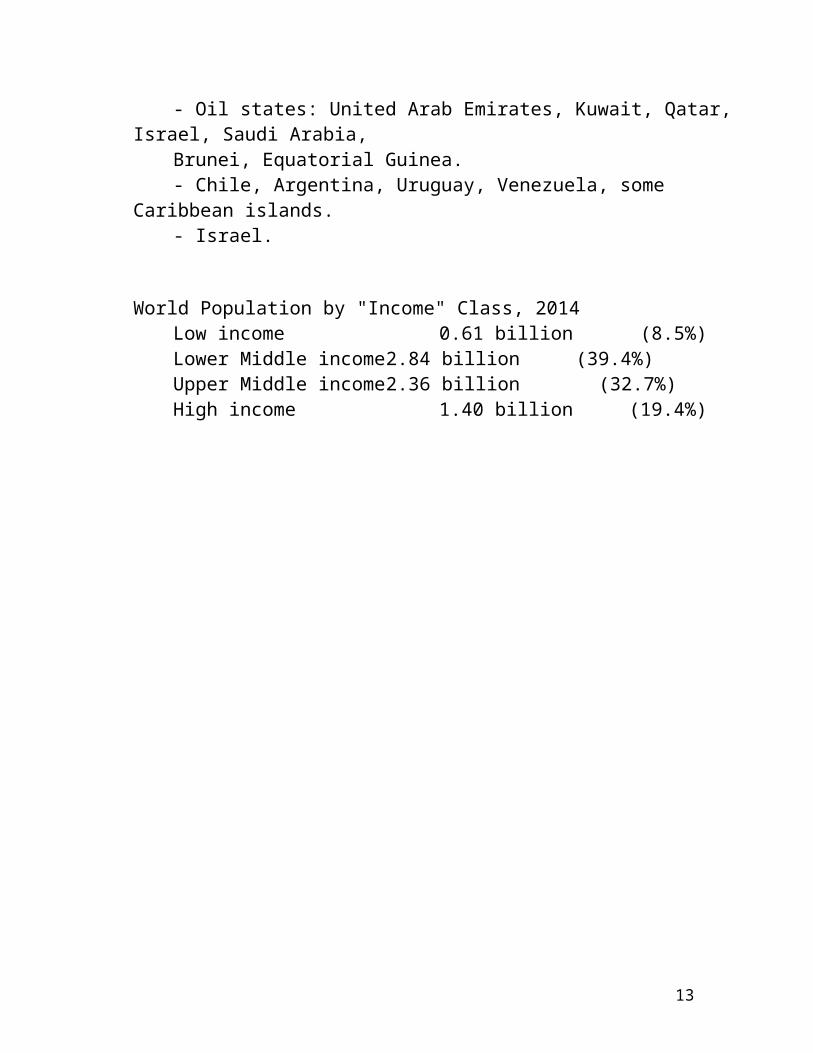
- High Income: about 79 countries (average $40,842 PPP)- Europe: Western Europe, Greece, Cyprus, Iceland, much of Eastern Europe
(Poland, Hungary, Czech Rep., Slovakia, Russia)- Canada, U.S., some Caribbean islands- Japan, Singapore, Hong Kong, S. Korea, Taiwan. - Australia, New Zealand some Pacific islands.- Oil states: United Arab Emirates, Kuwait, Qatar, Israel, Saudi Arabia,
Brunei, Equatorial Guinea.- Chile, Argentina, Uruguay, Venezuela, some Caribbean islands.- Israel.
World Population by "Income" Class, 2014
Low income 0.61 billion (8.5%)Lower Middle income 2.84 billion (39.4%)Upper Middle income 2.36 billion (32.7%)High income 1.40 billion (19.4%)
8
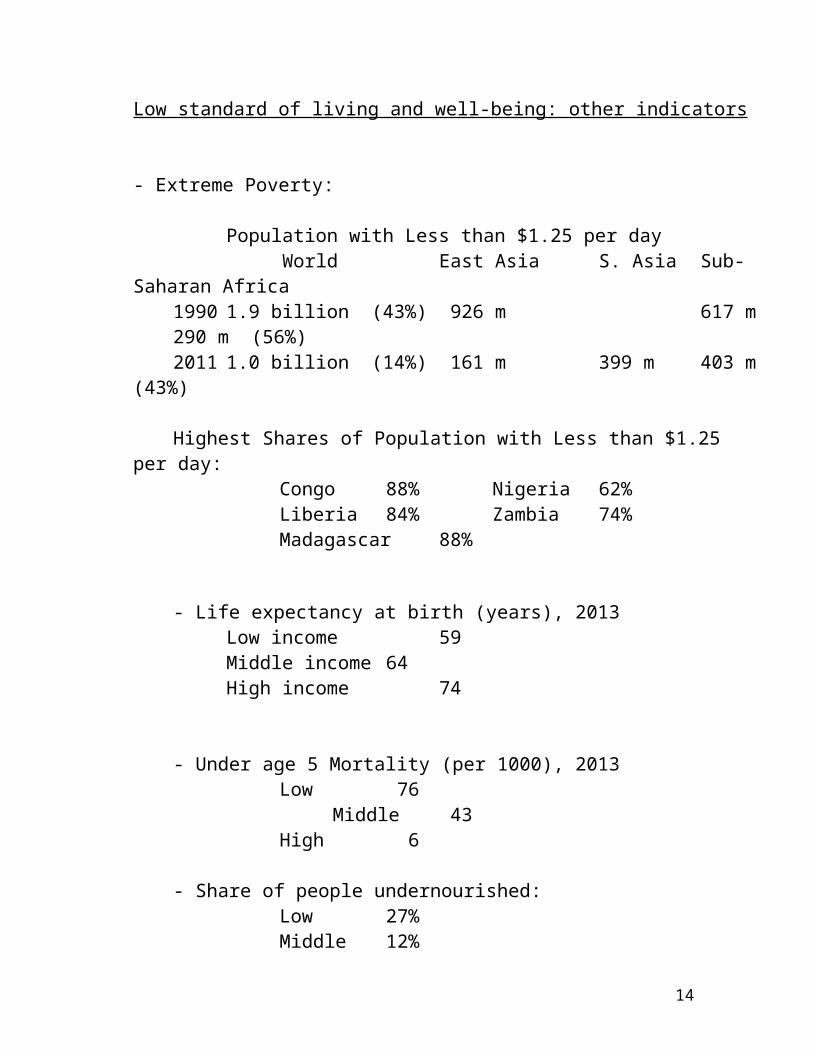
Low standard of living and well-being: other indicators
- Extreme Poverty:
Population with Less than $1.25 per day World East Asia S. Asia Sub-Saharan Africa
1990 1.9 billion (43%) 926 m 617 m 290 m (56%)2011 1.0 billion (14%) 161 m 399 m 403 m (43%)
Highest Shares of Population with Less than $1.25 per day:Congo 88% Nigeria 62%Liberia 84% Zambia 74%Madagascar 88%
- Life expectancy at birth (years), 2013 Low income 59 Middle income 64 High income 74
- Under age 5 Mortality (per 1000), 2013Low 76 Middle 43High 6
- Share of people undernourished:Low 27%Middle 12%High -
9
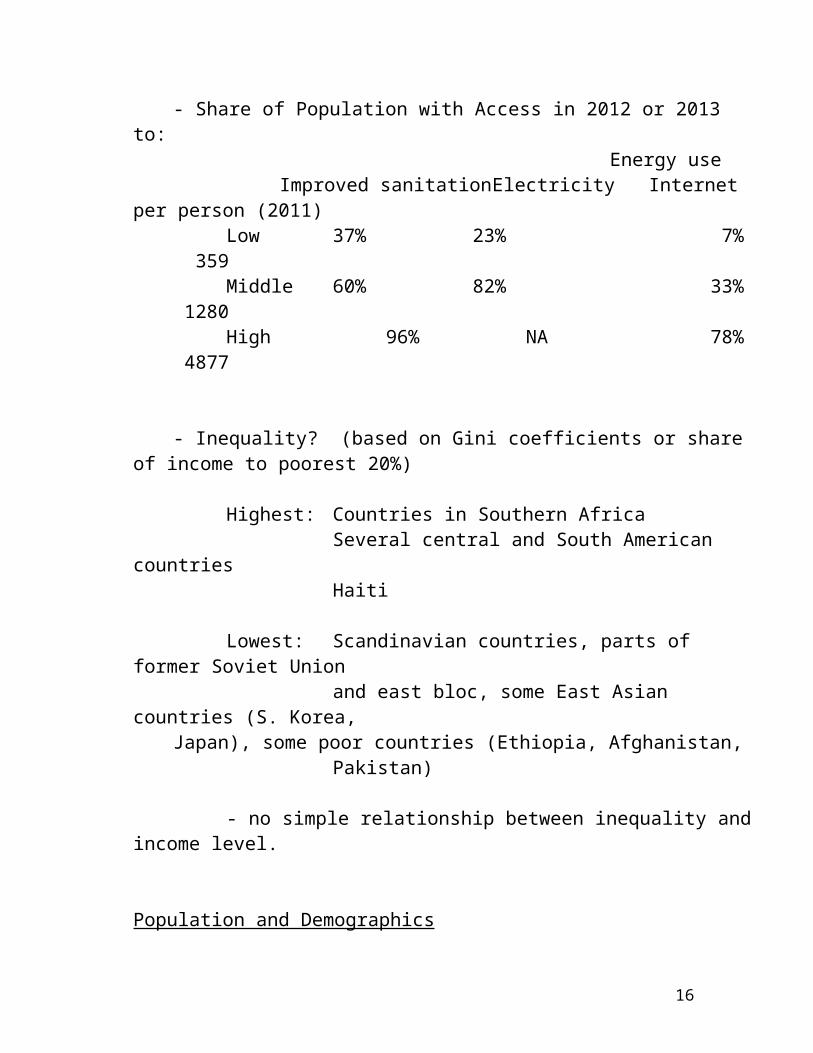
- Share of Population with Access in 2012 or 2013 to: Energy use
Improved sanitation Electricity Internet per person (2011)Low 37% 23% 7% 359Middle 60% 82% 33% 1280High 96% NA 78% 4877
- Inequality? (based on Gini coefficients or share of income to poorest 20%)
Highest: Countries in Southern Africa Several central and South American countriesHaiti
Lowest: Scandinavian countries, parts of former Soviet Union and east bloc, some East Asian countries (S. Korea, Japan), some poor countries (Ethiopia, Afghanistan, Pakistan)
- no simple relationship between inequality and income level.
Population and Demographics
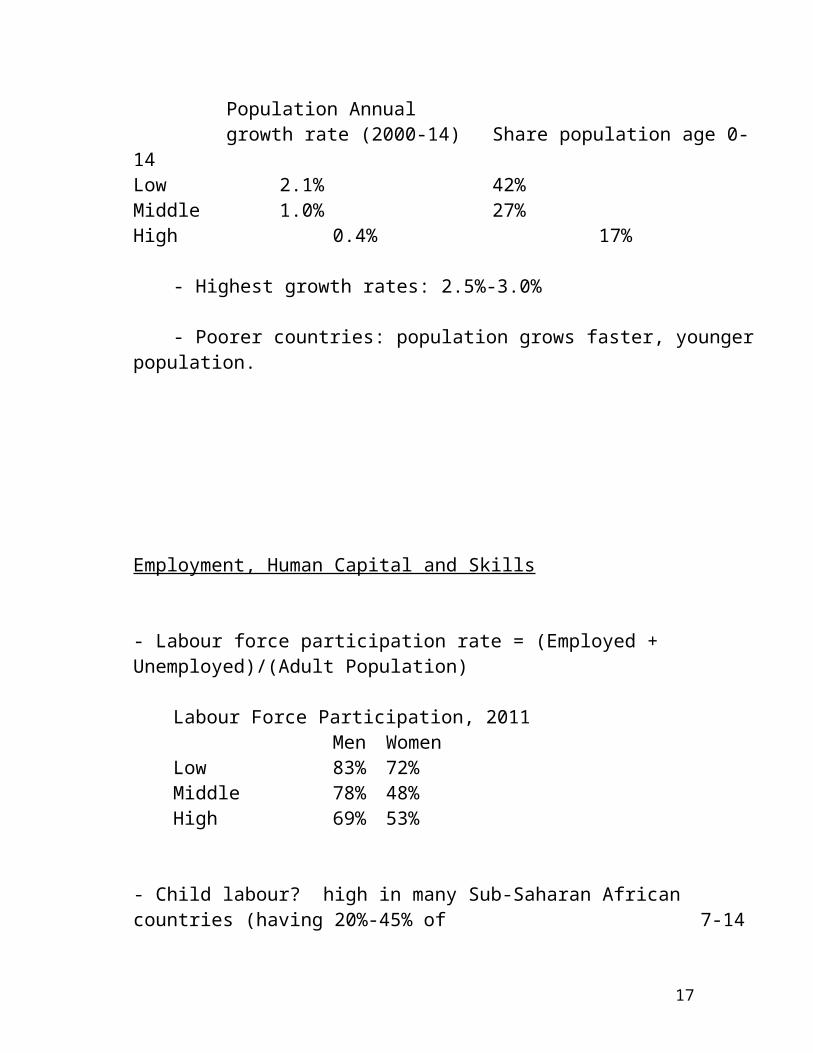
Population Annualgrowth rate (2000-14) Share population age 0-14
Low 2.1% 42%Middle 1.0% 27%High 0.4% 17%
- Highest growth rates: 2.5%-3.0%
- Poorer countries: population grows faster, younger population.
10
Employment, Human Capital and Skills
- Labour force participation rate = (Employed + Unemployed)/(Adult Population)
Labour Force Participation, 2011Men Women
Low 83% 72%Middle 78% 48%High 69% 53%
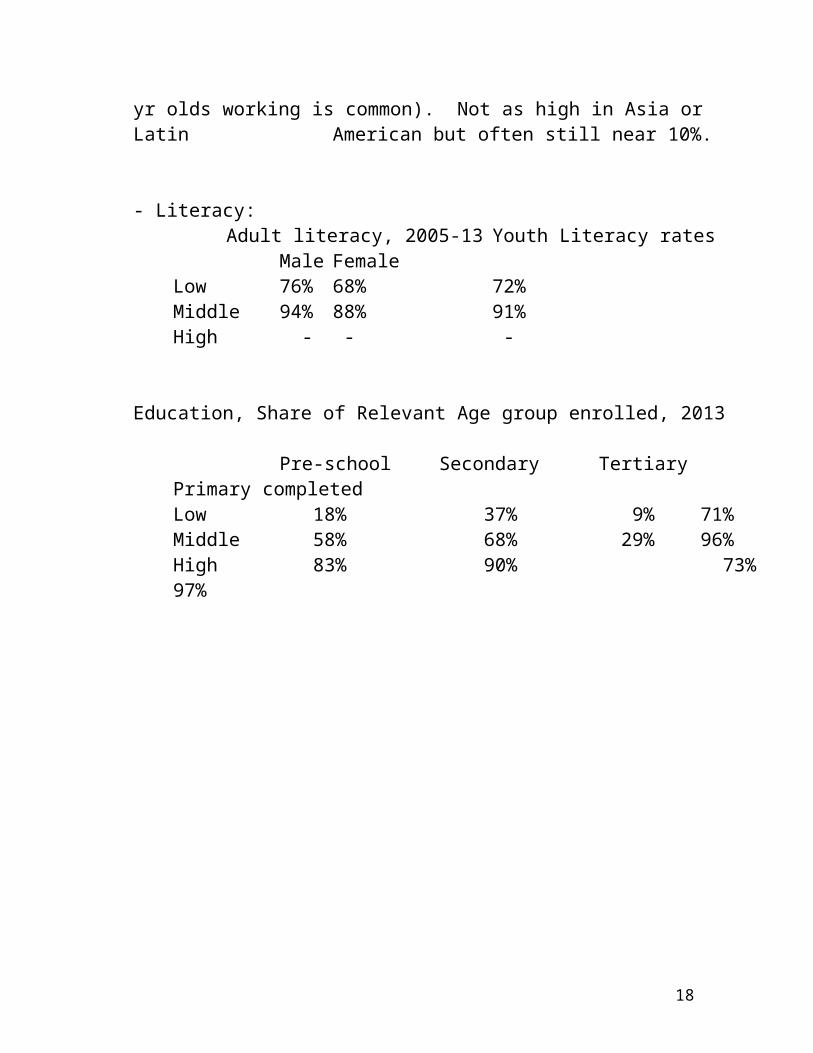
- Child labour? high in many Sub-Saharan African countries (having 20%-45% of 7-14 yr olds working is common). Not as high in Asia or Latin American but often still near 10%.
- Literacy:Adult literacy, 2005-13 Youth Literacy rates
Male FemaleLow 76% 68% 72%Middle 94% 88% 91%High - - -
Education, Share of Relevant Age group enrolled, 2013
Pre-school Secondary Tertiary Primary completedLow 18% 37% 9% 71%Middle 58% 68% 29% 96%High 83% 90% 73% 97%
11
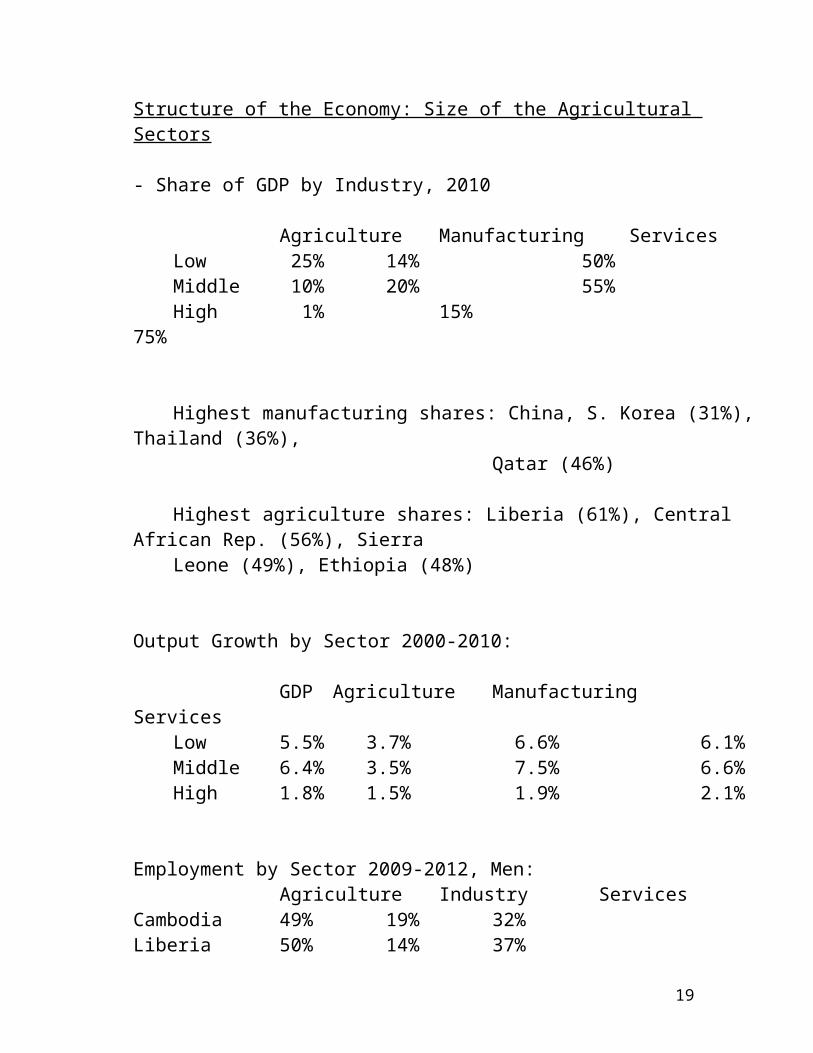
Structure of the Economy: Size of the Agricultural Sectors
- Share of GDP by Industry, 2010
Agriculture Manufacturing ServicesLow 25% 14% 50%Middle 10% 20% 55%High 1% 15% 75%
Highest manufacturing shares: China, S. Korea (31%), Thailand (36%), Qatar (46%)
Highest agriculture shares: Liberia (61%), Central African Rep. (56%), Sierra Leone (49%), Ethiopia (48%)
Output Growth by Sector 2000-2010:
GDP Agriculture Manufacturing ServicesLow 5.5% 3.7% 6.6% 6.1%Middle 6.4% 3.5% 7.5% 6.6%High 1.8% 1.5% 1.9% 2.1%
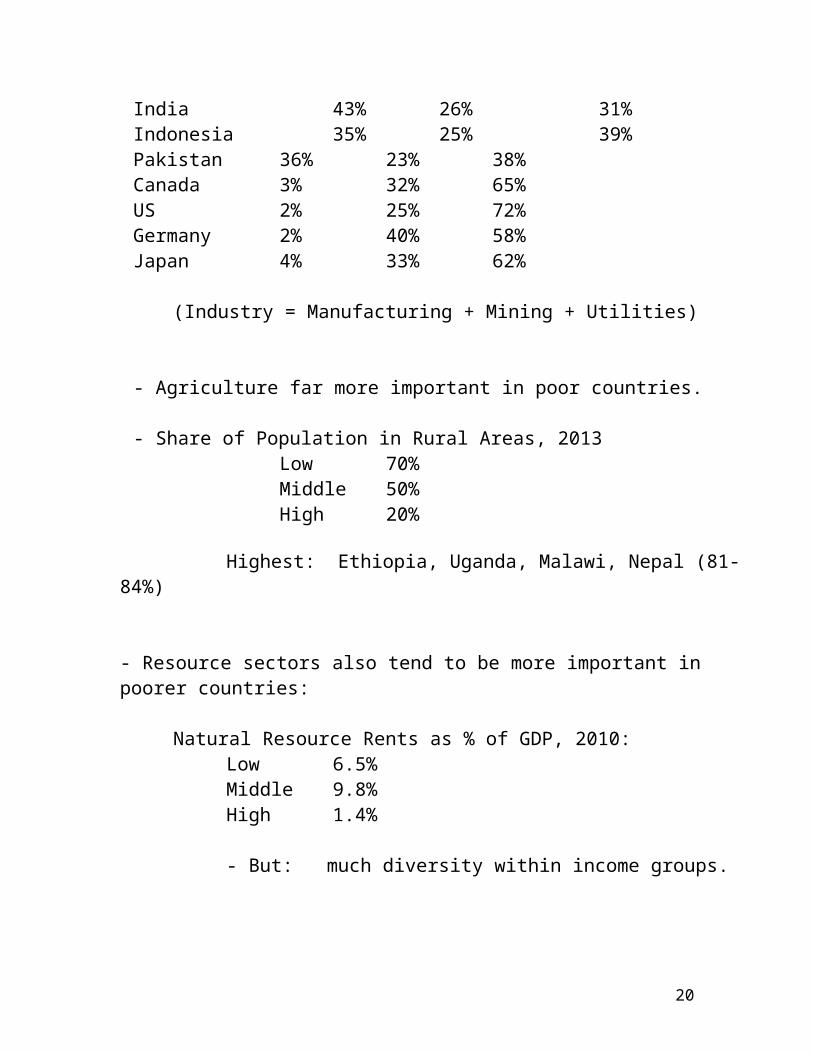
Employment by Sector 2009-2012, Men:Agriculture Industry Services
Cambodia 49% 19% 32%Liberia 50% 14% 37%India 43% 26% 31%Indonesia 35% 25% 39%Pakistan 36% 23% 38%Canada 3% 32% 65%US 2% 25% 72%Germany 2% 40% 58%Japan 4% 33% 62%
(Industry = Manufacturing + Mining + Utilities)
12
- Agriculture far more important in poor countries.
- Share of Population in Rural Areas, 2013Low 70%Middle 50%High 20%
Highest: Ethiopia, Uganda, Malawi, Nepal (81-84%)
- Resource sectors also tend to be more important in poorer countries:
Natural Resource Rents as % of GDP, 2010:Low 6.5%Middle 9.8%High 1.4%
- But: much diversity within income groups.
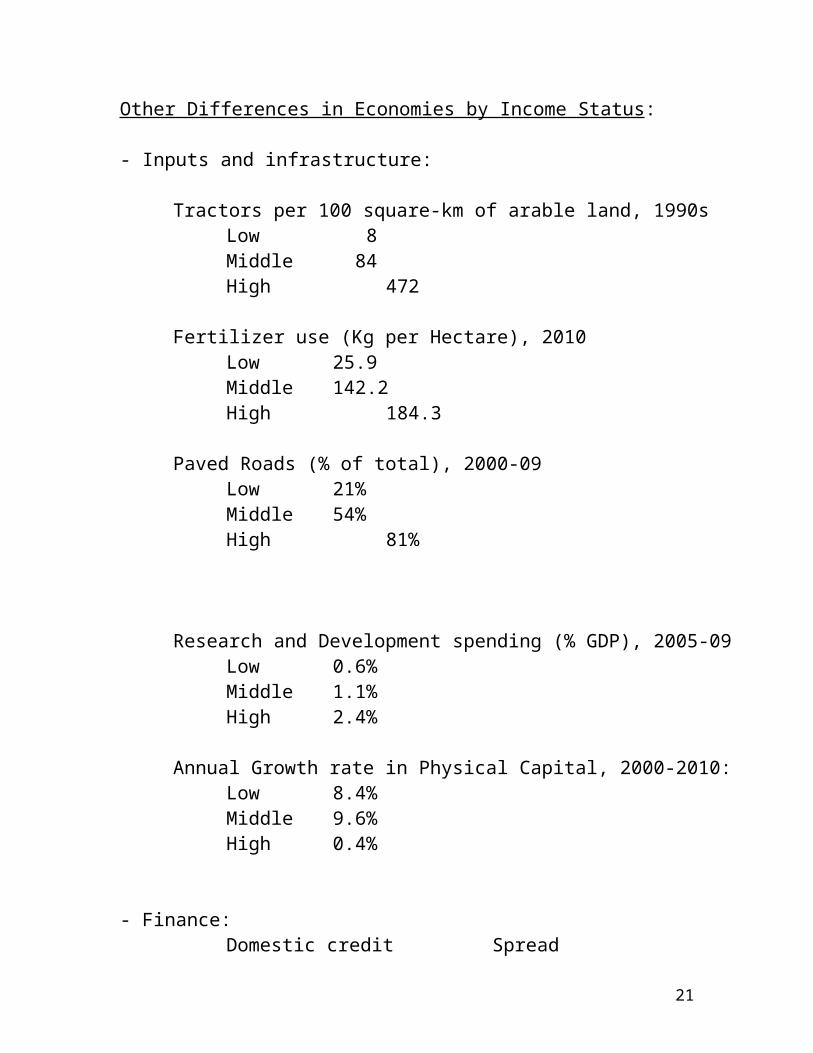
Other Differences in Economies by Income Status:
- Inputs and infrastructure:
Tractors per 100 square-km of arable land, 1990sLow 8Middle 84High 472
Fertilizer use (Kg per Hectare), 2010Low 25.9Middle 142.2High 184.3
Paved Roads (% of total), 2000-09Low 21%Middle 54%High 81%
13
Research and Development spending (% GDP), 2005-09Low 0.6%Middle 1.1%High 2.4%
Annual Growth rate in Physical Capital, 2000-2010:Low 8.4%Middle 9.6%High 0.4%
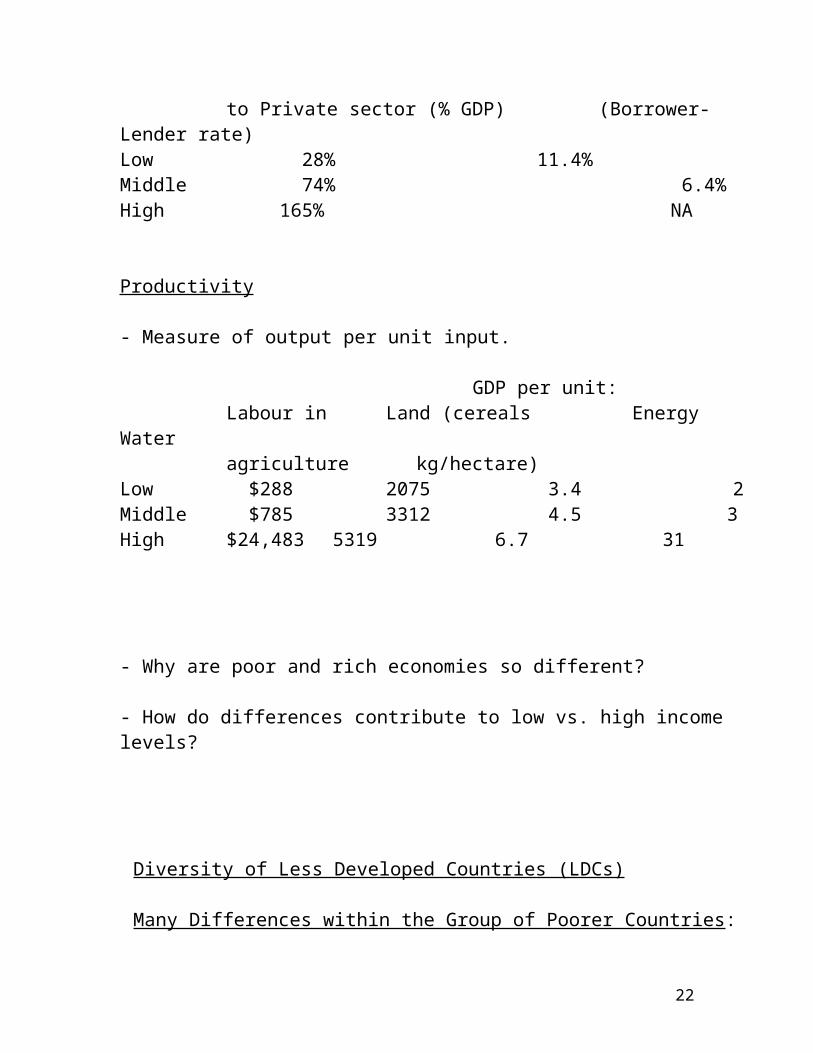
- Finance:Domestic credit Spreadto Private sector (% GDP) (Borrower-Lender rate)
Low 28% 11.4%Middle 74% 6.4%High 165% NA
Productivity
- Measure of output per unit input.
GDP per unit:Labour in Land (cereals Energy Wateragriculture kg/hectare)
Low $288 2075 3.4 2Middle $785 3312 4.5 3High $24,483 5319 6.7 31
- Why are poor and rich economies so different?
- How do differences contribute to low vs. high income levels?
14

Diversity of Less Developed Countries (LDCs)
Many Differences within the Group of Poorer Countries:
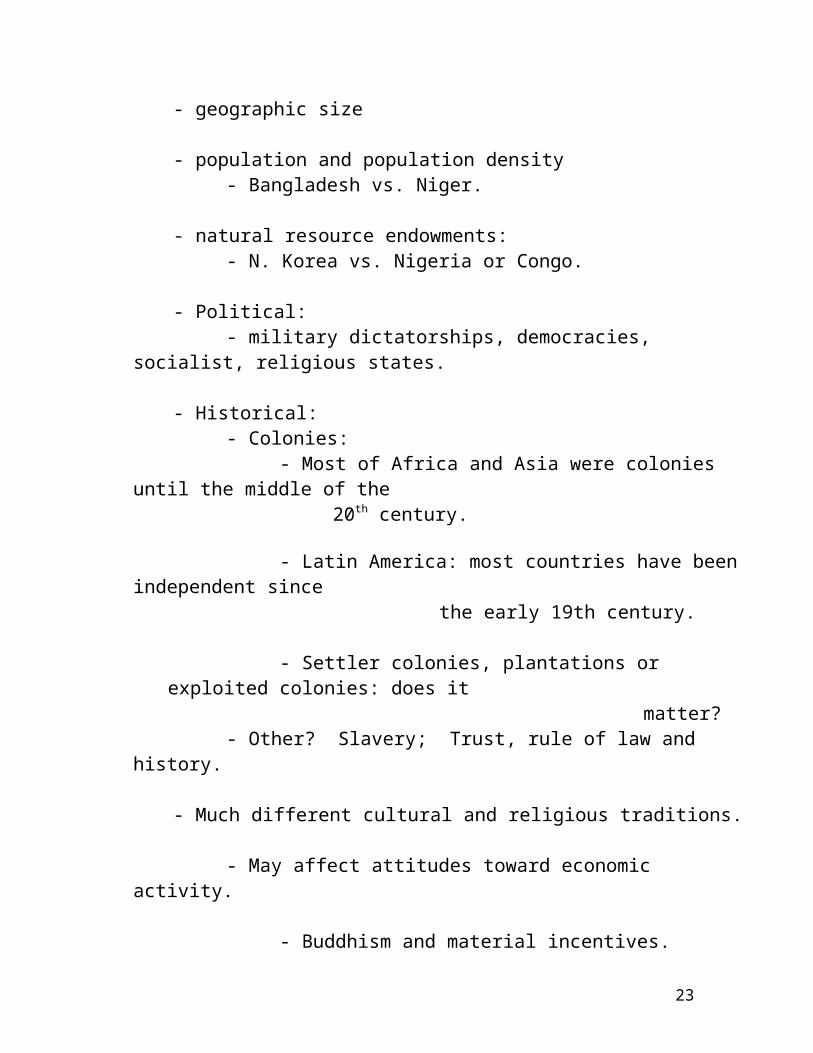
- geographic size
- population and population density- Bangladesh vs. Niger.
- natural resource endowments:- N. Korea vs. Nigeria or Congo.
- Political:- military dictatorships, democracies, socialist, religious states.
- Historical:- Colonies:
- Most of Africa and Asia were colonies until the middle of the 20th century.
- Latin America: most countries have been independent since the early 19th century.
- Settler colonies, plantations or exploited colonies: does it matter?
- Other? Slavery; Trust, rule of law and history.
- Much different cultural and religious traditions.
- May affect attitudes toward economic activity.
- Buddhism and material incentives.
- Confucian and Muslim influences: any economic effects?
- Explanations of why some are rich and why some are poor must be able to account for this diversity.
15
Recent Growth Experience:
- Main focus is on the annual growth rate in Per capita income measures.
- There has been much diversity in growth experience during the last few decades:
- See Fig. 1.6 “Distribution of Growth Rates” 1975-2009 from Weil Economic Growth Ch.1 (real GDP per capita)
- Extreme average annual growth in per capita income:
- sustained rates of 6%-9% are very high and very rare.
(next section: but level of maximum rates has risen over time)
Spence (2011) The Next Convergence p. 54 (handout): lists 13 countries with average annual growth of 7% or more for a period of 25 years or more.
- rich developed countries? growth of 1.5%-2.0% typical.
- temporary rates can be higher e.g. recovery from a big bust Latvia, Lithuania grew nearly
15% 2010-11 commodity price boom for big exporter.
16
Basic Growth Rate Math:
- Define: g = annual growth rate, g=.02 is a 2% growth rate.
Yt = GDP per capita at time t.
- For a one year period from year t to year t+1:
Yt+1 = Yt ∙ (1+g) with g = (Yt+1- Yt)/ Yt
- Often focus is on the “average annual growth rate” over some multi-year period.
- The average annual growth rate over “n” years (from t to t+n):
Yt+n = Yt ∙(1+g)n
- then solving for g:
g = (Yt+n/Yt)1/n -1 this is the average annual growth rate for the n-year period.
- Concept of average annual growth rate answers the question: what constant annual rate of growth would account for the observed growth.
Example: Say Japan’s GDP per capita was $3,500 in 1950 and $39,600 in 1983.
Japan 1950-83: Y1983 = Y1950∙(1+g)(1983-1950)
Y1983=$39,600 , Y1950=$3,500
g = (39,600/3500)1/33 -1 =.076 (7.6%)
17
Logarithms and Growth Rates
- Can express a given number as ‘e’ raised to some power. This power is the number’s natural logarithm.
- Natural logarithm of x: ln x
where: x = eln x by definition of ln x
e = 2.71828 by definition.
e.g. x=10 then ln(x)=ln(10)=2.302585 since e2.302585=10
- Some rules of logarithms:
ln xn = n ln x
ln xy = ln x + ln y
ln (x/y) = ln x - ln y
(1) A useful (often-used) approximation? ln(1+x) x
- decent for small x:
x ln(1+x)0.010 0.0100.020 0.0200.030 0.0300.040 0.0390.050 0.0490.060 0.0580.070 0.0680.080 0.077
18
(2) Doubling time:
- How long will it take GDP per capita (Y) to double given a constant annual growth rate of g?
- As before: Yt = GDP per capita at start (period t)Yt+n = GDP per capita n years later in period t+n.
Then:Yt+n= Yt (1+g)n
- GDP per capita has doubled when: Yt+n = 2Yt
2Yt= Yt (1+g)n
2= (1+g)n
ln 2 = n ln(1+g)
n = ln2 / ln (1+g) is the doubling time.
- A Rule of Thumb? "Rule of 72"
Doubling time roughly equals: 72/(gx100)
e.g., g=.05 n=14.2 years = ln(2)/ln(1.05) n=14.4 by the rule of 72.
19
(3) Catch-up time
Country X: gx, Xt are its growth rates GDP per capita at time t.
Country Y: gy, Yt are its growth rates GDP per capita at time t.
Xt+n = Xt (1+gx)n Yt+n = Yt (1+gy)n
- Catch-up will have occured when Xt+n=Yt+n
Xt (1+gx)n = Yt (1+gy)n
take logarithms and solve for n:
ln Xt + n ln (1+gx) = ln Yt + n ln (1+gy)
n = (ln Xt - ln Yt) / {ln (1+gy) - ln (1+gx)}
e.g., say for average low-income country gx=.040 (4.0%)Xt=$1,378 (actual 2011 value)
and average high-income country gy=.015 (1.5%)Yt=$38,523 (actual 2011 value)
catch-up: n= 136.9 years.
20
Example (see spreadsheet on class website):
Income Growth rate Doubling time (yrs): Catchup Time (years):
(g) ln(2)/ln(1+g) Rule of 72Low income country 1378 0.04 17.7 18 136.9High Income country 38523 0.015 46.6 48
2011 2041 2071 2101 21310
50000
100000
150000
200000
250000
300000
350000
400000
High income (g=.015)Low income (g=.040)
Year
Real
GDP
per
capi
ta
21
(4) Logarithmic Scale and Growth Rates
- Often economic data series over time are transformed into logarithms. e.g. plot the log of GDP vs. time rather than GDP vs. time.
- This can make it easier to perceive changes in growth rates over time.
- Why? Take a variable Y between two time periods t and t+1:
Yt+1=Yt (1+g) where g is the growth rate
so ln(Yt+1)= ln(Yt) ln(1+g)
or: ln(Yt+1)-ln(Yt) = ln(1+g)
- the per period change in ln(Y) between any two adjacent periods is
the same if g is the same.
- Similarly for the change over n-periods (between t and t+n):
ln(Yt+n)= ln(Yt)∙ n ln(1+g)
[ln(Yt+n)-ln(Yt)]/n = ln(1+g)
- the change in ln(Y) over any n-year period is the same if g is the same between these n-year periods.
- So when the variable is in logs an equal slope across some time period implies an equal growth rate.
22
- For example: UK GDP per capita since 1800 (in real $):
1800181218241836184818601872188418961908192019321944195619681980199220040
5,000
10,000
15,000
20,000
25,000
30,000
GDP per capita UK 1800-2010
1800 1815 1830 1845 1860 1875 1890 1905 1920 1935 1950 1965 1980 1995 20106
6.5
7
7.5
8
8.5
9
9.5
10
10.5
Ln(GDP per capita) for the UK 1800-2010
23