Embed Size (px)
Citation preview
1
Analysis of Critical Features and Evaluation of BIM Software:
Towards a Plugin for Construction Waste Minimisation
Abstract
The overall aim of this study is to investigate the potential of Building Information
Modelling (BIM) for construction waste minimisation. We evaluated leading BIM design
software products and concluded that none of them currently supports construction waste
minimisation. This motivates the development of a plugin for predicting and minimizing
construction waste. After rigorous literature review and conducting four focused group
interviews (FGIs), we have identified a list of 12 imperative BIM factors that should be
harnessed for predicting and designing out construction waste. These factors are
categorised into four layers, namely “BIM-core-layer”, “BIM-auxiliary-layer”, “waste-
management-criteria”, and “application-layer”. Further, a process to carry out BIM-
enabled Building Waste performance Analysis (BWA) is proposed. We have also
investigated usage of big data technologies in the context of waste minimisation. We
highlight that big data technologies are inherently suitable for BIM due to their support of
storing and processing large datasets. In particular, the use of graph based representation,
analysis, and visualisation can be employed for advancing the state of the art in BIM
technology for construction waste minimisation.
Keywords – BIM, Construction Waste Prediction and Minimisation, Design out Waste,
Waste Prevention, Big Data Analytics, NoSQL Systems
Paper Type – Review paper
1 Introduction
With huge material intake, construction industry produces large proportions of waste
yearly in the United Kingdom (UK) [1]. The main problems that arise from construction
waste include landfill depletion, carbon and greenhouse gas emission, huge wastage of
1
2
3
4
5
6
7
8
9
10
11
12
13
14
15
16
17
18
19
20
21
22
23
24
25
2
energy and raw materials, and increased project cost [2, 3, 4, 5]. The economic and
environmental benefits of construction waste minimisation are well understood.
Unfortunately, existing initiatives either undertaken by the UK government or the
Architecture, Engineering, and Construction (AEC) industry, are largely ineffective [2, 4,
6, 5] due to the ‘end-of-the-pipe’ treatment philosophy, which is a strategy whereby
construction waste is considered only after it has been generated [3]. In contrast, a more
promising approach, supported by the idea of design out waste research, is waste
prevention [2, 4, 5].
Building Information Modelling (BIM) is revolutionizing the AEC industry and is
becoming the de-facto standard to manage all of the activities of the AEC industry [7].
The superior BIM modelling philosophy enables stakeholders to identify design,
construction, and operation related problems prior to its physical construction [8, 9, 10,
9]. While BIM has been highlighted to offer greater opportunities for construction waste
minimisation [5, 11, 12], none of the existing BIM software products surprisingly offer
any waste prediction and minimisation functionality. Considering the UK government’s
BIM strategy of adopting collaborative 3D BIM by 2016 [13], and the importance of
designing out waste, there are clearly unprecedented opportunities to employ BIM in
plugin development for waste prediction and minimisation at early design stage.
Existing waste minimisation tools such as SMARTWasteTM, SWMP, NetWaste, DoWT-
B, SmartStartTM, SmartAuditTM, etc. are used to produce design guides and checklists that
are not helpful for designers and contractors to predict and reduce waste at design stage
[14, 5, 1]. Also, these tools can only be used after the bill of quantities has been
produced, thereby making it too late for designers to incorporate relevant waste
minimisation strategies. Additionally, these tools are not interoperable with existing BIM
software but are used in isolation, therefore making it unsuitable for designers to
minimise waste at early design stages [15, 5].
Based on the aforementioned reasons, this study aims to identify critical BIM features
that could be harnessed to implement construction waste minimisation at early design
stage. These critical BIM features are categorised into four layers: BIM core layer, BIM
26
27
28
29
30
31
32
33
34
35
36
37
38
39
40
41
42
43
44
45
46
47
48
49
50
51
52
53
54
3
auxiliary layer, waste management criteria, and application layer. These critical features
also provide a basis for evaluating existing BIM software products and devising a BIM-
enabled building waste performance analysis (BWA) process. Further, some
technological solutions including big data analytics, NoSQL systems, and semantic
technologies have also been proposed to complement BIM, which are deemed useful for
developing construction waste minimisation plugin.
More specifically, our research objectives are:
a) Identification of the critical features of BIM and ICT based technology solutions
for construction waste prediction and minimisation.
b) Evaluation of BIM software based on the identified critical features to assess their
capabilities for plugin development.
The main stream of knowledge behind this study involves a thorough review of extant
literature on BIM software products and Focused Group Interviews (FGIs) to identify
critical BIM features. Transcripts of FGIs were used to confirm and validate these criteria
using thematic analysis. This study contributes to effective waste management by
identifying critical BIM features along with identification of big data solutions that could
be tailored to implement robust waste minimisation plugin. Our research contributions
include (i) an evaluation of leading BIM software products on the basis of their support
of critical BIM features, (ii) identification of 12 imperative BIM factors that should be
harnessed to tackle construction waste, and (iii) devising a BIM-enabled construction
waste performance analysis (BWA) process, and (iv) the study of the implication of using
big data technologies for plugin development. This study contains general insights for
stakeholders involved in construction waste management. In particular, we offer insights
and guidelines for software engineers interested in developing similar kinds of tools for
construction waste simulation by leveraging BIM and big data technologies.
Section 2 briefly introduces BIM software products. In Section 3, the research
methodology underpinning this study is explained. Section 4 deliberates our layered
approach to explain critical BIM features. Section 5 deliberates BIM-enabled building
55
56
57
58
59
60
61
62
63
64
65
66
67
68
69
70
71
72
73
74
75
76
77
78
79
80
81
82
4
waste performance analysis (BWA) process. Section 6 highlights big data technologies
and their promise to solve certain challenges while developing waste simulation tool.
Section 7 concludes the paper and gives brief outlook to future research directions.
2 Literature Review: The BIM Design Software Products
In this section, BIM design software products are discussed. While there are a large
number of BIM design software products in the market, five leading BIM design products
have been chosen, namely Autodesk Revit, Bentley MicroStation, Graphisoft ArchiCAD,
Vectorworks, and Digital Project for the purpose of this review. This is because a review
of literature has revealed that prevailing purpose-built simulation software, developed for
waste, thermal and energy analysis, are mostly based on the platforms offered by one of
the selected BIM design software products [14, 16, 17, 4, 18]. This choice is further
endorsed by the participants of FGIs who agreed that these BIM design software products
are the most popular design tools in UK construction industry and that they use one of
these products in majority of their daily design-related activities. Other purpose-built
BIM based software, developed for complementing designer’s activities such as model
checking, 4D, and 5D, are not considered since they are domain-specific and are not
designed to cover almost every activity happening at the early design stage; an aspect
which this work is focused on. In this section, we provide a brief sketch of the history,
key functionalities and limitations (where applicable) of these products.
2.1 Autodesk Revit
Revit, which was introduced by Autodesk in 2002 [19], is the most popular BIM design
software among architects, engineers, designers, and contractors. The three key sub-
systems of Revit are Revit Architecture, Revit Structural, and Revit MEP, which can be
used to design different types of buildings, construct building components in 3D, and
annotate components with 2D drafting elements. This information is stored into a
centralised database to aid information sharing and collaboration among stakeholders.
The centralised database supports concurrent operations on a single building model while
maintaining the model’s consistency. In particular, Revit offers an intuitive user-friendly
83
84
85
86
87
88
89
90
91
92
93
94
95
96
97
98
99
100
101
102
103
104
105
106
107
108
109
110
5
interface that enables easy access to user options and manipulations of building models.
Revit also provides a large number of in-built building objects that are categorized into
“Revit Families”. In addition, Revit supports a wide range of building performance
simulations, which include energy analysis, environment impact analysis, site planning
and analysis, quantity take-off and cost estimation, construction planning and monitoring,
etc. All these have encouraged the wide adoption of Revit in the construction industry.
A key limitation of Revit is its in-memory management system that heavily relies on
computers’ main memory. This significantly slows down building modelling, rendering,
and simulation when the project file grows beyond 300MB [16].
2.2 Bentley MicroStation
Bentley Systems offers products for architecture, engineering, infrastructure, and
construction. Bentley Systems developed MicroStation that is a file-based system where
all actions are immediately written on files hence resulting in less memory overhead [20].
The key sub-systems of MicroStation include Bentley Architecture, Bentley Building
Mechanical Systems, Bentley Building Electrical Systems, Bentley InRoads, Bentley
Map, and Bentley MXROAD. The users can produce drawings, enable 2D detailing and
annotate 3D surface. The MicroStation is multi-platform and provides server capabilities.
The user interface of MicroStation is relatively complex and supports advanced features
like drag-over operator hints, small cursor, and customized menus. With sophisticated
drawing capabilities, designer can view even weights of lines along with text. It supports
large number of built-in building objects that can be customized easily.
Since MicroStation has wide range of extensions to simulate almost every aspect of AEC
performances; however, these extensions are often partially integrated [16].
2.3 Graphisoft ArchiCAD
Graphisoft initially developed ArchiCAD and introduced it to the market in 1980s [21].
Later in 2007, Nemetschek acquired the company, which is famous for civil engineering
111
112
113
114
115
116
117
118
119
120
121
122
123
124
125
126
127
128
129
130
131
132
133
134
135
136
6
applications. ArchiCAD is an architectural BIM application that offers comprehensive
design suite for architects, designers and planners with sophisticated support for 2D
drawings, 3D modelling, design renderings and visualisations. The user interface of
product is relatively easy and intuitive. Different programs are organized in context
sensitive menus. A broad range of built-in parametric objects is available. It provides
interoperability with large number of applications using Geometric Description Language
(GDL), ODBC, and Industry Foundation Classes (IFC). It integrates seamlessly with
Bentley BIM server to enable effective collaboration.
It is also an in-memory system like Revit and often incurs scaling problems for larger
projects [16] which could be overcome by using DELTA Server extension.
2.4 Vectorworks
This product was initially developed in 1985 by Diehl Graphisoft and is later acquired by
Nemetschek who named it Vectorworks. It is CAD software that offers comprehensive
tools for the designers and architects [22]. This product targets small firms and provides a
variety of tools including Architect, Designer, Landmark, Spotlight, Machine design, and
Renderworks. The user-interface across tools is highly integrated, offering customizable
menus with rich functionality. Drawing capabilities can associate annotations with model
and offers partial bi-directional associativity. It provides wide range of customizable
built-in objects. It also offers data exchange with structural, mechanical, energy,
environmental, and visualisation applications using Open Database Connectivity
(ODBC), API, and IFC.
The key limitations include restricted BIM functionality and lack of Globally Unique
Identifier (GUID) or version information with objects [16].
2.5 Digital Project
Digital Project (DP) is developed by Gehry Technologies. It is BIM based CAD software
and is file-based scalable system. It offers applications for architecture, engineering,
137
138
139
140
141
142
143
144
145
146
147
148
149
150
151
152
153
154
155
156
157
158
159
160
161
162
7
construction, and manufacturing. The key sub-systems include Architectural and
Structural, Imagine & Shape, Project Engineering Optimizer, Project Manager, and MEP
System Routing [23]. DP has complex user interface that requires adequate knowledge
for effectively using its features. The subsystems are consistent and customizable. It
offers tools to integrate manufactured product design and has a vibrant support for
fabrication. It also supports concurrent users through Apache Subversion (SVN) version
control manager. DP offers good interface for importing and exporting object’s data in
Extensible Markup Language (XML) and spreadsheets. It also provides a powerful API
for .NET developers to extend its core functionalities.
However, it has limited support for IFC and other data exchange formats and has limited
built-in objects for building design. Drawing capabilities are also not remarkable for
architectural purposes relative to other BIM software products [16].
3 Research Methodology
To prepare a comprehensive list of critical BIM features, we thoroughly reviewed the
extant literature on waste management, design-out waste, BIM, and BIM software
products. These critical factors were validated further by carrying out a qualitative study
involving FGIs with professionals from top UK construction companies. Details are
discussed in the following sections.
3.1 Literature Search Methods and Inclusion Criteria
Literature on construction waste management in general and construction waste
minimisation, design out waste, and BIM in particular was broadly surveyed. Online
databases of journals including Waste Management, Automation in Construction,
Construction Engineering and Management, Resources, Conversation and Recycling, and
Construction Management and Economics, to name a few, have been considered from the
year 1995 to 2014. Furthermore, recent reviews of research and books on construction
waste minimisation were also taken into consideration [24, 25, 26, 27]. Keywords
comprising the search queries include: “construction waste”, “construction waste
163
164
165
166
167
168
169
170
171
172
173
174
175
176
177
178
179
180
181
182
183
184
185
186
187
188
189
8
management”, “construction waste minimisation”, “design strategies for construction
waste minimisation”, “designing out construction waste”, “construction waste design
spectrums and principles”, “BIM critical features”, “BIM for waste minimisation”,
“potential of BIM for waste minimisation in design stage”, “big data in construction”,
“big data for construction waste minimisation”, and “BIM based big data analytics for
construction waste minimisation”. Overall, 200 publications were selected. Active
research groups where the issue of waste minimisation has been investigated were also
identified. While our literature search is not exhaustive (not all publications have been
incorporated due to the great breadth of published literature), we believe that our
literature search has captured a representative balanced sample of the related research.
Studies where the application of BIM is primarily investigated to resolve construction
related challenges were included. Studies that were not focused on waste minimisation in
design stage were excluded. This reduced the number of published articles to 115. Each
of these 115 publications was further scrutinized for their relevance by reading their
abstract, introduction, and conclusions. Eventually, 91 publications were selected, for
review in this study. These publications were further classified into three distinct
categories of interest, which include: (i) Construction waste minimisation in design stage,
(ii) BIM, and (iii) Application of ICT techniques like big data, visual analytics, semantic
technologies, and decision support systems in construction waste prediction and
minimisation.
It has been noticed that although literature has recently highlighted the importance of
using BIM for construction waste minimisation [6, 5], existing BIM solutions do not
incorporate waste minimisation functionality. This has motivated our study in which we
explore the various technical aspects of critical BIM features for plugin development. We
contributed to the literature by identifying twelve (12) critical BIM features for
construction waste prediction and minimisation, out of which ten (10) features—“Object
Parametric Modelling”, “Design”, “Visualisation”, “Data”, “Holistic”, “Lifecycle”,
“Interoperability”, “Technology”, “Cost Benefit Analysis”, and “Plugin Support”—came
from literature review.
190
191
192
193
194
195
196
197
198
199
200
201
202
203
204
205
206
207
208
209
210
211
212
213
214
215
216
217
218
9
3.2 Focused Group Interviews (FGIs)
To validate critical factors, and the need to understand multiple viewpoints of dealing
with construction waste, FGIs were used to bring-together real-life experience of industry
practitioners. The choice of FGIs was made as compared to individual interviews with
participants, since it allows participants to express their own experiences as well as
respond to the views expressed by others. Thus, FGIs enabled group thinking and
promote shared beliefs with deeper insights and broad range of perspectives on the issue
of waste minimisation in a short period of time. In addition, the validity and applicability
of critical BIM features is also authenticated before they were used to develop a holistic
BIM framework for waste prediction and minimisation. The perception and expectation
of industry practitioners was also better understood. In order to maintain openness and
ensure contributions of all participants the FGIs were proactively supervised by the
research team.
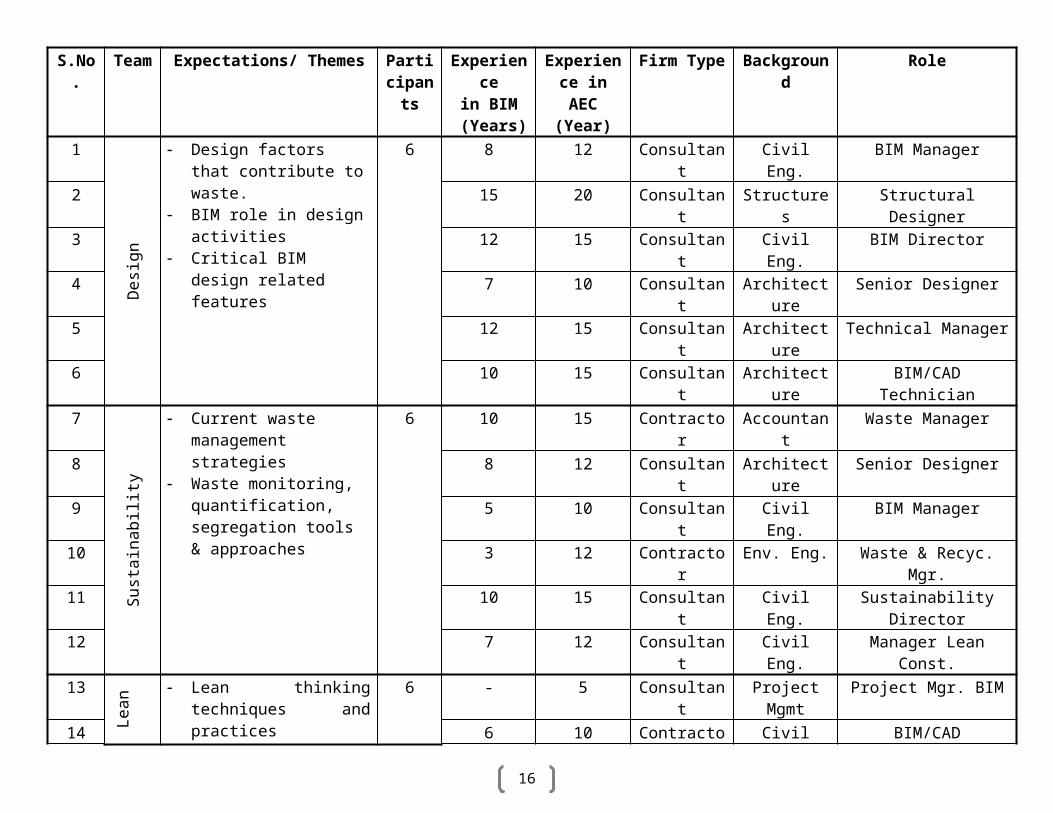
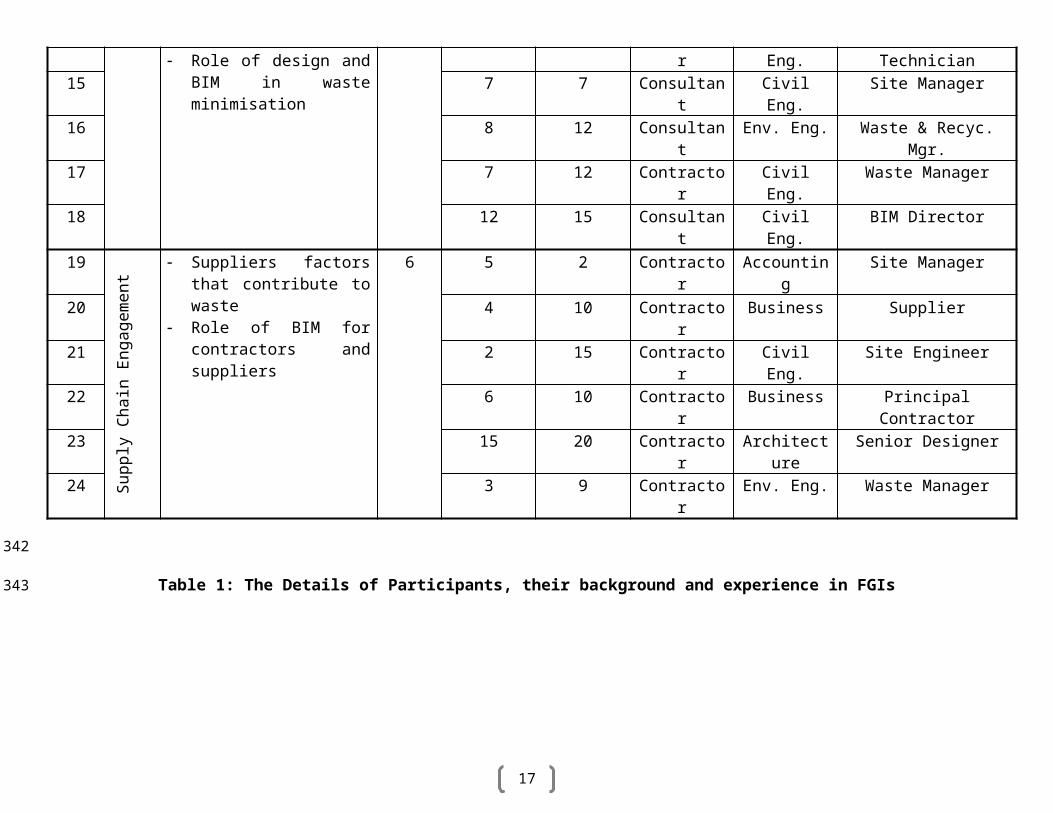
Four FGIs were conducted with a total of 24 participants from the sustainability, lean,
design, and supply chain engagement teams. The participants were selected based on
their responsibilities relevant to waste generation and for adopting best practices for
waste management.
219
220
221
222
223
224
225
226
227
228
229
230
231
232
233
234
235
10
S.No. Team Expectations/ Themes Participants
Experiencein BIM (Years)
Experience in AEC (Year)
Firm Type Background Role
1D
esig
n Design factors that
contribute to waste. BIM role in design
activities Critical BIM design related
features
6 8 12 Consultant Civil Eng. BIM Manager2 15 20 Consultant Structures Structural Designer3 12 15 Consultant Civil Eng. BIM Director4 7 10 Consultant Architecture Senior Designer5 12 15 Consultant Architecture Technical Manager6 10 15 Consultant Architecture BIM/CAD Technician7
Sust
aina
bilit
y Current waste management strategies
Waste monitoring, quantification, segregation tools & approaches
6 10 15 Contractor Accountant Waste Manager8 8 12 Consultant Architecture Senior Designer9 5 10 Consultant Civil Eng. BIM Manager10 3 12 Contractor Env. Eng. Waste & Recyc. Mgr.11 10 15 Consultant Civil Eng. Sustainability Director12 7 12 Consultant Civil Eng. Manager Lean Const.13
Lean
Lean thinking techniques and practices
Role of design and BIM in waste minimisation
6 - 5 Consultant Project Mgmt Project Mgr. BIM14 6 10 Contractor Civil Eng. BIM/CAD Technician15 7 7 Consultant Civil Eng. Site Manager16 8 12 Consultant Env. Eng. Waste & Recyc. Mgr.17 7 12 Contractor Civil Eng. Waste Manager18 12 15 Consultant Civil Eng. BIM Director19
Supp
ly C
hain
En
gage
men
t Suppliers factors that contribute to waste
Role of BIM for contractors and suppliers
6 5 2 Contractor Accounting Site Manager20 4 10 Contractor Business Supplier21 2 15 Contractor Civil Eng. Site Engineer22 6 10 Contractor Business Principal Contractor23 15 20 Contractor Architecture Senior Designer24 3 9 Contractor Env. Eng. Waste Manager
Table 1: The Details of Participants, their background and experience in FGIs
236
237
11
The discussions were focused on how teams have employed tools in mitigating
construction waste in different projects and how can BIM software products influence the
dilemma of construction waste. Open discussions were encouraged. Interactions were
recorded and later compared with notes taken to ensure necessary information was
captured. The details of FGIs are show in Table 1.
Transcripts were segmented for thematic analysis to compile a comprehensive list of
critical BIM factors. Coding scheme was structured in a way to identify various waste
management and technical related issues associated with plugin development and usage.
The critical factors that were identified from literature were also confirmed by FGIs.
Additionally two critical factors were identified besides those acknowledged by literature,
such as “Bi-directional Associativity” and “Intelligent Modelling”. For the sake of this
study, a thematic analysis—that is an exploratory qualitative data analysis approach—
was employed [28].
An exhaustive comparison of all transcript segments is carried out to examine structure
and relationships among themes. The process began with familiarization with data by
reading transcripts several times in search of meanings, reoccurring patterns and
repeating issues. Similarities and patterns among the codes were also identified for
categorising the data. Finally, thematic map was generated to provide an accurate
representation of the transcripts.
4 Critical Features of the BIM Software Products for Construction Waste
Minimisation
This section deliberates critical features of BIM that could be harnessed to implement
waste prediction and minimisation in building projects. The discussion often tends to
emphasize technical aspects of critical features, leading to detailed specifications for
plugins (software) development [29]. The discussions are started with transcript segments
taken from FGIs. Furthermore, the leading BIM software products (discussed earlier in
238
239
240
241
242
243
244
245
246
247
248
249
250
251
252
253
254
255
256
257
258
259
260
261
262
263
12
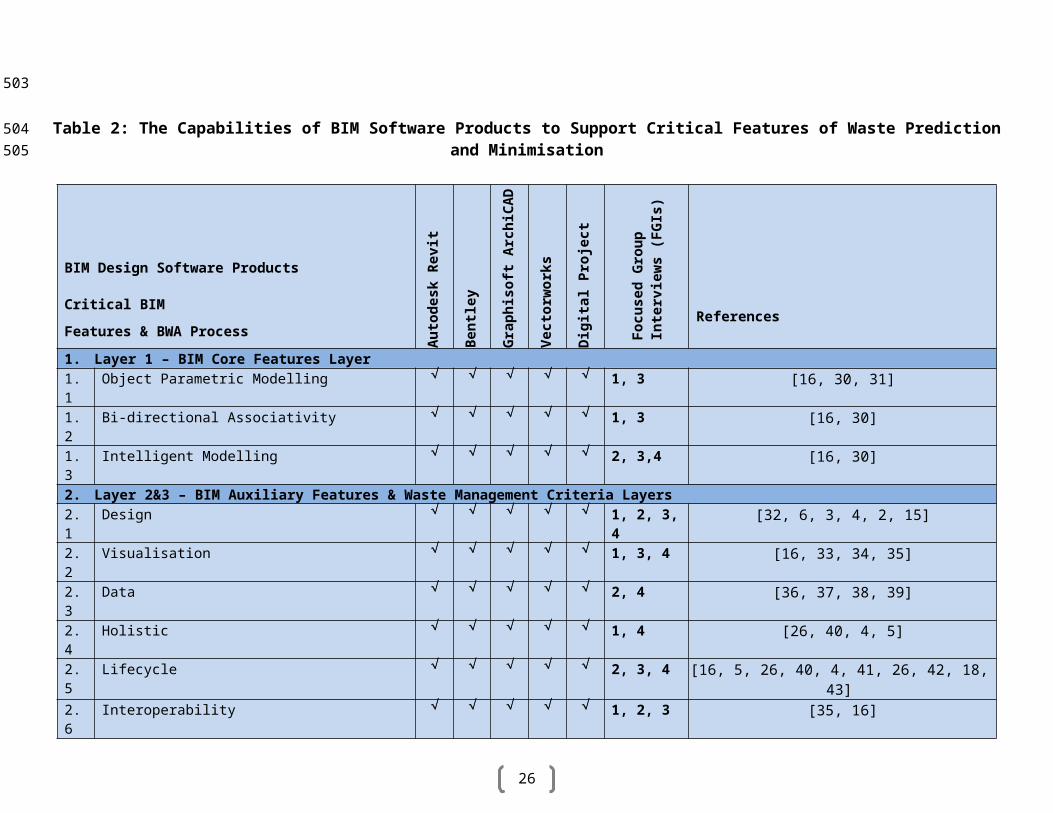
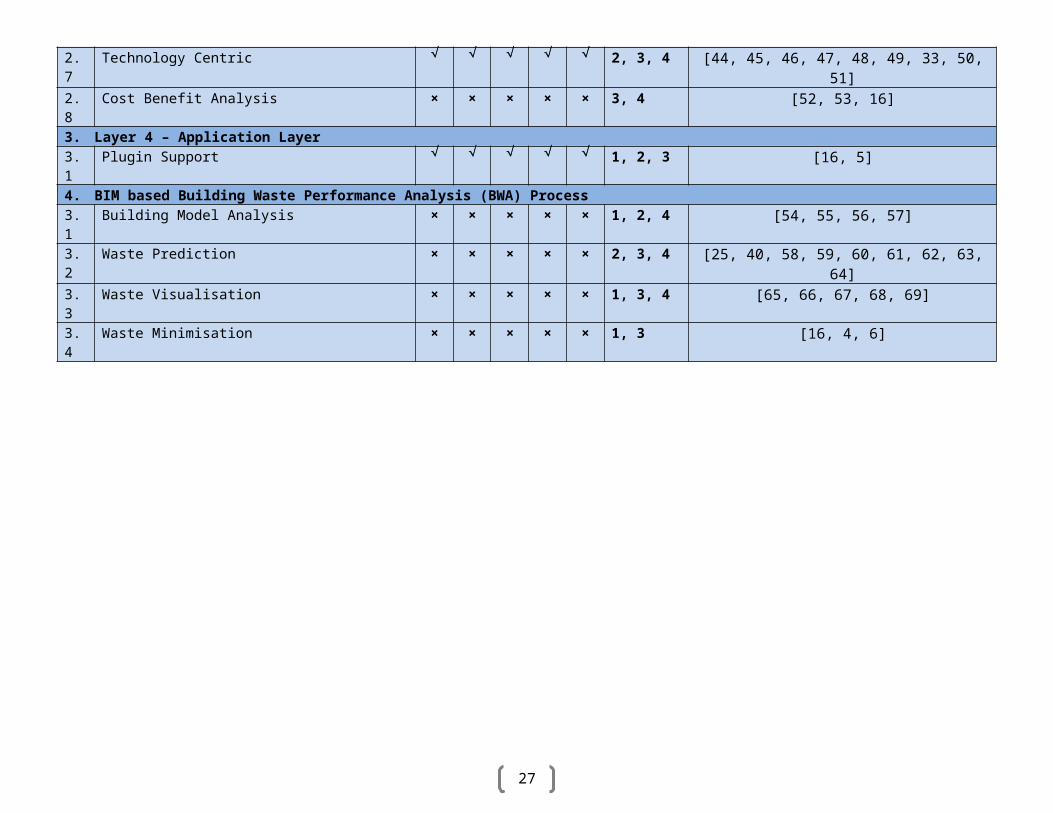
section 2) are evaluated to investigate the extent to which they support these critical
features. These findings are summarized in Table 2.
This evaluation will provide basis for selecting appropriate BIM software for future
plugin development. This study has identified 12 critical BIM features. To better explain
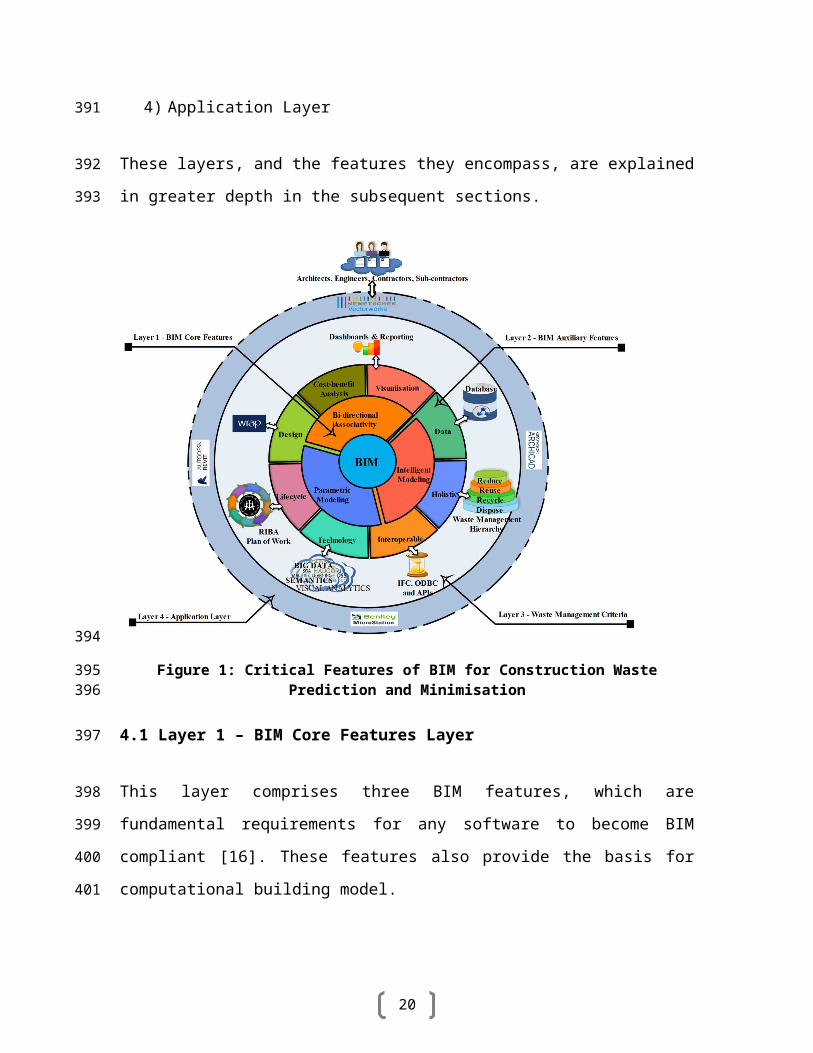
the concept, a layered approach is adopted as illustrated in Figure 1. The various layers,
where critical factors, were grouped are listed below:
1) BIM Core Features Layer
2) BIM Auxiliary Features Layer
3) Waste Management Criteria Layer
4) Application Layer
These layers, and the features they encompass, are explained in greater depth in the
subsequent sections.
Figure 1: Critical Features of BIM for Construction Waste Prediction and Minimisation
264
265
266
267
268
269
270
271
272
273
274
275
276
277
13
4.1 Layer 1 – BIM Core Features Layer
This layer comprises three BIM features, which are fundamental requirements for any
software to become BIM compliant [16]. These features also provide the basis for
computational building model.
4.1.1 Object Parametric Modelling
“The definition of waste changes with context e.g. waste from perspective of virgin
materials used into construction process is different from the rest. This context driven
information could be better modelled through object parametric modelling of BIM.”
Building model is comprised of software objects that reflect behaviours and attributes of
real-world materials, assemblies, and equipment. To imitate design intent, these objects
are assigned geometric and non-geometric data in building model. Parametric modelling
is specialized methodology to capture design intent in building model using parameters
and rules [16, 30]. This novel representation ensures that design intent is always
preserved in response to user or contextual change (Betting, 2001; Jonathan; 2001).
The domain knowledge related to design, procurement, and construction is indispensable
for the construction waste prediction and minimisation. The parametric modelling of BIM
may be augmented to entrench waste-specific domain knowledge in building objects
since it is considered as a suitable tool to embed domain knowledge in the building
objects [31]. Likewise, waste estimation involves calculating the waste at different levels
of aggregation (like wall, room, floor, and building). One of the characteristics of
parametric modelling is its built-in capability for aggregation of quantities [16] and can
therefore be tailored to implement the levels of aggregation in construction waste
estimation. Moreover, construction waste minimisation encourages excluding the
building objects that are likely to generate more waste thereupon the object feasibility
based constraint specifications of parametric modelling which guides when certain
changes violate the feasibility of given object [16], could be extended to implement
eliminating objects that generate beyond a threshold of construction waste.
278
279
280
281
282
283
284
285
286
287
288
289
290
291
292
293
294
295
296
297
298
299
300
301
302
303
304
14
Since object parametric modelling is a core feature, almost every BIM software product
supports this feature to varying extent. To attain this feature in plugin for construction
waste prediction and minimisation, APIs provided by these products would be utilized.
4.1.2 Bi-directional Associativity
“The bi-directional associativity would certainly go with the solution to propagate the
impact of any materials or design related change for instant feedback.”
The building components, views, and annotations are key elements of building model1.
Changing one of these elements may cause modifications to either of the building
elements. Some of examples of such changes include stretching wall or placing new
components in model. Accurately assessing and then applying the impact of these
changes in building model is conceived to be laborious and non-trivial task. As such, bi-
directional associativity complements object parametric modelling by calculating the
impact of design changes and then propagating these changes automatically to the
relevant parts of the building model accurately in real-time [16, 30]. Internally, the
network of building elements and their relationships is maintained which is used to
resolve changes later.
Different construction techniques, construction materials, and design alternatives affect
the amounts of construction waste in the building model. Existing solutions of
construction waste minimisation are unable to turn up this effect instantly at the design
stage to check the suitability of technique, material, and design alternative. A
sophisticated change management mechanism is needed that enables designers to foresee
the impact of these changes instantly and to choose suitable options that are likely to
generate less waste. In this context, the bi-directional associativity is relevant and can be
customized to incorporate sophisticated change management functionality.
The BIM software products offering object parametric modelling also support bi-
directional associativity, as these features complement each other. The APIs provided by
1 Building components include walls, roofs, doors, windows, and floors; Views include schedules and sheets; Annotations include text notes, dimensions, and spot elevations.
305
306
307
308
309
310
311
312
313
314
315
316
317
318
319
320
321
322
323
324
325
326
327
328
329
330
1
15
these products could be also be utilized to implement this feature into waste prediction
and minimisation plugin.
4.1.3 Intelligent Modelling
“Keeping in view the underlying complexity of waste minimisation, we need to exploit
BIM capabilities, particularly, the intelligent modelling, for embedding waste related
data into the building model.”
Although geometric data is essential for graphically representing building objects but
there is large number of supplementary data including dimensions, quantities, relative
locations, schedules, or specifications that is required for different analytical and
evaluation purposes. The ability to attach supplementary data once with building objects
and extract it repeatedly for different analytical and reporting purposes is called
intelligent modelling [16, 30].
Technically, geometries or properties are used to link data to building objects. As design
convention and best practice, small fraction of purely geometric data goes to geometries
while the rest of data is better modelled through object properties either as textual values
or as links to external sources. Linking objects to a wide array of external sources
enhances semantic capabilities of building objects, therefore making objects richer
containers of information. Examples include linking an object to own schedule or
attaching an object to its specifications.
The construction process deals with large number of construction materials. These
materials possess several auxiliary characteristics that are vital to accurately predict and
minimise construction waste. A key implementation milestone includes accurately storing
331
332
333
334
335
336
337
338
339
340
341
342
343
344
345
346
347
348
349
350
351
352
16
Table 2: The Capabilities of BIM Software Products to Support Critical Features of Waste Prediction and Minimisation
BIM Design Software Products
Critical BIM
Features & BWA Process
Aut
odes
k R
evit
Ben
tley
Mic
rost
atio
n
Gra
phis
oft A
rchi
CA
D
Vec
torw
orks
Dig
ital P
roje
ct
Focu
sed
Gro
up
Inte
rvie
ws (
FGIs
)
References
1. Layer 1 – BIM Core Features Layer1.1 Object Parametric Modelling 1, 3 [16, 30, 31]1.2 Bi-directional Associativity 1, 3 [16, 30]1.3 Intelligent Modelling 2, 3,4 [16, 30]2. Layer 2&3 – BIM Auxiliary Features & Waste Management Criteria Layers2.1 Design 1, 2, 3, 4 [32, 6, 3, 4, 2, 15]2.2 Visualisation 1, 3, 4 [16, 33, 34, 35]2.3 Data 2, 4 [36, 37, 38, 39]2.4 Holistic 1, 4 [26, 40, 4, 5]2.5 Lifecycle 2, 3, 4 [16, 5, 26, 40, 4, 41, 26, 42, 18, 43]2.6 Interoperability 1, 2, 3 [35, 16]2.7 Technology Centric 2, 3, 4 [44, 45, 46, 47, 48, 49, 33, 50, 51]2.8 Cost Benefit Analysis × × × × × 3, 4 [52, 53, 16]3. Layer 4 – Application Layer3.1 Plugin Support 1, 2, 3 [16, 5]4. BIM based Building Waste Performance Analysis (BWA) Process3.1 Building Model Analysis × × × × × 1, 2, 4 [54, 55, 56, 57]3.2 Waste Prediction × × × × × 2, 3, 4 [25, 40, 58, 59, 60, 61, 62, 63, 64]3.3 Waste Visualisation × × × × × 1, 3, 4 [65, 66, 67, 68, 69]3.4 Waste Minimisation × × × × × 1, 3 [16, 4, 6]
353
354
17
this high volume of multifarious data with building objects in materials database and then
efficiently querying it during the process. The role of intelligent modelling comes in play
that could be democratized to implement proportion of materials database using objects
properties. This will achieve the significant fraction of implementation. Just as in the case
of parametric modelling, this feature could be achieved, for the development of
construction waste prediction and minimisation plugin, by importing the relevant APIs
provided by BIM software products.
4.2 Layer 2&3 – BIM Auxiliary Features and Waste Management Criteria Layers
This section discusses two layers. Layer 2 contains auxiliary BIM features, which could
be extended to augment core features of BIM software products. As such, these auxiliary
features on layer 2 could be exploited to support waste management at design stages
using corresponding waste management criteria on layer 3. These proposed criteria define
extensions that shall be considered for effective waste prediction and minimisation.
4.2.1 Design
“Most of the construction and demolition (C&D) waste is due to design changes, lack of
dimensional coordination, and standardization of materials.”
The process of waste minimisation requires trying out different design alternatives and
choosing the ones with lesser waste output. Design changes proposed in response at later
stage of the project tends to cause rework and ultimately leads to material and time
wastage [32]. Hence, any attempt to minimize waste in the later construction stages
becomes costlier, ineffective, and impractical [6]. This is the key reason behind the
failure of existing efforts to tackle construction waste because they are mostly based on
the remedial measures after waste is generated and are designed to work in later stage of
the construction project [3]. As such, design stage, in contrast to construction stage, has
greater potential to accommodate design changes and embraces experimenting different
design alternatives for waste efficiency [4].
355
356
357
358
359
360
361
362
363
364
365
366
367
368
369
370
371
372
373
374
375
376
377
378
379
380
18
To truly achieve construction waste minimisation, the tools and techniques should aim to
prevent construction waste [3, 4] because it is the most anticipated waste management
approach [2]. Since waste minimisation at design stage is likely to promote the idea of
waste prevention, it is highly desirable [5]. Furthermore, it is also realised that design
decisions correlates the amounts of construction waste generated [4]. Moreover, to be
more precise, inappropriate design decisions inculcate almost 33% of construction waste
[70]. In short, design stage is ideal to implement waste prediction and minimisation
functionality. It also sets the stage for zero waste particularly for ‘design-induced’ waste
management, which would be a major breakthrough (if achieved) for the construction
industry. However, keeping in view complexities underlying construction process,
achieving waste minimisation at design stage is non-trivial and has myriads inherent
intricacies that need to be explored for effective construction waste minimisation [15].
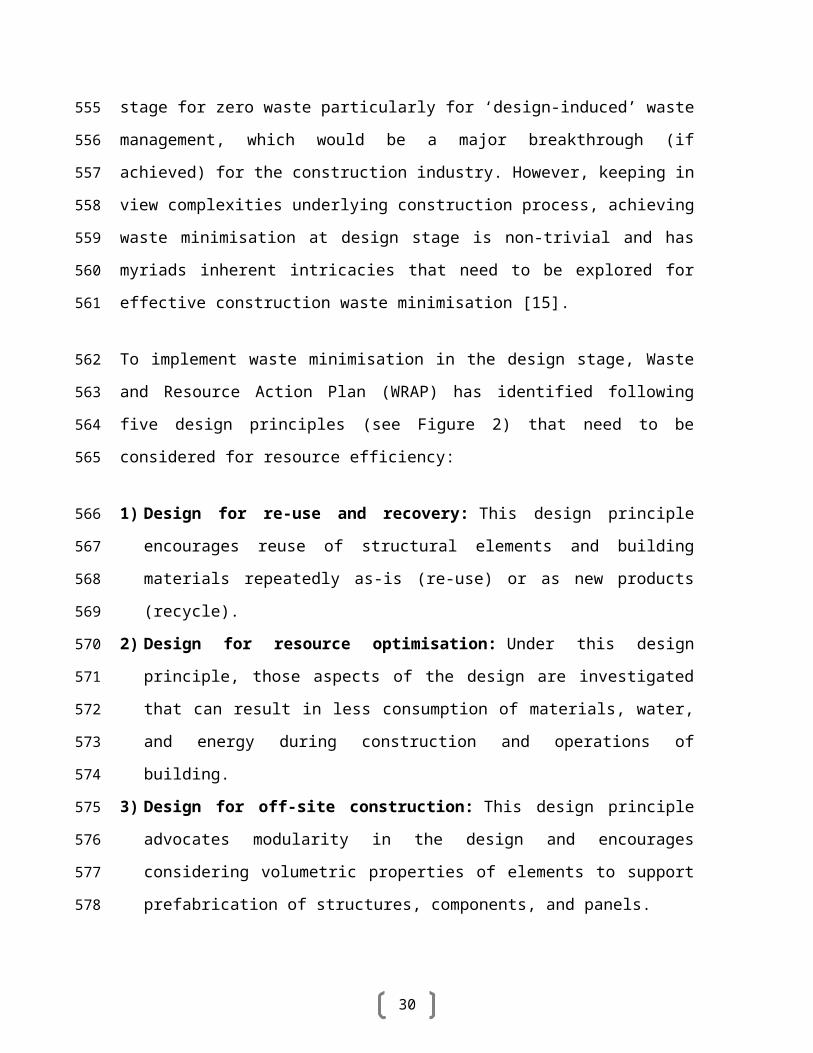
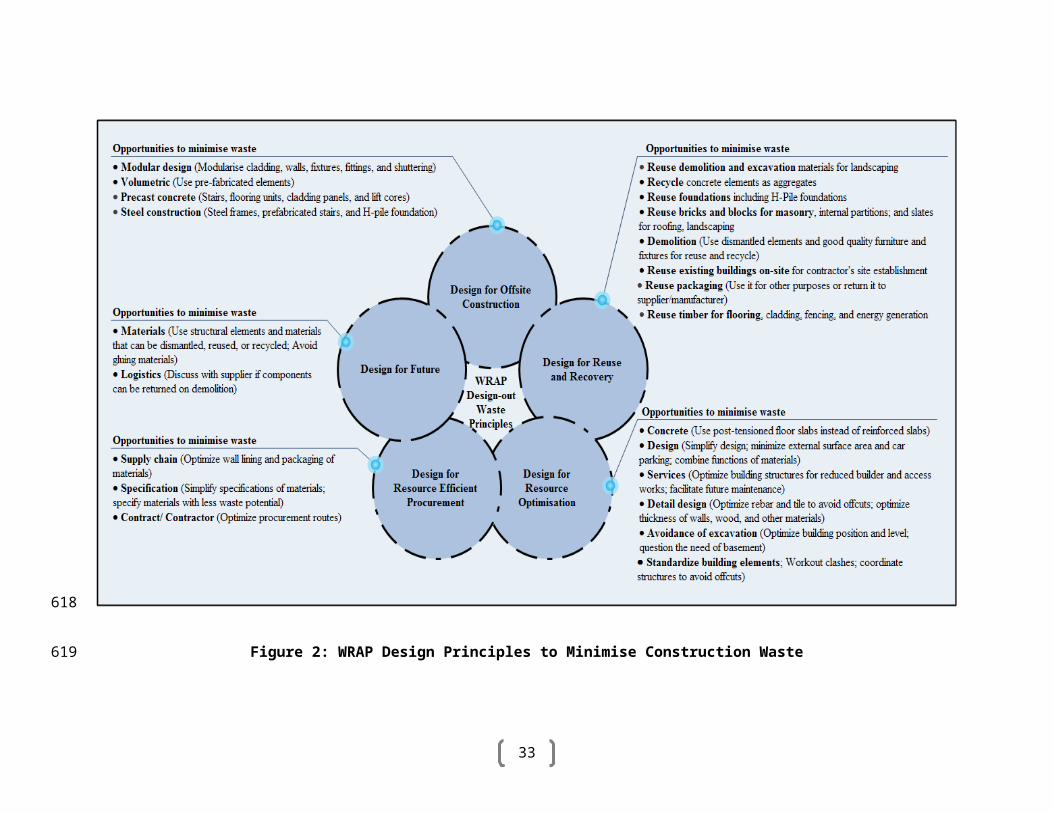
To implement waste minimisation in the design stage, Waste and Resource Action Plan
(WRAP) has identified following five design principles (see Figure 2) that need to be
considered for resource efficiency:
1) Design for re-use and recovery: This design principle encourages reuse of structural
elements and building materials repeatedly as-is (re-use) or as new products (recycle).
2) Design for resource optimisation: Under this design principle, those aspects of the
design are investigated that can result in less consumption of materials, water, and
energy during construction and operations of building.
3) Design for off-site construction: This design principle advocates modularity in the
design and encourages considering volumetric properties of elements to support
prefabrication of structures, components, and panels.
4) Design for resource efficient procurement: This design principle ensures resource
efficient procurement methods are chosen, specification of materials is simplified, the
materials are selected that are likely to generate less waste, and procurement routes
are properly optimized.
5) Design for the future: This design principle considers specifying building materials
and structural elements that are flexible, de-constructible and durable. They require
381
382
383
384
385
386
387
388
389
390
391
392
393
394
395
396
397
398
399
400
401
402
403
404
405
406
407
408
409
19
less maintenance efforts and can be easily dismantled, reused, and recycled during
demolition.
The current BIM software products mostly support design related activities [43, 71],
hence could be improved to support activities relating to construction waste prediction
and minimisation.
4.2.2 Visualisation
“To ensure effective collaboration, waste should be visualised such that all the
participant can not only see and understand it but can also react to the situation by
changing design strategies and materials selection.”
Visualisation combines interactive visual techniques for data analysis with human
background knowledge, intuition, and creativity to discover latent trends in support of
effective decision-making [72, 34]. In the context of construction, essential aspects of the
building model are visualized, better understood for potential issues, and right decisions
are taken to resolve them prior to any fieldwork [16, 35].
Although visualisation is relevant throughout lifecycle of building, it is of immense
importance to waste prediction and minimisation. It could be helpful in the following
ways. 1) It provides true enabling environment to experiment design changes for waste
efficiency; 2) the materials could be better labelled with associated waste potential which
enables designers to intuitively choose appropriate materials with lesser waste output
without undergoing complex optimizations for materials selection; 3) using visual
inspections, designers can also identify building elements that are likely to yield more
waste hence can be discarded or replaced with alternative waste efficient elements; 4)
lastly, it sets the stage
410
411
412
413
414
415
416
417
418
419
420
421
422
423
424
425
426
427
428
429
430
431
432
20
Figure 2: WRAP Design Principles to Minimise Construction Waste
433
434
21
for design optimisation where multiple designs are merged together and best waste
efficient design strategies and building elements are combined to produce superior design
that tends to generate minimum construction waste. The BIM software products offer
visualisation to varying extent, mostly in the form of photo-renderings, animations,
walkthroughs, and shaded 3D views of building design. These capabilities could be
further harnessed to accurately visualize construction waste such that designers do not
only see waste as ‘object’ attached to building elements but could also respond to it by
changing design strategies, materials, and construction methods.
4.2.3 Data
“Although, waste minimisation is a complex issue; however, if what causes waste is
known, then, they could be factored into waste management tools; to achieve this, the tool
shall certainly consider multifarious data sources”
The equation of construction waste estimation cannot be confined to just aggregating
volumetric data of building model, but certainly it should consider exhaustive list of
multi-dimensional criteria to accurately estimate construction waste. However, it is
unlikely that a single BIM database contains all relevant data required to predict and
minimise construction waste [37]. As such, access to number of diverse data sources
pertaining to design, procurement, and construction is essential. In addition to this,
supporting domain knowledge is integral to understanding context of data and to enable
semantic reasoning for analysing and estimating construction waste precisely [36].
Therefore, the issue of construction waste prediction and minimisation is conceived as
data driven and knowledge intensive in nature.
The capabilities of existing BIM software products could be uncovered by utilising their
underlying database of building information [38]. Majority of the design related data is
readily available and can be queried for different analytical and evaluation purposes.
However, special extensions are required in this regard. Particularly, not a single BIM
software product offers comprehensive materials database containing all the properties
435
436
437
438
439
440
441
442
443
444
445
446
447
448
449
450
451
452
453
454
455
456
457
458
459
460
461
22
required for the process. Furthermore, hardly would any BIM software product store the
design, construction, and procurement related domain knowledge [39]. Since detailed
data and appropriate domain knowledge is at the crux of this process, this therefore calls
for the extension of the databases of existing BIM software products to capture additional
data and relevant knowledge pertaining to design, procurement, and construction.
4.2.4 Holistic and Lifecycle
“While discussing the definition of waste, it is highlighted that definition changes with
context e.g. waste from the perspective of virgin materials used into construction process
is different from the rest. It arises throughout the lifecycle of building in different forms.”
Construction waste is influenced by large number of factors spanning throughout the
lifecycle of construction project [5]. Existing waste estimation models are unitary in the
sense that they often consider volumetric information to estimate construction waste [26,
40, 4]. More holistic criteria has to be considered, including:
1) Waste management hierarchy–a generic waste management framework that offers set
of logical strategies to deal with construction waste [2]. This initially proposes adopting
preventive measures to reduce construction waste and then recommends appropriate
measures to reuse, recycle, and eventually as last resort landfill construction waste [41].
2) WRAP design principles–as discussed earlier in Figure 2, also offers a number of
opportunities to minimise waste at design stage. To simplify this, a comprehensive
computational model of waste estimation is needed that considers all factors leading to
construction waste.
Furthermore, different construction phases are interrelated and activities carried-out in
one phase influence activities of other phases [26]. Since Royal Institute of British
Architects (RIBA) Plan of Work proposes generic lifecycle for construction projects
irrespective of project size, practices, and procurement routes [42], juxtaposition of waste
management hierarchy with RIBA Plan of Work stages even brings interesting
462
463
464
465
466
467
468
469
470
471
472
473
474
475
476
477
478
479
480
481
482
483
484
485
486
487
23
opportunities for construction waste minimisation. Additionally, roles of different
participants of construction projects cannot be ignored. Their early involvement in design
stage and providing them with appropriate tools to evaluate and give feedback on relevant
aspects of the design could help to tackle this issue effectively.
Since BIM software products encourage integration of roles of all stakeholders in
building project and support activities undertaken across the lifecycle of construction
project [18, 43], they support holistic and lifecycle driven approach to plugins
development for waste prediction and minimisation.
4.2.5 Interoperability
“The solution shall work with normal design tools currently prevailing in the industry but
we are expecting more collaboration with supply chain.”
As discussed above, construction projects involve multiple teams, which often use
heterogeneous applications to carry-out different tasks. Exchanging data seamlessly
among these applications is at the heart for successful project delivery [35].
Interoperability is the ability of software application to exchange data with heterogeneous
software applications to streamline and/or automate workflows [16]. Since higher level of
coordination and collaboration is conceived essential for successful project delivery,
interoperability of the underlying software has pivotal role to achieve the greater
coordination and collaboration.
In the context of construction waste prediction and minimisation, interoperability allows
reading required data from different data sources (including design, procurement, and
construction) for analysing and evaluating construction waste. After waste is quantified
successfully, the waste related details are then exported back to the data sources where
designers could visualize waste in their native tools for analytics and understand trends of
how waste is arising in building design and how it could be better approached for
minimisation.
488
489
490
491
492
493
494
495
496
497
498
499
500
501
502
503
504
505
506
507
508
509
510
511
512
513
24
BIM software products provide the three ways to achieve interoperability. Firstly, ODBC,
as a standard API for accessing the DBMS of a software package. Secondly, set of
programs in the form of API, that is used to develop plugin for BIM software products.
Lastly, open data exchange standards, which are vendor-neutral data exchange formats
and have industry-wide acceptance like IFC and gbXML. Table 3 summarizes
interoperability of existing BIM software products.
4.2.6 Technology
“Only with the help of innovative and latest technologies, this complex issue of
construction waste could be surpassed.”
Technological advancement in ICT has affected all aspects of society and almost every
industry. The following emerging technologies are of vital importance here since they are
known to solve similar kind of problems prevailing construction waste prediction and
minimisation.
Big data refers to data that is not conveniently processed by traditional database and data
warehousing technology [73]. It often relates to the emerging frameworks for storing,
processing, and analyzing such (voluminous, varied, and high-velocity) data, comprising
diverse sources and representations, scalably and reliably using a cluster of commodity
servers [45, 44]. One of the reasons for widespread adoption of big data is its capabilities
for enabling analytics that includes exploratory and descriptive analytics. This helps to
model and understand latent trends as well as predictive analytics, which are aimed at
forecasting future events [46, 47].
Specifically the field of ‘visual analytics’ that came into being originally to solve hardest
problems faced by government, business, and science but later realized to have broader
applicability to solve generic IT related problems. It is hybrid approach that combines
best of automated reasoning and visualisation [48, 49]. It brings intelligent automated
algorithms and gigantic computational capabilities of contemporary computers together
with human background knowledge and intuition to find good candidate solution with
514
515
516
517
518
519
520
521
522
523
524
525
526
527
528
529
530
531
532
533
534
535
536
537
538
539
540
25
higher level of trust [51, 68, 50]. Visual analytics based systems empower analytical
reasoning of analysts by maximising their abilities to perceive, understand, and reason
about highly complex and dynamic data and situations [33, 74, 34, 75].
The requirement of a robust material database that has the potential to answer complex
queries referring to the properties of materials, along with a comprehensive support for
interactive visualisation is vital for enabling designers to proactively analyse and respond
to construction waste in the early design stage. This calls for incorporating number of big
data components to be employed during the development of this plug-in. We discuss the
technological solution for waste management sketched here in brief in much more detail
in section 5.
4.2.7 Cost/benefits Analysis
“It is always cheaper to reduce waste but currently we have no means to prove it.”
Cost/benefits analysis is dominating factor, influencing adoption of software in industry
[52, 53]. This factor could play an important role by changing the beliefs of stakeholders
regarding waste prediction and minimisation in the following ways.
It is argued that there are situations when generating waste is conceived cheaper than
avoiding waste e.g. standard-sized materials versus custom-sized materials. The custom-
sized materials produce less construction waste but incur overhead cost of manufacturing
whereas standard-sized materials are cheap but generate construction waste by off-cuts.
Since cost of materials outweighs benefits of waste minimisation, companies prefer
cheaper option of standard-sized materials and generate waste. Therefore, there exists
pertinent relationship between commercial and sustainability. The belief that waste
minimisation is costlier is mythical and this mind-set could be changed by putting efforts
to bring together commercial, design, and procurement factors into BIM software for
waste prediction and minimisation and it could be shown that waste minimisation is
indeed always cheaper option in all the cases.
541
542
543
544
545
546
547
548
549
550
551
552
553
554
555
556
557
558
559
560
561
562
563
564
565
566
26
Since BIM supports cost-estimation functionality at early design stage [16, 76], this tool
will leverage on it to estimate the cost/benefits of every design related change made by
the designers.
4.3 Application Layer
“This whole functionality would be available as single software plug-in, integrated and
run through native design BIM software products.”
This layer represents BIM based plug-in for construction waste prediction and
minimisation. Programs supported by plug-in will be written using Software
Development Kits (SDK) of BIM software products. The purpose of plug-in development
is to extend functionality of existing BIM software products for construction waste
prediction and minimisation. This plug-in can be seamlessly integrated with the menu
system of underlying BIM software products using standard access points and methods
supported by these platforms. Users will interact with plug-in in their native designing
tools.
567
568
569
570
571
572
573
574
575
576
577
578
579
580
581
582
27
Table 3: The Capabilities of BIM Software Products to Support Interoperability
BIM Products
ProjectData
Autodesk Revit
MicroStation ArchiCAD Vectorworks Digital
Project
File Extension *.rvt *.dng *.pln *.vmx *.CATProductApplication Programming Interface (API)
Revit Open .NE
T API
MDL API Geometric Description Language
(GDL)
API + Vectorscript
scripting language
VB based .NET API
Open Standards Architectural
ModelIFC, RVT,
DWG, DGN, PLN, NWD
IFC, DNG, DWG
IFC, DWG, DGN
IFC IFC, DWG
Structural Model
IFC, CIS/2
IFC, CIS/2
IFC IFC IFC, CIS/2
CAD Data DXF, DWG
DWG, DXF
DWG, DXF DWG, DXF DWG, DXF
GIS Data SHP, KMZ, WFS, GML
SHP, KMZ, WFS, GML
SHP, KMZ, WFS
SHP, KMZ, WFS
-
Civil Engineering
LandXML, DWG, DGN
LandXML, DWG
LandXML,DWG
DWG DWG
Cost Estimating
XLSX, ODBC
ODBC ODBC ODBC ODBC
Visualisation Model
FBX, SKP, NWD
SKP, Rhino
MOV, SKP, WMF
SKP -
COBie Data IFC, XLSX
IFC IFC IFC -
Scheduling Data
P3, MPP P3, MPP P3, MPP MPP P3
Energy Analysis
IFC, gbXML
IFC, gbXML
IFC, gbXML
IFC, gbXML IFC, gbXML
Site Imagery JPG, PNG PNG PNG, JPG, BMP, TIFF
BMP, JPG, PNG
GIF, PNG, TIFF
583
28
5 BIM-enabled Building Waste Performance Analysis (BWA)
The term Building waste performance analysis (BWA) is coined here to capture the
whole process of employing the BIM for predicting and designing out construction waste.
The BWA is mainly comprised of four key steps namely, (i) building model analysis, (ii)
waste prediction, (iii) waste visualization, and (iv) waste minimisation. Transcripts of the
FGIs are used to develop the phases of the BWA, which are given at the beginning of
these phases. The BWA process is illustrated in the Figure 3 as shown below.
Figure 3: BIM based Building Waste Performance Analysis (BWA) Process
5.1 Building Model Analysis
“The process shall be design centric and shall begin with decomposing the building
model to its smallest granularity of building elements”
Building Model
Analysis
Waste Prediction
Waste Visualisation
Waste Minimisation
584
585
586
587
588
589
590
591
592
593
594
595
596
29
The BWA process will begin with building model analysis, which involves reading a
variety of data about building design, procurement, and construction. During this phase,
the elementary building elements/components (such as Walls, Doors, Windows, Roofs,
etc.) will be identified along with the details about materials being specified and
construction strategies being employed for building these elements (like standard
masonry wall with stretcher bond type). This data is fundamental for accurately
predicting the waste potential of building design at the fine-grained level. Accordingly,
large number of data sources may be queried during this phase to extract the relevant
data. These data sources may be intrinsically heterogeneous in terms of underling format,
schema, and contents [55, 56]. Common examples of format-related heterogeneities
include data stored in flat files, relational, web pages, XML, and JavaScript Object
Notation (JSON). This requires highly generic wrappers to sort out these heterogeneities
while importing the relevant data [77, 56, 54]. The queried data will be further
transformed using global terms by applying series of transformation functions and rules,
including selections, projections, joining, transposing, pivoting, aggregations, translating
codes, and encoding values [56]. Finally, the transformed data will be stored persistently
into staging tables to support the computations for predicting and designing out
construction waste [57, 56].
5.2 Waste Prediction
“And then estimating the amounts of construction waste for every building element by
applying modern heuristics based techniques to generate more accurate waste forecast.”
Waste prediction provides basis for understanding causes, types and quantities of
construction waste arising from the building models [25]. During this phase, building
elements will be evaluated for the amounts of construction waste they tend to generate.
Accordingly, robust waste prediction models will be employed. Existing waste prediction
models estimate the construction waste based on Materials Waste Rates (MWR) [60, 61,
62, 78, 79, 40] and waste generation indexes [58, 24, 59]. The techniques underlying
these models are mainly based on the percentage of waste to material procured and the
Gross Floor Area (GFA) of the building respectively. However, there are more factors
597
598
599
600
601
602
603
604
605
606
607
608
609
610
611
612
613
614
615
616
617
618
619
620
621
622
623
624
625
30
contributing to construction waste generation asides material quantity and GFA [25, 60].
A robust waste prediction model will be developed which will consider every building
elements and construction strategies for their contribution of construction waste.
Consequently, a comprehensive waste forecast will be generated after examining every
aspect of the building model. Prediction system will be developed, mainly comprised of
two integral components such as reasoning system and accurate database querying system
[63, 64]. In this phase, the reasoning system will be specifically used to carry out the
computational workload underpinning predicting and designing out construction waste.
State of the art techniques and algorithms will be utilised to develop reasoning systems
particularly big data analytics as discussed in Siegel (2013). More details about the
relevance of big data analytics for this development is discussed later in Section 5.
5.3 Waste Visualisation
“And then waste is displayed pictorially as 3D objects so that designers could understand
the trend of how waste is arising from the given building design.”
During this phase of the BWA, different elements of the waste forecast, generated during
the previous step, will be mapped onto the visual components. Visual representation of
construction waste will enable effective communication and stimulate the designers’
engagement for employing waste efficient strategies. As such, interactive visual
representation technologies will be used to enable the designers to investigate larger
datasets at once for holistic decision-making [65, 66]. The aim of employing visualisation
in this context is to carry out exploratory data mining in which experience of the
designers will be integrated with the effective visualisation techniques for predicting and
designing out construction waste [67, 68]. This phase will not only sort out the challenges
of mapping and presenting highly dimensional data in an analysis-friendly visualisations
but the wider issues of data uncertainties, incompleteness or misleading trends shall also
be considered and tackled to minimize the degree of error in the overall process of the
BWA [69].
626
627
628
629
630
631
632
633
634
635
636
637
638
639
640
641
642
643
644
645
646
647
648
649
650
651
652
31
5.4 Waste Minimisation
“Analysing the waste forecast using interactive visualisation tools and technologies can
really assist designers to try out design changes and material selection to reduce
construction waste.”
Since the human brain is the best tool for identifying the latent trends in the information,
this phase of the BWA will engage the designers to react to the waste arising from the
building design using technology-driven visual data exploration techniques. This idea of
visually representing construction waste will harness the designers’ abilities of better
understanding the building design from large number of dimensions. They will be
provided with vibrant environment to change construction materials as well as the design
strategies and check their influence on the generation of construction waste. The system
will provide real time waste forecast based on the changes incurred in the design and the
latest trends of construction waste will be disseminated instantly to either accept or reject
the design changes. Moreover, this whole process of the BWA will be embedded into
their native BIM software product as plugin to give them a realistic opportunity of
predicting and designing out construction waste. As a result, the designers will come up
with building designs, having better design strategies, material selection, and
procurement routes. And, these modifications will be carried out in the building design
unless an optimised and waste efficient building design is eventually produced.
6 The Promise of Big Data/ICT for Construction Waste Minimisation
Although, BIM sets an ideal stage for the development of powerful and innovative
applications for AEC industry by providing additional layer of data, but the plugin for
construction waste minimisation is highly data driven and requires access to large
volumes of additional datasets pertaining to design, procurement, and construction. The
collection, storage, processing, analysis, and interactions with such datasets impose
special challenges that are beyond the capabilities of traditional hardware and software
technologies including BIM.
653
654
655
656
657
658
659
660
661
662
663
664
665
666
667
668
669
670
671
672
673
674
675
676
677
678
679
32
Big data analytics is recently getting more momentum in analysing massive datasets to
discover latent trends and insights for effective decision making, the analytical tools such
as machine learning, statistics, time-series analysis, business intelligence, data
warehousing, and data mining, along with specialized techniques for processing big data,
could be profitably employed here for the development of plugin for construction waste
prediction and minimisation. This area is largely an unchartered territory and the use of
big data techniques in waste minimisation hold significant promise in creating more
efficient waste management subsystems through the development and processing of data-
driven insights.
In this section, we propose big data/ data analytics as a potential technological solution to
the problem of managing the large datasets that are relevant for waste minimisation. Big
data technologies are worth a special consideration here due to their relevance, since they
can handle storage and processing of massive datasets by virtue of their 3V (Volume,
Velocity, Variety) capabilities (Siegel, 2013). This dedicated section discusses the open
research challenges that call for the application of big data technologies into the
development of plugin for construction waste prediction and minimisation.
6.1 The issue of handling massive material database
The issue of waste management is to deal with large number of materials arising from the
construction process [80]. Since every material has an associated waste output, accessing
specific material details for waste efficient materials selection and optimization is highly
desirable [3]. This calls for comprehensive material database containing material
properties and allied domain knowledge. Owing to complexity and volume of large
number of materials data, material database itself constitutes a huge data repository.
Storage of the terabytes of material database would not only be insurmountable rather
real-time processing, analysis and interaction with this data would be challenging.
Literature has revealed the use of relational databases for storing building related data,
but the limits are reached soon within the first few months of data storage and processing
[17]. Similarly, time series databases are also explored in lieu of relational model to
achieve high performance [81], but due to the specialized access pattern required to query
680
681
682
683
684
685
686
687
688
689
690
691
692
693
694
695
696
697
698
699
700
701
702
703
704
705
706
707
708
33
material database has made these approaches ineffective. Some commercial solutions are
also available for real-time energy data collection, storage, and analysis [82]. Recently,
Internet of Things database is proposed which is designed specifically to store and
process voluminous data pertaining to building automation and energy analysis [83].
6.2 The issue of graph based representation, analysis and visualisation
In this context, the datasets often come from different independent parties and
applications, hence, resulting in a large number of schematic and semantic
heterogeneities [54]. Reconciling heterogeneities for integration into a common and
unified format is another open research challenge. Literature witnessed large body of
research carried out on schema and ontology matching [84, 85]. With the advent of
semantic web, ontologies are used for graph based data representations because capturing
datasets as graphs (containing nodes and links) enables the application of graph theory
based simulations and visualisation techniques. Ontology is formal description of
concepts and relationships in a domain of interest [86]. Web Ontology Language (OWL)
is popular language used for creating ontologies in Semantic Web, which has dominated
rest of the ontology languages (SHOE [87], OIL [88], DAML+OIL [89]) due to its
expressivity and better reasoning abilities [90]. Data in ontology is stored as Resource
Description Framework (RDF) triples, comprising of subject, predicate, and object [91].
NoSQL (for “not only SQL”) systems are getting prominent as emerging RDF triple
stores [92], to persistently store and query RDF data in modern enterprise applications,
complementing their relational counterpart [93, 94, 95]. Despite the fact that NoSQL
systems are storing unstructured data in a highly efficient and flexible key-value format
[96], the RDF triple store requires specialized features to store and process graph data,
thereby a graph based data model is proposed [97] for efficiently traversing RDF data in
NoSQL systems. Some of the examples of NoSQL databases include Oracle NoSQL
[98], Apache Cassandra [99], Voldemort [100], and MongoDB [101].
Exploring these datasets to derive meaningful insights is another open research issue.
Information visualisation techniques for small sized hierarchical datasets are studied in
Cawthon and Vande (2007). A specialized technique of visualisation of large
709
710
711
712
713
714
715
716
717
718
719
720
721
722
723
724
725
726
727
728
729
730
731
732
733
734
735
736
737
34
environmental datasets is proposed in Shneiderman (2008) and Wu, et al., (2009).
Recently, a framework for visualisation of complex domains has been proposed in Bai, et
al., (2009) that can handle complex spatio-temporal multi-dimensional data.
7 Conclusions
This paper discusses the potential of BIM and big data technologies for construction
waste prediction and minimisation. We have identified and discussed 17 critical features
of BIM that could be harnessed to implement the plugin for construction waste prediction
and minimisation. These critical BIM features are categorized into five layers: BIM core
layer, BIM auxiliary layer, waste management criteria, waste processing cycle, and
application layer. We have evaluated existing BIM software products for the support of
these critical features. Although BIM is the de-facto standard in the AEC industry, it
unfortunately has limited support for waste prediction and minimisation. This lack of
functionality reveals a serious technological gap. To bridge this gap, efforts have been
undertaken but they are not effective since these are not based on BIM, hence it can be
concluded that BIM based implementation is a promising way forward to effectively and
efficiently tackle issue of construction waste. We have also identified big data
technologies as a real game changer that can potentially lead to the development of high
performance and technology smart plugin for construction waste prediction and
minimisation. The paper provides the basis for detailed technical specifications that
would be useful during the implementation of waste prediction and minimisation plugin.
Bibliography
[1] M. Osmani, J. Glass and A. Price, “Architect and contractor attitudes to waste minimisation,” in Proceedings of the Institution of. Civil Engineers : Waste and Resource Managament, London. UK, 2006.
[2] O. O. Faniran and G. Caban, “Minimizing waste on construction project sites,” Engineering, Construction and Architectural Management, vol. 5, no. 2, pp. 182-
738
739
740
741
742
743
744
745
746
747
748
749
750
751
752
753
754
755
756
757
758
759
35
188, 1998.
[3] J. Wang, Z. Li and V. W. Tam, “Critical factors in effective construction waste minimization at the design stage: A Shenzhen case study, China,” Resources, Conservation and Recycling, no. 82, pp. 1-7, 2014.
[4] L. L. Ekanayake and G. Ofori, “Building waste assesment score: design-based tool,” Building and Environment, no. 39, pp. 851-861, 2004.
[5] Z. Liu, M. Osmani and P. Demian, “The potential use of BIM to aid construction waste minimisation,” Sophia Antipolis, France, 2011.
[6] L. L. Oyedele, M. Regan, M. Von, J. Ahmad, A. Ebohon and A. Elnokaly, “Reducing waste to landfill in the UK: identifying impediments and critical solutions,” World Journal of Science, Technology, and Sustainable Development, vol. 10, no. 2, pp. 131-142, 2013.
[7] A. Salman, K. Malik and M. Tayyab, “Building information modeling (BIM): now and beyond,” The Australasian Journal of Construction Economics and Building, vol. 12, p. 15, 2012.
[8] L. Shen and C. Dkh, “Application of Building Information Modeling (BIM) and Information Technology (IT) for Project Collaboration,” EPPM, pp. 20-29, 2011.
[9] R. Takim, M. Harris and A. Hadi, “Building Information Modeling (BIM): A New Paradigm for Quality of Life Within Architectural, Engineering and Construction (AEC) Industry,” Procedia - Social and Behavioral Sciences, vol. 101, pp. 23-32, 2013.
[10] T. Cerovsek, “A review and outlook for a 'Building Information Model' (BIM): A multi-standpoint framework for technological development,” Advanced Engineering Informatics, vol. 25, pp. 224-244, 2011.
[11] A. Porwal and K. N. Hewage, “Building Information Modeling–Based Analysis to Minimize Waste Rate of Structural Reinforcement,” Journal of Construction Engineering and Management, vol. 138, no. 8, pp. 943-954, 2012.
[12] J. Tah, W. Zhou, F. Abanda and F. Cheung, “Towards a holistic modelling framework for embodied carbon and waste in the building lifecycle,” Tizani, 2010.
[13] CabinetOffice, “BIM Strategy,” 2011. [Online]. Available: https://connect.innovateuk.org/web/modernbuiltktn/articles/-/blogs/new-construction-strategy?ns_33_redirect=%252Fweb%252Fmodernbuiltktn
36
%252Farticles. [Accessed 24 03 2014].
[14] J. Cheng and L. Ma, “A BIM-based system for demolition and renovation waste estimation and planning,” Waste Management, vol. 33, no. 6, pp. 1539 - 1551, 2013.
[15] A. Keys and A. Baldwin, “Designing to encourage waste minimisation in the construction industry,” Department of Civil & Building Engineering, Loughborough University, Licestershire UK, 2010.
[16] C. Eastman, P. Teicholz, R. Sacks and K. Liston, BIM Handbook: A Guide to Building Information Modeling for Owners, Managers, Designers, Engineers and Contractors, 2 ed., New York: John Wiley & Sons, Inc., 2011.
[17] R. Attar, E. Hailemariam, M. Glueck, A. Tessier, J. McCrae and A. Khan, “BIM-based Building Performance Monitor,” SimAUD, p. 32, 2010.
[18] A. Motamedi and A. Hammad, “Lifecycle management of facilities components using radio frequency identification and building information model,” Next Generation Construction IT: Technology Foresight, Future Studies, Roadmapping, and Scenario Planning, vol. 14, pp. 238-262, 2009.
[19] Revit, “Revit,” Autodesk, 2014. [Online]. Available: http://www.autodesk.co.uk/products/revit-family/overview. [Accessed 2014].
[20] Bentley, “MicroStation,” Bentley Systems, 2014. [Online]. Available: http://www.bentley.com/en-GB/products/microstation/. [Accessed 15 07 2014].
[21] Graphisoft, “ArchiCAD,” Nemetschek, 2014. [Online]. Available: http://www.graphisoft.com/archicad/. [Accessed 10 07 2014].
[22] Nemetschek, “Vectorworks,” Nemetschek, 2014. [Online]. Available: http://www.nemetschek.com/en/home/the_company/brand_portfolio/vectorworks.html. [Accessed 11 07 2014].
[23] Gehry, “Digital Project,” Gehry Technologies, 2014. [Online]. Available: http://www.gehrytechnologies.com/en/products/. [Accessed 13 07 2014].
[24] B. Kourmpanis, A. Papadopoulos, K. Moustakas, M. Stylianou, K. Haralambous and M. Loizidou, “Preliminary study for the management of construction and demolition waste,” Waste Management & Research, vol. 26, no. 3, pp. 267--275, 2008.
37
[25] Z. Wu, A. T. Yu, L. Shen and G. Liu, “Quantifying construction and demolition waste: An analytical review,” Waste Management, vol. 34, no. 9, pp. 1683-1692, 2014.
[26] W. Lu and H. Yuan, “Investigating waste reduction potential in the upstream,” Renewable and Sustainable, pp. 804-811, 2013.
[27] M. Zamorano, C. Brebbia, A. Kungolos, V. Popov and H. Itoh, Waste management and the environment, 4 ed., Granada, Spain: WIT Press, 2008.
[28] J. W. Creswell, Qualitative inquiry and research design: Choosing among five approaches, 3rd ed., USA: Sage publications, 2012.
[29] V. Singh, N. Gu and X. Wang, “Technical features of BIM servers for collaboration on building and construction projects,” in ICSU 2010: Proceedings of the First International Conference on Sustainable Urbanization, Hong Kong, 2010.
[30] Z. Xu-dong and T. Jie, “BIM Based on Intelligent Parametric Modeling Technology,” Journal of Chongqing University (Natural Science Edition), vol. 6, p. 27, 2006.
[31] G. Lee, R. Sacks and C. M. Eastman, “Specifying parametric building object behavior (BOB) for a building information modeling system,” Automation in construction, vol. 15, no. 6, pp. 758-776, 2006.
[32] P. E. D. Love and L. Heng, “Quantifying the causes and costs of rework in construction,” Construction Management and Economics, vol. 4, no. 18, pp. 479-490, 2000.
[33] D. A. Keim, F. Mansmann and J. Thomas, “Visual analytics: how much visualization and how much analytics?,” ACM SIGKDD Explorations Newsletter, vol. 11, no. 2, pp. 5-8, 2010.
[34] C. Panse, M. Sips, D. A. Keim and S. C. North, “Visualization of geo-spatial point sets via global shape transformation and local pixel placement,” IEEE Transactions on Visualization and Computer Graphics, vol. 12, no. 5, pp. 749--756, 2006.
[35] A. Grilo and R. Jardim-Goncalves, “Value proposition on interoperability of BIM and collaborative working environments,” Automation in Construction, pp. 522-530, 2010.
38
[36] T. E. El-Diraby, “Domain Ontology for Construction Knowledge,” Journal of Construction Engineering and Management, vol. 139, no. 7, pp. 768--784, 2012.
[37] Q. HE, L. QIAN, Y. DUAN and Y. LI, “Current Situation and Barriers of BIM Implementation,” Journal of Engineering Management, pp. 12--16, 2012.
[38] M. Ibrahim and R. Krawczyk, “The level of knowledge of CAD objects within the building information model,” in Association for Computer-Aided Design in Architecture, New York, 2003.
[39] J. Shaohua, Z. Haiyan and Z. Jian, “Research on BIM-based Construction Domain Text Information Management,” Journal of Network, vol. 8, no. 6, pp. 1455-1464, 2013.
[40] B. Bossink and H. Brouwers, “Construction waste: quantification and source evaluation,” Journal of construction engineering and management, vol. 122, no. 1, pp. 55-60, 1996.
[41] H. Wiley, “Waste Management Hierarchy,” In Dictionary of Environmental Science and Technology. , 2000. [Online]. Available: http://search.credoreference.com.ezproxy.uwe.ac.uk/content/entry/wileyenvsci/waste_management_hierarchy/0. [Accessed 06 September 2014].
[42] RIBA, “RIBA Plan of Work 2013,” RIBA, 2013. [Online]. Available: http://www.architecture.com/RIBA/Professionalsupport/RIBAOutlinePlanofWork2013.aspx. [Accessed 21 07 2014].
[43] S. Azhar, “Building information modeling (BIM): Trends, benefits, risks, and challenges for the AEC industry,” Leadership and Management in Engineering, vol. 11, no. 3, pp. 241-252, 2011.
[44] S. Ghemawat, H. Gobioff and S. Leung, “The Google file system,” ACM SIGOPS Operating Systems Review, vol. 37, pp. 29-43, 2003.
[45] J. Manyika, M. Chui, B. Brown, J. Bughin, R. Dobbs, C. Roxburgh and A. H. Byers, Big data: The next frontier for innovation, competition, and productivity, 2 ed., Washington DC, USA: McKinsey Global Institute, 2011.
[46] E. Siegel, Predictive Analytics: The Power to Predict who Will Click, Buy, Lie, Or Die., 1st ed., USA: John Wiley & Sons, 2013.
[47] K.-H. Lee, Y.-J. Lee, H. Choi, Y. D. Chung and B. Moon, “Parallel data processing with MapReduce: a survey,” ACM SIGMOD Record, vol. 40, pp. 11-
39
20, 2012.
[48] J. Thomas and K. A. Cook, “A visual analytics agenda,” Computer Graphics and Applications, vol. 26, no. 1, pp. 10-13, 2006.
[49] K. V. Nesbitt and S. Barrass, “Finding trading patterns in stock market data,” Computer Graphics and Applications, IEEE, vol. 24, no. 5, pp. 45--55, 2004.
[50] A. Lee, A. Girgensohn and J. Zhang, “Browsers to support awareness and social interaction,” Computer Graphics and Applications, IEEE, vol. 24, no. 5, pp. 66--75, 2004.
[51] J. Thomas and P. C. Wong, “Visual analytics,” IEEE Computer Graphics and Applications, vol. 24, no. 5, pp. 20-21, 2004.
[52] M. M. Mantei and T. J. Teorey, “Cost/benefit analysis for incorporating human factors in the software lifecycle,” Communications of the ACM, vol. 31, no. 4, pp. 428-439, 1998.
[53] S. J. Wang, B. Middleton, L. A. Prosser, C. G. Bardon, C. D. Spurr, P. J. Carchidi, A. F. Kittler, R. C. Goldszer, D. G. Fairchild and A. J. Sussman, “A cost-benefit analysis of electronic medical records in primary care,” The American journal of medicine, vol. 114, no. 5, pp. 397--403, 2003.
[54] A. Halevy, “Why your data won't mix,” Queue - Semi-structured Data, vol. 3, no. 8, pp. 50--58, Oct 2005.
[55] A. Y. Halevy, N. Ashish, D. Bitton, M. Carey, D. Draper, J. Pollock, A. Rosenthal and V. Sikka, “Enterprise Information Integration: Successes, Challenges and Controversies,” in ACM SIGMOD International Conference on Management of Data, Baltimore, Maryland, 2005.
[56] H. Garcia-Molina, Y. Papakonstantinou, D. Quass, A. Rajaraman, Y. Sagiv, J. Ullman, V. Vassalos and J. Widom, “The TSIMMIS approach to mediation: Data models and languages,” Journal of intelligent information systems, vol. 8, no. 2, pp. 117--132, 1997.
[57] S. Chaudhuri and U. and Dayal, “An overview of data warehousing and OLAP technology,” ACM Sigmod record, vol. 26, no. 1, pp. 65-74, 1997.
40
[58] D. Fatta, A. Papadopoulos, E. Avramikos, E. Sgourou, K. Moustakas, F. Kourmoussis, A. Mentzis and M. Loizidou, “Generation and management of construction and demolition waste in Greece—an existing challenge,” Resources, Conservation and Recycling, pp. 81-91, 2003.
[59] J. Solís-Guzmán, M. Marrero, M. Montes-Delgado and R.-d.-A. A., “A Spanish model for quantification and management of construction waste,” Waste Management, vol. 29, no. 9, pp. 2542 - 2548, 2009.
[60] I. Martínez Lage, F. Martínez Abella, C. Vázquez Herrero and J. Luis Pérez Ordóñez, “Estimation of the annual production and composition of C&D debris in Galicia (Spain),” Waste management, vol. 30, no. 4, pp. 636--645, 2010.
[61] J. Y. Wang, A. Touran, C. Christoforou and H. Fadlalla, “A systems analysis tool for construction and demolition wastes management,” Waste management, vol. 24, no. 10, pp. 989--997, 2004.
[62] K. Cochran and T. G. Townsend, “Estimating construction and demolition debris generation using a materials flow analysis approach,” Waste Management, vol. 30, no. 11, pp. 2247--2254, 2010.
[63] M. Shepperd and G. Kadoda, “Comparing software prediction techniques using simulation,” IEEE Transactions on Software Engineering, vol. 27, no. 11, pp. 1014-1022, 2001.
[64] C. Mair, G. Kadoda, M. Lefley, K. Phalp, C. Schofield, M. Shepperd and S. Webster, “An investigation of machine learning based prediction systems,” Journal of systems and software, vol. 53, no. 1, pp. 23-29, 2000.
[65] S. K. Card, J. D. Mackinlay and B. Shneiderman, Readings in information visualization: using vision to think, San Francisco, CA, USA: Morgan Kaufmann, 1999.
[66] C. Chen, Information visualization: Beyond the horizon, New York: Springer Science & Business, 2006.
[67] D. A. Keim, “Visual Exploration of Large Data Sets,” Commun. ACM, vol. 44, no. 8, pp. 38--44, 2001.
[68] D. A. Keim, F. Mansmann, J. Schneidewind, J. Thomas and H. Ziegler, “Visual analytics: Scope and challenges,” vol. 4404, Berlin Heidelberg, Springer, 2008, pp. 76-90.
41
[69] R. Kosara, C. G. Healey, V. Interrante, D. H. Laidlaw and C. Ware, “Visualization viewpoints,” IEEE Computer Graphics and Applications, vol. 23, no. 4, pp. 20-25, 2003.
[70] S. Innes, “Developing tools for designing out waste pre-site and on-site.,” in In Proceedings of Minimising Construction Waste Conference: Developing Resource Efficiency and Waste Minimisation in Design and Construction., London, 2004.
[71] G. Aranda-Mena, J. Crawford, A. Chevez and T. Froese, “Building information modelling demystified: does it make business sense to adopt BIM?,” International Journal of Managing Projects in Business, vol. 2, no. 3, pp. 419-434, 2009.
[72] D. A. Keim, F. Mansmann and J. Thomas, “Visual analytics: how much visualization and how much analytics?,” ACM SIGKDD Explorations Newsletter, vol. 11, no. 2, pp. 5-8, 2010.
[73] J. Dean and S. Ghemawat, “MapReduce: simplified data processing on large clusters,” vol. 51, no. 1, pp. 107-113, 2008.
[74] E. Hetzler and A. Turner, “Analysis Experiences Using Information Visualization,” IEEE Comput. Graph. Appl., vol. 24, no. 5, pp. 22--26, Sep 2004.
[75] S. T. Teoh, K. Ma, S. F. Wu and T. Jankun-Kelly, “Detecting flaws and intruders with visual data analysis,” Computer Graphics and Applications, IEEE, vol. 24, no. 5, pp. 27--35, 2004.
[76] K. Franco, R. Jonathan, T. Joseph, D. David and K. Esra, “Early stage multi-level cost estimation for schematic BIM models,” Automation in Construction, vol. 27, no. 0, pp. 67 - 77, 2012.
[77] A. Halevy, A. Rajaraman and J. Ordille, “Data integration: the teenage years,” in Proceedings of the 32nd International Conference on Very Large Data Bases, Seoul, Korea, 2006.
[78] J. Shi and Y. Xu, “Estimation and forecasting of concrete debris amount in China,” Resources, Conservation and Recycling, vol. 49, no. 2, pp. 147--158.
[79] A. Bruvoll and K. Ibenholt, “Future waste generation forecasts on the basis of a macroeconomic model,” Resources, Conservation and Recycling, vol. 19, no. 2, pp. 137--149, 1997.
[80] K. Panos and D. I. Danai, “Survey Regarding Control and Reduction of Construction Waste,” 2012.
42
[81] M. Last, Y. Klein and A. Kandel, “Knowledge discovery in time series databases,” IEEE Transactions on Systems, Man, and Cybernetics, vol. 31, no. 1, pp. 160-169, 2001.
[82] A. Yezioro and E. Shaviv, “Shading: a design tool for analyzing mutual shading between buildings,” Solar energy, vol. 52, no. 1, pp. 27-37, 1994.
[83] D. Folio, “SkySpark,” SkyFoundry, 2014. [Online]. Available: http://www.skyfoundry.com/skyspark/. [Accessed 09 Nov 2014].
[84] F. Hakimpour and A. Geppert, “Resolving semantic heterogeneity in schema integration,” in Proceedings of the international conference on Formal Ontology in Information Systems, New York, USA, 2001.
[85] C. Batini, M. Lenzerini and S. B. Navathe, “A comparative analysis of methodologies for database schema integration,” ACM computing surveys (CSUR), vol. 18, no. 4, pp. 323-364, 1986.
[86] T. R. Gruber, “Toward principles for the design of ontologies used for knowledge sharing,” International journal of human-computer studies, vol. 43, no. 5, pp. 907-928, 1993.
[87] J. Heflin, J. Hendler and S. Luke, “SHOE: A knowledge representation language for internet applications,” 1999.
[88] D. Fensel, F. Van Harmelen, I. Horrocks, D. L. McGuinness and P. F. Patel-Schneider, “OIL: An ontology infrastructure for the semantic web,” IEEE Intelligent Systems, vol. 16, no. 2, pp. 38-45, 2001.
[89] D. L. McGuinness, R. Fikes, J. Hendler and L. A. Stein, “DAML+ OIL: an ontology language for the Semantic Web,” IEEE Intelligent Systems, vol. 17, no. 5, pp. 72-80, 2002.
[90] I. Horrocks, P. F. Patel-Schneider and F. Van Harmelen, “From SHIQ and RDF to OWL: The making of a web ontology language,” Web semantics: science, services and agents on the World Wide Web, vol. 1, no. 1, pp. 7-26, 2003.
[91] R. W. Group, “RDF - Resource Description Framework,” 2004. [Online]. Available: http://www.w3.org/RDF/. [Accessed 15 May 2014].
[92] C. David, C. Olivier and B. Guillaume, “A survey of RDF storage approaches,” ARIMA Journal, vol. 15, pp. 11-35, 2012.

43
[93] P. Cudre-Mauroux, I. Enchev, S. Fundatureanu, P. Groth, A. Haque, A. Harth, F. L. Keppmann, D. Miranker, J. F. Sequeda and M. Wylot, “NoSQL databases for RDF: An empirical evaluation,” The Semantic Web - ISWC 2013, pp. 310-325, 2013.
[94] M. Stonebraker, “SQL databases v. NoSQL databases,” Communications of the ACM, vol. 53, no. 4, pp. 10-11, 2010.
[95] J. Pokorny, “NoSQL databases: a step to database scalability in web environment,” International Journal of Web Information Systems, vol. 9, no. 1, pp. 69-82, 2013.
[96] N. Leavitt, “Will NoSQL databases live up to their promise?,” Computer, vol. 43, no. IEEE, pp. 12-14, 2010.
[97] M. Buerli and C. P. S. L. Obispo, “The Current State of Graph Databases,” vol. 32, no. 3, pp. 67-83, 2012.
[98] Oracle, “Oracle NoSQL Database,” 2010. [Online]. Available: http://www.oracle.com/uk/products/database/nosql/overview/index.html. [Accessed 15 May 2014].
[99] Yahoo, “Apache Cassandra,” 2011. [Online]. Available: http://cassandra.apache.org/. [Accessed 17 May 2014].
[100] Voldemort, “Project Voldemort - A distributed database,” 2009. [Online]. Available: http://www.project-voldemort.com/voldemort/. [Accessed 17 May 2014].
[101] M. Inc., “MongoDB - Agile and Scalable Document Base,” 2010. [Online]. Available: http://www.mongodb.org/. [Accessed 15 May 2014].
[102] N. Cawthon and A. Vande M., “The Effect of Aesthetic on the Usability of Data Visualization,” in Proceedings of InfoViz (IV '07). IEEE Computer Society, Washington, DC, USA, 2007.
[103] B. Shneiderman, “Extreme visualization: squeezing a billion records into a million pixels,” in SIGMOD Proceedings, New York, USA, 2008.
[104] J. Wu, Y. Zhou, K. Aberer and K. Tan, “Towards integrated and efficient scientific sensor data processing: A database approach,” in EDBT Proceedings, New York, USA, 2009.
[105] X. Bai, D. White and D. Sundaram, “Visual intelligence density: definition,
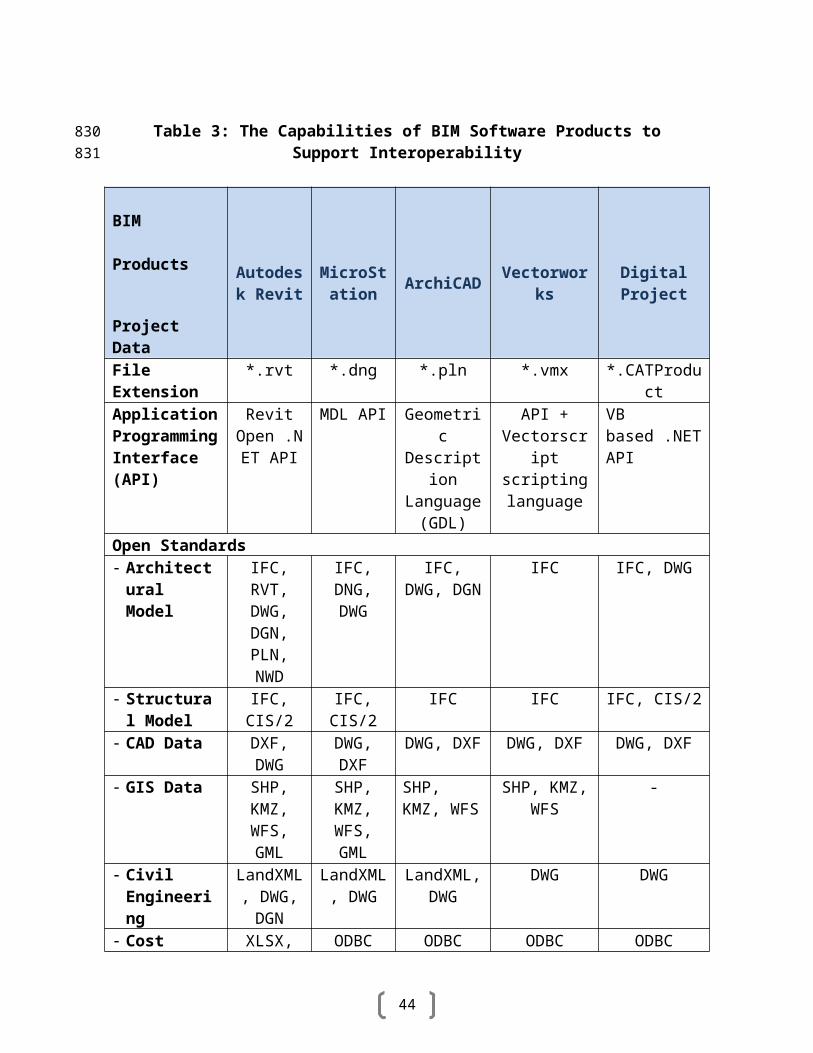
44
measurement, and implementation.,” in CHINZ '09., New York, 2009.
760
761