Embed Size (px)
Citation preview

Introduction
Philippine poultry market has a volume of P1.25 billion heads 40%+ is with San Miguel Foods Inc, with P30 billion revenue in
2012 SMFI Target – additional 357 new houses
2013: 500M heads
2014: 600M heads Of all poultry players, SMFI is the only exporting company. Distribution channels : 50% wet market,
50% malls, groceries and supermarkets.
Philippine Market Overview

Trends in Poultry
• Contract Growing with an Integrator for small scale businesses
• Subcontracting for a clients like KFC, Mang Inasal, Supermarkets, Jolibee for large scale
• New facilities are now “Controlled Climate System (CCS)”

Controlled Climate System (CCS)
“Tunnel Ventilation with evaporative cooling ”
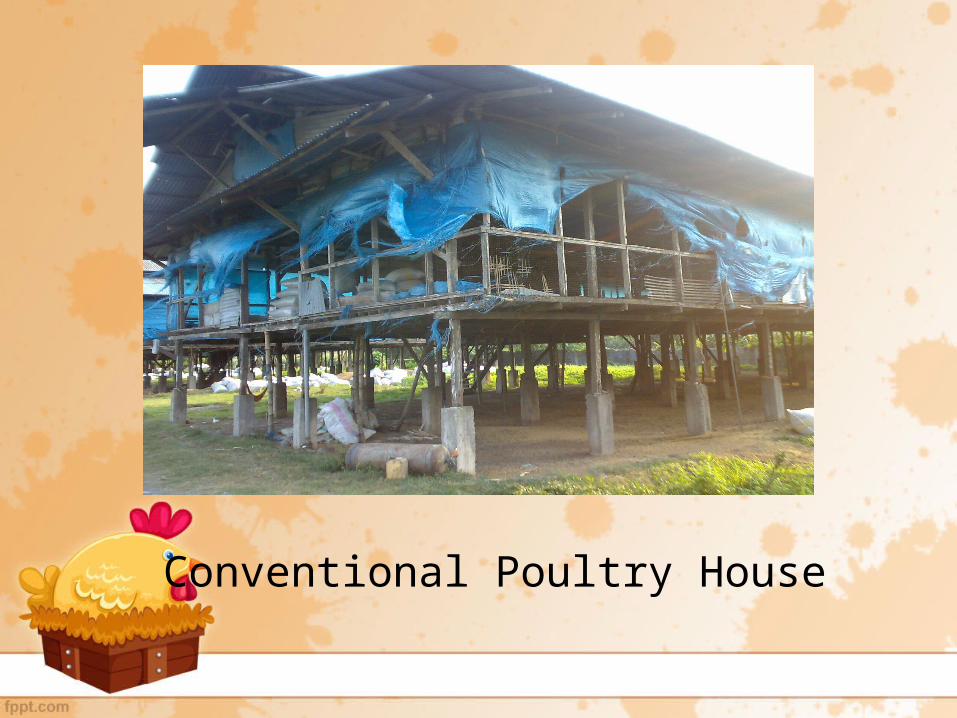
Conventional Poultry House

Conventional Poultry Equip

CCS System

Dominant players are SMFI, Bounty Fresh, with small players like Robina, Vitarich, Nutriva, Sustamina, Foster and many independent producers. A new big player from Thailand just entered named CP, who is the 4th largest poultry producer globally.
Brands currently strong in the market at Magnolia, Purefoods, Bounty Fresh, Monterey
The entrance of CP will change the landscape for commercial production, might lead to the death of smaller local players
The local market and export market is growing
Market Competitive Analysis

Corporate Mission/Vision
Mission:
To be the top producer of broiler chicken
Vision:
To be the choice chicken supplier in the local market

SWOT Analysis
Strengths• Has experienced poultry manager and flockmen per house • Supplier of equipment is very supportive and attentive to our needs• Has data to support and analyze trends in the cycle of growth• Facilities is new and operate in accordance to standard best
practices
Weaknesses• Poultry is physically far from base of operations• Need to recruit new flockmen due to size of farm/flock

SWOT Analysis
Opportunities:• Duplicate new farm sites to capture the volume needed by SMFI (at
least 350+ houses for 2014)• Become a commercial farm or a subcontracting farm in the future
Threats:• Avian Flu• CP

Organizational Structure

Organizational Roles
• Farm Manager – overseer of whole farm operation
• Electrician – manages all electrical equipments of farm
• Checker – receives, disburses and keeps record of all deliveries to farm
• Assistant Manager – assists farm manager

Organizational Roles
• Guard– acts like assistant farm managers at night
• Flockman – veteran flockman
• FlockmanA – new flockman
• FlockmanB– flockman with experience

Checklist for Multi-site Preparedness
• Acquisition of land that can fit an 8 building facility, preferrably near the same town and vicinity of existing sites
• Acquire and train poultry staff• Create an operations manual• Review performance of equipments currently used• Review service performance of suppliers• Check for new suppliers/trends in the industry• Forge partnership with banks

Profit & Loss Statement
Cycle 1 2 3 4 5 6 7 Whole YearIncome 4,888,800.00 4,888,800.00 4,888,800.00 4,888,800.00 4,888,800.00 4,888,800.00 4,888,800.00 34,221,600.00 Expenses Labor 280,000.00 280,000.00 280,000.00 280,000.00 280,000.00 280,000.00 280,000.00 1,960,000.00Managerial 280,000.00 280,000.00 280,000.00 280,000.00 280,000.00 280,000.00 280,000.00 1,960,000.00Medicine 280,000.00 280,000.00 280,000.00 280,000.00 280,000.00 280,000.00 280,000.00 1,960,000.00Food Expense 140,000.00 140,000.00 140,000.00 140,000.00 140,000.00 140,000.00 140,000.00 980,000.00Electricity 700,000.00 700,000.00 700,000.00 700,000.00 700,000.00 700,000.00 700,000.00 4,900,000.00Maintenance 140,000.00 140,000.00 140,000.00 140,000.00 140,000.00 140,000.00 140,000.00 980,000.00Magnificent Trio 2,192,857.14 2,192,857.14 2,192,857.14 2,192,857.14 2,192,857.14 2,192,857.14 2,192,857.14 15,350,000.00Total Expenses 4,012,857.14 4,012,857.14 4,012,857.14 4,012,857.14 4,012,857.14 4,012,857.14 4,012,857.14 28,090,000.00 0.00Net Income 875,942.86 875,942.86 875,942.86 875,942.86 875,942.86 875,942.86 875,942.86 6,131,600.00Net Cash 3,068,800.00 3,068,800.00 3,068,800.00 3,068,800.00 3,068,800.00 3,068,800.00 3,068,800.00 21,481,600.00

Business Objectives: 2014-2016
Year Number of Facilities Net Income Growth
2013 0 0 0
2014 1 P 21M 100%
2015 2 P42M 100%
2016 3 P63M 50%

Growth Drivers
• Development and availability of Manpower
• Availability of Agricultural Land to acquire and operate
• Development of Potential Customers
• Expansion into Commercial production
• Exporting

Human Resource Development Strategy
Pre-operations Trainings Operations Manual Tricks of the Trade Continuous Seminars for Managers In site classroom trainings for flockmen Sharing of best practices among flockmen