Embed Size (px)
Citation preview
Organisation for Economic Co-operation and Development
EDU/WKP(2019)17
Unclassified English text only
25 November 2019
DIRECTORATE FOR EDUCATION AND SKILLS
Introduction of multistage adaptive testing design in PISA 2018
OECD Education Working Paper No. 209
Kentaro Yamamoto, Hyo Jeong Shin and Lale Khorramdel
(Educational Testing Service)
This working paper has been authorised by Andreas Schleicher, Director of the Directorate
for Education and Skills, OECD.
Kentaro Yamamoto ([email protected]), Hyo Jeong Shin ([email protected]) and
Lale Khorramdel ([email protected])
JT03455236
OFDE
This document, as well as any data and map included herein, are without prejudice to the status of or sovereignty over any territory,
to the delimitation of international frontiers and boundaries and to the name of any territory, city or area.

2 EDU/WKP(2019)17
INTRODUCTION OF MULTISTAGE ADAPTIVE TESTING DESIGN IN PISA 2018 Unclassified
OECD EDUCATION WORKING PAPERS SERIES
OECD Working Papers should not be reported as representing the official views of the
OECD or of its member countries. The opinions expressed and arguments employed herein
are those of the author(s).
Working Papers describe preliminary results or research in progress by the author(s) and
are published to stimulate discussion on a broad range of issues on which the OECD works.
Comments on Working Papers are welcome, and may be sent to the Directorate for
Education and Skills, OECD, 2 rue André-Pascal, 75775 Paris Cedex 16, France.
This document, as well as any data and map included herein, are without prejudice to the
status of or sovereignty over any territory, to the delimitation of international frontiers and
boundaries and to the name of any territory, city or area.
You can copy, download or print OECD content for your own use, and you can include
excerpts from OECD publications, databases and multimedia products in your own
documents, presentations, blogs, websites and teaching materials, provided that suitable
acknowledgement of OECD as source and copyright owner is given. All requests for public
or commercial use and translation rights should be submitted to [email protected].
Comment on the series is welcome, and should be sent to [email protected].
This working paper has been authorised by Andreas Schleicher, Director of the Directorate
for Education and Skills, OECD.
-------------------------------------------------------------------------
www.oecd.org/edu/workingpapers
--------------------------------------------------------------------------
© OECD 2019
EDU/WKP(2019)17 3
INTRODUCTION OF MULTISTAGE ADAPTIVE TESTING DESIGN IN PISA 2018 Unclassified
Abstract
This paper describes and evaluates a multistage adaptive testing (MSAT) design that was
implemented for the Programme for International Student Assessment (PISA) 2018 main
survey for the major domain of Reading. Through a simulation study, recovery of item-
response theory model parameters and measurement precision were examined. The
PISA 2018 MSAT design resulted in a parameter recovery as good as the operational
benchmark, and measurement precision was improved by 4 to 5% with gains up to 10% at
the extreme performance levels.
Key words: multistage adaptive testing, assessment designs, item parameter estimation,
Programme for International Student Assessment (PISA), large-scale assessments
Résumé
Le présent document décrit et évalue un algorithme de test adaptatif à plusieurs étapes
(TAPE) qui a été mis en œuvre dans le cadre de l'enquête principale du Programme
International pour le Suivi des Acquis des élèves (PISA) 2018, dans le domaine majeur
(compréhension de l’écrit). L’absence de biais dans l’estimations des paramètres du modèle
théorique de réponse à l’item et la précision de la mesure ont été examinées dans le cadre
d'une étude de simulation. La conception du TAPE pour PISA 2018 a permis d'obtenir une
récupération des paramètres aussi bonne que le repère opérationnel, et la précision de la
mesure a été améliorée de 4 à 5 % avec des gains pouvant atteindre 10 % aux niveaux de
performance extrêmes.
Mots clés : tests adaptatifs en plusieurs étapes, algorithmes de test, estimation des
paramètres des items, Programme international pour le suivi des acquis des élèves (PISA),
évaluations à grande échelle.
4 EDU/WKP(2019)17
INTRODUCTION OF MULTISTAGE ADAPTIVE TESTING DESIGN IN PISA 2018 Unclassified
Table of Contents
Abstract .................................................................................................................................................. 3
Résumé ................................................................................................................................................... 3
1. Introduction ....................................................................................................................................... 5
2. Multistage adaptive testing design ................................................................................................... 6
3. Simulation study .............................................................................................................................. 14
4. Summary and conclusion ................................................................................................................ 21
5. References ........................................................................................................................................ 22
Annex A. ............................................................................................................................................... 24
Tables
Table 1. PISA 2018 main survey MSAT design of reading testlets at Core ........................................... 7 Table 2. PISA 2018 main survey MSAT design of reading testlets at Stage .......................................... 8 Table 3. PISA 2018 main survey MSAT design of reading testlets at Stage 2 ....................................... 8 Table 4. Summary of differences between generating values and estimates by design ........................ 18
Table A.1. Overview of the Adaptive Process for the Standard Design (Design A) that Connects
Core> Stage 1> Stage 2 ................................................................................................................. 24 Table A.2. Overview of the Adaptive Process for the Alternative Design (Design B) that Connects
Core>Stage 2>Stage 1 (128 Paths in Total, Applicable to 25% of Students) ............................... 27
Figures
Figure 1. Routing paths in the standard MSAT design (Design A) that connect
Core> Stage 1> Stage 2 ................................................................................................................. 10 Figure 2. Routing paths in the alternative MSAT design (Design B) that connect
Core> Stage 2> Stage 1 ................................................................................................................. 11 Figure 3. Test characteristic curves for each routing path in the MSAT design of PISA 2018 field
trial for the Reading domain (16 lines in each panel) .................................................................... 16 Figure 4. Distribution of errors (differences between generating values and estimates) in latent
ability distribution parameters by design. ..................................................................................... 17 Figure 5. Distribution of errors (difference between generating values and estimates) in item slopes
and difficulties by design............................................................................................................... 18 Figure 6. Expected gains in measurement precision from the simulation study ................................... 20
EDU/WKP(2019)17 5
INTRODUCTION OF MULTISTAGE ADAPTIVE TESTING DESIGN IN PISA 2018 Unclassified
1. Introduction
The Programme for International Student Assessment (PISA) is the largest international
large-scale assessment (ILSA) in the world, aiming to evaluate educational systems
worldwide through testing the skills and knowledge of 15-year-old students. Students
representing 79 countries and economies participated in the 2018 cycle of this triennial
assessment, and 6 300 students on average per country were sampled for the main survey.
In the 2015 cycle, PISA switched from a paper-based assessment (PBA) to mostly a
computer-based assessment (CBA), with 90% of countries choosing the CBA option. This
shift created new opportunities for (a) implementing new and innovative item types that
incorporate features and functions only afforded by computer, (b) assessing new domains
(collaborative problem solving in 2015 cycle), and (c) collecting additional information,
such as response times and process data.
Moreover, moving to CBA also more readily incorporated adaptive testing. Unlike
traditional linear testing where all participants are provided a fixed test form, adaptive
testing uses a test administration algorithm that is designed to present items that are
matched to the test takers’ estimated ability level, where ability is estimated in real time as
the test proceeds. Adaptive tests generally belong to one of two groups: item-level adaptive
tests or multistage adaptive tests (MSATs)1. Adaptation occurs after every item in item-
level adaptive testing, which is attractive for testing programs that focus on individuals
where a relatively narrow construct is assessed based on a large item pool of independent
items (Robin, Steffen, & Liang, 2014). For MSAT, a set of items is the smallest unit (such
as multiple questions based on a single reading passage), and adaptation occurs after a set
instead of a single item. MSAT designs “(strike) a balance among adaptability, practicality,
measurement accuracy, and control over test forms” (Zenisky, Hambleton, & Luecht, 2010)
and have several practical advantages.
In ILSAs, MSAT is useful when various constraints need to be taken into account
(Yamamoto, Shin, & Khorramdel, 2018b). For example, with PISA, measurement is based
on a broad framework of numerous items with different item types (multiple-choice and
constructed-response items), items are translated across multiple languages, and group-
level scores of heterogeneous populations must be reported. In such instances, MSAT is a
good choice for assessment design.
This paper describes and evaluates the MSAT design that was specifically designed to
handle such challenges for the PISA 2018 main survey. Through a simulation study, the
performance of the MSAT design was examined and compared in terms of model
parameter recovery and measurement precision. Specifically, errors in the model parameter
estimation and the measurement precision (i.e. standard errors of person proficiencies)
were examined when the MSAT design was applied to the generated dataset compared to
non-adaptive designs.
1 More information on multistage adaptive testing design in PISA will be available in the PISA 2018
Technical Report (OECD, forthcoming).
6 EDU/WKP(2019)17
INTRODUCTION OF MULTISTAGE ADAPTIVE TESTING DESIGN IN PISA 2018 Unclassified
2. Multistage adaptive testing design
To understand the design better, it is helpful to define terminologies that are used
throughout this paper:
Item: a task to which a student is directed to provide a response that receives a
score, including machine- and human-coded items;
Unit: a set of items (usually ranging from one to eight items) that is designed to
share similar or identical content, stimuli, or reading passage;
Testlet: a set of several units that, when combined across all three stages of the
adaptive design, constitute the administered assessment.
Note that the term “Cluster,” which has been used up to the PISA 2015 cycle for a balanced
incomplete block (BIB) design (Messick, Beaton, & Lord, 1983), is comparable to “testlet,”
which is used for the PISA 2018 cycle MSAT design. Both clusters and testlets are made
up of several units. However, clusters include units in fixed positions, while testlets include
units in variable positions. More specifically, for the BIB design, four 30-minute clusters
were located and fixed within each form based on the rotated booklet design, and randomly
selected forms were administered to students in a non-adaptive manner. By contrast, testlets
for MSAT design are more flexible: the same unit can be in a different location, depending
on the testlet and student’s performance at the previous stage (both affect the choice of
testlet in the next stage).
MSAT has become popular in many individual-level testing programs, but it is still new to
international large-scale assessment. The primary reasons to introduce MSAT in ILSAs are
to reduce measurement error for heterogeneous populations, without overburdening
individual respondents, and to accommodate both multiple-choice items (automatically-
coded items can be used for MSAT routing decisions) and constructed-response items
(human-coded items that cannot be scored on the fly and, thus, cannot be used for MSAT
routing decisions), which are associated with a specific unit to best measure the construct.
The first time MSAT was used in the context of ILSAs was in the Programme for the
International Assessment of Adult Competencies (PIAAC). PIAAC showed that its MSAT
adaptive assessment was approximately 15-47% more efficient than the average
non-adaptive linear assessment based on the identical item set (Organisation for Economic
Co-operation and Development [OECD], 2013). This means that the same amount of test
information was obtained from the adaptive test as would have been obtained from a
non-adaptive test having 15-47% more items (or stated another way; the adaptive test
required 13-32% fewer items). It is also worth noting that there was no proficiency range
where adaptive testing was less informative than a traditional test. For details about the
MSAT design used in PIAAC, please refer to the technical report (OECD, 2013) and
Yamamoto, Khorramdel, and Shin (2018a).
The MSAT design for the PISA 2018 main survey consisted of three stages: Core, Stage 1,
and Stage 2. Overall, the reading item pool included a total of 245 items, and each student
received one testlet at each stage: two units at the Core (7-10 items), three units at Stage 1
(12-15 items) and two units at Stage 2 (12-15 items) within a 60-minute period. This
resulted in different numbers of items for each student to take, ranging from 33-40 items,
depending on which testlet was taken at each stage. Forty was the maximum number of
items taken by each student within an hour, with most students taking 35-39 items.
EDU/WKP(2019)17 7
INTRODUCTION OF MULTISTAGE ADAPTIVE TESTING DESIGN IN PISA 2018 Unclassified
Assignment of units to testlets
Unit selection and assignment were carefully set up by test developers to optimise test
delivery and to the ability of students who take those items, as well as to meet other
constraints (e.g. construct coverage, amount of time for each unit, proportion of
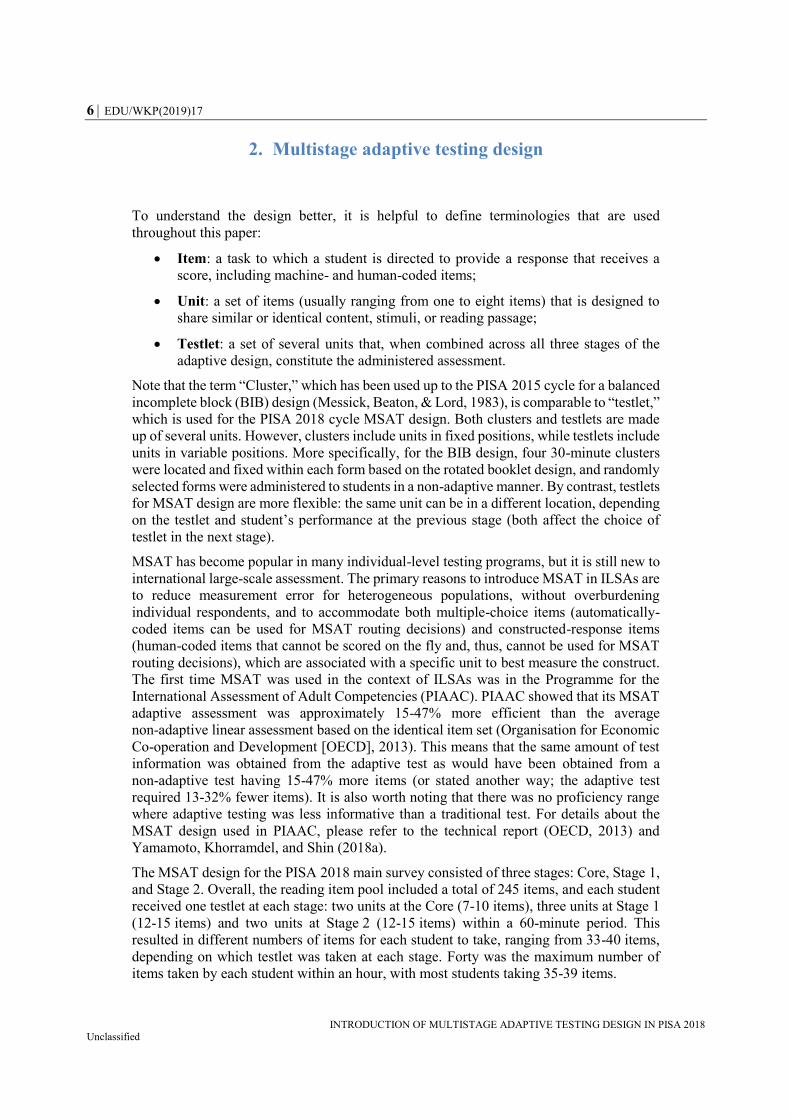
automatically scored items). Tables 1 to 3 represent how the testlets of each of the three
stages were constructed in terms of number of units, number of items within testlets, and
how units were linked across testlets. Each column corresponds to a “unit” and shows the
number of items in each unit, with the number of machine- or automatically scored items
shown in parentheses. Each row corresponds to a “testlet” that was composed of multiple
units. The two rightmost columns present the number of total (human- and automatically
scored) items and the number of automatically scored items for each testlet. As shown in
Table 1, the Core stage included a set of 5 different units, each composed of 3-5 items.
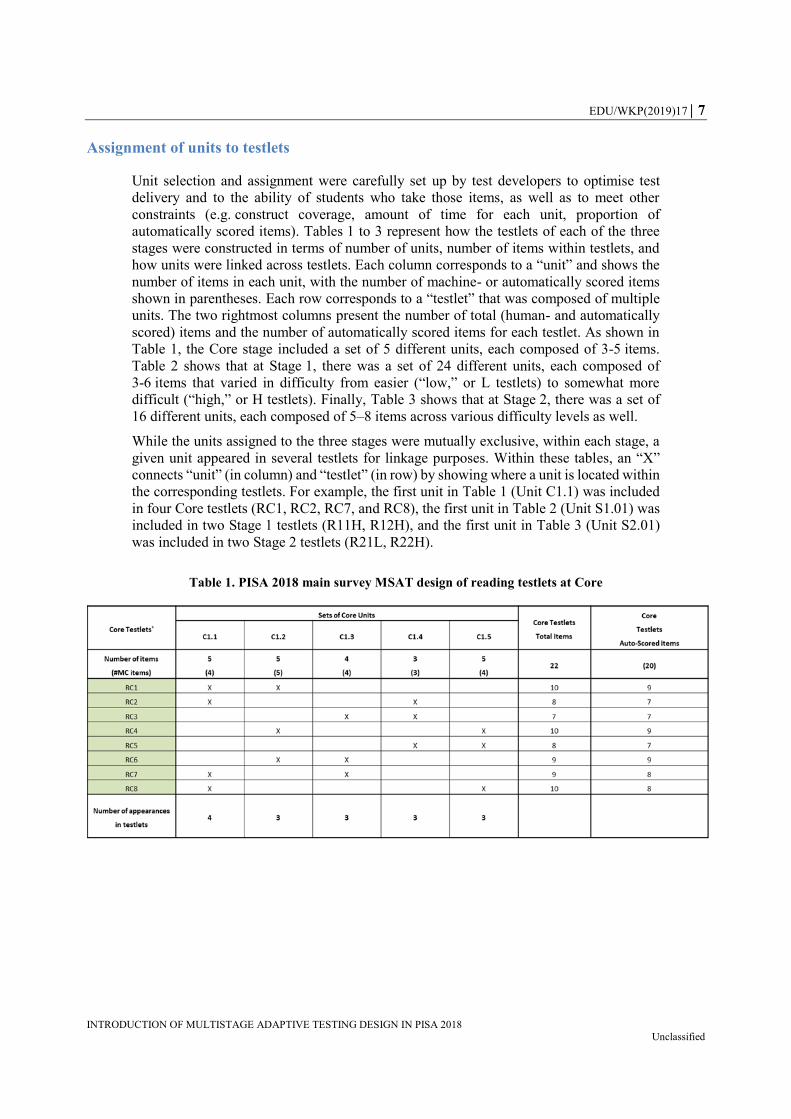
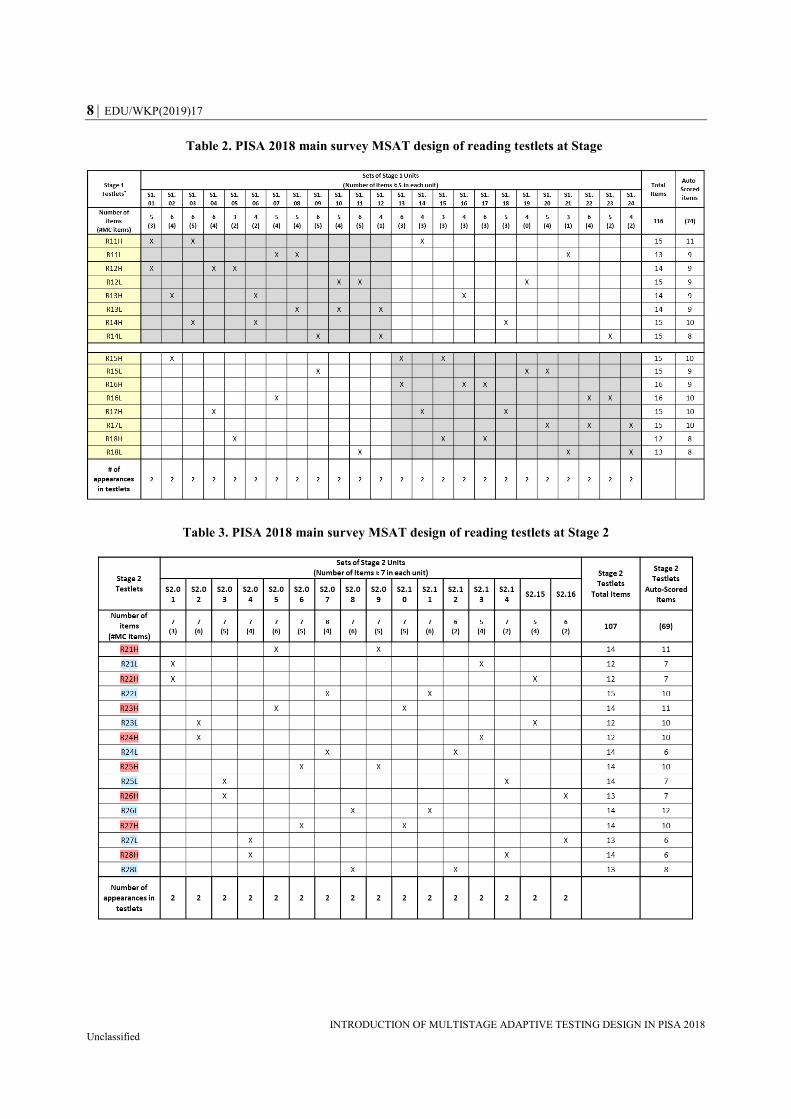
Table 2 shows that at Stage 1, there was a set of 24 different units, each composed of
3-6 items that varied in difficulty from easier (“low,” or L testlets) to somewhat more
difficult (“high,” or H testlets). Finally, Table 3 shows that at Stage 2, there was a set of
16 different units, each composed of 5–8 items across various difficulty levels as well.
While the units assigned to the three stages were mutually exclusive, within each stage, a
given unit appeared in several testlets for linkage purposes. Within these tables, an “X”
connects “unit” (in column) and “testlet” (in row) by showing where a unit is located within
the corresponding testlets. For example, the first unit in Table 1 (Unit C1.1) was included
in four Core testlets (RC1, RC2, RC7, and RC8), the first unit in Table 2 (Unit S1.01) was
included in two Stage 1 testlets (R11H, R12H), and the first unit in Table 3 (Unit S2.01)
was included in two Stage 2 testlets (R21L, R22H).
Table 1. PISA 2018 main survey MSAT design of reading testlets at Core
8 EDU/WKP(2019)17
INTRODUCTION OF MULTISTAGE ADAPTIVE TESTING DESIGN IN PISA 2018 Unclassified
Table 2. PISA 2018 main survey MSAT design of reading testlets at Stage
Table 3. PISA 2018 main survey MSAT design of reading testlets at Stage 2
EDU/WKP(2019)17 9
INTRODUCTION OF MULTISTAGE ADAPTIVE TESTING DESIGN IN PISA 2018 Unclassified
Test assembly
With respect to assembly, there were eight parallel testlets at each of the three stages: Core
(eight testlets labelled RC1-RC8), Stage 1 (eight more difficult testlets labelled
R11H-R18H for “high,” and eight easier testlets labelled R11L-R18L for “low”) and
Stage 2 (eight more difficult testlets labelled R21H-R28H for “high,” and eight easier
testlets labelled R21L-R28L for “low”). It may be helpful to further explain the labelling
method for the testlets in Stage 1 and Stage 2:
The first digit in the Reading testlets’ numeric identification indicates which stage
that testlet belongs to: 1 for Stage 1 (e.g. R1 of R14H and R18L) and 2 for Stage 2
(e.g. R2 of R21H and R28L)
The second digit in the Reading testlets’ numeric identification indicates the
possible options at each stage, for example, one of the difficult testlet options
(e.g. fourth “high” option, R14H) or one of the easy testlet options (e.g. sixth “low”
option, R16L).
For Core and Stage 1 testlets, “parallel sets” (i.e. similar difficulty levels with different
units) were introduced as an additional feature of the MSAT design for PISA 2018
Reading: RC1-RC4 and RC5-RC8 were the two parallel sets at Core, and R11H-R14L and
R15H-R18L were the two parallel sets at Stage 1. The introduction of parallel sets:
i) doubled the number of items to ensure better coverage of the domain and thus,
representation of the scale, and ii) served as the linking feature, as testlets are also linked
across “parallel sets” at every stage. These parallel sets are indicated by the shaded areas
in Figure 1 (two green shaded areas at Core and two yellow shaded areas at Stage 1). Each
testlet was paired with another testlet in a different parallel set at every stage. More
specifically, shaded cells in Figure 1 demonstrate how parallel sets were linked to each
other: the patterns linking the sets from R11H-R14L to Stage 2 were almost symmetric
with the patterns linking the sets from R15H-R18L to the same stage. In summary, “parallel
sets” at Core and Stage 1 allowed for 245 items in total (22 at Core, 116 at Stage 1, 107 at
Stage 2) to be used to construct the test. This assured a broad and thorough representation
of the scale with a considerably increased item pool.
10 EDU/WKP(2019)17
INTRODUCTION OF MULTISTAGE ADAPTIVE TESTING DESIGN IN PISA 2018 Unclassified
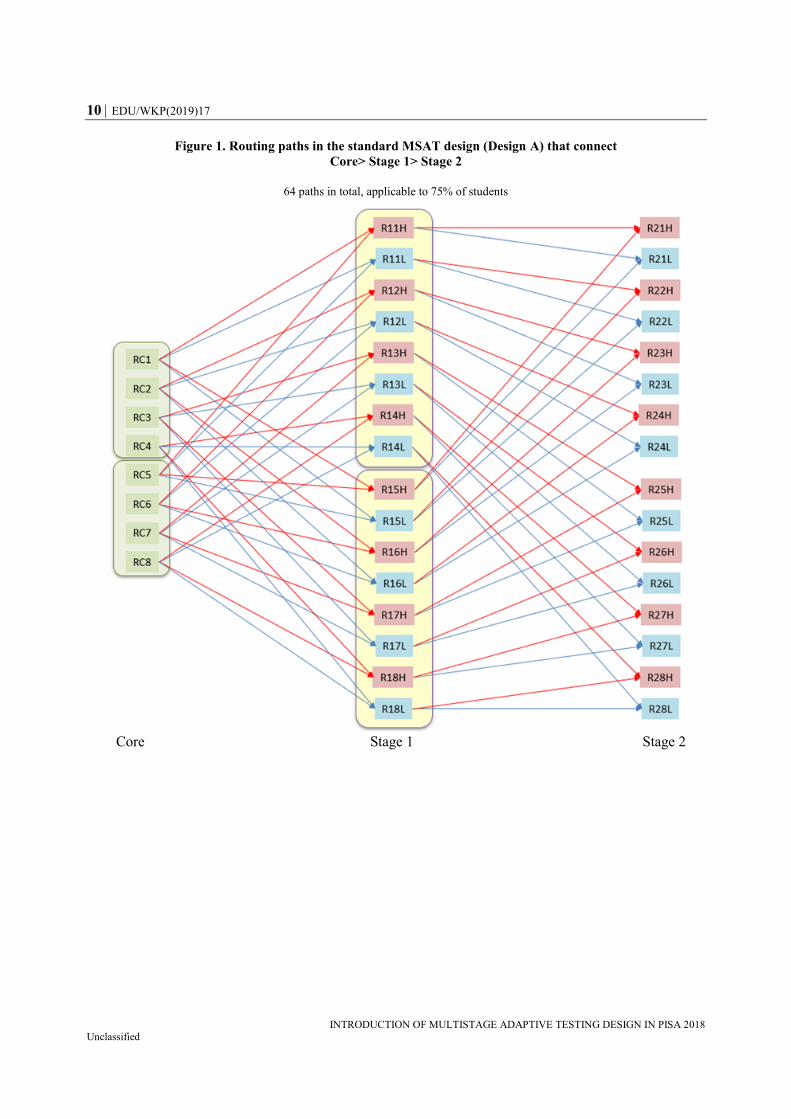
Figure 1. Routing paths in the standard MSAT design (Design A) that connect
Core> Stage 1> Stage 2
64 paths in total, applicable to 75% of students
Core Stage 1 Stage 2
EDU/WKP(2019)17 11
INTRODUCTION OF MULTISTAGE ADAPTIVE TESTING DESIGN IN PISA 2018 Unclassified
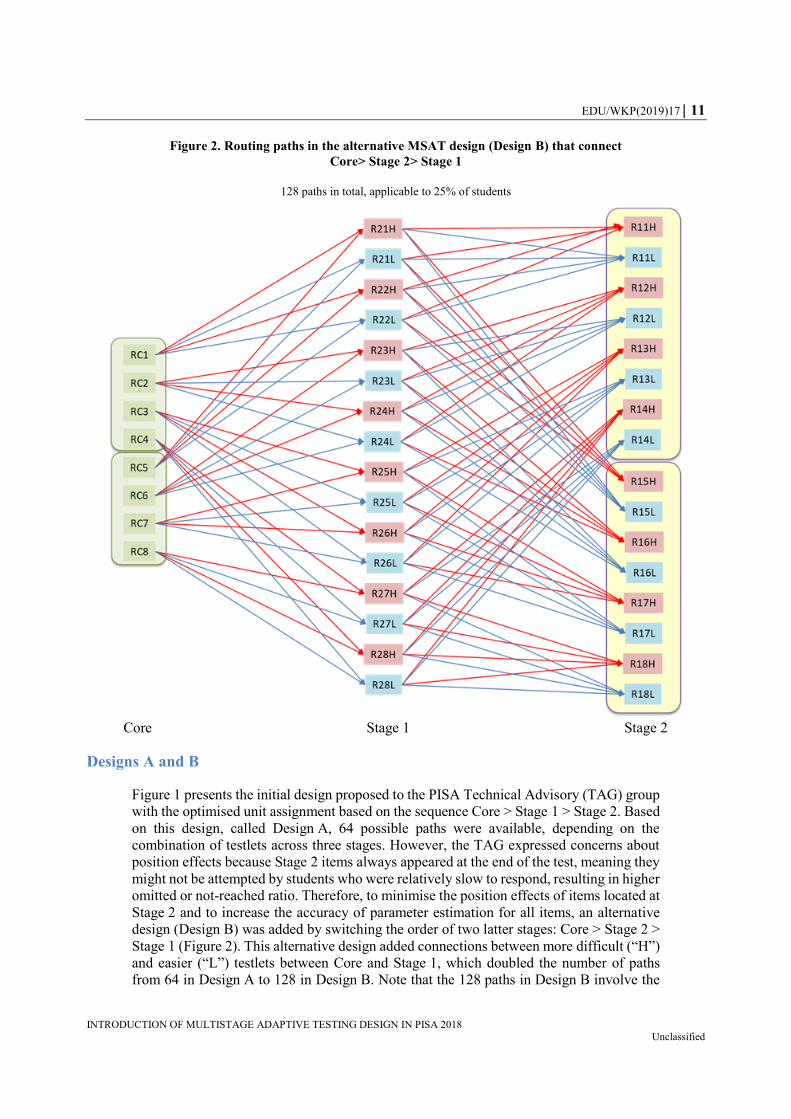
Figure 2. Routing paths in the alternative MSAT design (Design B) that connect
Core> Stage 2> Stage 1
128 paths in total, applicable to 25% of students
Core Stage 1 Stage 2
Designs A and B
Figure 1 presents the initial design proposed to the PISA Technical Advisory (TAG) group
with the optimised unit assignment based on the sequence Core > Stage 1 > Stage 2. Based
on this design, called Design A, 64 possible paths were available, depending on the
combination of testlets across three stages. However, the TAG expressed concerns about
position effects because Stage 2 items always appeared at the end of the test, meaning they
might not be attempted by students who were relatively slow to respond, resulting in higher
omitted or not-reached ratio. Therefore, to minimise the position effects of items located at
Stage 2 and to increase the accuracy of parameter estimation for all items, an alternative
design (Design B) was added by switching the order of two latter stages: Core > Stage 2 >
Stage 1 (Figure 2). This alternative design added connections between more difficult (“H”)
and easier (“L”) testlets between Core and Stage 1, which doubled the number of paths
from 64 in Design A to 128 in Design B. Note that the 128 paths in Design B involve the
12 EDU/WKP(2019)17
INTRODUCTION OF MULTISTAGE ADAPTIVE TESTING DESIGN IN PISA 2018 Unclassified
same 64 paths in Design A. More specifically, in Design A (Figure 1), Stage 2 difficult
testlets were only routed from Stage 1 difficult testlets (e.g. R21H was routed from R11H
and R15H). In Design B (Figure 2), Stage 2 difficult testlets routed to not only Stage 1
difficult testlets but also to easy testlets (e.g. R21H connected to R11H, R15H, R11L, and
R15L). In each country, Design A (Core > Stage 1 > Stage 2 with 64 paths in total) was
administered to 75% of students and Design B (Core > Stage 2 > Stage 1 with 128 paths in
total) was administered to 25%.
Routing decisions and paths
With respect to routing rules, at the Core stage, testlet assignment was based on a random
number (between 1 and 8). At Stage 1, testlet assignment was based on three criteria: i) the
Core testlet assigned, ii) the students’ performance in the Core testlet (i.e. total number
correct on automatically scored items on the given testlet), and iii) a probability layer
matrix. Similarly, at Stage 2, testlet assignment was based on: i) the testlet taken at Stage 1,
ii) the combined students’ performance in Core and Stage 1 testlets (i.e. total number
correct on automatically scored items on the given Core testlet and Stage 1 testlet), and
iii) a probability layer matrix. The first criterion implies that not all combinations of testlets
across stages were possible; rather, only certain combinations of testlets were intended
across stages. This was mainly to facilitate unit selection and assignment taking into
account several constraints in the test assembly (e.g. matching item difficulty level to the
ability of students, expecting number of responses per item, proportions of automatically
scored items). We elaborate two latter criteria below.
First, the routing method was dependent on the performance on the automatically scored
items at the previous stage, which categorised students into three performance groups:
low: total number correct less than the testlet-specific lower threshold,
medium: total number correct between lower and upper testlet-specific thresholds,
and
high: total number correct higher than upper testlet-specific threshold.
Decisions about these performance groups were based on the same proficiency thresholds
corresponding to testlet-specific number correct on the automatically scored items. More
specifically, for each testlet, the number-correct thresholds were computed according to
their test characteristic curve (TCC) multiplied by the number of automatically scored
items. Across all paths, the PISA scale scores of 425 and 530 were used to set the lower
threshold (between low and medium groups) and the upper threshold (between medium
and high groups), respectively. This method using the testlet-dependent total number of
correct thresholds was employed to optimise the expected gains from the adaptive
procedure, considering that at each decision point, only partial information was available
from previous stages (i.e. performance on human-coded items could not be included in the
routing decision, but responses to human-coded items were added later when they become
available and scaled together with automatically scored items).
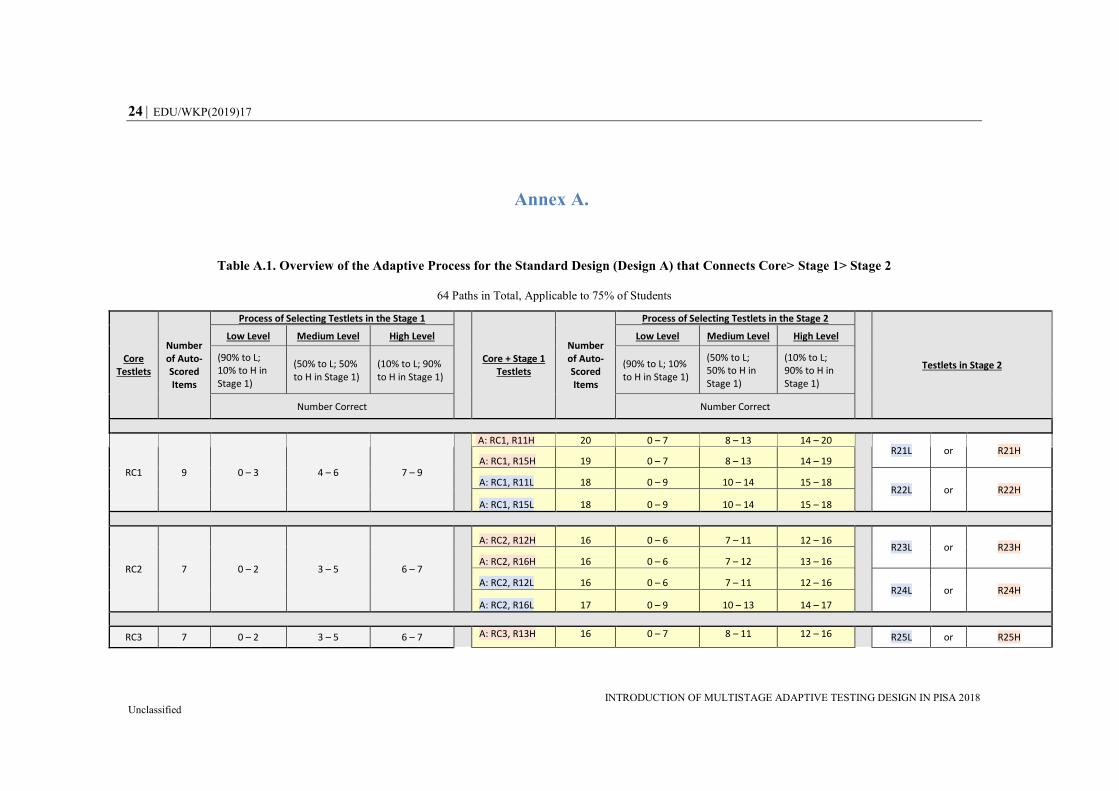
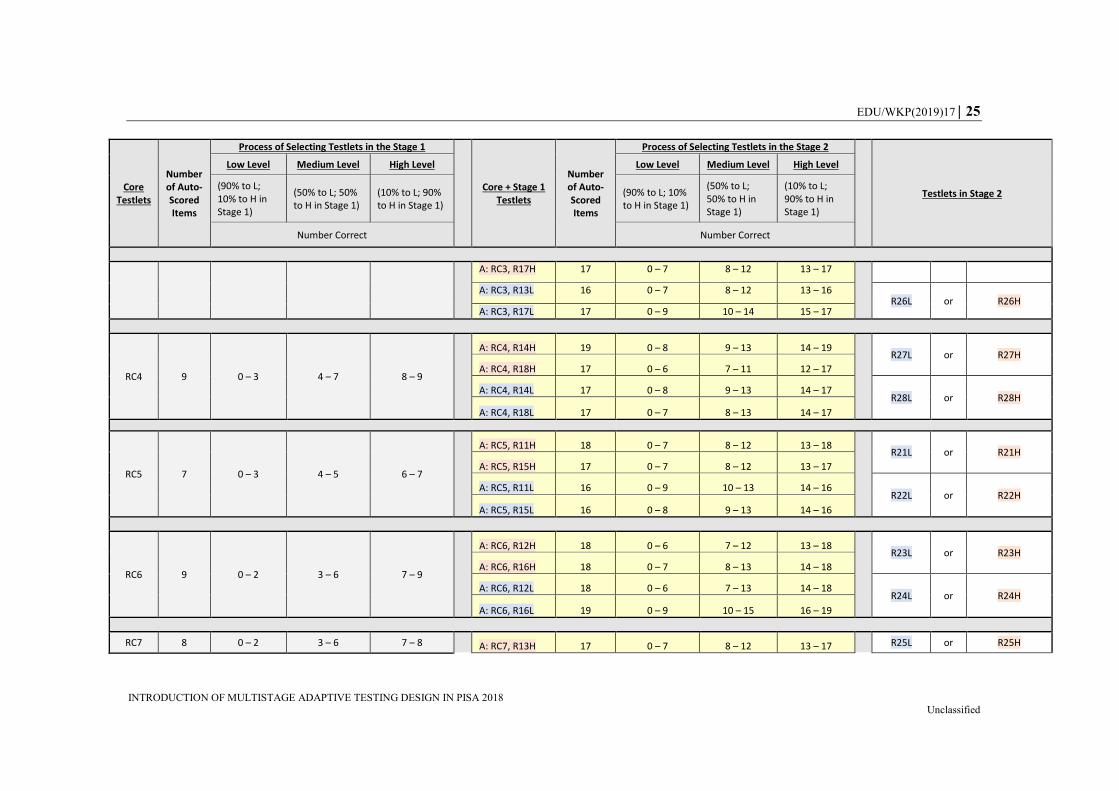
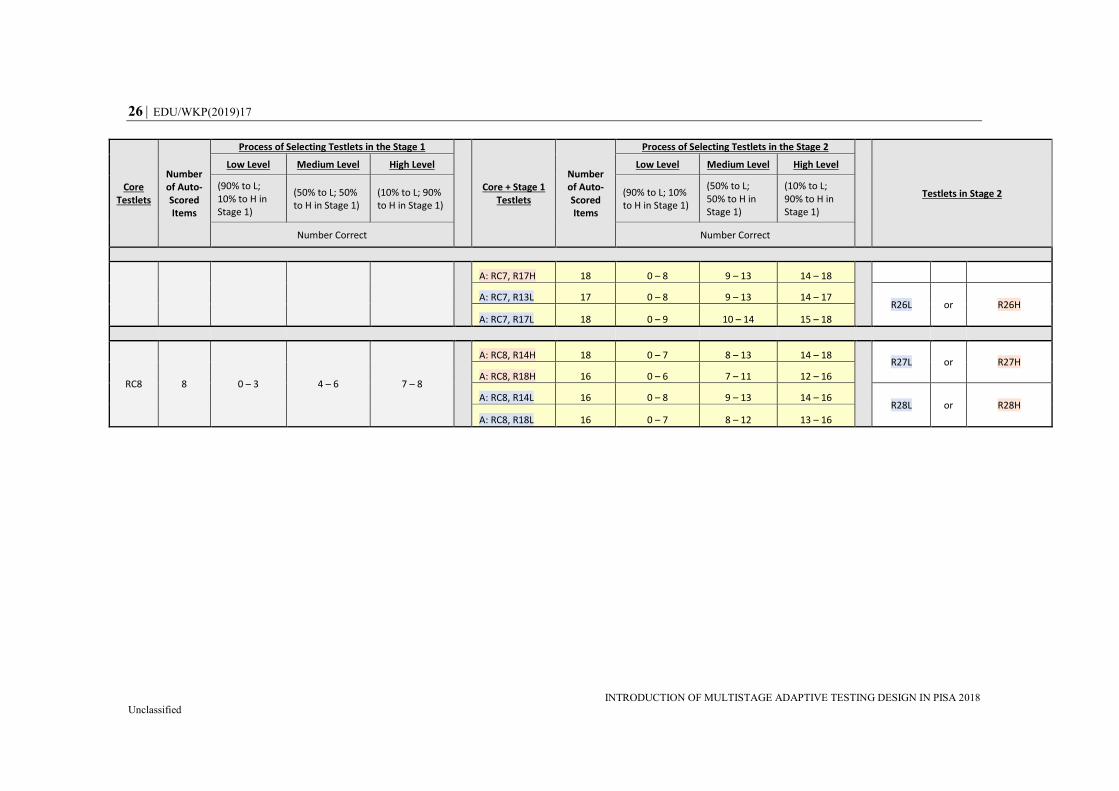
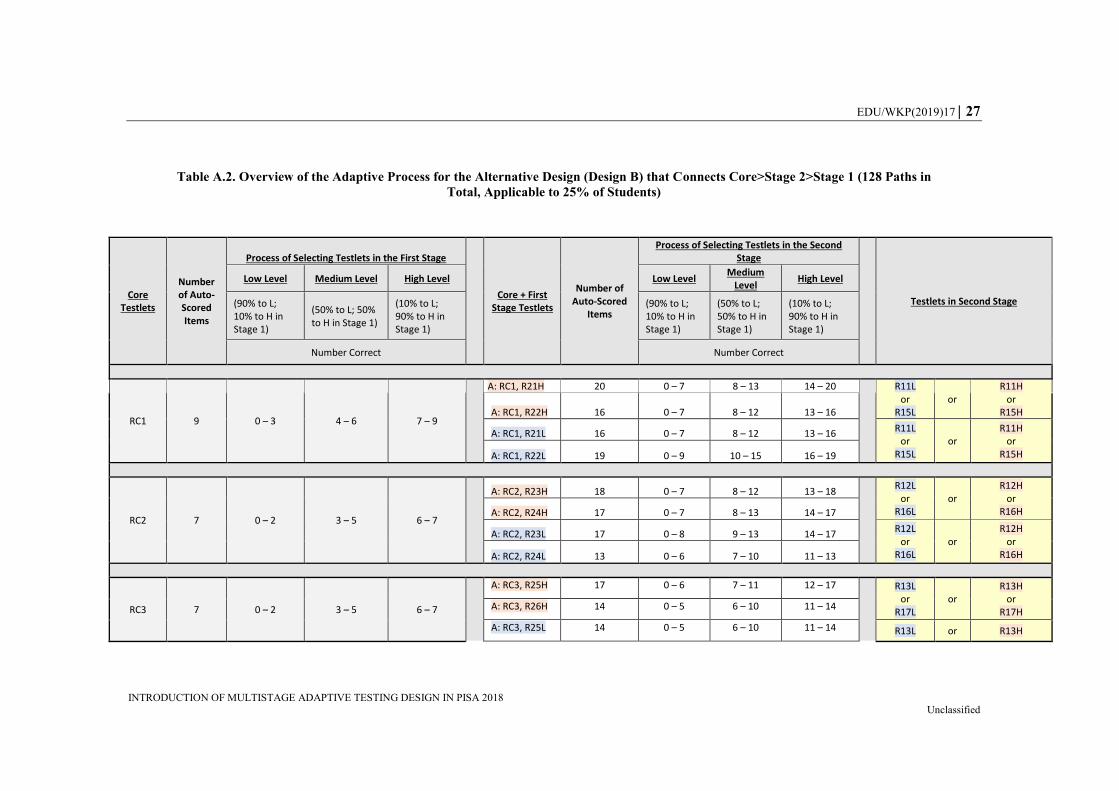
In the Appendix, Table A.1 provides an overview of the adaptive process for Design A,
which was applicable to 75% of the respondents. Table A.2 provides the information for
Design B, which was applicable to 25% of the respondents. The first part of the table (gray
columns) presents the Core testlets (RC1 to RC8) along with the number of automatically
scored items and the number-correct ranges, and how the process was applied to select
Stage 1 testlets. For example, a student taking Core 1 was classified into the “low”
EDU/WKP(2019)17 13
INTRODUCTION OF MULTISTAGE ADAPTIVE TESTING DESIGN IN PISA 2018 Unclassified
performance group if the number-correct (NC) was lower than 4 (i.e. NC {0,1,2,3}), into
the “high” performance group if the number-correct was higher than 6 (i.e. NC {7,8,9}),
and into the “medium” performance group if the number-correct was in between
(i.e. NC {4,5,6}). The second part of the table (yellow columns) describes the Stage 1
testlets in combination with the Core testlets. In this context, the total number of
automatically scored items was the sum of the Core + Stage 1 testlets, which was the most
complete level of information available at this point for each student.
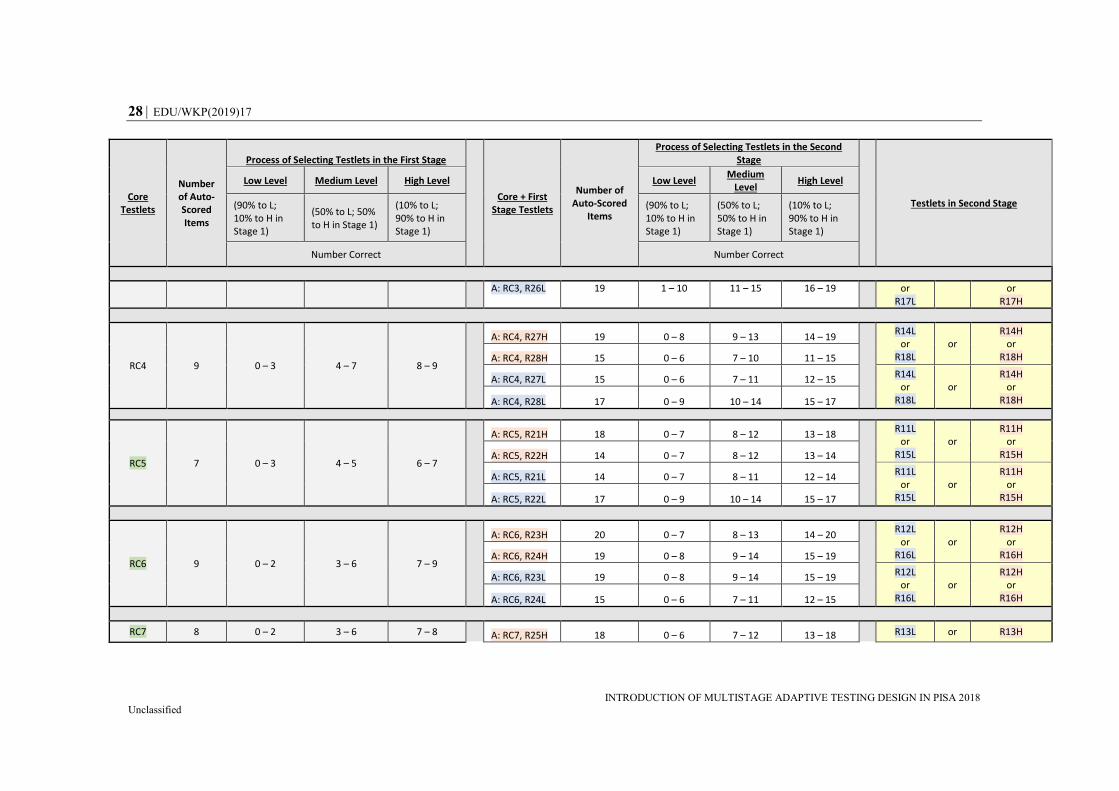
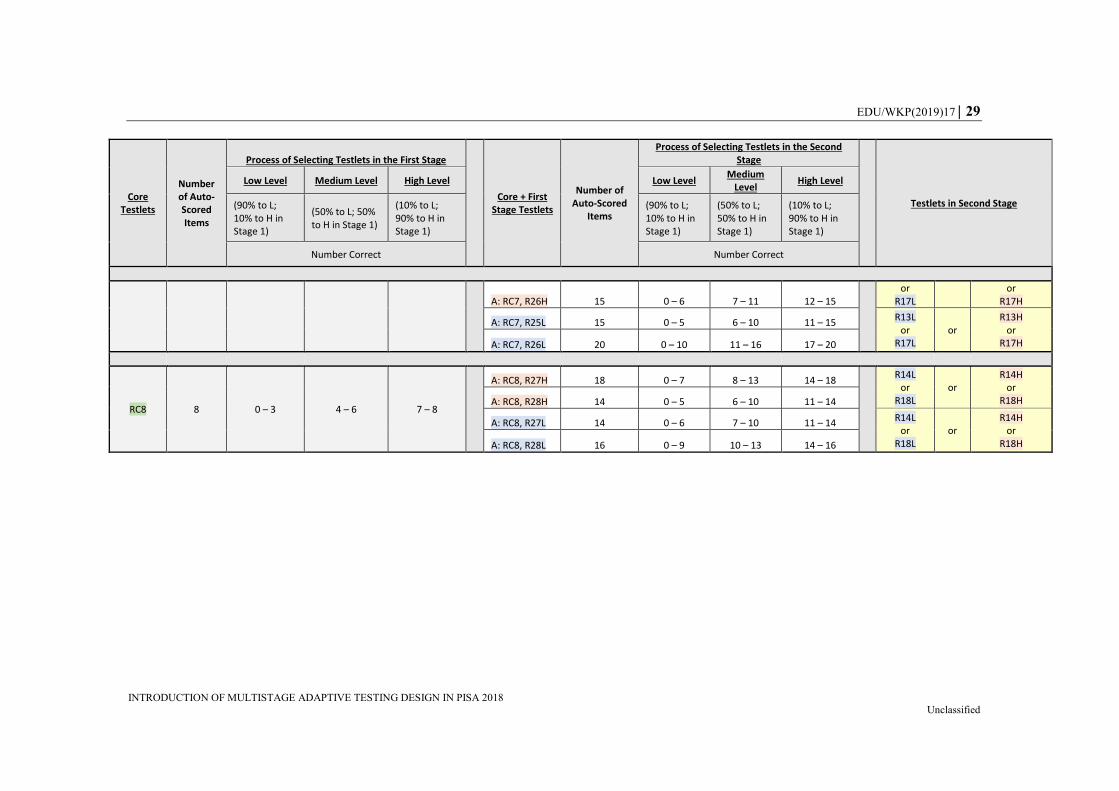
The second criterion – the probability layer matrix – is described in the columns labelled
“process of selecting testlets in the Stage 1 [or Stage 2])” in Tables A-1 and A-2. A student
in the “low” performance group had a 90% probability of being assigned an easy or “low”
testlet (90% to L) and 10% of being assigned a difficult or “high” testlet (10% to H) in the
next stage. The opposite happened for students in the “high” performance group: there was
a 90% probability of being assigned to a “high” testlet (90% to H) and 10% of being
assigned to a “low” testlet (10% to L) in the next stage.
Students classified as “medium” performance had equal probability of being assigned to
any of the two high or two low testlets in the next stage (50% to L and 50% to H). For
example in Table A.1 for Design A, if a student who took Core 1 was classified as “low”
performance (e.g. sum score less than 4), the assigned testlet would be one of the “low”
testlets {R11L, R15L} with 90% of probability (each 45%), or one of “high” testlets
{R11H, R15H} with 10% of probability (each 5%). Likewise, if a student took Core 1
testlet and the R11H testlet in Stage 1, the student would take either R21H or R21L
depending on his or her combined performance at Core and Stage 1, and the predetermined
probability would be 90% of the matched ability level if in the “high” or “low” performance
group, or 50% if in the “medium” performance group. For a probability layer matrix, it
could be more balanced to calculate the item exposure rates for each (sub)population of
interest, as is done in PIAAC (Chen, Yamamoto, & von Davier, 2014). However, given the
complex structure of the MSAT design for PISA, and that the background questionnaire
(BQ) in PISA is administered after the cognitive assessment (i.e. there is no BQ information
prior to the cognitive test), it was impossible to consider the numerous BQ variables in an
extensive way (see Yamamoto, et al., [2018a] for more details of the MSAT design in
PIAAC).
14 EDU/WKP(2019)17
INTRODUCTION OF MULTISTAGE ADAPTIVE TESTING DESIGN IN PISA 2018 Unclassified
3. Simulation study
Previous studies showed that adaptive testing has the potential to increase the accuracy of
the person ability estimator under specific circumstances (e.g. Kubinger, 2016). Oranje,
Mazzeo, Xu, and Kulick (2014) studied the accuracy of an MSAT design for the National
Assessment of Educational Progress (NAEP), another well-known large-scale assessment
in the United States. At the group level, they found that the measurement standard error
was reduced by 10-20% when adaptive testing was administered compared to the
calibration sample that followed the current NAEP design. Below, a simulation study was
designed to evaluate the MSAT design that was implemented in the PISA 2018 main
survey. In this simulation study, the performance of the MSAT design was evaluated and
compared with two other designs, a complete design and a random design.
Data generation
First, an item pool consisting of 245 dichotomous and polytomous items was used to
generate item responses with the preliminary item parameters (i.e. slopes and difficulties)
obtained from the PISA 2018 field trial. All 245 items were assigned to the appropriate unit
for the given stage by test developers, taking into account the item difficulties, content
coverage, and response times obtained from the field trial. In further detail, 22 items
(2 human-coded items and 20 multiple choice items) were assigned to 5 units at Core,
116 items (42 human-coded items and 74 multiple choice items) were assigned to 24 units
at Stage 1, and 107 items (38 human-coded items and 69 multiple choice items) were
assigned to 16 units at Stage 2. Note that throughout the simulation study, item selection
and their allocation to the units were kept the same, and that the same structure was used
for the MSAT design in the main survey.
Second, group-level skill distributions were generated. Given the heterogeneous
populations participating in PISA, 12 fictitious countries that vary in performance level
(i.e. mean of latent ability distributions) were considered, including one reference group
following the standard normal distribution. For the other 11 groups, skill distributions were
assumed to be normally distributed with a common standard deviation of 0.76 (100 on the
PISA Reading scale), and the mean of the latent ability distribution ranged from -0.29 to
1.23 (400~600 on the PISA Reading scale), according to the preliminary results obtained
from the PISA 2018 field trial. Given the sample size for the standard design participating
in PISA, the number of students per country was set to N=6 300, resulting in N=75 600 in
total across the 12 fictitious countries.
Using these item parameters and abilities, one complete dataset of item responses
(i.e. 245*75 600 data points) was generated. Then, the MSAT design was applied by
converting item responses to missing when the items were not taken by students, given the
unit selection, unit assignment, and the pre-specified sum score ranges stated in the
previous section and in the Appendix. In addition to the actual MSAT design, complete
design and random design conditions were examined as baseline designs for comparison.
The complete design assumes that all students take all 245 items in the item pool. Although
this design could be ideal for individual-level testing for a single domain, the design is not
feasible due to the large number of items and long testing time required, making it
unrealistic for a population survey. Still, the complete design provides comparative
information about estimation error and sampling error for the given simulated dataset. The
EDU/WKP(2019)17 15
INTRODUCTION OF MULTISTAGE ADAPTIVE TESTING DESIGN IN PISA 2018 Unclassified
random design, in contrast, assumes that individual students take a randomly selected set
of units rather than assigned units based on the MSAT design.
Under the random design, matching the student’s ability level with the item difficulty level
is not considered. The number of units that each student takes is the same for the random
design and the MSAT design: 2 of 5 units at Core, 3 of 24 units at Stage 1, and 2 of 16 units
at Stage 2. There can be various ways to represent non-adaptive operational PISA designs,
but given that the same number of units are administered to each student, the random design
serves as a realistic operational benchmark for comparison with the MSAT design. In the
MSAT and random designs, all other data points depending on design (i.e. items that were
not taken by students) were converted to missing.
Analysis
During the item response theory (IRT) scaling, a multiple-group IRT model (Bock &
Zimowski, 1997) based on the two-parameter logistic (2PL) model for dichotomous items
and the generalised partial credit model (GPCM; Muraki, 1992) for polytomous items was
fitted. This model is equivalent to one that has been utilised in PISA operational work since
the PISA 2015 cycle (OECD, 2017). Analyses were conducted using the mdltm software
that provides marginal maximum likelihood (MML) estimates obtained using customary
expectation-maximisation methods (von Davier, 2005; Khorramdel, Shin, & von Davier,
2019). As shown in Glas (1988), Eggen and Verhelst (2011), and Mislevy and Wu (1996),
MML estimation enables valid item calibration with MSAT data, both in the Rasch model
and in the 2PL model for the dichotomous and polytomous item responses in an MSAT
design for a single domain.
Test characteristic curves
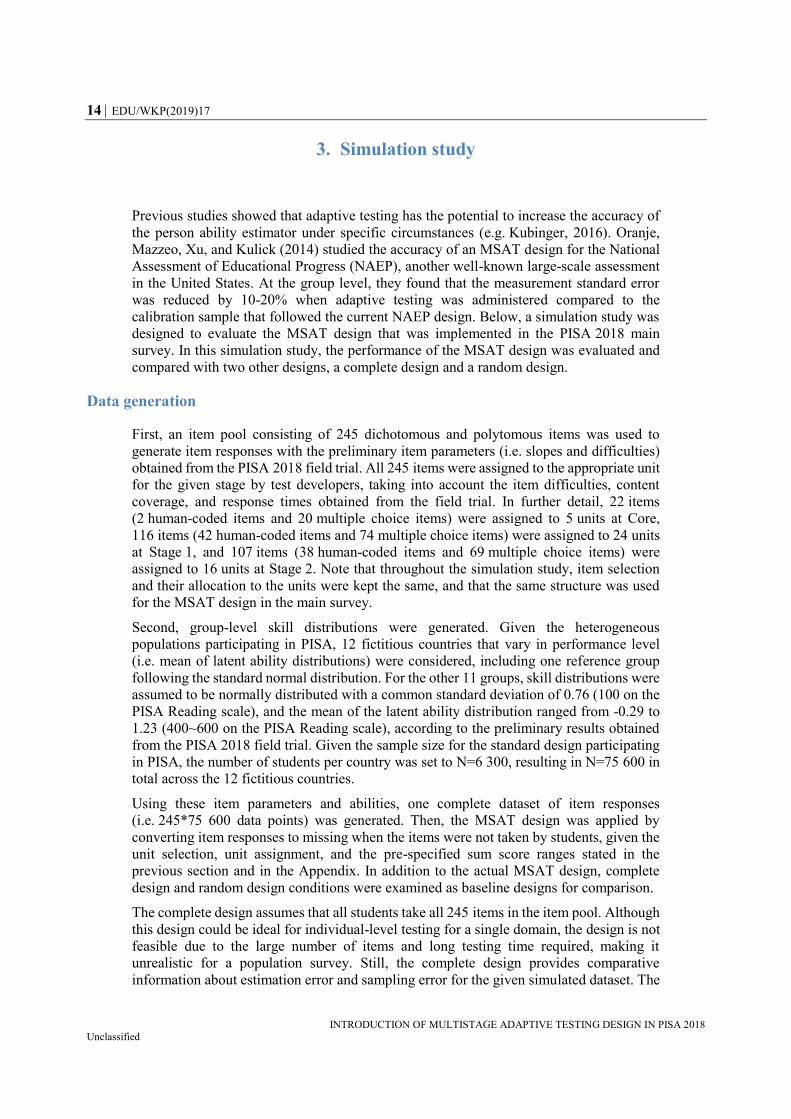
Test characteristic curves (TCC) are useful tools to see which range of scales is targeted
and accurately measured. We present the TCC of Design A because the majority of students
follow this design and half of the routing paths (64 out of 128) available in Design B
overlap with Design A. Figure 3 presents the TCC for the 64 routing paths available in the
Design A with the proportion of correct scores on the y-axis (labelled as ‘Probability’)
based on the preliminary item parameters obtained from the PISA 2018 field trial and item
selection and allocation for the main survey. Four options that share similar item difficulty
levels are indicated by the same type of lines (solid vs. dashed) and the same colour (red
vs. blue): red solid lines for HH (e.g. high-high; difficult testlets at both Stage 1 and 2), red
dashed lines for HL (e.g. high-low; difficult testlet at Stage 1 and easy testlet at Stage 2),
blue solid lines for LH, and blue dashed lines for LL. Figure 3 shows that red lines (HH
and HL) and blue lines (LH and LL) are located quite closely, regardless of the testlet
chosen at the Core. HH shows the most difficult test level, HL the second-most difficult,
LH the second-easiest, and LL the easiest. This pattern is consistently observed across the
four panels (16 paths in each panel) of Figure 3, and suggests that the gap of item difficulty
level between the most difficult and the easiest testlets is not huge, possibly due to the large
number of items within the Reading units (up to 8 items) in that range in difficulty.
16 EDU/WKP(2019)17
INTRODUCTION OF MULTISTAGE ADAPTIVE TESTING DESIGN IN PISA 2018 Unclassified
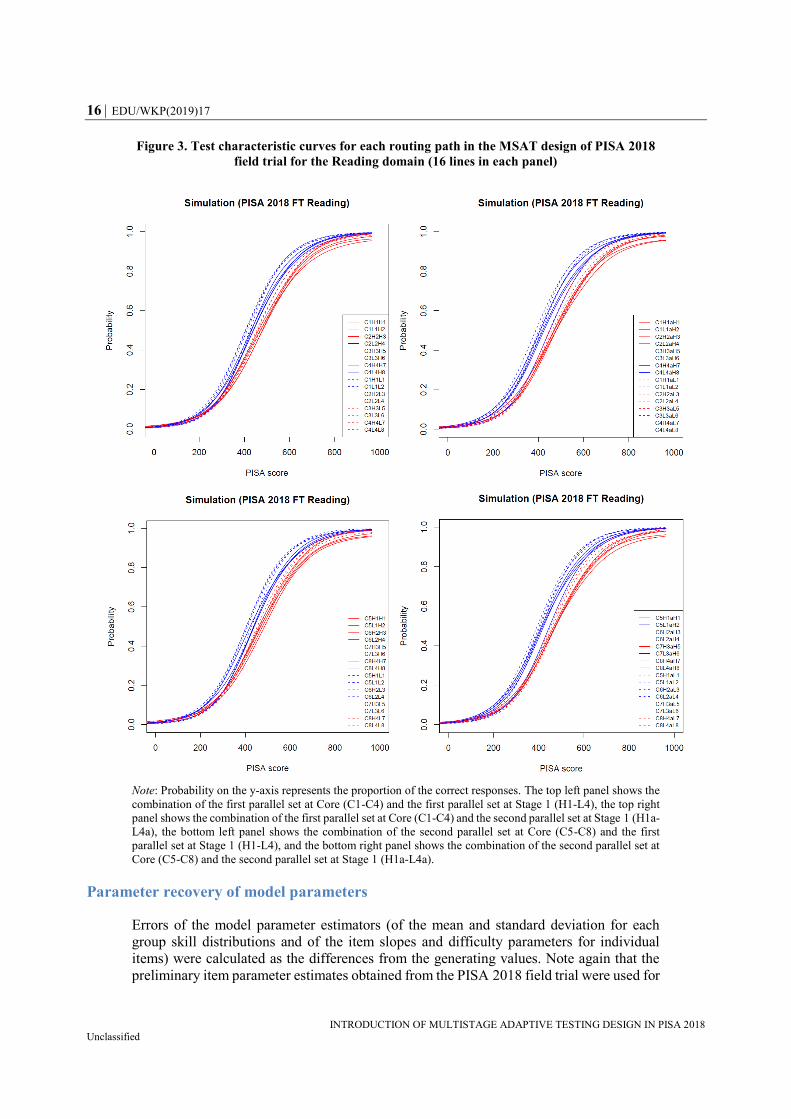
Figure 3. Test characteristic curves for each routing path in the MSAT design of PISA 2018
field trial for the Reading domain (16 lines in each panel)
Note: Probability on the y-axis represents the proportion of the correct responses. The top left panel shows the
combination of the first parallel set at Core (C1-C4) and the first parallel set at Stage 1 (H1-L4), the top right
panel shows the combination of the first parallel set at Core (C1-C4) and the second parallel set at Stage 1 (H1a-
L4a), the bottom left panel shows the combination of the second parallel set at Core (C5-C8) and the first
parallel set at Stage 1 (H1-L4), and the bottom right panel shows the combination of the second parallel set at
Core (C5-C8) and the second parallel set at Stage 1 (H1a-L4a).
Parameter recovery of model parameters
Errors of the model parameter estimators (of the mean and standard deviation for each
group skill distributions and of the item slopes and difficulty parameters for individual
items) were calculated as the differences from the generating values. Note again that the
preliminary item parameter estimates obtained from the PISA 2018 field trial were used for
EDU/WKP(2019)17 17
INTRODUCTION OF MULTISTAGE ADAPTIVE TESTING DESIGN IN PISA 2018 Unclassified
generating values for the item parameters. Table 4 presents the summary of differences
between generating values and estimates obtained from each design condition. Overall, the
MSAT design demonstrated an acceptable level of parameter recovery.
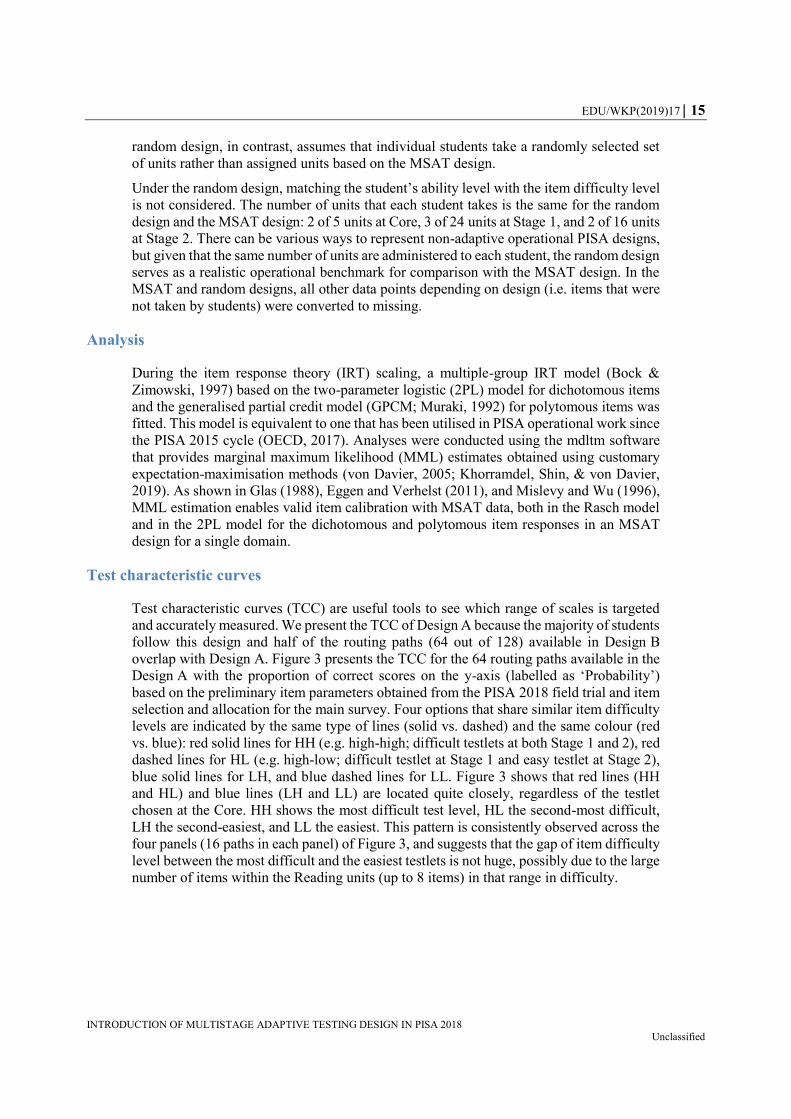
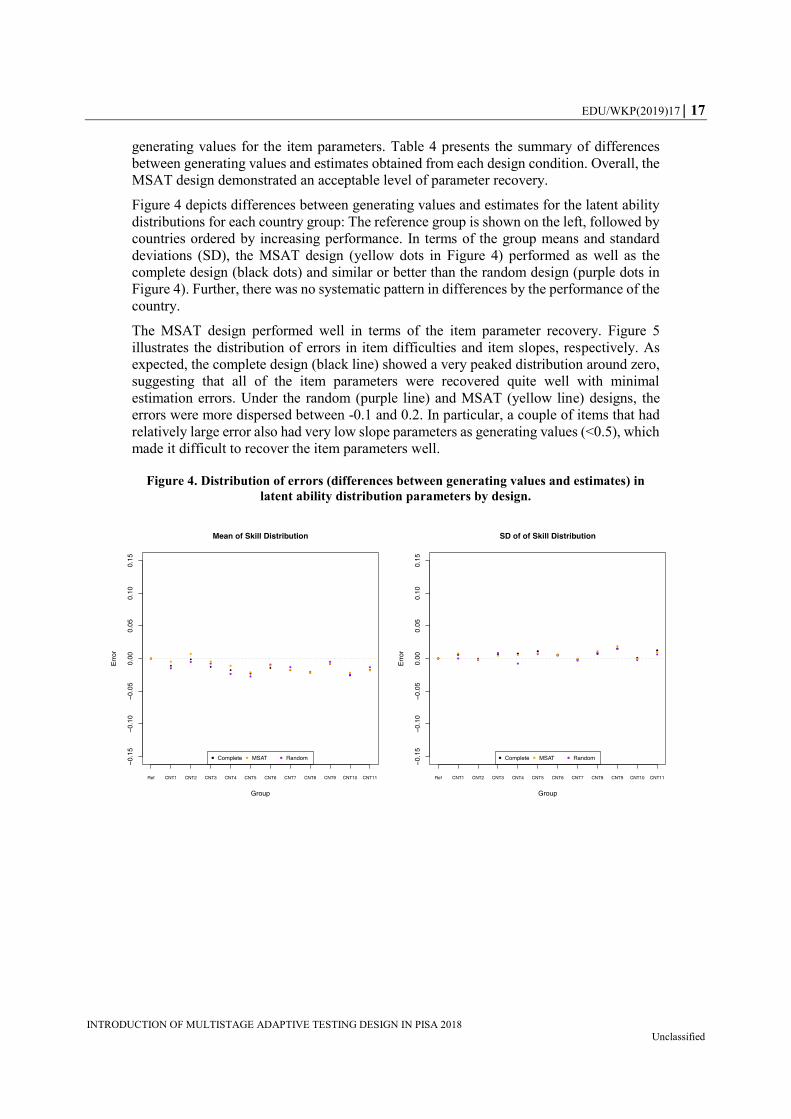
Figure 4 depicts differences between generating values and estimates for the latent ability
distributions for each country group: The reference group is shown on the left, followed by
countries ordered by increasing performance. In terms of the group means and standard
deviations (SD), the MSAT design (yellow dots in Figure 4) performed as well as the
complete design (black dots) and similar or better than the random design (purple dots in
Figure 4). Further, there was no systematic pattern in differences by the performance of the
country.
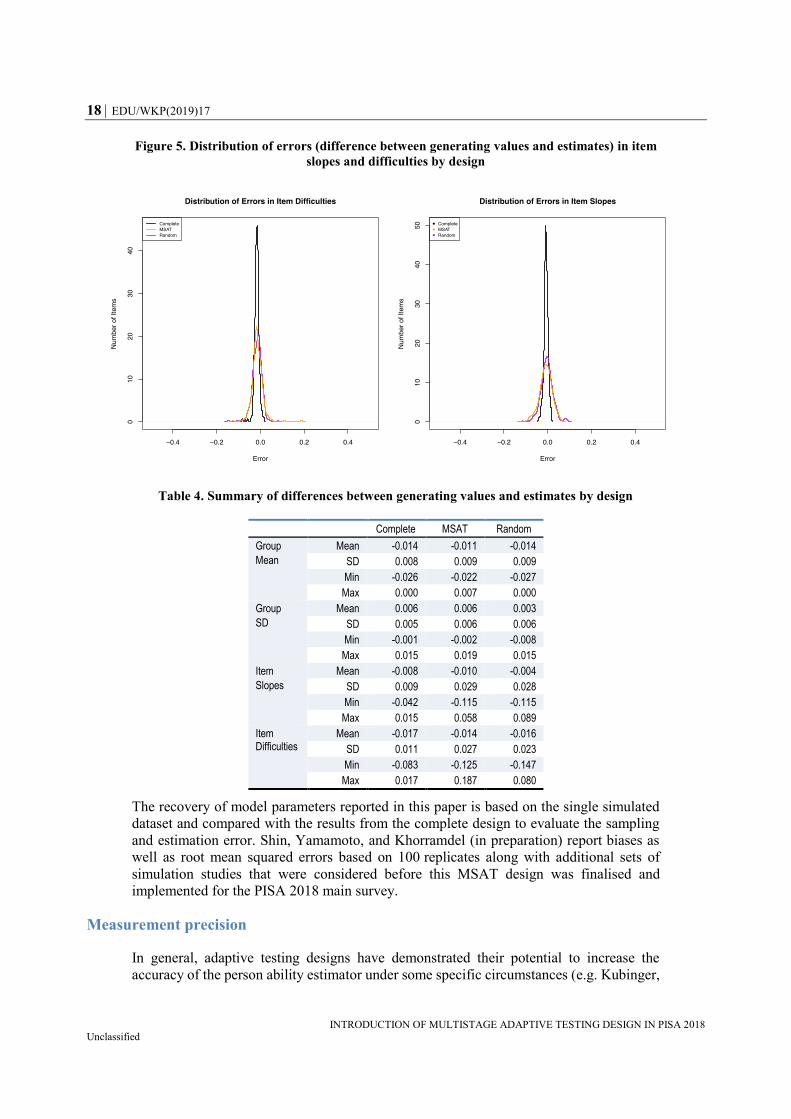
The MSAT design performed well in terms of the item parameter recovery. Figure 5
illustrates the distribution of errors in item difficulties and item slopes, respectively. As
expected, the complete design (black line) showed a very peaked distribution around zero,
suggesting that all of the item parameters were recovered quite well with minimal
estimation errors. Under the random (purple line) and MSAT (yellow line) designs, the
errors were more dispersed between -0.1 and 0.2. In particular, a couple of items that had
relatively large error also had very low slope parameters as generating values (<0.5), which
made it difficult to recover the item parameters well.
Figure 4. Distribution of errors (differences between generating values and estimates) in
latent ability distribution parameters by design.
18 EDU/WKP(2019)17
INTRODUCTION OF MULTISTAGE ADAPTIVE TESTING DESIGN IN PISA 2018 Unclassified
Figure 5. Distribution of errors (difference between generating values and estimates) in item
slopes and difficulties by design
Table 4. Summary of differences between generating values and estimates by design
Complete MSAT Random
Group
Mean
Mean -0.014 -0.011 -0.014
SD 0.008 0.009 0.009
Min -0.026 -0.022 -0.027
Max 0.000 0.007 0.000
Group
SD
Mean 0.006 0.006 0.003
SD 0.005 0.006 0.006
Min -0.001 -0.002 -0.008
Max 0.015 0.019 0.015
Item
Slopes
Mean -0.008 -0.010 -0.004
SD 0.009 0.029 0.028
Min -0.042 -0.115 -0.115
Max 0.015 0.058 0.089
Item Difficulties
Mean -0.017 -0.014 -0.016
SD 0.011 0.027 0.023
Min -0.083 -0.125 -0.147
Max 0.017 0.187 0.080
The recovery of model parameters reported in this paper is based on the single simulated
dataset and compared with the results from the complete design to evaluate the sampling
and estimation error. Shin, Yamamoto, and Khorramdel (in preparation) report biases as
well as root mean squared errors based on 100 replicates along with additional sets of
simulation studies that were considered before this MSAT design was finalised and
implemented for the PISA 2018 main survey.
Measurement precision
In general, adaptive testing designs have demonstrated their potential to increase the
accuracy of the person ability estimator under some specific circumstances (e.g. Kubinger,
EDU/WKP(2019)17 19
INTRODUCTION OF MULTISTAGE ADAPTIVE TESTING DESIGN IN PISA 2018 Unclassified
2016; Weiss, 1982). As a simple summary of measurement precision that includes both the
location of the test information and that of the ability distribution, the IRT reliabilities using
expected a posteriori (EAP) estimates (van Rijn, 2014) were calculated for each design
condition. The complete design resulted in IRT reliability of 0.986, and corresponding IRT
reliability measures were 0.924 for the MSAT design and 0.918 for the random design.
Further, the precision of the person ability estimator was evaluated using the standard errors
associated with the weighted likelihood estimates (Warm, 1989). In order to quantify the
expected gains in measurement precision by design, the proportions of standard error of
each design were calculated against the operational benchmark (random design), following
the equation below with 70 quadrature points (Q=70) between -3 and 3 (corresponding
PISA Reading scales range from 3 to about 911), where q indicates each quadrature point,
P_q (θ) indicates the density of students at each quadrature point, SE(Design)q stands for
the standard error for each quadrature point for a given design, and SE(RR)q represents
standard error for each quadrature point under the baseline random design:
𝐸(𝐺𝑎𝑖𝑛𝐷𝑒𝑠𝑖𝑔𝑛) = ∑𝑆𝐸(𝑅𝑅)𝑞 − 𝑆𝐸(𝐷𝑒𝑠𝑖𝑔𝑛)𝑞
𝑆𝐸(𝑅𝑅)𝑞
𝑄
𝑞=1
𝑃𝑞(𝜃).
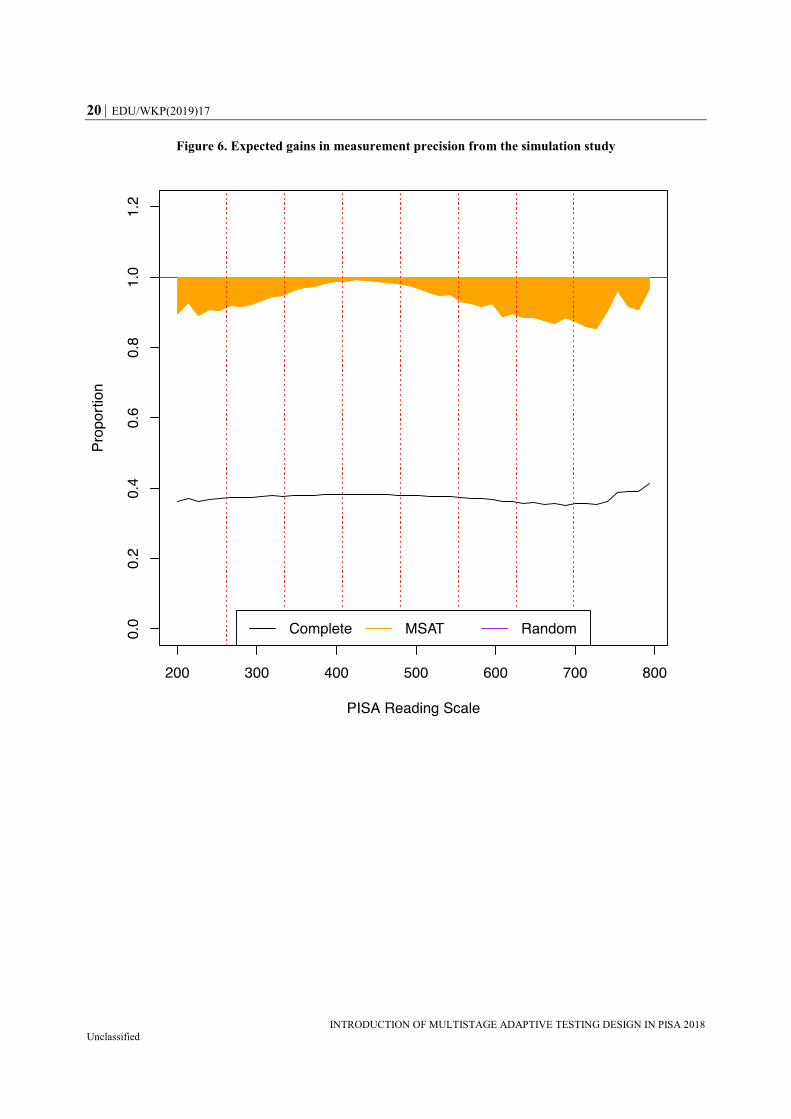
The expected gains in precision were averaged over the PISA scale scores between 200 and
800 where sufficient sample sizes were observed. The gain of complete design was about
62% compared to the random design, keeping in mind that the complete design is neither
realistic nor feasible in a population survey. The MSAT design implemented in the
PISA 2018 main survey showed about a 4.5% precision gain on average. The MSAT
contributed to the accuracy of the person ability estimator across all scale scores, in
particular at the extreme performance levels of lower than 300 and over 700 with around
10% higher accuracy. The orange-coloured area in Figure 6 shows the proportions of SE,
SE(Design)/SE(RR), at given PISA scale scores.
Note that 4.5% is the hypothetical gain for the expected distribution, and each country
would have slightly different gains depending on its ability distribution (i.e. middle-
performing countries would have smaller gains, but high- or low-performing countries
would have greater gains). This especially helps to improve the accuracy of proficiency
estimation of both extremely high- and low-performing students within countries, as well
as high- and low-performing countries in general. Although the expected 4.5% precision
gain of the MSAT design appears low compared to the expectations from PIAAC or the
previous literature, it should be noted that the MSAT design for PISA was chosen not only
to improve measurement precision but also to ensure a satisfactory level of model
parameter recovery, controlling for a possible item position effect. As studied by Shin et al.
(in preparation), if the more adaptive Design A could be used assuming absence of any
item position effect (without Design B), precision gains would be expected to be as high
as 7%.
20 EDU/WKP(2019)17
INTRODUCTION OF MULTISTAGE ADAPTIVE TESTING DESIGN IN PISA 2018 Unclassified
Figure 6. Expected gains in measurement precision from the simulation study
EDU/WKP(2019)17 21
INTRODUCTION OF MULTISTAGE ADAPTIVE TESTING DESIGN IN PISA 2018 Unclassified
4. Summary and conclusion
MSAT designs in ILSA were introduced with the aim of providing more accurate and
efficient measures, given the heterogeneous characteristics of the participating groups and
individuals, and the number and type of items (automatically vs. human scored) needed to
represent the full construct. With these constraints, the MSAT was designed and studied
based on simulated data from the field trial and discussed with the PISA Technical
Advisory Group that includes international scientists and experts in the fields of statistics
and psychometrics. This paper describes and evaluates the final MSAT design that was
implemented in the PISA 2018 main survey for the Reading domain. The unique feature of
the PISA MSAT design was the testlet-level adaptive tests of different item types through
the use of parallel sets to better match a student’s ability while accommodating a large item
pool to ensure appropriate domain coverage across all proficiency levels.
Through a simulation study, the performance of the MSAT design was examined and
compared in terms of model parameter recovery and precision of the person proficiencies.
In summary, the MSAT design utilised in PISA 2018 main survey demonstrated an
increased precision of 4.5% on average, with acceptable errors in item parameter
estimation. The simulation result was based on a single set of generated data, so further
investigation would be necessary (Shin, et al., in preparation). Based on a single simulated
dataset, it was clear that the MSAT design contributed to the accuracy of the person ability
estimator across all PISA Reading scale scores, with more gains in precision at the extreme
performance levels. This suggests the possibility of more efficient survey instrument
administration without country-level adaptations.
In the future, more simulation studies that examine the robustness of MSAT designs in
PISA could be conducted – for example, effects of the item-by-country interactions and
omission rates – to establish safeguards against potential threats to validity. Also, more
flexible and optimised test assembly can be studied through automatizing the assembly
process (e.g. van der Linden, 2006) and relaxing some constraints.
22 EDU/WKP(2019)17
INTRODUCTION OF MULTISTAGE ADAPTIVE TESTING DESIGN IN PISA 2018 Unclassified
5. References
Bock, R. D., & Zimowski, M. F. (1997). Multiple group IRT. In W. J. van der Linden & R. K.
Hambleton (Eds.), Handbook of modern item response theory (pp. 433–448). New York,
NY: Springer-Verlag.
Chen, H., Yamamoto, K., & von Davier, M. (2014). Controlling MST exposure rates in
international large-scale assessments. In D. Yan, A. A. von Davier, & C. Lewis (Eds.).
Computerized multistage testing: Theory and applications (pp. 391–409). Boca Raton,
FL: Chapman and Hall/CRC.
Eggen, T. J., & Verhelst, N. D. (2011). Item calibration in incomplete testing designs. Psicológica,
32(1), 107–132.
Glas, C. A. W. (1988). The Rasch model and multistage testing. Journal of Educational Statistics,
13, 45–52.
Jewsbury, P. A., & van Rijn, P. W. (in press). IRT and MIRT models for multidimensional
multistage tests. Journal of Educational and Behavioral Statistics.
Khorramdel, L., Shin, H., & von Davier, M. (2019). GDM Software mdltm including parallel EM
algorithm. In M. von Davier, & Y. S. Lee (Eds.), Handbook of diagnostic classification
models (pp. 603–628). Cham, Switzerland: Springer.
Kubinger, K. (2016). Adaptive testing. In K. Schweizer & C. DiStefano (Eds.), Principles and
methods of test construction (Chapter 6). Boston, MA: Hogrefe Publishing.
Messick, S. J., Beaton, A. E., & Lord, F. M. (1983). NAEP reconsidered: A new design for a new
era (NAEP Report No. 83-1). Princeton, NJ: Educational Testing Service.
Mislevy, R. J., & Wu, P. K. (1996). Missing responses and IRT ability estimation: Omits, choice,
time limits, and adaptive testing. (Research Report No. RR-96-30-ONR). Princeton, NJ:
Educational Testing Service.
Muraki, E. (1992). A generalized partial credit model: Application of an EM algorithm. Applied
Psychological Measurement, 16, 159–177.
OECD (2013). Technical report of the Survey of Adult Skills (PIAAC), Ch. 17 (pp. 406–438).
Paris, France: OECD Publishing.
OECD (2017). PISA 2015 technical report. Paris, France: OECD Publishing.
Oranje, A., Mazzeo, J., Xu, X., & Kulick, E. (2014). A multistage testing approach to group-score
assessments. In D. Yan, A. A. von Davier, & C. Lewis (Eds.), Computerized multistage
testing: Theory and applications (pp. 371–390). Boca Raton, FL: Chapman and Hall/CRC.
Robin, F., Steffen, M., & Liang, L. (2014). The multistage test implementation of the GRE®
revised General Test. In D. Yan, A. A. von Davier & C. Lewis (Eds.), Computerized
multistage testing: Theory and applications (pp. 325–341). Boca Raton, FL: Chapman and
Hall/CRC.
EDU/WKP(2019)17 23
INTRODUCTION OF MULTISTAGE ADAPTIVE TESTING DESIGN IN PISA 2018 Unclassified
Shin, H., Yamamoto, K., & Khorramdel, L. (in preparation). Increasing the measurement
efficiency and accuracy of PISA through multistage adaptive testing design.
van der Linden, W. J. (2006). Linear models for optimal test design. New York: Springer
van Rijn, P. W. (2014). Reliability of multistage tests using item response theory. In D. Yan, A.
A. von Davier & C. Lewis (Eds.), Computerized multistage testing: Theory and
applications (pp. 251–263). Boca Raton, FL: Chapman and Hall/CRC.
von Davier, M. (2005). A general diagnostic model applied to language testing data (Research
Report No. RR-05-16). Princeton, NJ: Educational Testing Service.
Wainer, H., Bradlow, E. T., & Wang, X. (2007). Testlet response theory and its applications. New
York, NY: Cambridge University Press.
Wainer, H., & Kiely, G. L. (1987). Item clusters and computerized adaptive testing: A case for
testlets. Journal of Educational Measurement, 24(3), 185–201.
https://doi.org/10.1111/j.1745-3984.1987.tb00274.x
Warm, T. A. (1989). Weighted likelihood estimation of ability in item response theory.
Psychometrika, 54, 427–450.
Weiss, D. J. (1982). Improving measurement quality and efficiency with adaptive testing. Applied
Psychological Measurement, 6(4), 473–492.
Yamamoto, K., Khorramdel, L., & Shin, H. (2018a). Introducing multistage adaptive testing into
international large-scale assessments designs using the example of PIAAC. Psychological
Test and Assessment Modeling, 60, 347–368.
Yamamoto, K., Shin, H., & Khorramdel, L. (2018b). Multistage adaptive testing design in
international large-scale assessments. Educational Measurement: Issues and Practice, 37,
16–27.
Zenisky, A., Hambleton, R.K., & Luecht, R. (2010). Multistage testing: issues, designs and
research. In W. J. Van der Linden & C. A. W. Glas (Eds.), Elements of adaptive testing
(pp. 355–372). Berlin, Germany: Springer.
24 EDU/WKP(2019)17
INTRODUCTION OF MULTISTAGE ADAPTIVE TESTING DESIGN IN PISA 2018 Unclassified
Annex A.
Table A.1. Overview of the Adaptive Process for the Standard Design (Design A) that Connects Core> Stage 1> Stage 2
64 Paths in Total, Applicable to 75% of Students
Core Testlets
Number of Auto-Scored Items
Process of Selecting Testlets in the Stage 1
Core + Stage 1 Testlets
Number of Auto-Scored Items
Process of Selecting Testlets in the Stage 2
Testlets in Stage 2
Low Level Medium Level High Level Low Level Medium Level High Level
(90% to L; 10% to H in Stage 1)
(50% to L; 50% to H in Stage 1)
(10% to L; 90% to H in Stage 1)
(90% to L; 10% to H in Stage 1)
(50% to L; 50% to H in Stage 1)
(10% to L; 90% to H in Stage 1)
Number Correct Number Correct
RC1 9 0 – 3 4 – 6 7 – 9
A: RC1, R11H 20 0 – 7 8 – 13 14 – 20
R21L or R21H A: RC1, R15H 19 0 – 7 8 – 13 14 – 19
A: RC1, R11L 18 0 – 9 10 – 14 15 – 18 R22L or R22H
A: RC1, R15L 18 0 – 9 10 – 14 15 – 18
RC2 7 0 – 2 3 – 5 6 – 7
A: RC2, R12H 16 0 – 6 7 – 11 12 – 16
R23L or R23H
A: RC2, R16H 16 0 – 6 7 – 12 13 – 16
A: RC2, R12L 16 0 – 6 7 – 11 12 – 16 R24L or R24H
A: RC2, R16L 17 0 – 9 10 – 13 14 – 17
RC3 7 0 – 2 3 – 5 6 – 7 A: RC3, R13H 16 0 – 7 8 – 11 12 – 16
R25L or R25H
EDU/WKP(2019)17 25
INTRODUCTION OF MULTISTAGE ADAPTIVE TESTING DESIGN IN PISA 2018 Unclassified
Core Testlets
Number of Auto-Scored Items
Process of Selecting Testlets in the Stage 1
Core + Stage 1 Testlets
Number of Auto-Scored Items
Process of Selecting Testlets in the Stage 2
Testlets in Stage 2
Low Level Medium Level High Level Low Level Medium Level High Level
(90% to L; 10% to H in Stage 1)
(50% to L; 50% to H in Stage 1)
(10% to L; 90% to H in Stage 1)
(90% to L; 10% to H in Stage 1)
(50% to L; 50% to H in Stage 1)
(10% to L; 90% to H in Stage 1)
Number Correct Number Correct
A: RC3, R17H 17 0 – 7 8 – 12 13 – 17 A: RC3, R13L 16 0 – 7 8 – 12 13 – 16
R26L or R26H A: RC3, R17L 17 0 – 9 10 – 14 15 – 17
RC4 9 0 – 3 4 – 7 8 – 9
A: RC4, R14H 19 0 – 8 9 – 13 14 – 19
R27L or R27H
A: RC4, R18H 17 0 – 6 7 – 11 12 – 17
A: RC4, R14L 17 0 – 8 9 – 13 14 – 17 R28L or R28H
A: RC4, R18L 17 0 – 7 8 – 13 14 – 17
RC5 7 0 – 3 4 – 5 6 – 7
A: RC5, R11H 18 0 – 7 8 – 12 13 – 18
R21L or R21H
A: RC5, R15H 17 0 – 7 8 – 12 13 – 17
A: RC5, R11L 16 0 – 9 10 – 13 14 – 16 R22L or R22H
A: RC5, R15L 16 0 – 8 9 – 13 14 – 16
RC6 9 0 – 2 3 – 6 7 – 9
A: RC6, R12H 18 0 – 6 7 – 12 13 – 18
R23L or R23H
A: RC6, R16H 18 0 – 7 8 – 13 14 – 18
A: RC6, R12L 18 0 – 6 7 – 13 14 – 18 R24L or R24H
A: RC6, R16L 19 0 – 9 10 – 15 16 – 19
RC7 8 0 – 2 3 – 6 7 – 8 A: RC7, R13H 17 0 – 7 8 – 12 13 – 17 R25L or R25H
26 EDU/WKP(2019)17
INTRODUCTION OF MULTISTAGE ADAPTIVE TESTING DESIGN IN PISA 2018 Unclassified
Core Testlets
Number of Auto-Scored Items
Process of Selecting Testlets in the Stage 1
Core + Stage 1 Testlets
Number of Auto-Scored Items
Process of Selecting Testlets in the Stage 2
Testlets in Stage 2
Low Level Medium Level High Level Low Level Medium Level High Level
(90% to L; 10% to H in Stage 1)
(50% to L; 50% to H in Stage 1)
(10% to L; 90% to H in Stage 1)
(90% to L; 10% to H in Stage 1)
(50% to L; 50% to H in Stage 1)
(10% to L; 90% to H in Stage 1)
Number Correct Number Correct
A: RC7, R17H 18 0 – 8 9 – 13 14 – 18 A: RC7, R13L 17 0 – 8 9 – 13 14 – 17
R26L or R26H
A: RC7, R17L 18 0 – 9 10 – 14 15 – 18
RC8 8 0 – 3 4 – 6 7 – 8
A: RC8, R14H 18 0 – 7 8 – 13 14 – 18
R27L or R27H
A: RC8, R18H 16 0 – 6 7 – 11 12 – 16
A: RC8, R14L 16 0 – 8 9 – 13 14 – 16 R28L or R28H
A: RC8, R18L 16 0 – 7 8 – 12 13 – 16
EDU/WKP(2019)17 27
INTRODUCTION OF MULTISTAGE ADAPTIVE TESTING DESIGN IN PISA 2018 Unclassified
Table A.2. Overview of the Adaptive Process for the Alternative Design (Design B) that Connects Core>Stage 2>Stage 1 (128 Paths in
Total, Applicable to 25% of Students)
Core Testlets
Number of Auto-Scored Items
Process of Selecting Testlets in the First Stage
Core + First Stage Testlets
Number of Auto-Scored
Items
Process of Selecting Testlets in the Second Stage
Testlets in Second Stage
Low Level Medium Level High Level Low Level Medium
Level High Level
(90% to L; 10% to H in Stage 1)
(50% to L; 50% to H in Stage 1)
(10% to L; 90% to H in Stage 1)
(90% to L; 10% to H in Stage 1)
(50% to L; 50% to H in Stage 1)
(10% to L; 90% to H in Stage 1)
Number Correct Number Correct
RC1 9 0 – 3 4 – 6 7 – 9
A: RC1, R21H 20 0 – 7 8 – 13 14 – 20
R11L or
R15L or
R11H or
R15H A: RC1, R22H 16 0 – 7 8 – 12 13 – 16
A: RC1, R21L 16 0 – 7 8 – 12 13 – 16 R11L or
R15L or
R11H or
R15H A: RC1, R22L 19 0 – 9 10 – 15 16 – 19
RC2 7 0 – 2 3 – 5 6 – 7
A: RC2, R23H 18 0 – 7 8 – 12 13 – 18
R12L or
R16L or
R12H or
R16H A: RC2, R24H 17 0 – 7 8 – 13 14 – 17
A: RC2, R23L 17 0 – 8 9 – 13 14 – 17 R12L
or R16L
or R12H
or R16H A: RC2, R24L 13 0 – 6 7 – 10 11 – 13
RC3 7 0 – 2 3 – 5 6 – 7
A: RC3, R25H 17 0 – 6 7 – 11 12 – 17
R13L or
R17L or
R13H or
R17H A: RC3, R26H 14 0 – 5 6 – 10 11 – 14
A: RC3, R25L 14 0 – 5 6 – 10 11 – 14 R13L or R13H
28 EDU/WKP(2019)17
INTRODUCTION OF MULTISTAGE ADAPTIVE TESTING DESIGN IN PISA 2018 Unclassified
Core Testlets
Number of Auto-Scored Items
Process of Selecting Testlets in the First Stage
Core + First Stage Testlets
Number of Auto-Scored
Items
Process of Selecting Testlets in the Second Stage
Testlets in Second Stage
Low Level Medium Level High Level Low Level Medium
Level High Level
(90% to L; 10% to H in Stage 1)
(50% to L; 50% to H in Stage 1)
(10% to L; 90% to H in Stage 1)
(90% to L; 10% to H in Stage 1)
(50% to L; 50% to H in Stage 1)
(10% to L; 90% to H in Stage 1)
Number Correct Number Correct
A: RC3, R26L 19 1 – 10 11 – 15 16 – 19 or R17L
or R17H
RC4 9 0 – 3 4 – 7 8 – 9
A: RC4, R27H 19 0 – 8 9 – 13 14 – 19
R14L or
R18L or
R14H or
R18H A: RC4, R28H 15 0 – 6 7 – 10 11 – 15
A: RC4, R27L 15 0 – 6 7 – 11 12 – 15 R14L or
R18L or
R14H or
R18H A: RC4, R28L 17 0 – 9 10 – 14 15 – 17
RC5 7 0 – 3 4 – 5 6 – 7
A: RC5, R21H 18 0 – 7 8 – 12 13 – 18
R11L or
R15L or
R11H or
R15H A: RC5, R22H 14 0 – 7 8 – 12 13 – 14
A: RC5, R21L 14 0 – 7 8 – 11 12 – 14 R11L or
R15L or
R11H or
R15H A: RC5, R22L 17 0 – 9 10 – 14 15 – 17
RC6 9 0 – 2 3 – 6 7 – 9
A: RC6, R23H 20 0 – 7 8 – 13 14 – 20
R12L or
R16L or
R12H or
R16H A: RC6, R24H 19 0 – 8 9 – 14 15 – 19
A: RC6, R23L 19 0 – 8 9 – 14 15 – 19 R12L or
R16L or
R12H or
R16H A: RC6, R24L 15 0 – 6 7 – 11 12 – 15
RC7 8 0 – 2 3 – 6 7 – 8 A: RC7, R25H 18 0 – 6 7 – 12 13 – 18 R13L or R13H
EDU/WKP(2019)17 29
INTRODUCTION OF MULTISTAGE ADAPTIVE TESTING DESIGN IN PISA 2018 Unclassified
Core Testlets
Number of Auto-Scored Items
Process of Selecting Testlets in the First Stage
Core + First Stage Testlets
Number of Auto-Scored
Items
Process of Selecting Testlets in the Second Stage
Testlets in Second Stage
Low Level Medium Level High Level Low Level Medium
Level High Level
(90% to L; 10% to H in Stage 1)
(50% to L; 50% to H in Stage 1)
(10% to L; 90% to H in Stage 1)
(90% to L; 10% to H in Stage 1)
(50% to L; 50% to H in Stage 1)
(10% to L; 90% to H in Stage 1)
Number Correct Number Correct
A: RC7, R26H 15 0 – 6 7 – 11 12 – 15
or R17L
or R17H
A: RC7, R25L 15 0 – 5 6 – 10 11 – 15 R13L
or R17L
or R13H
or R17H A: RC7, R26L 20 0 – 10 11 – 16 17 – 20
RC8 8 0 – 3 4 – 6 7 – 8
A: RC8, R27H 18 0 – 7 8 – 13 14 – 18
R14L or
R18L or
R14H or
R18H A: RC8, R28H 14 0 – 5 6 – 10 11 – 14
A: RC8, R27L 14 0 – 6 7 – 10 11 – 14 R14L or
R18L or
R14H or
R18H A: RC8, R28L 16 0 – 9 10 – 13 14 – 16