Embed Size (px)
Citation preview

Please refer to important disclosures and analyst certification information on pages 11-13 of this report.
July 22, 2005
Regional Banks Equity Research
Introduction of KBW Regional Banking Index and KBW Mortgage Finance Index
KBW expanded its family of indices by adding two new indices: the KBW Regional Banking Index (KRX-$99.95) and the KBW Mortgage Finance Index (MFX-$100.30).
On July 26, options on these indices will begin trading on the Philadelphia Stock Exchange (PHLX) under the tickers KRX and MFX.
The existing family of KBW indices includes the KBW Bank Index (BKX- $101.42), the KBW Insurance Index (KIX-$145.15), and the KBW Capital Markets Index (KSX-$243.57).
The indices are designed as benchmarks for the investor and institutional community and as a tool for traders and institutional money managers to manage risk by using options to hedge exposure and to anticipate and respond to fundamental shifts in the Financial Services industry.
Siddharth Jain 212-887-3835 [email protected]
Industry Opinion:
The KBW family of tradable indices was developed to help investors track the performance of the Banking, Broker/Dealer-Asset Management, Insurance, and Mortgage Finance sectors within the Financial Services industry. Given the flexibility of trading sector index options on the Philadelphia Stock Exchange, the indices can now be used to hedge exposure to these sub-sectors of the industry.

July 22, 2005
Please refer to important disclosures and analyst certification information on pages 11-13 of this report. - 2 -
Composition of the New KBW Indices
KBW Regional Banking Index is a float-adjusted, equal-weighted index designed to effectively represent the performance of the broad and diverse U.S. Regional Banking industry.
In fact, the 50 companies that comprise the index (see Appendix A-1) represent the mid-cap sector ($1-10 billion) of the entire U.S. Regional Banking universe. This representation is achieved through the inclusion of institutions from all regions of the United States. (See Exhibit 1.)
Exhibit 1: KRX Regional Presence
NE28%
SE/SW24%
MW26%
WE22%
Source: SNL and KBW research.
KBW Mortgage Finance Index is a float-adjusted modified capitalization-weighted index designed to effectively represent the performance of the broad and diverse U.S. Mortgage Finance industry. In fact, the 24 companies that comprise the index (see Appendix A-2) account for a large portion of the market capitalization of the entire U.S. Mortgage Finance universe. This representation is achieved through the inclusion of major companies in the industry. In addition, the companies comprising the MFX were selected to provide appropriate representation of the industry's diverse sub-sectors, including pure mortgage players, mortgage insurers, title insurers, and banks and thrifts that have considerable mortgage loan portfolios in the United States.
Index Description

July 22, 2005
Please refer to important disclosures and analyst certification information on pages 11-13 of this report. - 3 -
The above indices serve as benchmarks for the investor and institutional community and can be used as a tool for traders and institutional money managers to manage risk by using options to hedge exposure and to anticipate and respond to fundamental shifts in mortgage finance-sensitive companies or regional banks and thrifts across the United States in the Financial Services industry. To ensure that the composition is highly representative of the Financial Services industry, KBW evaluates the indices at least annually.
Performance of the KBW Family of Tradable Indices in 2005
The contract volume year to date has increased by 18% to 565,331 contracts from 478,254 contracts for the similar period in 2004. (See Exhibit 2.)
The KBW Bank Index now ranks #2 (year-to-date July 2005) among listed sector index options by open interest on the Philadelphia Stock Exchange, up from #4 at year-end 2004. Open interest in the BKX at the PHLX has increased to 107,828 year to date from 21,152 contracts at year-end 2004.
Exhibit 2: Performance of KBW Indices by Volume and Open Interest, 2003-05
KBW Indices Contract Volume
612
2114 13 10 8
3017
54
198
7868
3446
96 95
117
55
101
55
-
50
100
150
200
Jan Feb Mar Apr May Jun Jul
Thousands
2003 2004 2005
Note: Data as of the close of markets on July 20, 2005 and BKX split 10:1 in March 2004.
Source: The Options Clearing Corporation and KBW research.
Indices Serve as Benchmarks….
BKX Ranks #2

July 22, 2005
Please refer to important disclosures and analyst certification information on pages 11-13 of this report. - 4 -
KBW develops and maintains indices that seek to replicate certain market, industry and geographic segments. In doing so, KBW will select publicly traded companies, or other publicly visible and quantifiable variables, that it deems appropriate for the purpose of constituting a certain segment. For indices comprised of publicly traded companies, index constituents will be chosen on the basis of relevance to the market sector in question and, after due consideration, on certain trading criteria, including but not limited to stock price, stock price volatility, stock price correlation to index price, average daily trading volume, optionability of stock, market capitalization, country of origin, listed exchange, and perceived viability of listed company. Such metrics are necessary to ensure that the chosen constituents are not only reflective of the intended market segment, but are also tradable – i.e., they provide sufficient liquidity to enable market participants to effect basket trades for purposes of hedging, etc. Specific quantitative bounds will be followed for the above criteria (as guided by the relevant exchange rules). KBW product development and corporate research staff will consider these boundaries to ensure that the constituents are both representative and tradable. Specifically, the indices will be designed and maintained so that financial instruments based on them will be in compliance with necessary listing/maintenance criteria dictated by subsections (b) and (c) of Rule 1009A (Designation of the Index) on the Philadelphia Stock Exchange. Component securities that fail to meet these standards will be replaced within the index according to the above described policies and procedures.
Periodic Component Adjustments
In the event that there is a change in the nature of any component stock in the index that will change the overall market character of the index (e.g., delisting, merger, acquisition, change of principal business, or otherwise), KBW will take appropriate steps to remove the stock or replace it with another stock that would best represent the intended market character of the index. Companies that are the target of a merger or acquisition that will change the market character of the index will be removed or replaced as close as practicable to the announced or effective date of the transaction. Companies that have filed for bankruptcy will be removed or replaced as soon as practicable after such filing has occurred. Corporate restructuring will be analyzed on a case-by-case basis to determine the appropriate action to be taken. KBW reserves the authority to add one or more index-eligible stocks on a quarterly basis, or alternatively to remove any component stock on a quarterly basis if it believes such stock no longer provides adequate representation of the Regional Banking or Mortgage Finance securities, or no longer maintains the character of the index. In the case of a stock removal, KBW may choose to replace such stock with an index-eligible stock at any time, but it is not required to do so.
Component Eligibility and
Inclusion

July 22, 2005
Please refer to important disclosures and analyst certification information on pages 11-13 of this report. - 5 -
Calculation Methodology
MFX is calculated as a float-adjusted, modified market capitalization-weighted index, meaning that each of the component stocks represented in the index is equal to its float-adjusted shares outstanding (i.e., shares outstanding less the internal holdings) times its current stock price quoted on the NASDAQ/NMS or the NYSE. Float-adjusted modified market capitalization weighting is achieved through quarterly rebalancing (as described below). The four largest stocks, currently Fannie Mae, Freddie Mac, Washington Mutual, and Countrywide Financial, will be assigned maximum initial weights equal to the lesser of their actual capitalization weight or 10% in the reconstituted index. All other stocks with a capitalization weight of more than 5.0% will be assigned initial weights of 4.5% in the reconstituted index. All banks with capitalization weights under 4.5% will share equally in the weight available for redistribution, but none of these banks will be assigned an initial weight of more than 4.5%. Based on capitalizations as of the close on the Monday before the third Saturday of the last month in each calendar quarter, the MFX Index re-balancing will be calculated according to the following rules: • If any of the top four institutions’ index weightings have increased beyond 12.5%,
their weighting will be reduced to a maximum of 10% in the quarterly rebalancing.
• If any of the remaining institutions’ weightings have increased beyond 5%, their weightings will be reduced to a maximum of 4.5% in the rebalancing.
• If any of the top four institutions’ weightings have dropped below 8%, their weightings will be increased to the lesser of their float-adjusted capitalization weight or 10% in the rebalancing.
• If any of the institutions with unadjusted capitalization weights greater than 5% have declined in index weighting below 4%, their weightings will be increased to 4.5% in the rebalancing.
• Any excess weighting available will be reallocated to the smaller institutions and any weighting needed to increase weighting in the larger institutions will be taken from the smaller institutions in the same manner as in the initial allocation at the time of the rebalancing.
• The rebalancing will be implemented at the close on the Friday before the third Saturday of the last month in each calendar quarter.
• Index value = 1/divisor*SUM (Price(i) * index shares (i))
Calculation of the MFX Index

July 22, 2005
Please refer to important disclosures and analyst certification information on pages 11-13 of this report. - 6 -
KRX is calculated as an equal-weighted index, meaning that each of the component stocks represented in the index has an equal weight and equal market capitalization and thus we calculate the new shares outstanding by dividing the equal market capitalization by its current stock price quoted on the NASDAQ/NMS or the NYSE. Equal market capitalization weighting is achieved through quarterly rebalancing (as described below). All the stocks are assigned maximum initial weights equal to the lesser of their actual capitalization weight or 2% in the reconstituted index. Based on capitalizations as of the close on the Monday before the third Saturday of the last month in each calendar quarter, the KRX Index re-balancing will be calculated according to the following rules: • If any of the institutions’ index weightings have increased beyond 3.0%, their
weighting will be reduced to a maximum of 2.0% in the quarterly rebalancing.
• If any of the institutions’ index weightings have dropped below 1.0%, their weightings will be increased to 2.0% in the rebalancing.
• Any excess weighting available will be reallocated to the smaller institutions and any weighting needed to increase weighting in the larger institutions will be taken from the smaller institutions in the same manner as in the initial allocation at the time of the rebalancing.
• The rebalancing will be implemented at the close on the Friday before the third Saturday of the last month in each calendar quarter.
• Index value = 1/divisor*SUM (Price(i) * index shares (i))
Calculation of the KRX Index
July 22, 2005
Please refer to important disclosures and analyst certification information on pages 11-13 of this report. - 7 -
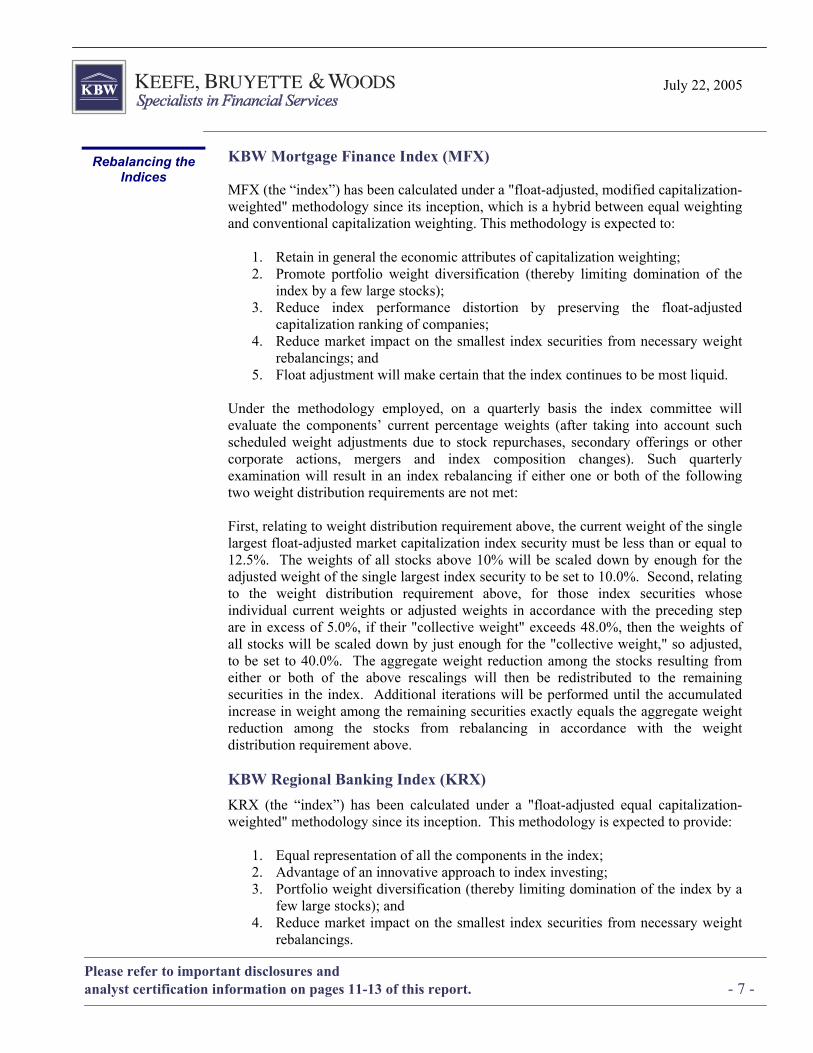
KBW Mortgage Finance Index (MFX)
MFX (the “index”) has been calculated under a "float-adjusted, modified capitalization-weighted" methodology since its inception, which is a hybrid between equal weighting and conventional capitalization weighting. This methodology is expected to:
1. Retain in general the economic attributes of capitalization weighting; 2. Promote portfolio weight diversification (thereby limiting domination of the
index by a few large stocks); 3. Reduce index performance distortion by preserving the float-adjusted
capitalization ranking of companies; 4. Reduce market impact on the smallest index securities from necessary weight
rebalancings; and 5. Float adjustment will make certain that the index continues to be most liquid.
Under the methodology employed, on a quarterly basis the index committee will evaluate the components’ current percentage weights (after taking into account such scheduled weight adjustments due to stock repurchases, secondary offerings or other corporate actions, mergers and index composition changes). Such quarterly examination will result in an index rebalancing if either one or both of the following two weight distribution requirements are not met: First, relating to weight distribution requirement above, the current weight of the single largest float-adjusted market capitalization index security must be less than or equal to 12.5%. The weights of all stocks above 10% will be scaled down by enough for the adjusted weight of the single largest index security to be set to 10.0%. Second, relating to the weight distribution requirement above, for those index securities whose individual current weights or adjusted weights in accordance with the preceding step are in excess of 5.0%, if their "collective weight" exceeds 48.0%, then the weights of all stocks will be scaled down by just enough for the "collective weight," so adjusted, to be set to 40.0%. The aggregate weight reduction among the stocks resulting from either or both of the above rescalings will then be redistributed to the remaining securities in the index. Additional iterations will be performed until the accumulated increase in weight among the remaining securities exactly equals the aggregate weight reduction among the stocks from rebalancing in accordance with the weight distribution requirement above. KBW Regional Banking Index (KRX) KRX (the “index”) has been calculated under a "float-adjusted equal capitalization-weighted" methodology since its inception. This methodology is expected to provide:
1. Equal representation of all the components in the index; 2. Advantage of an innovative approach to index investing; 3. Portfolio weight diversification (thereby limiting domination of the index by a
few large stocks); and 4. Reduce market impact on the smallest index securities from necessary weight
rebalancings.
Rebalancing the Indices

July 22, 2005
Please refer to important disclosures and analyst certification information on pages 11-13 of this report. - 8 -
Under the methodology employed, on a quarterly basis, the index committee will evaluate the components’ current percentage weights (after taking into account such scheduled weight adjustments due to stock repurchases, secondary offerings or other corporate actions, mergers and index composition changes). Such quarterly examination will result in an index rebalancing if either one or both of the following two weight distribution requirements are not met: First, if the current weight of the single largest index security exceeds 3.0%, the weights of all stocks above 2.0% will be scaled down by enough for the adjusted weight of the single largest index security to be set to 2.0%. Second, for those index securities whose individual current weights or adjusted weights in accordance with the preceding step are in excess of 2.5%, if their "collective weight" exceeds 48.0%, the weights of all stocks will be scaled down by just enough for the "collective weight," so adjusted, to be set to 40.0%. The aggregate weight reduction among the stocks resulting from either or both of the above rescalings will then be redistributed to the remaining securities in the index. Additional iterations will be performed until the accumulated increase in weight among the remaining securities exactly equals the aggregate weight reduction among the stocks from rebalancing in accordance with the weight distribution requirement above. Then, to complete the rebalancing procedure, once the final percent weights of each index security are set, the index share weights will be determined anew based upon the last sale prices and aggregate float-adjusted modified capitalization-weighted or equal capitalization-weighted based on the indexes at the close of trading on the Thursday in the week immediately preceding the week of the third Friday in March, June, September, and December. Changes to the index share weights will be made effective after the close of trading on the third Friday in March, June, September, and December and an adjustment to the divisor will be made to ensure continuity of the index.
July 22, 2005
Please refer to important disclosures and analyst certification information on pages 11-13 of this report. - 9 -
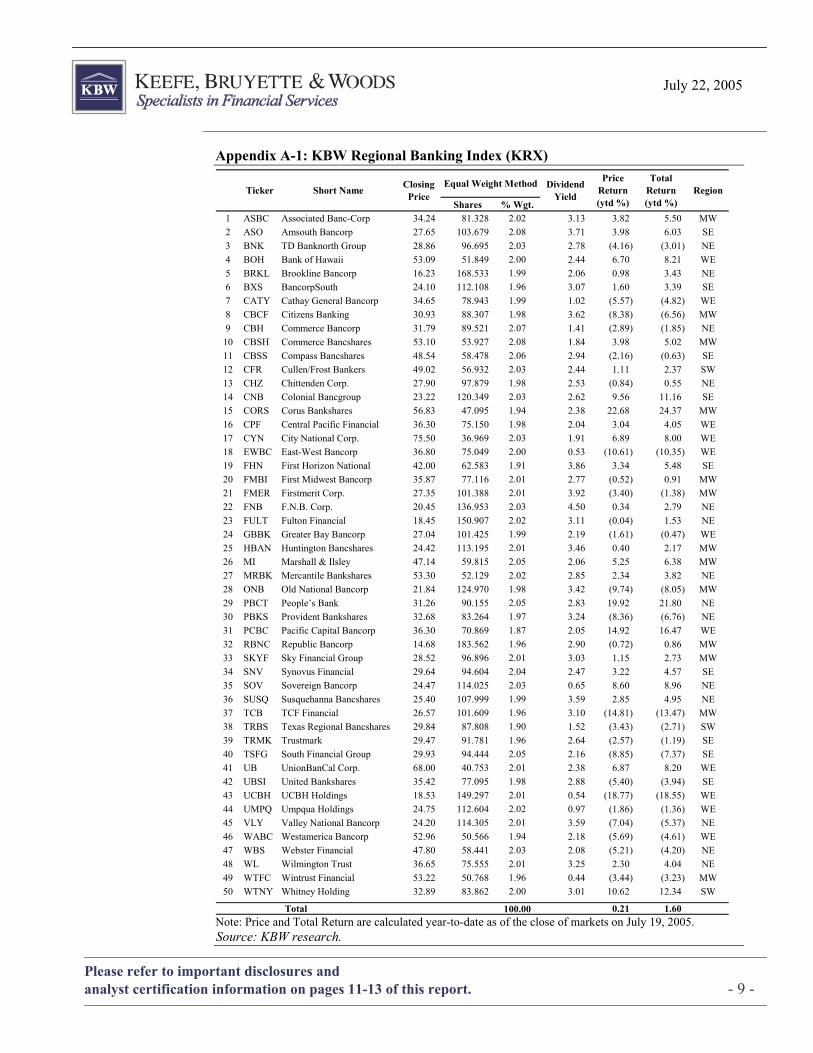
Appendix A-1: KBW Regional Banking Index (KRX)
Shares % Wgt.1 ASBC Associated Banc-Corp 34.24 81.328 2.02 3.13 3.82 5.50 MW2 ASO Amsouth Bancorp 27.65 103.679 2.08 3.71 3.98 6.03 SE3 BNK TD Banknorth Group 28.86 96.695 2.03 2.78 (4.16) (3.01) NE4 BOH Bank of Hawaii 53.09 51.849 2.00 2.44 6.70 8.21 WE5 BRKL Brookline Bancorp 16.23 168.533 1.99 2.06 0.98 3.43 NE6 BXS BancorpSouth 24.10 112.108 1.96 3.07 1.60 3.39 SE7 CATY Cathay General Bancorp 34.65 78.943 1.99 1.02 (5.57) (4.82) WE8 CBCF Citizens Banking 30.93 88.307 1.98 3.62 (8.38) (6.56) MW9 CBH Commerce Bancorp 31.79 89.521 2.07 1.41 (2.89) (1.85) NE
10 CBSH Commerce Bancshares 53.10 53.927 2.08 1.84 3.98 5.02 MW11 CBSS Compass Bancshares 48.54 58.478 2.06 2.94 (2.16) (0.63) SE12 CFR Cullen/Frost Bankers 49.02 56.932 2.03 2.44 1.11 2.37 SW13 CHZ Chittenden Corp. 27.90 97.879 1.98 2.53 (0.84) 0.55 NE14 CNB Colonial Bancgroup 23.22 120.349 2.03 2.62 9.56 11.16 SE15 CORS Corus Bankshares 56.83 47.095 1.94 2.38 22.68 24.37 MW16 CPF Central Pacific Financial 36.30 75.150 1.98 2.04 3.04 4.05 WE17 CYN City National Corp. 75.50 36.969 2.03 1.91 6.89 8.00 WE18 EWBC East-West Bancorp 36.80 75.049 2.00 0.53 (10.61) (10.35) WE19 FHN First Horizon National 42.00 62.583 1.91 3.86 3.34 5.48 SE20 FMBI First Midwest Bancorp 35.87 77.116 2.01 2.77 (0.52) 0.91 MW21 FMER Firstmerit Corp. 27.35 101.388 2.01 3.92 (3.40) (1.38) MW22 FNB F.N.B. Corp. 20.45 136.953 2.03 4.50 0.34 2.79 NE23 FULT Fulton Financial 18.45 150.907 2.02 3.11 (0.04) 1.53 NE24 GBBK Greater Bay Bancorp 27.04 101.425 1.99 2.19 (1.61) (0.47) WE25 HBAN Huntington Bancshares 24.42 113.195 2.01 3.46 0.40 2.17 MW26 MI Marshall & Ilsley 47.14 59.815 2.05 2.06 5.25 6.38 MW27 MRBK Mercantile Bankshares 53.30 52.129 2.02 2.85 2.34 3.82 NE28 ONB Old National Bancorp 21.84 124.970 1.98 3.42 (9.74) (8.05) MW29 PBCT People’s Bank 31.26 90.155 2.05 2.83 19.92 21.80 NE30 PBKS Provident Bankshares 32.68 83.264 1.97 3.24 (8.36) (6.76) NE31 PCBC Pacific Capital Bancorp 36.30 70.869 1.87 2.05 14.92 16.47 WE32 RBNC Republic Bancorp 14.68 183.562 1.96 2.90 (0.72) 0.86 MW33 SKYF Sky Financial Group 28.52 96.896 2.01 3.03 1.15 2.73 MW34 SNV Synovus Financial 29.64 94.604 2.04 2.47 3.22 4.57 SE35 SOV Sovereign Bancorp 24.47 114.025 2.03 0.65 8.60 8.96 NE36 SUSQ Susquehanna Bancshares 25.40 107.999 1.99 3.59 2.85 4.95 NE37 TCB TCF Financial 26.57 101.609 1.96 3.10 (14.81) (13.47) MW38 TRBS Texas Regional Bancshares 29.84 87.808 1.90 1.52 (3.43) (2.71) SW39 TRMK Trustmark 29.47 91.781 1.96 2.64 (2.57) (1.19) SE40 TSFG South Financial Group 29.93 94.444 2.05 2.16 (8.85) (7.37) SE41 UB UnionBanCal Corp. 68.00 40.753 2.01 2.38 6.87 8.20 WE42 UBSI United Bankshares 35.42 77.095 1.98 2.88 (5.40) (3.94) SE43 UCBH UCBH Holdings 18.53 149.297 2.01 0.54 (18.77) (18.55) WE44 UMPQ Umpqua Holdings 24.75 112.604 2.02 0.97 (1.86) (1.36) WE45 VLY Valley National Bancorp 24.20 114.305 2.01 3.59 (7.04) (5.37) NE46 WABC Westamerica Bancorp 52.96 50.566 1.94 2.18 (5.69) (4.61) WE47 WBS Webster Financial 47.80 58.441 2.03 2.08 (5.21) (4.20) NE48 WL Wilmington Trust 36.65 75.555 2.01 3.25 2.30 4.04 NE49 WTFC Wintrust Financial 53.22 50.768 1.96 0.44 (3.44) (3.23) MW50 WTNY Whitney Holding 32.89 83.862 2.00 3.01 10.62 12.34 SW
Total 100.00 0.21 1.60
Price Return (ytd %)
Total Return (ytd %)
RegionShort NameTicker Dividend Yield
Closing Price
Equal Weight Method
Note: Price and Total Return are calculated year-to-date as of the close of markets on July 19, 2005. Source: KBW research.
July 22, 2005
Please refer to important disclosures and analyst certification information on pages 11-13 of this report. - 10 -
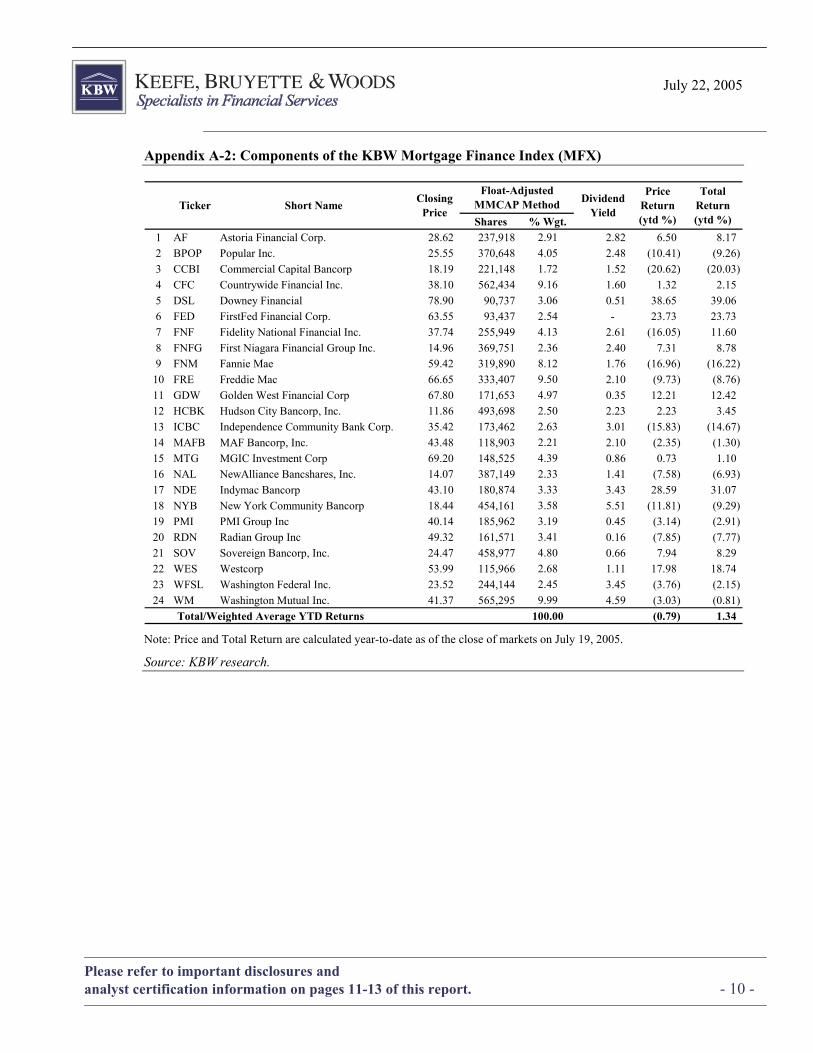
Appendix A-2: Components of the KBW Mortgage Finance Index (MFX)
Shares % Wgt.1 AF Astoria Financial Corp. 28.62 237,918 2.91 2.82 6.50 8.17 2 BPOP Popular Inc. 25.55 370,648 4.05 2.48 (10.41) (9.26) 3 CCBI Commercial Capital Bancorp 18.19 221,148 1.72 1.52 (20.62) (20.03) 4 CFC Countrywide Financial Inc. 38.10 562,434 9.16 1.60 1.32 2.15 5 DSL Downey Financial 78.90 90,737 3.06 0.51 38.65 39.06 6 FED FirstFed Financial Corp. 63.55 93,437 2.54 - 23.73 23.73 7 FNF Fidelity National Financial Inc. 37.74 255,949 4.13 2.61 (16.05) 11.60 8 FNFG First Niagara Financial Group Inc. 14.96 369,751 2.36 2.40 7.31 8.78 9 FNM Fannie Mae 59.42 319,890 8.12 1.76 (16.96) (16.22)
10 FRE Freddie Mac 66.65 333,407 9.50 2.10 (9.73) (8.76) 11 GDW Golden West Financial Corp 67.80 171,653 4.97 0.35 12.21 12.42 12 HCBK Hudson City Bancorp, Inc. 11.86 493,698 2.50 2.23 2.23 3.45 13 ICBC Independence Community Bank Corp. 35.42 173,462 2.63 3.01 (15.83) (14.67) 14 MAFB MAF Bancorp, Inc. 43.48 118,903 2.21 2.10 (2.35) (1.30) 15 MTG MGIC Investment Corp 69.20 148,525 4.39 0.86 0.73 1.10 16 NAL NewAlliance Bancshares, Inc. 14.07 387,149 2.33 1.41 (7.58) (6.93) 17 NDE Indymac Bancorp 43.10 180,874 3.33 3.43 28.59 31.07 18 NYB New York Community Bancorp 18.44 454,161 3.58 5.51 (11.81) (9.29) 19 PMI PMI Group Inc 40.14 185,962 3.19 0.45 (3.14) (2.91) 20 RDN Radian Group Inc 49.32 161,571 3.41 0.16 (7.85) (7.77) 21 SOV Sovereign Bancorp, Inc. 24.47 458,977 4.80 0.66 7.94 8.29 22 WES Westcorp 53.99 115,966 2.68 1.11 17.98 18.74 23 WFSL Washington Federal Inc. 23.52 244,144 2.45 3.45 (3.76) (2.15) 24 WM Washington Mutual Inc. 41.37 565,295 9.99 4.59 (3.03) (0.81)
Total/Weighted Average YTD Returns 100.00 (0.79) 1.34
Price Return (ytd %)
Total Return (ytd %)
Short NameTicker Dividend Yield
Closing Price
Float-Adjusted MMCAP Method
Note: Price and Total Return are calculated year-to-date as of the close of markets on July 19, 2005.
Source: KBW research.

July 22, 2005
Please refer to important disclosures and analyst certification information on pages 11-13 of this report. - 11 -
Analyst Certification
I, Siddharth Jain, hereby certify that the views expressed in this research report accurately reflect my personal views about the subject company and its securities. I also certify that I have not been, and will not be receiving direct or indirect compensation in exchange for expressing the specific recommendation in this report. Disclaimers The KBW Bank Index (BKX) is the property of Keefe, Bruyette & Woods, Inc. (KBW). KBW does not guarantee the accuracy or completeness of the Index, makes no express or implied warranties with respect to the Index and shall have no liability for any damages, claims, losses or expenses caused by errors in the index calculation. KBW makes no representation regarding the advisability of investing in options on the Index.
The KBW Insurance Index (KIX) is the property of Keefe, Bruyette & Woods, Inc. (KBW). KBW does not guarantee the accuracy or completeness of the Index, makes no express or implied warranties with respect to the Index and shall have no liability for any damages, claims, losses or expenses caused by errors in the index calculation. KBW makes no representation regarding the advisability of investing in options on the Index.
The KBW Capital Markets Index (KSX) is the property of Keefe, Bruyette & Woods, Inc. (KBW). KBW does not guarantee the accuracy or completeness of the Index, makes no express or implied warranties with respect to the Index and shall have no liability for any damages, claims, losses or expenses caused by errors in the index calculation. KBW makes no representation regarding the advisability of investing in options on the Index.
The KBW Regional Banking Index (KRX) is the property of Keefe, Bruyette & Woods, Inc. (KBW). KBW does not guarantee the accuracy or completeness of the Index, makes no express or implied warranties with respect to the Index and shall have no liability for any damages, claims, losses or expenses caused by errors in the index calculation. KBW makes no representation regarding the advisability of investing in options on the Index.
The KBW Mortgage Finance Index (MFX) is the property of Keefe, Bruyette & Woods, Inc. (KBW). KBW does not guarantee the accuracy or completeness of the Index, makes no express or implied warranties with respect to the Index and shall have no liability for any damages, claims, losses or expenses caused by errors in the index calculation. KBW makes no representation regarding the advisability of investing in options on the Index.
This communication is not an offer to sell or a solicitation to buy the securities mentioned. The information relating to any company herein is derived from publicly available sources and Keefe, Bruyette & Woods, Inc. makes no representation as to the accuracy or completeness of such information. KBW, its officers, directors, and employees may from time to time own the securities mentioned.
July 22, 2005
Please refer to important disclosures and analyst certification information on pages 11-13 of this report. - 12 -
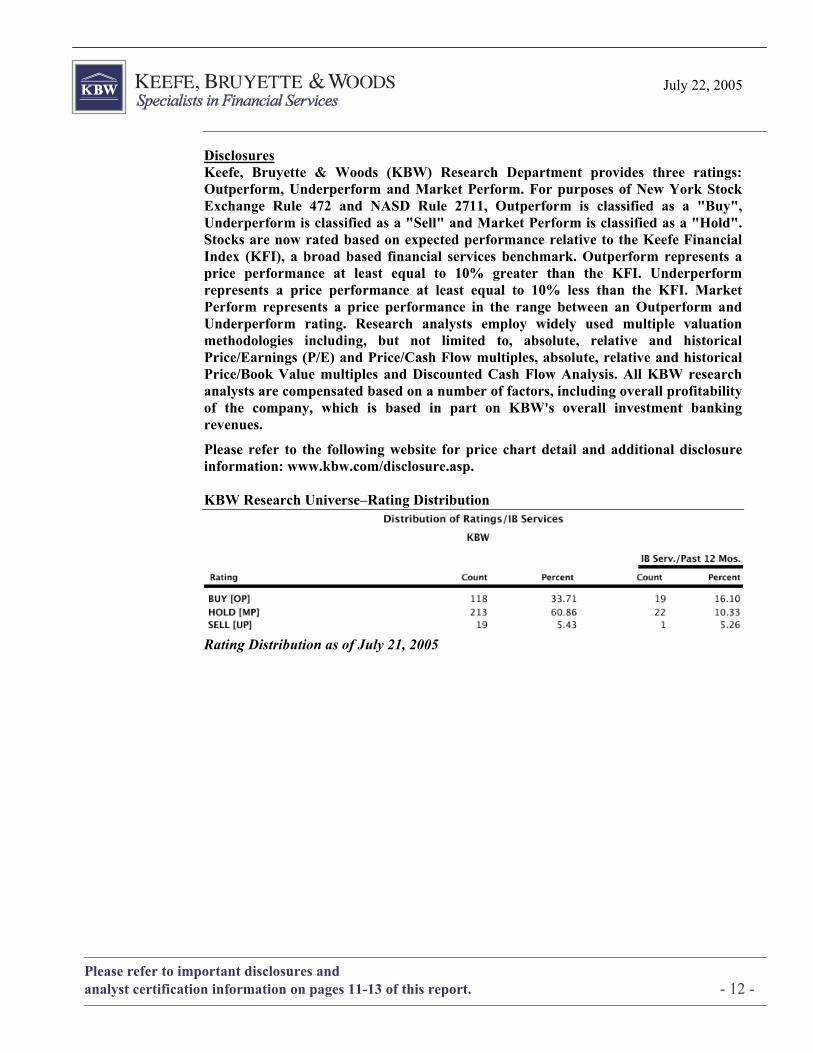
Disclosures Keefe, Bruyette & Woods (KBW) Research Department provides three ratings: Outperform, Underperform and Market Perform. For purposes of New York Stock Exchange Rule 472 and NASD Rule 2711, Outperform is classified as a "Buy", Underperform is classified as a "Sell" and Market Perform is classified as a "Hold". Stocks are now rated based on expected performance relative to the Keefe Financial Index (KFI), a broad based financial services benchmark. Outperform represents a price performance at least equal to 10% greater than the KFI. Underperform represents a price performance at least equal to 10% less than the KFI. Market Perform represents a price performance in the range between an Outperform and Underperform rating. Research analysts employ widely used multiple valuation methodologies including, but not limited to, absolute, relative and historical Price/Earnings (P/E) and Price/Cash Flow multiples, absolute, relative and historical Price/Book Value multiples and Discounted Cash Flow Analysis. All KBW research analysts are compensated based on a number of factors, including overall profitability of the company, which is based in part on KBW's overall investment banking revenues.
Please refer to the following website for price chart detail and additional disclosure information: www.kbw.com/disclosure.asp. KBW Research Universe–Rating Distribution
Rating Distribution as of July 21, 2005

July 22, 2005
Please refer to important disclosures and analyst certification information on pages 11-13 of this report. - 13 -
UK Disclaimers 1. This communication is only made to or directed at persons who (i) are outside the United Kingdom or (ii) have professional experience in matters relating to investments or (iii) are persons falling within Article 49(2)(a) to (d) ("high net worth companies, unincorporated associations etc") of the Financial Services and Markets Act 2000 (Financial Promotion) Order 2001 and (iv) who are Market Counterparties and/or Intermediate Customers as those terms are defined in the Rules of the Financial Services Authority (all such persons together being referred to as "relevant persons"). This communication must not be acted on or relied on by persons who are not relevant persons. Any investment or investment activity to which this communication relates is available only to relevant persons and will be engaged in only with relevant persons. 2. This communication has been prepared by Keefe Bruyette & Woods Inc. (KBW) and while Keefe, Bruyette & Woods Limited (KBWL) believes this communication to be reliable, KBWL has not reviewed and/or approved the information contained herein. KBWL does not guarantee its accuracy, adequacy or completeness and is not responsible for any errors or omissions or for the results obtained from the use of such information.
3. Certain assumptions may have been made in connection with the analysis presented herein and changes to the assumptions may have a material impact on the analysis or results. Information with respect to past performance of a security is not necessarily a guide to its future performance. The research and information has been prepared as of a certain date and KBW and KBWL do not undertake to update or advise you of changes in the research and information. The investments discussed herein may be unsuitable for investors depending on their specific investment objectives and financial position. KBW and KBWL make no representation or recommendation as to investments discussed herein. Investors should independently evaluate each investment discussed in the context of their own objectives, risk profile and circumstances. Additional Disclaimers 4. This communication is only intended for and will only be distributed to persons resident in any jurisdictions where such distribution or availability would not be contrary to local law or regulation. This communication must not be acted upon or relied on by persons in any jurisdiction other than in accordance with local law or regulation and where such person is an investment professional with the requisite sophistication and resources to understand an investment in such securities of the type communicated and assume the risks associated therewith.

July 22, 2005
Please refer to important disclosures and analyst certification information on pages 11-13 of this report. - 14 -
This page left intentionally blank

July 22, 2005
Please refer to important disclosures and analyst certification information on pages 11-13 of this report. - 15 -
This page left intentionally blank

John N. Howard, Director of Research
1 212 887-7700
Head of Bank Research Denis Laplante, CFA 1 212-887-7730
Bank Equity Strategist Diane Merdian 1 415-591-5071
Ravi Tarekere, CFA 1 415-591-5077 Kristian R. Jhamb, CFA 1 415-591-5075
Major Regional Banks Denis Laplante, CFA 1 212-887-7730
Eileen Rooney 1 212-887-7739 Christopher McGratty 1 212-887-7704
Midwest Banks Eric J. Grubelich, CFA 1 212-887-7720 Donald P. Schipf, CFA 1 212-887-7793 David J. Konrad, CFA 1 212-887-6719 Matthew T. Clark 1 212-887-3841
New England Banks/Thrifts Jared Shaw 1 860-722-5903
Damon DelMonte 1 860-722-5908
NY City/Mid-Atlantic Robert Hughes, CFA 1 212-887-7729 Colin Dunn 1 212-887-3806
Southeast Banks Jefferson Harralson, CFA 1 404-231-6540 Samuel Caldwell, CFA 1 404-231-6542 David Honold 1 212-887-7733
Arran Jacobson 1 212-887-7736
Southwest Banks & Puerto Rico Banks/Thrifts Jefferson Harralson, CFA 1 404-231-6540 Samuel Caldwell, CFA 1 404-231-6542 David Honold 1 212-887-7733 Bain Slack 1 404-231-6545
Brian Klock 1 404-231-6547
Trust and Custody Robert Lee 1 212-887-7732
Murali Gopal, CFA 1 212-887-7738
West Coast Banks/Thrifts Manuel Ramirez 1 415-591-5072 Frederick Cannon, CFA 1 415-591-5070
Robert Bohlen 1 415-591-5073 Clayton Kunz 1 415-591-5074
Asset Management Robert Lee 1 212-887-7732 Jim Johnson 1 212-887-7728
Broker/Dealer Lauren A. Smith 1 212-887-7712 Richard Herr 1 212-887-7737
Kyle McLean 1 212-887-7709
Financial Guaranty Geoffrey Dunn, CFA 1 860-722-5904 Nathaniel Otis 1 860-722-5907
Life Insurance Jeffrey Schuman 1 860-722-5902 Jukka Lipponen, CFA 1 860-722-5905
Kyle Mitchell 1 860-722-5906
Property Casualty Insurance Cliff Gallant, CFA 1 212-887-7705 Jason Busell 1 212-887-7723
Dean Evans 1 212-887-7701 Jeffrey Thompson 1 860-722-5901 Ken Popeleski 1 860-722-5901
Real Estate Investment Trusts Bose George 1 212-887-3843
Specialty Finance Stephen Schulz, CFA 1 212-887-7726 Rohan Juneja 1 212-887-7721 Neilay Mehta 1 212-887-7740
Quantitative Research Jeffrey Spetalnick 1 212-887-7713 Melissa A. Roberts 1 212-887-3820
Washington Research Brian Gardner 1 212-887-7735
Fixed Income Research Banking Jay Weintraub 1 212-887-3808 Osnat Faliks 1 212-887-3810
Insurance/Finance Seth Kurland, CFA 1 212-887-6751 Osnat Faliks 1 212-887-3810
KEEFE, BRUYETTE & WOODS LTD. European Research Vasco Moreno, Director of European Research 44 20 7663 5282
European Banks & Miscellaneous Financials Steven Bacon 44 20 7663 5295 Matthew Clark 44 20 7663 5280 James Hutson 44 20 7663 5293 George Karamanos 44 20 7663 5283 Jean-Pierre Lambert 44 20 7663 5292 Michael Long 44 20 7663 3219 Vasco Moreno 44 20 7663 5282 Mirko Sanna 44 20 7663 3211 Henrik Schmidt 44 20 7663 5284 Mark Thomas 44 20 7663 5279 Marcello Zanardo 44 20 7663 3214
European Insurance Tom Carstairs 44 20 7663 5286 William Hawkins 44 20 7663 5294 Karl Morris 44 20 7663 5296 Greig Paterson, CFA, FFA 44 20 7663 5289 Dilip Shah 44 20 7663 5288 Anand Vasudevan 44-20 7663 5285
KEEFE, BRUYETTE & WOODS INC. 787 Seventh Avenue, 4th Floor
New York, NY 10019 1 212-887-7777 1 800-966-1559
One Constitution Plaza 17th Floor
Hartford, CT 06103 1 860-722-5900
3455 Peachtree Road NE Suite 450
Atlanta, GA 30326 1 404 231-6565
101 California Street, Suite 3700, San Francisco CA 94111
1 415-591-5060 1 877-778-5330
225 Franklin Street Suite 1720
Boston, MA 02110 1 617-848-2777
3 James Center 1051 East Cary,
Suite 1415 Richmond, VA 23219
1 804 643-4250
10 South Wacker Drive
Suite 3400 Chicago, IL 60606
1 312-423-8200 1 800-929-6113
211 Bradenton Avenue Columbus, OH 43017
1 614 766-8400
KEEFE, BRUYETTE & WOODS LTD.
City Point Tower 1 Ropemaker Street, 10th Floor
London EC2Y 9HT 44 20 7663 5260


![Kbw office comm assist candidate[bws-edit]](https://img.pdfslide.us/doc/110x75/58edcdb21a28abf82e8b45a3/kbw-office-comm-assist-candidatebws-edit.jpg)