Embed Size (px)
Citation preview

Sovereign Bancorp, Inc.
KBW 2005 Regional BankConference
March 2, 2005

2
Forward Looking Statement This presentation contains statements of Sovereign’s vision, mission, strategies, goals, beliefs, plans,
objectives, expectations, anticipations, estimates, intentions, financial condition, results of operation, estimates of future operating results for Sovereign Bancorp, Inc. as well as estimates of financial condition, operating efficiencies, revenue creation and shareholder value.
These statements and estimates constitute forward-looking statements (within the meaning of the Private Securities Litigation Reform Act of 1995) which involve significant risks and uncertainties. Actual results may differ materially from the results discussed in these forward-looking statements.
Factors that might cause such a difference include, but are not limited to: general economic conditions; changes in interest rates; inflation; deposit flows; loan demand; real estate values; competition; changes in accounting principles, policies, or guidelines; integration of acquired assets, liabilities, customers, systems and management personnel into Sovereign’s operations and the ability to realize the related revenue synergies and cost savings within expected time frames; possibility that expected merger-related charges are materially greater than forecasted or that final purchase price allocations based on fair value of the acquired assets and liabilities at acquisition date and related adjustments to yield and/or amortization of the acquired assets and liabilities are materially different from those forecasted; deposit attrition, customer loss, revenue loss and business disruption following Sovereign’s acquisitions, including adverse effects on relationships with employees may be greater than expected; anticipated acquisitions may not close on the expected closing date or it may not close; the conditions to closing anticipated acquisitions, including stockholder and regulatory approvals, may not be satisfied; Sovereign’s timely development of competitive new products and services in a changing environment and the acceptance of such products and services by customers; the willingness of customers to substitute competitors’ products and services and vice versa; the ability of Sovereign and its third party processing and related systems on a timely and acceptable basis and within projected cost estimates; the impact of changes in financial services policies, laws and regulations, including laws, regulations, policies and practices concerning taxes, banking, capital, liquidity, proper accounting treatment, securities and insurance, and the application thereof by regulatory bodies and the impact of changes in and interpretation of generally accepted accounting principles: technological changes; changes in consumer spending and saving habits; unanticipated regulatory or judicial proceedings; changes in asset quality; employee retention; reserve adequacy; changes in legislation or regulation or policy or the application thereof; and other economic, competitive, governmental, regulatory, and technological factors affecting the Company’s operations, pricing, products and services.
3
Non-GAAP Financial Measures
This report contains Financial information determined by methods other than in accordance with U.S. Generally Accepted Accounting Principles (“GAAP”). Sovereign’s management uses the non-GAAP measures of Operating Earnings, and the related per share amounts, in their analysis of the company's performance. These measures, as used by Sovereign, adjust net income determined in accordance with GAAP to exclude the effects of special items, including significant gains or losses that are unusual in nature or are associated with acquiring or integrating businesses, and certain non-cash charges. Operating Earnings represent net income adjusted for after-tax effects of merger-related and integration charges, other various non-recurring charges and the amortization of intangible assets. Since certain of these items and their impact on Sovereign’s performance are difficult to predict, management believes presentations of financial measures excluding the impact of these items provide useful supplemental information in evaluating the operating results of Sovereign’s core businesses. These disclosures should not be viewed as a substitute for net income determined in accordance with GAAP, nor are they necessarily comparable to non-GAAP performance measures that may be presented by other companies.

4
Reconciliation of Operating Earnings to GAAP Earnings
2004 2003 2002 2001 2000 1999 1998 2004
Net Income/(loss) as reported 453,552$ 401,851$ 341,985$ 116,821$ (30,242)$ 179,299$ 136,455$ 137,429$
Merger-related and integration costs 30,134 10,316 97,063 20,576 33,533 (3,360)
Provision for Loan Loss 3,900 3,900
Restructuring of Balance Sheet 42,605 18,838 6,549 66,956
Restructuring Expenses 5,525 12,025
Impairment Charge for FNMA and FHLMC Preferred Stock 20,891 20,891
Financing-Related Adjustments 16,040 2,421
Non-solicitation Expense 158,106 78,039
Amoritzation of Intangibles 51,186 50,100 54,121 89,408 67,003 26,968 15,588 12,562
Operating Earnings 602,268$ 470,789$ 410,322$ 376,409$ 306,884$ 229,264$ 185,576$ 167,522$
Note: Further details are available on our web site at www.sovereignbank.com and in our 2002 and 2003 Annual Reports to Shareholders
Year Ended December 31, Quarter Ended December 31,
($ in thousands, all numbers shown net of tax)
5
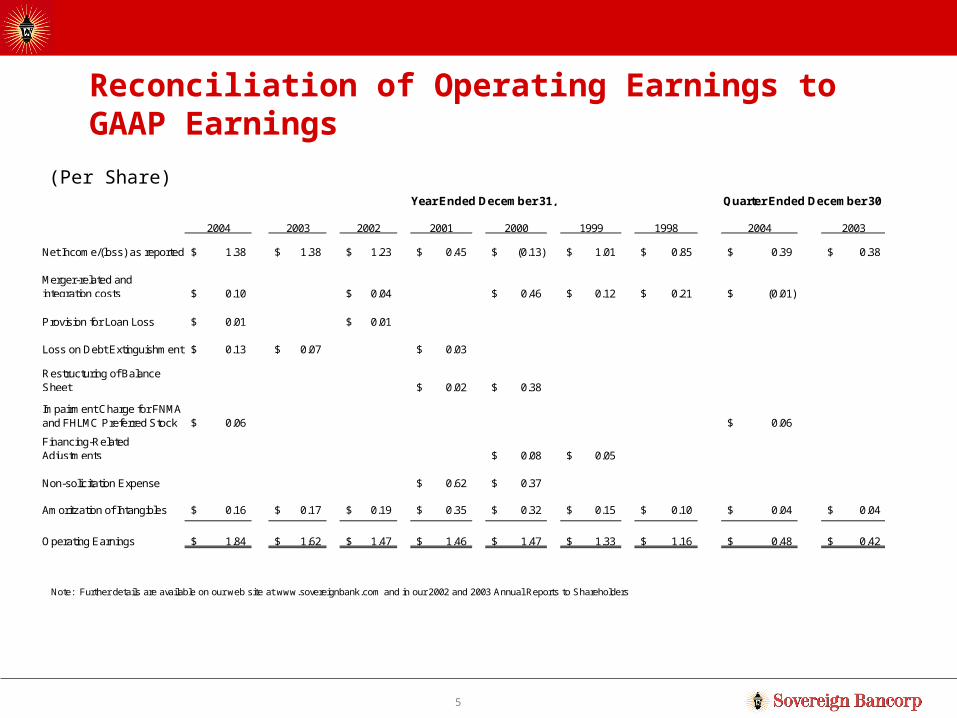
Reconciliation of Operating Earnings to GAAP Earnings
2004 2003 2002 2001 2000 1999 1998 2004 2003
Net Income/(loss) as reported 1.38$ 1.38$ 1.23$ 0.45$ (0.13)$ 1.01$ 0.85$ 0.39$ 0.38$
Merger-related and integration costs 0.10$ 0.04$ 0.46$ 0.12$ 0.21$ (0.01)$
Provision for Loan Loss 0.01$ 0.01$
Loss on Debt Extinguishment 0.13$ 0.07$ 0.03$
Restructuring of Balance Sheet 0.02$ 0.38$
Impairment Charge for FNMA and FHLMC Preferred Stock 0.06$ 0.06$
Financing-Related Adjustments 0.08$ 0.05$
Non-solicitation Expense 0.62$ 0.37$
Amoritzation of Intangibles 0.16$ 0.17$ 0.19$ 0.35$ 0.32$ 0.15$ 0.10$ 0.04$ 0.04$
Operating Earnings 1.84$ 1.62$ 1.47$ 1.46$ 1.47$ 1.33$ 1.16$ 0.48$ 0.42$
Note: Further details are available on our web site at www.sovereignbank.com and in our 2002 and 2003 Annual Reports to Shareholders
Year Ended December 31, Quarter Ended December 30,
(Per Share)

Overview of Sovereign

7
An Exceptional Franchise Serving from South of Philadelphia to Boston and Beyond…
Key: Sovereign Branches
Source: SNL DataSource
• $58 billion bankpro forma for Waypoint
• 665 branches & ~1,000 ATM’s
• 19th largest bank in the U.S. pro forma all deals
• Top 20 Small Business Lenders in the U.S.
Market Share
Massachusetts #3
Rhode Island #3
New Hampshire #5
Pennsylvania #5
New Jersey #7
Connecticut #11
Maryland #38

8
Sovereign’s FootprintDemographics by StateRanked by Median Household Income
Projected Projected Projected ProjectedTotal Population Median HH Income Total Total Population Median HH Income Total
Population Change HH Income Change 2003 Population Change HH Income Change 20032003 2003-2008 2003 2003-2008 Deposits 2003 2003-2008 2003 2003-2008 Deposits
State (Actual) (%) ($) (%) ($ bil) State (Actual) (%) ($) (%) ($ bil)
1 New Jersey 8,648,219 4.50 61,179 11.28 196.3 26 Kansas 2,724,736 2.25 45,339 13.64 44.9
2 Connecticut 3,478,428 3.51 59,302 10.55 69.6 27 Vermont 619,110 2.77 45,074 11.06 8.8
3 Maryland 5,511,566 6.49 58,672 11.20 77.9 28 Texas 22,086,674 9.28 44,909 14.04 297.3
4 Massachusetts 6,451,860 2.46 56,120 12.47 172.4 District of Columbia 570,447 -0.47 44,718 11.33 15.65 Alaska 649,745 6.35 55,217 7.49 5.7 29 Pennsylvania 12,352,083 1.00 44,237 10.89 208.06 New Hampshire 1,287,879 6.57 54,650 12.28 29.6 30 Nebraska 1,734,956 2.32 44,133 13.36 31.57 Colorado 4,573,452 9.53 54,475 18.22 61.1 31 North Carolina 8,408,414 7.00 43,979 13.47 147.08 Hawaii 1,256,844 6.38 53,650 9.08 21.2 32 Iowa 2,939,909 0.75 43,815 11.95 52.19 Minnesota 5,051,203 4.09 53,448 16.08 97.4 33 Florida 16,959,416 9.72 43,216 11.99 268.2
10 California 35,526,692 7.64 52,417 12.75 614.7 34 Missouri 5,697,731 2.99 42,558 12.56 91.611 Delaware 815,222 6.47 52,362 12.63 96.8 35 Idaho 1,356,506 7.61 42,409 13.08 12.612 Illinois 12,659,502 3.14 52,104 14.84 281.8 36 Wyoming 500,377 2.74 42,131 12.01 7.813 Virginia 7,364,402 6.46 51,923 14.40 129.7 37 South Carolina 4,138,445 5.13 41,575 12.80 44.914 Utah 2,343,691 7.86 51,268 16.40 85.0 38 Tennessee 5,832,551 4.07 41,018 13.83 86.715 Washington 6,126,602 6.27 51,248 15.75 81.5 39 Maine 1,300,832 3.39 40,990 10.63 16.116 Michigan 10,084,694 2.30 49,626 15.43 137.1 40 South Dakota 763,030 1.76 39,970 15.04 15.717 Wisconsin 5,466,418 3.12 48,947 15.46 95.9 41 North Dakota 631,406 -2.68 38,836 13.66 11.018 Nevada 2,231,241 17.25 48,715 13.10 31.9 42 Alabama 4,499,139 1.91 38,109 13.08 60.319 Georgia 8,681,578 9.30 47,818 15.92 124.9 43 Kentucky 4,109,331 2.74 37,989 14.39 56.120 New York 19,214,548 1.99 47,659 11.23 580.7 44 New Mexico 1,867,337 4.76 37,889 12.11 16.7
United States 290,647,163 5.25 46,868 13.57 5.1 45 Oklahoma 3,508,062 2.86 37,232 12.63 44.321 Indiana 6,183,547 2.68 46,383 13.85 80.3 46 Montana 911,769 1.82 36,817 12.87 11.322 Rhode Island 1,076,739 4.43 46,159 10.03 17.8 47 Louisiana 4,486,970 0.79 36,225 12.41 52.623 Oregon 3,555,010 6.37 45,818 13.92 37.3 48 Arkansas 2,721,552 2.86 35,800 13.26 37.724 Ohio 11,442,741 1.29 45,728 13.30 211.0 49 Mississippi 2,880,492 2.05 34,737 13.65 32.925 Arizona 5,564,438 13.05 45,580 14.56 56.0 50 West Virginia 1,799,627 -0.62 32,854 12.20 22.3

9
Sovereign’s Footprint
We have the second most affluent footprint among all large banks:Banks & Thrifts with Market Cap over $5b1
Ranked by Weighted Average 2003 Median Household Income
Market Wtd Avg Wtd Avg WTD AVGValue Population HH Income HH Income
Company Name Ticker ($B) Growth Growth 2003
1 Hudson City Bancorp HCBK $6.72 4.5% 11.3% $61,1792 Sovereign Bancorp, Inc. SOV 7.87 3.0 11.5 54,1733 UnionBanCal Corporation UB 8.31 7.6 12.8 52,3774 Banknorth Group, Inc. BNK 5.69 3.7 11.7 52,2105 Zions Bancorporation ZION 5.49 9.6 14.6 50,7786 Golden West Financial Corp GDW 16.53 8.2 13.4 50,7287 Comerica Incorporated CMA 9.78 5.4 14.2 50,5038 North Fork Bancorporation NFB 6.57 2.5 11.2 50,5019 Washington Mutual, Inc. WM 35.26 7.2 13.0 50,477
10 Wells Fargo & Company WFC 98.91 7.2 13.9 50,19711 Bank of America Corporation BAC 171.69 6.6 12.8 50,01012 PNC Financial Services Group PNC 15.41 2.4 11.4 49,67313 Northern Trust Corporation NTRS 9.45 5.8 14.0 49,27214 Bank of New York Company BK 23.10 2.2 11.2 48,97415 Mellon Financial Corporation MEL 12.49 2.6 11.6 48,74516 M&T Bank Corporation MTB 10.91 2.6 11.6 48,74517 Citigroup, Inc. C 244.87 3.8 11.8 48,59418 Marshall & Ilsley Corporation MI 8.92 4.2 15.2 48,44519 New York Community Bancorp NYB 5.63 2.1 11.2 48,18120 U.S. Bancorp USB 53.33 4.4 14.3 47,77521 Wachovia Corporation WB 62.65 6.2 12.7 47,73722 J.P. Morgan Chase & Co. JPM 78.72 4.2 13.0 47,44123 Fifth Third Bancorp FITB 31.25 2.1 14.1 46,78824 SunTrust Banks, Inc. STI 18.51 8.0 13.4 46,78825 KeyCorp KEY 12.56 2.7 13.2 46,71226 BB&T Corporation BBT 20.52 6.1 13.6 46,24927 National City Corporation NCC 21.67 1.9 13.5 45,97428 Huntington Bancshares Inc. HBAN 5.16 1.5 13.8 45,63829 Synovus Financial Corp. SNV 7.71 7.3 14.5 44,53430 National Commerce Fina Corp NCF 6.61 5.9 13.7 43,63331 SouthTrust Corporation SOTR 11.22 6.8 13.4 42,80432 Compass Bancshares, Inc. CBSS 5.09 7.2 13.7 42,76133 Regions Financial Corporation RF 8.33 4.7 13.6 40,55334 AmSouth Bancorporation ASO 8.79 4.4 13.1 39,452
1 Market Cap as of 06/11/2004. Sovereign's is Pro Forma for pending acquisitions.2 Weighted average for each demographic indicator is weighted by the deposit contribution of each
state to the bank's total deposit base.
10
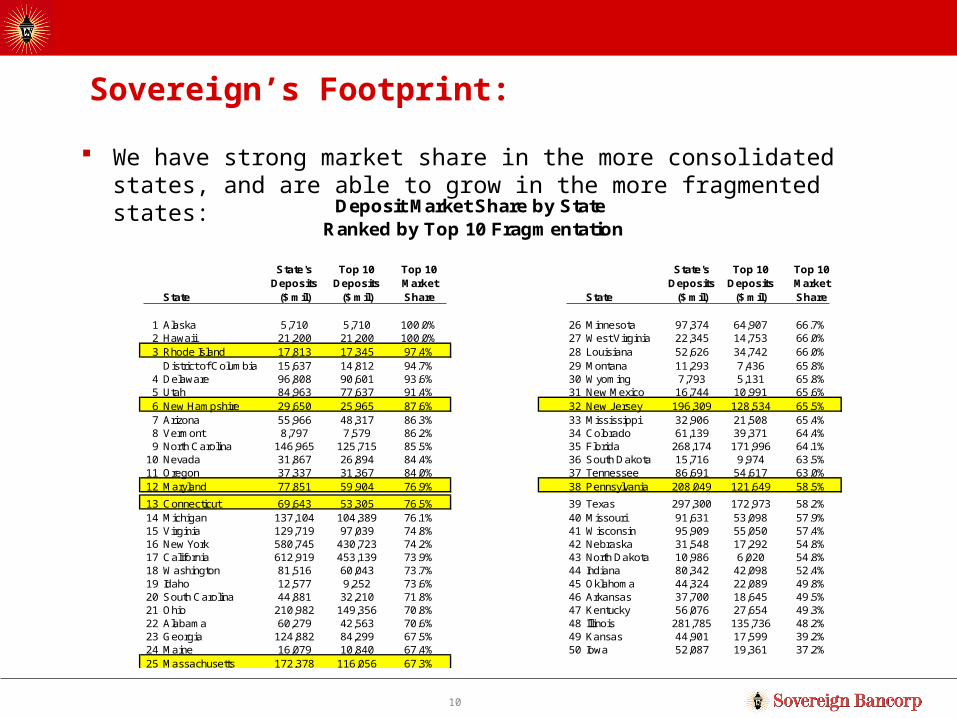
Sovereign’s Footprint:
We have strong market share in the more consolidated states, and are able to grow in the more fragmented states:Deposit Market Share by State
Ranked by Top 10 Fragmentation
State's Top 10 Top 10 State's Top 10 Top 10Deposits Deposits Market Deposits Deposits Market
State ($ mil) ($ mil) Share State ($ mil) ($ mil) Share
1 Alaska 5,710 5,710 100.0% 26 Minnesota 97,374 64,907 66.7%2 Hawaii 21,200 21,200 100.0% 27 West Virginia 22,345 14,753 66.0%3 Rhode Island 17,813 17,345 97.4% 28 Louisiana 52,626 34,742 66.0%
District of Columbia 15,637 14,812 94.7% 29 Montana 11,293 7,436 65.8%4 Delaware 96,808 90,601 93.6% 30 Wyoming 7,793 5,131 65.8%5 Utah 84,963 77,637 91.4% 31 New Mexico 16,744 10,991 65.6%6 New Hampshire 29,650 25,965 87.6% 32 New Jersey 196,309 128,534 65.5%7 Arizona 55,966 48,317 86.3% 33 Mississippi 32,906 21,508 65.4%8 Vermont 8,797 7,579 86.2% 34 Colorado 61,139 39,371 64.4%9 North Carolina 146,965 125,715 85.5% 35 Florida 268,174 171,996 64.1%
10 Nevada 31,867 26,894 84.4% 36 South Dakota 15,716 9,974 63.5%11 Oregon 37,337 31,367 84.0% 37 Tennessee 86,691 54,617 63.0%12 Maryland 77,851 59,904 76.9% 38 Pennsylvania 208,049 121,649 58.5%
13 Connecticut 69,643 53,305 76.5% 39 Texas 297,300 172,973 58.2%14 Michigan 137,104 104,389 76.1% 40 Missouri 91,631 53,098 57.9%15 Virginia 129,719 97,039 74.8% 41 Wisconsin 95,909 55,050 57.4%16 New York 580,745 430,723 74.2% 42 Nebraska 31,548 17,292 54.8%17 California 612,919 453,139 73.9% 43 North Dakota 10,986 6,020 54.8%18 Washington 81,516 60,043 73.7% 44 Indiana 80,342 42,098 52.4%19 Idaho 12,577 9,252 73.6% 45 Oklahoma 44,324 22,089 49.8%20 South Carolina 44,881 32,210 71.8% 46 Arkansas 37,700 18,645 49.5%21 Ohio 210,982 149,356 70.8% 47 Kentucky 56,076 27,654 49.3%22 Alabama 60,279 42,563 70.6% 48 Illinois 281,785 135,736 48.2%23 Georgia 124,882 84,299 67.5% 49 Kansas 44,901 17,599 39.2%24 Maine 16,079 10,840 67.4% 50 Iowa 52,087 19,361 37.2%25 Massachusetts 172,378 116,056 67.3%

11
Company Name State Total Assets ($000) Total Deposits ($000) Market Value ($M)
1 PNC Financial Services Group PA 77,297,000 51,162,000 15,310.32 Sovereign Bancorp, Inc. PA 55,755,008 33,101,678 7,606.63 M&T Bank Corporation NY 52,886,900 34,975,699 11,127.44 Mellon Financial Corporation PA 35,096,000 22,031,000 11,728.15 Banknorth Group, Inc. ME 28,986,084 19,370,473 6,090.86 Commerce Bancorp, Inc. NJ 28,431,481 26,241,632 4,362.97 North Fork Bancorporation, Inc. NY 27,502,808 20,148,204 7,688.88 New York Community Bancorp, Inc. NY 23,624,628 10,202,193 5,445.09 Astoria Financial Corporation NY 22,774,863 12,169,869 2,660.3
10 Hudson City Bancorp, Inc. (MHC) NJ 19,321,274 11,195,719 6,648.111 Webster Financial Corporation CT 17,802,242 10,439,423 2,626.812 Independence Community Bank Corp. NY 17,631,688 9,301,672 3,301.413 Mercantile Bankshares Corporation MD 14,303,019 10,722,083 3,796.114 Investors Financial Services Corp. MA 10,792,784 4,206,779 2,994.515 Valley National Bancorp NJ 10,630,850 7,402,105 2,521.416 Fulton Financial Corporation PA 10,568,816 7,460,070 2,589.517 People's Bank (MHC) CT 10,540,800 8,812,400 3,347.918 Wilmington Trust Corporation DE 9,630,850 6,989,336 2,439.019 Hudson United Bancorp NJ 8,825,227 6,290,439 1,656.620 Susquehanna Bancshares, Inc. PA 7,449,856 5,085,570 1,144.021 Provident Financial Services, Inc. NJ 6,539,982 4,091,995 1,291.222 Provident Bankshares Corporation MD 6,396,815 3,897,258 1,109.723 New Alliance Bancshares, Inc. CT 6,283,912 3,695,037 1,638.224 First Commonw ealth Financial Corp PA 6,258,777 3,851,351 946.825 Northw est Bancorp, Inc. (MHC) PA 6,225,552 5,095,519 1,118.3
Top 25 Regional by Asset Size (1)
Northeastern US Banking Climate Aside from New York money center banks, the Northeastern US market is
controlled by 3 large out-of-market consolidators (Bank of America, Wachovia and Royal Bank of Scotland), and a handful of regional banks competing for market share
1) Excludes New York City – headquartered institutions and data as of 09/30/2004. Excludes all pending deals.

12
Total US Banking Climate
Conclusion: The northeastern United States has created an opportunity for a super-regional to emerge, similar to Fifth Third Bancorp in the Midwest and BB&T in the South
Company Name State Total Assets ($000) Total Deposits ($000) Market Value ($M)
1 Citigroup, Inc. NY 1,436,554,000 534,451,000 228,971.92 JPMorgan Chase & Co. NY 1,138,469,000 496,454,000 141,600.53 Bank of America Corporation NC 1,088,996,000 591,258,000 175,445.94 Wachovia Corporation NC 436,698,000 252,981,000 61,394.95 Wells Fargo & Company CA 421,549,000 268,787,000 100,794.96 Washington Mutual, Inc. WA 288,828,000 168,695,000 33,885.77 U.S. Bancorp MN 192,844,000 115,567,000 54,067.38 National City Corporation OH 136,372,583 76,875,411 25,422.59 SunTrust Banks, Inc. GA 127,785,985 83,096,061 19,926.1
10 State Street Corporation MA 100,527,000 57,929,000 14,374.111 Golden West Financial Corporation CA 100,247,627 51,666,515 16,982.612 Fifth Third Bancorp OH 98,293,000 56,860,000 27,618.013 BB&T Corporation NC 97,880,397 65,753,596 21,928.214 Bank of New York Company, Inc. NY 93,175,000 58,440,000 22,661.815 KeyCorp OH 88,455,000 55,843,000 12,820.916 Regions Financial Corporation AL 84,077,043 56,589,257 15,332.117 PNC Financial Services Group PA 77,297,000 51,162,000 15,310.318 Sovereign Bancorp, Inc. PA 55,755,008 33,101,678 7,606.619 Comerica Incorporated MI 52,959,000 42,235,000 10,123.120 M&T Bank Corporation NY 52,886,900 34,975,699 11,127.421 AmSouth Bancorporation AL 49,687,862 31,919,416 8,653.122 UnionBanCal Corporation CA 46,990,605 39,342,229 8,713.523 Popular, Inc. PR 42,855,594 20,483,218 7,004.924 Northern Trust Corporation IL 41,110,000 28,617,800 8,943.725 Marshall & Ilsley Corporation WI 38,979,524 24,885,781 8,990.2
(1) All Numbers are as of 09/30/2004 excluing any pending acquisitions.
Top 25 U.S. by Asset Size (1)

13
A High Growth Company
Estimated 2005Assets ~ $63 billion
Analyst Mean Net Income $771 million*
1990Assets $1.3 billion
Net Operating Income $5.5 million
*Mean net income estimate for covering analysts

Sovereign’s Business Strategy

15
Sovereign’s Business Strategy
Combining the best of a large bank with the best of a smaller community bank.Best of a Large Bank:
–Products–Services–Technology–Brand–Delivery channels / distribution system–Talent–Diversification–Sophistication of risk management
Best of a Small Bank:–Flatter structure–Divided into 10 geographic markets–Local decision making–Active community involvement culture–Cross functional lines to deliver bank to customer–Treat customers as “individuals”
16
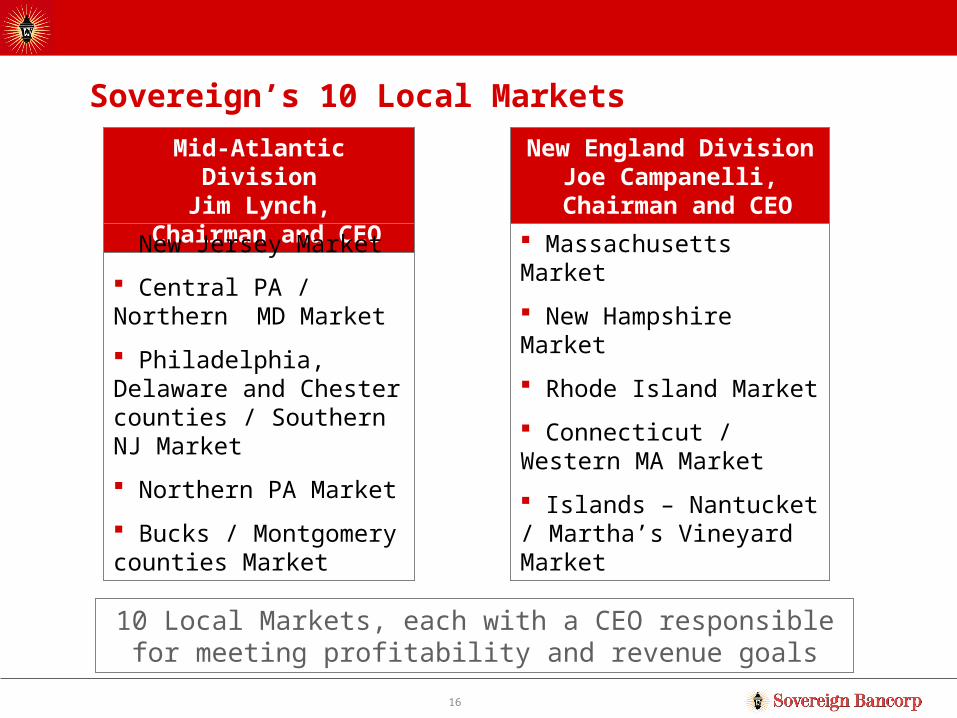
Sovereign’s 10 Local Markets
Mid-Atlantic DivisionJim Lynch,
Chairman and CEO
New England DivisionJoe Campanelli,
Chairman and CEO New Jersey Market
Central PA / Northern MD Market
Philadelphia, Delaware and Chester counties / Southern NJ Market
Northern PA Market
Bucks / Montgomery counties Market
Massachusetts Market
New Hampshire Market
Rhode Island Market
Connecticut / Western MA Market
Islands – Nantucket / Martha’s Vineyard Market
10 Local Markets, each with a CEO responsible for meeting profitability and revenue goals

17
Sovereign’s Banking Structure
MarketCEO
Commercial Real EstateLenders
CommercialLenders
Small BusinessLenders
FinancialConsultants
Cash ManagementRepresentatives
Retail Branches
18
Absolute Clarity Regarding Target Markets
Consumer Middle Income Households
– We target mass market with average household income of about $75,000+
– We differentiate on the basis of relationship selling and service delivered with high-touch and supported by convenience of technology
– Goal to become dominant in all micro markets
– Goal to cross-sell 6+ services to every household to entrench relationship and dramatically improve Bank profits

19
Absolute Clarity Regarding Target Markets
Commercial/Business Small to Middle Market
– We target in-market businesses with revenues of $1 - $100 million
– We differentiate on the basis of quality of relationship managers, localized quick decision making, supported by superior products and technology
– Goal to cross-sell 6+ services to entrench relationship and dramatically improve Bank profits

20
Strategy. With Clear Purpose and Direction.
There is nothing complicated about our strategy for moving forward
We are clear about our strategy, as well as our values, mission and goals
As we execute, we will remain committed to our critical success factors of:– Superior asset quality
– Superior risk management
– Strong sales and service culture that aligns team member performance with a recognition and rewards system
– High level of productivity through revenue growth and efficient expense control
21
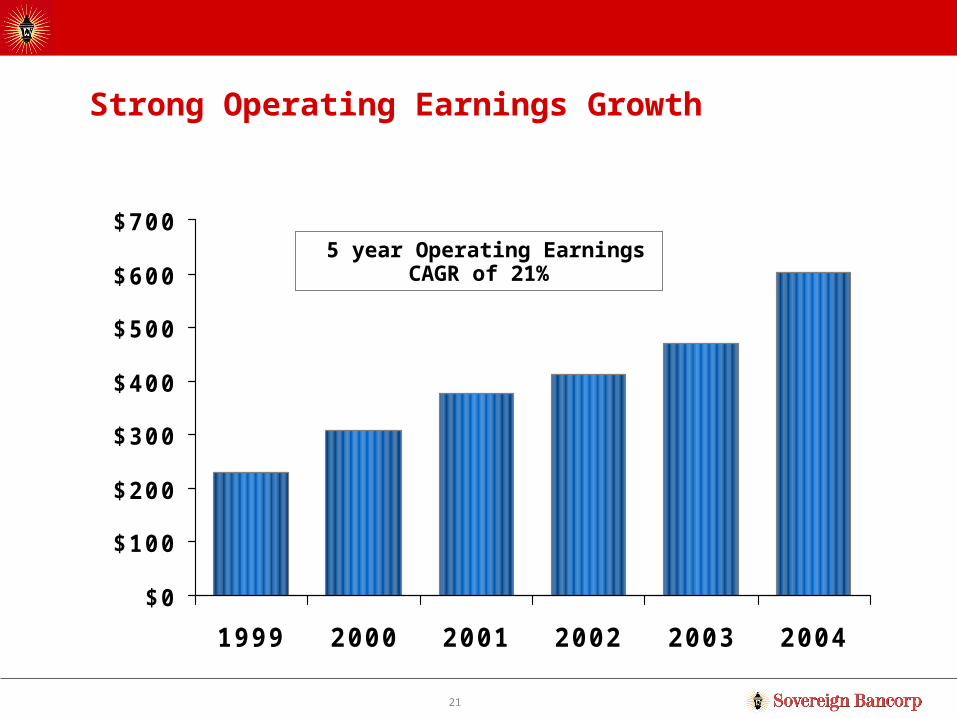
Strong Operating Earnings Growth
$0
$100
$200
$300
$400
$500
$600
$700
1999 2000 2001 2002 2003 2004
5 year Operating Earnings CAGR of 21%

22
A Consistent Performer
($ in millions) 2000 2001 2002 2003 20042004 % Growth
Total Revenue $1,084 $1,465 $1,541 $1,661 $1,872 12.7%
Commercial Loans $8,150 $8,564 $10,327 $11,064 $13,864 25.3%
Consumer Loans $5,783 $6,831 $8,519 $10,010 $14,269 42.5%
Core Deposits $15,229 $16,075 $19,831 $21,334 $25,441 19.3%
Non-Interest Expense $726 $777 $820 $865 $942 8.9%
Operating Earnings $306 $376 $410 $470 $602 28.1%
Operating EPS $1.47 $1.46 $1.47 $1.62 $1.84 13.6%

23
1-Year Stock Price Performance
1/12/05 closing price of $22.26
80%
90%
100%
110%
120%
Jan-2004 Mar-2004 May-2004 Jul-2004 Sep-2004 Nov-2004 Jan-2005
Daily from 12-Jan-2004 to 12-Jan-2005
Ind
ex
ed
Pri
ce
Sovereign S&P 500 Dow Jones S&P Banks
(6.4)%
5.4%
1.3%
9.7%
%Appreciation
24
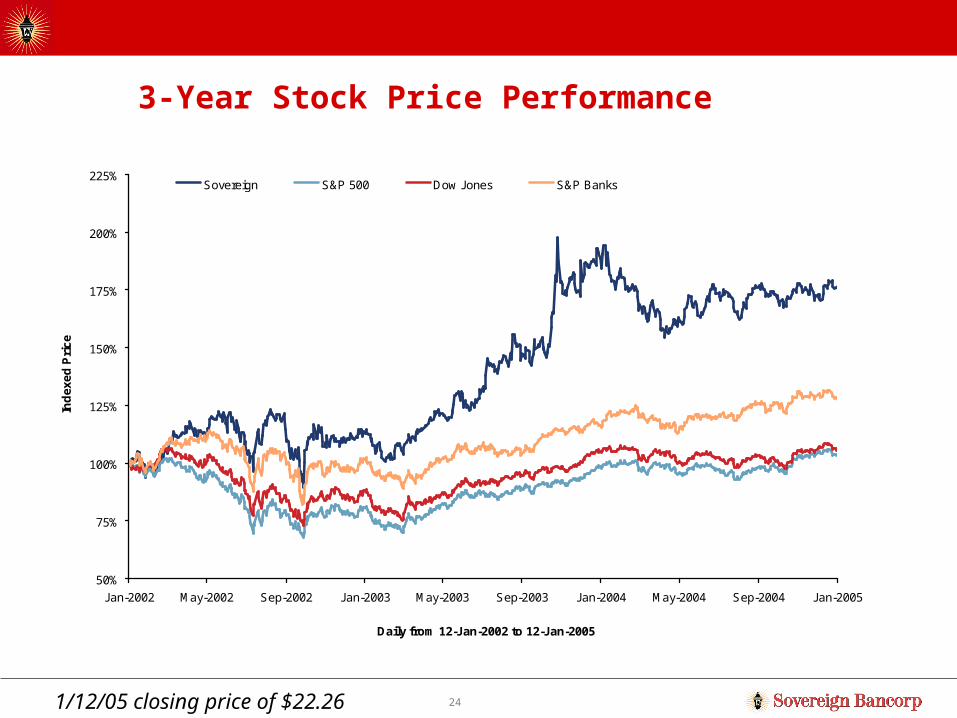
3-Year Stock Price Performance
1/12/05 closing price of $22.26
50%
75%
100%
125%
150%
175%
200%
225%
Jan-2002 May-2002 Sep-2002 Jan-2003 May-2003 Sep-2003 Jan-2004 May-2004 Sep-2004 Jan-2005
Daily from 12-Jan-2002 to 12-Jan-2005
Ind
ex
ed
Pri
ce
Sovereign S&P 500 Dow Jones S&P Banks
76.5%
3.7%6.3%
27.7%
%Appreciation

25
5-Year Stock Price Performance
1/12/05 closing price of $22.26
20%
70%
120%
170%
220%
270%
320%
370%
Jan-2000 Jul-2000 Jan-2001 Jul-2001 Jan-2002 Jul-2002 Jan-2003 Jul-2003 Jan-2004 Jul-2004 Jan-2005
Daily from 12-Jan-2000 to 12-Jan-2005
Ind
ex
ed
Pri
ce
Sovereign S&P 500 Dow Jones S&P Banks
210.8%
(17.1)%(8.1)%
53.2%
%Appreciation

Critical Success Factor –Superior Asset Quality
27
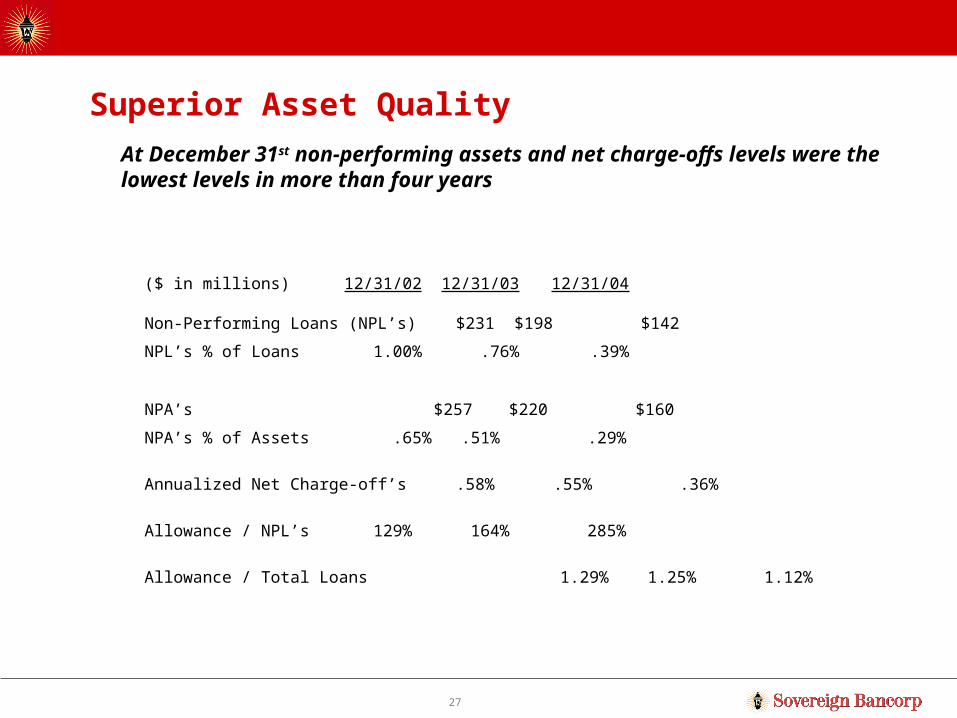
Superior Asset Quality
($ in millions) 12/31/02 12/31/03 12/31/04
Non-Performing Loans (NPL’s) $231 $198 $142
NPL’s % of Loans 1.00% .76% .39%
NPA’s $257 $220 $160
NPA’s % of Assets .65% .51% .29%
Annualized Net Charge-off’s .58% .55% .36%
Allowance / NPL’s 129% 164% 285%
Allowance / Total Loans 1.29% 1.25% 1.12%
At December 31st non-performing assets and net charge-offs levels were the lowest levels in more than four years

28
Credit Quality
All asset quality measures are pointing toward improved net charge-offs, continuing in 2005
Recent Acquisitions of Seacoast and Waypoint both improve our credit risk profile
Lower NCO’s forecasted and lower credit risk profile will reduce our need for annual loan loss provisioning in coming periods:– NCO’s anticipated to remain in the 25 to 35 basis point
range for 2005 and beyond
– Allowance as a % of loans will be dictated by credit quality and loan mix

Critical Success Factor –Superior Risk Management
30
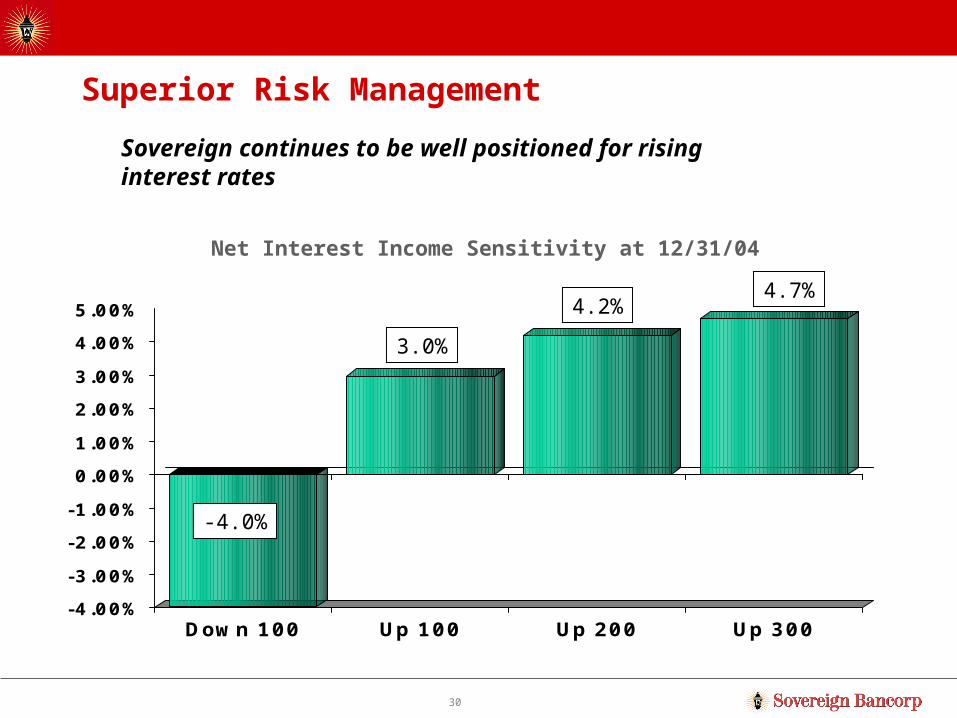
Net Interest Income Sensitivity at 12/31/04
-4.00%
-3.00%
-2.00%
-1.00%
0.00%
1.00%
2.00%
3.00%
4.00%
5.00%
Down 100 Up 100 Up 200 Up 300
-4.0%
3.0%
4.2%4.7%
Superior Risk Management
Sovereign continues to be well positioned for rising interest rates

31
$14.9 billion of assets tied to Prime,LIBOR, or CMT resets within 1 month following an increase or decrease in rates
Only $9.3 billion of liabilities tied to short-term indices
Why Are We Asset Sensitive? At December 31st…
Prime $7.0b55% Commercial45% Consumer
Treasuries $3.2b37% Investments63% Residential
Other $.04b
Libor $4.7b100% Commercial

32
Why Are We Asset Sensitive? Core Deposit Base…
Interest Bearing DDA27% or $8.7 bn
Money Market24% or $7.9 bn
CD’s22% or $7.1 bn
Savings11% or $3.8 bn
Non-Interest Bearing DDA
16% or $5.1 bn
$5.1 billion, or 16% of deposits at zero cost $17.9 billion, or 55% of total deposits at administered
rates Growing equity base helps maintain asset sensitive bias

Critical Success Factor –Strong Sales and Service

34
Strong Sales and Service Culture
6.00
5.46
4.985.13 5.20 5.25 5.24 5.29 5.36
3.00
3.50
4.00
4.50
5.00
5.50
6.00
6.50
1Q03 2Q03 3Q03 4Q03 1Q04 2Q04 3Q04 4Q04 Target'05
Retail Accounts and Services per Household
35
Red Carpet Service Guarantees Red Carpet Service was unveiled in January 2002 as a unique
program that differentiates Sovereign from the competition
Six customer service guarantees were introduced at that time, and backed by $5 if Sovereign failed to uphold those guarantees
Red Carpet Service Guarantees were recently expanded to include other business lines within the bank, over 24 guarantees now exist
Guarantees exist within the following business units:– Community Banking– Consumer Lending– Mortgage Banking– ATM’s– Research/Records– Netbanking

Critical Success Factor –Productivity andExpense Control

37
Productivity and Expense Control
53.49% 53.23%
51.31%
50.33%
45.00%
47.00%
49.00%
51.00%
53.00%
55.00%
Dec-01 Dec-02 Dec-03 Dec-04
Efficiency Ratio
Continue to grow revenues at a faster pace than operating expenses (positive operating leverage)
* Efficiency ratio equals G&A expenses as a percentage of total revenue, excluding securities gains

Sovereign’s Historical Performance
39
Operating Earnings
Effective in the fourth quarter of 2004, Sovereign moved to one non-GAAP financial measure– Provides greater financial transparency– Provides useful supplemental information when evaluating
Sovereign’s core businesses
Operating earnings represent net income adjusted for after-tax effects of merger-related and integration charges, other various non-recurring charges, and the amortization of intangible assets
For 2005, current analyst mean estimate is $1.89 which excludes $.04 to $.06 of merger integration charges; amortization of intangibles is expected to be $.12; this implies operating earnings per share of $2.01

40
Fourth Quarter 2004 Financial Highlights:
Net Interest Margin expanded 12 basis points to 3.29% during the quarter
Core bank spread (loan yield less deposit cost) expanded 16 basis points to 4.17% during the quarter
Reduced the investment portfolio $2.6 billion
Strong capital growth
Annualized net charge-offs of .28%
Sovereign continues to be positioned to benefit from higher interest rates
Operating return on average assets of 1.22%

41
Full Year 2004 Financial Highlights:
Operating earnings growth of 28%; operating earnings per share growth of 14%
Organic Consumer and Commercial loans growth of 28% and 10%, respectively
Consumer and Commercial fee revenue growth of 16% and 15%, respectively
Core deposit growth of 19%; organic core deposit growth of 4%
Dramatic improvement in credit quality
Significant growth in capital ratios
~ 100 basis point improvement in efficiency ratio Removed most of the high-cost debt incurred in the Fleet branch
acquisition Operating return on average assets of 1.19%

Our Earnings Goals for 2005 through 2007
43
What to Expect in 2005…
Net income of $1.84 - $1.94 per fully diluted share
Implied operating earnings of $2.01* per diluted share; implies double digit growth (excludes $.04-.06 of merger integration charges in 1Q05 and $.12 of non-cash charges)
Net interest margin will expand modestly as rates increase in 2005
Expect commercial loan and core deposit growth during 2005, even after considering acquisition effects
Efficiency Ratio improvement to below 50%
Generation of excess capital* Analyst mean estimate of $1.89 plus $.12 anticipated non-cash charges

44
Assumed Earnings Drivers: 2005 through 2007
Excess Capital Generation,
+ Stable to Improved Credit Quality,
+ Balanced Asset/Liability Profile with long-term asset sensitive bias,
+ Continued Operating Efficiency,
+ Continued Tax Efficiency,
+ Manageable levels of Balance Sheet growth for loans, deposits and fee revenue,
= Potential for sustained, strong double-digit earnings growth
45
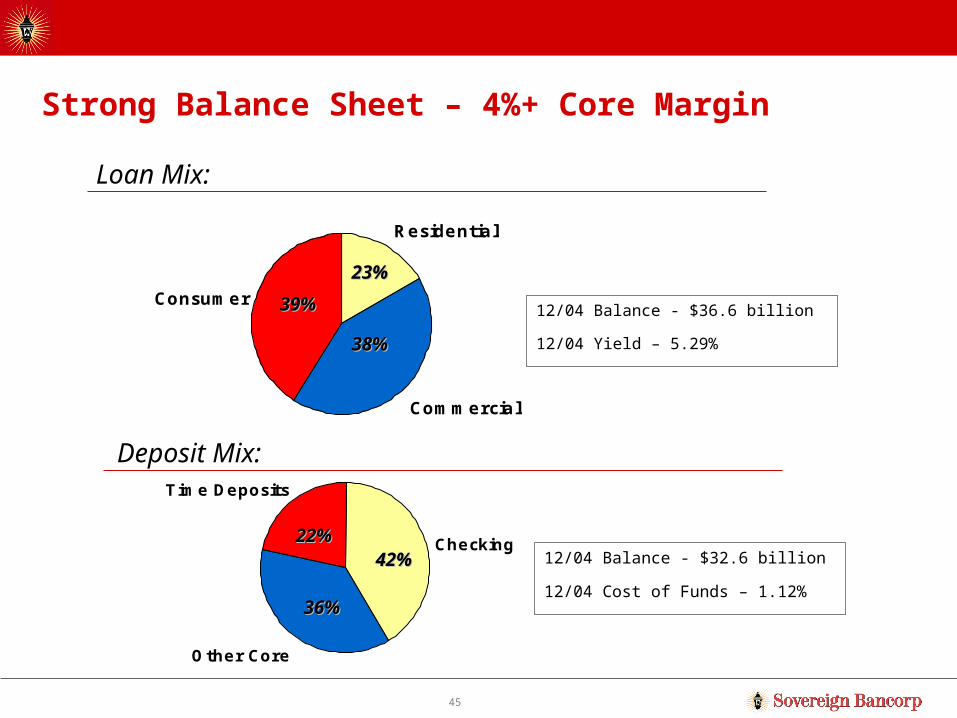
Residential
Consumer
Commercial
Other Core
Time Deposits
Checking
Strong Balance Sheet – 4%+ Core Margin
Loan Mix:
12/04 Balance - $36.6 billion
12/04 Yield – 5.29%
Deposit Mix:
12/04 Balance - $32.6 billion
12/04 Cost of Funds – 1.12%
42%42%22%22%
36%36%
38%38%
23%23%
39%39%

46
Strengthened Balance Sheet All high-cost debt now removed from structure
– $500 million secured senior note at approximately 8.00% all-in redeemed in September 2004
– Replaced with $300 million unsecured senior note at 3-month LIBOR + 33 bps
Reduced the investment portfolio $2.6 billion during the fourth quarter ’04, and removed $2 billion of borrowings– Improved the quality of the balance sheet– Improved capital ratios– Improved net interest margin– Reduced interest rate risk and mark-to-market risk
Investments to Total Assets now 21% as compared to 29% at December 31, 2003
In a rising rate environment, the core bank margin (loan yields less deposit costs) continues to expand, while the wholesale bank’s (investments and borrowings) contribution will decline

47
Excess Capital Generation Sovereign produces strong organic capital growth in 2005 and beyond:
While a wide range of uses for this excess capital may emerge, multiple scenarios produce EPS accretion of $.03 - $.05 for 2006 and $.06 - $.10 for 2007
(1) Current dividend rate is assumed for illustrative purposes only(2) Assumed $4.0 billion of balance sheet growth in 2005 on starting balance sheet of $60 billion, or 7% growth
$1.89 407 = 769$
plus: '05 CDI Amortization 73
842
less: Shareholder Dividends 50 (1)
less: 6% tangible capital on assumed B/S growth 240 (2)
equals: Excess Capital to deploy 552$
Mean '05 Street
'05 Shares($ in millions)
48
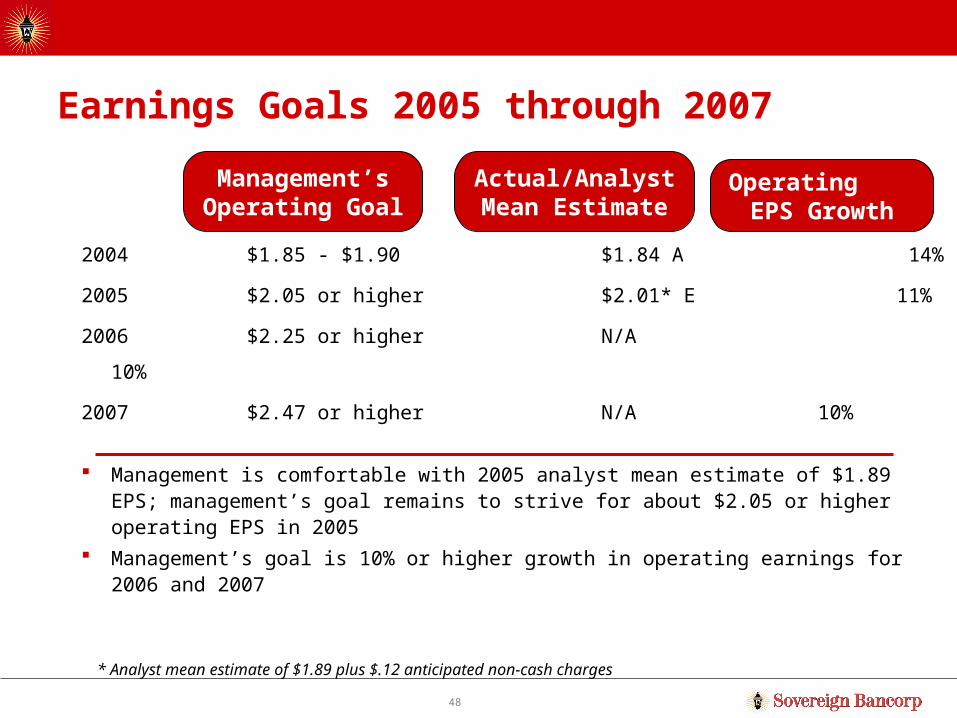
Earnings Goals 2005 through 2007
2004 $1.85 - $1.90 $1.84 A 14%
2005 $2.05 or higher $2.01* E 11%
2006 $2.25 or higher N/A 10%
2007 $2.47 or higher N/A 10%
Management is comfortable with 2005 analyst mean estimate of $1.89 EPS; management’s goal remains to strive for about $2.05 or higher operating EPS in 2005
Management’s goal is 10% or higher growth in operating earnings for 2006 and 2007
Management’s Operating Goal
Actual/Analyst Mean Estimate
Operating EPS Growth
* Analyst mean estimate of $1.89 plus $.12 anticipated non-cash charges

49
Sovereign Is Committed to the Following:
1. We will stick with our discipline of blocking & tackling, as there are tremendous opportunities within our market for organic growth. We have a strong management team in place and our structure and strategy is organized as such to seize those opportunities.
2. We will continue with our capital and M&A discipline. As always, any acquisition that we do must be accretive to earnings within the first year, not take us away materially from our capital goals, and must not be dilutive to our future growth prospects. Any acquisition opportunity, which requires capital allocation, will be analyzed against share repurchases or other uses of capital.
3. We are committed to improving our operating fundamentals including net interest margin, return on assets, return on equity, and dividends
50
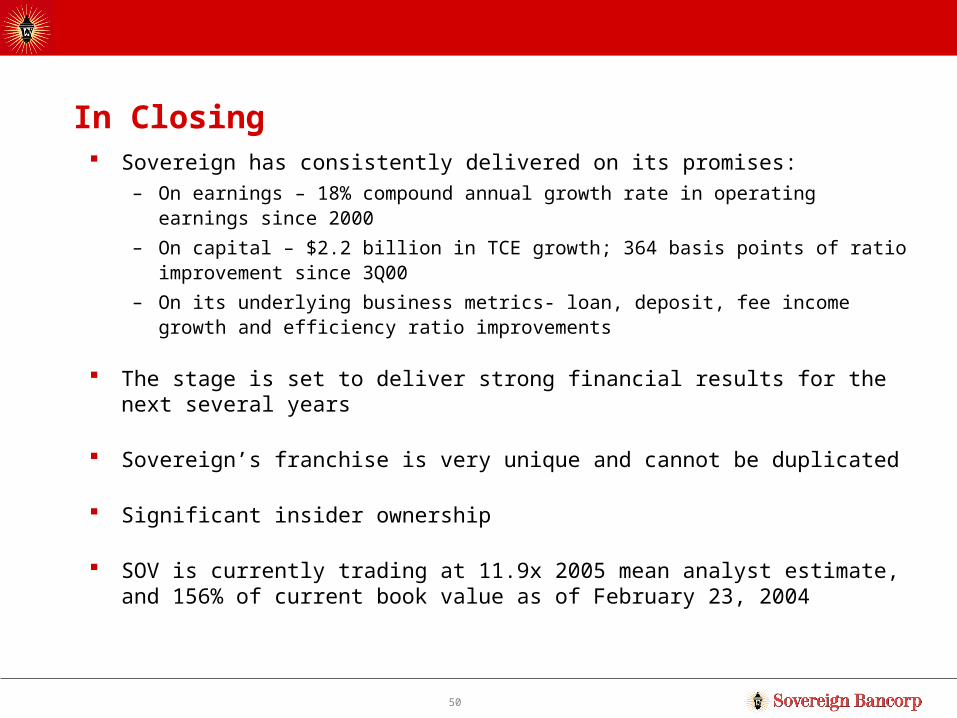
In Closing Sovereign has consistently delivered on its promises:
– On earnings – 18% compound annual growth rate in operating earnings since 2000
– On capital – $2.2 billion in TCE growth; 364 basis points of ratio improvement since 3Q00
– On its underlying business metrics- loan, deposit, fee income growth and efficiency ratio improvements
The stage is set to deliver strong financial results for the next several years
Sovereign’s franchise is very unique and cannot be duplicated
Significant insider ownership
SOV is currently trading at 11.9x 2005 mean analyst estimate, and 156% of current book value as of February 23, 2004


![KBW European Financials Conferencefiles.investis.com/experian/docs/kbw_conference.pdfMicrosoft PowerPoint - EXPERIAN Presentation for KBW Conference London 16 September 2008.ppt [Read-Only]](https://img.pdfslide.us/doc/110x75/5fb816144c7ec3113d13550e/kbw-european-financials-microsoft-powerpoint-experian-presentation-for-kbw-conference.jpg)


![Kbw office comm assist candidate[bws-edit]](https://img.pdfslide.us/doc/110x75/58edcdb21a28abf82e8b45a3/kbw-office-comm-assist-candidatebws-edit.jpg)