Embed Size (px)
Citation preview
2
Introduction :
NIFTY 50 is a broad based index consisting of 50 large and liquid companies listed on National Stock Exchange of India (NSE). NIFTY 50 is the benchmark index of India, reflecting the overall conditions of Indian equity market as well as Indian economy. Over the years, NIFTY 50 has be-come the most widely used benchmark for exchange traded products in Indian equity market.
NIFTY 50 & GDP growth rate
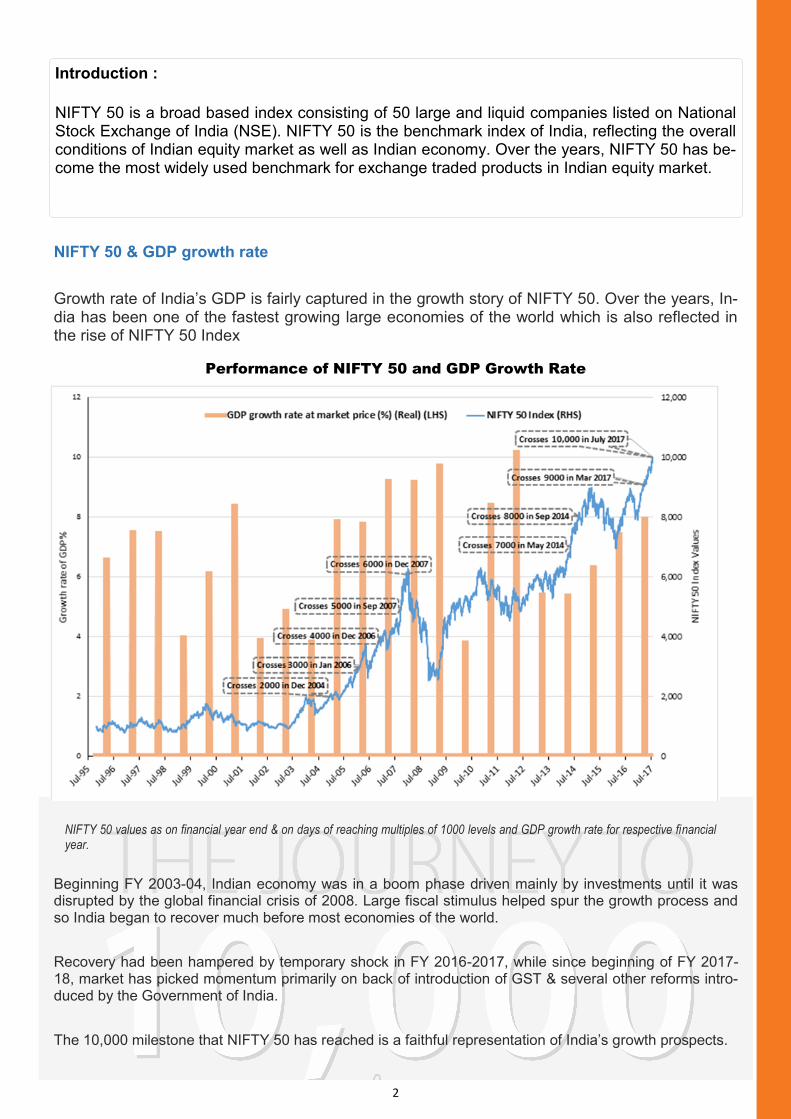
Growth rate of India’s GDP is fairly captured in the growth story of NIFTY 50. Over the years, In-dia has been one of the fastest growing large economies of the world which is also reflected in the rise of NIFTY 50 Index
Performance of NIFTY 50 and GDP Growth Rate
NIFTY 50 values as on financial year end & on days of reaching multiples of 1000 levels and GDP growth rate for respective financial year.
Beginning FY 2003-04, Indian economy was in a boom phase driven mainly by investments until it was disrupted by the global financial crisis of 2008. Large fiscal stimulus helped spur the growth process and so India began to recover much before most economies of the world.
Recovery had been hampered by temporary shock in FY 2016-2017, while since beginning of FY 2017-18, market has picked momentum primarily on back of introduction of GST & several other reforms intro-duced by the Government of India.
The 10,000 milestone that NIFTY 50 has reached is a faithful representation of India’s growth prospects.
3
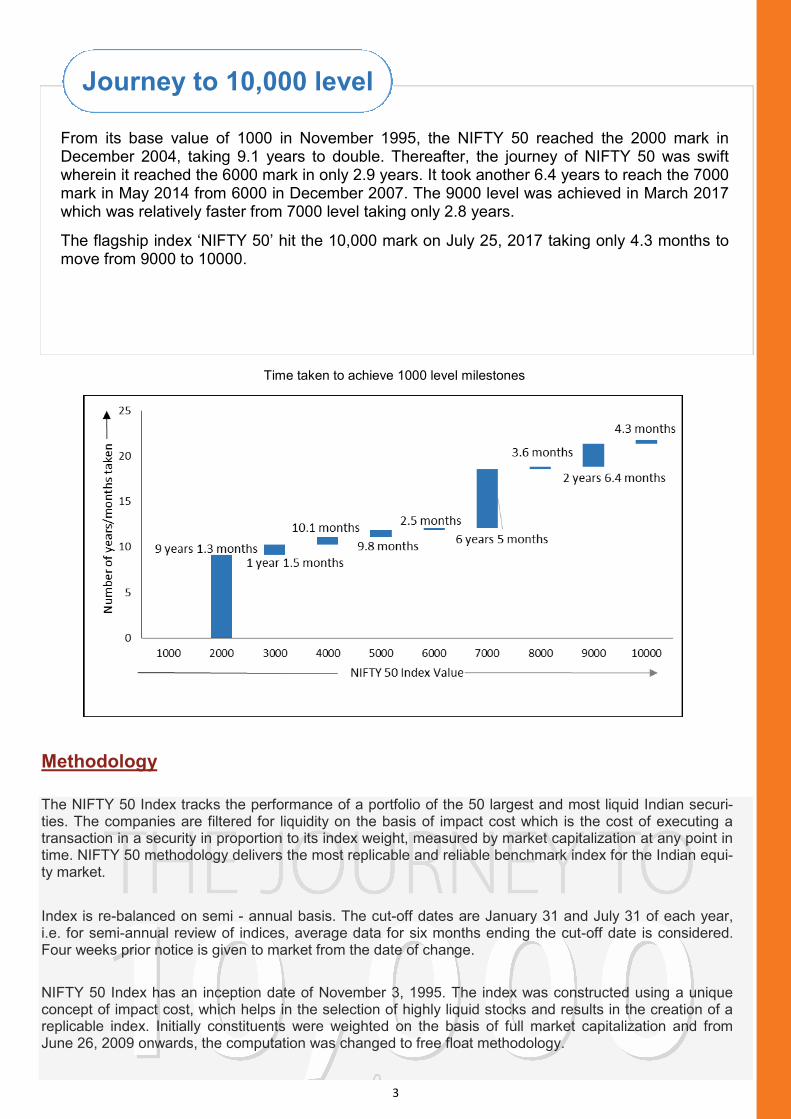
Time taken to achieve 1000 level milestones
Methodology The NIFTY 50 Index tracks the performance of a portfolio of the 50 largest and most liquid Indian securi-ties. The companies are filtered for liquidity on the basis of impact cost which is the cost of executing a transaction in a security in proportion to its index weight, measured by market capitalization at any point in time. NIFTY 50 methodology delivers the most replicable and reliable benchmark index for the Indian equi-ty market.
Index is re-balanced on semi - annual basis. The cut-off dates are January 31 and July 31 of each year, i.e. for semi-annual review of indices, average data for six months ending the cut-off date is considered. Four weeks prior notice is given to market from the date of change.
NIFTY 50 Index has an inception date of November 3, 1995. The index was constructed using a unique concept of impact cost, which helps in the selection of highly liquid stocks and results in the creation of a replicable index. Initially constituents were weighted on the basis of full market capitalization and from June 26, 2009 onwards, the computation was changed to free float methodology.
Journey to 10,000 level
From its base value of 1000 in November 1995, the NIFTY 50 reached the 2000 mark in December 2004, taking 9.1 years to double. Thereafter, the journey of NIFTY 50 was swift wherein it reached the 6000 mark in only 2.9 years. It took another 6.4 years to reach the 7000 mark in May 2014 from 6000 in December 2007. The 9000 level was achieved in March 2017 which was relatively faster from 7000 level taking only 2.8 years.
The flagship index ‘NIFTY 50’ hit the 10,000 mark on July 25, 2017 taking only 4.3 months to move from 9000 to 10000.
4
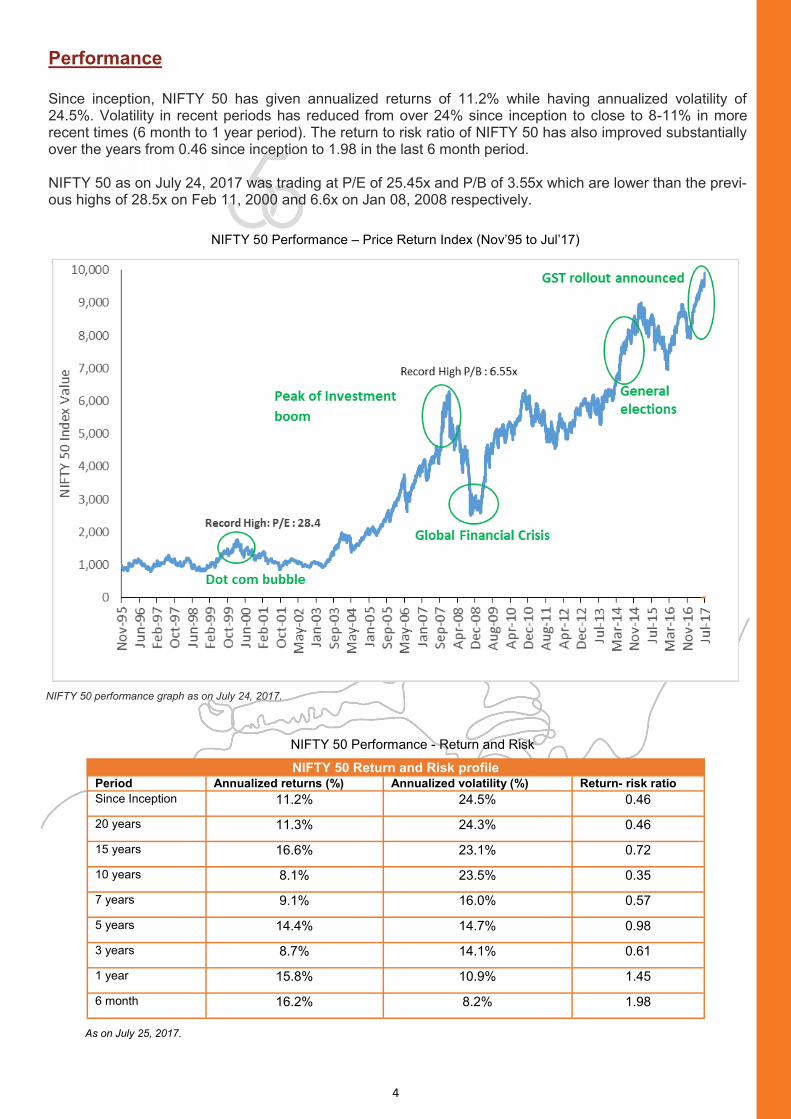
Performance Since inception, NIFTY 50 has given annualized returns of 11.2% while having annualized volatility of 24.5%. Volatility in recent periods has reduced from over 24% since inception to close to 8-11% in more recent times (6 month to 1 year period). The return to risk ratio of NIFTY 50 has also improved substantially over the years from 0.46 since inception to 1.98 in the last 6 month period. NIFTY 50 as on July 24, 2017 was trading at P/E of 25.45x and P/B of 3.55x which are lower than the previ-ous highs of 28.5x on Feb 11, 2000 and 6.6x on Jan 08, 2008 respectively.
NIFTY 50 Performance – Price Return Index (Nov’95 to Jul’17)
NIFTY 50 performance graph as on July 24, 2017.
NIFTY 50 Return and Risk profile Period Annualized returns (%) Annualized volatility (%) Return- risk ratio Since Inception 11.2% 24.5% 0.46
20 years 11.3% 24.3% 0.46
15 years 16.6% 23.1% 0.72
10 years 8.1% 23.5% 0.35
7 years 9.1% 16.0% 0.57
5 years 14.4% 14.7% 0.98
3 years 8.7% 14.1% 0.61
1 year 15.8% 10.9% 1.45
6 month 16.2% 8.2% 1.98
NIFTY 50 Performance - Return and Risk
As on July 25, 2017.
5
Calendar Year Performance
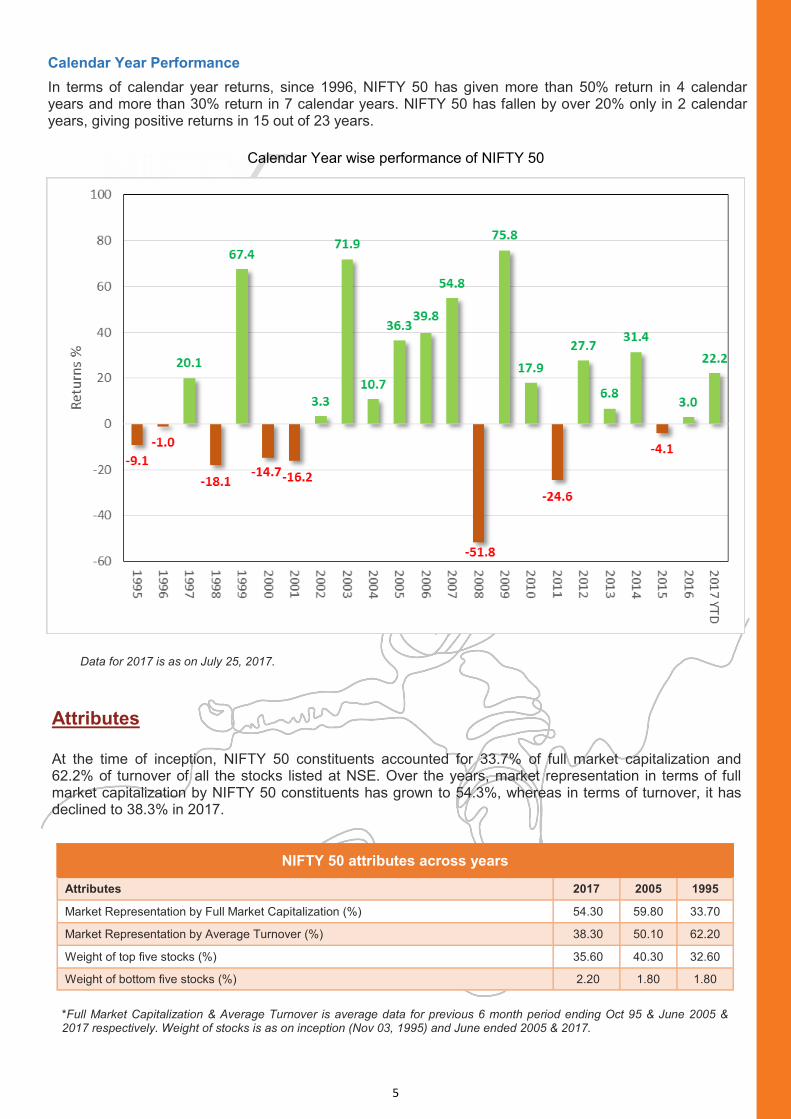
In terms of calendar year returns, since 1996, NIFTY 50 has given more than 50% return in 4 calendar years and more than 30% return in 7 calendar years. NIFTY 50 has fallen by over 20% only in 2 calendar years, giving positive returns in 15 out of 23 years.
Calendar Year wise performance of NIFTY 50
Data for 2017 is as on July 25, 2017.
Attributes At the time of inception, NIFTY 50 constituents accounted for 33.7% of full market capitalization and 62.2% of turnover of all the stocks listed at NSE. Over the years, market representation in terms of full market capitalization by NIFTY 50 constituents has grown to 54.3%, whereas in terms of turnover, it has declined to 38.3% in 2017.
NIFTY 50 attributes across years
Attributes 2017 2005 1995
Market Representation by Full Market Capitalization (%) 54.30 59.80 33.70
Market Representation by Average Turnover (%) 38.30 50.10 62.20
Weight of top five stocks (%) 35.60 40.30 32.60
Weight of bottom five stocks (%) 2.20 1.80 1.80
*Full Market Capitalization & Average Turnover is average data for previous 6 month period ending Oct 95 & June 2005 & 2017 respectively. Weight of stocks is as on inception (Nov 03, 1995) and June ended 2005 & 2017.
6
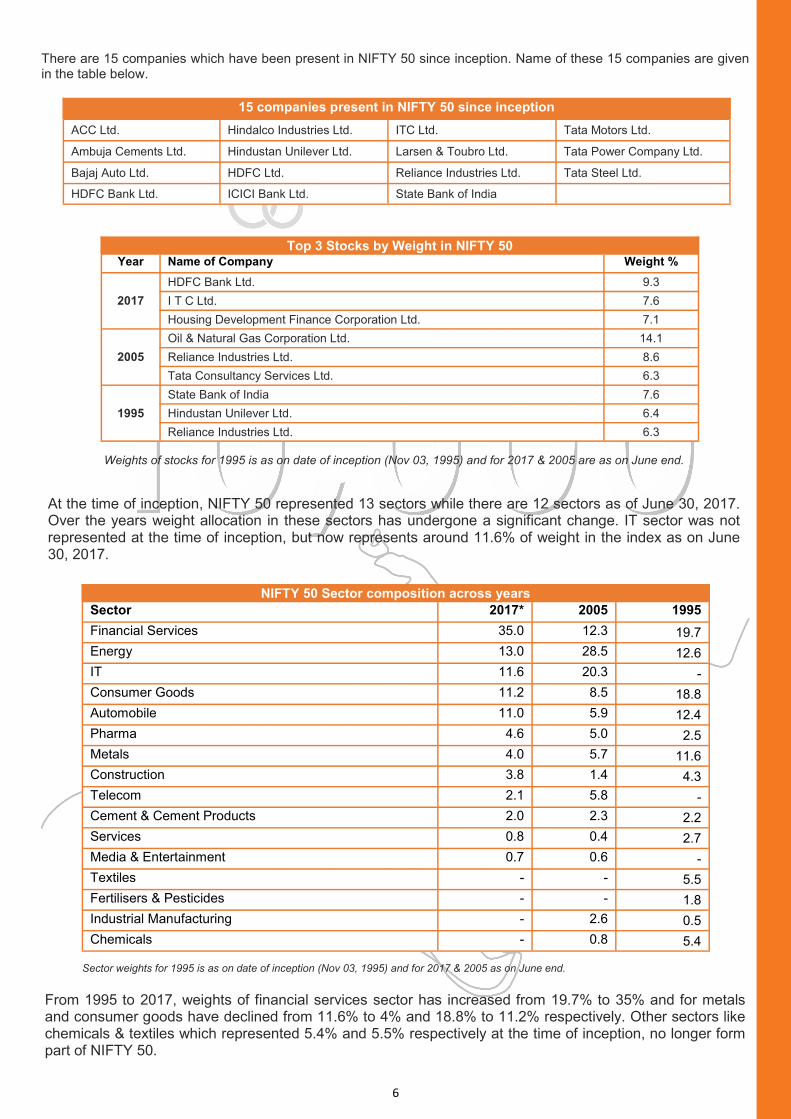
There are 15 companies which have been present in NIFTY 50 since inception. Name of these 15 companies are given in the table below.
15 companies present in NIFTY 50 since inception
ACC Ltd. Hindalco Industries Ltd. ITC Ltd. Tata Motors Ltd.
Ambuja Cements Ltd. Hindustan Unilever Ltd. Larsen & Toubro Ltd. Tata Power Company Ltd.
Bajaj Auto Ltd. HDFC Ltd. Reliance Industries Ltd. Tata Steel Ltd.
HDFC Bank Ltd. ICICI Bank Ltd. State Bank of India
Top 3 Stocks by Weight in NIFTY 50 Year Name of Company Weight %
2017
HDFC Bank Ltd. 9.3
I T C Ltd. 7.6
Housing Development Finance Corporation Ltd. 7.1
2005
Oil & Natural Gas Corporation Ltd. 14.1
Reliance Industries Ltd. 8.6
Tata Consultancy Services Ltd. 6.3
1995
State Bank of India 7.6
Hindustan Unilever Ltd. 6.4
Reliance Industries Ltd. 6.3
Weights of stocks for 1995 is as on date of inception (Nov 03, 1995) and for 2017 & 2005 are as on June end.
At the time of inception, NIFTY 50 represented 13 sectors while there are 12 sectors as of June 30, 2017. Over the years weight allocation in these sectors has undergone a significant change. IT sector was not represented at the time of inception, but now represents around 11.6% of weight in the index as on June 30, 2017.
NIFTY 50 Sector composition across years
Sector 2017* 2005 1995
Financial Services 35.0 12.3 19.7
Energy 13.0 28.5 12.6
IT 11.6 20.3 -
Consumer Goods 11.2 8.5 18.8
Automobile 11.0 5.9 12.4
Pharma 4.6 5.0 2.5
Metals 4.0 5.7 11.6
Construction 3.8 1.4 4.3
Telecom 2.1 5.8 -
Cement & Cement Products 2.0 2.3 2.2
Services 0.8 0.4 2.7
Media & Entertainment 0.7 0.6 -
Textiles - - 5.5
Fertilisers & Pesticides - - 1.8
Industrial Manufacturing - 2.6 0.5
Chemicals - 0.8 5.4
Sector weights for 1995 is as on date of inception (Nov 03, 1995) and for 2017 & 2005 as on June end.
From 1995 to 2017, weights of financial services sector has increased from 19.7% to 35% and for metals and consumer goods have declined from 11.6% to 4% and 18.8% to 11.2% respectively. Other sectors like chemicals & textiles which represented 5.4% and 5.5% respectively at the time of inception, no longer form part of NIFTY 50.
7
Financial Products tracking the NIFTY 50 NIFTY 50 based index derivatives are listed on 5 exchanges globally viz. National Stock Exchange of India Limited (NSE), Singapore Exchange Ltd. (SGX), Chicago Mercantile Exchange Inc. (CME), Osaka Ex-change Inc. (OSE) and Taiwan Futures Exchange (TAIFEX). As per World Federation of Exchanges, NIFTY 50 based options contract is world’s highest traded index option contract in terms of number of contracts traded.
First ETF launched in India in December 2001 was benchmarked to the NIFTY 50 index. Currently 20 ETFs are benchmarked to NIFTY 50 index out of which 14 ETFs are listed in India and 6 ETFs are listed in inter-national markets. More than USD 6 billion of Asset Under Management (AUM) is linked to NIFTY 50 index globally. India’ largest equity mutual fund scheme (SBI - ETF NIFTY 50) is also benchmarked to the NIFTY 50 Index.
In addition, there are 13 index funds in India which track the NIFTY 50 index. Insurance companies, Invest-ment banks and NBFCs in domestic and international markets also offer financial products such as Market Linked Debentures, Structured products, Swaps and Warrants that are linked to the NIFTY 50 index.
Funds on NIFTY 50 - Domestic Presence
NIFTY 50 is the most widely used ETF benchmark in Indian domestic market with 14 out of 49 ETFs track-ing the index as underlying. Total AUM of ETFs tracking NIFTY 50 is Rs.25,702 Cr. accounting for about 55% of total Indian equity ETF AUM of Rs.46,417 Cr. (as on May 31, 2017).
Funds on NIFTY 50 - Global Presence
Global ETF providers like iShares and DB x-trackers have chosen NIFTY 50 Index as a benchmark to launch ETFs on Indian markets. In international markets, there are 6 ETFs tracking NIFTY 50 with a total AUM of USD 1,276 Mn. (as on June 30, 2017).
Derivatives on NIFTY 50 - Domestic presence
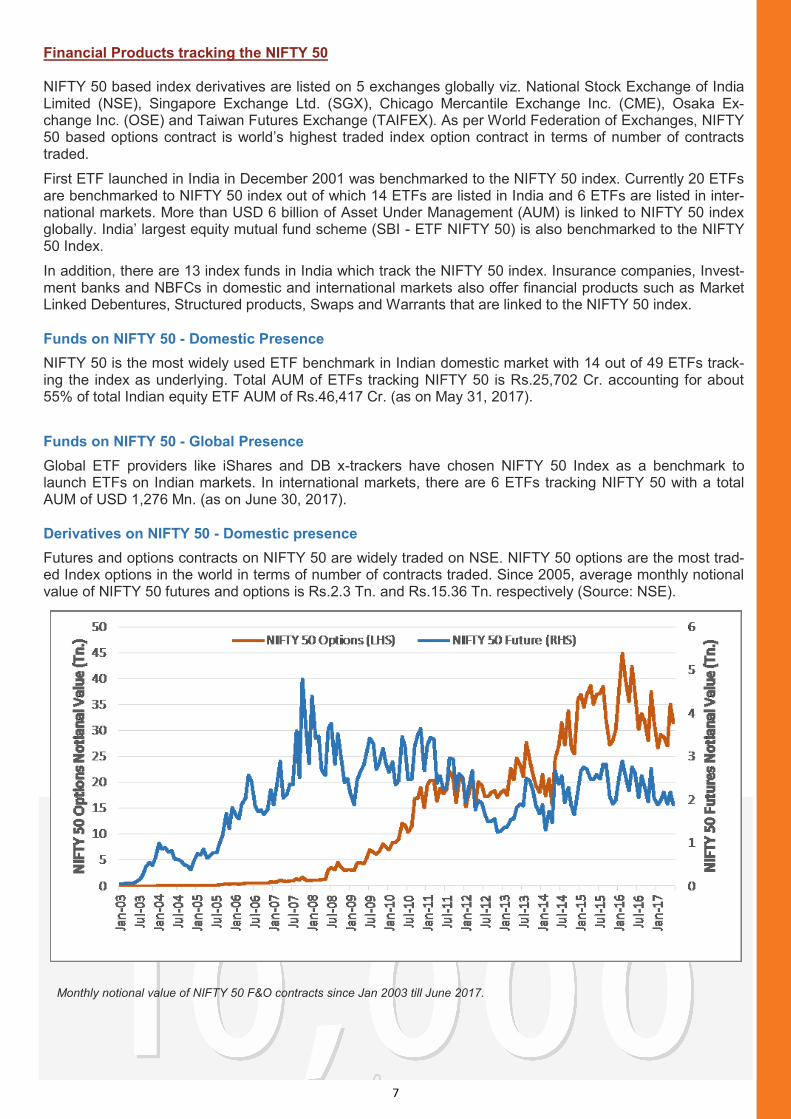
Futures and options contracts on NIFTY 50 are widely traded on NSE. NIFTY 50 options are the most trad-ed Index options in the world in terms of number of contracts traded. Since 2005, average monthly notional value of NIFTY 50 futures and options is Rs.2.3 Tn. and Rs.15.36 Tn. respectively (Source: NSE).
Monthly notional value of NIFTY 50 F&O contracts since Jan 2003 till June 2017.
8
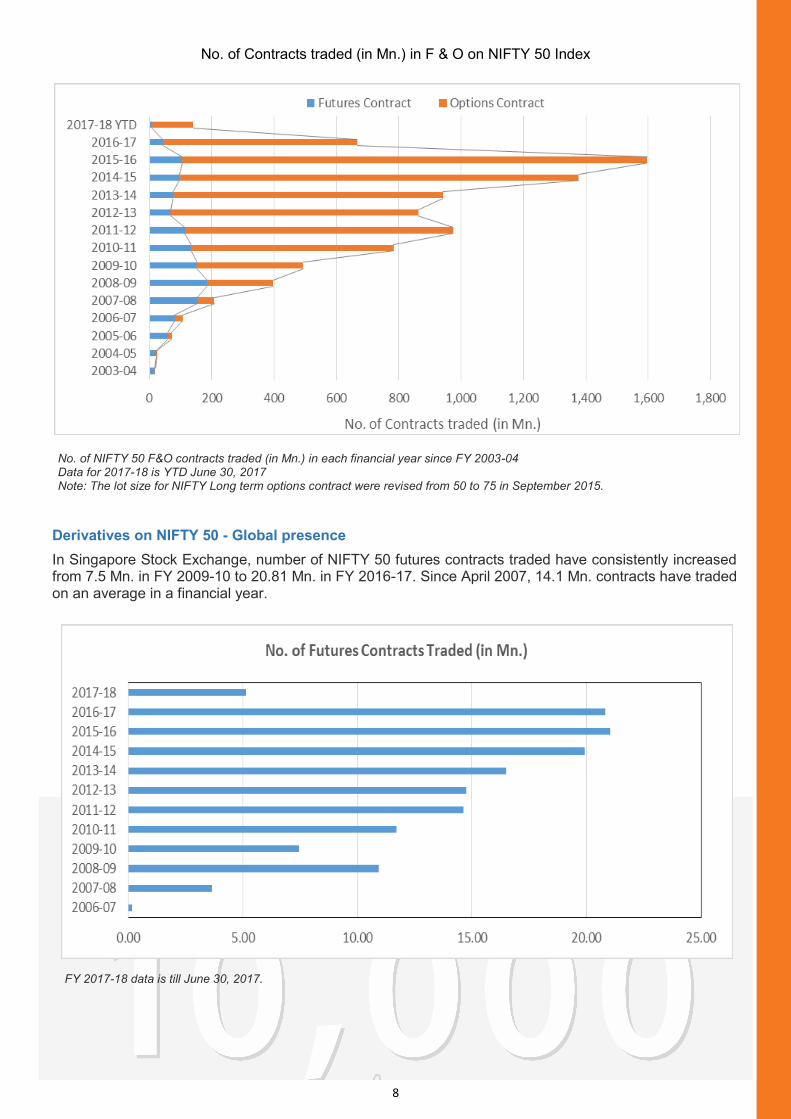
No. of Contracts traded (in Mn.) in F & O on NIFTY 50 Index
No. of NIFTY 50 F&O contracts traded (in Mn.) in each financial year since FY 2003-04 Data for 2017-18 is YTD June 30, 2017 Note: The lot size for NIFTY Long term options contract were revised from 50 to 75 in September 2015.
Derivatives on NIFTY 50 - Global presence
In Singapore Stock Exchange, number of NIFTY 50 futures contracts traded have consistently increased from 7.5 Mn. in FY 2009-10 to 20.81 Mn. in FY 2016-17. Since April 2007, 14.1 Mn. contracts have traded on an average in a financial year.
FY 2017-18 data is till June 30, 2017.
About India Index Services & Products Ltd. (IISL):
India Index Services & Products Ltd. (IISL), a subsidiary of NSE, provides a variety of indices and
index related services for the capital markets. IISL focuses upon the index as a core product. IISL
owns and manages a portfolio of indices under the NIFTY brand of NSE, including the flagship in-
dex, the NIFTY 50. IISL equity Indices comprises of broad-based benchmark indices, sectoral indi-
ces, strategy indices, thematic indices and customised indices. IISL also maintains fixed income
indices based on Government of India securities, corporate bonds and money market instruments.
Many investment products based on IISL indices have been developed within India and abroad.
These include index based derivatives traded on NSE, Singapore Exchange Ltd. (SGX), Chicago
Mercantile Exchange Inc. (CME), Osaka Exchange Inc. (OSE), Taiwan Futures Exchange
(TAIFEX) and a number of index funds and exchange traded funds. The flagship 'NIFTY 50' index
is widely tracked and traded as the benchmark for Indian Capital Markets.
Contact: Email: [email protected] Tel: +91 22 26598386
Address: Exchange Plaza, Bandra Kurla Complex, Bandra (East), Mumbai– 400 051(India)
Disclaimer: All information contained herewith is provided for reference purpose only. IISL ensures accuracy and
reliability of the above information to the best of its endeavours. However, IISL makes no warranty or representation
as to the accuracy, completeness or reliability of any of the information contained herein and disclaim any and all
liability whatsoever to any person for any damage or loss of any nature arising from or as a result of reliance on any
of the information provided herein. The information contained in this document is not intended to provide any profes-
sional advice.